*hatanaka.y@usp.ac.jp; phone 81 749 28 9556; fax 81 749 28 9576; www.e.usp.ac.jp Vertical cup-to-disc ratio measurement for diagnosis of glaucoma on fundus images Yuji Hatanaka* a , Atsushi Noudo b , Chisako Muramatsu c , Akira Sawada d , Takeshi Hara c , Tetsuya Yamamoto d , Hiroshi Fujita c a Dept. of Electronic Systems Engineering, School of Engineering, The Univ. of Shiga Prefecture, 2500 Hassaka-cho, Hikone-shi, Shiga, Japan 522-8533; b Dept. of Information Science, Faculty of Engineering, Gifu Univ., 1-1 Yanagido, Gifu-shi, Gifu, Japan 501-1193; c Dept. of Intelligent Image Information, Graduate School of Medicine, Gifu Univ., 1-1 Yanagido, Gifu-shi, Gifu, Japan 501-1194; d Dept. of Ophthalmology, Graduate School of Medicine, Gifu Univ., 1-1 Yanagido, Gifu-shi, Gifu, Japan 501-1194; ABSTRACT Glaucoma is a leading cause of permanent blindness. Retinal fundus image examination is useful for early detection of glaucoma. In order to evaluate the presence of glaucoma, the ophthalmologists determine the cup and disc areas and they diagnose glaucoma using a vertical cup-to-disc ratio. However, determination of the cup area is very difficult, thus we propose a method to measure the cup-to-disc ratio using a vertical profile on the optic disc. First, the blood vessels were erased from the image and then the edge of optic disc was then detected by use of a canny edge detection filter. Twenty profiles were then obtained around the center of the optic disc in the vertical direction on blue channel of the color image, and the profile was smoothed by averaging these profiles. After that, the edge of the cup area on the vertical profile was determined by thresholding technique. Lastly, the vertical cup-to-disc ratio was calculated. Using seventy nine images, including twenty five glaucoma images, the sensitivity of 80% and a specificity of 85% were achieved with this method. These results indicated that this method can be useful for the analysis of the optic disc in glaucoma examinations. Keywords: Glaucoma, Retinal fundus image, Cup-to-disc ratio, Optic disc extraction, Determination of cup edge, Computer-aided diagnosis, blindness, Ocular disease 1. INTRODUCTION In a population-based prevalence survey of glaucoma conducted in Tajimi City, Japan, 1 in 20 people over the age of 40 was diagnosed with glaucoma [1], [2]. The number of people affected with glaucoma globally is estimated to be 60.5 million by 2010 and reaching 79.6 million by 2020 [3]. Glaucoma is the leading cause of blindness in Japan. Although it cannot be cured, glaucoma can be treated if diagnosed early. Mass screening for glaucoma using retinal fundus images is simple and effective. In view of this, the fundus is examined selectively in the diagnosis performed by physicians as part of a specific health checkup scheme initiated in Japan in April 2008. Although this has improved the ocular healthcare, the number of ophthalmologists has not increased, thus increasing their workload. Computer-aided diagnosis (CAD) systems, developed for analyzing retinal fundus images, can assist in reducing the workload of ophthalmologists and improving the screening accuracy. We have been developing a CAD system for analyzing retinal fundus images [4-13]. Our CAD system was divided into three disease, hypertensive retinopathy [4-6], diabetic retinopathy [7-9] and glaucoma [10-13]. The purpose of this study is to analyze the optic disc on a retinal fundus image, which is important for diagnosis of glaucoma. First, as a basic study for analysis of the optic disc, we developed a method to extract the optic disc from a retinal fundus image [11-13]. A number of studies has reported on automated localization of optic discs; several studies Medical Imaging 2010: Computer-Aided Diagnosis, edited by Nico Karssemeijer, Ronald M. Summers, Proc. of SPIE Vol. 7624, 76243C · © 2010 SPIE · CCC code: 1605-7422/10/$18 · doi: 10.1117/12.843775 Proc. of SPIE Vol. 7624 76243C-1

Welcome message from author
This document is posted to help you gain knowledge. Please leave a comment to let me know what you think about it! Share it to your friends and learn new things together.
Transcript

*[email protected]; phone 81 749 28 9556; fax 81 749 28 9576; www.e.usp.ac.jp
Vertical cup-to-disc ratio measurement for diagnosis of glaucoma on fundus images
Yuji Hatanaka*a, Atsushi Noudob, Chisako Muramatsuc, Akira Sawadad, Takeshi Harac,
Tetsuya Yamamotod, Hiroshi Fujitac
aDept. of Electronic Systems Engineering, School of Engineering, The Univ. of Shiga Prefecture, 2500 Hassaka-cho, Hikone-shi, Shiga, Japan 522-8533;
bDept. of Information Science, Faculty of Engineering, Gifu Univ., 1-1 Yanagido, Gifu-shi, Gifu, Japan 501-1193;
cDept. of Intelligent Image Information, Graduate School of Medicine, Gifu Univ., 1-1 Yanagido, Gifu-shi, Gifu, Japan 501-1194;
dDept. of Ophthalmology, Graduate School of Medicine, Gifu Univ., 1-1 Yanagido, Gifu-shi, Gifu, Japan 501-1194;
ABSTRACT
Glaucoma is a leading cause of permanent blindness. Retinal fundus image examination is useful for early detection of glaucoma. In order to evaluate the presence of glaucoma, the ophthalmologists determine the cup and disc areas and they diagnose glaucoma using a vertical cup-to-disc ratio. However, determination of the cup area is very difficult, thus we propose a method to measure the cup-to-disc ratio using a vertical profile on the optic disc. First, the blood vessels were erased from the image and then the edge of optic disc was then detected by use of a canny edge detection filter. Twenty profiles were then obtained around the center of the optic disc in the vertical direction on blue channel of the color image, and the profile was smoothed by averaging these profiles. After that, the edge of the cup area on the vertical profile was determined by thresholding technique. Lastly, the vertical cup-to-disc ratio was calculated. Using seventy nine images, including twenty five glaucoma images, the sensitivity of 80% and a specificity of 85% were achieved with this method. These results indicated that this method can be useful for the analysis of the optic disc in glaucoma examinations. Keywords: Glaucoma, Retinal fundus image, Cup-to-disc ratio, Optic disc extraction, Determination of cup edge, Computer-aided diagnosis, blindness, Ocular disease
1. INTRODUCTION In a population-based prevalence survey of glaucoma conducted in Tajimi City, Japan, 1 in 20 people over the age of 40 was diagnosed with glaucoma [1], [2]. The number of people affected with glaucoma globally is estimated to be 60.5 million by 2010 and reaching 79.6 million by 2020 [3]. Glaucoma is the leading cause of blindness in Japan. Although it cannot be cured, glaucoma can be treated if diagnosed early. Mass screening for glaucoma using retinal fundus images is simple and effective. In view of this, the fundus is examined selectively in the diagnosis performed by physicians as part of a specific health checkup scheme initiated in Japan in April 2008. Although this has improved the ocular healthcare, the number of ophthalmologists has not increased, thus increasing their workload. Computer-aided diagnosis (CAD) systems, developed for analyzing retinal fundus images, can assist in reducing the workload of ophthalmologists and improving the screening accuracy. We have been developing a CAD system for analyzing retinal fundus images [4-13]. Our CAD system was divided into three disease, hypertensive retinopathy [4-6], diabetic retinopathy [7-9] and glaucoma [10-13].
The purpose of this study is to analyze the optic disc on a retinal fundus image, which is important for diagnosis of glaucoma. First, as a basic study for analysis of the optic disc, we developed a method to extract the optic disc from a retinal fundus image [11-13]. A number of studies has reported on automated localization of optic discs; several studies
Medical Imaging 2010: Computer-Aided Diagnosis, edited by Nico Karssemeijer, Ronald M. Summers, Proc. of SPIE Vol. 7624, 76243C · © 2010 SPIE · CCC code: 1605-7422/10/$18 · doi: 10.1117/12.843775
Proc. of SPIE Vol. 7624 76243C-1

have also reported on segmentation of optic discs [11-22]. And, Nakagawa et al. had previously proposed a disc detection scheme using the P-tile thresholding method [11]. Since, this method was proposed for detecting rather than extracting the optic disc, a more precise method is required for analysis of the optic disc features. The proposed method was intended to improve the conventional method of extracting the optic disc. Three-dimensions images captured on stereo fundus camera [13, 17-20] and HRT [21] were used in several studies. However, it is difficult to use such 3D fundus camera in the screening. Thus, we attempted to measure C/D ratio automatically using two dimensions images. But, to our knowledge, none achieved high performance because it was difficult to extract the cup region [22]. The ophthalmologists determine the outline of cup by detection of kinks in the blood vessels (as shown in Figure 1). Wong, et al. proposed an automated C/D ration measuring method by detecting kinks in the blood vessels on the optic disc [22], but it was very difficult. Therefore, by analyzing a color profile of the optic disc, we developed a computerized scheme that recognizes glaucoma cases. That method can be effective in recognizing glaucoma cases, without detecting kinks, by focusing on the profile of the optic disc on a retinal fundus image.
Figure 1. An example of an ophthalmologist’s sketch. A green line shows an outline of a disc, a blue line shows an outline of a cup.
2. METHODS Retinal images were captured using a fundus camera (Kowa VX-10i). The photographic angle of the fundus camera was set to 27 degrees. The retinal fundus images were obtained with an array size of 1600 × 1200 pixels and 24-bit color. Our method consists of two steps. First, the optic disc is extracted based on features such as color and shape. Further, we attempt to distinguish between the glaucoma and non-glaucoma cases by calculating the C/D ratio. More details are given below.
2.1 Extraction of optic disc
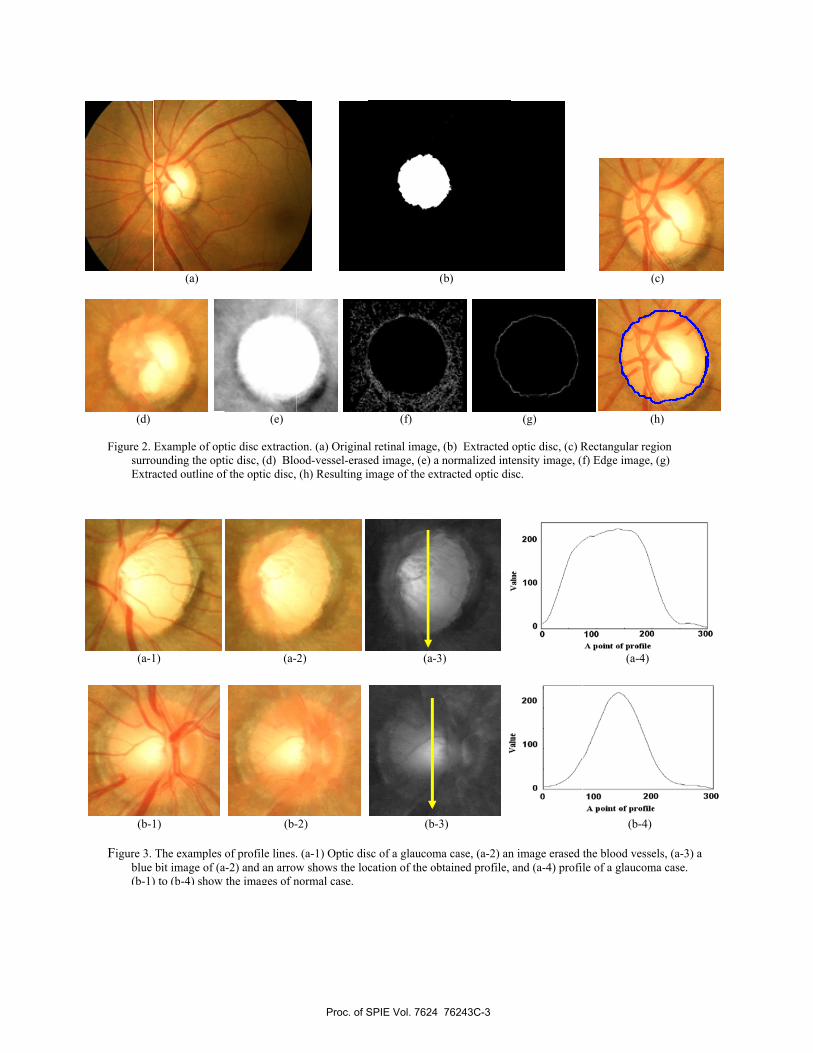
The presence of blood vessels that run on the outline of the optic disc makes accurate extraction of its outline difficult. Thus, to reduce the effect of blood vessels, the method proposed by Nakagawa et al. was applied to create a “blood-vessel-erased” image [11]. The optic disc region tends to be comparatively brighter. Thus, the approximate region of the optic disc was extracted by using the P-tile thresholding method [23] on each red, green, and blue component image, and the optic disc region was determined by using an image combining these three binary images. The result of this approach is shown in Figure 2 (b). Then, the area of the 600 × 600 pixel image, centered on the optic disc thus determined was extracted as the region for analysis. The resulting extracted region is shown in Figure 2 (c).
An RGB color image was converted to an intensity image, and the pixel values were normalized. The change in intensity (brightness) is usually high at the outline of the optic disc; thus, we applied a canny edge detector [24] to enhance the edge. We determined the outline using the spline interpolation method based on the locations of the outline suggested by edge detection. The results of these approaches are shown in Figure 2.
Disc diameter
Cup diameter
Rim
Proc. of SPIE Vol. 7624 76243C-2
(a-1
(b-1
Figure 3. blue (b-1)
(d)
Figure 2. surroExtra
1)
1)
The examples obit image of (a
) to (b-4) show
(a)
Example of optounding the optacted outline of
(a-
(b-
of profile lines.a-2) and an arrowthe images of n
(e)
tic disc extractiic disc, (d) Blof the optic disc,
2)
-2)
. (a-1) Optic disw shows the locnormal case.
ion. (a) Originaood-vessel-eras
(h) Resulting i
(a-3
(b-3
sc of a glaucomcation of the ob
(f)
l retinal image,ed image, (e) amage of the ext
3)
3)
ma case, (a-2) anbtained profile,
(b)
(b) Extracted normalized inttracted optic di
n image erased and (a-4) profil
(g)
optic disc, (c) Rtensity image, (fsc.
(a-4)
(b-4)
the blood vessele of a glaucom
(
(
Rectangular regf) Edge image,
els, (a-3) a ma case.
(c)
h)
gion (g)
Proc. of SPIE Vol. 7624 76243C-3

2.2 Determination of cup-to-disc ratio
The vertical C/D ratio is most important factor for diagnosis of glaucoma, because the contrast of the cup region and the rim one was high. Thus, we attempted to measure C/D ratio automatically. Here, glaucoma cases tend to have enlarged cup regions as against the normal cases. (In other words, the bright region is extended in many cases.) Thus, while comparing the optic disc profiles, the profile for normal cases tend to appear as a narrow mountain with long skirts, while that for glaucoma cases appears as a broad mountain with short skirts, as shown in Figure 3. Our present study focuses on this difference.
The images were preprocessed before obtaining the profile. First, a blood-vessel-erased image was created by the method described in 2.1 [11]. Since there is high contrast between the cup and disc regions in the blue channel of a color image, a blue component was used for subsequent analysis. Thus, we classified the fundus image into the right and left image by comparing the pixel value in right and left side of an optic disc region, because the nose side of an optic disc was brighter than that of the ear. A profile was then obtained around the center of the optic disc in the vertical direction. Here, the blood vessel's region un-erased affected the vertical profile. Moreover, the contrast of ear side of the optic disc was high in the blue component image. Thus, twenty profiles were obtained from the center of the optic disc to the ear side, and these profiles were then aver-aged so that the result would not depend on the specific line selected. This profile was smoothed as shown in Figure 4 (b), and impulses if any were removed, in order to reduce the effect of noise and remaining blood vessels. After that, we determined the skirt region of the profile as the rim region. The skirt region was determined by the empirical threshold value of profile (as shown in Figure 4 (c)). The edge of the skirt region and mountain one was determined as the cup edge. Finally, C/D ratio was measured by using the cup edge and disc region.
A point on profile
300
250
200
150
100
50
00 50 100 150 200 250 300
A point on profile30025020015010050
300
250
200
150
100
50
0
valu
e
valu
e
A point on profile30025020015010050
300
250
200
150
100
50
00
valu
e
0
(a) (b) (c)
Figure 4. An analysis of profile. (a) Original profile. (b) Smoothed profile. (c) Determination of cup edge. Gray regions
show Rim regions, and a dashed line shows a thresholding value of determination of cup edge. The minimum distance between two gray region was cup diameter.
3. RESULTS AND DISCUSSIONS 3.1 Extraction of optic disc
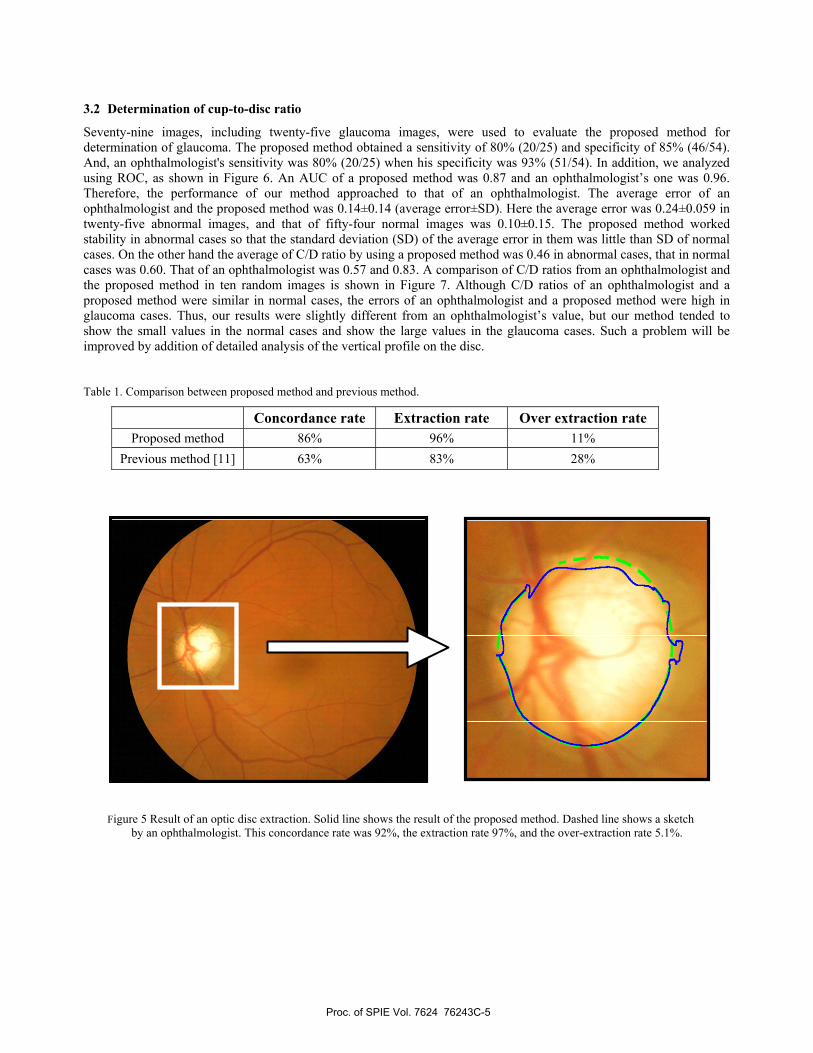
The proposed method for extracting the optic disc was evaluated based on manual outlines drawn by an ophthalmologist. Fifty fundus images, including twenty-five glaucoma images, were included in this study. Comparison of results by the proposed method and our previous method is shown in Table 1. The method was useful in the extraction of disc regions with a concordance rate of 86%, which expresses the area of intersection as a percentage of the area of union. Our method correctly extracted on average 96% of the disc regions determined by the ophthalmologist, whereas it over-extracted 11% of the disc regions. In contrast, the concordance rate using our previous method [11] was 63% when the extraction rate was 83% and the over-extraction rate was 28%. An example result is shown in Figure 5. Although the previous method mis-extracted slightly in the top of the disc region, it could extract the approximate disc region. Compared with the previous method, this method can be useful for detecting the optic disc in glaucoma examinations.
Proc. of SPIE Vol. 7624 76243C-4
3.2 Determination of cup-to-disc ratio
Seventy-nine images, including twenty-five glaucoma images, were used to evaluate the proposed method for determination of glaucoma. The proposed method obtained a sensitivity of 80% (20/25) and specificity of 85% (46/54). And, an ophthalmologist's sensitivity was 80% (20/25) when his specificity was 93% (51/54). In addition, we analyzed using ROC, as shown in Figure 6. An AUC of a proposed method was 0.87 and an ophthalmologist’s one was 0.96. Therefore, the performance of our method approached to that of an ophthalmologist. The average error of an ophthalmologist and the proposed method was 0.14±0.14 (average error±SD). Here the average error was 0.24±0.059 in twenty-five abnormal images, and that of fifty-four normal images was 0.10±0.15. The proposed method worked stability in abnormal cases so that the standard deviation (SD) of the average error in them was little than SD of normal cases. On the other hand the average of C/D ratio by using a proposed method was 0.46 in abnormal cases, that in normal cases was 0.60. That of an ophthalmologist was 0.57 and 0.83. A comparison of C/D ratios from an ophthalmologist and the proposed method in ten random images is shown in Figure 7. Although C/D ratios of an ophthalmologist and a proposed method were similar in normal cases, the errors of an ophthalmologist and a proposed method were high in glaucoma cases. Thus, our results were slightly different from an ophthalmologist’s value, but our method tended to show the small values in the normal cases and show the large values in the glaucoma cases. Such a problem will be improved by addition of detailed analysis of the vertical profile on the disc.
Table 1. Comparison between proposed method and previous method.
Concordance rate Extraction rate Over extraction rate Proposed method 86% 96% 11%
Previous method [11] 63% 83% 28%
Figure 5 Result of an optic disc extraction. Solid line shows the result of the proposed method. Dashed line shows a sketch by an ophthalmologist. This concordance rate was 92%, the extraction rate 97%, and the over-extraction rate 5.1%.
Proc. of SPIE Vol. 7624 76243C-5

Figure 6. Two ROC curves are shown. A gray curve shows ROC curve of an ophthalmologist. A black curve shows ROC
curve of a proposed method.
Figure 7. Comparison of C/D ratio measured by an ophthalmologist and the proposed method. Case 1-10 are normal cases,
and case 11-20 are glaucoma cases. Horizontal dashed line shows a threshold value for determination of glaucoma. A threshold value of determination of glaucoma was set 0.6.
0
0.1
0.2
0.3
0.4
0.5
0.6
0.7
0.8
0.9
1
0 0.1 0.2 0.3 0.4 0.5 0.6 0.7 0.8 0.9 1
TPF
FPF
OphthalmologistProposed method
00.10.20.30.40.50.60.70.80.9
1
1 2 3 4 5 6 7 8 9 10 11 12 13 14 15 16 17 18 19 20
C/D
rat
io
Case number
Ophthalmologist
Proposed method
Proc. of SPIE Vol. 7624 76243C-6
4. CONCLUSIONS We proposed a method for extracting the optic disc in retinal fundus images. The proposed method achieved a concordance rate of 86%, extraction rate of 96%, and over-extraction rate of 11% relative to the disc areas determined by an ophthalmologist. In this study, we also presented a method for recognizing glaucoma by calculating C/D ratio. The method correctly identified 80% of glaucoma cases and 85% of normal cases. Although the proposed method is not error-free, the results indicated that it can be useful for the analysis of the optic disc in glaucoma examinations.
ACKNOWLEDGMENT
The studies described above were supported mainly by a grant for the Knowledge Cluster Gifu-Ogaki (KCGO), referred to as the “Robotics Advanced Medical Cluster,” from the Ministry of Education, Culture, Sports, Science, and Technology, Japan. The authors are grateful to K. Fukuta from Denso Corp., T. Nakagawa from Kowa Company Ltd., K. Ishida from Gifu Prefecture General Medical Center, A. Aoyama from Ogaki Municipal Hospital, Y. Hayashi, K. Sugio from Tak Co. Ltd., and the co-workers from the hospitals, the companies, and Gifu University involved in the “Big CAD projects” at KCGO.
REFERENCES
1. Iwase, A., Suzuki, Y., Araie, M., Yamamoto, T., Abe, H., Shirato, S., Kuwayama, Y., Mishima, H., Shimizu, H. and Tomita, G., “The prevalence of primary open-angle glaucoma in Japanese: The Tajimi study,” Ophthalmology 111(9), 1641–1648 (2004).
2. Yamamoto, T., Iwase, A., Araie, M., Suzuki, Y., Abe, H., Shirato, S., Kuwayama, Y., Mishima, H., Shimizu, H. and Tomita, G., “The Tajimi study report 2 prevalence of primary angle closure and secondary glaucoma in a Japanese population,” Ophthalmology 112(10), 1661–1669 (2005).
3. Quigley, H. and Broman, A., “The number of people with glaucoma worldwide in 2010 and 2020,” British J. Ophthalmology 90(3), 262–267 (2006).
4. Hatanaka, Y., Hara, T., Fujita, H., Aoyama, M., Uchida, H, and Yamamoto, Y, “Automatic distribution and shape analysis of blood vessels on retinal images,” Proc. SPIE 5370, 1621-1628 (2004).
5. Takahashi, R., Hatanaka, Y., Nakagawa, T., Hayashi, Y., Aoyama, A., Mizukusa, Y., Fujita, A., Kakogawa, M., Hara, T. and Fujita, H., “Automated analysis of blood vessel intersections in retinal images for diagnosis of hypertension,” Medical Imaging Technology 24(4), 270–276 (2006).
6. Hayashi, T., Nakagawa, T., Hatanaka, Y., Hayashi, Y., Aoyama, A., Mizukusa, Y., Fujita, A., Kakogawa, M., Hara, T. and Fujita, H., “An artery-vein classification using top-hat image and detection of arteriolar narrowing on retinal images,” IEICE Technical Report 107(57), 127–132 (2007).
7. Hatanaka, Y., Nakagawa, T., Hayashi, Y., Fujita, A., Kakogawa, M., Kawase, K., Hara, T. and Fujita, H., ”CAD scheme to detect hemorrhages and exudates in ocular fundus images,” Proc. SPIE 6514, 65142M-1-65142M-8 (2007).
8. Hatanaka, Y., Nakagawa, T., Hayashi, Y., Kakogawa, M., Sawada, A., Kawase, K., Hara, T. and Fujita, H., “Improvement of automatic hemorrhages detection methods using brightness correction on fundus images,” Proc. SPIE 6915, 69153E-1 - 69153E-10 (2008).
9. Mizutani, A., Muramatsu, C., Hatanaka, Y., Suemori, S., Hara, T. and Fujita, H., “Automated microaneurysms detection method based on double ring filter in retinal fundus images,” Proc. SPIE 7260, 72601N-1 - 72601N-8 (2009).
10. Muramatsu, C., Hayashi, Y., Sawada, A., Hatanaka, Y., Yamamoto, T. and Fujita, H., “Detection of retinal nerve fiber layer defects on retinal fundus images for early diagnosis of glaucoma,” J. Biomedical Optics, in press (2010).
11. Nakagawa, T., Hayashi, Y., Hatanaka, Y., Aoyama, A., Mizukusa, Y., Fujita, A., Kakogawa, M., Hara, T., Fujita, H. and Yamamoto, T., “Recognition of optic nerve head using blood-vessel-erased image and its application to
Proc. of SPIE Vol. 7624 76243C-7

production of simulated stereogram in computer-aided diagnosis system for retinal images,” IEICE Transactions on Information and Systems J89-D(11), 2491–2501 (2006).
12. Nakagawa, T., Suzuki, T., Hayashi, Y., Mizukusa, Y., Hatanaka, Y., Ishida, K., Hara, T., Fujita, H. and Yamamoto, T., “Quantitative depth analysis of optic nerve head using stereo retinal fundus image pair,” J. Biomedical Optics 13(6), 064026-1-10 (2008).
13. Muramatsu, C., Nakagawa, T., Sawada, A., Hatanaka, Y., Hara, T., Yamamoto, T. and Fujita, H., “Determination of cup and disc ratio of optical nerve head for diagnosis of glaucoma on stereo retinal fundus image pairs,” Proc. SPIE 7260, 72603L-1-8 (2009).
14. Lalonde, M., Beaulieu, M. and Gagnon, L., “Fast and robust optic disc detection using pyramidal decomposition and Hausdorff-based template matching,” IEEE Transactions on Medical Imaging 20(11), 1193-1200 (2001).
15. Li, H. and Chutatape, O., “Automated feature extraction in color retinal images by a model based approach,” IEEE Transactions on Biomed Engineering 51(2), 246-254 (2004).
16. Chrastek, R., Wolf, M., Donath, K., Niemann, H., Paulus, D., Hothorn, T., Lausen, B., Lammer, R., Mardin, C. Y. and Michelson, G., “Automated segmentation of the optic nerve head for diagnosis of glaucoma,” Medical Image Analysis 9(4), 297-314 (2005).
17. Merickel, M. B., Wu, X., Sonka, M. and Abramoff, M., “Optimal segmentation of the optic nerve head from stereo retinal images,” Proc. SPIE 6143, 61433B-1-8 (2006).
18. Xu, J., Ishikawa, H., Wollstein, G., Bilonick, R. A., Sung, K. R., Kagemann, L., Townsend, K. A. and Schuman1, J. S., “Automated assessment of the optic nerve head on stereo disc photographs,” Investigative Ophthalmology & Visual Science 49(6), 2512-7 (2008).
19. Abramoff, M. D., Alward, W. L. M., Greenlee, E. C., Shuba, L., Kim, C. Y., Fingert, J. H. and Kwon, Y. H., “Automated segmentation of the optic disc from stereo color photographs using physiologically plausible features,” Investigative Ophthalmology & Visual Science 48(4), 1665-73(2007).
20. Corona, E., Mitra, S., Wilson, M., Krile, T., Kwon, Y. H. and Soliz, P., ”Digital stereo image analyzer for generating automated 3-D measures of optic disc deformatin in glaucoma,” IEEE Transactions on Medical Imaging 21(10), 1244–1253 (2002).
21. Mikelberg, F. S., Parfitt, C. M., Swindale, N. V., Graham, S. L., Drance, S. M., Gosine, R., “Ability of the Heidelberg Retina Tomograph to detect early glaucomatous visual field loss,” J. Glaucoma 4 (4), 242–247 (1995).
22. Wong, D. W. K., Liu, J., Lim, J. H., Li, H. and Wong, T. Y., “Automated detection of kinks from blood vessels for optic cup segmentation in retinal images,” Proc. SPIE 7260, 72601J-1-72601J-8 (2009).
23. Parker, J. R., [Algorithms for image processing and computer vision], Wiley Computer Publishing, New York, 116-128 (1997).
24. Canny, J., “A computational approach to edge detection,” IEEE Transactions on Pattern Analysis and Machine Intelligence 8(6), 679–698 (1986).
Proc. of SPIE Vol. 7624 76243C-8
Related Documents

![FUZZY CLUSTERING TECHNIQUES BASED ON GLAUCOMA … · optic cup detection for glaucoma detection using the cup to disc ratio in retinal fundus images. Joshi G.D. et al[10]. developed](https://static.cupdf.com/doc/110x72/5f0f495b7e708231d44368c2/fuzzy-clustering-techniques-based-on-glaucoma-optic-cup-detection-for-glaucoma-detection.jpg)