VERMONT AGENCY OF TRANSPORTATION Research and Development Section Research Report VERIFICATION OF ABUTMENT AND RETAINING WALL DESIGN ASSUMPTIONS Report 2015 – 06 March 2015

Welcome message from author
This document is posted to help you gain knowledge. Please leave a comment to let me know what you think about it! Share it to your friends and learn new things together.
Transcript

VERMONT AGENCY OF TRANSPORTATION
Research and Development Section Research Report
VERIFICATION OF ABUTMENT AND RETAINING WALL DESIGN ASSUMPTIONS
Report 2015 – 06
March 2015

VERIFICATION OF ABUTMENT AND RETAINING WALL DESIGN ASSUMPTIONS
Report 2015 – 06
MARCH 2015
Reporting on SPR-RAC-720
STATE OF VERMONT AGENCY OF TRANSPORTATION
RESEARCH & DEVELOPMENT SECTION
SUE MINTER , SECRETARY OF TRANSPORTATION
MICHELE BOOMHOWER , DIRECTOR OF POLICY, PLANNING AND INTERMODAL DEVELOPMENT
JOE SEGALE, P.E./PTP, PLANNING, POLICY & RESEARCH WILLIAM E. AHEARN, P.E., RESEARCH & DEVELOPMENT
Prepared By:
University of Vermont, Department of Civil and Environmental Engineering Brian W. Gomez, Civil Engineering
Mandar M. Dewoolkar, Ph.D., P.E., Associate Professor, Civil and Env. Engineering John E. Lens, P.E. Research Assistant, School of Engineering
Transportation Research Center Farrell Hall 210 Colchester Avenue Burlington, VT 05405 Phone: (802) 656-1312 Website: www.uvm.edu/transportationcenter


- i -
The information contained in this report was compiled for the use of the Vermont Agency of
Transportation (VTrans). Conclusions and recommendations contained herein are based upon
the research data obtained and the expertise of the researchers, and are not necessarily to be
construed as Agency policy. This report does not constitute a standard, specification, or
regulation. VTrans assumes no liability for its contents or the use thereof.

- ii -

- iii -
Technical Report Documentation Page
1. Report No. 2. Government Accession No. 3. Recipient's Catalog No. 2015-06 - - - - - -
4. Title and Subtitle 5. Report Date
VERIFICATION OF ABUTMENT AND RETAINING WALL DESIGN ASSUMPTIONS
MARCH 2015 6. Performing Organization Code
7. Author(s) 8. Performing Organization Report No. Brian W. Gomez Mandar M. Dewoolkar
John E. Lens 2015-06
9. Performing Organization Name and Address 10. Work Unit No.
UVM School of Civil and Environment Engineering Votey Hall Room 213 33 Colchester Avenue Burlington, VT 05405
11. Contract or Grant No.
RSCH017-720
12. Sponsoring Agency Name and Address 13. Type of Report and Period Covered
Vermont Agency of Transportation Research & Development Section 1 National Life Drive National Life Building Montpelier, VT 05633-5001
Federal Highway Administration Division Office Federal Building Montpelier, VT 05602
Final 2011 – 2014
14. Sponsoring Agency Code
15. Supplementary Notes
16. Abstract The American Association of State Highway and Transportation Officials (AASHTO), along with some other federal and state guidelines,
suggest a maximum soil fines (particles finer than 0.075 mm) content in granular structural backfill be used behind bridge abutments and retaining walls. This fines content limit is currently set at 6 percent (by weight) by the Vermont Agency of Transportation (VTrans) and is usually between 5 and 12 percent in most states, according to a canvassing of state Department of Transportation (DOT) practices. The fines content limit is an attempt to assure a free-draining backfill condition so water is not retained behind the structure, thereby eliminating the need to design the abutments and retaining walls for hydrostatic pressures. It appears that this maximum fines content is adopted largely as a rule-of-thumb considering that hydraulic conductivity of a soil is expected to decrease with increasing fines content. In Vermont and many other regions the availability of high-quality structural backfill with naturally low fines content is declining, which warrants an evaluation of whether granular backfill materials with greater than 5% fines content could be successfully used in practice.
This research project was set up with two broad over-arching goals. The first goal was to verify that the backfill and drainage details currently used in cast-in-place concrete cantilevered retaining walls and bridge abutments on VTrans projects perform as expected and that the backfill has the engineering properties assumed in the design. The second goal was to find the most cost effective backfill details. To evaluate the above two overarching goals, the specific objectives of this research were to: (1) survey other state Departments of Transportation on their practices for abutment and retaining walls; (2) study the effects of fines on a typical granular structural backfill by performing hydraulic conductivity and shear strength tests at varied non-plastic fines contents; (3) monitor differential water levels between the stream and the backfill at two field sites; (4) analyze the collected data and develop specific recommendations for VTrans; and (5) prepare this final report.
To assess if any differential water pressures exist in existing cast-in-place reinforced concrete retaining walls installed by VTrans, a field monitoring program was implemented at two sites in Vermont. The laboratory investigation included flexible wall, hydraulic conductivity tests on a granular structural backfill with 0, 5, 10, 15, 20, and 25% non-plastic fines content at 41, 83, and 124 kPa (6, 12, and 18 psi) confining pressures followed by consolidated drained triaxial compression tests for obtaining associated drained shear strength parameters of these gradations. The 15.2 cm (6 in.) diameter specimens were prepared at optimum moisture content and 95% of maximum standard Proctor density. Some tests were conducted at 90% of maximum standard Proctor density. To enable a comparison with respect to modified Proctor maximum densities, modified Proctor tests were also performed for all base soil-fines content mixtures. The experimental results were compared with relevant studies found in the literature.
The results of the field monitoring program were inconclusive. The results of the laboratory investigation indicated that a non-plastic fines content up to 10% may be justified in structural backfill specifications for retaining walls and abutments. 17. Key Words 18. Distribution Statement
Cast in Place Retaining Walls, Abutments, Backfill, Fines Content No Restrictions.
19. Security Classif. (of this report) 20. Security Classif. (of this page) 21. No. Pages 22. Price
- - - - - - 114 - - - Form DOT F1700.7 (8-72) Reproduction of completed pages authorized

- iv -

- v -
EXECUTIVE SUMMARY
The Vermont Agency of Transportation sponsored this research in an effort to evaluate if our current design practices for the backfill of cast-in-place concrete cantilevered retaining walls and bridge abutments are appropriate and cost effective. The VTrans Geotechnical Section was principal liaison and expert support for this research. Specifically, the research objectives were to: (1) verify that the backfill and drainage details currently used in cast-in-place concrete cantilevered retaining walls and bridge abutments on VTrans projects perform as expected, i.e. differential hydraulic pressures do not develop in the backfill; and (2) assess if the current backfill specifications are adequate and cost-effective.
Backfill strength, hydraulic conductivity and compactability are critical parameters to the substructure design. To assess if any differential hydraulic pressures develop in existing cast-in-place reinforced concrete retaining walls installed by VTrans, a field-monitoring program was implemented at two sites in Vermont. To evaluate the current backfill specification, a laboratory investigation was conducted that included flexible wall, hydraulic conductivity tests on a granular structural backfill. The field investigation results were not sufficiently conclusive. The laboratory assessment suggested that a fines content of up to 10% is potentially allowable as compared to the currently allowed fines content of 6% in VTrans specifications. Earlier research, reported in “Evaluation of a Proposed Sand Borrow to Include the Percentage Passing
the 0.02mm Size” (Report 1990-04, March 1990, Adams and A-Baki) conducted by VTrans established that a reliable correlation between the fines that contribute to frost susceptibility and fines measured by sieve analysis is adequately protective. If greater fines content is allowed, it may increase availability and decrease cost of suitable borrow materials. The survey results of other state transportation agencies and experimental results led to a recommendation that the structural backfill specification should require 95% of maximum dry density as determined by AASHTO T99. Based on these recommendations, the Agency will implement two changes.
The specifications will be revised for compaction to 95% of maximum dry density as determined by AASHTO T99. The revision will assure better compaction at lower costs and enhanced embankment to bridge transition performance. As a follow up, an experimental installation on three new projects will deploy a granular structural backfill with up to 8% fines. In such cases, a field-monitoring program must be implemented to evaluate if the backfills function as largely free draining materials without development of differential hydraulic pressures.
- Christopher Benda, P.E., Geotechnical Engineering Manager

- vi -

- vii -

- viii -
ABSTRACT
The American Association of State Highway and Transportation Officials (AASHTO), along with some other federal and state guidelines, suggest a maximum soil fines (particles finer than 0.075 mm) content in granular structural backfill be used behind bridge abutments and retaining walls. This fines content limit is currently set at 6 percent (by weight) by the Vermont Agency of Transportation (VTrans) and is usually between 5 and 12 percent in most states, according to a canvassing of state Department of Transportation (DOT) practices. The fines content limit is an attempt to assure a free-draining backfill condition so water is not retained behind the structure, thereby eliminating the need to design the abutments and retaining walls for hydrostatic pressures. It appears that this maximum fines content is adopted largely as a rule-of-thumb considering that hydraulic conductivity of a soil is expected to decrease with increasing fines content. In Vermont and many other regions the availability of high-quality structural backfill with naturally low fines content is declining, which warrants an evaluation of whether granular backfill materials with greater than 5% fines content could be successfully used in practice.
This research project was set up with two broad over-arching goals. The first goal was to verify that the backfill and drainage details currently used in cast-in-place concrete cantilevered retaining walls and bridge abutments on VTrans projects perform as expected and that the backfill has the engineering properties assumed in the design. The second goal was to find the most cost effective backfill details. To evaluate the above two overarching goals, the specific objectives of this research were to:
(1) Survey other state Departments of Transportation on their practices for abutment and retaining walls;
(2) Study the effects of fines on a typical granular structural backfill by performing hydraulic conductivity and shear strength tests at varied non-plastic fines contents;
(3) Monitor differential water levels between the stream and the backfill at two field sites;
(4) Analyze the collected data and develop specific recommendations for VTrans; and (5) Prepare the final report
To assess if any differential water pressures exist in existing cast-in-place reinforced concrete retaining walls installed by VTrans, a field-monitoring program was implemented at two sites in Vermont. The laboratory investigation included flexible wall, hydraulic conductivity tests on a granular structural backfill with 0, 5, 10, 15, 20, and 25% non-plastic fines content at 41, 83, and 124 kPa (6, 12, and 18 psi) confining pressures followed by consolidated drained triaxial compression tests for obtaining associated drained shear strength parameters of these gradations. The 15.2 cm (6 in.) diameter specimens were prepared at optimum moisture content and 95% of maximum standard Proctor density. Some tests were conducted at 90% of maximum

- ix -
standard Proctor density. To enable a comparison with respect to modified Proctor maximum densities, modified Proctor tests were also performed for all base soil-fines content mixtures. The experimental results were compared with relevant studies found in the literature.
The results of the field-monitoring program were inconclusive. The results of the laboratory investigation indicated that a non-plastic fines content up to 10% may be justified in structural backfill specifications for retaining walls and abutments.

- x -
TABLE OF CONTENTS
EXECUTIVE SUMMARY ......................................................................................................................... V
ABSTRACT ............................................................................................................................................. VIII
LIST OF TABLES ..................................................................................................................................... XII
LIST OF FIGURES ................................................................................................................................. XIII
1. INTRODUCTION .................................................................................................................................. 1
1.1 Motivation ..................................................................................................................................... 1
1.2 Research Objectives ...................................................................................................................... 4
1.3 Organization of this Report ........................................................................................................... 5
2. STATE SURVEY OF DESIGN PRACTICES ...................................................................................... 7
2.1 Survey Results ............................................................................................................................... 8
2.2 Respondents’ Comments ............................................................................................................. 10
2.3 Standard Details And Specifications ........................................................................................... 13
2.4 Analysis Of Data From Past Vtrans Bridge Abutment Projects .................................................. 16
3. LITERATURE REVIEW ..................................................................................................................... 25
3.1 Background ................................................................................................................................. 25
3.2 Maximum Allowable Fines Content ........................................................................................... 26
3.3 Testing Methods .......................................................................................................................... 29
3.4 Effect Of Fines On Soil Properties .............................................................................................. 30
3.4.1 Compaction ......................................................................................................................................... 30
3.4.2 Hydraulic Conductivity ....................................................................................................................... 34
3.4.3 Shear Strength Parameters ................................................................................................................... 45
4. EFFECTS OF FINES ON HYDRAULIC CONDUCTIVITY AND SHEAR STRENGTH ............... 49
4.1 Soils, Sample Preparation And Testing Methods ........................................................................ 49
4.2 Experimental Results ................................................................................................................... 52
4.3 Summary Of The Experimental Results ...................................................................................... 59
5. FIELD MONITORING ........................................................................................................................ 61
5.1 Motivation ................................................................................................................................... 61
5.2 Monitoring Sites And Instrumentation ........................................................................................ 61
5.3 Measurements And Analysis ....................................................................................................... 68
5.3.1 Preconstrucion Water Levels ............................................................................................................... 71
5.3.2 Post-Construction Water Levels .......................................................................................................... 72
5.4 Summary ..................................................................................................................................... 74

- xi -
6. OVERALL CONCLUSIONS AND RECOMMENDATIONS FOR FUTURE WORK ..................... 75
6.1 Main Conclusions ........................................................................................................................ 75
6.2 Recommendations For Future Research ...................................................................................... 78
ACKNOWLEDGEMENTS ........................................................................................................................ 80
BIBLIOGRAPHY ....................................................................................................................................... 81
APPENDIX A – STATE SURVEY............................................................................................................ 83
APPENDIX B – TEST RESULTS ............................................................................................................. 85

- xii -
LIST OF TABLES
Table 2.1: Summary of State Survey Responses .......................................................................... 14
Table 2.2: Drainage provisions for bridge abutments used in various states ................................ 15
Table 3.1: Summary of fines limitations from various publications ............................................ 26
Table 3.2: Suitability of soils for compacted backfill (Merriman 1955) ...................................... 29
Table 3.3: Summary of compaction criteria (UFC, 2005) ............................................................ 31
Table 3.4: Compaction test comparison (UFC, 2005) .................................................................. 32
Table 3.5: Comparison of hydraulic conductivity testing with other investigations .................... 34
Table 3.6: Typical properties of compacted materials (NAVFAC DM7-2, 1986) ....................... 42
Table 3.7: Friction Angles of Granular Soils (Lambe and Whitman, 1979) ................................ 46
Table 4.1: Summary of standard and modified Proctor test results .............................................. 51
Table 4.2: Summary of drained shear strength parameters........................................................... 58

- xiii -
LIST OF FIGURES
Figure 1.1: Typical Lateral Pressures Acting on a Retaining Wall ................................................ 2
Figure 2.1: Backfill gradation specification of VTrans compared to that of two other New England states ............................................................................................................................... 17
Figure 2.2: Backfill gradation specification of VTrans compared to a Northeast state and a Midwest state ................................................................................................................................ 18
Figure 2.3: Gradations of backfills of past abutment projects of VTrans ..................................... 19
Figure 2.4: Gradations of some source soils available in Vermont .............................................. 20
Figure 2.5: Histogram of relative compaction achieved in the field for VTrans abutment projects....................................................................................................................................................... 22
Figure 2.6: Histogram of the specified minimum relative compaction (based on standard Proctor test) for dry density measurements made in VTrans abutment projects ....................................... 22
Figure 2.7: In-place optimum moisture (based on standard Proctor test) difference for past VTrans abutment projects ............................................................................................................. 23
Figure 3.1: Soil types tested by Merriman (1955) with VTrans gradation specification limits shown ............................................................................................................................................ 35
Figure 3.2: Hydraulic conductivity versus silt content (Bandini and Sathiskumar, 2009) ........... 37
Figure 3.3: Hydraulic conductivity versus confinement (Bandini and Sathiskumar, 2009) ......... 37
Figure 3.4: Grain size distribution and hydraulic conductivity (NAVFAC DM7-1, 1986) ......... 39
Figure 3.5: Typical hydraulic conductivity values for USCS soil types (USBR Earth manual part 1, 1998) ......................................................................................................................................... 43
Figure 3.6: Hydraulic conductivity and drainage of given soil types (Terzaghi and Peck 1967) . 44
Figure 3.7: Friction Angle for Given Soil Type (NAVFAC DM7-2, 1986) ................................ 48
Figure 4.1: Grain size distribution of the base material of this study, compared to VTrans’ specifications (vertical bars); base soils used in relevant published studies are also included..... 49
Figure 4.2: Measured hydraulic conductivity versus confining pressure for 95% RC ................. 54
Figure 4.3: Effect of Fines on hydraulic conductivity at varied confinement for 95% RC .......... 55
Figure 4.4: Measured hydraulic conductivity versus confining pressure for 90% RC ................. 56
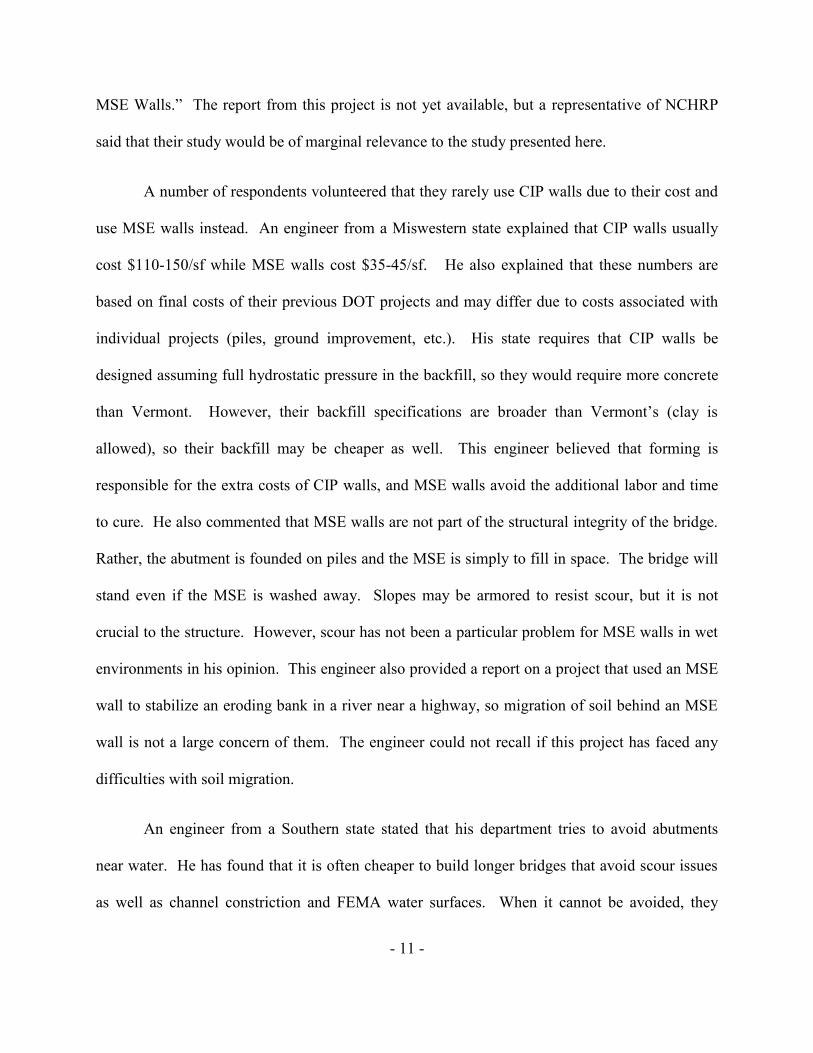
Figure 4.5: Effect of Fines on hydraulic conductivity at varied confinement for 90% RC .......... 57
Figure 4.6: Hydraulic conductivities from this study compared to other relevant studies ........... 58
Figure 5.1: Location map of Bridgewater and Williamstown ...................................................... 64
Figure 5.2: Bridgewater piezometer installation ........................................................................... 65
Figure 5.3: Plan view of instrumentation at Bridgewater site ...................................................... 66
Figure 5.4: Williamstown piezometer installations ...................................................................... 67

- xiv -
Figure 5.5: Plan view of the instrumentation at the Williamstown site ........................................ 67
Figure 5.6: Measured water levels at Bridgewater site ................................................................. 68
Figure 5.7: Measured differential water levels at Bridgewater site .............................................. 69
Figure 5.8: Measured water levels at Bridgewater site (close-up of a portion from Figure 5.6) .. 69
Figure 5.9: Measured water levels at Williamstown site .............................................................. 70
Figure 5.10: Measured differential water levels at Williamstown site ......................................... 70
Figure 5.11: Measured water levels at Williamstown site (close-up of a portion from Figure 5.9)....................................................................................................................................................... 71

- xv -

- 1 -
1. INTRODUCTION
1.1 MOTIVATION
The analysis and design of retaining walls and bridge abutments have structural (e.g.,
selection of stem and foundation dimensions, reinforcement details) and geotechnical (e.g.,
backfill soil permeability and shear strength, the extent of structural backfill behind the structure,
drainage provision, depth of foundation) engineering components among others. The choices
made in the geotechnical aspects of analysis and design affect the design of structural
components and costs. This research evaluated two specific geotechnical engineering aspects of
structural backfills – (1) their hydraulic conductivity and shear strength properties; and (2) field
observations of differential water levels between the stream and the backfill.
Typically, the design of retaining walls and bridge abutments relies on the assumption
that the soil material used to backfill the structure is ‘free-draining’ and will not produce
hydrostatic pressure. If the backfill is not expected to be drained, the abutment or retaining wall
must be designed for earth pressure loads plus hydrostatic pressure due to the presence of water.
However, there is insufficient readily accessible information regarding the limits of what
constitutes free-draining backfill and which current design practices satisfactorily avoid the
potential for unexpected hydrostatic pressure. Differential water pressures, as depicted in Figure
1.1, could be of concern particularly for retaining structures near water bodies such as bridge
abutments over rivers and streams.

- 2 -
Figure 1.1: Typical Lateral Pressures Acting on a Retaining Wall
A survey conducted in 2011 by the Vermont Agency of Transportation (VTrans) to
determine common abutment wall design practices at transportation agencies throughout the
United States, received a total of 53 responses; representing 35 states (see Chapter 2 for details).
Questions on the fines content allowed in structural backfills, hydrostatic pressure assumptions,
typical details and specifications were asked in relation to abutment designs. The majority of
responses indicated that drainage systems were used to allow designers to neglect hydrostatic
pressure or else the thickness and size of the abutment wall were increased. Additionally, 70% of
respondents indicated that backfill with greater than 5% fines content was currently utilized –
most states were between 10 – 15% fines content.

- 3 -
The American Association of State Highway and Transportation Officials (AASHTO)
recommends that hydrostatic water pressure should be avoided, if possible, in all abutment and
retaining wall designs by means of an appropriate drainage system. AASHTO advises that the
use of weep holes or drains at the wall face do not assure fully drained conditions. It
recommends that an effective design will use pipe drains, gravel drains, perforated drains,
geosynthetic drains, or backfilling with crushed rock. However, in a follow-up survey, many
states indicated the use of weep-holes and wall face drains as their primary drainage provision.
Typical details and specifications standards were then compiled and analyzed.
It was apparent from the survey results that it has generally been recognized that the soil
material used as backfill must be drained either through the use of permeable material or by use
of an effective drainage system, or both. If not, the wall must be designed for earth pressure
loads plus hydrostatic pressure. AASHTO, along with some other federal and state guidelines,
recommend a maximum soil fines (particles finer than 0.075mm) content for granular structural
backfill behind bridge abutments and retaining walls. The fines content limit is set at 6 percent
by VTrans and is usually limited to between 5 and 12 percent in most states, according to the
previously mentioned survey results. The fines content limit is an attempt to assure a free-
draining backfill condition so water is not retained behind the structure, thereby eliminating the
need to design the abutments and retaining walls for hydrostatic pressures. It appears this
maximum fines content is adopted largely as a rule-of-thumb considering that hydraulic
conductivity of a soil is expected to decrease with increasing fines content. In Vermont and many
other regions the availability of high-quality structural backfill with naturally low fines content is
declining, which warrants an evaluation of whether granular backfill materials with greater than
5% fines contents could be successfully used in practice. Limited resources and a continually

- 4 -
aging transportation system require verification of these design assumptions made in current
practice. In some cases, it is possible design assumptions are too conservative; and as a result,
construction costs are unnecessarily increased.
1.2 RESEARCH OBJECTIVES
This research project was set up with the following two broad over-arching goals:
(1) The first goal of this research was to verify that the backfill and drainage details currently
used on cast-in-place concrete cantilevered retaining walls and bridge abutments on
VTrans projects perform as expected and that the backfill has the engineering properties
assumed in the design.
(2) The second goal was to find the most cost effective backfill details.
To evaluate the above two overarching goals, the specific objectives of this research were to:
(1) Survey other state Departments of Transportation on their practices for abutment and
retaining walls;
(2) Study the effects of fines on a typical granular structural backfill by performing hydraulic
conductivity and shear strength tests at varied non-plastic fines contents;
(3) Monitor differential water levels between the stream and the backfill at two field sites;
(4) Analyze the collected data and develop specific recommendations for VTrans; and
(5) Prepare this final report.

- 5 -
1.3 ORGANIZATION OF THIS REPORT
Chapter 2 presents the results of the survey conducted of state DOTs. Chapter 0 presents
the literature review of previous relevant studies. Chapter 0 presents the laboratory methods used
to investigate the hydraulic conductivity and shear strength of a representative granular backfill
with varying non-plastic fines content, test results, and their analysis. Chapter 5 presents the
results of the field monitoring. A summary of the overall conclusions and recommendations for
future work is presented in Chapter 6.

- 6 -

- 7 -
2. STATE SURVEY OF DESIGN PRACTICES
The Vermont Agency of Transportation (VTrans) created a survey (Appendix A)
regarding backfill practices of state transportation agencies, and an invitation to take this survey
was emailed by VTrans to state geotechnical and structural experts in July 2011. The survey had
a good response rate with 53 complete responses. Four of these did not give contact information,
so it could not be determined which states these responses represent. The 49 remaining
responses represented 35 states. The survey results were aggregated by state to determine
general trends. In some cases, respondents for the same state gave contradictory answers, and
the responses were analyzed considering both answers. For example, if the answers to a survey
question were as follows:
State Response
State 1 Yes State 2 Yes State 2 No State 3 Yes State 3 Yes
The five responses would be aggregated by state into three responses. Since State 2
answered both “Yes” and “No,” “Yes” responses would have a range between 2 out of 3 states
and 3 out of 3 states. The survey results would be displayed in this way:
Yes 67-100% No 0-33%
Overall, these contradictions had little effect on the trends of the data.

- 8 -
2.1 SURVEY RESULTS
Each survey question is followed by the results and then any relevant commentary.
1. How do you account for hydrostatic pressure in your design assumptions?
Ignore it. 9% Design for it. 23% Install a drainage system in order to not design for it. 89% None of the above. 0%
The trend among the states is clearly to install a drainage system. Note that the
percentages above total to greater than 100%. Some respondents chose more than one answer.
2. Do you utilize backfill material with greater than 5% fines?
Yes 63-77% No 23-37%
A majority of states allow greater than 5% fines in their backfill, but this finding does not
take into account states that allow a little more than 5%. Respondents were asked about their
allowable percent fines in follow-up interviews, and answers ranged from 8% (a New England
state) to clay (a Midwestern state) with most states falling in between 10% and 15%. On the
other hand, some states only allow gravel or use low-strength concrete, so there is no clear trend
across states.
3. Has your organization done formal studies to investigate if greater fines contents could be used or if alternative materials could be used/added?
Yes 6-14% No 86-94%
The analysis of this question was a bit complicated because it asked about two items. Six
respondents answered “Yes,” but one of them did not give contact information. UVM followed

- 9 -
up on each “Yes” respondent by examining that state’s backfill guidelines and relevant reports
that could be found online. Several reports on alternative backfill materials were found but no
reports on allowing greater fines content. Next, each respondent was contacted requesting
information about their studies and, in some cases, asking for clarification on their backfill
guidelines. None of the five respondents could remember his/her state studying additional fines
content in backfill for cantilevered cast-in-place (CIP) abutments.
4. Please check all applicable backfill materials your DOT uses or would consider using in the future:
Shredded tires 29-31% Geofoam Blocks 57-71% Recycled concrete 17-31% Recycled pavement 20-26% Granular backfill 91-97% In-situ soils 37-49% Other 23-26%
Granular backfill is the most commonly accepted material. Geofoam blocks are also
popular, and many states use or would consider using in-situ soils. Given that 80% of the states
have standard specifications for backfill material (see Question 6 below), it seems likely that in
situ soils would still need to meet a state’s specifications to be allowed. The other materials
listed are allowed or would be considered by about 25% of the states. If a respondent selected
one of these alternative materials, more often than not s/he selected all of them. These results
suggest that such states are open to many different types of alternative backfill.
5. Do you have standard details for abutment and wingwall backfill?
Yes 69-74% No 26-31%
Most states have standard details for abutment and wingwall backfill.

- 10 -
6. Do you have standard specifications for abutment and wingwall backfill methods and materials?
Yes 77-80% No 20-23%
Most states have standard specifications for abutment and wingwall backfill methods and
materials, and standard specifications were slightly more common than standard details. Most
states that have one, have the other; although 7 out of the 35 states have only one or the other.
7. Have you changed your details in the past to provide a more cost-effective backfill detail, or do you currently vary your details on a project by project basis based on cost?
Yes 23-31% No 69-77%
About a quarter to a third of states have factored cost into their details.
8. Do you vary your design and details for backfill based on other non-geotechnical parameters, such as the average daily traffic (ADT)?
Yes 6-9% No 91-94%
Most states do not use non-geotechnical parameters when considering backfill details.
2.2 RESPONDENTS’ COMMENTS
In corresponding with some respondents, some relevant information not associated with a
specific question came to light. These findings are detailed below.
In 2005, Virginia Tech conducted a study on using less-than-ideal soils in non-critical
mechanically stabilized earth (MSE) walls, but the report focused on MSE walls and did not
characterize hydraulic conductivity of the soils. Some states participated in the National
Cooperative Highway Research Program (NCHRP) study 24-22 “Selecting Backfill Material for
- 11 -
MSE Walls.” The report from this project is not yet available, but a representative of NCHRP
said that their study would be of marginal relevance to the study presented here.
A number of respondents volunteered that they rarely use CIP walls due to their cost and
use MSE walls instead. An engineer from a Miswestern state explained that CIP walls usually
cost $110-150/sf while MSE walls cost $35-45/sf. He also explained that these numbers are
based on final costs of their previous DOT projects and may differ due to costs associated with
individual projects (piles, ground improvement, etc.). His state requires that CIP walls be
designed assuming full hydrostatic pressure in the backfill, so they would require more concrete
than Vermont. However, their backfill specifications are broader than Vermont’s (clay is
allowed), so their backfill may be cheaper as well. This engineer believed that forming is
responsible for the extra costs of CIP walls, and MSE walls avoid the additional labor and time
to cure. He also commented that MSE walls are not part of the structural integrity of the bridge.
Rather, the abutment is founded on piles and the MSE is simply to fill in space. The bridge will
stand even if the MSE is washed away. Slopes may be armored to resist scour, but it is not
crucial to the structure. However, scour has not been a particular problem for MSE walls in wet
environments in his opinion. This engineer also provided a report on a project that used an MSE
wall to stabilize an eroding bank in a river near a highway, so migration of soil behind an MSE
wall is not a large concern of them. The engineer could not recall if this project has faced any
difficulties with soil migration.
An engineer from a Southern state stated that his department tries to avoid abutments
near water. He has found that it is often cheaper to build longer bridges that avoid scour issues
as well as channel constriction and FEMA water surfaces. When it cannot be avoided, they

- 12 -
choose cantilevered walls about as often as they choose MSE walls. He could not pin down why
one would be chosen over the other because every project was site specific, noting that MSE
walls are more flexible while cantilevered walls are more resistant to flow. In his experience,
MSE walls have performed fine. To protect against scour, they may use sheet piling, tangent
drilled shafts, embed the wall, or other methods. Typically, 10 feet of scour is accounted for in
their designs.
Similarly, an engineer from another Southern state explained that they also try to avoid
abutments in stream crossings. Instead, they use slopes plated with riprap. If an abutment near a
stream is unavoidable, they use MSE walls and bury the bottom of panels 2 feet below scour
depth. They also found MSE walls consistently less expensive than CIP walls so they rarely use
the latter. Both of the above-mentioned engineers said they only use CIP walls when horizontal
space is at a premium, such as in mountainous terrain.
The respondents from the Northeast states were also contacted about their experience
with MSE walls in stream crossings. Not all states responded to the survey, but two other
Northeast states DOTs appear to avoid MSE walls in stream crossings due to a strong possibility
of washout. An engineer from another Northeast state said that MSE walls are significantly
cheaper than CIP walls, but, similar to the two Southern states above, they prefer not to make the
reinforced soil a structural component of the bridge in case the soil washes out.
None of the states contacted have standard details for MSE walls in wet crossings. It
appears that one Northeastern state uses the FHWA manual (FHWA-NHI-10-024/025) for
design of MSE walls.

- 13 -
In summary, state DOTs follow a wide variety of abutment wall practices. A variety of
backfill types and qualities are used including gravel, low-fines granular material, and materials
with high fines content. Other materials include low-strength concrete and geofoam blocks.
While some states appear to be moving away from cantilevered cast-in-place walls, other states
still find them useful, and some states, appear to be reluctant to use MSE walls in wet
environments. There appears to be a common thought that MSE walls should not be part of the
structural integrity of a bridge, but some states have found it more cost effective to use piles and
MSE walls rather than CIP walls. Many states are moving abutments and approaches away from
wet environments both for the benefits of not infringing on the channel and avoiding scour
concerns.
2.3 STANDARD DETAILS AND SPECIFICATIONS
A follow-up survey was conducted because several respondents to the original survey
indicated that standard details and specifications are currently in use within their DOTs.
Construction drawings of typical details of cast-in-place cantilever bridge abutments were
obtained when possible.
Table 2.1 summarizes the follow-up survey responses from the states, as well as
information obtained independently. The information obtained independently was typically
based on some project information found online, and has not been verified to be a standard
practice. The data summarized in Table 2.1 indicate that the range of allowable percent fines
varies between 0 and 15% among the states that responded, but the survey respondents did not
know the basis that led to the specific fines content specification. Also, the specified minimum
relative compaction varies between 90 and 100% based on standard Proctor maximum dry

- 14 -
density or between 95 and 97% based on modified Proctor maximum dry density. A related
question is how far the structural backfill should extend behind an abutment or a retaining wall.
State DOTs have differing specifications ranging from a vertical limit to a 1.5H:1V slope from
the heel of the wall footing as summarized in Table 2.1.
Table 2.1: Summary of State Survey Responses
State % Fines
Backfill Slope (H:V)
Backfill Offset from
Footing Heel (in.)
In-Place Relative
Compaction Required
(%)
In-Place Moisture Content
Required (%)
Proctor Type*
1 (Vermont) 0 – 6 Vertical 24" 90, 95, 100 Optimum ± 2 %
Standard 2+ 0 – 5 1.5 : 1 0" 95 Optimum Modified 3 0 –
10 Vertical 12" 95 Optimum Standard
4 0 – 12
Vertical 12" 95, 98 Optimum ± 2 %
Standard 5 0 –
15 1.5 : 1 0 - 39" 95 Optimum Standard
6 0 1: 2 0" 92, 97 Optimum ± 2 %
Modified 7 0 – 2 Vertical 0" 90, 93, 95 Optimum Standard 8 0 – 7 1 : 1 18" 95 Optimum ± 3
% Standard
9 0 Vertical 24" 98 Optimum
Standard 10 0 1.5 : 1 12" 90, 95 unavailable Modified 11 5 –
20 1.5 : 1 48” 95 Optimum ± 2
% Modified
Table 2.2 summarzies the drainage provisions specified by various states. Table 2.2
indicates that the majority of the states utilize multiple drainage provisions in an effort to
minimize hydrostatic pressure behind the abutment wall.
Note: *Modified refers to ASTM D1557 and AASHTO T180 Proctor test or equivalent.
Standard refers to ASTM D698 and AASHTO T99 Proctor test or equivalent.

- 15 -
Table 2.2: Drainage provisions for bridge abutments used in various states
State Weep holes Underdrain1 Composite2
1 (Vermont) X -- -- 23 X X X 3 X X -- 4 X X X 5 X X -- 6 X X -- 7 -- -- -- 8 X -- -- 9 X X X
10 -- X -- 11 -- X --
Note: 1. Underdrain refers to a pipe placed behind abutment wall, daylighting at
weepholes or sides of abutment.
2. Composite drainage consists of geotextile /geocomposite materials placed
against the face of the backfilled wall - to direct water to weepholes or
underdrain locations.
3. This state specifies a 3 foot minimum differential hydrostatic pressure to
be considered for design of structures along rivers.
Figure 2.1 and Figure 2.2 compare gradation limits for backfill material prescribed by
VTrans and some other states. Specifically, Figure 2.1 shows the gradation specifications for
VTrans compared to two other New England DOTs. The three sets of gradation requirements are
fairly comparable. Figure 2.2 shows the gradation specifications of VTrans compared to a
Northeastern DOT and Midwestern DOT – illustrating the wide acceptance range of the
Northeastern state and the lower restrictive acceptance range of the Midwestern state.

- 16 -
2.4 ANALYSIS OF DATA FROM PAST VTRANS BRIDGE ABUTMENT PROJECTS
VTrans provided grain size analysis and field compaction test data from a number of their
bridge abutment projects. These data are analyzed in the following.
Soil gradation data from a total of 12 past VTrans bridge abutment projects were made
available. The data contained the results of sieve analyses performed on backfill soil samples of
in-place material, located at either abutments or stockpiled material on-site. In Figure 2.3, all of
the project data have been plotted with the specification requirements. The soil gradation from
the Bridgewater project has been indentified since, because this borrow material was used as the
base soil in the experimental investigation presented later in this report. Data on gradations from
55 granular backfill sources available for abutment projects in Vermont have been plotted in
Figure 2.4. This plot also includes the VTrans gradation specification for comparison.

- 17 -
Figure 2.1: Backfill gradation specification of VTrans compared to that of two other New England states
0
10
20
30
40
50
60
70
80
90
100
0.010.1110100
Perc
ent P
assi
ng b
y M
ass
Grain Size (mm)
another New England state 2
Vermont
another New England state 1
Approximate Limit

- 18 -
Figure 2.2: Backfill gradation specification of VTrans compared to a Northeast state and a Midwest state
0
10
20
30
40
50
60
70
80
90
100
0.010.1110100
Perc
ent P
assi
ng b
y M
ass
Grain Size (mm)
a Northeastern state
Vermont
a Midwest state
Approximate Limit

- 19 -
Figure 2.3: Gradations of backfills of past abutment projects of VTrans
0
10
20
30
40
50
60
70
80
90
100
0.010.1110100
Perc
ent P
assi
ng b
y M
ass
Grain Size (mm)
Bridgewater VTrans Specification Additional Projects Approximate Limit

- 20 -
Figure 2.4: Gradations of some source soils available in Vermont
0
10
20
30
40
50
60
70
80
90
100
0.010.1110100
Perc
ent P
assi
ng b
y M
ass
Grain Size (mm)
VTrans Specification
Granular Backfill Sources Approximate Limit

- 21 -
Moisture-density reports were also analyzed to investigate the compaction of granular
backfill material used in past VTrans projects. Data were available from a total of 52 projects.
For each site, relative compaction and moisture content measurements were available for
between 1 and as many as 18 locations. A total of 211 data points were available from the 52
projects. The data contained field density and mositure content measurements made using
nuclear gauges within abutment backfills during construction. The data sheets often included the
minimum compaction required by VTrans at the measurement locations. These were specifically
reported for 165 measurements. Figure 2.5 presents results of the relative compaction tests
achieved in a histogram format. Figure 2.6 summarizes the minimum relative compaction
required by VTrans at the measurement location again in a histogram format.
The results of Figure 2.5 indicate that a range of minimum relative compaction values
(based on standard Proctor test) were obtained on past VTrans bridge abutment projects.
Approximately 75% of the measurements recorded relative compaction between 95 and 100%.
The mean for the relative compaction test data is approximately 97.25%. Figure 2.6 shows that
the majority of tests have a specified minimum relative compaction of 95%. Approximately 40
tests were excluded because they did not report minimum required relative compaction. As seen
in Figure 2.7, about 70% of the data points recorded a moisture content more than 2% below the
optimum.

- 22 -
Figure 2.5: Histogram of relative compaction achieved in the field for VTrans abutment projects
Figure 2.6: Histogram of the specified minimum relative compaction (based on standard
Proctor test) for dry density measurements made in VTrans abutment projects
0
10
20
30
40
50
60
70
80
90
100
< 85
85 -
87.5
87.5
- 90
90 -
92.5
92.5
- 95
95 -
97.5
97.5
- 10
0
100
-102
.5
102.
5 -1
05
> 10
5
Tota
l # o
f Tes
ts
Relative Compaction (%)
020406080
100120140160
90 95
Test
s with
Spe
cifie
d M
inim
um C
ompa
ctio
n
Minimum Relative Compaction (%)

- 23 -
Figure 2.7: In-place optimum moisture (based on standard Proctor test) difference for past VTrans abutment projects

- 24 -

- 25 -
3. LITERATURE REVIEW
3.1 BACKGROUND
The Vermont Agency of Transportation (VTrans) currently limits the maximum
allowable fines content, within granular structural backfill for cantilever retaining walls, to 6%.
The American Association of State Highway and Transportation Officials (AASHTO) and other
federal guidelines generally recommend a limit of 5%. The assumption appears to be that
reduced fines content within the structural backfill will promote a free-draining condition,
thereby eliminating the need to design an abutment or retaining wall to withstand additional
hydrostatic pressure. There appears to be limited information or data to justify this maximum
fines content recommendation made by various agencies, as well as the current maximum
specified by VTrans. Therefore, this research included:
(1) An experimental study on a natural granular backfill material currently used by
VTrans. The effects of increased fines content and confining pressure on hydraulic
conductivity and shear strength parameters of the backfill material were determined
using a flexible wall triaxial apparatus fitted with flow pumps; and
(2) Field observations of differential water levels between the stream and the backfill at
two sites.
In this chapter, a summary of relevant literature on various aspects of the effects of non-
plastic fines content on saturated hydraulic conductivity and shear strength of granular soils and
associated experimental techniques is presented.

- 26 -
3.2 MAXIMUM ALLOWABLE FINES CONTENT
The maximum allowable fines content refers to the percentage of soil mass particles
passing a No. 200 sieve (<0.075mm) compared to the total mass of the soil. Maximum allowable
fines content is specified to limit the uncertainty introduced by certain fines types. The
evaluation of the stress induced by cohesive soils is highly uncertain due to their sensitivity to
shrinkage and swelling as well as a varied degree of saturation (AASHTO 2010). Furthermore,
higher fines content can reduce the ability of the backfill to drain properly. The term ‘free-
draining’ is commonly used in test method standards and design specifications to describe the
ability of water to drain from soil.
Various Federal guidelines from the literature were reviewed for their recommendations
regarding backfill materials. Most of these sources mentioned free-draining but no specific
hydraulic conductivity was found to be associated with this term. Table 3.1 summarizes backfill
recommendations from five different sources:
Table 3.1: Summary of fines limitations from various publications
Source Maximum Fines Content
Notes (regarding fines)
AASHTO (2010) 5% Free-draining defined as < 5%
FHWA (2006) 5% 15% if rapid drainage is not required
NAVFAC (1986) 15% Ensure proper drainage
UFC (2005) 5% Free-draining defined by soil type
USACE (1989) Not Prescribed Clean Sands and Gravels

- 27 -
The U.S. Army Corps of Engineers (USACE) and Naval Facilities Engineering
Command (NAVFAC), along with the Air Force Civil Engineer Support Agency (AFCESA), are
responsible for administration of the Unified Facilities Criteria (UFC) documents, which is
primarily responsible for providing technical criteria for military construction. Although USACE
(1989) did not prescribe a maximum fines limit of 5% fines, clean sands and gravels are limited
to 5% fines by definition, as per the Unified Soils Classification System (USCS). NAVFAC DM
7.02 suggests up to 15% fines; however, clays and other fine-grained soils, as well as granular
soils with considerable amount of clay and silt (greater than or equal to 15%) are not commonly
used as backfill material for retaining walls or abutments. Where they must be used, it is
typically recommended that the earth pressure should be calculated using at-rest conditions or
higher pressure – to account for the potentially poor drainage conditions, swelling, and frost
action that may occur (NAVFAC 7.02, 1986).
AASHTO (2010) advises caution in the determination of lateral earth pressures when
using cohesive soils and recommends that if possible, cohesive or other fine-grained soils should
be avoided as backfills. AASHTO defines a free-draining backfill as a material containing less
than 5% passing a No. 200 sieve. If the material is free-draining (a fines content limited to 5%),
the need to design the structure to withstand hydrostatic pressure is eliminated (AASTO 2010).
To account for hydrostatic pressure, the majority of respondents from the previously
mentioned state survey indicated that drainage was incorporated in the design rather than
assuming the presence of water pressures. The California Department of Transportation
(Caltrans) Bridge Design Specification (2004) requires drainage provision and restrictions to
high plasticity materials as backfill in locations where retaining walls and abutments are used so

- 28 -
that hydrostatic pressure does not need to be considered. However, the design specifications also
state that structures along rivers and canals shall require a minimum differential hydrostatic
pressure equal to 3 ft of water be considered for design. It also states that in situations of rapid
drawdown or significant river fluctuations, a greater differential may be required or a more
rapidly free-draining backfill material may be used, such as open graded coarse gravel or shot
rock (rip-rap).
Merriman (1955) showed that soil types can be grouped by effectiveness of vibratory
compaction (
Table 3.2). The compaction of a soil relies on the ability of water to move through soil
pores as the void space decreases. Hydraulic conductivity tests performed by Merriman (1955)
on these soil types revealed that due to the strong variation in hydraulic conductivity with little
variation in gradation, it cannot be used as a measure for how well a soil may compact. In
Table 3.2, the soil types GW-GM, GW-GC, GP-GM, GP-GC are considered generally
suitable with less than 8% fines; and soils SM and SC can contain up to 16% fines, requiring
special consideration. The two primary factors that affected the compaction of these materials
were the gradation and the plasticity of the fines present. The larger the particle size and the
more uniform the gradation, greater is the allowable fines content to obtain satisfactory densities.
Also, with less plasticity of the fines, a greater fines content was allowed (Merriman, 1955).
The soil types presented in Table 3.2 are also discussed in UFC (2005). Soil types GW,
GP, SW and SP are defined as free-draining, pervious soil types with a maximum of 5% fines.
This maximum fines content is defined by the Unified Soil Classification System (USCS), and
therefore, contains less than 5% fines by definition.

- 29 -
The current ASTM test method (D4254 and D4253) for determining the minimum and
maximum dry densities, respectively, defines free-draining as a cohesionless material with less
than 15% fines content. The ability of the soil to drain without developing pore pressure allows
the soil to be effectively compacted.
Table 3.2: Suitability of soils for compacted backfill (Merriman 1955)
3.3 TESTING METHODS
Testing of granular, cohesionless material can produce high variation and difficulty in
reproducibility. A cooperative study was performed under the sponsorship of the American
Society for Testing and Materials (ASTM), where 41 soil laboratories carried out typical soil
mechanics tests to determine the variation associated with gradation, minimum and maximum
density, and Proctor compaction tests on identical specimens of fine sand and gravelly sand
(Tavenas, 1973). All tests indicated a large variability and low reproducibility within the
different types of tests performed. Also, variation among different laboratories was as high as

- 30 -
two to three times greater than variation between duplicate tests. Some of the factors that have
the largest effect on the variation and reproducibility on identical tests include the size of the
sample and the method of physically sampling or handling the soil material (Tavenas, 1973).
Current ASTM standard D6913 addresses the sample size to account for the maximum
particle within the soil. The ASTM standard D6913 addresses the issue related to sampling by
suggesting that the splitting or partitioning of samples for various tests be excluded or limited to
no more than a few times, otherwise the sample will no longer be representative. This will limit
the segregation of particles where samples would have decreased fines and increased larger
particle sizes. The standard suggests using moist sampling to provide temporary cohesion and is
especially recommended if the maximum particle size is less than 19 mm (¾” sieve).
3.4 EFFECT OF FINES ON SOIL PROPERTIES
3.4.1 COMPACTION
Table 3.3 presents recommendations for compaction of various USCS soil types made by
UFC (2005) along with a comparison of compaction test types described in Table 3.4. As seen in
Table 3.4, the CE 55 test is comparable to the AASHTO T-180 (ASTM D1557). For the GW,
GP, SW and SP soil types, the in-place water content for compaction is 100% saturation. The
NAVFAC 7.02 (1986) manual describes soils that are sensitive and not sensitive to compaction
moisture. Silts and silty-sands typically have steep moisture-density curves and can be more
difficult to compact to the specified relative compaction in the field due to their sensitivity to
moisture. Soils that are coarse-grained and well-graded with less than 4% fines (or less than 8%
fines for soil of uniform gradation) are typically not sensitive to compaction moisture. These

- 31 -
materials are capable of being compacted at near fully saturated moisture contents in the field. If
a soil has a hydraulic conductivity greater than 1 x 10⁻³ cm/sec, it is considered to be insensitive
to compaction moisture (NAVFAC 7.02 1986).
Table 3.3: Summary of compaction criteria (UFC, 2005)

- 32 -
Table 3.4: Compaction test comparison (UFC, 2005)
The ASTM test methods for standard and modified Proctor densities (ASTM D698 and
D1557) state that the test methods will generally produce a well-defined maximum dry density
compaction curve for non-free draining soils (fines content greater than 15%). However, if either
method is used for free-draining soils, the maximum dry density may not be well defined and
may be more easily obtained using ASTM D4253 Standard Test Methods for Maximum Index
Density and Unit Weight of Soils Using a Vibratory Table (ASTM D698 and D1557). The
D4253 test method is suggested for use on free-draining materials, which is defined as having a
maximum fines content of 15%.
In the study performed by Tavenas (1973), the results of their standard and modified
Proctor compaction tests showed better reproducibility than maximum densities obtained using a
vibratory table. The use of the vibratory table method can reduce crushing of particles and was
expected to show higher reproducibility. Due to the magnification of error in the maximum and

- 33 -
minimum densities, Tavenas (1973) recommends using relative compaction based on the
modified Proctor density as a good evaluator for compactness in cohesionless soils.
For many types of free-draining, cohesionless soils, the Proctor test methods can cause a
moderate amount of degradation due to the amount of compaction energy. When degradation
occurs, typically there is an increase in the maximum dry density that is recorded in the
laboratory. Therefore, the laboratory dry density obtained will not be representative of field
conditions and in some cases may not be achievable in the field due to the misleading maximum
dry density measurement (ASTM D1557).
In previous studies, the increase in fines content has produced higher maximum dry
densities for natural granular soils. Merriman (1955) tested sands and granular soils with fines
ranging from 0-18% and showed that maximum dry density increased with an increase in fines
content for relative density measurements. For the 95% standard Proctor density tests, the
density of the sand-gravel mixture reached a maximum at 13% fines content and remained
unaffected by an increase in fines between 13 – 18%. For relative density tests, compacted with
a vibratory table, the densities began decreasing at 9% fines content.
Siswosoebrotho et al. (2005) showed that a critical fines content existed for a sand with
added non-plastic fines ranging from 0 – 16%. The maximum dry density increased with
additional fines and began to decrease at a fines content of 9%.

- 34 -
3.4.2 HYDRAULIC CONDUCTIVITY
Published data in the open literature on the effects of fines on the hydraulic conductivity
and shear strength of compacted granular backfill soils by systematically varying the fines
content appears to be sparse. Relevant laboratory data found in the literature on hydraulic
conductivity measurements of granular soils with varying fines content (non-plastic or nearly
non-plastic) are summarized in Table 3.5. For brevity the ranges of hydraulic conductivity are
provided in the last column of Table 3.5. The smaller hydraulic conductivity is typically
associated with higher end of fines content.
Table 3.5: Comparison of hydraulic conductivity testing with other investigations
Investigation
Base Soil Type
AASHTO (8) (USCS) (9)
Fines Content
(%)
Moisture Content Density
Permeameter Type and Sample
Diameter
Confining Pressure kPa (psi)
Hydraulic Conductivity
(cm/s)
Merriman (1955)
Fine sand and coarse sand A-3 (SP);
sand-gravel mixture A-1-b
(SP*)
0-18 Optimum
95% of std.
Proctor or 70%
RD
Consolidometer, falling head
10.8 cm (4.23 in.)
138 (20) Normal Stress
Fine sand: 1 x 10⁻³ to 4 x 10⁻⁴
Coarse sand: 2 x 10⁻³ to 8 x 10⁻⁴
Sand-gravel mixture:
9 x 10⁻³ to 2 x 10⁻⁵
Siswosoebrotho et al. (2005)
A-1-a (SP*) 0-16 Optimum
95% of mod.
Proctor
Rigid compaction, falling head
15.2 cm (6.0 in.)
NA 9.6 x 10⁻³ to 1.3 x 10⁻³
Bandini and Sathiskumar
(2009)
50-50 sand A-1-b (SP);
ASTM sand A-3 (SP)
0-25 NA NA
Flexible wall, constant and falling head
7.0 cm (2.75 in.)
50 (7), 100 (15), 200 (29), 300 (44)
2 x 10⁻³ to 2.2 x 10⁻⁵
* Although the authors do not specifically report, particles greater than 19 mm (3/4 in.) were probably removed from the base soil prior to testing. NA: not applicable
Merriman (1955) conducted falling head permeability tests in a rigid permeameter on
three types of compacted natural soils (a fine sand, a coarse sand, and a sand-gravel mixture).
Figure 3.1 shows the gradations of soils tested by Merriman (1955). The soils were first washed
to remove the natural fines and then incremented with natural non-plastic 0 – 18% silt. Results

- 35 -
showed that the addition of non-plastic fines between 0 - 18% reduced the hydraulic conductivity
significantly as summarized in Table 3.5. Merriman (1955) concluded hydraulic conductivity to
be an unreliable indicator of how well a soil could be compacted. Additionally, the higher
plasticity fines tended to reduce the hydraulic conductivity more than non-plastic fines.
Figure 3.1: Soil types tested by Merriman (1955) with VTrans gradation specification limits shown
Tests performed by Siswosoebrotho et al. (2005) on granular aggregate with fines
contents of 0 – 16% showed hydraulic conductivity decreases with the addition of fines. Values
of hydraulic conductivity varied within one order of magnitude for the non-plastic fines between
9.6 x 10⁻³ to 1.3 x 10⁻³ cm/s for 0 – 16% fines. Mixtures of plastic fines, with a plasticity index
range of 5 to 13, had a range of hydraulic conductivity between 1.2 x 10⁻³ to 2.6 x 10⁻⁵ cm/s.

- 36 -
Tests were performed in a 150 mm compaction permeameter using constant head and falling
head tests with samples prepared with the modified Proctor method.
Laboratory hydraulic conductivity tests performed by Bandini and Sathiskumar (2009) on
fine sand with fines contents of 0-25% showed that hydraulic conductivity decreased with an
increase in fines content and confining pressure (Figure 3.2 and Figure 3.3, respectively).
Comparisons were made between two types of fine sand, an Ottawa sand and ASTM 20-30. Both
materials are poorly graded. The silt used was a ground silica Sil-Co-Sil manufactured material.
Their tests were performed using a flexible wall permeameter on specimens prepared at 160 mm
(6.3 in.) height by 70 mm (2.8 in.) diameter. Tests were performed using a pressure control panel
with burettes. As seen in Figure 3.2 and Figure 3.3 hydraulic conductivity decreased with
increasing fines content and confining stress, respectively. It appears that at fines contents
greater than about 15%, the decrease in hydraulic conductivity was more pronounced. However,
comparison of the effects of fines on hydraulic conductivity at specified relative compaction
(which could be related to field compaction) was not done in this study.

- 37 -
Figure 3.2: Hydraulic conductivity versus silt content (Bandini and Sathiskumar, 2009)
Figure 3.3: Hydraulic conductivity versus confinement (Bandini and Sathiskumar, 2009)

- 38 -
NAVFAC DM 7-1 (1986) has guidelines for coarse grained materials mixed with
different types of fines, shown in Figure 3.4. For silt contents between 0 – 15% the hydraulic
expected conductivity ranges from 5 x 10⁻³ cm/s to 5 x 10⁻⁸ cm/s, respectively. This guideline
does not mention how the hydraulic conductivities were measured; using a flexible wall
permeameter or a rigid wall compaction permeameter. As mentioned in the previous section,
NAVFAC 7.02 (1986) defines soils that are not affected by compaction moisture as having
hydraulic conductivities greater than approximately 1 x 10⁻³ cm/sec.

- 39 -
Figure 3.4: Grain size distribution and hydraulic conductivity (NAVFAC DM7-1, 1986)
NAVFAC DM 7-2 (1986) has typical values of compacted soils based on soil type
classification in

- 40 -
Table 3.6. The values shown for hydraulic conductivity were tested at maximum dry
density using the modified Proctor method. The soil types described as free-draining previously
in UFC (2005) are shown. The hydraulic conductivities for GW and GP are 2.5 x 10⁻² and 5 x 10-
2 cm/sec, respectively. Soils SW and SP are both characterized by hydraulic conductivities
greater than 5 x 10⁻⁴ cm/sec. The hydraulic conductivity decreases with increasing fines based on
soil types. Within the group of free-draining soils, the fines content does not change. However,
with decreased gravel content (SW and SP types) the hydraulic conductivity increases. The
hydraulic conductivity appears to be affected by the overall soil gradation as opposed to solely
the fines content. For silty gravel (GM, containing greater than 12% fines), the hydraulic
conductivity is greater than 5 x 10⁻⁷ cm/sec. Figure 3.5 shows the hydraulic conductivity could
range from slightly less than 10-2 cm/s to almost about 10-8 cm/sec. Well graded gravel, (GW)
containing less than 5% fines, is expected to have a hydraulic conductivity greater than 2.5 x 10⁻²
cm/sec.
Terzaghi and Peck (1967) discussed drainage properties of different soil types as seen in
Figure 3.6. For soil types with a hydraulic conductivity range between 102 to 10-4 cm/s, the
drainage performance was considered good. Soils with hydraulic conductivities as low as 10-3
cm/s include clean gravel, clean sands and gravel mixtures. Hydraulic conductivity in a range of
10-3 to 10-4 cm/s would indicate good drainage in soils including very fine sands, organic and
inorganic silts, mixtures of sand silt and clay, etc. Terzaghi and Peck (1967) recommend that a
constant head permeameter be used for testing hydraulic conductivity greater than 10-3 cm/s. A
falling head permeameter is recommended for soils with hydraulic conductivities between 10-3 to
10-6 cm/s, but Terzaghi and Peck (1967) caution that rigid wall permeameter tests are unreliable
and user experience is needed for testing. They also recommend that for hydraulic conductivity

- 41 -
values less than 10-6 cm/s, falling head permeameter tests are fairly reliable, but even greater user
experience is required for testing.
Terzaghi and Peck (1967) recommend using soil filter materials with a maximum particle
size of 3 in. and not containing greater than 5% passing the No. 200 sieve. The filter material
refers to the material placed between the native soil and a drain pipe. This type of drainage is
typically used behind retaining walls. The filter material should also be uniformly graded as
opposed to gap graded. They found that filter material needs to have voids that are small enough
to prevent the migration of fines but large enough to allow water to flow out.
ASTM D2434 Standard Test Method for Permeability of Granular Soils (constant head)
limits the test standard to granular material with a maximum fines content of 10% and for
specimens with a hydraulic conductivity greater than 1 x 10⁻³ cm/s. This standard also indicates
that the required porous stones should not have openings greater than the fines’ particle size
(0.075mm). ASTM D5084 Standard Test Methods for Measurement of Hydraulic Conductivity
of Saturated Porous Materials Using a Flexible Wall Permeameter, states that the porous stones
must have a significantly greater hydraulic conductivity so they do not inhibit or control the
measured hydraulic conductivity value of the soil. The standard, however, does not specify a
maximum pore size for porous stones.

- 42 -
Table 3.6: Typical properties of compacted materials (NAVFAC DM7-2, 1986)

- 43 -
Figure 3.5: Typical hydraulic conductivity values for USCS soil types (USBR Earth manual part 1, 1998)

- 44 -
Figure 3.6: Hydraulic conductivity and drainage of given soil types (Terzaghi and Peck 1967)
The testing standards (D2434 and D5084) suggest that soils with up to 10% fines can
have a hydraulic conductivity of 1 x 10⁻³ cm/s or greater and that soils with greater than 10%
fines can have hydraulic conductivities smaller than 1 x 10⁻³ cm/s. The pores must be small
enough for the porous stones to prevent the passage of fines, but large enough to allow water to
flow. Typically, filter paper is included with the use of porous stones to prevent fines migration,
but its effects on the overall hydraulic conductivity may lead to some error. A test should be
performed using the intended apparatus without any specimen in the permeameter to evaluate the
head losses (ASTM D5084).

- 45 -
ASTM D2434 suggests using a rigid wall permeameter for soils with hydraulic
conductivity greater than 1 x 10⁻³ cm/s. ASTM D5084 suggests using a flexible wall
permeameter for soils with hydraulic conductivity smaller than 1 x 10⁻³ cm/s. It appears that at
the cut-off of 1 x 10⁻³ cm/s, there is the potential to obtain unreliable hydraulic conductivity
measurements, which had been observed by Terzaghi and Peck (1967). ASTM D5084 stipulates
that for testing such soils (with hydraulic conductivity around 10-3 cm/s) the tubing sizes of the
apparatus must be increased along with the porosity of the porous stones. Increasing the porous
stone porosity may not be possible due to the potential for fines to migrate through pores of the
stones. If an increase in porous stone is not made, a test of the overall system head loss is
recommended to ensure that the porous stones are not significantly limiting the measured
hydraulic conductivity of the specimen (ASTM D5084). For a constant rate of flow, the system
must be able to maintain a flow to +/- 5% as well as be capable of measuring head loss to this
accuracy. This is not easily performed without the use of transducers and flow-pumps (ASTM
D5084). Note that in the study presented in this report the head loss test was performed and the
conditions were determined to be satisfactory.
3.4.3 SHEAR STRENGTH PARAMETERS
One of the most commonly used methods of measuring the friction angle of soils is to
perform a series of triaxial compression tests. Different types of tests exist for this method based
on the soil type and loading/drainage conditions expected in the field. For granular material, the
consolidated drained (CD) test is typically used to measure the shear strength parameters. The

- 46 -
test condition represents soil that has been allowed to consolidate for sufficient time. During
compression, the soil is then allowed to drain without developing any excess pore pressure.
Bowles (1982) stated that the results from the CD, CU and UU tests performed on
granular free-draining material will produce very similar results; no data were found to verify
this suggestion.
Table 3.7 shows typical values of drained internal friction angles for granular soils. The
internal friction angle for sands and gravels ranges from 26 to 48 degrees.
Table 3.7: Friction Angles of Granular Soils (Lambe and Whitman, 1979)
In

- 47 -
Table 3.6, the soil types defined by UFC (2005) have effective friction angle values from
tests performed on samples compacted using the standard Proctor method at maximum dry
density. For the GW and GP soils, the friction angle is greater than 38 and 37 degrees,
respectively. Similarly, for SW and SP, the friction angle is 38 and 37 degrees, respectively.
It appears that the term cohesionless is used for describing a free-draining soil in the
more current publications. The Unified Facilities Guide Specifications (UFGS 2008) describes
cohesionless soils as those classified in the USCS as GW, GP, SW, and SP. Cohesive materials
include materials classified as GC, SC, ML, CL, MH, and CH. Materials that are classified as
GM, GP-GM, GW-GM, SW-SM, SP-SM, and SM shall be identified as cohesionless only when
the fines are non-plastic.
NAVFAC DM 7-2 (1986) shows a relationship between friction angle and soil’s index
properties (unit weight and void ratio) for different soil types (Figure 3.7). Friction angle values
are effective values obtained from tests that involved cohesionless soils with non-plastic fines. In
general, the plot indicates that internal friction angle decreases as soil is more uniformly graded,
less dense, and has higher fines content.
Thevanayagam (1998) performed consolidated undrained (CU) triaxial compression tests
on sand samples of 10 cm diameter and 20 cm height with 0%, 10% and 25% fines to determine
their strength. Results showed that the friction angle decreased as fines increased but not
significantly. The difference between the average friction angle for soils with 0-2% Kaolin silts
and 27% Kaolin silts was only about 3.

- 48 -
Figure 3.7: Friction Angle for Given Soil Type (NAVFAC DM7-2, 1986)

- 49 -
4. EFFECTS OF FINES ON HYDRAULIC CONDUCTIVITY AND SHEAR STRENGTH
4.1 SOILS, SAMPLE PREPARATION AND TESTING METHODS
The grain size distribution of the base granular soil used in this study (from the borrow
source of the Bridggewater project) is shown in Figure 4.1. For reference, the VTrans current
standard specification of structural backfill for abutments and retaining walls is also included. In
addition, grain size distributions of the base soils used in other investigations found in the
literature (Table 3.5) are also included.
Figure 4.1: Grain size distribution of the base material of this study, compared to VTrans’ specifications (vertical bars); base soils used in relevant published studies are also included.

- 50 -
An abundant source of fines was identified within the same quarry pit where the base
material was obtained to allow systematic variation of the fines content from 0 to 25%.
Hydrometer analysis (ASTM D422) and Atterberg limit (ASTM D4318) results indicated that
the fines had similar properties to the natural fines in the base material and were non-plastic or
had very low plasticity. Prior to testing, the base material was first sieved and washed to remove
the natural fines and then incremented with the selected fines.
For the majority of the tests, the target specimen densities were 95% of maximum dry
densities per standard Proctor test at optimum moisture content. The Standard Proctor density is
most commonly specified, as per the survey (Table 2.1). Standard Proctor tests were performed
on six combinations of the base soil and fines contents (0, 5, 10, 15, 20, and 25% by mass). For
comparison purposes, modified Proctor tests were also performed. Specimen densities of 95% of
maximum dry density per standard Proctor tests related to about 91% of maximum dry density
per modified Proctor tests. All Proctor tests were performed in a 15.2 cm (6 in.) mold per
standards ASTM D698 and D1557 because the soil contained particle sizes up to 19 mm (3/4
in.). An automated hammer mechanism was used. Table 4.1 summarizes maximum dry densities
and optimum moisture contents obtained from the Proctor tests. In general, the maximum dry
density increased and optimum moisture content decreased as the fines content increased. As
expected, maximum dry densities and optimum moisture contents from modified Proctor tests
were greater and smaller, respectively, than those from standard Proctor tests for a given fines
content. A small number of tests were conducted at 90% relative compaction and optimum
moisture content per standard Proctor test.

- 51 -
Table 4.1: Summary of standard and modified Proctor test results
Fines Content (% by mass)
AASHTO Soil
Classification
USCS Soil
Classification
Standard Proctor Modified Proctor
Maximum Dry
Density, g/cm3 (pcf)
Optimum Moisture Content
(%)
Maximum Dry
Density, g/cm3 (pcf)
Optimum Moisture Content
(%)
0
A-1-b SP 2.01 (126)
10.5
2.11 (132)
7.7 5 A-1-b SP-SM 2.09 (130)
(8.08.5
8.5 2.19 (137) 6.0 10 A-1-b SP-SM 2.12 (132)
8.0 2.23 (139) 5.3 15 A-1-b SM 2.18 (136) 7.3 2.26 (141) 5.3 20 A-1-b SM 2.22 (139) 7.4 2.24 (140) 7.0 25 A-1-b SM 2.17 (135) 7.9 2.21 (138) 6.0
Hydraulic conductivity and triaxial tests were performed using automated Geocomp
Flowtrac II flowpumps, 4.4 kN (10 kip) load frame, and a triaxial cell that accommodated 15.2
cm (6 in.) diameter and about 30.5 cm (12 in.) high specimens. Flexible wall permeability tests
were chosen to allow for back pressure saturation and to reduce potential side leakage which is
common in rigid permeameters. The specimens were prepared using a split mold to allow the soil
mixture to be compacted to the desired initial density. The dry mass of base material and silt was
added together, mixed, and then water was added to optimum moisture. This mixture was then
compacted in equal layers in the split mold by hand to a fixed height, to the target density. A
membrane thickness of 0.635 mm (0.025 in.) was used to reduce the chance of puncture during
compaction, and membrane correction was applied in data reduction. After sample preparation,
the tubing and pumps were de-aired while the sample was allowed to saturate with deaired water
under a low gradient prior to being connected to flow pumps. Back pressure saturation was
performed to verify the B parameter of 0.95 or greater using the automated flow pumps.

- 52 -
Hydraulic conductivity tests were performed using constant flow. No loss of fines was observed
during or after testing and the porous stones were inspected and cleaned prior to each test.
A head loss check was performed on the system prior to testing as suggested by ASTM
D5084. This test was performed using a hollow Plexiglas cylinder, in place of the soil sample,
with a membrane to observe the effect of the tubing and porous stones without any soil. This
check showed that the porous stones and losses in other components of the apparatus had little
effect on the measured hydraulic conductivities of the soil specimens.
For each combination of the base soil and fines content, three triaxial specimens were
prepared. Tests were performed using ASTM D7181 for consolidated drained triaxial
compression (CD) tests. Hydraulic conductivity was measured at 41 kPa (6 psi) confining
pressure followed by a CD test for the first specimen. For the second specimen, hydraulic
conductivity was measured at a confining pressure of 83 kPa (12 psi) after the 41 kPa (6 psi)
measurement and then a CD test was performed. Hydraulic conductivities were measured at 41,
83, and 124 kPa (6, 12, and 18 psi) confining pressures followed by a CD test for the third
specimen. Occasionally, an additional specimen was prepared for repeating a test. All CD tests
were conducted at a shearing rate of 0.01%/min.
4.2 EXPERIMENTAL RESULTS
The hydraulic conductivity measurements are plotted in Figure 4.2 through Figure 4.5.
Hydraulic conductivities were measured on three specimens at 41 kPa (6 psi), on two specimens
at 83 kPa (12 psi), and once at 124 kPa (18 psi), and were fairly repeatable. As expected,
hydraulic conductivity decreased with increasing confining pressure as seen in Figure 4.2. As

- 53 -
seen in Figure 4.3, hydraulic conductivities of 0 - 10% fines contents were close to each other,
and greater than 10-4 cm/s (0.14 in/hr) for up to 15% fines content. There is a distinct drop in
hydraulic conductivity between 10 and 15% fines content and continued to decrease with higher
fines content. Hydraulic conductivity of specimens compacted at 90% relative compaction was
generally higher than that of specimens compacted at 95% relative compaction, as expected.
This investigation included only one base soil. To evaluate if the above conclusions could
be generalized to other granular soils, the results obtained here are combined in Measured
hydraulic conductivity versus fines content (the dashed lines are based on judgment and not
statistically determined)
Figure 4.6 with other relevant results found in the literature (Merriman, 1955;
Siswosoebrotho et al., 2005; Bandini and Sathiskumar, 2009). The gradations of the soils used by
these investigators are included in Figure 4.1. Other specifics of their test conditions are
summarized in Table 3.5. The base soil types and test conditions in the investigations varied
significantly. For example, the base soils included fine sand to mostly gravelly soils. Both rigid
and flexible wall permeameters were used and the techniques of measuring hydraulic
conductivity also varied (constant head, falling head and constant flow). The confining pressures
also differed. Despite these differences, the estimated best fit of the hydraulic conductivities
summarized in Measured hydraulic conductivity versus fines content (the dashed lines are based
on judgment and not statistically determined)
Figure 4.6 are consistent with this study in that the hydraulic conductivity of the granular
base soils did not change appreciably for non-plastic fines content of up to 10%.

- 54 -
As described earlier, a consolidated drained strength test was conducted on each
specimen after the hydraulic conductivities were measured. The effective internal friction angle
and effective cohesion values for peak and ultimate failure conditions are summarized in Table
4.2. The internal friction angle decreased with an increase in fines content. The small effective
cohesions are due to a slight decrease that occurred in peak friction angle with increased
confinement and applying a straight-line fit to each of the corresponding failure circles. The
peak internal friction angle decreased from about 39o for zero percent fines to about 33o for 25%
fines. For the same fines content range, the ultimate friction angle decreased from about 35o to
32o. The data from triaxial compression tests are included in Appendix B.
Figure 4.2: Measured hydraulic conductivity versus confining pressure for 95% RC
0.001
0.014
0.142
1.417
14.1700 5 10 15 20
1.0 E-06
1.0 E-05
1.0 E-04
1.0 E-03
1.0 E-02
0 20 40 60 80 100 120 140
Hydraulic C
onductivity (in/hr)
Confining Pressure (psi)
Hyd
raul
ic C
ondu
ctiv
ity (c
m/s
)
Confining Pressure (kPa)
0%5%10%15%20%25%
Fines Content:

- 55 -
Figure 4.3: Effect of Fines on hydraulic conductivity at varied confinement for 95% RC
0.001
0.014
0.142
1.417
14.170
1.0 E-06
1.0 E-05
1.0 E-04
1.0 E-03
1.0 E-02
0 5 10 15 20 25 30
Hydraulic C
onductivity (in/hr) H
ydra
ulic
Con
duct
ivity
(cm
/s)
Fines Content (% mass)
41 kPa (6 psi)
83 kPa (12 psi)
124 kPa (18 psi)

- 56 -
Figure 4.4: Measured hydraulic conductivity versus confining pressure for 90% RC
0.01
0.14
1.42
14.170 5 10 15 20
1.0 E-05
1.0 E-04
1.0 E-03
1.0 E-02
0 20 40 60 80 100 120 140
Hydraulic C
onductivity (in/hr)
Confining Pressure (psi)
Hyd
raul
ic C
ondu
ctiv
ity (c
m/s
)
Confining Pressure (kPa)
Fines Content:
- 57 -
Figure 4.5: Effect of Fines on hydraulic conductivity at varied confinement for 90% RC
0.00
0.01
0.14
1.42
14.17
1.0 E-06
1.0 E-05
1.0 E-04
1.0 E-03
1.0 E-02
0 5 10 15 20 25 30
Hydraulic C
onductivity (in/hr) Hyd
raul
ic C
ondu
ctiv
ity (c
m/s
)
Fines Content (% mass)
41 kPa (6 psi)
83 kPa (12 psi)
124 kPa (18 psi)

- 58 -
Measured hydraulic conductivity versus fines content (the dashed lines are based on judgment and not statistically determined)
Figure 4.6: Hydraulic conductivities from this study compared to other relevant studies
Table 4.2: Summary of drained shear strength parameters
Fines Content (%)
Peak Strength Ultimate Strength Cohesion, kPa
(psi) Friction Angle,
degrees Cohesion, kPa
(psi) Friction Angle,
degrees 0 12.4 (1.78) 38.9 2.3 (0.34) 34.5 5 11.9 (1.72) 39.7 0.0 (0.00) 35.3 10 8.2 (1.19) 36.4 0.8 (0.12) 34.2 15 19.1 (2.77) 34.1 0.4 (0.06) 35.5 20 6.2 (0.90) 33.4 4.1 (0.60) 32.2 25 5.2 (0.75) 33.1 4.3 (0.62) 31.7
0.001
0.014
0.142
1.417
14.170
1.0E-06
1.0E-05
1.0E-04
1.0E-03
1.0E-02
0 5 10 15 20 25 30
Hydraulic C
onductivity (in/hr) Hyd
raul
ic C
ondu
ctiv
ity (c
m/s
)
Fines Content (%)
This study50:50 Sand (Bandini and Sathiskumar 2009)ASTM Graded Sand (Bandini and Sathiskumar 2009)Siswosoebrotho et al. (2005)River Sand (Merriman 1955)Creek Sand (Merriman 1955)Sand and Gravel (Merriman 1955)

- 59 -
4.3 SUMMARY OF THE EXPERIMENTAL RESULTS
For the soils investigated, the measured hydraulic conductivities for 0%, 5%, and 10%,
fines contents were quite close to each other. Hydraulic conductivities were significantly lower
for fines content in excess of 15%. These results compared well with other relevant studies
found in the literature that included varying granular soil types (fine sand to mostly gravel) and
test conditions. A non-plastic fines content of up to about 10% for free-draining structural
backfill is well supported by this study and data reported in published work by others.

- 60 -

- 61 -
5. FIELD MONITORING
5.1 MOTIVATION
Typically, the design of retaining walls and bridge abutments relies on the assumption
that the soil material used to backfill the structure is ‘free-draining’ and will not produce
differential hydrostatic pressure. If the backfill is not expected to be drained, the abutment or
retaining wall must be designed for earth pressure loads plus hydrostatic pressure due to the
presence of water. However, there is insufficient readily accessible information regarding what
constitutes free-draining for purposes of preventing hydrostatic pressure against walls and
abutments. Differential water pressures could be of concern particularly for retaining structures
near water bodies such as bridge abutments over rivers and streams. To assess if any differential
water pressures exist in existing cast-in-place reinforced concrete retaining walls installed by
VTrans, a field monitoring program was implemented, which is described below along with the
measurements and analysis.
5.2 MONITORING SITES AND INSTRUMENTATION
Two sites – Bridgewater and Williamstown, both in Vermont, were selected for installing
field instrumentation by VTrans. The locations of these bridges are depicted in the map shown in

- 62 -

- 63 -
Figure 5.1. The Bridgewater abutment was new construction in 2012 whereas Williamstown site
is an existing bridge (built in 2010).

- 64 -
Figure 5.1: Location map of Bridgewater and Williamstown
Williamstown Site
Bridgewater Site

- 65 -
At each site, three piezometers were installed in the backfill and an additional pressure
transducer was installed to measure stream water level elevation. Figure 5.2 shows a photograph
during the installations of piezometers at Bridgewater and Figure 5.3 shows a plan view of the
instrumentation.
Figure 5.2: Bridgewater piezometer installation

- 66 -
Figure 5.3: Plan view of instrumentation at Bridgewater site
Figure 5.4 shows a photograph during the installations of piezoemeters at Williamstown
and Figure 5.5 shows a plan view of the instrumentation.

- 67 -
Figure 5.4: Williamstown piezometer installations
Figure 5.5: Plan view of the instrumentation at the Williamstown site

- 68 -
5.3 MEASUREMENTS AND ANALYSIS
Monitoring periods were from January 2012 through July 2014. Figure 5.6 and Figure 5.7
show groundwater and river water level data from Bridgewater site. Figure 5.6 summarizes water
levels in terms of elevations. Figure 5.7 shows differential water levels; the water level of the
river is subtracted from the water level in the backfill. A positive number would indicate that the
water level in the backfill was higher than that in the stream. Figure 5.8 shows a close-up of the
data from Figure 5.6 for a shorter time period to assess if there is any time lag between the water
level changes in the stream versus those in the backfill.
Figure 5.9, Figure 5.10 and Figure 5.11 present data in formats similar to Figure 5.6,
Figure 5.7 and Figure 5.8, but for Williamstown site.
Figure 5.6: Measured water levels at Bridgewater site

- 69 -
Figure 5.7: Measured differential water levels at Bridgewater site
Figure 5.8: Measured water levels at Bridgewater site (close-up of a portion from Figure 5.6)

- 70 -
Figure 5.9: Measured water levels at Williamstown site
Figure 5.10: Measured differential water levels at Williamstown site

- 71 -
Figure 5.11: Measured water levels at Williamstown site (close-up of a portion from Figure 5.9)
5.3.1 PRECONSTRUCION WATER LEVELS
Bridgewater
Preconstruction ground water level data from three borings (B-101, B-102, and B-201) drilled
for the project between 2005 and 2008 at the south abutment (abutment no. 1) were limited to
observations during drilling. The water level in boring B-201 taken during drilling (casing
extent was not reported) was approximately at the river bed level shown on the plans. The river
is normally shallow in this stretch correlating with groundwater matching river level. Caving
was reported at boreholes B-101 and B-102 at about 8 and 3 feet higher, respectively, without
specific groundwater level data. Overall there is no direct data on prior water levels aside from

- 72 -
these reports. Soils reported on the logs between ground level and below proposed Bottom of
Footing elevation are granular with between 10 and 22 percent fines, indicating a relatively high
conductivity in the stream bank and foundation soils.
Williamstown
Preconstruction ground water level data near the new observation wells is limited to observations
during drilling at two borings (B-2 and B-4). No ground water table was encountered at boring
B-2. At boring B-4, the ground water table was reported at 14.1 feet deep. Based on this data it
appears that ground water was near or below top of rock in the vicinity of the new monitoring
wells, MW-1 through MW-3. Backfill permeability is unclear based on the limited amount of
sampling obtained and several cored boulders at boring B-4 could be interpreted as indicative
either of low permeability glacial till or more pervious conditions. The foundations are shown to
be placed directly on top of the bedrock.
5.3.2 POST-CONSTRUCTION WATER LEVELS
Bridgewater
Aside from what appear to be anomalous levels measured at observation well B-201 between
January and July 2012, the ground water levels measured in the three observation wells nearly
match the river levels. As illustrated in Figure 5.7, the backfill water levels essentially match the
river levels during river rise. There is at most a six inch lag in the backfill ground water levels
during river fall.

- 73 -
Williamstown
Figure 5.10 illustrates that groundwater levels in the observation wells are between 12 and 18
inches above the river level during relatively consistent river level conditions. During periods of
rapid river level fluctuations the groundwater levels have risen as much as 3 to 4 feet above river
level. The groundwater levels in observation wells B-201 and B-202 approximately match the
amount of the river level rise and lag behind in their rate of rise. The groundwater levels in
observation well B-203 usually match the rate and often exceed the amount of the river level
rise. It is puzzling that B-203 levels are higher and more erratic than at the other observation
wells.
The river and groundwater levels during the July 9, 2013 flooding in Williamstown (Refer to
Figure 5.9 for water level data) provide helpful data in comparing river and groundwater levels.
Groundwater levels rose essentially as quickly as the river level although they lagged lower than
the total river level rise. Following that short burst of flooding the ground water levels gradually
dropped over the course of about 2 months while river levels dropped in a matter of about a
week. Aside from the unusual July 2013 flooding period, the groundwater levels in all three
observation wells have usually been about 12 inches and rarely more than 18 inches above the
adjacent river level during the approximately 2 year monitoring record.

- 74 -
5.4 SUMMARY
Bridgewater
Groundwater levels in Bridgewater essentially match the river levels with a maximum difference
of about 6 inches in the backfill groundwater above the river during falling river levels. This
appears to be the result of the abutment bearing on and being surrounded by relatively free
draining natural soils and adequate drainage characteristics in the abutment backfill and weep
holes within the abutment itself.
Williamstown
Groundwater levels in Williamstown have mostly been within 1 foot above the river level with
the exception of the July 9, 2013 flooding. Observation well B-203 water levels are higher and
more erratic than expected for this well as compared to the other two wells which have more
stable and typical groundwater level fluctuations. Its response seems more likely of a well closer
to the river and placed beside a weep hole.
The groundwater flow regime in the backfill of this project’s unusually long abutment and wing
wall configuration is unclear. The extent to which surface water can infiltrate the wall backfill
is important. The groundwater monitoring data indicates that the water level in the backfill is
usually between 1 and 3 feet above the river. The extent to which this differential reflects typical
retaining wall conditions versus a groundwater and surface water regime unique to this project
configuration is unknown. More data on the construction details described above, perhaps by
means of project photographs, will be helpful. In the end, it will most likely take comparison of
Williamstown’s data with that from other projects to decide if and how to generalize this
project’s findings to other backfill situations.

- 75 -
6. OVERALL CONCLUSIONS AND RECOMMENDATIONS FOR FUTURE WORK
6.1 MAIN CONCLUSIONS
This report presented:
(1) A laboratory study investigating effects of fines on the hydraulic conductivity and shear
strength of a typical granular backfill, and
(2) Results of field monitoring of river level and groundwater level in the backfill at two cast
in place abutment wall sites in Vermont. The following conclusions are drawn:
For the soils investigated, the measured hydraulic conductivities for 0%, 5%, and 10%,
fines contents were quite close to each other. Hydraulic conductivities were significantly lower
for fines content in excess of 15%. These results compared well with other relevant studies
found in the literature that included varying granular soil types (fine sand to mostly gravel) and
test conditions. A non-plastic fines content of up to about 10% for free-draining structural
backfill is well supported by this study and data reported in published work by others. On an
empirical basis, the survey of state transportation agencies indicates that some states are using
fines contents from 5 to 15% (with one state at 20%) without reports of adverse effects.
How much, if any, of a fines content above 10% can be justified is less clear. Beyond
about 10% there is both greater variability and decreasing permeability such that the free
draining designation is perhaps not justifiable for a broadly applied specification for structural
wall backfill. In specific situations which warrant investing in the combination of additional
testing, design effort, and attention to controlling material variability in construction, the
permeability data reported here indicates that the fines content could potentially be increased a

- 76 -
small amount if the specific soils have favorable hydraulic conductivity. However, attention
would need to be paid to the potential for greater frost susceptibility and material variability
which would result in added quality control costs for the contractor and quality assurance
expenses for the owner.
The effect of fines on drained shear strength showed a decrease in the effective internal
friction angle with increased fines. Values of peak and ultimate friction angles varied between 39
and 33 degrees and between about 34.5 and 31.5 degrees, respectively, for fines content between
0 - 25%. If the fines content of up to 10% was allowed, the peak internal friction angle may
decrease from about 39° for zero percent fines to about 34.5° for 10% fines. For the same fines
content range (0 to 10%), the ultimate friction angle may decrease from about 35 to 34 degrees.
To generalize this conclusion however, shear strength tests should be conducted on additional
soils.
It is important to note that the objective of considering a backfill soil specification with
higher fines content than presently used was for cost savings. The abutment and retaining walls
under consideration are considered to be primarily in river crossing settings and wall
performance with the current backfill and bottom of wall weep hole configuration in Vermont
has been satisfactory.
The Vermont Agency of Transportation (VTrans) evaluated borrow source availability in
1993 (Conrad and Dudley, 1993) finding that available sources were being depleted and that
94.5% of Vermont’s remaining deposits are not available for extraction due to inaccessibility,
conflicting land use, environmental sensitivity and poor quality. Personal communications with
contractors in Vermont indicate that up to 20 percent savings in the unit cost price of the

- 77 -
retaining wall backfill item could be achieved by allowing a fines content by weight increase
from the current Vermont standard specified maximum of 6% to 10%. If the allowable fines
content is increased from 6% to 10%, it is recommended that it is adopted on a trial basis at three
or so sites and these walls be monitored for differential water levels.
The effects of initially unsaturated conditions or aging and other characteristics of
compacted soils on their permeability and strength and how these characteristics change with
fines content were not specifically evaluated in the testing for this and the referenced studies,
which could be a topic for future investigations.
The field monitoring at Bridgewater site showed that groundwater levels in the backfill
essentially matched the river levels with a maximum difference of about 6 inches in the backfill
groundwater above the river during falling river levels. This appears to be the result of the
abutment bearing on and being surrounded by relatively free draining natural soils and adequate
drainage characteristics in the abutment backfill and weep holes within the abutment itself.
Groundwater levels in Williamstown were within 1 foot above the river level with the
exception of the July 9, 2013 flooding. Observation well B-203 water levels were higher and
more erratic than expected for this well as compared to the other two wells which have more
stable and typical groundwater level fluctuations. Its response seems more likely of a well closer
to the river and placed beside a weep hole. The groundwater flow regime in the backfill of this
project’s unusually long abutment and wing wall configuration is unclear. The extent to which
surface water can infiltrate the wall backfill is important. The groundwater monitoring data
indicates that the water level in the backfill was usually between 1 and 3 feet above the river.
The extent to which this differential reflects typical retaining wall conditions versus a

- 78 -
groundwater and surface water regime unique to this project configuration is unknown. More
data on the construction details described above, perhaps by means of project photographs, will
be helpful. In the end, it will most likely take comparison of Williamstown’s data with that from
other projects to decide if and how to generalize this project’s findings to other backfill
situations.
6.2 RECOMMENDATIONS FOR FUTURE RESEARCH
Additional research into the following areas is recommended. For the experimental work,
we recommend the following.
(1) Additional granular backfill soils should be tested to study the effects of gradation
properties in addition to the effects of fines content on compaction, hydraulic
conductivity and shear strength.
(2) In this investigation, grain size distributions of only the base soil were determined before
and after compaction to examine if additional fine grained partciles generate because of
compaction. In general, less than 1% fines were generated. In future, if additional backfill
soils are investigated, the effects of compaction on soil gradation could be further
investigated.
(3) Constant and falling head hydraulic conductivity tests performed in a rigid compaction
permeameter could be performed for comparison to the flexible wall permeameter. If the
results compare well, the tests could be conducted much faster.
(4) The effects of strain rate on shear strength could be investigated. In this research it was
assumed that the effect of strain rate on a free-draining soil is negligible.

- 79 -
For field monitoring, we recommend supplementing the Bridgewater and Williamstown
monitoring with additional project monitoring in order to more reliably conclude how well the
currently specified wall backfill and weep-hole details limit the groundwater differential at
abutments. Bridgewater appears to represent the case of an abutment in relatively free draining
granular soils behind and below the wall, and with relatively limited seepage into the backfill
from natural ground behind it. Williamstown represents the case of a retaining wall bearing on
bedrock with a currently undetermined amount of seepage from behind, and from surface
infiltration.
Specifically, we recommend monitoring on projects where preconstruction groundwater
data is available for comparison with post construction monitoring data. We recommend the
following monitoring cases:
(1) Abutment bearing on low permeability soil (e.g., glacial till or clay) with natural granular
soil above, with groundwater levels well documented in natural soils behind the new
backfill/abutment.
(2) Abutment bearing on bedrock with groundwater levels well documented in natural soils
behind the new backfill/abutment (Williamstown case but with shorter, more typical,
wing walls.

- 80 -
ACKNOWLEDGEMENTS
This work was funded by the Vermont Agency of Transportation (VTrans) with
assistance from the Federal Highway Administration, which is gratefully acknowledged. Any
opinions, findings, and conclusions or recommendations expressed in this material are those of
the authors and do not necessarily reflect the views of VTrans. The authors also thank Dr. Paola
Bandini for providing data from their work along with Mr. Roger Gilman of Miller Construction
for generously providing the borrow materials tested in this study. Appreciation also goes to the
University of Vermont’s Transportation Research Center; Mr. Timothy Fillbach of VTrans for
providing input on structural design considerations; and Mr. Brendan Stringer, Mr. David Grover
and Dr. Donna Rizzo of the University of Vermont, and Mr. James Touchette of VTrans, for
their assistance with laboratory testing.

- 81 -
BIBLIOGRAPHY
AASHTO (2010). LRFD Bridge Design Specifications. American Association of State Highway and Transportation Officials. Washington, D.C.
AASHTO (2008). Standard Specification for Classification of Soils and Soil-Aggregate Mixtures for Highway Construction Purposes. American Association of State Highway and Transportation Officials. Washington, D.C.
ASTM D422 (2008). “Standard Test Method or Particle-Size Analysis of Soils.” Annual Book of ASTM Standards 4.08. West Conshohocken, PA: ASTM International.
ASTM D698 (2008). “Standard Test Methods for Laboratory Compaction Characteristics of Soil Using Standard Effort.” Annual Book of ASTM Standards 4.08. West Conshohocken, PA: ASTM International.
ASTM D1557 (2008). “Standard Test Methods for Laboratory Compaction Characteristics of Soil Using Modified Effort.” Annual Book of ASTM Standards 4.08. West Conshohocken, PA: ASTM International.
ASTM D2487 (2011). “Standard Practice for Classification of Soils for Engineering Purposes (Unified Soil Classification System).” Annual Book of ASTM Standards 4.08. West Conshohocken, PA: ASTM International.
ASTM D4318. (2010). “Test Methods for Liquid Limit, Plastic Limit, and Plasticity Index of Soils.” Annual Book of ASTM Standards 4.08. West Conshohocken, PA: ASTM International.
ASTM D5084 (2010). “Standard Test Methods for Measurement of Hydraulic Conductivity of Saturated Porous Materials Using a Flexible Wall Permeameter.” Annual Book of ASTM Standards 4.08. West Conshohocken, PA: ASTM International.
ASTM D6913 (2008). “Standard Test Methods for Particle-Size Distribution (Gradation) of Soils Using Sieve Analysis.” Annual Book of ASTM Standards 4.09. West Conshohocken, PA: ASTM International.
ASTM D7181 (2011). “Standard Test Method for Consolidated Drained Triaxial Compression Test for Soils.” Annual Book of ASTM Standards 4.09. West Conshohocken, PA: ASTM International.
Bandini, P., and Sathiskumar, S. (2009). “Effects of Silt Content and Void Ratio on the Saturated Hydraulic Conductivity and Compressibility of Sand-Silt Mixtures.” Journal of Geotechnical and Geoenvironmental Engineering, 135(12), 1976–1980.
Bowles, J. E. (1982). Foundation analysis and design. McGraw-Hill.

- 82 -
Carraro, J. A. H., M. Prezzi, et al. (2009). "Shear Strength and Stiffness of Sands Containing Plastic or Nonplastic Fines." Journal of Geotechnical and Geoenvironmental Engineering 135(9), 1167-78.
FHWA. (2003). Standard Specifications for Construction of Roads and Bridges on Federal Highway Projects. U.S. Department of Transportation, Federal Highway Administration, Washington, D.C.
Lambe, T. W. and R. V. Whitman (1969). Soil Mechanics, Wiley, New York.
Merriman, J., “Research Tests to Investigate Criteria for Selection Between Vibratory or Impact Compaction Methods,” Laboratory Report No. EM-441, U. S. Bureau of Reclamation, 1955.
Naval Facilities Engineering Command (1986). Foundations & Earth Structures. N. F. E. Command. Alexandria, Virginia. Design Manual 7.01.
Naval Facilities Engineering Command (1986). Foundations & Earth Structures. N. F. E. Command. Alexandria, Virginia. Design Manual 7.02.
Salgado, R., Bandini, P., et al. (2000). “Shear strength and stiffness of silty sand.” J.Geotech. Geoenviron. Eng., 126 (5), 451–462.
Siswosoebrotho, B.I., Widodo, P., et al. (2005). The Influence of Fines Content and Plasticity on The Strength and Permeability of Aggregate for Base Course Material”, J. of Proceedings of The Eastern Asia Society for Transportation Studies, Vol.5, pp. 845–856.
Terzaghi, K., and Peck, R. B. (1967). Soil Mechanics in Engineering Practice. Warren Press.
Thevanayagam, S. (1998). "Effects of Fines and Confining Stress on Undrained Shear Strength of Silty Sands." Journal of Geotechnical and Geoenvironmental Engineering 124(6),479-491.
United Facilities Criteria (2005).Geotechnical Engineering Procedures for Foundation Design of Buildings and Structures. Dept. of Defense.
United States. Department of Defense. Backfill for subsurface structures, unified facilities criteria (UFC, 3-220-04FA). USA; 2004.
US Army Corps of Engineers (1989).Engineering and Design: Retaining and Flood Walls. Washington, D.C.
Vermont Agency of Transportation (2011). Standard Specifications for Construction Book.

- 83 -
APPENDIX A – STATE SURVEY
The Vermont Agency of Transportation is evaluating the current AASHTO-recommended design criteria (granular backfill with less than 5% fines) and specifications for backfill in association with abutments and retaining walls. These design assumptions presume a free-draining structure that results in no differential groundwater levels on opposite sides of the retaining wall. Consequently, unbalanced loading due to hydrostatic pressure is ignored. However, some engineers are concerned that unbalance loading may be occurring. Furthermore, in some areas the availability of high-quality structural backfill has been declining. The purpose of this research initiative is to examine these relationships along with other possible cost effective backfill alternatives and establish design guidelines for our organization.
As part of this research projects, we are surveying other state DOTs to determine what types of backfill materials and drainage details are currently being used on cast-in-place concrete cantilevered retaining wall and bridge abutments.
The survey is expected to 2 to 5 minutes to complete. Please make sure to include your contact information. Surveys results will be shared with everyone that completes the survey. We thank you for your time.
Page 1 - Question 1 - Choice - Multiple Answers (Bullets)
How do you account for hydrostatic pressure in your design assumptions? Ignore it. Design for it. Install a drainage system in order to not design for it. None of the above.
Page 1 - Question 2 - Yes or No
Do you utilize backfill material with greater than 5% fines? Yes No
Page 1 - Question 3 - Yes or No
Has your organization done formal studies to investigate if greater fines contents could be used or if alternative materials could be used/added? Yes No
Page 1 - Question 4 - Choice - Multiple Answers (Bullets)
Please check all applicable backfill materials your DOT uses or would consider using in the future: Shredded tires Geofoam Blocks Recycled concrete

- 84 -
Recycled pavement Granular backfill In-situ soils Other
Page 1 - Question 5 - Yes or No
Do you have standard details for abutment and wingwall backfill? Yes No
Page 1 - Question 6 - Yes or No
Do you have standard specifications for abutment and wingwall backfill methods and materials? Yes No
Page 1 - Question 7 - Yes or No
Have you changed your details in the past to provide a more cost-effective backfill detail, or do you currently vary your details on a project by project basis based on cost? Yes No
Page 1 - Question 8 - Yes or No
Do you vary your design and details for backfill based on other non-geotechnical parameters, such as the average daily traffic (ADT)? Yes No
Page 1 - Question 9 - Open Ended - Comments Box
Please provide contact information for follow-up clarification and distribution of survey results:

- 85 -
APPENDIX B – TEST RESULTS

- 86 -

- 87 -

- 88 -

- 89 -

- 90 -

- 91 -

- 92 -

- 93 -

- 94 -

- 95 -

- 96 -

- 97 -

- 98 -

- 99 -

- 100 -

- 101 -

- 102 -

- 103 -

- 104 -

- 105 -
(I) TYPICAL HYDRAULIC CONDUCTIVITY TEST DATA

- 106 -

- 107 -
Related Documents