Investor Presentation VRTV Veritiv Corporation

Welcome message from author
This document is posted to help you gain knowledge. Please leave a comment to let me know what you think about it! Share it to your friends and learn new things together.
Transcript
Investor Presentation VRTV
Veritiv Corporation
| 2
This document contains forward-looking statements that involve risks, uncertainties and changes in circumstances. Forward-looking statements generally can be identified by the use of forward-looking terminology such as “may,” “will,” “expect,” “intend,” “estimate,” “anticipate,” “believe,”
“project,” “continue” or other similar words. The forward-looking statements are not historical facts, but rather are based on Veritiv Corporation’s (the Company’s) current expectations, estimates,
assumptions and projections about our industry, business and future financial results. The Company’s actual results could differ materially from the results contemplated by these forward-looking statements due to a number of factors, including those discussed in the sections entitled
“Risk Factors” and “Note Regarding Forward-Looking Statements and Information” in the prospectus forming part of the Company’s Registration Statement on Form S-1 originally filed with the Securities and Exchange Commission on February 14, 2014, as the same has been amended
to date. For the foregoing reasons, you are cautioned against relying on any forward-looking statements contained in this presentation. The Company does not undertake any obligation to update or revise these forward-looking statements, except as required by law. This presentation
also contains certain non-GAAP financial measures including adjusted EBITDA. Adjusted EBITDA is not considered a measure of financial performance under generally accepted accounting
principles and the items excluded in the calculation are significant components in understanding and assessing our financial performance. Non-GAAP measures should not be considered in
isolation or as an alternative to GAAP measures and such measures may not be comparable to other similarly titled measures of other companies. The reconciliation of these non-GAAP items can
be found in the appendix to this presentation.
Forward-Looking Statement

| 3
Agenda
Topic
Transaction Overview
Veritiv: Background and Investment Highlights
Financials and Leadership
| 4
Executive Summary
Ø Two industry leaders
Ø Complimentary businesses
Ø Significant synergies
Ø Invest in high-margin growth
| 5
Structure and consideration
Ownership
Closing
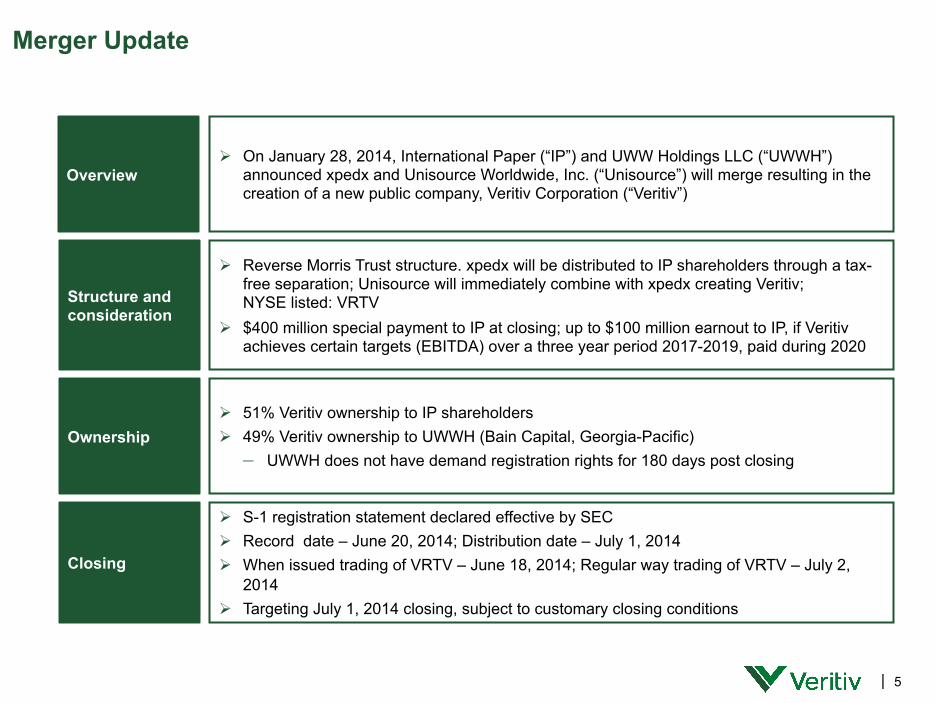
Ø Reverse Morris Trust structure. xpedx will be distributed to IP shareholders through a tax-free separation; Unisource will immediately combine with xpedx creating Veritiv; NYSE listed: VRTV
Ø $400 million special payment to IP at closing; up to $100 million earnout to IP, if Veritiv achieves certain targets (EBITDA) over a three year period 2017-2019, paid during 2020
Ø 51% Veritiv ownership to IP shareholders Ø 49% Veritiv ownership to UWWH (Bain Capital, Georgia-Pacific)
– UWWH does not have demand registration rights for 180 days post closing
Ø S-1 registration statement declared effective by SEC Ø Record date – June 20, 2014; Distribution date – July 1, 2014 Ø When issued trading of VRTV – June 18, 2014; Regular way trading of VRTV – July 2,
2014 Ø Targeting July 1, 2014 closing, subject to customary closing conditions
Overview Ø On January 28, 2014, International Paper (“IP”) and UWW Holdings LLC (“UWWH”)
announced xpedx and Unisource Worldwide, Inc. (“Unisource”) will merge resulting in the creation of a new public company, Veritiv Corporation (“Veritiv”)
Merger Update
| 6
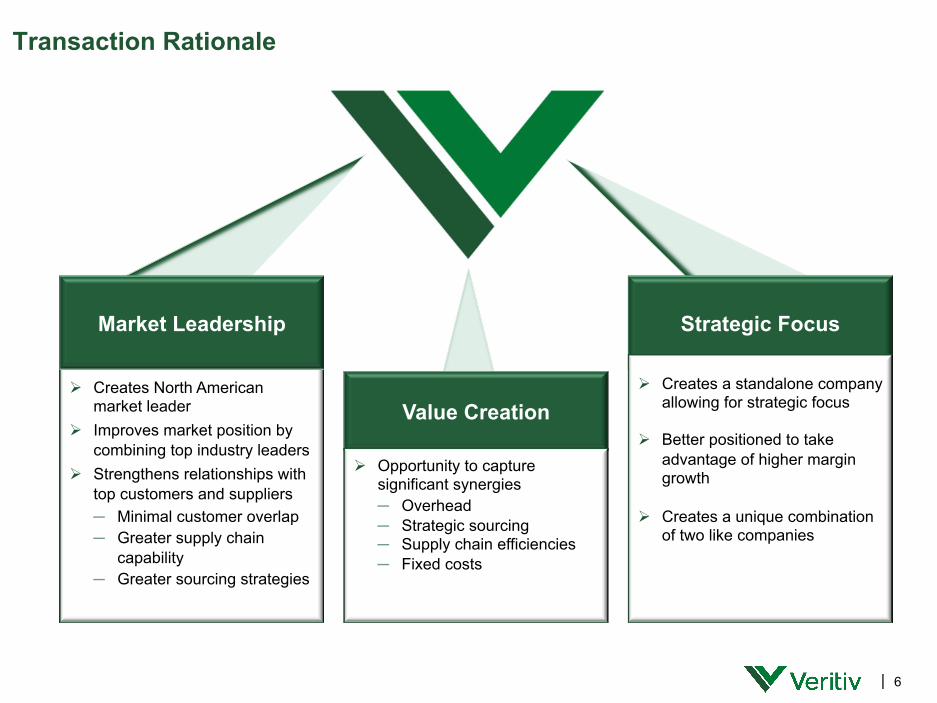
Transaction Rationale
Market Leadership
Ø Creates North American market leader
Ø Improves market position by combining top industry leaders
Ø Strengthens relationships with top customers and suppliers ─ Minimal customer overlap ─ Greater supply chain
capability ─ Greater sourcing strategies
Value Creation
Ø Opportunity to capture significant synergies ─ Overhead ─ Strategic sourcing ─ Supply chain efficiencies ─ Fixed costs
Strategic Focus
Ø Creates a standalone company allowing for strategic focus
Ø Better positioned to take advantage of higher margin growth
Ø Creates a unique combination of two like companies

| 7
Agenda
Topic
Transaction Overview
Veritiv: Background and Investment Highlights
Financials and Leadership

| 8
xpedx Business Overview
($ Millions) YE 12/31/13
Net Sales $5,652
Adj. EBITDA $75
EBITDA Margin 1.3%
Employees 5,200
DCs 73
Mini-DCs 13
2013 Revenue by Primary Segment
North American Footprint Primary Segment Descriptions Provides end-to-end print solutions, including the sale & distribution of print substrates, graphics supplies and wide format, corporate end-user paper solutions
Provides packaging expertise through design, sourcing, sale and distribution of custom & standard packaging supplies and equipment
Facility Solutions provider through the sale and distribution of products necessary to maintain large facilities
xpedx DCs
Leading business-to-business distributor of print, packaging and facility solutions in the United States and Mexico.
Print 57%
Packaging 28%
Facility Solutions
15%
Packaging
Facility Solutions

| 9
Unisource Business Overview
Leading business-to-business distributor of print, packaging and facility solutions in the United States and Canada.
($ Millions) YE 12/31/13
Net Sales $4,089
Adj. EBITDA $87
EBITDA Margin 2.1%
Employees 4,200
DCs 93
Provides end-to-end print solutions: print management, the sale & distribution of print substrates, graphics supplies and wide format
Provides custom, end-to-end packaging solutions, from material innovation to design, sourcing and selling of packing materials and equipment
Facility solutions provider through the sale and distribution of products necessary to maintain large facilities
Inbound and outbound logistics solutions, comprehensive supply chain analytics and value-added offerings
Unisource DCs
2013 Revenue by Primary Segment
Print 54% Packaging
28%
Facility Solutions
16%
Logistics Solutions 2%
Packaging
Facility Solutions
Logistics Solutions
North American Footprint Primary Segment Descriptions
| 10
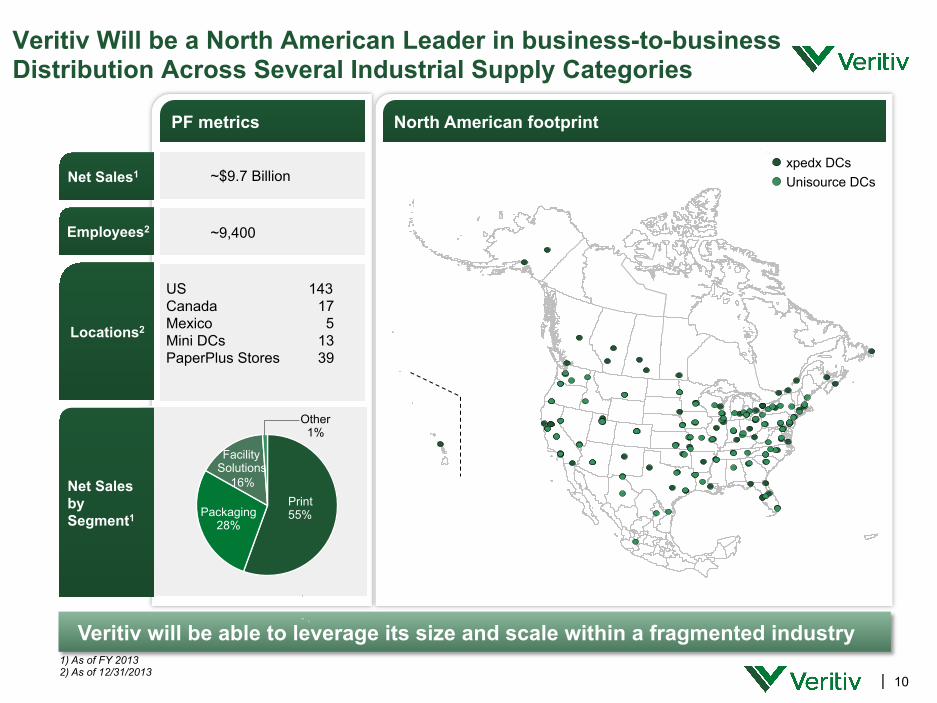
Net Sales1 ~$9.7 Billion
Net Sales by Segment1
1) As of FY 2013 2) As of 12/31/2013
PF metrics North American footprint
Locations2
US Canada Mexico Mini DCs PaperPlus Stores
143 17 5
13 39
Employees2 ~9,400
Veritiv will be able to leverage its size and scale within a fragmented industry
xpedx DCs Unisource DCs
Veritiv Will be a North American Leader in business-to-business Distribution Across Several Industrial Supply Categories
Print 55% Packaging
28%
Facility Solutions
16%
Other 1%

| 11
Veritiv’s Business Model
Ø Full product line to reduce inbound complexity
Ø National network to service large customers
Ø Service and solutions to customers where they lack expertise or capabilities
Ø Veritiv conducts business with more than half of the Fortune 500
Partner with world class suppliers…
…then add value through multiple capabilities…
…to a wide range of customer segments
Ø Customer Reach
Ø Effective Supply Chain
Select
Solve
Source Service
Sell
Veritiv
| 12
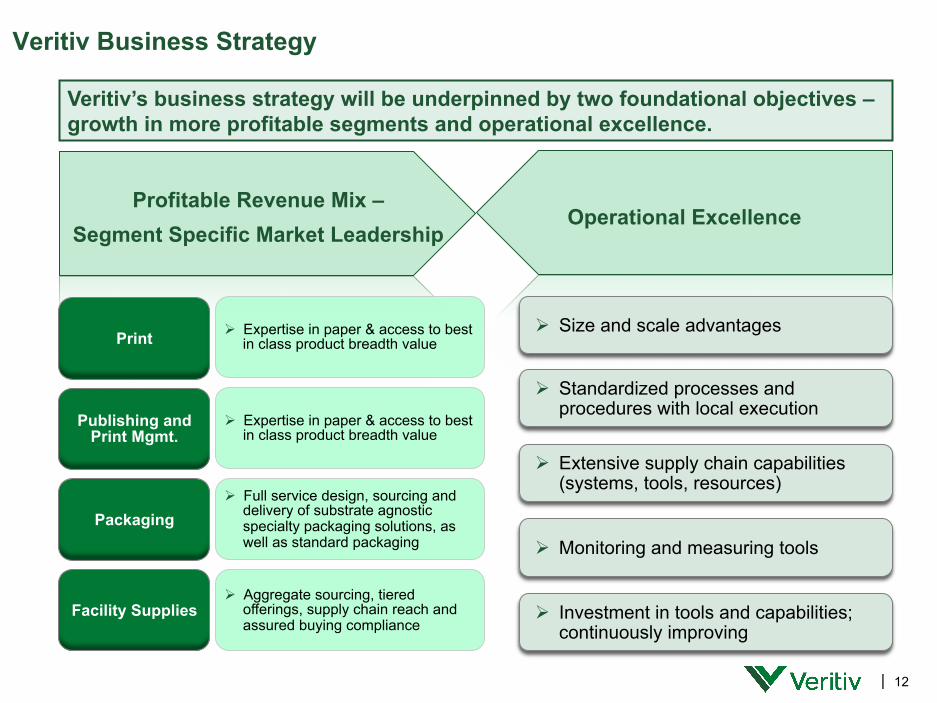
Veritiv Business Strategy
Veritiv’s business strategy will be underpinned by two foundational objectives – growth in more profitable segments and operational excellence.
Profitable Revenue Mix – Segment Specific Market Leadership
Operational Excellence
Ø Standardized processes and procedures with local execution
Ø Extensive supply chain capabilities (systems, tools, resources)
Ø Monitoring and measuring tools
Ø Size and scale advantages
Ø Investment in tools and capabilities; continuously improving
Ø Expertise in paper & access to best in class product breadth value Print
Ø Expertise in paper & access to best in class product breadth value
Publishing and Print Mgmt.
Ø Full service design, sourcing and delivery of substrate agnostic specialty packaging solutions, as well as standard packaging
Packaging
Ø Aggregate sourcing, tiered offerings, supply chain reach and assured buying compliance
Facility Supplies

| 13
Veritiv’s Print Segment
Providing more than just products – creating solutions.
1) Combined xpedx and Unisource 2013 sales 2) Based on industry data and company estimates (2013 – 2018)
High-Quality Commercial Paper
n Printing, writing, copy, digital, and specialty
n National and private brands
Graphics
n Graphics supplies
n Equipment sales and service
Wide Format Solutions
n Wide format solutions ̶ Equipment ̶ Substrates
Small Order Service
n Support growth of digital print small runs
n Small order delivery
E-Commerce & E-Procurement
n Automated e-procurement platforms, allowing customers to define specification, review estimates, and place orders
Forecasted Market Growth Rate: (3%)2
Sustainable Solutions
n Sustainable green printing
n Chain of Custody certifications
Veritiv Net Sales¹ $4.0 billion

| 14
Veritiv’s Publishing & Print Management Segment
Veritiv Net Sales¹ $1.5 billion
Paper Sourcing & Delivery n Extensive sourcing options
n Expert service and delivery
Print Consulting n End user consulting for the most
effective, cost competitive solutions
Global Market Solutions n Paper procurement needs of
multinational customers with offshore affiliates or locations
Workflow Management n Customer workflow managed to
optimize print jobs
Print Management n End user end-to-end solutions in
printing, substrate sourcing, and delivery
Forecasted Market Growth Rate: (4%)2
Providing solutions to the world’s largest publishers and consumer retail companies.
1) Combined xpedx and Unisource 2013 sales 2) Based on industry data and company estimates (2013 – 2018)
| 15
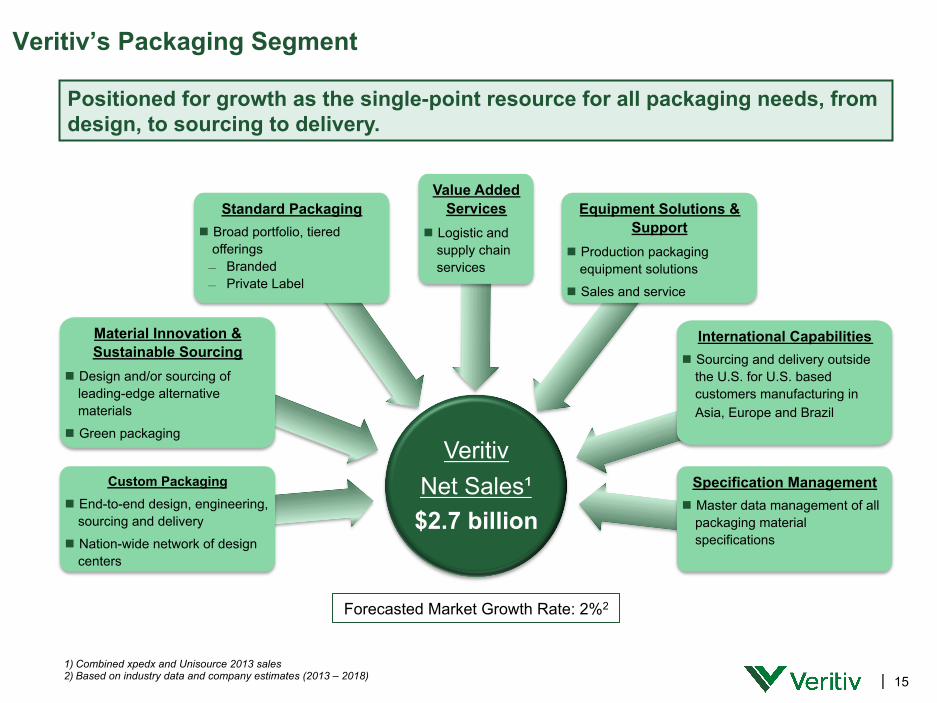
Veritiv’s Packaging Segment
Positioned for growth as the single-point resource for all packaging needs, from design, to sourcing to delivery.
Custom Packaging n End-to-end design, engineering,
sourcing and delivery
n Nation-wide network of design centers
Material Innovation & Sustainable Sourcing
n Design and/or sourcing of leading-edge alternative materials
n Green packaging
Standard Packaging n Broad portfolio, tiered
offerings ̶ Branded ̶ Private Label
Value Added Services
n Logistic and supply chain services
Equipment Solutions & Support
n Production packaging equipment solutions
n Sales and service
International Capabilities n Sourcing and delivery outside
the U.S. for U.S. based customers manufacturing in Asia, Europe and Brazil
Specification Management n Master data management of all
packaging material specifications
Forecasted Market Growth Rate: 2%2
1) Combined xpedx and Unisource 2013 sales 2) Based on industry data and company estimates (2013 – 2018)
Veritiv Net Sales¹ $2.7 billion

| 16
Veritiv’s Facility Solutions Segment
Standard Products n Broad portfolio of branded and
private label products n Supply chain efficiency
Green Product Offerings n Branded and private label
products n Chain of custody certifications
Healthy Building Consulting n Quality control audits and
action plans n Certified specialists
Reporting & Analytics n Inventory management
analytics n Green reporting n Spend reporting to support
customer budgets
Customer Inventory Optimization
n System to optimize customer inventory
n Automatic replenishment
Forecasted Market Growth Rate: 2%2
1) Combined xpedx and Unisource 2013 sales 2) Based on industry data and company estimates (2013 – 2018)
Providing products, services and solutions nationally across multiple channels.
Veritiv Net Sales¹ $1.5 billion
Re-distribution n Small distributors n One-stop shopping n Leverage supply chain
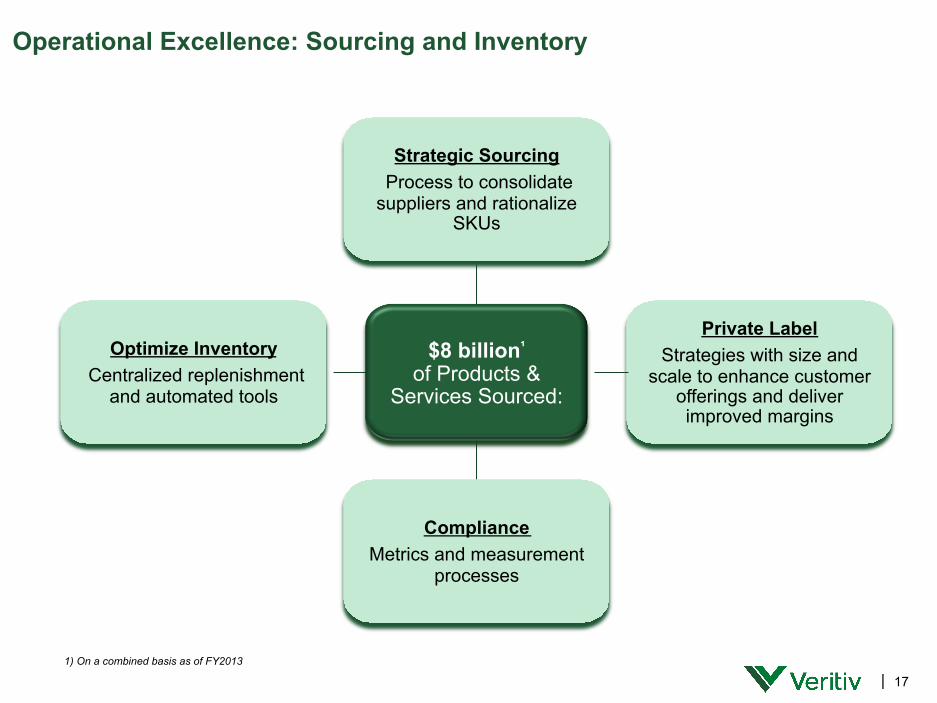
| 17
$8 billion¹ of Products &
Services Sourced:
Private Label Strategies with size and
scale to enhance customer offerings and deliver improved margins
Optimize Inventory Centralized replenishment
and automated tools
1) On a combined basis as of FY2013
Strategic Sourcing Process to consolidate suppliers and rationalize
SKUs
Compliance Metrics and measurement
processes
Operational Excellence: Sourcing and Inventory
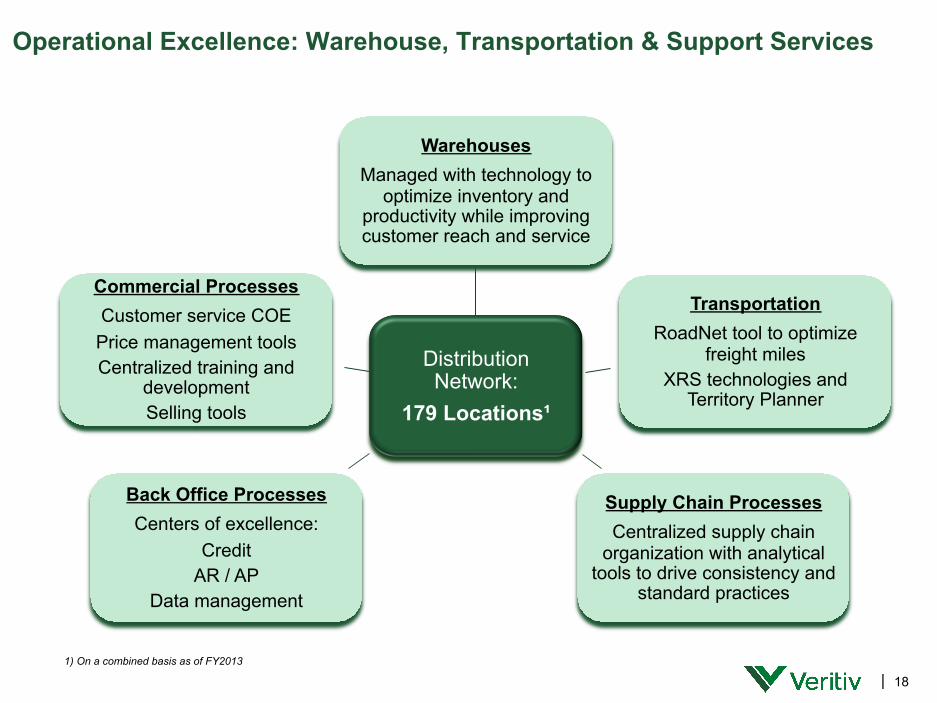
| 18
Distribution Network:
179 Locations¹
Warehouses Managed with technology to
optimize inventory and productivity while improving customer reach and service
Transportation RoadNet tool to optimize
freight miles XRS technologies and
Territory Planner
Supply Chain Processes Centralized supply chain
organization with analytical tools to drive consistency and
standard practices
Back Office Processes Centers of excellence:
Credit AR / AP
Data management
Commercial Processes Customer service COE
Price management tools Centralized training and
development Selling tools
Operational Excellence: Warehouse, Transportation & Support Services
1) On a combined basis as of FY2013

| 19
Consolidating Operational Excellence Programs to capture and sustain synergies
Centralized Supply Chain will assist Field and SBUs to increase profit without sacrificing profitable growth
Deliver operational excellence: Enhance cross-functional processes while allowing for appropriate local flexibility
Capture synergy
Deliver operational excellence
Capture synergies: Rigorous programs to systematically attack the opportunity across business units
a) Profitable service – Provide field with information on opportunities to adjust handling/delivery, customer service, and inventory costs
b) Logistics excellence – Optimize routing, transfers, freight rates, warehouse productivity and space
c) Sourcing – Partner with SBUs to drive down unit costs and rationalize SKUs
1
2
Ope
ratio
nal E
xcel
lenc
e Pr
ogra
m

| 20
Agenda
Topic
Transaction Overview
Veritiv: Background and Investment Highlights
Financials and Leadership

| 21
Revenues
Synergies
2014 Adjusted EBITDA expected to be $135 million - $145 million
Ø Investing in growth segments Ø Organized around
– Large nation/regional accounts – scale matters – Local accounts – manage cost to serve
Ø Strategic account management - optimize customer mix and SKUs Ø Initial downward pressure
Ø Better positioned to take advantage of higher margin growth segments Ø Management intends to improve Adjusted EBITDA by an incremental $100
million over next few years Ø Transaction and transition expenses meaningful….but, one-time in nature
– Strategic sourcing – Supply chain efficiencies
– Fixed costs (e.g. warehouse) – Overhead (e.g. back office)
Ø Opportunity to capture significant synergies Ø Significant driver to business model in next several years
Financial Summary

| 22
Synergies and one-time integration costs
Veritiv expects significant net synergies of $150M - $225M
Ø Key areas that synergies will be derived from include: – Supply chain efficiencies – Selling, General and Administrative
0%
20%
40%
60%
80%
100%
YE 2014 YE 2015 YE 2016 YE 2017
0%
15% - 25%
50% - 60%
80% - 90% Net synergies expected to be realized
Costs to achieve1
($225M): 30-35% 60-70% 80- 90% 90-100%
1) Includes ~ $55 million of one-time integration capital expenditures

| 23
Liquidity and Capital Discussion
Cap Structure Capital Allocation
– Fund costs of synergies and reinvest in the business ̶ Maintain fleet and facilities to
preserve premium customer service levels compared to lesser capitalized, smaller, competitors
Pay down debt ̶ Improve balance sheet
Position company to return value to shareholders over time
▪ New $1.4bn ABL facility in place, matures 2019 ̶ Initial draw down of ~ $750 million at
closing ̶ Available liquidity at closing of
~ $450 million
▪ Initial ABL drawings used to repay Unisource debt and to fund IP cash dividend of $400 million
▪ Over the next few years, Veritiv
expects revolver availability plus cash flow from operations will be sufficient to fund costs of achieving synergies and other working capital needs

| 24
Veritiv’s Leadership & Governance
q Lead Director William E. Mitchell, retired chairman and chief executive officer, Arrow Electronics, Inc. and founder of Sequel Capital Management, LLC
q Allan Dragone, current Unisource CEO, will serve as a director of the new company and will advise on integration activities.
q Daniel T. Henry, retired executive vice president and chief financial officer, American Express
q Tracy Leinbach, retired executive vice president and CFO, Ryder System, Inc.
q Seth Meisel, managing director, Bain Capital
q Michael Muldowney, former CFO and interim CEO of Houghton Mifflin Harcourt Publishing Co., and founder and CEO of Foxford Capital, LLC
q Charles G. Ward, partner, Perella Weinberg Partners, and former president, Lazard Ltd.
q John Zillmer, retired chairman, president and chief executive officer, Univar, Inc.
Mary Laschinger Chairman and Chief Executive Officer Current President, xpedx and SVP, International Paper
Management Team Board of Directors SVP, Packaging Darin Tang
SVP, Print Dan Watkoske
SVP, Supply Chain Tim Kutz
SVP, Field Sales & Operations Tom Lazzaro
SVP, General Counsel Mark Hianik
SVP, CFO Steve Smith
SVP, Corporate Affairs Neil Russell
SVP, Integration & Change Mgmt Bruce Henry
SVP, Chief Human Resources Officer Beth Patrick
SVP, Publishing & Print Management Barry Nelson
SVP, Facility Solutions/Strategy & Commercial Excellence Joe Myers
Significant leadership incentives will be linked to earnings performance
| 25
Why Invest in Veritiv (VRTV)…
Ø Industry leader with significant size and scale Ø Business model creates value for both customers and
suppliers Ø Growth segments in packaging, facility solutions and logistics
with differentiating value propositions Ø Positioned to win in the print segment Ø Strong and stable platform to invest for future growth Ø Experienced team
| 26
Non-GAAP Reconciliations
| 27
Adjusted EBITDA is defined as earnings before interest, income taxes, depreciation and amortization, cash and non-cash restructuring (gains) expenses, merger expenses, gain from sale of equity investments, asset impairments, non-restructuring stock-based compensation expense, LIFO (income) expense, non-restructuring severance charges, non-restructuring pension settlement charges, (loss) income from discontinued operations, net of income taxes, and certain other costs. Adjusted EBITDA Margin is calculated based on Adjusted EBITDA divided by net sales. Veritiv supplements its financial information prepared in accordance with GAAP with Adjusted EBITDA because we believe investors commonly use Adjusted EBITDA as a main component of valuing companies such as Veritiv. In addition, the credit agreement governing Veritiv’s ABL Facility will permit Veritiv to exclude these and other charges and expenses in calculating “Consolidated EBITDA” pursuant to such credit agreement. A reconciliation of Adjusted EBITDA to net income determined in accordance with GAAP is provided for the periods presented.
Non-GAAP Adjusted EBITDA Reconciliation Disclaimer

| 28
Veritiv Historical Non-GAAP Adjusted EBITDA Reconciliation
Veritiv Historical Non-GAAP Adjusted EBITDA Reconciliation ($mm) FY '11A FY '12A FY '13A LTM 1Q '14A 1Q '13A 1Q '14A
Net income (loss) $(5) $10 $243 $251 $(6) $2 Interest expense, net 67 28 27 27 7 6
Income tax provision (benefit) ¹ 16 24 (228) (225) (0) 3
Depreciation and amortization 40 39 42 42 11 11
EBITDA $117 $102 $84 $96 $11 $23 Restructuring expenses (gains) 58 42 35 27 8 -
Merger expenses - - 14 22 0 8
Gain from sale of equity investment² - - - (7) - (7)
Asset impairments³ 1 5 0 0 0 -
Non-restructuring stock-based compensation 11 14 14 11 4 1
LIFO (income) expense 1 1 7 5 (3) (4)
Non-restructuring severance charges 1 1 3 4 0 2
Non-restructuring pension settlement charges - 1 1 1 - - (Loss) income from discontinued operations, net of income taxes
(14) (10) 0 (0) 0 (0)
Employee strike related costs - 2 - - - -
Bain athisory fees 4 4 4 4 1 1
Adjusted EBITDA $208 $181 $162 $163 $22 $24
1) FY '12 includes a $17 million charge related to a deferred tax asset valuation allowance for Unisource Canada FY '13 and LTM 1Q '14 includes a $230 million of tax benefit related to the reversal of the Unisource U.S. tax valuation allowance
2) LTM 1Q '14 includes gains of $5 million and $2 million from the sale of two of Unisource's joint ventures 3) FY '11 includes write-off of trade names by Unisource Canada of $1 million FY '12 primarily includes a $3 million impairment of cold storage equipment by Unisource Canada, a $1 million of impairment of packaging equipment Unisource Sweden and a $1 million impairment of goodwill by Unisource Canada

| 29
xpedx Historical Non-GAAP Adjusted EBITDA Reconciliation
xpedx Historical Non-GAAP Adjusted EBITDA Reconciliation ($mm) FY '11A FY '12A FY '13A LTM 1Q '14A 1Q '13A 1Q '14A
Net income (loss) $22 $4 $0 $6 $(1) $6
Interest expense, net - - - - - -
Income tax provision (benefit) 21 9 0 5 (1) 4
Depreciation and amortization 16 14 17 17 4 5
EBITDA $59 $28 $18 $28 $3 $14
Restructuring expenses (gains) 44 35 38 31 7 (0)
Non-restructuring stock-based compensation 10 13 14 10 4 1
LIFO (income) expense (1) 1 3 2 (2) (4)
Non-restructuring severance charges 0 1 2 4 0 2
(Loss) income from discontinued operations, net of income taxes
(14) (10) 0 (0) 0 (0)
Employee strike related costs - 2 - - - -
Adjusted EBITDA $126 $90 $75 $75 $13 $13

| 30
Unisource Historical Non-GAAP Adjusted EBITDA Reconciliation
Unisource Historical Non-GAAP Adjusted EBITDA Reconciliation ($mm) FY '11A FY '12A FY '13A LTM 1Q '14A 1Q '13A 1Q '14A
Net income (loss) $(27) $5 $242 $245 $(6) $(3)
Interest expense, net 67 28 27 27 7 6
Income tax provision (benefit)¹ (6) 15 (229) (229) 0 (0)
Depreciation and amortization 25 25 25 25 6 6
EBITDA $59 $74 $66 $67 $8 $9
Restructuring expenses (gains) 15 7 (3) (4) 1 0
Merger expenses - - 14 22 0 8
Gain from sale of equity investment² - - - (7) - (7)
Asset impairments³ 1 5 0 0 0 -
Non-restructuring stock-based compensation 1 1 0 0 0 -
LIFO (income) expense 2 (0) 3 4 (1) (0)
Non-restructuring severance charges 1 1 1 1 - 0
Non-restructuring pension settlement charges - 1 1 1 - -
Bain advisory fees 4 4 4 4 1 1
Adjusted EBITDA $83 $92 $87 $89 $10 $11
1) FY '12 includes a $17 million charge related to a deferred tax asset valuation allowance in Canada FY '13 and LTM 1Q '14 includes a $230 million of tax benefit related to the reversal of the Unisource U.S. tax valuation allowance
2) LTM 1Q '14 includes gains of $5 million and $2 million from the sale of two of Unisource's joint ventures 3) FY '11 includes impairment of trade names in Canada FY '12 primarily includes a $3 million impairment of cold storage equipment in Canada, a $1 million of impairment of packaging equipment in Sweden and a $1 million impairment of goodwill in Canada
Related Documents