VERITAS FUNDS PLC ANNUAL REPORT AND AUDITED FINANCIAL STATEMENTS FOR THE FINANCIAL YEAR ENDED 30 SEPTEMBER 2021

Welcome message from author
This document is posted to help you gain knowledge. Please leave a comment to let me know what you think about it! Share it to your friends and learn new things together.
Transcript

VERITAS FUNDS PLC
ANNUAL REPORT AND AUDITED FINANCIAL STATEMENTS FOR THE FINANCIAL YEAR ENDED 30 SEPTEMBER 2021

VERITAS FUNDS PLC
1
TABLE OF CONTENTS
Directory 2
Directors’ Report 3
Independent Auditor’s Report 8
Depositary’s Report 11
Investment Manager’s Report -Veritas Asian Fund / Veritas China Fund 12 -Veritas Global Focus Fund / Veritas Global Real Return Fund / Veritas Izoard Fund 31 -Veritas Global Equity Income Fund 36 -Veritas Third Eye Global Emerging Markets Fund 39 Schedule of Investments -Veritas Asian Fund 43 -Veritas Global Focus Fund 46 -Veritas Global Equity Income Fund 50 -Veritas China Fund 53 -Veritas Global Real Return Fund 56 -Veritas Izoard Fund 61 -Veritas Third Eye Global Emerging Markets Fund 64 Statement of Financial Position 68
Statement of Comprehensive Income 72
Statement of Changes in Net Assets Attributable to Holders of Redeemable Participating Shares 76
Statement of Cash Flows 80
Notes to the Financial Statements 86
Schedule of Changes in Investments (Unaudited) -Veritas Asian Fund 151 -Veritas Global Focus Fund 153 -Veritas Global Equity Income Fund 154 -Veritas China Fund 155 -Veritas Global Real Return Fund 157 -Veritas Izoard Fund 159 -Veritas Third Eye Global Emerging Markets Fund 160 Supplementary Information (Unaudited) 162
Additional Information 170

VERITAS FUNDS PLC
2
DIRECTORY
DIRECTORS Mike Kirby (Irish) Brian Wilkinson (British, Irish resident)* Richard Grant (British) Michael Morris (Irish) (since 1 January 2021)* Nicola Lakin (British) (since 15 April 2021)
REGISTERED OFFICE 25/28 North Wall Quay (until 13 May 2021) IFSC Dublin 1 Ireland
DEPOSITARY Brown Brothers Harriman Trustee Services (Ireland) Limited 30 Herbert Street Dublin 2 Ireland
70 Sir John Rogerson’s Quay (from 13 May 2021) Dublin 2 Ireland
ADMINISTRATOR AND REGISTRAR Brown Brothers Harriman Fund Administration Services (Ireland) Limited 30 Herbert Street Dublin 2 Ireland
INVESTMENT MANAGER AND UNITED KINGDOM REPRESENTATIVE Veritas Asset Management LLP 1 Smart’s Place London WC2B 5LW United Kingdom
INDEPENDENT AUDITORS PricewaterhouseCoopers One Spencer Dock North Wall Quay Dublin 1 Ireland
LEGAL ADVISERS TO THE COMPANY A&L Goodbody (until 10 May 2021) International Financial Services Centre 28-28 North Wall Quay Dublin 1 Ireland
SUB ADVISOR TO THE VERITAS ASIAN FUND AND VERITAS CHINA FUND Veritas Asset Management (Asia) Ltd Level 29, Infinitus Plaza 199 Des Voeux Road Central Hong Kong
Matheson (from 10 May 2021) 70 Sir John Rogerson’s Quay Dublin 2 Ireland
COMPANY SECRETARY Goodbody Secretarial Limited (until 13 May 2021) 25-28 North Wall Quay IFSC Dublin 1 Ireland Matsack Trust Limited (from 13 May 2021) 70 Sir John Rogerson’s Quay Dublin 2 Ireland
SWISS PAYING AGENT & SWISS REPRESENTATIVE Société Générale Paris Zürich Branch Talacker 50, P.O.B. 1928 CH-8001 Zurich Switzerland
All Directors are non-executive * Independent Director

VERITAS FUNDS PLC
3
DIRECTORS’ REPORT The Directors submit their report together with the audited financial statements for the year ended 30 September 2021. Directors’ responsibilities Company law requires the Directors to prepare Company financial statements for each financial year. Under that law the Directors have elected to prepare the financial statements in accordance with Irish Law and International Financial Reporting Standards (IFRS’s) as adopted by the EU and applicable law. Irish company law requires the Directors to prepare financial statements for each financial year which give a true and fair view of the assets, liabilities and financial position of Veritas Funds Plc (''the Company'') and of the Statement of Comprehensive Income of the Company for that year. In preparing these financial statements, the Directors are required to:
select suitable accounting policies and then apply them consistently; make judgments and estimates that are reasonable and prudent; state whether the financial statements have been prepared in accordance with IFRS as adopted by the European
Union ("EU") and ensure that they contain additional information required by the Companies Act, 2014 (the “Companies Act”); and
prepare the financial statements on the going concern basis unless it is inappropriate to presume that the company will continue in business.
The Directors confirm that they have complied with the above requirements in preparing the financial statements. The Directors are responsible for keeping adequate accounting records which disclose with reasonable accuracy at any time the financial position of the Company and to enable them to ensure that the financial statements comply with the Companies Act and the Central Bank (Supervision and Enforcement) Act 2013 (section 48(1)) (Undertakings for Collective Investment in Transferable Securities) Regulations 2019 (the “Central Bank UCITS Regulations”). They are also responsible for safeguarding the assets of the Company and hence for taking reasonable steps for the prevention and detection of fraud and other irregularities. Under the Central Bank UCITS Regulations, the Directors are required to entrust the assets of the Company to the Depositary for safe-keeping. In carrying out this duty, the Directors have delegated custody of the Company’s assets to Brown Brothers Harriman Trustee Services (Ireland) Limited. The Directors are responsible for the maintenance and integrity of the corporate and financial information included on the Company’s website. Legislation in the Republic of Ireland governing the preparation and dissemination of financial statements may differ from legislation in other jurisdictions. The work carried out by the auditors does not involve consideration of these matters and, accordingly, the auditors accept no responsibility for any changes that may have occurred to the financial statements since they were initially presented on the website. Adequate Accounting Records The Directors are responsible for keeping adequate accounting records that disclose with reasonable accuracy at any time the financial position of the Company and enable them to ensure that the financial statements are prepared in accordance with Financial Reporting Standards applicable in the Republic of Ireland and comply with the Companies Act and the Central Bank UCITS Regulations.

VERITAS FUNDS PLC
4
DIRECTORS’ REPORT (CONTINUED)
The measures taken by the Directors to secure compliance with the Company’s obligation to keep adequate accounting records are the use of appropriate systems and procedures and employment of competent persons. To this end the Directors have engaged Brown Brothers Harriman Fund Administration Services (Ireland) Limited as Administrator and Matsack Trust Limited as Secretary (from 13 May 2021). The accounting records are kept at 30 Herbert Street, Dublin 2. Review of business and future developments The Company is an open-ended investment company with variable capital which has been authorised by the Central Bank of Ireland (the “Regulator”) under the Central Bank UCITS Regulations. There was no change in the nature of the Company’s business during the year. The Investment Manager’s Report contains a review of the factors which contributed to the performance for the year. The Company will continue to pursue its objectives as set out in detail in the Prospectus. Risk management objectives and policies A detailed review of the principal activities is included in the Investment Manager’s Report and in note 9 of these financial statements. Principal risks and uncertainties The Company is an umbrella fund with segregated liability between sub-funds. The principal risks facing the Company relate primarily to the holding of financial instruments and markets in which it invests. The most significant types of financial risk to which the Company is exposed are market risk, credit risk and liquidity risk. Market risk includes other price risk, currency risk and interest rate risk. Details of the risks associated with financial instruments are included in note 9 to the financial statements. Beginning in January 2020, global financial markets have experienced significant volatility resulting from the spread of a novel coronavirus known as COVID-19. The outbreak of COVID-19 has resulted in travel and border restrictions, quarantines, supply chain disruptions, lower consumer demand and general market uncertainty. The effects of COVID-19 may continue to adversely affect the global economy, the economies of certain nations and individual issuers, all of which may negatively impact the Company's performance. The United Kingdom (“UK”) officially left the EU on 31 January 2020 but remained subject to EU regulations during an agreed transitionary phase until 31 December 2020. Although a free trade agreement was ratified by both the EU and the UK in December 2020 and the transitionary phase has ended, there remains a number of uncertainties in connection with the UK’s relationship with the EU in regards to potential regulatory alignment or equivalence. Until the terms of regulations are clearer, it is not possible to determine the full impact that the UK’s departure and/or any related matters may have on the Company and its investments. From 1 January 2021 a memorandum of understanding is in place between the UK’s Financial Conduct Authority, the European Securities and Markets Authority and the EU which permits the continued delegation of investment management to Veritas Asset Management. Results and dividends The results and dividends for the year are set out in the Statement of Comprehensive Income. During the financial year ended 30 September 2021, the Company paid to Holders of Redeemable Participating Shares distributions in the amount of USD 11,484,791.

VERITAS FUNDS PLC
5
DIRECTORS’ REPORT (CONTINUED)
Significant matters arising during the year Significant matters arising during the year are outlined in note 15. Subsequent events Details of subsequent events since the statement of financial position date are outlined in note 18. Directors Mr Brian Wilkinson, Mr Mike Kirby, Mr Richard Grant, Mr Michael Morris (since 1 January 2021) and Ms Nicola Lakin (since 15 April 2021) were the Directors who held office throughout the year.
Directors’ and secretary’s interests The Directors of the Company at 30 September 2021 are set out on page 2 and the shares held by Directors are outlined in note 11.
As at 30 September 2021, Mr Richard Grant was a Managing Partner of the Investment Manager and as such had an interest in the relationship between the Company and the Investment Manager. He ceased acting as a Managing Partner of the Investment Manager from 1 November 2021. Mr Richard Grant was also director of Veritas Asset Management (Asia) Ltd, a sub-advisor to the Investment Manager on Veritas Asian Fund and Veritas China Fund (until 1 November 2021). He will continue as a director on the Board of the Company.
Ms Nicola Lakin is the Chief Operating Officer and a Managing Partner of the Investment Manager (since 1 November 2021) and as such has an interest in the relationship between the Company and the Investment Manager. Ms Nicola Lakin is also director of Veritas Asset Management (Asia) Ltd (since 16 June 2021).
The Company uses the services of KB Associates for the provision of a Money Laundering Reporting Officer. Mr Mike Kirby who is a Director of the Company, is the Managing Principal of KB Associates.
The Secretary does not have any interest in the Company.
Connected persons In accordance with the requirements of the Central Bank UCITS Regulations, all transactions carried out with the Company by the management company or depositary of a UCITS, and the delegate or sub-delegates of such a management company or depositary (excluding any non-group company sub-depositaries appointed by a depositary), and any associated or group companies of such a management company, depositary, delegate or sub-delegate (“connected persons”) must be carried out as if conducted at arm's length and be in the best interests of shareholders. The Directors are satisfied that there are arrangements in place to ensure that the obligations set out in the Central Bank UCITS Regulations are applied to all transactions with connected persons and transactions with connected persons entered into during the period complied with the obligations set out in the Central Bank UCITS Regulations.
Independent auditors The auditors, PricewaterhouseCoopers, have indicated their willingness to continue in office in accordance with the provisions of section 383(2) of the Companies Act.

VERITAS FUNDS PLC
6
DIRECTORS’ REPORT (CONTINUED)
Directors Compliance Statement The Directors confirm, in accordance with Section 225 of the Companies Act, that the following has been completed:
produced a compliance policy statement setting out the Company's compliance policies; established arrangements/structures sufficient to "secure material compliance" with the Company's "relevant
obligations"; and conducted a review of these arrangements/structures during the financial year ended 30 September 2021.
Audit Committee Section 167 (2) of the Companies Act requires the Board of Directors to either establish an audit committee or decide not to establish such a committee. The Directors believe that there is no requirement to form an audit committee as:
the Board has all non-executive Directors and two independent Directors; Veritas Asset Management LLP has been appointed as investment manager and performs the general administration
of the Company with power to delegate such functions subject to the overall supervision and control of the Directors;
the Company have also appointed Brown Brothers Harriman Trustee Services (Ireland) Limited as Depositary of the assets of the Company.
Audit Information Statement As per the Section 330 of the Companies Act,
so far as the Directors are aware, there is no relevant audit information of which the Company’s statutory auditors are unaware; and
each Director has taken all the steps that he or she ought to have taken as a Director in order to make himself or herself aware of any relevant audit information and to establish that the Company’s statutory auditors are aware of that information.
Corporate Governance Code The Company has adopted the Corporate Governance Code for Collective Investment Schemes and Management Companies (the “Code”) which was issued by Irish Funds in December 2011 and which came into effect on 1 January 2012 with a transitional period of 12 months until 31 December 2012. The Board of Directors resolved to adopt the Code at a board meeting on 13 December 2012 with effect from 31 December 2012. The Directors confirm that the Company has been in compliance with the Code since the date of adoption. Financial reporting process – description of main features: The Directors are responsible for establishing and maintaining adequate internal control and risk management systems of the Company in relation to the financial reporting process. Such systems are designed to manage rather than eliminate the risk of error or fraud in achieving the Company’s financial reporting objectives and can only provide reasonable and not absolute assurance against material misstatement or loss. The Directors have procedures in place to ensure that all relevant accounting records are properly maintained and are readily available, including production of annual and interim financial statements. The annual and interim financial statements of the Company are required to be approved by the Directors and filed with the Central Bank. The annual financial statements are required to be audited by an independent auditor who reports annually to the Board on their findings.


Independent auditors’ report to the members of Veritas Funds Plc
Report on the audit of the financial statements
Opinion
In our opinion, Veritas Funds Plc’s financial statements:
• give a true and fair view of the Company’s and sub-funds’ assets, liabilities and financial position as at 30 September 2021 and of their results and cash flows for the year then ended;
• have been properly prepared in accordance with International Financial Reporting Standards (“IFRSs”) as adopted by the European Union; and
• have been properly prepared in accordance with the requirements of the Companies Act 2014 and the European Communities (Undertakings for Collective Investment in Transferable Securities) Regulations 2011 (as amended).
We have audited the financial statements, included within the Annual Report and Audited Financial Statements, which comprise:
• the Statement of Financial Position as at 30 September 2021;
• the Statement of Comprehensive Income for the year then ended;
• the Statement of Cash Flows for the year then ended;
• the Statement of Changes in Net Assets Attributable to Holders of Redeemable Participating Shares for the year then ended;
• the Schedule of Investments for each of the sub-funds as at 30 September 2021; and
• the notes to the financial statements for the Company and for each of its sub-funds, which include a description of the significant accounting policies.
Basis for opinion
We conducted our audit in accordance with International Standards on Auditing (Ireland) (“ISAs (Ireland)”) and applicable law.
Our responsibilities under ISAs (Ireland) are further described in the Auditors’ responsibilities for the audit of the financial statements section of our report. We believe that the audit evidence we have obtained is sufficient and appropriate to provide a basis for our opinion.
Independence
We remained independent of the Company in accordance with the ethical requirements that are relevant to our audit of the financial statements in Ireland, which includes IAASA’s Ethical Standard, and we have fulfilled our other ethical responsibilities in accordance with these requirements.
Conclusions relating to going concern
Based on the work we have performed, we have not identified any material uncertainties relating to events or conditions that, individually or collectively, may cast significant doubt on the Company’s and sub-funds’ ability to continue as a going concern for a period of at least twelve months from the date on which the financial statements are authorised for issue.
In auditing the financial statements, we have concluded that the directors’ use of the going concern basis of accounting in the preparation of the financial statements is appropriate.
However, because not all future events or conditions can be predicted, this conclusion is not a guarantee as to the Company’s and sub-funds’ ability to continue as a going concern.
Our responsibilities and the responsibilities of the directors with respect to going concern are described in the relevant sections of this report.

Reporting on other information
The other information comprises all of the information in the Annual Report and Audited Financial Statements other than the financial statements and our auditors’ report thereon. The directors are responsible for the other information. Our opinion on the financial statements does not cover the other information and, accordingly, we do not express an audit opinion or, except to the extent otherwise explicitly stated in this report, any form of assurance thereon. In connection with our audit of the financial statements, our responsibility is to read the other information and, in doing so, consider whether the other information is materially inconsistent with the financial statements or our knowledge obtained in the audit, or otherwise appears to be materially misstated. If we identify an apparent material inconsistency or material misstatement, we are required to perform procedures to conclude whether there is a material misstatement of the financial statements or a material misstatement of the other information. If, based on the work we have performed, we conclude that there is a material misstatement of this other information, we are required to report that fact. We have nothing to report based on these responsibilities.
With respect to the Directors’ Report, we also considered whether the disclosures required by the Companies Act 2014 have been included.
Based on the responsibilities described above and our work undertaken in the course of the audit, ISAs (Ireland) and the Companies Act 2014 require us to also report certain opinions and matters as described below:
• In our opinion, based on the work undertaken in the course of the audit, the information given in the Directors’ Report for the year ended 30 September 2021 is consistent with the financial statements and has been prepared in accordance with applicable legal requirements.
• Based on our knowledge and understanding of the Company and its environment obtained in the course of the audit, we have not identified any material misstatements in the Directors’ Report.
Responsibilities for the financial statements and the audit
Responsibilities of the directors for the financial statements
As explained more fully in the Directors’ responsibilities set out on page 3, the directors are responsible for the preparation of the financial statements in accordance with the applicable framework and for being satisfied that they give a true and fair view.
The directors are also responsible for such internal control as they determine is necessary to enable the preparation of financial statements that are free from material misstatement, whether due to fraud or error.
In preparing the financial statements, the directors are responsible for assessing the Company’s and sub-funds’ ability to continue as going concerns, disclosing as applicable, matters related to going concern and using the going concern basis of accounting unless the directors either intend to liquidate the Company or to cease operations, or have no realistic alternative but to do so.
Auditors’ responsibilities for the audit of the financial statements
Our objectives are to obtain reasonable assurance about whether the financial statements as a whole are free from material misstatement, whether due to fraud or error, and to issue an auditors’ report that includes our opinion. Reasonable assurance is a high level of assurance, but is not a guarantee that an audit conducted in accordance with ISAs (Ireland) will always detect a material misstatement when it exists. Misstatements can arise from fraud or error and are considered material if, individually or in the aggregate, they could reasonably be expected to influence the economic decisions of users taken on the basis of these financial statements.
Our audit testing might include testing complete populations of certain transactions and balances, possibly using data auditing techniques. However, it typically involves selecting a limited number of items for testing, rather than testing complete populations. We will often seek to target particular items for testing based on their size or risk characteristics. In other cases, we will use audit sampling to enable us to draw a conclusion about the population from which the sample is selected.
A further description of our responsibilities for the audit of the financial statements is located on the IAASA website at:
https://www.iaasa.ie/getmedia/b2389013-1cf6-458b-9b8f-a98202dc9c3a/Description_of_auditors_responsibilities_for_audit.pdf.
This description forms part of our auditors’ report.
Use of this report
This report, including the opinions, has been prepared for and only for the Company’s members as a body in accordance with section 391 of the Companies Act 2014 and for no other purpose. We do not, in giving these opinions, accept or assume responsibility for any other purpose or to any other person to whom this report is shown or into whose hands it may come save where expressly agreed by our prior consent in writing.

Other required reporting
Companies Act 2014 opinions on other matters
• We have obtained all the information and explanations which we consider necessary for the purposes of our audit.
• In our opinion the accounting records of the Company were sufficient to permit the financial statements to be readily and properly audited.
• The financial statements are in agreement with the accounting records.
Companies Act 2014 exception reporting
Directors’ remuneration and transactions
Under the Companies Act 2014 we are required to report to you if, in our opinion, the disclosures of directors’ remuneration and transactions specified by sections 305 to 312 of that Act have not been made. We have no exceptions to report arising from this responsibility.
Patricia Johnston for and on behalf of PricewaterhouseCoopers Chartered Accountants and Statutory Audit Firm Dublin 14 December 2021


VERITAS FUNDS PLC
12
VERITAS ASIAN FUND / VERITAS CHINA FUND
INVESTMENT MANAGER’S REPORT The Asian markets and especially Chinese related stocks saw a difficult second half of the year with the MSCI China falling significantly driven by China regulatory concerns over the technology and education sectors. In addition, investors were worried about the potential regulatory concerns on Hong Kong property and Macau casinos. The performance of a number of our holdings especially in India and the environmental sector mitigated the fall.
China’s common prosperity: The history of “common prosperity”
The concept of “common prosperity” in China is not new. Since the establishment of the People’s Republic of China in 1949, different generations of leaders have viewed common prosperity as the ultimate goal. The words common prosperity or
“共同富裕” are frequently used by Chairman Mao, Deng Xiaoping and more recently Xi Jinping. Deng Xiaoping articulated
numerous statements on the concept of common prosperity including the following:
October 1985 (speaking to US trade representatives): “We can allow some places and some people to become rich first; those who become rich first can help the others and eventually achieve common prosperity”.
一部分地区、一部分人可以先富起来,Mih和帮助其他地区、其他的人,逐步达到共同富裕。
August 1986 (speech in Tianjin): “My proposal is to let some places and some people to become rich, but the broad principle is for common prosperity. One segment of the area developing faster to foster the remaining area. This will
help speed up development to achieve common prosperity”.我的一5-7.主v是, th一部分人、一部分 地区先富
起来,大原91,1J是共同富裕。一部分地区a展快一点,Mih 大部分地区,3A是加速a展、达到共同富裕的捷径
Early 1992 in his famous Southern tour: “The essence of socialism is to liberate the productive forces, develop the productive forces, eliminate exploitation, eliminate polarisation, to finally achieve common prosperity.”
“社会主.的本.e., 是解放生7,.力,a展生7,.力,消T:剥削,消除两极分化,最终达到共同富裕。”
Deng Xiaoping’s policies are widely credited for the successful restructuring of the Chinese economy which had brought prosperity to the nation. He placed a stronger policy priority on growth and efficiency, i.e., “making the pie bigger” was more important than “dividing the pie evenly”. The “iron bowl” was taken away with the state-owned enterprises (SOE) reform in the 1990s, replaced by various forms of non-state sectors including individual-owned company, township and village enterprises, private enterprises, joint-stock enterprises and foreign companies. These segments developed rapidly and overtook state-owned enterprises to become the major source of growth, employment, taxation, and innovations. Inequality became acceptable in the early stage of development under the Chinese socialist growth model with Chinese characteristics.
Common prosperity is not a new theme...
The policy shift started to happen under the leadership of President Hu Jintao. President Hu proposed a people-oriented scientific development concept, promised to build a “harmonious society” (an inclusive model of development) where the entrepreneurs should not become rich at the expense of the workers and farmers. The policy started to shift towards a balance between efficiency and equality and support for vulnerable groups, most notably the removal of agricultural tax in 2006, the revision of Labour Law in 2009, and the establishment of social security system.

VERITAS FUNDS PLC
13
VERITAS ASIAN FUND / VERITAS CHINA FUND
INVESTMENT MANAGER’S REPORT (CONTINUED)
The concept of common prosperity has been strengthened under the leadership of President Xi Jinping.
The 18th Party Congress in 2012, Chaired by President Xi Jinping stated that China should stick to "the path of common prosperity", which is "the fundamental principle of socialism with Chinese characteristic".
The "Decision on Several Major Issues of Comprehensively Deepening Reform", the 2013 reform blueprint of the Third Plenum, specified ways to achieve common prosperity. They include supporting labour income growth, pushing for more equal basic public services, reforming the income distribution system
through tax reform, social protection enhancement, and transfer payment, expanding the size of middle-income population, and narrowing the regional, rural-urban and sectoral income gaps. The decision also called for multiple channels to increase household property income and encouraging a big role from charity donations.
In 2014, the CPC National Congress adopted a decision to advance the rule of law: to develop effective institutional arrangements to ensure steady progress towards common prosperity.
The 13th Five Year Plan (FYP) in 2016 implemented some specific measures to further the objective of common prosperity, including reducing poverty, expanding the coverage of pension and health insurance and reforming personal income tax and consumption tax.
...But its importance has increased in the 14th FYP
In 2018-2020, the government launched a three-year campaign with three priority tasks: poverty reduction, environment protection and risk prevention. The 19th Party Congress in 2020 set out China's long-term development plan to become an advanced modern economy by 2050 after the country has achieved "moderately prosperous society in all respects". China is to make "solid progress" towards common prosperity by 2035 and "basically achieve" common prosperity by 2050. This means a more equal society with better social welfare as the country becomes richer and more advanced. President Xi emphasized in a January 2021 speech that common prosperity is not just an economic objective, but also about the Party's "governing foundation". That said, the top leadership has repeatedly emphasized that common prosperity is not egalitarianism and is an objective that will be achieved in multiple phases over time, and through experiences from regional pilot programs. In line with this long-term plan, the 14th FYP (2021-2025) called for the formulation of an action plan to facilitate common prosperity, highlighting the increased emphasis on the theme and imploring various governments to roll out accompanying policy measures.
What does common prosperity mean?
Common prosperity, along with “green development” and “innovations”, will become prominent themes under the high-quality development strategy going forward. Common prosperity aims to address imbalances as specified in the principal contradictions facing the Chinese society, including regional imbalances, imbalances between urban and rural areas, income, and wealth inequality. The 10th Meeting of the Central Committee for Financial and Economic Affairs (CFEAC) elaborated on the concept as follows.

VERITAS FUNDS PLC
14
VERITAS ASIAN FUND / VERITAS CHINA FUND
INVESTMENT MANAGER’S REPORT (CONTINUED)
Common prosperity means prosperity for all people, not prosperity for a small group of people.
Common prosperity will be achieved in stages; it does not mean uniform egalitarianism.
Common prosperity not only means reduced income inequality, but more broadly equal opportunity and improved social welfare, including education, healthcare, and employment opportunities.
Common prosperity does not mean a crackdown on non-state sectors. China will stick to the economic system with the public ownership as the main body and coexistence of multiple ownerships. Some people can become rich first and subsequently help others. The government will protect income and wealth derived from hard work, law-abiding businesses, and innovations.
Common prosperity means that China will strengthen social welfare schemes but does not mean China will shift to the welfare economy system.
Common prosperity means a balance between efficiency and equality, and a coordination of roles between the government and the market.
What does common prosperity hope to achieve?
Common prosperity is a continuation of structural transformation in the past decade The emphasis on common prosperity, or a balance between efficiency and equality, comes after decades of high growth and China’s ascendance into the group of high middle-income countries. China’s GDP per capita has surpassed US$10,000 since 2019 and is expected to exceed US$12,000 this year. The policy shift started under President Hu’s terms especially after the 2008 Global Financial Crisis. In many areas, the emphasis on common prosperity is a continuation of economic transformation in China over the past decade.
First, potential growth slowed down, and the government lowered the high growth targets to “medium to high” and emphasized on the quality of growth in recent years.
Second, 2010 was the turning point for the declining trend of labour income and household consumption (as % of GDP). This was in line with the economic transformation towards a consumption-driven growth model. The 19th Party Congress explicitly guided that labour income growth should be in line with GDP growth and wage increases should be in line with labour productivity increases.
Third, income and wealth inequality deteriorated since the 1980s, but started to stabilize and improve modestly over the past decade. At the national level, disposable income of the high-income group (top 20%) is about 10 times of the low-income group (bottom 20%), and in urban areas the ratio is approximately 6 times. According to Premier Li, while disposable income per capita exceeded 30,000 yuan in 2019, about 600 million people (42.5% of total population) in China had disposable income below 12,000 yuan per year.

VERITAS FUNDS PLC
15
VERITAS ASIAN FUND / VERITAS CHINA FUND
INVESTMENT MANAGER’S REPORT (CONTINUED)
China’s economic growth and GDP per capita
Source: NBS, CEIC; J.P. Morgan
Labour income and household consumption
Source: CEIC; J.P. Morgan

VERITAS FUNDS PLC
16
VERITAS ASIAN FUND / VERITAS CHINA FUND
INVESTMENT MANAGER’S REPORT (CONTINUED)
Gini coefficient is one of the most popular indicators to assess inequality. According to the Standard World Income Inequality Database (SWIID) provided by the World Bank, China’s Gini coefficient before tax and transfer was 0.46 in 2015, and the Gini coefficient after tax and transfer was 0.402. The Gini coefficient reported by the NBS peaked in 2009 at 0.491 and then declined modestly to 0.465 in 2019. World Inequality Database (WID) reported that the share of income of top 10% households rose from 27.9% in 1980 to 41.7% in 2015 (peaking at 43.1% in 2011), while the share of income of bottom 50% households declined from 25.0% in 1980 to 14.4% in 2015 (bottom at 13.8% in 2010). The People’s Bank of China Household survey in 2020 reported that top 10% households held 47.5% of total household assets, compared to 2.6% for bottom 20% households. Among all surveys, the China Household Finance Survey (CHFS) reported the most significant income inequality for China. The CHFS survey in 2010 reported a Gini coefficient of 0.61 in 2010, and the wealthiest 10% of Chinese households held 60.6% of total household assets.
Fourthly, the past decade also witnessed a remarkable expansion in China’s social security system. The number of insured people under the pension system rose from 360 million in 2010 to around 1 billion in 2020, and the coverage of medical insurance rose from 433 million person in 2010 to 1.36 billion in 2020.
Income growth vs. GDP growth in China
Source: NBS, CEIC; J.P. Morgan

VERITAS FUNDS PLC
17
VERITAS ASIAN FUND / VERITAS CHINA FUND
INVESTMENT MANAGER’S REPORT (CONTINUED)
Disposable Income ratio between high and low-income
Source: CEIC; J.P. Morgan
China’s Gini coefficients
Source: NBS; CHFS; Standard World Inequality Database (SWIID); J.P. Morgan

VERITAS FUNDS PLC
18
VERITAS ASIAN FUND / VERITAS CHINA FUND
INVESTMENT MANAGER’S REPORT (CONTINUED)
Number of insured person under social security in China
Source: CEIC; J.P. Morgan
Three myths on 'common prosperity’
Myth 1: The catchphrase signals an abrupt policy shift that will bring short-term shocks.
The phrase seems to have caused shock waves globally, but it is not new. Deng used it frequently and Hu started the process after the Global Financial Crisis to focus more on equality. President Xi used it in 2012, and again on many occasions during signature keynote speeches that China would "make concrete steps towards common prosperity". The phrase has appeared more frequently since late last year, in multiple documents of the Communist Party of China (CPC) proposals for formulating the 14th Five-Year Plan (Nov 2020), the government work report (Mar 2021), the Politburo meeting communique (Apr 2021) and President Xi's speech at 100th anniversary of the CPC (Jul 2021). The government had also released plans for the Zhejiang pilot program in July 2021.
Meanwhile, any policy changes are likely to be gradual. "Common prosperity" is a target to be reached in three decades, according to Xi's 2017 speech, and the blueprint to achieve such a goal is yet to be formulated. The government will draft a roadmap towards achieving "common prosperity" during the 14th FYP period (2021-25). The government also indicated a gradual, long-term approach. "We must make gradual and orderly progress, and be fully aware of the long-term, arduous and complex nature of common prosperity," read the CFEAC meeting communique.

VERITAS FUNDS PLC
19
VERITAS ASIAN FUND / VERITAS CHINA FUND
INVESTMENT MANAGER’S REPORT (CONTINUED)
Myth 2: The government is going to redistribute wealth in a random manner
The CFEAC pledged to "reasonably adjust excessively high income, encourage high-income individuals and businesses to return to the society," triggering concerns of a hostile approach towards the wealthy. However, the CFEAC also clarified that common prosperity is "not a uniform egalitarianism, and we shall promote common prosperity in stages." Common prosperity does not mean "equally wealthy, simultaneously wealthy, or equalizing the rich and the poor, or killing the rich to help the poor," said Yuan Jiajun, the Party Secretary of Zhejiang province who is in charge of the pilot program.
Most official statements so far emphasize boosting overall income and expanding the middle-income group, instead of merely redistributing existing wealth. As such, the "common prosperity" is a step up from the decades-long poverty alleviation project, after the CPC announced a victory in eradicating extreme poverty last year. The government aims to further support low-income individuals and allow them to move up the income ladder, primarily by creating higher-paying jobs, offering more equal social services and increasing upward mobility, as the Zhejiang roadmap shows.
Myth 3: The government is going to crack down on the private sector.
The phrase common prosperity also triggered concerns about a crackdown on private businesses, seen as the biggest beneficiary of Deng's "let some get rich first" philosophy. Investors are also pondering whether the recent regulation tightening on technology and education sectors will lead to broader restrictions. The Zhejiang pilot program roadmap suggests the opposite. The State Council's suggestions for Zhejiang stated it should protect private properties and "break barriers of private businesses' development." The province pledged to create an optimal environment for private businesses, so they can be "assured and bold" in achieving economic outcome, according to the pilot program plans for 2021-25. In addition, China's 14th FYP also pledged to optimize the environment for private business.
We do not think the government will launch a broad crackdown on private businesses, given the government is unlikely to strangle the most nimble, efficient and innovative part of the economy when it aims to double the GDP by 2035. The government repeatedly emphasized reaching a balance between efficiency and fairness in the 14th FYP, including the CFEAC statement and Zhejiang roadmap. After all, private businesses contribute to over 50% of tax revenue, 60% of GDP, 70% of innovation and 80% of employment, and are recognized as a crucial player in achieving common prosperity in the documents.
That said, businesses may still face an increase in labour and regulatory cost in the long term, given the government (in 14th FYP and Zhejiang roadmap) plans to (1) design a mechanism to adjust minimum wages, and encourage collective bargain for wages; (2) improve social security coverage; and (3) curb monopoly and unfair competition.

VERITAS FUNDS PLC
20
VERITAS ASIAN FUND / VERITAS CHINA FUND
INVESTMENT MANAGER’S REPORT (CONTINUED)
Per-Capita urban disposable income by income group The gap between the top and bottom earners is still expanding
Source: CEIC; NBS
VERITAS FUNDS PLC
21
VERITAS ASIAN FUND / VERITAS CHINA FUND
INVESTMENT MANAGER’S REPORT (CONTINUED)
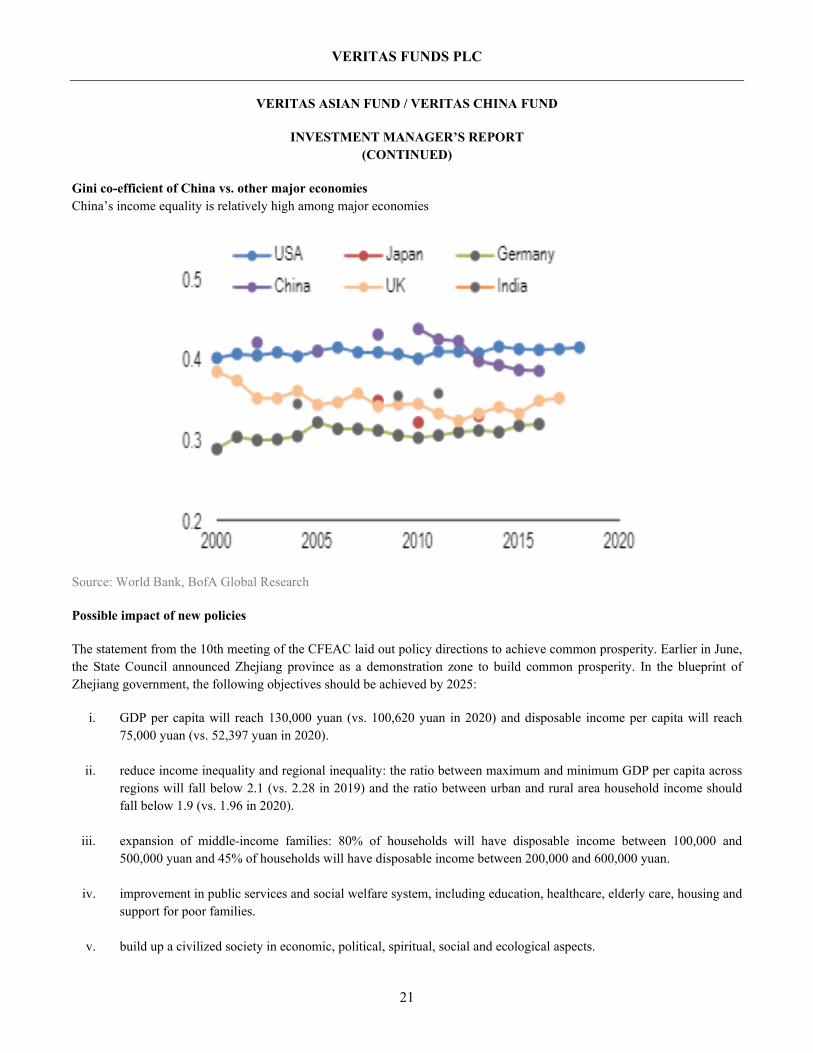
Gini co-efficient of China vs. other major economies China’s income equality is relatively high among major economies
Source: World Bank, BofA Global Research
Possible impact of new policies
The statement from the 10th meeting of the CFEAC laid out policy directions to achieve common prosperity. Earlier in June, the State Council announced Zhejiang province as a demonstration zone to build common prosperity. In the blueprint of Zhejiang government, the following objectives should be achieved by 2025:
i. GDP per capita will reach 130,000 yuan (vs. 100,620 yuan in 2020) and disposable income per capita will reach 75,000 yuan (vs. 52,397 yuan in 2020).
ii. reduce income inequality and regional inequality: the ratio between maximum and minimum GDP per capita across regions will fall below 2.1 (vs. 2.28 in 2019) and the ratio between urban and rural area household income should fall below 1.9 (vs. 1.96 in 2020).
iii. expansion of middle-income families: 80% of households will have disposable income between 100,000 and 500,000 yuan and 45% of households will have disposable income between 200,000 and 600,000 yuan.
iv. improvement in public services and social welfare system, including education, healthcare, elderly care, housing and support for poor families.
v. build up a civilized society in economic, political, spiritual, social and ecological aspects.

VERITAS FUNDS PLC
22
VERITAS ASIAN FUND / VERITAS CHINA FUND
INVESTMENT MANAGER’S REPORT (CONTINUED)
Looking at the Zhejiang “common prosperity model”, the objective to achieve common prosperity will have the following policy implications.
Impact on Growth. First of all, reasonably high growth remains an important element of high-quality growth. While the government has de-emphasized the importance of growth target in recent years, they are not abandoned. “Medium-to-high” growth rates, e.g., 5-6% growth in the 14th Five Year Plan, may represent a comfortable range of growth for the government and in line with the 2035 target to double the GDP. While “dividing the pie more evenly” is becoming more important, “making the pie bigger” remains an important pre-condition to fulfil the long-term development objective.
Impact on wealth inequality. Reducing income and wealth inequality is a key element in “common prosperity”. Policy measures can be adopted via primary income distribution, secondary re-distribution and tertiary distribution channels. Primary distribution refers to the distribution of income over the production factors (labour, capital). In China’s case, increasing the share of labour income (as % of GDP) and reducing income gaps between urban and rural areas and across regions and sectors are natural policy objectives. Re-distribution (also known as secondary distribution) refers to the process of income and wealth redistribution through the government, typically via taxation, transfer and subsidies. Tertiary distribution refers to charity donation on a voluntary basis, in many countries supported by government incentive schemes (e.g. tax deductible for donation).
Wealth distribution in OECD countries and China
Source: OECD Wealth Database; PBOC; J.P. Morgan

VERITAS FUNDS PLC
23
VERITAS ASIAN FUND / VERITAS CHINA FUND
INVESTMENT MANAGER’S REPORT (CONTINUED)
Gini coefficients in G20 economies
Source: Standard World Income Inequality Database (SWIID); J.P. Morgan
Reducing Gini coefficient like the developed countries. The policies will likely focus on the improvement in taxes, subsidies and insurance schemes. From a cross-country comparison perspective, China has the room to reduce income inequality via primary and re-distribution channels. The World Bank data showed that China’s income inequality before tax and transfer (after primary income distribution) ranked 50th among the 90 reported countries in 2015, and income inequality after tax and transfer (after re-distribution) ranked 30th. Re-distribution policies are able to significantly reduce the income inequality, e.g. a reduction of 0.23 in Gini coefficient in Germany and 0.20 in France. China’s re-distribution policy reduced the Gini coefficient by 0.058, vs. an average reduction of 0.103 among G20 economies.

VERITAS FUNDS PLC
24
VERITAS ASIAN FUND / VERITAS CHINA FUND
INVESTMENT MANAGER’S REPORT (CONTINUED)
Reduction in Gini coefficients via tax and transfer
Source: Standard World Income Inequality Database (SWIID); J.P. Morgan
Environmental, social and corporate governance (ESG) will become increasingly important in China. Beyond equality, the government will also prioritise the development of an inclusive development model and build up an equal opportunity society. Policies will respond to major social problems or concerns, e.g., the housing policy (housing is for living, not for speculation), health care policy (more affordable healthcare) and recent education policy shock (to reduce the education burden for children and parents). For Chinese companies, it implies increasing importance of the new social pillar under China’s ESG framework. The policy will focus on protection of consumer welfare and workers’ rights, and companies (both SOEs and non-SOEs) will be encouraged to balance profit-making with social responsibility.
USA example: from gilded age to progressive era
In the USA, the Gilded Age was an era coined by Mark Twain in his 1873 novel “The Gilded Age: A Tale of Today” that occurred during the late 19th century, which coincided with the Belle Epoque era in France. The Gilded Age was an era of extremely rapid growth as railways, mining, heavy industry factories and finance lead that growth. The first Transcontinental Railroad opened in 1869 and cut travel time from New York to San Francisco to six days instead of six months, and railroad track mileage tripled between 1860 and 1880 and then doubled again by 1920. Investors in London and Paris poured money through the American financial market centred in Wall Street to buy these new growth industries. Great technology and financial breakthroughs happened at this period led by entrepreneurs George Westinghouse, JP Morgan, Andrew Carnegie, Theodore Vail (ATT), and Thomas Edison. Despite this era of strong growth and great prosperity, this period was called the Gilded Age, not Golden Age, as Princeton University historian Nell Irvin Painter explains “Gilded is not golden. Gilded has the sense of a patina covering something else. It’s the shiny exterior and the rot underneath.”

VERITAS FUNDS PLC
25
VERITAS ASIAN FUND / VERITAS CHINA FUND
INVESTMENT MANAGER’S REPORT (CONTINUED)
The unequal wealth distribution was high during this period. From 1860 to 1900, the wealthiest 2% of American household controlled more than a third of the nation’s wealth, the top 10% owned roughly three quarters of the wealth, and the bottom 40% had no wealth at all. In terms of property, the wealthiest 1% owned 51% whilst the bottom 44% owned a mere 1.1%. One of the best-remembered excesses of the Gilded Age is the flaunting of great wealth, as epitomised by the great lavish costume Bradley-Martin ball held in New York Waldorf Hotel in 1897 which cost US$400,000 (estimated to be US$9.7m in today’s money) where socialites dressed as kings and queens. The ball drew massive criticism for its extravagance and excess.
Disturbed by the waste, inefficiency, corruption and injustices of the Gilded Age, President Theodore Roosevelt, leader of the Progressive movement, championed the “Square Deal” which has three major goals: conservation of natural resources, control of corporations and consumer protection, or the 3Cs. It is also during this Progressive Era that significant changes including the imposition of an income tax with the Sixteenth Amendment in 1909, the Federal Reserve in 1913, the Federal Trade Commission in 1914 and the Federal Employees Compensation Act in 1916 were implemented. One major event during the Progressive era was the implementation of the Sherman Antitrust Act that eventually resulted in the ending of the oil monopoly Standard Oil in 1911. The Progressive Era was one of general prosperity, reform of schools, rise of the middle class, emergence of philanthropy led by Carnegie and Rockefeller and embracing of science and technology.
Conclusion
China in the 1980s was one of the poorest countries in the world. Since the launch of the economic reforms in the late 70s, about 800m Chinese people have been lifted out of poverty which is unprecedented in human history. Despite this success, there are still 600m Chinese who earn about 1,000 yuan (US$141) per capita a month, according to Chinese Premier Li Keqiang. Although their income is above the poverty line, they can hardly live a decent life. Their lives remain difficult, and they can only maintain a basic living and can hardly afford rental in a mid-size city. Among the 600m low-income population, 36.2% are in the central provinces and 34.8% in western regions.
Despite China’s status as an upper middle-income country of per capita GDP exceeding US$10,000, as well as the largest consumer of luxury goods globally, there is a widening wealth gap, which is a side effect due to uneven development over the past 40 years. China is like the Gilded Age of the USA in the late 1800s, where its huge prosperity and display of ostentatious wealth has hidden the size of China’s vulnerable population. In the long term, China’s success in building a prosperous society where wealth is shared by more people will make society more stable. And this rise of a large educated middle class will lead to greater consumption power in China. From an investment point of view, this can be quite positive for the longer term despite the short-term misgivings of investors fearing the uncertainty. We believe that investing in China is changing. Companies who ruthlessly exploit its workers and who disregard their social responsibilities are unlikely to do well in the new era. The brutal unbridled capitalism of the previous decades is no longer tolerated by the people and government. It’s interesting to see South Korea is following China‘s lead in looking at the work practices of its own internet companies. In Asia, the winners of the future are likely to be companies that not just work for their shareholders but for all stakeholders including their workers and the society at large.

VERITAS FUNDS PLC
26
VERITAS ASIAN FUND / VERITAS CHINA FUND
INVESTMENT MANAGER’S REPORT (CONTINUED)
Asia and Sustainability
Another topical issue to discuss is sustainability. According to OECD data, in the 21st century, after a sustained period of rapid growth, Asia has grown to become the largest regional economy, with 37.8 per cent of global GDP, followed by North America with 26.5 per cent and Europe with 24.8 per cent. Asia’s rapid economic growth coupled with a rising population has adversely affected the environment through air pollution, sea pollution, waste management problems and increased greenhouse gas (GHG) emissions. The International Energy Agency (IEA) reports that carbon dioxide (CO2) emissions from fuel combustion in Asia increased by 124.2 per cent between 2000 and 2018. As a result, Asia currently accounts for 54.7 per cent of global CO2 emissions from fuel combustion; far more than North America’s 16.4 per cent share and Europe’s 15.3 per cent. Unprecedented material and financial damage resulting from climate-related natural disasters in recent years within the region has raised concern over climate change. As a result, Asian governments have prioritized climate action, including the green transition and adaptation. Each country’s national commitment to comprehensive climate action and the target for the mitigation of GHG emissions towards 2030 can be seen in the Nationally Determined Contributions (NDCs), which countries are obliged to monitor and submit to the secretariat of the United Nations Framework Convention on Climate Change (UNFCCC) every five years. Asian countries have also attempted to align their development strategies with the UN Sustainable Development Goals (SDGs). The SDG Index, in Sustainable Development Report 2020, which tracks country performance on the 17 SDGs (with the worst rating at 0 and the best at 100) suggests that Asian countries overall are performing poorly on the SDGs. In Asia, South Korea is in 20th place, Thailand at 41st, China in 48th, and India in 117th place. Asia’s emerging economies are struggling to cope with the dilemma of balancing policies aimed at boosting their economies with their commitments to GHG emissions and SDGs. All this against a backdrop of the West demanding more action having benefitted from the industrial revolution (the UK has destroyed 50% of its biodiversity in the process).
A common challenge across many countries in Asia is the high dependency on coal for energy. According to an IEA report during 2020, 67% of electricity generation in China relies on coal. For India, it is 75%.
The figure for China was 70% in 2015 so the trend has been down. The COVID-19 crisis has sharpened challenges such as coal dependency. The key policy issues are whether governments can develop and implement financial recovery programmes while also meeting their commitments under the Paris Agreement and the SDGs.
According to the Global Climate Risk Index 2020, seven Asian countries (Myanmar, the Philippines, Pakistan, Vietnam, Bangladesh, Thailand and Nepal) are identified among the 10 nations most affected by climate risk from 1999 to 2018. Currently there is great variation regarding how well-equipped countries are to tackle climate change within and across Asia. Examples of commitments made are as follows;
China: To achieve peak CO2 emissions around 2030 and make best efforts to peak early. To lower CO2 emissions per unit of GDP by between 60% and 65% by 2030 from the 2005 level. To be carbon-neutral by 2060.
India: To reduce the emissions intensity of its GDP by between 33% and 35% by 2030 from the 2005 level. No current carbon- neutral policy. Cannot currently commit to peak by 2030.
South Korea: A 24.4% reduction from the total national GHG emissions in 2017 by 2030. To be carbon-neutral by 2050.

VERITAS FUNDS PLC
27
VERITAS ASIAN FUND / VERITAS CHINA FUND
INVESTMENT MANAGER’S REPORT (CONTINUED)
Australia: To reduce greenhouse gas emissions by 26 to 28 per cent below 2005 levels by 2030. This target is a floor on Australia’s ambition. Australia is aiming to overachieve on this target, and newly released emissions projections show Australia is on track to meet and beat its 2030 target without relying on past overachievement. No current 2050 carbon -neutral commitment (2060+)
The ASEAN5 (Indonesia, Malaysia, Philippines, Thailand, Vietnam) have adopted a two-fold approach to meet their emissions goals through a combination of unconditional and conditional targets. The five countries insist that they can achieve these ambitious targets so long as there is international support. Using Thailand as an example, the targets are as follows;
Unconditional: 20% reduction from the Business-As-Usual level by 2030.
Conditional: 25% reduction from the BAU level by 2030 including an additional 5% reduction compared to unconditional target. No commitment to carbon neutral by 2050.
China, has expressed intentions to try to reach the peak earlier and has implemented coal-targeting measures including a coal consumption cap for coal-fired generation capacity. Furthermore, new efficiency standards have forced a number of its old plants to shut down and the country is to stop investing in coal plants outside of China. The next step is to see how China incorporates its carbon-neutral targets in the country’s new five-year plan for the period 2021–25.
The carbon-neutral commitments by China, South Korea (and Japan, who have also committed to carbon neutrality by 2050) may change the direction of progress and help solve the trade-off between economic stimulus policies and the green transition which a report by United Nations Economic and Social Commission for Asia and the Pacific (UNESCAP) shows had not gone far enough before these commitments had been made.
At the country level across the region, the breakdown of policy actions aimed at achieving targets includes a move to diversify the energy mix with an accelerated shift to renewable energy, promotion of eco-friendly vehicles and other measures to improve energy efficiency.

VERITAS FUNDS PLC
28
VERITAS ASIAN FUND / VERITAS CHINA FUND
INVESTMENT MANAGER’S REPORT (CONTINUED)
In addition to the respective efforts by each government, differing regional networks in Asia are trying to address the concern of climate change and sustainability. These include;
Tripartite Environment Ministers Meeting (TEMM) between China, Japan and South Korea with knowledge-sharing, joint research and workshops on priority areas such as air pollution, biodiversity, climate change, the circular economy. TEMM is currently working closely under a five-year joint action plan (2020–24).
The Association of Southeast Asian Nations (ASEAN) has broadened its remit to cover a broad range of sustainability issues including the SDGs, national security, cybersecurity and the green economy.
The Regional Comprehensive Economic Partnership (RCEP), a trade partnership signed between ASEAN, Japan, China, S. Korea, Australia and New Zealand discussing regional cooperation.
China’s Belt and Road Initiative (BRI), a campaign to promote Chinese investment around the world while at the same time better connecting China with Africa and Europe, through a series of maritime and land routes. Given the degree of investment in new infrastructure linked to the BRI, it will have significant climate change implications.
ASEAN Power Grid initiative whereby 10 ASEAN member states are aiming to integrate their respective power grids through cross-border transmission lines
In 2020, the carbon-neutral declarations by China, and South Korea have helped to produce a visible shift in momentum in Asia. Already with continuous government promotion of renewable energy, the International Renewable Agency suggests that by 2025 the average levelised cost of electricity (LCOE) of solar photovoltaics (PV) used in solar panels could decrease by 59 per cent, and the LCOE of concentrating solar power (CSP) could decrease by up to 43 per cent. There could also be decreases in cost of onshore and offshore wind power, which could decline by 26 per cent and 35 per cent, respectively. This would enable renewable options to become more competitive than conventional energy and result in further shifts away from government subsidies.

VERITAS FUNDS PLC
29
VERITAS ASIAN FUND / VERITAS CHINA FUND
INVESTMENT MANAGER’S REPORT (CONTINUED)
Promotion of Environmental efforts
We, at Veritas are committed to helping to promote good environmental practice amongst the companies within which we invest on behalf of our clients. Climate change in its widest definition poses one of the biggest risks and opportunities for companies globally. For many years one of the themes within the portfolio has been Green Asia. At the time of writing, over 20% of the portfolio is invested in companies that benefit from the growing importance of this theme. A previous essay highlighted the solar energy market and the investments within the portfolio. As noted above a combination of greater climate commitment and technological advance in renewable energy, battery technology etc will offer opportunity. Valuation is critical to long term value creation, and any climate solution company exposure may shift up and down over time but we would expect more quality companies, run by forward thinking management to become part of the solution. Additionally, on behalf of our clients we are encouraging investee companies to disclose their environmental commitments in line with the Taskforce for Climate-related Financial Disclosure (TCFD) guidelines. This will take time and maybe more effective by targeting a few companies initially. Over the last few weeks we have started a process of formally contacting companies to ask about their own targets, strategy, scenario testing and commitments to science based measurement. We will then have a better idea of a starting point as to how the portfolio is positioned and which companies need to be further encouraged to make changes. Over time, it will then be possible for clients to follow improvements. Going forward we will illustrate where companies are positioned and which areas need improving. Below we start with two investee companies at differing starting points. Annually we will provide a summary of the overall position within the fund.
Goodman Group, is an Australian company holding which owns, develops and manages modern, high quality industrial and logistics space and warehousing globally and customers include the likes of Amazon. It has been a beneficiary of the acceleration in e-commerce. 2021 was the year that Goodman achieved carbon neutrality for its global operations, four years ahead of its 2025 target. In markets where it is challenging to procure renewable energy, Goodman will consider options such as direct power purchase agreements or green energy certificate schemes.
Goodman engaged climate consultants South Pole to provide support in completing a scenario-based climate risk assessment aligned with the TCFD guidelines. Overall, five key climate hazards (increasing temperatures and heatwaves, extreme precipitation events, windstorms, hailstorms and sea-level rise) were identified as being material and recommended for inclusion in the scenario risk assessment. These hazards were analysed under three different climate scenarios or Representative Concentration Pathways (RCPs), and across two-time horizons (mid-term up to 2050 and a long-term up to 2100). The scenarios chosen for the physical risk assessment are a business-as-usual scenario (RCP8.5), a medium mitigation scenario (RCP4.5) and a strong mitigation scenario (RCP2.6), which respectively correspond to a 4.6°C, 2.6°C and 1.7°C global warming trajectory.
Goodman is looking to maximise the availability of large, flat roof areas suitable for installation of solar PV systems. They increased the target of solar PV capacity installed on rooftops to 400MW globally by 2025. They are also looking to maintain carbon neutral operations and looking to start to developing carbon neutral buildings. Currently Goodman Group has not signed up to the Science Based Initiative but it is independently certified by Climate Active, an Australian government backed body that award certification to companies that have attained carbon neutrality. We expect new builds to be increasingly carbon neutral and will monitor this progress.
VERITAS FUNDS PLC
30
VERITAS ASIAN FUND / VERITAS CHINA FUND
INVESTMENT MANAGER’S REPORT (CONTINUED)
In 2021, Indian company Apollo Hospitals conducted its first materiality assessment of identified ESG issues. Within this analysis, though the Company has identified climate change as one of the key ESG issues, it has currently placed more importance on other issues such as quality of service and patient safety, affordability and accessibility of healthcare and human capital management. This is somewhat understandable as affordable health and accessibility is a key SDG. Apollo Hospitals is also currently concentrating its efforts to ensure compliance with the new requirements of the Business Responsibility and Sustainability Report (BRSR) in India, which will become mandatory for the financial year 2022/23. Compared to the existing requirements of the Business Responsibility Report (BRR), the BRSR has introduced a significant number of new requirements and expanded the scope of ESG issues covered.
Apollo Hospitals is fully aware of the devastating effects of climate change, the urgency of climate action as well as the impacts that Apollo Hospitals’ business has on the environment, including its carbon footprint. However, at this stage, the Company has not set any GHG emission reduction targets or explicitly committed to meeting carbon neutrality by 2050. The company did tell us that it does intend to disclose its carbon footprint (Scope 1 and 2 GHG emissions) in 2023 at the latest, and the reduction targets and the Company’s long-term climate action ambition will be set accordingly after further analyses.
Disappointingly the company deliberated internally whether to submit responses to CDP’s climate change survey and concluded not to submit a response to CDP’s request for information in 2021 based on an internal cost-benefit analysis and there not being sufficient time to collect relevant data and answer the adequate number of questions on the questionnaire for this year. However, it did note an increasing overlap with the requirements of the new BRSR and committed to looking at the disclosure requirements again for 2022. One of the issues is that none of Apollo Hospitals peers submit CPD reports and as yet none has taken the lead. Again maybe not too surprising given India as a nation has yet to commit to carbon neutrality. We will continue to encourage the company to start disclosing climate credentials.

VERITAS FUNDS PLC
31
VERITAS GLOBAL FOCUS FUND / VERITAS GLOBAL REAL RETURN FUND / VERITAS IZOARD FUND
INVESTMENT MANAGER’S REPORT
The Outside View
In normal times, interest rates are set by market forces and represent the price of money, which is then used to measure investment risk and determine the present value of estimated future cash flows. However, since the Global Financial Crisis this price has become distorted as policy makers around the world have held their collective thumbs on the monetary scales to keep the cost of money artificially low. As these policy makers are well aware, interest rates power everything in the financial world. Holding interest rates artificially low undoubtedly leads to excessive risk taking as investors who previously relied on safe interest income need to invest in higher risk assets to maintain the same level of return.
After more than a decade of policy makers determining the price of money (which they have effectively set at zero) it seems that investors have become increasingly disorientated with many (high growth) companies’ valuations becoming dissociated from reality. One indication of this is how many investors now value companies not based on fundamentals but instead on “total addressable market” and “pro-forma” long run margin estimates. What they seem to miss in this work is how exceptional (based on historical examples) these companies would be if their forecasts prove correct. This is particularly the case in technological areas where rapid development increases the risk of a better solution being adopted and the existing technology thereby facing obsolescence within the long-time horizon demanded by extreme valuations.
To illustrate just how exceptional these companies’ results would need to be to justify an investment let’s use a software company that currently has a c.$90bn market capitalization and similar enterprise value. In FY2021 this company delivered just under $600m of revenue to put the company on an historic Enterprise Value / Sales valuation of almost 150x. The company is growing very fast (c.100% currently), has a large addressable market and has a common size P&L that looks like this:
FY 2021 Revenue 100% Cost of Goods Sold (41%) Gross Profit 59% Selling, General & Administrative Expenses (not including Stock Based Compensation)
(60%)
Stock Based Compensation (51%) R&D (40%) Operating Profit (92%)
To own shares in this c.$90bn company, we can work back from a point in the future when we believe it might be in a steady state (i.e. making a consistent profit that we can value) to see what assumptions you need to believe to hold it. Let’s first off assume that as an investor you want to earn 10% pa in this investment and are prepared to hold for 10 years. This means the market capitalisation in 10 years’ time would need to be c.$235bn. If we assume it is then more mature and so can be valued at a multiple of earnings, say 30x (implying it is still growing fairly rapidly), what does that mean for growth? Well, to work this out we need to make some simplifying assumptions. Let’s assume that in 10 years the company has:
Gross margin: 80% of revenue (vs less than 60% now and historically) Selling, general & administrative expenses: 30% of revenue (vs 60% now) R&D: 10% of revenue (vs 40% now) Stock based compensation: 20% of revenue (vs >50% now) Tax rate: 20%

VERITAS FUNDS PLC
32
VERITAS GLOBAL FOCUS FUND / VERITAS GLOBAL REAL RETURN FUND / VERITAS IZOARD FUND
INVESTMENT MANAGER’S REPORT (CONTINUED)
These assumptions seem fairly generous in that they assume a company that currently makes a substantial loss almost equivalent to its entire revenue will transition to an operating profit margin of 20% (post stock-based compensation) over 10 years. If this can be achieved and we value the resulting earnings at 30x, earnings would need to be c.$8bn ($235bn / 30) in 10 years. This means pre-tax profit of c.$10bn and therefore annual revenue of $50bn at a 20% operating profit margin. In 10 years. From c.$600m today. That works out at 56% compound annual growth rate (CAGR) in revenues for the next 10 years. Can that be achieved? Before we answer that, let’s consider some relevant academic work:
Daniel Kahneman in his (fabulous) book “Thinking Fast and Slow” talks about the Inside View and the Outside View. The inside view is best thought of as specific to the case in hand where forecasts are made using the specific circumstances and evidence from the forecaster's own experience. It is the approach most forecasters stumble onto. The external view on the other hand seeks broader external evidence not necessarily specific to the exact situation but instead more statistically rigorous due to a larger data set, such as base rates. The outside view is rarely the default way forecasters look at a specific situation but according to Kahneman is a better way of forecasting when there are “unknown unknowns” involved (pretty much everything involving the future then!). Kahneman’s work was subsequently strongly endorsed by Philip Tetlock in his superb book “Superforecasting” in which he demonstrates that “super-forecasters” use the outside view much more heavily than average forecasters.
So what is the base rate for publicly traded companies with revenues of >$500m to compound those revenues by >55% over 10 years without material mergers and acquisitions? The answer to this is that there has only been 1 company that has achieved this in the last 22 years: Facebook. This goes to show just how rare such high growth is. Maybe this analysis is too harsh and we should use a lower starting revenue to account for inflation? If we use at least $100m as the starting revenue then 9 publicly traded companies1 have achieved >55% CAGR during the 22 year period (again excluding those that achieved it by material acquisitions such as China Evergrande). 9 out of the many, many thousands of companies with revenue above $100m. The base rate goes to show how difficult compounding at such high rates for long period is and perhaps how demanding the assumptions built into the valuations of some tech companies have become. Now maybe the investors in this tech company would argue a different case. Fair enough. But give me your assumptions. Maybe the company will be valued at 50x earnings in 10 years, or stock-based comp will have been greatly reduced but these assumptions seem aggressive to us, and undoubtably leave little margin for error in the forecast.
This is one example, and it is possible that this specific company will go on to achieve growth rates above the assumptions laid out. However, there are many publicly traded companies in the technology sphere that are being valued similarly with very high required growth rates over long periods that seem unlikely to be achieved in the context of a base rate. Not all trees grow to the sky.
Implications for the portfolio
At Veritas we focus on buying companies that are competitively advantaged and available at attractive valuations. Two we have held for long periods in the portfolio are Alphabet and Charter and they represent two of our largest positions.
1 Tesla, Alphabet, Facebook, Blackberry, Baidu, Tencent, T-Mobile, Luxshare Precision Industry, Bharti Airtel

VERITAS FUNDS PLC
33
VERITAS GLOBAL FOCUS FUND / VERITAS GLOBAL REAL RETURN FUND / VERITAS IZOARD FUND
INVESTMENT MANAGER’S REPORT (CONTINUED)
Our original investment in Charter was actually an investment into Time Warner Cable in March 2015 which was subsequently acquired by Charter (to get hold of both the assets and the remarkable management team). Our thesis was (and remains) very simple – cable companies invested huge amounts in connecting homes with co-axial cable in the 1990s and 2000s that has serendipitously proven to be an excellent infrastructure for distributing broadband. This puts the cable companies in a competitively advantaged position as the investment in the infrastructure has largely been made (and fully depreciated) and the growth in broadband is therefore a new, large and incremental revenue stream. To meaningfully compete against the cable companies any competitor would need to invest in fiber optic cable to every house which is hugely expensive. Furthermore, with (largely) cheap software upgrades the cable companies’ coaxial cable can be upgraded such that upload and download speeds can be comparable to fiber optic cable.
The opportunity to invest arose because many investors were unimpressed by the overall revenue growth of the cable companies. This superficial analysis missed an important point: while the cable companies were losing video subscribers (to the likes of Netflix) they were gaining more broadband subscribers. At the revenue line this looked largely awash with revenue growth running around mid-single digit. However, what this missed was the huge difference in profitability between a video subscriber and a broadband subscriber. Cable companies are distributors of content in video and therefore need to pay for that content. A typical video subscriber may generate $90 per month of revenue but the content cost of this subscriber will be c.$60 leaving a gross margin of only $30. This gross margin then needs to cover high customer equipment costs (much higher for video than for broadband) and servicing that customer leaving an operating profit per subscriber of only c.$10 per month. A broadband subscriber on the other hand is likely paying upwards of $60 per month but has no content cost associated with them so gross margin is $60. The equipment is also cheaper as is the servicing requirement so the operating profit per broadband sub is multiples of the video subscriber. This math’s meant that despite fairly pedestrian overall revenue growth, earnings growth would be much higher (c.20% pa). At that cash flow level this growth would be augmented further as the capital intensity of the of the network declined (as a percentage of revenues) due to a shift to a more passive and lower maintenance network configuration (including more fibre optic cable). At the per share level, Charter further turbocharged growth by aggressively using their free cash flow to buy back shares, reducing the number outstanding by almost one third from our original purchase in 2015 from 314m to c.210m currently. This has resulted in a compound growth rate in free cash flow of 26% over our holding period.
Looking forward we remain confident in the opportunities still ahead for Charter. Broadband growth will continue with the company having only around 50% of houses subscribed to its service in the areas it operates. Given their economic lead (the infrastructure is already there) and the (medium-term) pathway to deliver 10Gb symmetrical service offering, we think they will continue to win customers from all but fiber optic cable and even here, they are well positioned given the infrastructure cost to lay fiber. Outside of broadband there are two further exciting areas of growth together with the continuing drag of “cord-cutting” of video subscribers. We believe that “cord-cutting” will remain manageable for the company as it has in the past despite the success of Netflix / YouTube / Amazon Prime / Disney+ etc. The growth areas are in commercial customers and mobile. In commercial customers the cable companies have historically not competed well against the telco incumbents but this is now changing as they prove that they can deliver both on the infrastructure requirements but also on the service levels required.
VERITAS FUNDS PLC
34
VERITAS GLOBAL FOCUS FUND / VERITAS GLOBAL REAL RETURN FUND / VERITAS IZOARD FUND
INVESTMENT MANAGER’S REPORT (CONTINUED)
However, it is in the mobile arena that the greatest gains might accrue - the mobile market in the US is approximately double the earnings before interest, taxes, depreciation, and amortization (EBITDA) pool of the cable companies (c.$80bn vs c.$40bn). This is a huge market that Charter (and the other cable companies) can attack and once again, they seem to be serendipitously well placed. Charter and Comcast (another large cable company) have a multiple virtual network operator (MVNO) agreement with Verizon which allows them to piggy back off the Verizon network and thereby offer a full mobile service. However, most mobile usage is data and most of this is done over Wi-Fi. Here the cable companies have a huge advantage with a massive existing Wi-Fi network. Furthermore, they can cherry-pick the areas where they are offloading the most data / calls to Verizon and invest solely in those geographic areas using the latest technology (5G over mid band spectrum most likely). This will reduce the amount they need to pay to Verizon under the terms of their MVNO agreement. As a result of this, the cable companies might prove to be highly disruptive in the mobile industry, pricing their product well below that of the incumbents but at the same time generating a profit (and importantly increasing customer loyalty in broadband). The recent announcement from Charter reducing prices substantially (and well below the incumbents) underpins our confidence in this thesis. Significant success is not built into our models with an expectation of only modest earnings from mobile by 2026 but it is an area that we could well prove to be unduly pessimistic. Even absent success in mobile, Charter still seems good value. With continued growth in broadband subscribers (and some modest pricing benefits), improving capital intensity and continued share buy backs we estimate 2025 free cash flow per share around $70. Valuing the company on a forward multiple of 15x FCF gives an internal rate of return (IRR) of over 12%.
Alphabet is another long-standing holding – we first invested in Alphabet (parent company of Google) in June 2010. Whilst the company is known for Search, Android and YouTube, its primary method of revenue generation is advertising. When we initiated the investment, the company traded c.13x 2011 ex-cash earnings. Since that point both revenues and net income have risen at an impressive 23% CAGR. The market cap has increased at a 25% CAGR. This in itself is an interesting counterpoint to current technology valuations and embedded expectations. Around the time of investment, the market had concerns regarding the transition from Google’s then dominant desktop search business to mobile. One of the issues was during the transition, pricing was far lower on mobile formats. This gave rise to a concern that pricing was getting impacted and mobile was going to eat the lunch of desktop. Google simultaneously faced an existential threat as to whether it would be as strong in the mobile world and Bing had recently launched. In hindsight investors at the time missed 3 points. One was simply the low penetration of online advertising, where Google has dominant market share, which in 2010 was $68bn, 14% of the $475bn global advertising market. Today, that figure stands at $457bn, some 61% of the global advertising market of c.$750bn. The second was the ubiquity of mobile phone usage driven by location, utility, personalisation and preference changes in consumption (e.g. YouTube) culminating in a better product for advertisers, which Google could price for.
The third was Google’s position in the ecosystem as a gateway for intention, which continues to drive network effects. Whilst this all seems obvious today, it wasn’t at the time. However, even with many unknowns you were not having to pay to take that risk, you simply needed to ask whether the business was sustainable. Google in 2010 was a classic ‘fallen angel’ and it should remind us that even the best companies can face doubt and scrutiny (“The Everything Store”, charting the rise of Amazon, is instructive on this). Finally, as an investor, it highlights the continuing importance of patience (opportunities will arise), perspective based on facts (outside view) and a focus on the long term.

VERITAS FUNDS PLC
35
VERITAS GLOBAL FOCUS FUND / VERITAS GLOBAL REAL RETURN FUND / VERITAS IZOARD FUND
INVESTMENT MANAGER’S REPORT (CONTINUED)
Alphabet maintains material competitive advantages and opportunity a decade later. One of the key aspects of Google’s importance is the utility it provides for users. This is hugely understated. However, it can be measurable e.g. consumers being able to ascertain better price transparency or using Google Maps to find a location. It could even be free online guitar lessons on YouTube. The business model largely relies on advertising funding but the benefit/utility to users is significant. The second consideration is intention. Users go to Google when they have a need. Arguably, you share more information about intention with Google than any human. These factors remain enduring and highly valuable to its users. In terms of maintaining this position Google has both a competitive barrier and competitive strength. The competitive barrier is the network effect of search and honing of the algorithms. More data processed produces a more finely tuned algorithm which in turn drives better results and more usage. This is extremely hard to compete against, ‘as good’ on a product which is deemed free to the user simply isn’t good enough. Competitor Bing speaks to the difficulty - it has been in business for 12 years and in 2010 had 3% market share, whilst this has grown over a decade it still resides at c.7%. Whilst this is a barrier, Google implicitly has a significant strength that is not widely articulated - agility. The company, given its scale and platform, can deploy new products or innovations in hours and get statistically relevant information on success or failure of its own product. It can alter or rescind in rapid time. This ability is extremely rare - think of how easily a manufacturing process can be altered and tested - it would take months at best.
Alphabet continues to have opportunities to deliver profitable growth, and this has been exhibited in its 2yr growth CAGR of 23% in high margin search/network revenues, which is its most mature business. It is driven in part by greater and better personalisation that should continue to reflect in pricing (given higher return on advertising spend) and significant parts of the economy that still aren’t digitised (e.g. e-commerce is still only <20% of retail sales in the US). YouTube (growing at a 40% 2yr CAGR), which has taken share from traditional TV viewership whilst also being able to personalise advertising, unlike traditional formats. Over and above the core search business, the company has also invested heavily in its cloud business, autonomous driving and artificial intelligence using profit dollars generated in its core and redeploying them. AI in particular has potentially significant opportunities, where Alphabet is in a leadership position, but at present monetisation is nebulous (it will likely feature in its cloud business). Whilst different in context, there are parallels to 2010 in terms of asking what is being priced in? At present the company trades at 24x ex-cash earnings, but operating profit is impinged by c.10% on investments in Cloud and Other Bets which likely have positive value - effectively this places the core business on <22x, assuming no real positive value for those businesses. Alphabet has the ability to deliver mid-teens revenue and operating profit growth into the medium term which does not look expensive in absolute terms, or especially in the context of the S&P trading at 19x. We would argue given the market opportunity, the inherent competitive strengths of the business, better cost execution and the option value of some other newer businesses that this remains a compelling long-term investment.

VERITAS FUNDS PLC
36
VERITAS GLOBAL EQUITY INCOME FUND
INVESTMENT MANAGER’S REPORT
“Only when the tide goes out do you discover who's been swimming naked.” Warren Buffett
The St. Petersburg paradox was introduced by Nicolaus Bernoulli in 1713 and imagines a coin toss game where a fair coin is flipped until it comes up heads for the first time. At that point the player wins $2n (where n is the number of times tails was flipped before the first heads). While intuition suggests this game does not have a particularly high expected monetary value to the player, the reality is it is extremely valuable (and calculates as having infinite value). The reason for this apparent contradiction is that a single play of the game is unlikely to yield a high payoff and indeed there is a 50% chance you toss heads straight away and get nothing. If, however, you play the game enough times then at some point you can expect a long string of tails, and the power of compounding, with a doubling of value every flip, quickly becomes apparent. Ten tails in a row and the pay out is $1024, 20 tails and it is a $1m, 30 tails is $1bn. How much would you pay to play, and conversely how much would you charge to be the banker and underwrite the game?
The potential for a catastrophic loss makes the danger of this game to the underwriter immediately apparent, and yet we frequently see different versions being played out in the investment world, with the most vivid example in recent memory being the sale of credit default swaps (CDSs) on mortgage bonds during the 2008 credit crisis:
“Greg Lippmann watched his counterparts at Goldman Sachs find and exploit someone else’s willingness to sell huge amounts of cheap insurance on subprime mortgage bonds, and almost immediately guessed the seller’s identity: AIG was now selling credit default swaps [insurance] on subprime bonds for a mere 0.12 percent a year. It was incredible: in exchange for a few million bucks a year, this insurance company was taking the very real risk that $20bn would simply go poof.” Michael Lewis “The Big Short”
One of the most important aspects of our job is to make sure we avoid taking risks for which we are insufficiently compensated. However, the benefit of this prudence may not always be immediately obvious. In his seminal book, “Fooled by Randomness”, Nassim Taleb reminds us that strategies that work within a given cycle may not be the best for long run success through and across cycles. That is to say that strategies like selling CDSs on subprime mortgages, using excess leverage, buying profitless concept stocks and participating in speculative bubbles may be optically rewarding in the short term, but extremely destructive to wealth in the long term.
Through this lens, the Chinese property and construction markets have been concerning for a number of years but are yet to suffer the kind of severe downturn we suspect is inevitable after such a prolonged period of excess. During Q321 concerns about China Evergrande, the World’s most indebted property developer, bubbled up into mainstream consciousness (again!). While the £304bn of gross liabilities on Evergrande’s balance sheet are eye watering, we have little doubt that the Chinese government has the wherewithal to brush this under the carpet and keep the cycle going if it so chooses. Nevertheless, this event provides an important reminder of the scale and importance of the Chinese property market and the extent of the property bubble. As famed short seller Jim Chanos points out in the FT “There are lots of Evergrande’s out there in China but this just happens to be one of the biggest. All of the developers look like this. The whole Chinese property market is on stilts.” So while there is little doubt that China can deal with the solvency of a single developer, there are very significant questions about whether it can deflate and constrain a sector that directly and indirectly contributes greater than 20% of the country’s GDP, without severely negative repercussions.

VERITAS FUNDS PLC
37
VERITAS GLOBAL EQUITY INCOME FUND
INVESTMENT MANAGER’S REPORT (CONTINUED)
The numbers are massive and hard to fathom. According to Rhodium Group, a consultancy cited in the WSJ, “We estimate existing but unsold housing inventory is in the range of 3bn square metres, which is enough to house 30m families, conservatively. The average size of a household in China is just over three people, giving enough space for over 90m people.” Our statistic of choice is steel consumption where China has produced as much steel in the last 5 years as the United States has in the last 50. At 1.4bn people the Chinese population is 4.2x as great as the US at 330m but the level of installed steel per capita in the economy is rapidly catching up, and at the current rate of consumption will exceed the US in the next 6 years or so. Chinese GDP per capita is approximately 20% the size of the US. This rate of consumption cannot carry on forever. We don’t know when it ends, or how, but that when the music stops playing the repercussions will be widely felt and many fortunes lost.
Vivendi
While we try to avoid cyclical and speculative booms that go bust, we are attracted to already depressed end markets and situations where excessive pessimism has taken hold. We are similarly attracted to capital allocators who exploit these capital cycle dynamics to the betterment of their businesses and shareholders. When we made our investment in Vivendi in Q120 our thesis was predicated on the attractiveness of its primary asset Universal Music Group (UMG), but also the benefits we foresaw from being invested alongside Vincent Bollore. With the spin out of 60% of UMG to Vivendi shareholders in September we now have pureplay exposure to both aspects of the original Vivendi thesis.
Universal Music Group itself is a story of countercyclical capital allocation. During the early stages of the transition from physical music sales to what we now know as streaming, the music industry struggled to find an economic business model that could compete with piracy. Recorded music revenues collapsed from $23.6bn in 2001 to $14bn at the nadir in 2014, and record label profits were decimated. Under the stewardship of Sir Lucien Grange, who remains the CEO of UMG today, UMG took the opportunity to consolidate the industry buying up distressed players who were labouring under unmanageable debt loads and becoming forced sellers at what turned out to be the bottom, most famously EMI. The company were not only buying scale, but also an irreplicable catalogue of music copyright.
By 2014, at the dawn of the streaming era, UMG, Warner and Sony controlled 80% of recorded music sales with UMG having amassed 35% market share. No music streaming service could exist without UMG and their immense catalogue of must have content, affording them tremendous bargaining power. Similarly, new artists are extremely unlikely to “make it” without the marketing, investment, and distribution wherewithal of a major label. As Spotify in particular started to gain traction with consumers it became evident to industry participants that the tide was turning and that labels were particularly well placed. John Malone and Masayoshi Son both made unsolicited approaches to Vivendi in the 2012/13 period, offering to buy the UMG asset for $8-10bn. Without Bollore’s ownership we believe Vivendi shareholders would likely have seen this prize asset sold out from under them on the cheap. Instead, long term shareholders have benefited from the appreciation in value of UMG to $50bn today as well as a share count that has shrunk by 15% as Vivendi has sold off non-core assets and bought back its stock cheaply.
With the spin out in September, investors can now appraise UMG separately from Vivendi and value it accordingly. At the current market price, UMG standalone trades meaningfully in excess of the value that was placed on the entirety of Vivendi, including its ownership of UMG, when we initiated our position. While we continue to view UMG as a superior business, with excellent prospects and yielding an internal rate of return (IRR) sufficiently attractive to maintain a position in the fund, we do not think it is the bargain it once was when buried in the Vivendi conglomerate. The Vivendi rump is a different matter.

VERITAS FUNDS PLC
38
VERITAS GLOBAL EQUITY INCOME FUND
INVESTMENT MANAGER’S REPORT (CONTINUED)
In 1981 Vincent Bollore repurchased his bankrupt family business from Edmond de Rothschild for one franc and from these beginnings compounded book value per share at 13%. Today the Bollore holding company has a market value of EUR14.6bn. He is an outstanding capital allocator and operator as opposed to a purely financial investor. He is particularly adept at exploiting deeply undervalued, complex situations which can be simplified and improved over time. He profoundly understands the benefit of depressed valuations when one has the opportunity to buy back, or buy more stock at a discount. There is no doubt that Vincent Bollore was acutely aware of how UMG would be positively appraised by the market on a standalone basis but also how the Vivendi rump would likely suffer once it was left with only the 10% residual stake in UMG that it still owns today, post spin.
Residual Vivendi is a complex jumble of seemingly un-related and difficult to value assets. The company has net cash of EUR 1.5 per share and the 10% stake in UMG is currently valued at EUR 4.4 per share. There are EUR 4.5 per share of other minority holdings in businesses such as Telcom Italia and Lagardere. The main operating assets are Canal+ the leading French Pay-TV business with dominant and lucrative market positions across French speaking Africa and ex colonies, Havas a mid-sized advertising agency, and Editis a book publishing business. Together, these operating assets are worth in the region of EUR 8 per share.
Putting it altogether, we have a net asset value of approximately EUR 18 vs a current market price of EUR 11, and of this EUR 11, EUR 5.9 is explained by net cash and UMG. There are multiple ways in which this special situation could play out but under most scenarios the IRR is attractive. Bollore will most likely seek to magnify the available upside by using the proceeds from asset sales and leverage to buy back stock at a substantial discount to NAV.
There are classic spin out dynamics at work here, with investors neglecting the complex and hard to value rump. There is also distrust of Bollore given the opacity with which he operates. There is no doubt in our mind that he will exploit willing sellers of Vivendi stock to the advantage of those shareholders that choose to remain, but there is very little evidence he has ever abused patient minority shareholders. Indeed, shareholders have typically done well investing alongside Bollore and minorities have typically been treated advantageously often to the detriment of his own interests.
Performance
We closed the year with a dividend that fell 3.6% below 2020 levels in Sterling but was up 7% and 3.5% in $ and EUR respectively. As of Sept 30th the running yield on the fund equated to 3.1% and for comparison the yield currently available from the MSCI World Index is 1.66%. Given the difficult economic environment over the last 18 months we are happy with this outcome particularly given the improvement in the characteristics and quality made to the portfolio through this period.

VERITAS FUNDS PLC
39
VERITAS THIRD EYE GLOBAL EMERGING MARKETS FUND
INVESTMENT MANAGER’S REPORT
China: Another black cat, white cat moment
“It doesn't matter if a cat is black or white, so long as it catches mice.” Deng Xiaoping, 1961
“The profit motive acts as the basic engine of private interest, moving both finance and production capital. The social interests, incarnate in government and the various organizations of civil society, are constantly trying to shape the conditions of growth and the distribution of its toils and of its fruits.” Carlota Perez, ‘Technological Revolutions and Financial Capital: The Dynamics of Bubbles and Golden Ages’
Context
In previous essays, there has been discussions regarding India and how the country has firmly moved its economic and political system into a more inclusive system of governance (compared to the extractive system that existed in the past). With the events of late in China, the ostensible contrast with India couldn’t be starker. China seems to be asserting authoritarian policies that scream ‘extractive’ at first glance. Mention China to group of investors, and ‘is it investable’ is likely the first question that comes up.
The drumbeats of regulation have been building in China for years culminating in the suspension of the IPO of Ant Financial late last year and the fines imposed on Alibaba a few months later. The scrutiny on data security followed, exemplified by Didi’s troubles (and followed by the Chinese government’s influence on ByteDance at the board level). Online games have been compared to opium. And the most draconian measure of them all pertained to the Chinese after-school tutoring industry which was relegated to being a non-profit with one fell swoop. Older debates on the longevity of the VIE1 structure have resurfaced, as have concerns around the sustainability of China’s long-term growth exemplified by the leverage concerns at Evergrande. The market has responded swiftly, re-weighting the probabilities of long-term cash flows of industries ranging from consumer internet to staples.
There are two questions to our mind that frame the debate: are Chinese policies rational and sensible; and are the ‘micro’ impacts on companies and industries reasonably analysable on a case-by-case basis. Having given this some thought and having conducted a post-mortem on our failed investment in New Oriental (the Chinese after-school tutoring company), our view is that the direction of governance and policy is largely (but not entirely) rational and that specific companies and assets in China are investable. The Chinese Internet companies we hold –which have been in the forefront of scrutiny – seem capable of withstanding this storm with better climes over the next 5+ years. There is much blood on the street, and on balance, amid the sound of cannons, we think there is opportunity and have deployed capital selectively into companies in China that we think are ‘distinctive and durable’ where valuations now offer a margin of safety.
Chinese pragmatism
The first question is whether the policies are rational and sensible. A popular framing of the policy question in China is whether the political system is capitalist or communist or ‘capitalism with Chinese characteristics.’ This misses the point (and all nuance). It appears to us that the better framing of the debate is whether China is pragmatic.
1 Variable Interest Entity: a ‘synthetic’ structure which allows participation in the equity of Chinese on-shore entities without actual ownership of the on-shore assets in China. China does not allow actual foreign ownership and control in most of its industries. The structure allows Chinese companies to access to Western capital without giving up control and influence to off-shore shareholders.

VERITAS FUNDS PLC
40
VERITAS THIRD EYE GLOBAL EMERGING MARKETS FUND
INVESTMENT MANAGER’S REPORT (CONTINUED)
Our reading of the policy documents available in the public domain is that what the Chinese government is trying to do is largely rational and sensible, viz.: focus on consumption growth (and avoiding the ‘middle income trap’), fair competition, fair treatment of ‘gig workers’ (which has resulted in hundreds of millions of people getting better insurance protection and pay), data security, primary research into the basic sciences and a focus on next-generation areas like renewable energy and artificial intelligence. All of this strikes us as entirely logical and aligned with positive long-term outcomes for the country.22
What ‘common prosperity’ seems to be designed to achieve is to enshrine some of the very debates being had in the West. Centerstage among these is income and wealth inequality; but so too are questions on how Internet companies should be regulated to promote fairer competition and how consumer data should be protected. Except for the very significant difference that China’s political system moves quickly (seemingly overnight), the underlying principles and objectives don’t seem to be all that different to what is being considered by the rest of the world.
There is also an implicit and strong social contract between those in power and the Chinese people. One of the reasons the Chinese people seem to have confidence in the leadership of the Chinese Communist Party is simply because the effect on their lives and livelihood has been transformational over the last few decades. It seems illogical to expect that even with the recent actions (which have generally been aligned with better outcomes for the population), China will abolish the very system of pragmatism that has driven the incredible economic improvements and standards of living in the past.
Nothing enshrines this profound pragmatism than Deng Xiaoping’s words in 1961: “It doesn't matter if a cat is black or white, so long as it catches mice.” Six decades later, China finds itself in another black cat/white cat moment.
Micro-analysis
The second question for active fundamental investors like us is whether individual companies and industries in China can be analysed to a reasonable degree to gain conviction in their prospects. This is a ‘microeconomic’ question and is case-by-case for each company we analyse. We are neither starry-eyed perma-bulls nor hardened perma-bears and don’t really believe in reductive questions like ‘is the China growth story is over?’ The world is far too complex to use dangerously simplifying assumptions and this is more so in China than elsewhere. We aim to stay rational and respond to facts as logically as we can. In fact, the fund has been designed since inception to avoid taking one-sided stances like these – investors will recall that we can (and do) own companies listed in both emerging and developed markets. We are notbenchmark aware and do not feel the pressure to own companies in certain countries (including China) just because of their weights in commonly followed market indices. In fact, we are prepared to own no companies whatsoever in China.
2 We recommend reading the translated document entitled ‘Proposal of the Central Committee of the Chinese Communist Party on Drawing Up the 14th Five-Year Plan for National Economic and Social Development and Long-Range Objectives for 2030.’ There are 60 (approved) proposals in total spanning a wide range of areas. We humbly submit that had it been written by the government of UK or Singapore, it would have been received as being largely rational and sensible and hardly controversial.

VERITAS FUNDS PLC
41
VERITAS THIRD EYE GLOBAL EMERGING MARKETS FUND
INVESTMENT MANAGER’S REPORT (CONTINUED)
Which brings us to an important distinction: we don’t think of buying ‘China’ (the country) but about buying individual companies run by able management who are listed in China or have a difficult to replicate presence there. We are aware of the many challenges ahead – the two most prominent being aging population (which has a long-term impact on economic growth) and the leverage in the system including in real estate. Our holdings in China are put together entirely bottom-up in a case-by-case manner. For every individual company, we look for bright prospects in terms of distinctiveness (business quality: does it have a competitive advantage that clears the ‘build vs. buy hurdle’) and duration (runway for growth and longevity). Our belief is that over the very long term, the micro overwhelms the macro (though in the short term, it is the exact opposite).
Potential aftershocks
It is worth mentioning that we have been considering the impact of regulation on Chinese companies for several years now, well before it became a popular conversation topic in the mainstream. Investors may recall that we wrote in the summer of ’20 re: Tencent that “a social network as dominant as this, with a richness of data unsurpassed in scale and scope operating in a centrally planned economy like China, will sooner or later invite some form of regulation.” In fact, our initial assessment on Tencent, Alibaba and Facebook, was that “the sources of pessimism ascribed by the market can most rationally be explained by regulatory risks (as discussed above) and a threat to the longevity of these platforms (duration of above-normal returns or the competitive advantage period).” We judged the risks to be manageable and thought we were being compensated by the attractive margin of safety in the price.
Fast forward to today and a key aspect to consider looking forward is whether Chinese entrepreneurship is dead and whether the dynamism of Chinese companies is a thing of the past. This is a profound question and is entirely ‘micro.’ Based on our observations of companies operating in the country, what global multi-nationals have spoken about in terms of their lived experience and the long history of entrepreneurship in China (including Chinese diaspora internationally), we would hazard a guess that the hunger and drive of able management teams to leave a mark on the world will remain uninhibited, irrespective of regulation or taxation. This has been as true in the US as it is in China. We find it hard to believe that the next generation of Mark Zuckerberg’s and Jack Ma’s will suddenly stop working hard just because of regulatory or tax interventions by the government.
The effects might not unilaterally be negative either for the affected industries, like Internet businesses. There is a likely capital cycle that could be put in motion allowing the larger Internet companies to be advantaged both as capital suppliers as well as the incumbents. Let us not forget that the incumbents have the requisite cash flows to reinvest into their ecosystems as well as offer better pay and benefits to employees and other stakeholders – which we regard as a form of regulatory take. While we are not explicitly expecting a major benefit due to capital retrenchment, it is not beyond the realm of possibility.
China is also integrated with global supply chains and manufacturing and there is no close substitute for this physical capital investment at the scale and sophistication that is equivalent to what China offers. This means that the most plausible scenario is that China will remain accessible and integrated into the global markets (esp. given the renminbi is not internationalized like the US dollar). The logical incentives are strong and the alternatives simply not feasible from a Chinse perspective.

VERITAS FUNDS PLC
42
VERITAS THIRD EYE GLOBAL EMERGING MARKETS FUND
INVESTMENT MANAGER’S REPORT (CONTINUED)
This naturally raises the question of how well foreign capital will be treated. There is certainly a risk of opaqueness here, given the precedence set by the draconian interventions in the Chinse after-school tutoring space (which was deemed non-profit overnight), however despite our grave misjudgement here, we think that there was no evidence here of ill-will towards foreign capital per se. The maligned VIE structure favours Chinese companies since it is set up in a way that there is an asymmetry that allows Chinese companies to access outside capital without giving up control; and there is no logical incentive for China to abrogate this. This is not to say it will never happen or that we know how or when it might happen, but simply that the incentives (and hence odds) favour the structure to remain in place. This is especially more so as China is now a prominent player in the world stage with large capitalization companies rivalling any in Europe or the US.
This is not to say there is no risk at all – there is certainly significant opaqueness in how the policies, governance and regulations are set and implemented. And the speed at which this is done is unlike anything developed market participants are used to (where there is usually a prolonged ‘consultation’ period with stakeholders as well as case law and judicial recourse). We are keenly risk-aware and look for the lowest possible risk (business quality, management quality and position sizing where appropriate with the added advantage that we do not need to hold any Chinese companies at all if we think the risks are too high). This is an area of risk we are prepared to accept when investing in China, given the other factors discussed about.
Closing thoughts
It is a cliché to say that China is different – but that doesn’t make it untrue. China is indeed a very large and very complex country with a socio-economic system of governance that is unique compared to anything in the developed markets of the West – both in its scale of influence as well as in its demonstrable success to the Chinese people over the last few decades. We do not think anyone (certainly not us!) can forecast with precision what exactly future policies could mean, what circumstances in the Chinese Communist Party they would be conceived under, or to how exactly the future will unfold.
Our analysis of the observable facts (as opposed to breathless, sensationalist and reductive commentary in the press) suggests that China is just being pragmatic and responding to the same questions that the rest of the world is grappling with. If the facts change, we are prepared to change our mind but for the moment, we believe that selective investments in high quality companies in China remains a rational and attractive proposition and on balance, the current environment of panic presents an opportunity for long-term minded investors. The sound of cannons is deafening.

VERITAS FUNDS PLC
43
VERITAS ASIAN FUND
SCHEDULE OF INVESTMENTS AS AT 30 SEPTEMBER 2021
Holdings Financial assets at fair value through profit or loss Fair Value
USD % of Net
Asset Value
Equities (85.38%) (September 2020: 89.57%) Australia (8.15%) (September 2020: 16.28%)
3,018,431 Afterpay Ltd. 264,608,826 3.22565,000 Cochlear Ltd. 89,902,346 1.09759,759 CSL Ltd. 160,903,358 1.96
9,855,000 Goodman Group 154,299,046 1.88 669,713,576 8.15 China (30.24%) (September 2020: 44.08%)
3,315,026 Alibaba Group Holding Ltd. 60,575,935 0.7418,224,539 Centre Testing International Group Co. Ltd. 71,568,166 0.8713,079,000 Country Garden Services Holdings Co. Ltd. 103,242,220 1.266,812,112 Guangzhou Kingmed Diagnostics Group Co. Ltd. 108,097,684 1.323,999,982 Hangzhou First Applied Material Co. Ltd. 78,583,470 0.96
27,670,000 Jinxin Fertility Group Ltd. 41,195,853 0.507,420,000 JW Cayman Therapeutics Co. Ltd. 14,240,178 0.171,244,256 Kweichow Moutai Co. Ltd. 352,803,641 4.30
15,319,667 LONGi Green Energy Technology Co. Ltd. 195,768,444 2.3811,310,130 Midea Group Co. Ltd. 121,959,792 1.4829,806,511 Shenzhen Inovance Technology Co. Ltd. 291,045,293 3.5414,439,507 Sungrow Power Supply Co. Ltd. 331,981,135 4.052,791,700 Tencent Holdings Ltd. 165,501,281 2.017,365,530 WuXi AppTec Co. Ltd. 174,386,398 2.129,295,000 Wuxi Biologics Cayman, Inc. 150,983,378 1.84
20,499,706 Wuxi Lead Intelligent Equipment Co. Ltd. 221,783,696 2.70 2,483,716,564 30.24 Hong Kong (Nil) (September 2020: 2.62%) India (22.63%) (September 2020: 11.19%)
3,824,329 Apollo Hospitals Enterprise Ltd. 230,899,772 2.812,500,000 Asian Paints Ltd. 109,280,590 1.33
17,964,500 HDFC Bank Ltd. 386,008,949 4.706,500,000 Hindustan Unilever Ltd. 236,592,907 2.881,271,012 Info Edge India Ltd. 110,126,120 1.348,500,000 Kotak Mahindra Bank Ltd. 229,655,451 2.809,833,981 Max Healthcare Institute Ltd. 47,634,743 0.58
396,187 Nestle India Ltd. 103,790,026 1.26

VERITAS FUNDS PLC
44
VERITAS ASIAN FUND
SCHEDULE OF INVESTMENTS AS AT 30 SEPTEMBER 2021
(CONTINUED)
Holdings Financial assets at fair value through profit or loss Fair Value
USD % of Net
Asset Value
Equities (85.38%) (September 2020: 89.57%) (continued) India (22.63%) (September 2020: 11.19%) (continued)
3,000,000 Reliance Industries Ltd. 101,818,733 1.244,133,071 Tata Consultancy Services Ltd. 210,226,886 2.563,200,000 Titan Co. Ltd. 93,198,882 1.13
1,859,233,059 22.63 Singapore (4.21%) (September 2020: 1.54%)
1,084,716 Sea Ltd. 345,677,295 4.21 345,677,295 4.21 South Korea (13.09%) (September 2020: 6.30%)
1,000,000 Coupang, Inc. 27,855,000 0.34471,700 LG Chem Ltd. 309,353,927 3.77
7,520,000 Samsung Electronics Co. Ltd. 470,952,703 5.73440,000 Samsung SDI Co. Ltd. 267,010,135 3.25
1,075,171,765 13.09 Taiwan (7.06%) (September 2020: 5.19%)
27,822,100 Taiwan Semiconductor Manufacturing Co. Ltd. 579,699,900 7.06 579,699,900 7.06 Thailand (Nil) (September 2020: 1.10%) United States (Nil) (September 2020: 1.27%)
Total Equities (85.38%) (September 2020: 89.57%) 7,013,212,159 85.38
Equity Warrants (1.30%) (September 2020: Nil)* Luxembourg (1.30%) (September 2020: Nil)
4,638,968 Sungrow Power Supply Co. Ltd. (Warrant 21/04/2022) 106,520,781 1.30 106,520,781 1.30
Total Equity Warrants (1.30%) (September 2020: Nil) 106,520,781 1.30
*The counterparty for the warrants is UBS.

VERITAS FUNDS PLC
45
VERITAS ASIAN FUND
SCHEDULE OF INVESTMENTS AS AT 30 SEPTEMBER 2021
(CONTINUED)
Holdings Financial assets at fair value through profit or loss Fair Value
USD % of Net
Asset Value
Collective Investment Schemes (8.88%) (September 2020: 8.06%*) Luxembourg (8.88%) (September 2020: 8.06%)
365,103,440 JP Morgan US Dollar Liquidity Fund 365,103,440 4.44365,133,030 Morgan Stanley US Dollar Liquidity Fund 365,133,030 4.44
730,236,470 8.88
Total Collective Investment Schemes (8.88%) (September 2020: 8.06%) 730,236,470 8.88
Total Financial assets at Fair Value through Profit or Loss (95.56%) (September 2020: 97.63%) 7,849,969,410 95.56
Net Financial assets and liabilities at Fair Value through Profit or Loss (95.56%) (September 2020: 97.63%) 7,849,969,410 95.56
Other Net Assets (4.44%) (September 2020: 2.37%) 364,530,187 4.44
Net assets attributable to Holders of Redeemable Participating Shares 8,214,499,597 100.00
% of % of Total Assets Total Assets
Analysis of Total Assets 30 September
202130 September
2020
Transferable securities admitted to official stock exchange listing 86.14% 89.15%
Collective Investment Schemes 8.83% 8.02% Other current Assets 5.03% 2.83% Total Assets 100.00% 100.00%
* Included in Cash and cash equivalents in the Statement of Financial Positions as of 30 September 2020.

VERITAS FUNDS PLC
46
VERITAS GLOBAL FOCUS FUND
SCHEDULE OF INVESTMENTS AS AT 30 SEPTEMBER 2021
Holdings Financial assets at fair value through profit or loss Fair Value
USD % of Net
Asset Value
Equities (93.06%) (September 2020: 99.12%) Australia (3.49%) (September 2020: 6.01%)
136,135 Cochlear Ltd. 21,661,692 0.593,615,252 Sonic Healthcare Ltd. 105,973,706 2.90
127,635,398 3.49 Canada (3.87%) (September 2020: 4.25%)
2,175,315 Canadian Pacific Railway Ltd. 141,558,624 3.87 141,558,624 3.87 China (1.99%) (September 2020: 3.99%)
490,105 Alibaba Group Holding Ltd. 72,555,144 1.99 72,555,144 1.99 France (9.23%) (September 2020: 11.34%)
614,509 Airbus SE 81,986,760 2.24942,953 Safran S.A. 119,829,398 3.28
1,296,100 Vinci S.A. 135,445,718 3.71 337,261,876 9.23 Hong Kong (–%) (September 2020: –%)
9,421,780 RREEF China Commercial Trust # – – – – Spain (2.84%) (September 2020: 3.06%)
599,922 Aena SME S.A. 103,822,626 2.84 103,822,626 2.84 Sweden (Nil) (September 2020: 2.96%) Switzerland (Nil) (September 2020: 1.97%) United Kingdom (8.17%) (September 2020: 8.97%)
19,457,108 BAE Systems PLC 148,332,682 4.062,778,073 Unilever PLC 150,220,712 4.11
298,553,394 8.17 # Unquoted security

VERITAS FUNDS PLC
47
VERITAS GLOBAL FOCUS FUND
SCHEDULE OF INVESTMENTS AS AT 30 SEPTEMBER 2021
(CONTINUED)
Holdings Financial assets at fair value through profit or loss Fair Value
USD % of Net
Asset Value
Equities (93.06%) (September 2020: 99.12%) (continued) United States (63.47%) (September 2020: 56.57%)
106,424 Alphabet, Inc. 284,408,030 7.7943,900 Amazon.com, Inc. 144,230,816 3.95
1,516,882 Baxter International, Inc. 121,980,066 3.34445,034 Becton Dickinson & Co. 109,416,059 2.99816,500 Catalent, Inc. 108,631,243 2.97288,004 Charter Communications, Inc. 209,459,549 5.73255,579 Cooper Cos, Inc. 105,637,190 2.89931,300 CoStar Group, Inc. 80,124,396 2.19
1,546,163 CVS Health Corp. 131,153,276 3.59404,226 Facebook, Inc. 137,149,840 3.75
1,192,100 Fiserv, Inc. 129,354,771 3.5490,003 Illumina, Inc. 36,489,916 1.00
792,709 Intercontinental Exchange, Inc. 91,030,738 2.49309,648 Mastercard, Inc. 107,616,614 2.95556,000 Microsoft Corp. 156,627,980 4.29247,900 Moody's Corp. 88,005,740 2.41240,222 Thermo Fisher Scientific, Inc. 137,203,996 3.75359,681 UnitedHealth Group, Inc. 140,543,552 3.85
2,319,063,772 63.47
Total Equities (93.06%) (September 2020: 99.12%) 3,400,450,834 93.06
Collective Investment Schemes (5.64%) (September 2020: –%*) Luxembourg (5.64%) (September 2020: –%)
103,006,849 JP Morgan US Dollar Liquidity Fund 103,006,849 2.82103,039,085 Morgan Stanley US Dollar Liquidity Fund 103,039,085 2.82
206,045,934 5.64
Total Collective Investment Schemes (5.64%) (September 2020: –%) 206,045,934 5.64
* Included in Cash and cash equivalents in the Statement of Financial Positions as of 30 September 2020.

VERITAS FUNDS PLC
48
VERITAS GLOBAL FOCUS FUND
SCHEDULE OF INVESTMENTS AS AT 30 SEPTEMBER 2021
(CONTINUED)
UnrealisedCurrency Amount Currency Amount Maturity Gain/(Loss) % of Net Purchased Purchased Sold Sold Counterparty Date USD Assets Unrealised Gain/(Loss) on Forward Currency Contracts ((0.01)%) (September 2020: (0.03)%)
NOK 38,579,919 EUR 3,750,895 HSBC 06/10/2021 34,907 –NOK 9,420,008 AUD 1,468,878 HSBC 06/10/2021 12,322 –NOK 10,904,960 GBP 911,943 HSBC 06/10/2021 11,435 –USD 305,011 NOK 2,642,410 HSBC 06/10/2021 5,381 –USD 346,149 NOK 3,006,703 HSBC 06/10/2021 5,211 –USD 526,076 NOK 4,609,991 HSBC 06/10/2021 3,337 –EUR 79,556 NOK 805,465 HSBC 06/10/2021 712 –AUD 59,136 NOK 369,185 HSBC 06/10/2021 645 –AUD 68,670 NOK 430,985 HSBC 06/10/2021 490 –NOK 193,839 AUD 30,077 HSBC 06/10/2021 360 –EUR 39,059 NOK 395,902 HSBC 06/10/2021 299 –AUD 22,623 NOK 141,717 HSBC 06/10/2021 192 –GBP 28,192 NOK 332,459 HSBC 06/10/2021 175 –NOK 168,436 GBP 14,098 HSBC 06/10/2021 160 –AUD 16,012 NOK 100,360 HSBC 06/10/2021 129 –NOK 187,690 AUD 29,474 HSBC 06/10/2021 97 –GBP 8,997 NOK 105,838 HSBC 06/10/2021 85 –AUD 14,741 NOK 92,804 HSBC 06/10/2021 73 –NOK 197,487 GBP 16,618 HSBC 06/10/2021 69 –GBP 8,868 NOK 104,485 HSBC 06/10/2021 66 –GBP 8,772 NOK 103,383 HSBC 06/10/2021 61 –AUD 57,278 NOK 362,584 HSBC 06/10/2021 58 –NOK 245,637 GBP 20,710 HSBC 06/10/2021 31 –NOK 778,235 EUR 76,274 HSBC 06/10/2021 (3) –NOK 131,481 AUD 20,823 HSBC 06/10/2021 (59) –NOK 124,680 AUD 19,816 HSBC 06/10/2021 (106) –GBP 10,190 NOK 121,822 HSBC 06/10/2021 (125) –NOK 165,108 GBP 14,036 HSBC 06/10/2021 (134) –GBP 10,246 NOK 122,759 HSBC 06/10/2021 (155) –AUD 22,985 NOK 147,253 HSBC 06/10/2021 (175) –AUD 23,153 NOK 148,725 HSBC 06/10/2021 (222) –NOK 146,689 AUD 23,457 HSBC 06/10/2021 (228) –EUR 38,702 NOK 396,985 HSBC 06/10/2021 (237) –EUR 42,252 NOK 434,483 HSBC 06/10/2021 (381) –NOK 1,752,415 EUR 172,078 HSBC 06/10/2021 (383) –EUR 106,543 NOK 1,090,548 HSBC 06/10/2021 (391) –EUR 49,899 NOK 512,599 HSBC 06/10/2021 (392) –NOK 664,444 EUR 65,578 HSBC 06/10/2021 (531) –NOK 413,930 EUR 41,137 HSBC 06/10/2021 (659) –GBP 79,957 NOK 954,263 HSBC 06/10/2021 (792) –

VERITAS FUNDS PLC
49
VERITAS GLOBAL FOCUS FUND
SCHEDULE OF INVESTMENTS AS AT 30 SEPTEMBER 2021
(CONTINUED)
UnrealisedCurrency Amount Currency Amount Maturity Gain/(Loss) % of Net Purchased Purchased Sold Sold Counterparty Date USD Assets Unrealised Gain/(Loss) on Forward Currency Contracts ((0.01)%) (September 2020: (0.03)%) (continued)
NOK 617,421 EUR 61,443 HSBC 06/10/2021 (1,079) –NOK 2,062,707 USD 238,588 HSBC 06/10/2021 (4,692) –NOK 1,950,601 USD 227,611 HSBC 06/10/2021 (6,428) –NOK 2,134,926 USD 248,702 HSBC 06/10/2021 (6,617) –NOK 186,739,943 USD 21,525,514 HSBC 06/10/2021 (350,577) (0.01)
Total Unrealised Gain on Forward Currency Contracts (–%) (September 2020: –%) # 76,295 –Total Unrealised Loss on Forward Currency Contracts ((0.01)%) (September 2020: (0.03)%) # (374,366) (0.01)
Total Financial assets at Fair Value through Profit or Loss (98.70%) (September 2020: 99.12%) 3,606,573,063 98.70
Total Financial liabilities at Fair Value through Profit or Loss ((0.01)%) (September 2020: (0.03)%) (374,366) (0.01)
Net Financial assets and liabilities at Fair Value through Profit or Loss (98.69%) (September 2020: 99.09%) 3,606,198,697 98.69
Other Net Assets (1.31%) (September 2020: 0.91%) 47,798,837 1.31
Net assets attributable to Holders of Redeemable Participating Shares 3,653,997,534 100.00
% of % of Total Assets Total Assets
Analysis of Total Assets 30 September
202130 September
2020
Transferable securities admitted to official stock exchange listing 92.83% 97.76%
Collective Investment Schemes 5.63% –% Financial derivative instruments traded over-the-counter –% –% Other current Assets 1.54% 2.24% Total Assets 100.00% 100.00%
# Forward Contracts are held at Class level for hedging.

VERITAS FUNDS PLC
50
VERITAS GLOBAL EQUITY INCOME FUND
SCHEDULE OF INVESTMENTS AS AT 30 SEPTEMBER 2021
Holdings Financial assets at fair value through profit or loss Fair Value
GBP % of Net
Asset Value
Equities (97.57%) (September 2020: 97.94%) Australia (3.74%) (September 2020: 4.04%)
429,833 Sonic Healthcare Ltd. 9,344,516 3.74 9,344,516 3.74 France (13.47%) (September 2020: 17.17%)
64,600 Safran S.A. 6,088,399 2.43144,600 Sanofi 10,328,359 4.14108,200 Vinci S.A. 8,385,932 3.35947,600 Vivendi SE 8,888,148 3.55
33,690,838 13.47 Hong Kong (2.30%) (September 2020: 3.03%)
7,810,537 Fortune Real Estate Investment Trust 5,755,718 2.309,738,050 RREEF China Commercial Trust # – –
5,755,718 2.30 Netherlands (4.53%) (September 2020: Nil)
570,700 Universal Music Group NV 11,336,260 4.53 11,336,260 4.53 Singapore (5.52%) (September 2020: 9.02%)
2,851,045 Ascendas Real Estate Investment Trust 4,680,305 1.878,306,635 NetLink NBN Trust 4,503,821 1.80
328,000 United Overseas Bank Ltd. 4,629,220 1.85 13,813,346 5.52 Spain (6.98%) (September 2020: 4.36%)
57,900 Aena SME S.A. 7,431,442 2.97366,100 Industria de Diseno Textil S.A. 10,014,519 4.01
17,445,961 6.98 Sweden (4.41%) (September 2020: 3.80%)
1,323,500 Svenska Handelsbanken AB 11,024,578 4.41 11,024,578 4.41 # Unquoted security

VERITAS FUNDS PLC
51
VERITAS GLOBAL EQUITY INCOME FUND
SCHEDULE OF INVESTMENTS AS AT 30 SEPTEMBER 2021
(CONTINUED)
Holdings Financial assets at fair value through profit or loss Fair Value
GBP % of Net
Asset Value
Equities (97.57%) (September 2020: 97.94%) (continued) Switzerland (7.04%) (September 2020: 5.60%)
22,300 Dormakaba Holding AG 12,042,597 4.8162,200 Nestle S.A. 5,572,151 2.23
17,614,748 7.04 United Kingdom (23.60%) (September 2020: 27.58%)
2,685,200 BAE Systems PLC 15,182,121 6.07341,300 British American Tobacco PLC 8,888,305 3.55320,900 Diageo PLC 11,570,852 4.63
49,000 Ferguson PLC 5,065,375 2.0350,900 Reckitt Benckiser Group PLC 2,968,488 1.19
382,200 Unilever PLC 15,327,599 6.13 59,002,740 23.60 United States (25.98%) (September 2020: 23.34%)
359,500 Cisco Systems, Inc. 14,508,245 5.80227,300 Coca-Cola Co. 8,842,675 3.54120,900 CVS Health Corp. 7,605,846 3.04
80,100 General Dynamics Corp. 11,648,020 4.66200,100 MSC Industrial Direct Co., Inc. 11,901,969 4.76148,500 Philip Morris International, Inc. 10,440,210 4.18
64,946,965 25.98
Total Equities (97.57%) (September 2020: 97.94%) 243,975,670 97.57
Collective Investment Schemes (0.11%) (September 2020: 0.09%*) Luxembourg (0.11%) (September 2020: 0.09%)
118,181 JP Morgan GBP Liquidity Fund 118,181 0.05148,027 Morgan Stanley GBP Liquidity Fund 148,027 0.06
266,208 0.11
Total Collective Investment Schemes (0.11%) (September 2020: 0.09%) 266,208 0.11
* Included in Cash and cash equivalents in the Statement of Financial Positions as of 30 September 2020.

VERITAS FUNDS PLC
52
VERITAS GLOBAL EQUITY INCOME FUND
SCHEDULE OF INVESTMENTS AS AT 30 SEPTEMBER 2021
(CONTINUED)
UnrealisedCurrency Amount Currency Amount Maturity Gain/(Loss) % of Net Purchased Purchased Sold Sold Counterparty Date GBP Assets Unrealised Gain/(Loss) on Forward Currency Contracts (0.01%) (September 2020: 0.02%)
USD 1,922,494 GBP 1,394,876 HSBC 06/10/2021 36,186 0.01USD 22,458 GBP 16,240 HSBC 06/10/2021 477 –USD 19,587 GBP 14,255 HSBC 06/10/2021 325 –GBP 19,944 USD 27,650 HSBC 06/10/2021 (638) –
Total Unrealised Gain on Forward Currency Contracts (0.01%) (September 2020: 0.02%) # 36,988 0.01Total Unrealised Loss on Forward Currency Contracts (–%) (September 2020: –%) # (638) –
Total Financial assets at Fair Value through Profit or Loss (97.69%) (September 2020: 98.05%) 244,278,866 97.69
Total Financial liabilities at Fair Value through Profit or Loss (–%) (September 2020: –%) (638) –
Net Financial assets and liabilities at Fair Value through Profit or Loss (97.69%) (September 2020: 98.05%) 244,278,228 97.69
Other Net Assets (2.31%) (September 2020: 1.95%) 5,765,616 2.31
Net assets attributable to Holders of Redeemable Participating Shares 250,043,844 100.00
% of % of Total Assets Total Assets
Analysis of Total Assets 30 September
202130 September
2020
Transferable securities admitted to official stock exchange listing 94.55% 95.30%
Collective Investment Schemes 0.11% 0.08% Financial derivative instruments traded over-the-counter 0.01% 0.02% Other current Assets 5.33% 4.60% Total Assets 100.00% 100.00%
# Forward Contracts are held at Class level for hedging.

VERITAS FUNDS PLC
53
VERITAS CHINA FUND
SCHEDULE OF INVESTMENTS AS AT 30 SEPTEMBER 2021
Holdings Financial assets at fair value through profit or loss Fair Value
USD % of Net
Asset Value
Equities (67.99%) (September 2020: 69.45%) China (63.27%) (September 2020: 67.94%)
300,000 By-health Co. Ltd. 1,312,442 2.06100,000 Centre Testing International Group Co. Ltd. 392,702 0.62289,879 Chongqing Fuling Zhacai Group Co. Ltd. 1,381,798 2.17100,000 Country Garden Services Holdings Co. Ltd. 789,374 1.24959,992 Estun Automation Co. Ltd. 3,261,206 5.12100,000 Gree Electric Appliances, Inc. of Zhuhai 600,480 0.94429,978 Guangzhou GRG Metrology & Test Co. Ltd. 1,992,329 3.13191,956 Guangzhou Kingmed Diagnostics Group Co. Ltd. 3,046,045 4.78100,000 Hangzhou First Applied Material Co. Ltd. 1,964,596 3.09700,000 Jinxin Fertility Group Ltd. 1,042,179 1.64300,000 JW Cayman Therapeutics Co. Ltd. 575,748 0.90
8,790 Kweichow Moutai Co. Ltd. 2,489,225 3.91179,998 Midea Group Co. Ltd. 1,940,961 3.05219,971 Shandong Sinocera Functional Material Co. Ltd. 1,402,682 2.20375,000 Shenzhen Inovance Technology Co. Ltd. 3,661,683 5.75
50,000 Skshu Paint Co. Ltd. 775,023 1.22179,999 Sungrow Power Supply Co. Ltd. 4,138,387 6.50
84,000 WuXi AppTec Co. Ltd. 1,988,785 3.12110,000 Wuxi Biologics Cayman, Inc. 1,786,786 2.81149,998 Wuxi Lead Intelligent Equipment Co. Ltd. 1,622,809 2.55
30,000 Yunnan Energy New Material Co. Ltd. 1,302,169 2.04799,975 Zhejiang Sanhua Intelligent Controls Co. Ltd. 2,821,728 4.43
40,289,137 63.27 Hong Kong (4.72%) (September 2020: 1.51%)
650,000 JS Global Lifestyle Co. Ltd. 1,510,473 2.37500,000 Xinyi Glass Holdings Ltd. 1,494,929 2.35
3,005,402 4.72
Total Equities (67.99%) (September 2020: 69.45%) 43,294,539 67.99

VERITAS FUNDS PLC
54
VERITAS CHINA FUND
SCHEDULE OF INVESTMENTS AS AT 30 SEPTEMBER 2021
(CONTINUED)
Holdings Financial assets at fair value through profit or loss Fair Value
USD % of Net
Asset Value
Bond (0.87%) (September 2020: 1.38%) China (0.87%) (September 2020: 1.38%)
583,000 Trip.com Group Ltd. 1.250% 15/09/2022 556,403 0.87 556,403 0.87
Total Bond (0.87%) (September 2020: 1.38%) 556,403 0.87
Equity Warrants (5.71%) (September 2020: Nil)* Singapore (5.71%) (September 2020: Nil)
1,000,000 Zhejiang Shuanghuan Driveline Co. Ltd. (Warrant 04/08/2026) 3,635,787 5.71 3,635,787 5.71
Total Equity Warrants (5.71%) (September 2020: Nil) 3,635,787 5.71
Collective Investment Schemes (9.43%) (September 2020: 9.32%**) Luxembourg (9.43%) (September 2020: 9.32%)
3,000,928 JP Morgan US Dollar Liquidity Fund 3,000,928 4.713,001,050 Morgan Stanley US Dollar Liquidity Fund 3,001,050 4.72
6,001,978 9.43
Total Collective Investment Schemes (9.43%) (September 2020: 9.32%) 6,001,978 9.43
*The counterparty for the warrants is CLSA. ** Included in Cash and cash equivalents in the Statement of Financial Positions as of 30 September 2020.

VERITAS FUNDS PLC
55
VERITAS CHINA FUND
SCHEDULE OF INVESTMENTS AS AT 30 SEPTEMBER 2021
(CONTINUED)
Unrealised Currency Amount Currency Amount Maturity Gain/(Loss) % of Net Purchased Purchased Sold Sold Counterparty Date USD Assets Unrealised Gain/(Loss) on Forward Currency Contracts (–%) (September 2020: Nil)
USD 6,026 CNH 38,880 Brown Brothers Harriman 12/10/2021 22 –
Total Unrealised Gain on Forward Currency Contracts (–%) (September 2020: Nil) 22 –
Total Financial assets at Fair Value through Profit or Loss (84.00%) (September 2020: 80.15%) 53,488,729 84.00
Net Financial assets and liabilities at Fair Value through Profit or Loss (84.00%) (September 2020: 80.15%) 53,488,729 84.00
Other Net Assets (16.00%) (September 2020: 19.85%) 10,189,006 16.00
Net assets attributable to Holders of Redeemable Participating Shares 63,677,735 100.00
% of % of Total Assets Total Assets
Analysis of Total Assets 30 September
202130 September
2020
Transferable securities admitted to official stock exchange listing 67.91% 68.67%
Other transferable securities of the type referred to in Regulations 68 (1)(a), (b) and (c) 6.58% 1.36%
Collective Investment Schemes 9.42% 9.21% Financial derivative instruments traded over-the-counter –% –% Other current Assets 16.09% 20.76% Total Assets 100.00% 100.00%

VERITAS FUNDS PLC
56
VERITAS GLOBAL REAL RETURN FUND
SCHEDULE OF INVESTMENTS AS AT 30 SEPTEMBER 2021
Holdings Financial assets at fair value through profit or loss Fair Value
GBP % of Net
Asset Value
Equities (92.62%) (September 2020: 94.36%) Australia (2.83%) (September 2020: 5.82%)
349,449 Sonic Healthcare Ltd. 7,596,978 2.83 7,596,978 2.83 Canada (4.84%) (September 2020: 4.95%)
216,900 Canadian Pacific Railway Ltd. 10,468,178 3.9026,100 Franco-Nevada Corp. 2,514,183 0.94
12,982,361 4.84 China (1.98%) (September 2020: 4.05%)
48,400 Alibaba Group Holding Ltd. 5,314,003 1.98 5,314,003 1.98 France (8.72%) (September 2020: 11.36%)
55,100 Airbus SE 5,452,107 2.0387,600 Safran S.A. 8,256,096 3.08
125,100 Vinci S.A. 9,695,748 3.61 23,403,951 8.72 Hong Kong (–%) (September 2020: –%)
4,654,000 RREEF China Commercial Trust # – – – – Spain (2.83%) (September 2020: 3.05%)
59,110 Aena SME S.A. 7,586,745 2.83 7,586,745 2.83 Sweden (Nil) (September 2020: 2.58%) Switzerland (Nil) (September 2020: 1.96%) United Kingdom (8.07%) (September 2020: 8.23%)
1,908,700 BAE Systems PLC 10,791,790 4.02271,186 Unilever PLC 10,875,537 4.05
21,667,327 8.07 # Unquoted security

VERITAS FUNDS PLC
57
VERITAS GLOBAL REAL RETURN FUND
SCHEDULE OF INVESTMENTS AS AT 30 SEPTEMBER 2021
(CONTINUED)
Holdings Financial assets at fair value through profit or loss Fair Value
GBP % of Net
Asset Value
Equities (92.62%) (September 2020: 94.36%) (continued) United States (63.35%) (September 2020: 52.36%)
10,450 Alphabet, Inc. 20,711,708 7.724,300 Amazon.com, Inc. 10,477,541 3.90
166,215 Baxter International, Inc. 9,912,989 3.6942,300 Becton Dickinson & Co. 7,713,040 2.8779,900 Catalent, Inc. 7,883,929 2.9428,199 Charter Communications, Inc. 15,210,122 5.6725,069 Cooper Cos, Inc. 7,684,685 2.8691,100 CoStar Group, Inc. 5,812,874 2.17
151,600 CVS Health Corp. 9,537,190 3.5537,500 Facebook, Inc. 9,436,255 3.52
120,300 Fiserv, Inc. 9,681,279 3.6110,475 Illumina, Inc. 3,149,686 1.1777,800 Intercontinental Exchange, Inc. 6,625,997 2.4730,100 Mastercard, Inc. 7,758,449 2.8954,600 Microsoft Corp. 11,407,345 4.2524,400 Moody's Corp. 6,424,239 2.3923,800 Thermo Fisher Scientific, Inc. 10,081,573 3.7636,300 UnitedHealth Group, Inc. 10,519,556 3.92
170,028,457 63.35
Total Equities (92.62%) (September 2020: 94.36%) 248,579,822 92.62
Collective Investment Schemes (–%) (September 2020: –%*) Luxembourg (–%) (September 2020: –%)
1 JP Morgan GBP Liquidity Fund 1 –635 Morgan Stanley GBP Liquidity Fund 635 –
636 –
Total Collective Investment Schemes (–%) (September 2020: –%) 636 –
* Included in Cash and cash equivalents in the Statement of Financial Positions as of 30 September 2020.

VERITAS FUNDS PLC
58
VERITAS GLOBAL REAL RETURN FUND
SCHEDULE OF INVESTMENTS AS AT 30 SEPTEMBER 2021
(CONTINUED)
UnrealisedCurrency Amount Currency Amount Maturity Gain/(Loss) % of Net Purchased Purchased Sold Sold Counterparty Date GBP Assets Unrealised Gain/(Loss) on Forward Currency Contracts (0.38%) (September 2020: 1.15%)
USD 29,742,775 GBP 21,580,041 HSBC 06/10/2021 559,835 0.22USD 20,249,101 GBP 14,691,851 HSBC 06/10/2021 381,140 0.14USD 3,038,716 GBP 2,204,758 HSBC 06/10/2021 57,197 0.02EUR 24,989,558 GBP 21,496,710 HSBC 06/10/2021 25,381 0.01EUR 3,094,336 GBP 2,653,885 Brown Brothers Harriman 06/10/2021 11,091 0.01EUR 10,745,950 GBP 9,243,963 HSBC 06/10/2021 10,914 0.01EUR 1,372,749 GBP 1,173,364 Brown Brothers Harriman 06/10/2021 8,907 –USD 318,929 GBP 230,625 HSBC 06/10/2021 6,780 –USD 496,528 GBP 363,388 HSBC 06/10/2021 6,216 –USD 216,204 GBP 156,341 HSBC 06/10/2021 4,596 –USD 339,668 GBP 248,589 HSBC 06/10/2021 4,253 –EUR 3,339,027 GBP 2,872,324 HSBC 06/10/2021 3,391 –USD 70,448 GBP 51,078 Brown Brothers Harriman 06/10/2021 1,362 –USD 41,768 GBP 30,203 Brown Brothers Harriman 06/10/2021 888 –EUR 241,916 GBP 207,542 HSBC 06/10/2021 807 –USD 32,525 GBP 23,519 HSBC 06/10/2021 691 –USD 49,254 GBP 36,047 HSBC 06/10/2021 617 –EUR 186,536 GBP 160,097 HSBC 06/10/2021 556 –EUR 40,471 GBP 34,457 Brown Brothers Harriman 06/10/2021 398 –USD 26,912 GBP 19,651 Brown Brothers Harriman 06/10/2021 382 –EUR 113,182 GBP 97,100 HSBC 06/10/2021 377 –EUR 44,169 GBP 37,682 Brown Brothers Harriman 06/10/2021 359 –USD 17,603 GBP 12,787 Brown Brothers Harriman 06/10/2021 316 –EUR 88,688 GBP 76,117 HSBC 06/10/2021 264 –EUR 57,423 GBP 49,264 HSBC 06/10/2021 191 –GBP 80,360 EUR 93,087 Brown Brothers Harriman 06/10/2021 189 –EUR 14,843 GBP 12,636 Brown Brothers Harriman 06/10/2021 147 –EUR 26,282 GBP 22,557 HSBC 06/10/2021 78 –EUR 54,536 GBP 46,895 Brown Brothers Harriman 06/10/2021 74 –EUR 15,000 GBP 12,854 Brown Brothers Harriman 06/10/2021 64 –EUR 10,000 GBP 8,570 Brown Brothers Harriman 06/10/2021 43 –EUR 2,870 GBP 2,448 Brown Brothers Harriman 06/10/2021 23 –EUR 3,027 GBP 2,594 Brown Brothers Harriman 06/10/2021 13 –EUR 3,582 GBP 3,079 Brown Brothers Harriman 06/10/2021 6 –USD 122 GBP 88 Brown Brothers Harriman 06/10/2021 3 –EUR 297 GBP 253 Brown Brothers Harriman 06/10/2021 3 –EUR 92 GBP 78 Brown Brothers Harriman 06/10/2021 1 –USD 53 GBP 39 Brown Brothers Harriman 06/10/2021 1 –GBP 4,934 EUR 5,728 Brown Brothers Harriman 06/10/2021 1 –GBP 110 EUR 128 Brown Brothers Harriman 06/10/2021 (1) –

VERITAS FUNDS PLC
59
VERITAS GLOBAL REAL RETURN FUND
SCHEDULE OF INVESTMENTS AS AT 30 SEPTEMBER 2021
(CONTINUED)
UnrealisedCurrency Amount Currency Amount Maturity Gain/(Loss) % of Net Purchased Purchased Sold Sold Counterparty Date GBP Assets Unrealised Gain/(Loss) on Forward Currency Contracts (0.38%) (September 2020: 1.15%) (continued)
GBP 27 USD 37 Brown Brothers Harriman 06/10/2021 (1) –EUR 358 GBP 309 Brown Brothers Harriman 06/10/2021 (1) –GBP 170 EUR 199 Brown Brothers Harriman 06/10/2021 (1) –GBP 421 EUR 492 Brown Brothers Harriman 06/10/2021 (2) –EUR 50,000 GBP 43,071 Brown Brothers Harriman 06/10/2021 (8) –EUR 49,906 GBP 42,990 Brown Brothers Harriman 06/10/2021 (8) –GBP 554 USD 766 Brown Brothers Harriman 06/10/2021 (16) –GBP 18,848 EUR 21,905 Brown Brothers Harriman 06/10/2021 (18) –GBP 6,944 EUR 8,085 Brown Brothers Harriman 06/10/2021 (19) –GBP 1,667 USD 2,281 Brown Brothers Harriman 06/10/2021 (31) –GBP 13,829 EUR 16,100 Brown Brothers Harriman 06/10/2021 (37) –GBP 1,844 USD 2,550 Brown Brothers Harriman 06/10/2021 (54) –GBP 32,738 EUR 38,312 Brown Brothers Harriman 06/10/2021 (257) –GBP 32,929 EUR 38,558 HSBC 06/10/2021 (279) –GBP 31,963 EUR 37,507 HSBC 06/10/2021 (339) –GBP 22,231 USD 30,383 HSBC 06/10/2021 (386) –GBP 24,301 USD 33,730 HSBC 06/10/2021 (807) –GBP 102,609 EUR 120,150 HSBC 06/10/2021 (869) –GBP 47,026 USD 65,225 Brown Brothers Harriman 06/10/2021 (1,525) –GBP 169,631 EUR 198,836 Brown Brothers Harriman 06/10/2021 (1,615) –GBP 152,202 USD 208,016 HSBC 06/10/2021 (2,640) –GBP 222,075 USD 303,510 HSBC 06/10/2021 (3,852) –GBP 157,576 USD 218,721 HSBC 06/10/2021 (5,235) –GBP 1,074,078 EUR 1,253,351 Brown Brothers Harriman 06/10/2021 (5,362) –GBP 227,876 USD 316,298 HSBC 06/10/2021 (7,570) (0.01)GBP 1,070,127 EUR 1,256,231 Brown Brothers Harriman 06/10/2021 (11,794) (0.01)GBP 4,277,280 EUR 5,000,000 Brown Brothers Harriman 06/10/2021 (28,936) (0.01)
Total Unrealised Gain on Forward Currency Contracts (0.41%) (September 2020: 1.20%) # 1,087,555 0.41Total Unrealised Loss on Forward Currency Contracts ((0.03)%) (September 2020: (0.05)%) # (71,663) (0.03)

VERITAS FUNDS PLC
60
VERITAS GLOBAL REAL RETURN FUND
SCHEDULE OF INVESTMENTS AS AT 30 SEPTEMBER 2021
(CONTINUED)
Fair Value % of NetHoldings Financial assets at fair value through profit or loss GBP Assets Value
Future Contracts (1.74%) (September 2020: 0.79%)*
(730) E-mini S&P 500 Index Futures December 2021 4,088,942 1.52(560) Euro Stoxx 50 Index Futures December 2021 624,536 0.23(145) FTSE 100 Index Futures December 2021 (34,075) (0.01)
4,679,403 1.74
Total Unrealised Gain on Future Contracts (1.75%) (September 2020: 0.79%) 4,713,478 1.75
Total Unrealised Loss on Future Contracts ((0.01)%) (September 2020: –%) (34,075) (0.01)
Total Financial assets at Fair Value through Profit or Loss (94.78%) (September 2020: 96.35%) 254,381,491 94.78
Total Financial liabilities at Fair Value through Profit or Loss ((0.04)%) (September 2020: (0.05)%) (105,738) (0.04)
Net Financial assets and liabilities at Fair Value through Profit or Loss (94.74%) (September 2020: 96.30%) 254,275,753 94.74
Other Net Assets (5.26%) (September 2020: 3.70%) 14,104,529 5.26
Net assets attributable to Holders of Redeemable Participating Shares 268,380,282 100.00
% of % of Total Assets Total Assets
Analysis of Total Assets 30 September
202130 September
2020
Transferable securities admitted to official stock exchange listing 92.42% 92.82%
Collective Investment Schemes –% –% Financial derivative instruments traded over-the-counter 0.40% 1.18% Other current Assets 7.18% 6.00% Total Assets 100.00% 100.00%
*The counterparty for the future contracts is UBS. # Forward Contracts are held at Class level for hedging

VERITAS FUNDS PLC
61
VERITAS IZOARD FUND
SCHEDULE OF INVESTMENTS AS AT 30 SEPTEMBER 2021
Holdings Financial assets at fair value through profit or loss Fair Value
USD % of Net
Asset Value
Equities (97.10%) (September 2020: 96.33%) Australia (3.06%) (September 2020: 3.53%)
81,178 Sonic Healthcare Ltd. 2,379,567 3.06 2,379,567 3.06 Canada (5.49%) (September 2020: 6.14%)
65,500 Canadian Pacific Railway Ltd. 4,262,413 5.49 4,262,413 5.49 China (2.17%) (September 2020: Nil)
11,400 Alibaba Group Holding Ltd. 1,687,656 2.17 1,687,656 2.17 France (12.90%) (September 2020: 13.21%)
17,700 Airbus SE 2,361,504 3.0429,800 Safran S.A. 3,786,950 4.8837,000 Vinci S.A. 3,866,594 4.98
10,015,048 12.90 Spain (3.43%) (September 2020: 3.04%)
15,390 Aena SME S.A. 2,663,397 3.43 2,663,397 3.43 Switzerland (Nil) (September 2020: 1.91%) United Kingdom (9.32%) (September 2020: 13.54%)
460,000 BAE Systems PLC 3,506,844 4.5269,000 Unilever PLC 3,731,085 4.80
7,237,929 9.32 United States (60.73%) (September 2020: 54.96%)
2,700 Alphabet, Inc. 7,215,493 9.3038,651 Baxter International, Inc. 3,108,120 4.009,059 Charter Communications, Inc. 6,588,429 8.497,686 Cooper Cos, Inc./The 3,176,816 4.09
42,700 CVS Health Corp. 3,622,028 4.6611,838 Facebook, Inc. 4,016,515 5.1728,400 Fiserv, Inc. 3,081,684 3.9725,600 Intercontinental Exchange, Inc. 2,939,776 3.79

VERITAS FUNDS PLC
62
VERITAS IZOARD FUND
SCHEDULE OF INVESTMENTS AS AT 30 SEPTEMBER 2021
(CONTINUED)
Holdings Financial assets at fair value through profit or loss Fair Value
USD % of Net
Asset Value
Equities (97.10%) (September 2020: 96.33%) (continued) United States (60.73%) (September 2020: 54.96%) (continued)
8,700 Mastercard, Inc. 3,023,642 3.8916,300 Microsoft Corp. 4,591,791 5.918,400 Moody's Corp. 2,982,042 3.847,200 UnitedHealth Group, Inc. 2,813,364 3.62
47,159,700 60.73
Total Equities (97.10%) (September 2020: 96.33%) 75,405,710 97.10
Collective Investment Schemes (–%) (September 2020: 2.82%*) Luxembourg (–%) (September 2020: 2.82%)
962 JP Morgan US Dollar Liquidity Fund 962 –1,494 Morgan Stanley US Dollar Liquidity Fund 1,494 –
2,456 –
Total Collective Investment Schemes (–%) (September 2020: 2.82%) 2,456 –
Total Financial assets at Fair Value through Profit or Loss (97.10%) (September 2020: 99.15%) 75,408,166 97.10
Net Financial assets and liabilities at Fair Value through Profit or Loss (97.10%) (September 2020: 99.15%) 75,408,166 97.10
Other Net Assets (2.90%) (September 2020: 0.85%) 2,251,695 2.90
Net assets attributable to Holders of Redeemable Participating Shares 77,659,861 100.00
* Included in Cash and cash equivalents in the Statement of Financial Positions as of 30 September 2020.

VERITAS FUNDS PLC
63
VERITAS IZOARD FUND
SCHEDULE OF INVESTMENTS AS AT 30 SEPTEMBER 2021
(CONTINUED)
% of % of Total Assets Total Assets
Analysis of Total Assets 30 September
202130 September
2020
Transferable securities admitted to official stock exchange listing 96.71% 92.21%
Collective Investment Schemes –% 2.70% Other current Assets 3.29% 5.09% Total Assets 100.00% 100.00%

VERITAS FUNDS PLC
64
VERITAS THIRD EYE GLOBAL EMERGING MARKETS FUND
SCHEDULE OF INVESTMENTS AS AT 30 SEPTEMBER 2021
Holdings Financial assets at fair value through profit or loss Fair Value
USD % of Net
Asset Value
Equities (80.91%) (September 2020: 76.76%) Canada (2.08%) (September 2020: 2.16%)
2,600 Franco-Nevada Corp. 337,701 2.08 337,701 2.08 China (19.59%) (September 2020: 20.51%)
28,150 Alibaba Group Holding Ltd. 514,389 3.1724,900 Foshan Haitian Flavouring & Food Co. Ltd. 424,369 2.6213,500 Jiangsu Yanghe Brewery Joint-Stock Co. Ltd. 347,383 2.1413,900 Tencent Holdings Ltd. 824,039 5.08
136,600 TravelSky Technology Ltd. 262,684 1.6212,100 Wuliangye Yibin Co. Ltd. 411,323 2.5371,000 Yihai International Holding Ltd. 394,918 2.43
3,179,105 19.59 France (10.78%) (September 2020: 8.23%)
2,000 Airbus SE 266,837 1.643,200 Pernod Ricard S.A. 707,330 4.366,100 Safran S.A. 775,181 4.78
1,749,348 10.78 Germany (1.84%) (September 2020: Nil)
2,200 SAP SE 298,671 1.84 298,671 1.84 India (5.59%) (September 2020: Nil)
33,600 Kotak Mahindra Bank Ltd. 907,814 5.59 907,814 5.59 Japan (Nil) (September 2020: 1.63%) Mexico (2.04%) (September 2020: 2.07%)
152,000 Becle SAB de CV 330,864 2.04 330,864 2.04 Singapore (3.93%) (September 2020: 2.39%)
2,000 Sea Ltd. 637,360 3.93 637,360 3.93

VERITAS FUNDS PLC
65
VERITAS THIRD EYE GLOBAL EMERGING MARKETS FUND
SCHEDULE OF INVESTMENTS AS AT 30 SEPTEMBER 2021
(CONTINUED)
Holdings Financial assets at fair value through profit or loss Fair Value
USD % of Net
Asset Value
Equities (80.91%) (September 2020: 76.76%) Sweden (1.77%) (September 2020: Nil)
13,800 Epiroc AB 286,693 1.77 286,693 1.77 Switzerland (4.04%) (September 2020: 5.37%)
9,700 Wizz Air Holdings PLC 656,173 4.04 656,173 4.04 United Arab Emirates (Nil) (September 2020: 1.38%) United Kingdom (2.29%) (September 2020: 13.53%)
10,600 British American Tobacco PLC 372,213 2.29 372,213 2.29 United States (26.96%) (September 2020: 19.49%)
5,700 Abbott Laboratories 673,256 4.157,100 Corteva, Inc. 298,662 1.842,500 Facebook, Inc. 848,225 5.231,300 Netflix, Inc. 793,325 4.898,400 Philip Morris International, Inc. 796,278 4.912,000 Starbucks Corp. 220,650 1.361,300 Thermo Fisher Scientific, Inc. 742,502 4.58
4,372,898 26.96
Total Equities (80.91%) (September 2020: 76.76%) 13,128,840 80.91

VERITAS FUNDS PLC
66
VERITAS THIRD EYE GLOBAL EMERGING MARKETS FUND
SCHEDULE OF INVESTMENTS AS AT 30 SEPTEMBER 2021
(CONTINUED)
Holdings Financial assets at fair value through profit or loss Fair Value
USD % of Net
Asset Value
Equity Warrants (18.82%) (September 2020: 11.77%)* Singapore (18.82%) (September 2020: 11.77%)
45,600 HDFC Bank Ltd. (Warrant 30/06/2024) 979,822 6.0448,000 Indian Energy Exchange Ltd. (Warrant 18/11/2024) 417,710 2.573,700 Info Edge India Ltd. (Warrant 31/12/2024) 320,584 1.98
11,000 Tata Consultancy Services Ltd. (Warrant 25/02/2025) 559,510 3.457,800 Avenue Supermarts Ltd. (Warrant 07/10/2025) 446,621 2.755,100 Divi's Laboratories Ltd. (Warrant 09/02/2026) 329,708 2.03
3,053,955 18.82
Total Equity Warrants (18.82%) (September 2020: 11.77%) 3,053,955 18.82
Collective Investment Schemes (0.01%) (September 2020: 5.92%**) Luxembourg (0.01%) (September 2020: 5.92%)
1,628 JP Morgan US Dollar Liquidity Fund 1,628 0.01326 Morgan Stanley US Dollar Liquidity Fund 326 –
1,954 0.01
Total Collective Investment Schemes (0.01%) (September 2020: 5.92%) 1,954 0.01
Total Financial assets at Fair Value through Profit or Loss (99.74%) (September 2020: 94.45%) 16,184,749 99.74
Net Financial assets and liabilities at Fair Value through Profit or Loss (99.74%) (September 2020: 94.45%) 16,184,749 99.74
Other Net Assets (0.26%) (September 2020: 5.55%) 42,253 0.26
Net assets attributable to Holders of Redeemable Participating Shares 16,227,002 100.00
*The counterparty for the warrants is CLSA. ** Included in Cash and cash equivalents in the Statement of Financial Positions as of 30 September 2020.

VERITAS FUNDS PLC
67
VERITAS THIRD EYE GLOBAL EMERGING MARKETS FUND
SCHEDULE OF INVESTMENTS AS AT 30 SEPTEMBER 2021
(CONTINUED)
% of % of Total Assets Total Assets
Analysis of Total Assets 30 September
202130 September
2020
Transferable securities admitted to official stock exchange listing 88.89% 81.52%
Other transferable securities of the type referred to in Regulations 68 (1)(a), (b) and (c) 10.74% 6.84%
Collective Investment Schemes 0.01% 5.91% Other current Assets 0.36% 5.73% Total Assets 100.00% 100.00%

VERITAS FUNDS PLC
The notes to the financial statements form an integral part of these financial statements.
68
STATEMENT OF FINANCIAL POSITION AS AT 30 SEPTEMBER 2021
Veritas Asian FundVeritas Global Focus
FundVeritas Global Equity
Income Fund Veritas China Fund Note USD USD GBP USD
CURRENT ASSETS Financial assets at fair value through profit or loss 7 7,849,969,410 3,606,573,063 244,278,866 53,488,729Cash and cash equivalents 8 283,267,984 50,570,084 4,364,729 9,400,454Margin cash held with brokers 8 – – – 265Due from brokers 2 78,365,721 – 8,026,219 541,904Due from shareholders 49,877,825 4,477,217 116,389 324,095Dividends receivable 4,525,731 1,481,585 1,259,408 –Other debtors – – – 91
TOTAL CURRENT ASSETS 8,266,006,671 3,663,101,949 258,045,611 63,755,538 CURRENT LIABILITIES Financial liabilities at fair value through profit or loss 7 – 374,366 638 –Bank overdraft – 337 501 –Due to brokers 2 24,587,247 25,393 2,618,781 –Due to shareholders 20,200,092 5,596,739 376,679 10Investment management fee payable 3 5,592,365 2,286,523 168,050 54,727Distribution payable 5 – 194,559 4,757,460 –Other creditors 1,127,370 626,498 79,658 23,066
CURRENT LIABILITIES (EXCLUDING NET ASSETS ATTRIBUTABLE TO HOLDERS OF REDEEMABLE PARTICIPATING SHARES) 51,507,074 9,104,415 8,001,767 77,803
NET ASSETS ATTRIBUTABLE TO HOLDERS OF REDEEMABLE PARTICIPATING SHARES 8,214,499,597 3,653,997,534 250,043,844 63,677,735


VERITAS FUNDS PLC
The notes to the financial statements form an integral part of these financial statements.
70
STATEMENT OF FINANCIAL POSITION AS AT 30 SEPTEMBER 2020
Veritas Asian FundVeritas Global Focus
FundVeritas Global Equity
Income Fund Veritas China Fund Note USD USD GBP USD
CURRENT ASSETS Financial assets at fair value through profit or loss 7 5,249,927,045 3,349,455,877 299,001,383 30,105,849 Cash and cash equivalents 8 136,641,279 55,410,981 9,059,148 7,796,239 Margin cash held with brokers 8 – – – 266Due from brokers 2 3,322 12,874,110 3,111,968 12Due from shareholders 11,902,660 4,620,008 12,991 34,401Dividends receivable 4,454,299 3,723,535 2,226,081 –Other debtors 878 – – 52,595
TOTAL CURRENT ASSETS 5,402,929,483 3,426,084,511 313,411,571 37,989,362
CURRENT LIABILITIES Financial liabilities at fair value through profit or loss 7 – 981,376 2,474 –Bank overdraft – 78 – –Due to brokers 2 8,851,209 37,772,628 6,784 346,735Due to shareholders 8,156,893 2,079,658 752,973 300Investment management fee payable 3 6,817,712 4,334,328 454,868 65,011Distribution payable 5 1,075,285 1,204,375 7,159,034 –Other creditors 759,559 636,627 94,325 12,658
CURRENT LIABILITIES (EXCLUDING NET ASSETS ATTRIBUTABLE TO HOLDERS OF REDEEMABLE PARTICIPATING SHARES) 25,660,658 47,009,070 8,470,458 424,704
NET ASSETS ATTRIBUTABLE TO HOLDERS OF REDEEMABLE PARTICIPATING SHARES 5,377,268,825 3,379,075,441 304,941,113 37,564,658

VERITAS FUNDS PLC
The notes to the financial statements form an integral part of these financial statements.
71
STATEMENT OF FINANCIAL POSITION AS AT 30 SEPTEMBER 2020
(CONTINUED)
Veritas Global Real
Return Fund Veritas Izoard Fund
Veritas Third Eye Global Emerging
Markets Fund Total Note GBP USD USD USD
CURRENT ASSETS Financial assets at fair value through profit or loss 7 281,444,743 70,298,779 12,801,382 9,457,127,178 Cash and cash equivalents 8 461,111 3,190,721 717,152 216,013,184*Margin cash held with brokers 8 13,282,481 – – 17,037,704Due from brokers 2 – 209,162 5 17,078,332Due from shareholders 1,628,615 225,000 641 18,888,398Dividends receivable 149,107 104,572 9,657 11,338,717Other debtors 26 42,331 50,587 146,424
TOTAL CURRENT ASSETS 296,966,083 74,070,565 13,579,424 9,737,629,937
CURRENT LIABILITIES Financial liabilities at fair value through profit or loss 7 143,074 – – 1,168,070Bank overdraft 309,112 – – 396,576Due to brokers 2 3,669,255 2,536,370 64 54,222,262Due to shareholders 225,398 – – 11,521,680*Investment management fee payable 3 436,088 60,461 22,856 12,458,500*Distribution payable 5 – 558,430 – 12,020,983Other creditors 56,281 11,752 2,270 1,616,048
CURRENT LIABILITIES (EXCLUDING NET ASSETS ATTRIBUTABLE TO HOLDERS OF REDEEMABLE PARTICIPATING SHARES) 4,839,208 3,167,013 25,190 93,404,119
NET ASSETS ATTRIBUTABLE TO HOLDERS OF REDEEMABLE PARTICIPATING SHARES 292,126,875 70,903,552 13,554,234 9,644,225,818
*The figures have been adjusted to account for balances held in the name of the Company on cash collection accounts. The total adjustment to Cash and cash equivalents is USD 45,176.
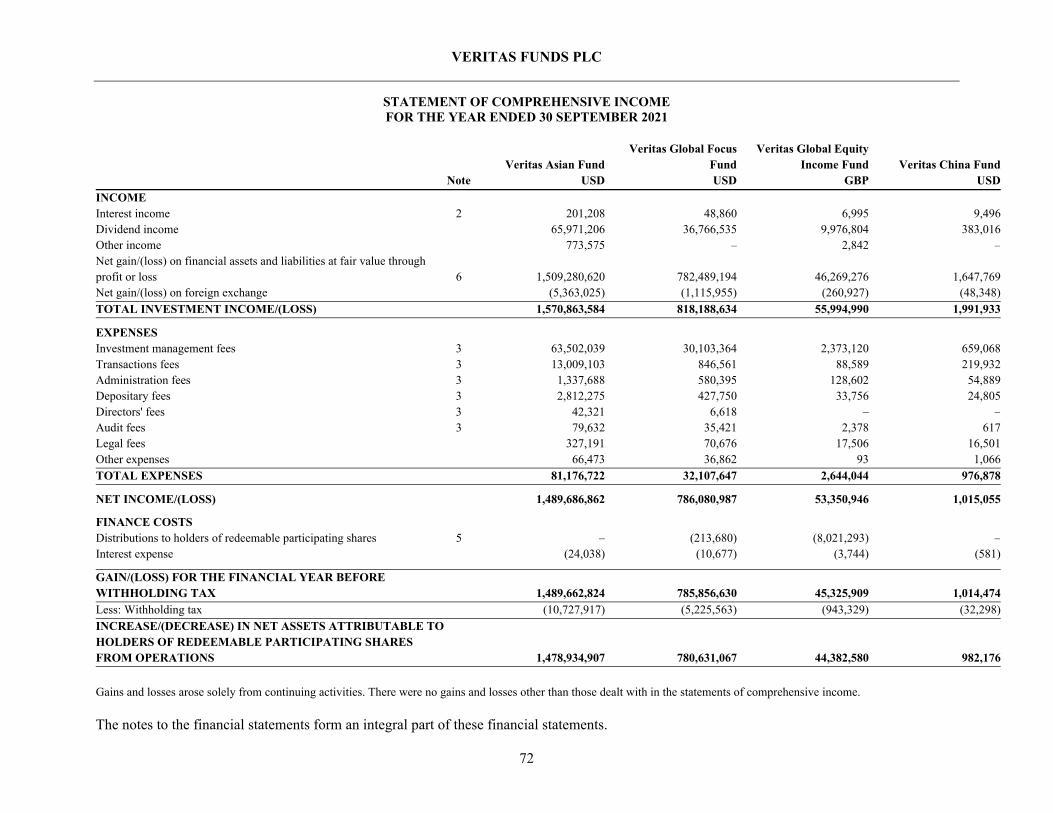
VERITAS FUNDS PLC
The notes to the financial statements form an integral part of these financial statements.
72
STATEMENT OF COMPREHENSIVE INCOME FOR THE YEAR ENDED 30 SEPTEMBER 2021
Veritas Asian FundVeritas Global Focus
FundVeritas Global Equity
Income Fund Veritas China Fund Note USD USD GBP USD
INCOME Interest income 2 201,208 48,860 6,995 9,496Dividend income 65,971,206 36,766,535 9,976,804 383,016Other income 773,575 – 2,842 –Net gain/(loss) on financial assets and liabilities at fair value through profit or loss 6 1,509,280,620 782,489,194 46,269,276 1,647,769Net gain/(loss) on foreign exchange (5,363,025) (1,115,955) (260,927) (48,348)TOTAL INVESTMENT INCOME/(LOSS) 1,570,863,584 818,188,634 55,994,990 1,991,933
EXPENSES Investment management fees 3 63,502,039 30,103,364 2,373,120 659,068Transactions fees 3 13,009,103 846,561 88,589 219,932Administration fees 3 1,337,688 580,395 128,602 54,889Depositary fees 3 2,812,275 427,750 33,756 24,805Directors' fees 3 42,321 6,618 – –Audit fees 3 79,632 35,421 2,378 617Legal fees 327,191 70,676 17,506 16,501Other expenses 66,473 36,862 93 1,066TOTAL EXPENSES 81,176,722 32,107,647 2,644,044 976,878
NET INCOME/(LOSS) 1,489,686,862 786,080,987 53,350,946 1,015,055
FINANCE COSTS Distributions to holders of redeemable participating shares 5 – (213,680) (8,021,293) –Interest expense (24,038) (10,677) (3,744) (581)
GAIN/(LOSS) FOR THE FINANCIAL YEAR BEFORE WITHHOLDING TAX 1,489,662,824 785,856,630 45,325,909 1,014,474Less: Withholding tax (10,727,917) (5,225,563) (943,329) (32,298)INCREASE/(DECREASE) IN NET ASSETS ATTRIBUTABLE TO HOLDERS OF REDEEMABLE PARTICIPATING SHARES FROM OPERATIONS 1,478,934,907 780,631,067 44,382,580 982,176
Gains and losses arose solely from continuing activities. There were no gains and losses other than those dealt with in the statements of comprehensive income.

VERITAS FUNDS PLC
The notes to the financial statements form an integral part of these financial statements.
73
STATEMENT OF COMPREHENSIVE INCOME FOR THE YEAR ENDED 30 SEPTEMBER 2021
(CONTINUED)
Veritas Global Real
Return Fund Veritas Izoard Fund
Veritas Third Eye Global Emerging
Markets Fund Total Note GBP USD USD USD
INCOME Interest income 2 2,131 2,446 487 274,991Dividend income 2,616,296 826,623 196,725 121,385,319Other income 17,122 2,715 – 803,623Net gain/(loss) on financial assets and liabilities at fair value through profit or loss 6 6,375,243 16,265,783 2,648,352 2,384,407,329Net gain/(loss) on foreign exchange 72,180 (27,397) (1,923) (6,815,062)TOTAL INVESTMENT INCOME/(LOSS) 9,082,972 17,070,170 2,843,641 2,500,056,200
EXPENSES Investment management fees 3 2,641,586 399,144 159,221 101,688,470Transactions fees 3 100,990 15,508 15,333 14,365,990Administration fees 3 106,083 14,129 17,310 2,325,718Depositary fees 3 34,754 10,681 3,847 3,373,155Directors' fees 3 – – – 48,939Audit fees 3 2,557 753 157 123,336Legal fees 18,820 7,344 7,062 478,508Other expenses 1,683 – 14,449 121,282TOTAL EXPENSES 2,906,473 447,559 217,379 122,525,398
NET INCOME/(LOSS) 6,176,499 16,622,611 2,626,262 2,377,530,802
FINANCE COSTS Distributions to holders of redeemable participating shares 5 – (289,159) – (11,484,791)Interest expense (137,331) (197) (640) (229,279)
GAIN/(LOSS) FOR THE FINANCIAL YEAR BEFORE WITHHOLDING TAX 6,039,168 16,333,255 2,625,622 2,365,816,732Less: Withholding tax (378,302) (107,645) (16,321) (17,919,189)INCREASE/(DECREASE) IN NET ASSETS ATTRIBUTABLE TO HOLDERS OF REDEEMABLE PARTICIPATING SHARES FROM OPERATIONS 5,660,866 16,225,610 2,609,301 2,347,897,543
Gains and losses arose solely from continuing activities. There were no gains and losses other than those dealt with in the statements of comprehensive income.

VERITAS FUNDS PLC
The notes to the financial statements form an integral part of these financial statements.
74
STATEMENT OF COMPREHENSIVE INCOME FOR THE YEAR ENDED 30 SEPTEMBER 2020
Veritas Asian FundVeritas Global Focus
FundVeritas Global Equity
Income Fund Veritas China Fund Note USD USD GBP USD
INCOME Interest income 2 3,562,149 4,784,942 80,842 57,342Dividend income 34,314,557 36,182,022 15,062,648 211,637
Net gain/(loss) on financial assets and liabilities at fair value through profit or loss 6 1,226,303,614 300,746,918 (51,049,918) 11,558,430Net gain/(loss) on foreign exchange (3,100,605) (1,322,832) (85,393) (11,954)
TOTAL INVESTMENT INCOME/(LOSS) 1,261,079,715 340,391,050 (35,991,821) 11,815,455
EXPENSES Investment management fees 3 28,550,706 26,345,780 3,424,896 287,704Transactions fees* 3 6,814,557 1,561,381 266,389 99,513Administration fees 3 751,754 569,119 143,717 8,623Depositary fees 3 1,169,981 444,467 72,544 9,652Directors' fees 3 46,468 5,280 501 87Audit fees 3 61,092 38,390 3,486 427Legal fees 342,995 139,484 36,829 19,561Other expenses 415,125 43,235 5,976 1,558
TOTAL EXPENSES 38,152,678 29,147,136 3,954,338 427,125
NET INCOME/(LOSS) 1,222,927,037 311,243,914 (39,946,159) 11,388,330
FINANCE COSTS Distributions to holders of redeemable participating shares 5 (1,120,051) (1,264,412) (11,963,144) –Interest expense (24,292) (114,993) (9,722) (8,369)
GAIN/(LOSS) FOR THE FINANCIAL YEAR BEFORE WITHHOLDING TAX 1,221,782,694 309,864,509 (51,919,025) 11,379,961
Less: Capital withholding tax (649,820) – – –Less: Withholding tax (4,408,400) (5,324,525) (1,426,004) (17,701)
INCREASE/(DECREASE) IN NET ASSETS ATTRIBUTABLE TO HOLDERS OF REDEEMABLE PARTICIPATING SHARES FROM OPERATIONS 1,216,724,474 304,539,984 (53,345,029) 11,362,260
Gains and losses arose solely from continuing activities. There were no gains and losses other than those dealt with in the statements of comprehensive income. *Included in Net gain/(loss) on financial assets and liabilities at fair value through profit or loss caption in the Financial Statements for the year ended 30 September 2020.

VERITAS FUNDS PLC
The notes to the financial statements form an integral part of these financial statements.
75
STATEMENT OF COMPREHENSIVE INCOME FOR THE YEAR ENDED 30 SEPTEMBER 2020
(CONTINUED)
Veritas Global Real
Return Fund Veritas Izoard Fund
Veritas Third Eye Global Emerging
Markets Fund Total Note GBP USD USD USD
INCOME Interest income 2 134,902 77,379 48,241 8,805,213Dividend income 2,848,245 1,008,809 136,433 94,697,011
Net gain/(loss) on financial assets and liabilities at fair value through profit or loss 6 13,059,238 5,742,754 1,056,590 1,496,954,992Net gain/(loss) on foreign exchange (984,208) (18,105) 6,963 (5,810,702)
TOTAL INVESTMENT INCOME/(LOSS) 15,058,177 6,810,837 1,248,227 1,594,646,514
EXPENSES Investment management fees 3 2,699,741 333,896 125,660 63,455,108Transactions fees* 3 202,276 39,552 16,700 9,129,438Administration fees 3 100,078 21,628 8,103 1,670,163Depositary fees 3 54,240 10,667 2,676 1,799,143Directors' fees 3 18,632 226 35 76,498Audit fees 3 3,339 805 154 109,573Legal fees 30,721 3,493 10,212 601,898Other expenses 2,356 1,743 6,516 478,804TOTAL EXPENSES 3,111,383 412,010 170,056 77,320,625
NET INCOME/(LOSS) 11,946,794 6,398,827 1,078,171 1,517,325,889
FINANCE COSTS Distributions to holders of redeemable participating shares 5 – (543,414) – (18,185,671)Interest expense (200,084) (532) (612) (416,385)
GAIN/(LOSS) FOR THE FINANCIAL YEAR BEFORE WITHHOLDING TAX 11,746,710 5,854,881 1,077,559 1,498,723,833
Less: Capital withholding tax – – – (649,820)Less: Withholding tax (487,892) (107,520) (10,591) (12,309,720)INCREASE/(DECREASE) IN NET ASSETS ATTRIBUTABLE TO HOLDERS OF REDEEMABLE PARTICIPATING SHARES FROM OPERATIONS 11,258,818 5,747,361 1,066,968 1,485,764,293
Gains and losses arose solely from continuing activities. There were no gains and losses other than those dealt with in the statements of comprehensive income. *Included in Net gain/(loss) on financial assets and liabilities at fair value through profit or loss caption in the Financial Statements for the year ended 30 September 2020.

VERITAS FUNDS PLC
The notes to the financial statements form an integral part of these financial statements.
76
STATEMENT OF CHANGES IN NET ASSETS ATTRIBUTABLE TO HOLDERS OF REDEEMABLE PARTICIPATING SHARES
FOR THE YEAR ENDED 30 SEPTEMBER 2021
Veritas Asian FundVeritas Global Focus
FundVeritas Global Equity
Income Fund Veritas China Fund
Note USD USD GBP USD Net Assets attributable to holders of redeemable participating shares at the start of the year 5,377,268,825 3,379,075,441 304,941,113 37,564,658 Foreign exchange movement arising on aggregation 2(a) – – – – Increase/(decrease) in net assets attributable to holders of redeemable participating shares from operations 1,478,934,907 780,631,067 44,382,580 982,176 Proceeds from redeemable participating shares issued 4,001,327,021 650,501,410 18,800,612 31,524,879 Redemption of redeemable participating shares (2,643,031,156) (1,156,210,384) (118,080,461) (6,393,978) NET ASSETS ATTRIBUTABLE TO HOLDERS OF REDEEMABLE PARTICIPATING SHARES AT THE END OF THE YEAR 8,214,499,597 3,653,997,534 250,043,844 63,677,735

VERITAS FUNDS PLC
The notes to the financial statements form an integral part of these financial statements.
77
STATEMENT OF CHANGES IN NET ASSETS ATTRIBUTABLE TO HOLDERS OF REDEEMABLE PARTICIPATING SHARES
FOR THE YEAR ENDED 30 SEPTEMBER 2021 (CONTINUED)
u
Veritas Global Real
Return Fund Veritas Izoard Fund
Veritas Third EyeGlobal Emerging
Markets Fund Total
Note GBP USD USD USD
Net Assets attributable to holders of redeemable participating shares at the start of the year 292,126,875 70,903,552 13,554,234 9,644,225,818 Foreign exchange movement arising on aggregation 2(a) – – – 38,263,174 Increase/(decrease) in net assets attributable to holders of redeemable participating shares from operations 5,660,866 16,225,610 2,609,301 2,347,897,543 Proceeds from redeemable participating shares issued 96,069,820 3,467,656 284,163 4,844,374,237 Redemption of redeemable participating shares (125,477,279) (12,936,957) (220,696) (4,152,248,072) NET ASSETS ATTRIBUTABLE TO HOLDERS OF REDEEMABLE PARTICIPATING SHARES AT THE END OF THE YEAR 268,380,282 77,659,861 16,227,002 12,722,512,700

VERITAS FUNDS PLC
The notes to the financial statements form an integral part of these financial statements.
78
STATEMENT OF CHANGES IN NET ASSETS ATTRIBUTABLE TO HOLDERS OF REDEEMABLE PARTICIPATING SHARES
FOR THE YEAR ENDED 30 SEPTEMBER 2020
Veritas Asian FundVeritas Global Focus
FundVeritas Global Equity
Income Fund Veritas China Fund
Note USD USD GBP USD
Net Assets attributable to holders of redeemable participating shares at the start of the year 2,395,477,966 3,327,903,677 513,091,183 23,902,407 Foreign exchange movement arising on aggregation 2(a) – – – –
Increase/(decrease) in net assets attributable to holders of redeemable participating shares from operations 1,216,724,474 304,539,984 (53,345,029) 11,362,260 Proceeds from redeemable participating shares issued 2,909,422,693 540,546,825 26,643,422 3,973,169 Redemption of redeemable participating shares (1,144,356,308) (793,915,045) (181,448,463) (1,673,178)
NET ASSETS ATTRIBUTABLE TO HOLDERS OF REDEEMABLE PARTICIPATING SHARES AT THE END OF THE YEAR 5,377,268,825 3,379,075,441 304,941,113 37,564,658
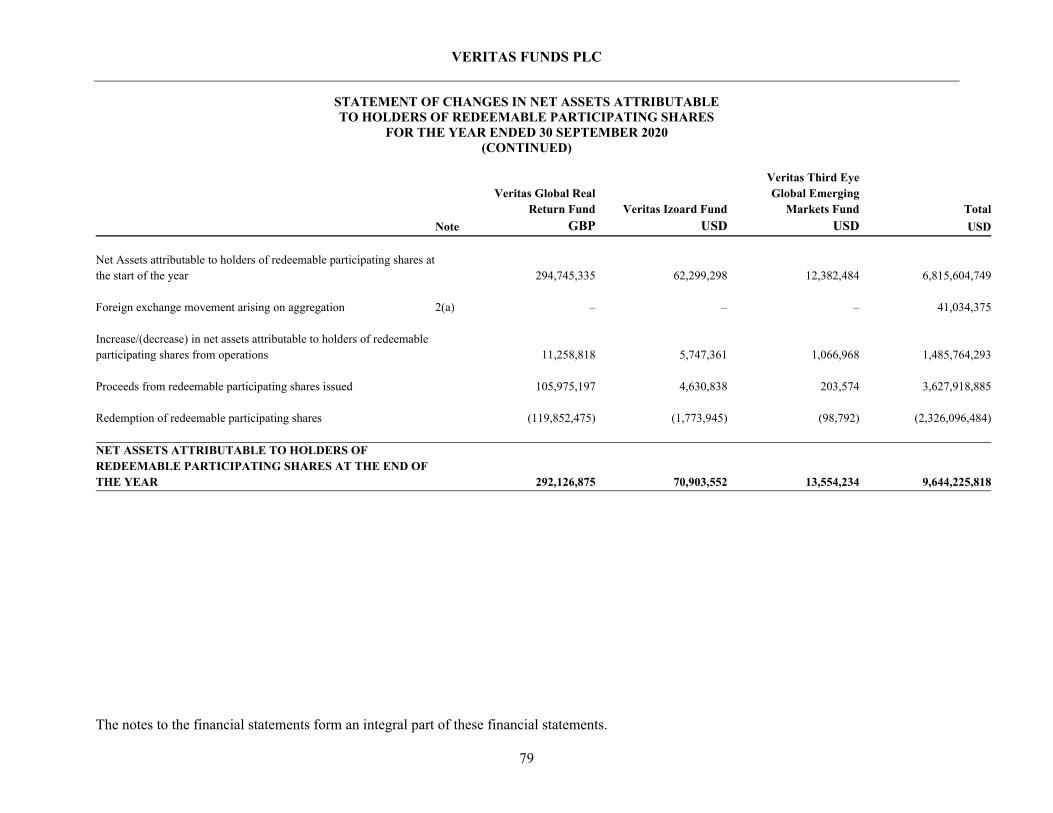
VERITAS FUNDS PLC
The notes to the financial statements form an integral part of these financial statements.
79
STATEMENT OF CHANGES IN NET ASSETS ATTRIBUTABLE TO HOLDERS OF REDEEMABLE PARTICIPATING SHARES
FOR THE YEAR ENDED 30 SEPTEMBER 2020 (CONTINUED)
Veritas Global Real
Return Fund Veritas Izoard Fund
Veritas Third EyeGlobal Emerging
Markets Fund Total
Note GBP USD USD USD
Net Assets attributable to holders of redeemable participating shares at the start of the year 294,745,335 62,299,298 12,382,484 6,815,604,749 Foreign exchange movement arising on aggregation 2(a) – – – 41,034,375 Increase/(decrease) in net assets attributable to holders of redeemable participating shares from operations 11,258,818 5,747,361 1,066,968 1,485,764,293 Proceeds from redeemable participating shares issued 105,975,197 4,630,838 203,574 3,627,918,885 Redemption of redeemable participating shares (119,852,475) (1,773,945) (98,792) (2,326,096,484) NET ASSETS ATTRIBUTABLE TO HOLDERS OF REDEEMABLE PARTICIPATING SHARES AT THE END OF THE YEAR 292,126,875 70,903,552 13,554,234 9,644,225,818

VERITAS FUNDS PLC
The notes to the financial statements form an integral part of these financial statements.
80
STATEMENT OF CASH FLOWS FOR THE YEAR ENDED 30 SEPTEMBER 2021
Veritas Asian Fund
USD
Veritas Global Focus Fund
USD
Veritas Global Equity Income
FundGBP
Cash flows from operating activities Increase/(decrease) in net assets attributable to holders of redeemable participating shares from operations 1,478,934,907 780,631,067 44,382,580Adjustment for: - Interest income (201,208) (48,860) (6,995)- Interest expense 24,038 10,677 3,744- Distributions to holders of redeemable participating shares – 213,680 8,021,293- Dividend income (65,971,206) (36,766,535) (9,976,804)- Withholding tax 10,727,917 5,225,563 943,329- Net (gain)/loss on foreign exchange 5,363,025 1,115,955 260,927 1,428,877,473 750,381,547 43,628,074 Net (increase)/decrease in financial assets at fair value through profit or loss (2,600,042,365) (257,117,186) 54,722,517Net (increase)/decrease in financial liabilities at fair value through profit or loss – (607,010) (1,836)(Increase)/decrease in margin accounts – – –Net (increase)/decrease in due from/to brokers (62,626,361) (24,873,125) (2,302,254)(Increase)/Decrease in other operating debtors 878 – –Increase/(Decrease) in other operating creditors (857,536) (2,057,934) (301,485)Cash (used in)/provided by operations (1,234,647,911) 465,726,292 95,745,016 Interest received 201,208 48,860 6,995Interest paid (24,038) (10,677) (3,744)Dividend received 65,899,774 39,008,485 10,943,477Taxation paid (10,727,917) (5,225,563) (943,329)Net cash (outflow)/inflow from operating activities (1,179,298,884) 499,547,397 105,748,415 Cash flows from financing activities Distributions paid to holders of redeemable participating shares (1,075,285) (1,223,496) (10,422,867)Proceeds from redeemable participating shares issued 3,963,351,856 650,644,201 18,697,214Payment on redemption of redeemable participating shares (2,630,987,957) (1,152,693,303) (118,456,755)Net cash inflow/(outflow) from financing activities 1,331,288,614 (503,272,598) (110,182,408) Net increase/(decrease) in cash and cash equivalents 151,989,730 (3,725,201) (4,433,993)Cash and cash equivalents at beginning of year 136,641,279 55,410,903 9,059,148Net gain/(loss) on foreign exchange (5,363,025) (1,115,955) (260,927)Exchange adjustment due to currency conversion – – – Cash and cash equivalents at end of year 283,267,984 50,569,747* 4,364,228*
*Cash and cash equivalents include bank overdraft.

VERITAS FUNDS PLC
The notes to the financial statements form an integral part of these financial statements.
81
STATEMENT OF CASH FLOWS FOR THE YEAR ENDED 30 SEPTEMBER 2021
(CONTINUED)
Veritas China Fund
USD
Veritas Global Real Return Fund
GBP
Veritas Izoard Fund
USD Cash flows from operating activities Increase/(decrease) in net assets attributable to holders of redeemable participating shares from operations 982,176 5,660,866 16,225,610Adjustment for: - Interest income (9,496) (2,131) (2,446)- Interest expense 581 137,331 197- Distributions to holders of redeemable participating shares – – 289,159- Dividend income (383,016) (2,616,296) (826,623)- Withholding tax 32,298 378,302 107,645- Net (gain)/loss on foreign exchange 48,348 (72,180) 27,397 670,891 3,485,892 15,820,939 Net (increase)/decrease in financial assets at fair value through profit or loss (23,382,880) 27,063,252 (5,109,387)Net (increase)/decrease in financial liabilities at fair value through profit or loss – (37,336) –(Increase)/decrease in margin accounts 1 5,312,041 –Net (increase)/decrease in due from/to brokers (888,627) (3,669,032) (2,327,208)(Increase)/Decrease in other operating debtors 52,504 26 42,331Increase/(Decrease) in other operating creditors 124 (251,584) (26,540)Cash (used in)/provided by operations (23,547,987) 31,903,259 8,400,135 Interest received 9,496 2,131 2,446Interest paid (581) (137,331) (197)Dividend received 383,016 2,673,795 893,987Taxation paid (32,298) (378,302) (107,645)Net cash (outflow)/inflow from operating activities (23,188,354) 34,063,552 9,188,726 Cash flows from financing activities Distributions paid to holders of redeemable participating shares – – (578,765)Proceeds from redeemable participating shares issued 31,235,185 97,622,521 3,692,656Payment on redemption of redeemable participating shares (6,394,268) (125,466,511) (12,936,957)Net cash inflow/(outflow) from financing activities 24,840,917 (27,843,990) (9,823,066) Net increase/(decrease) in cash and cash equivalents 1,652,563 6,219,562 (634,340)Cash and cash equivalents at beginning of year 7,796,239 151,999 3,190,721Net gain/(loss) on foreign exchange (48,348) 72,180 (27,397)Exchange adjustment due to currency conversion – – – Cash and cash equivalents at end of year 9,400,454 6,443,741* 2,528,984
*Cash and cash equivalents include bank overdraft.

VERITAS FUNDS PLC
The notes to the financial statements form an integral part of these financial statements.
82
STATEMENT OF CASH FLOWS FOR THE YEAR ENDED 30 SEPTEMBER 2021
(CONTINUED)
Veritas Third EyeGlobal Emerging
Markets FundUSD
Total**USD
Cash flows from operating activities Increase/(decrease) in net assets attributable to holders of redeemable participating shares from operations 2,609,301 2,347,897,543Adjustment for: - Interest income (487) (274,991)- Interest expense 640 229,279- Distributions to holders of redeemable participating shares – 11,484,791- Dividend income (196,725) (121,385,319)- Withholding tax 16,321 17,919,189- Net (gain)/loss on foreign exchange 1,923 6,815,062 2,430,973 2,262,685,554 Net (increase)/decrease in financial assets at fair value through profit or loss (3,383,367) (2,777,062,289)Net (increase)/decrease in financial liabilities at fair value through profit or loss – (660,640)(Increase)/decrease in margin accounts – 7,272,716Net (increase)/decrease in due from/to brokers (59) (98,890,668)(Increase)/Decrease in other operating debtors 50,587 146,336Increase/(Decrease) in other operating creditors (8,875) (3,783,091)Cash (used in)/provided by operations (910,741) (610,292,082) Interest received 487 274,991Interest paid (640) (229,279)Dividend received 187,516 125,016,186Taxation paid (16,321) (17,919,189)Net cash (outflow)/inflow from operating activities (739,699) (503,149,373) Cash flows from financing activities Distributions paid to holders of redeemable participating shares – (17,147,493)Proceeds from redeemable participating shares issued 284,787 4,808,917,058Payment on redemption of redeemable participating shares (220,696) (4,137,188,524)Net cash inflow/(outflow) from financing activities 64,091 654,581,041 Net increase/(decrease) in cash and cash equivalents (675,608) 151,431,668Cash and cash equivalents at beginning of year 717,152 215,616,608Net gain/(loss) on foreign exchange (1,923) (6,815,062)Exchange adjustment due to currency conversion – (286,900) Cash and cash equivalents at end of year 39,621 359,946,314*
*Cash and cash equivalents include bank overdraft. ** The figures have been adjusted to account for balances held in the name of the Company on cash collection accounts. The total adjustment to Cash and cash equivalents is USD (379,901).

VERITAS FUNDS PLC
The notes to the financial statements form an integral part of these financial statements.
83
STATEMENT OF CASH FLOWS FOR THE YEAR ENDED 30 SEPTEMBER 2020
Veritas Veritas Veritas Global Asian Global Focus Equity Income Fund Fund Fund USD USD GBP
Cash flows from operating activities
Increase/(decrease) in net assets attributable to holders of redeemable participating shares from operations 1,216,724,474 304,539,984 (53,345,029)
Adjustment for: – Interest income (3,562,149) (4,784,942) (80,842) – Interest expense 24,292 114,993 9,722 – Distributions to holders of redeemable participating shares 1,120,051 1,264,412 11,963,144 – Dividend income (34,314,557) (36,182,022) (15,062,648) – Withholding tax 5,058,220 5,324,525 1,426,004 – Net (gain)/loss on foreign exchange 3,100,605 1,322,832 85,393 1,188,150,936 271,599,782 (55,004,256) Net (increase)/decrease in financial assets at fair value through profit or loss (3,312,627,937) (553,462,216) 192,071,131 Net (increase)/decrease in financial liabilities at fair value through profit or loss - 953,606 (12,212) (Increase)/decrease in margin accounts 120,709,950 - - Net (increase)/decrease in due from/to brokers (18,508,812) 25,200,809 39,083,327 (Increase)/Decrease in other operating debtors (1,569) (1,174) - Increase/(Decrease) in other operating creditors 1,247,002 (4,579,704) (2,053,804) Cash (used in)/provided by operations (2,021,030,430) (260,288,897) 174,084,186 Interest received 3,565,831 5,217,504 80,842 Interest paid (24,292) (114,993) (9,722) Dividend received 33,357,497 36,220,853 15,213,156 Taxation paid (5,058,220) (5,324,525) (1,426,004)
Net cash (outflow)/inflow from operating activities (1,989,189,614) (224,290,058) 187,942,458
Cash flows from financing activities Distributions paid to holders of redeemable participating shares (6,887,740) (5,619,241) (16,752,546) Proceeds from redeemable participating shares issued 2,973,746,530 538,106,398 26,816,765 Payment on redemption of redeemable participating shares (1,139,671,815) (822,533,407) (223,000,665)
Net cash inflow/(outflow) from financing activities 1,827,186,975 (290,046,250) (212,936,446)
Net increase/(decrease) in cash and cash equivalents (162,002,639) (514,336,308) (24,993,988) Cash and cash equivalents at beginning of year 301,744,523 571,070,043 34,138,529 Net gain/(loss) on foreign exchange (3,100,605) (1,322,832) (85,393) Exchange adjustment due to currency conversion - - -
Cash and cash equivalents at end of year 136,641,279 55,410,903* 9,059,148
*Cash and cash equivalents include bank overdraft.

VERITAS FUNDS PLC
The notes to the financial statements form an integral part of these financial statements.
84
STATEMENT OF CASH FLOWS FOR THE YEAR ENDED 30 SEPTEMBER 2020
(CONTINUED)
Veritas Veritas Veritas China Global Real Izoard Fund Return Fund Fund USD GBP USD
Cash flows from operating activities
Increase/(decrease) in net assets attributable to holders of redeemable participating shares from operations 11,362,260 11,258,818 5,747,361
Adjustment for: – Interest income (57,342) (134,902) (77,379) – Interest expense 8,369 200,084 532 – Distributions to holders of redeemable participating shares - - 543,414 – Dividend income (211,637) (2,848,245) (1,008,809) – Withholding tax 17,701 487,892 107,520 – Net (gain)/loss on foreign exchange 11,954 984,208 18,105
11,131,305 9,947,855 5,330,744
Net (increase)/decrease in financial assets at fair value through profit or loss (17,963,426) (49,901,022) (18,340,466) Net (increase)/decrease in financial liabilities at fair value through profit or loss
-
(712,237)
-
(Increase)/decrease in margin accounts 869,948 (8,497,124) - Net (increase)/decrease in due from/to brokers 343,325 3,738,231 2,319,231 (Increase)/Decrease in other operating debtors (52,280) (26) (42,331) Increase/(Decrease) in other operating creditors (14,666) (750,361) (43,766)
Cash (used in)/provided by operations (5,685,794) (46,174,684) (10,776,588) Interest received 57,521 134,902 77,379 Interest paid (8,369) (200,084) (532) Dividend received 211,637 2,944,624 1,006,764 Taxation paid (17,701) (487,892) (107,520)
Net cash (outflow)/inflow from operating activities (5,442,706) (43,783,134) (9,800,497)
Cash flows from financing activities Distributions to holders of redeemable participating shares (27,763) (542,145) (848,512) Proceeds from redeemable participating shares issued 3,939,024 113,108,612 4,405,838 Payment on redemption of redeemable participating shares (1,672,878) (120,134,999) (1,773,945)
Net cash inflow/(outflow) from financing activities 2,238,383 (7,568,532) 1,783,381
Net increase/(decrease) in cash and cash equivalents (3,204,323) (51,351,666) (8,017,116) Cash and cash equivalents at beginning of year 11,012,516 52,487,873 11,225,942 Net gain/(loss) on foreign exchange (11,954) (984,208) (18,105) Exchange adjustment due to currency conversion - - -
Cash and cash equivalents at end of year 7,796,239 151,999* 3,190,721
*Cash and cash equivalents include bank overdraft.
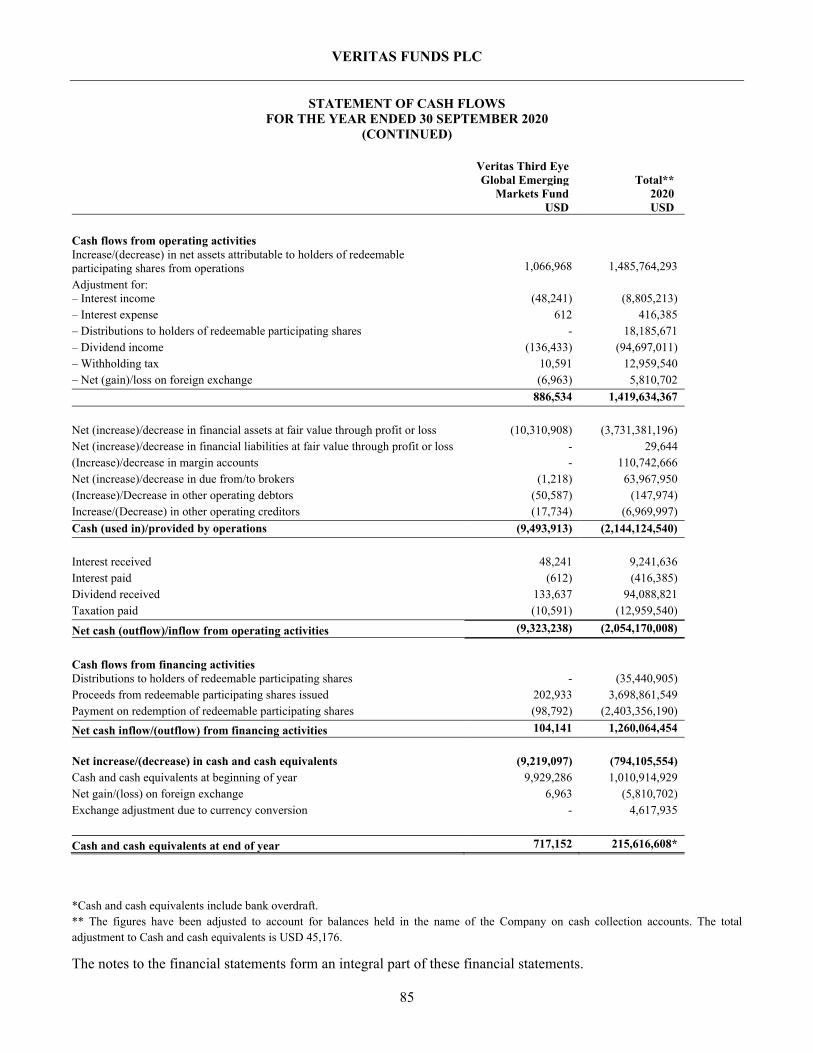
VERITAS FUNDS PLC
The notes to the financial statements form an integral part of these financial statements.
85
STATEMENT OF CASH FLOWS FOR THE YEAR ENDED 30 SEPTEMBER 2020
(CONTINUED)
Veritas Third Eye Global Emerging Total** Markets Fund 2020 USD USD
Cash flows from operating activities Increase/(decrease) in net assets attributable to holders of redeemable participating shares from operations 1,066,968 1,485,764,293
Adjustment for: – Interest income (48,241) (8,805,213) – Interest expense 612 416,385 – Distributions to holders of redeemable participating shares - 18,185,671 – Dividend income (136,433) (94,697,011) – Withholding tax 10,591 12,959,540 – Net (gain)/loss on foreign exchange (6,963) 5,810,702
886,534 1,419,634,367
Net (increase)/decrease in financial assets at fair value through profit or loss (10,310,908) (3,731,381,196) Net (increase)/decrease in financial liabilities at fair value through profit or loss - 29,644 (Increase)/decrease in margin accounts - 110,742,666 Net (increase)/decrease in due from/to brokers (1,218) 63,967,950 (Increase)/Decrease in other operating debtors (50,587) (147,974) Increase/(Decrease) in other operating creditors (17,734) (6,969,997)
Cash (used in)/provided by operations (9,493,913) (2,144,124,540) Interest received 48,241 9,241,636 Interest paid (612) (416,385) Dividend received 133,637 94,088,821 Taxation paid (10,591) (12,959,540)
Net cash (outflow)/inflow from operating activities (9,323,238) (2,054,170,008)
Cash flows from financing activities Distributions to holders of redeemable participating shares - (35,440,905) Proceeds from redeemable participating shares issued 202,933 3,698,861,549 Payment on redemption of redeemable participating shares (98,792) (2,403,356,190)
Net cash inflow/(outflow) from financing activities 104,141 1,260,064,454
Net increase/(decrease) in cash and cash equivalents (9,219,097) (794,105,554) Cash and cash equivalents at beginning of year 9,929,286 1,010,914,929 Net gain/(loss) on foreign exchange 6,963 (5,810,702) Exchange adjustment due to currency conversion - 4,617,935
Cash and cash equivalents at end of year 717,152 215,616,608*
*Cash and cash equivalents include bank overdraft. ** The figures have been adjusted to account for balances held in the name of the Company on cash collection accounts. The total adjustment to Cash and cash equivalents is USD 45,176.

VERITAS FUNDS PLC
NOTES TO THE FINANCIAL STATEMENTS FOR THE YEAR ENDED 30 SEPTEMBER 2021
86
1. General Veritas Funds Plc (the “Company”) was incorporated in Ireland on 24 April 2001 with registered number 342215, as an open-ended investment company with variable capital and limited liability under the Companies Act, 2014. The Company is authorised by the Central Bank (Supervision and Enforcement Act 2013 (Section 48(1)) (Undertakings for Collective Investment in Transferable Securities) Regulations 2019 (the “Central Bank UCITS Regulations”). Listing and trading of all the share classes of the Company on the Irish Stock Exchange was cancelled with effect from 14 July 2017. The Company has implemented a remuneration policy pursuant to Directive 2014/91/EU of the European Parliament and of the Council of 23 July 2014 amending Directive 2009/65/EC on the coordination of laws, regulations and administrative provisions relating to undertakings for collective investment in transferable securities (UCITS) as regards to depositary functions, remuneration policies and sanctions (the “UCITS V Directive”). The Company is an umbrella type structure with segregated liability between sub-funds (the “Sub-Funds”), in which different Sub-Funds may be issued from time to time with the prior approval of the Central Bank of Ireland. The Company is a public company, and the registered office is located in 70 Sir John Rogerson’s Quay, Dublin 2, Ireland. As at 30 September 2021, the Company has seven Sub-Funds in existence, Veritas Asian Fund, Veritas Global Focus Fund, Veritas Global Equity Income Fund, Veritas China Fund, Veritas Global Real Return Fund, Veritas Izoard Fund and Veritas Third Eye Global Emerging Markets Fund. 2. Principal accounting policies The significant accounting policies adopted by the Company are as follows: Basis of preparation These financial statements are prepared in accordance with International Financial Reporting Standards (IFRS), issued by the International Accounting Standard Board (IASB) as adopted for use in the European Union and interpretations issued by the International Financial Reporting Interpretations Committee of the IASB and with the Companies Act, 2014. The preparation of financial statements in conformity with IFRS requires management to make judgements, estimates and assumptions that affect the application of policies and the reported amounts of assets and liabilities, income and expense. The estimates and associated assumptions are based on historical experience and various other factors that are believed to be reasonable under the circumstances, the results of which form the basis of making the judgements about carrying values of assets and liabilities that are not readily apparent from other sources. Actual results may differ from these estimates and these differences may be material. The accounting policies have been applied consistently by the Company and are consistent with those used in the previous period.

VERITAS FUNDS PLC
NOTES TO THE FINANCIAL STATEMENTS FOR THE YEAR ENDED 30 SEPTEMBER 2021
(CONTINUED)
87
2. Principal accounting policies (continued) The format and certain wordings on the financial statements have been adapted from those contained in IFRS and adopted by the EU and the Companies Act 2014 so that, in the opinion of the Directors, they more appropriately reflect the nature of the Company’s business as an investment fund. All investments of the Sub-Funds, for dealing purposes, are valued in accordance with the valuation policies outlined in the Company’s offering documents, at prices as at 12 noon Irish time. For these Financial Statements a separate valuation was prepared for each Sub-Fund at last traded prices to close of business 30 September 2021. A reconciliation between the last dealing NAV of the year, 30 September 2021 and the NAV used for Financial Statements purposes is provided in note 13. Foreign currency translation a) Functional and presentation currency Items included in the Company’s financial statements are measured using the currency of the primary economic environment in which it operates. This is United States Dollar for Veritas Asian Fund, Veritas Global Focus Fund, Veritas China Fund, Veritas Izoard Fund and Veritas Third Eye Global Emerging Markets Fund and Pound Sterling for Veritas Global Equity Income Fund and Veritas Global Real Return Fund. The Company has also adopted these currencies as the presentation currency of the Sub-Funds. The overall Company total is presented in United States Dollars. For the purpose of aggregating the financial statements of the Sub-Funds, the Statement of Financial Position figures for Veritas Global Equity Income Fund and Veritas Global Real Return Fund have been translated to US Dollars at the exchange rate ruling at year end. Statement of Comprehensive Income movements and capital transactions have been translated at the average exchange rate for the year. The resulting notional gain or loss has no effect on the Net Asset Value per Share attributable to the individual Sub-Funds.

VERITAS FUNDS PLC
NOTES TO THE FINANCIAL STATEMENTS FOR THE YEAR ENDED 30 SEPTEMBER 2021
(CONTINUED)
88
2. Principal accounting policies (continued) b) Transactions and balances Monetary assets and liabilities denominated in currencies other than the functional currency are translated to the functional currency at the closing rates of exchange at year end. Non-monetary assets and liabilities denominated in currencies other than the functional currency are translated using the exchange rates at the date when the fair value was determined. Transactions during the year are translated at the rate of exchange prevailing on the date of the transaction. Income from investments Interest income is recognised in the Statement of Comprehensive Income for all debt instruments using the effective interest method. Dividend income is credited to the Statement of Comprehensive Income on the date on which the relevant securities are listed as “ex-dividend”. Dividend income is shown gross of any non-recoverable withholding taxes, which is disclosed separately in the Statement of Comprehensive Income, and net of any tax credits. Cash and cash equivalents Cash and cash equivalents include cash in hand, overnight deposits and other short term highly liquid investments with original maturities of three months or less. Margin Cash Margin cash provided by the Company is identified separately in the Statement of Financial Position as margin cash and is not included as a component of cash and cash equivalents. Due from/to brokers Amounts due from/to brokers represent receivables for securities sold and payables for securities purchased that have been contracted for but not yet delivered by the end of the year.

VERITAS FUNDS PLC
NOTES TO THE FINANCIAL STATEMENTS FOR THE YEAR ENDED 30 SEPTEMBER 2021
(CONTINUED)
89
2. Principal accounting policies (continued) Financial assets and liabilities at fair value through profit or loss (i) Classification The Company has designated its investments into the financial assets and liabilities at fair value through profit or loss category. This category has two sub-categories: financial assets and liabilities held for trading, and those designated by management at fair value through profit or loss at inception. All financial assets and liabilities at fair value through profit or loss are measured at fair value. Financial assets or liabilities held for trading are acquired or incurred principally for the purpose of selling or repurchasing in the short term. All investments have been categorised as financial assets and liabilities at fair value through profit or loss. (ii) Recognition Purchases and sales of financial instruments are accounted for at trade date - the date on which the Company commits to purchase or sell the asset. Realised gains and losses on disposals of financial instruments are calculated using the first-in-first-out (FIFO) method. (iii) Measurement Financial instruments categorised at fair value through profit or loss are measured initially at fair value, with transaction costs for such instruments being recognised in the Statement of Comprehensive Income. Gains and losses arising from changes in the fair value of financial assets and liabilities at fair value through profit or loss are included in the Statement of Comprehensive Income in the period in which they arise. (iv) Fair value measurement principles The fair value of financial assets and liabilities traded in active markets (such as publicly traded derivatives and trading securities) are based on quoted market prices at the close of trading on the reporting date. If a quoted market price is not available on a recognised stock exchange or from a broker/dealer for non-exchange-traded financial instruments, the fair value of the instrument is estimated using valuation techniques, including use of recent arm’s length market transactions, reference to the current fair value of another instrument that is substantially the same, discounted cash flow techniques, option pricing models or any other valuation technique that provides a reliable estimate of prices obtained in actual market transactions.

VERITAS FUNDS PLC
NOTES TO THE FINANCIAL STATEMENTS FOR THE YEAR ENDED 30 SEPTEMBER 2021
(CONTINUED)
90
2. Principal accounting policies (continued) Financial assets and liabilities at fair value through profit or loss (continued) (iv) Fair value measurement principles (continued) Where discounted cash flow techniques are used, estimated future cash flows are based on management’s best estimates and the discount rate used is a market rate at the Statement of Financial Position date applicable to an instrument with similar terms and conditions. Where other pricing models are used, inputs are based on market data at the Statement of Financial Position date. Fair values for unquoted equity investments are estimated, if possible, using applicable price/earnings ratios for similar listed companies adjusted to reflect the specific circumstances of the issuer. (v) Derecognition A financial asset is derecognised when the Company no longer has control over the contractual rights that comprise that asset. This occurs when the rights are realised, expire or are surrendered. A financial liability is derecognised when it is extinguished or when the obligation specified in the contract is discharged, cancelled or expired. Distributions to holders of redeemable participating shares Distributions to holders of redeemable participating shares are recorded in the Statement of Comprehensive Income as finance costs when authorised. Contracts for Difference Contracts for difference (“CFD”) are agreements between the Company and third parties which allow the Company to acquire an exposure to the price movement of specific securities without actually purchasing the securities. Upon entering into a CFD, the Company is required to deposit with a broker initial cash margin equal to a certain percentage of the contract amount. Variation margin payments are made or received by the Company depending upon the fluctuation in the value of the underlying securities. The changes in contract values are recorded as unrealised gains or losses and the Company recognises a realised gain or loss when the contract is closed or when the contract is re-set. CFDs are fair valued as the change in market value of the underlying security applied to the notional amount of the CFD held at the end of the year, representing the unrealised gain or loss on these CFDs. The market value of the underlying security is determined by reference to the quoted market price available on a recognised stock exchange. All income accruing to the underlying securities in the CFDs and the financing charges associated with the CFD trading are accrued by the Company on an accruals basis and is recognised in the Statement of Comprehensive Income as part of the net gain/(loss) on financial assets and financial liabilities at fair value through profit or loss.
VERITAS FUNDS PLC
NOTES TO THE FINANCIAL STATEMENTS FOR THE YEAR ENDED 30 SEPTEMBER 2021
(CONTINUED)
91
2. Principal accounting policies (continued) Financial assets and liabilities at fair value through profit or loss (continued) Forward foreign exchange contracts All forward foreign exchange contracts are fair valued using forward exchange rates prevailing at the relevant valuation date for the remaining period to maturity and any resulting unrealised gains are recorded as assets and and any unrealised losses are recorded as liabilities in the Statement of Financial Position. Realised gains and losses are recorded in the Statement of Comprehensive Income at the time the forward foreign exchange contract settles. Realised and unrealised gains and losses applicable to forward foreign exchange contracts entered into at Sub-Fund level are allocated at Sub-fund level. In relation to class specific forward foreign exchange contracts, the realised and unrealised gains and losses and transaction costs are allocated solely to those share classes. Futures Futures are valued at fair value based on the settlement price on the relevant valuation date. Futures are contracts for delayed delivery of commodities in which the seller agrees to make delivery at a specific future date of a specific commodity, at a specified price or yield. Gains and losses on futures are recorded by the Sub-Funds based on market fluctuations and are recorded as realised or unrealised gains/(losses) or interest income dependent upon settlement terms of the contracts held. Options An option is a contractual agreement under which the seller (writer) grants the purchaser (buyer) the right, but not the obligation, to either buy (a call option) or sell (a put option) at or by a set date or during a set period, a specific amount of securities or a financial instrument at a predetermined price. The seller receives a premium from the purchaser in consideration for the assumption of future securities price. Options held by the Company can be exchange-traded or privately negotiated over-the-counter ("OTC"). The Company is exposed to credit risk on purchased options only to the extent of their amount, which is their fair value. Options are settled on gross basis. Warrants Warrants are valued at fair value based on the quoted market price as provided by electronic feed from one or more reputable price vendors. The change in fair value, if any, is recorded as an unrealised gain or loss in the Statement of Comprehensive Income. Realised gains or losses on warrants are shown in the Statement of Comprehensive Income. On the expiry of a warrant the amount previously recognised in the Statement of Financial Position is recognised in the Statement of Comprehensive Income as a realised gain or loss.

VERITAS FUNDS PLC
NOTES TO THE FINANCIAL STATEMENTS FOR THE YEAR ENDED 30 SEPTEMBER 2021
(CONTINUED)
92
2. Principal accounting policies (continued) Financial assets and liabilities at fair value through profit or loss (continued) Offsetting of financial assets and liabilities Financial assets and liabilities are offset and the net amount reported in the Statement of Financial Position and Statement of Comprehensive Income where there is a legally enforceable right to offset the recognised amounts and there is an intention to settle on a net basis, or realise the assets and settle the liabilities simultaneously. Redeemable participating shares Redeemable participating shares are redeemable at the shareholder’s option and are classified as financial liabilities. The redeemable participating shares can be put back to the Company at any time for cash equal to a proportionate share of the particular Sub-Fund’s net asset value. The redeemable participating share is carried at the redemption amount that is payable at the year end date if the shareholder exercised its right to put the share back to the Sub-Fund. Equalisation is operated in connection with the issue and redemption of shares. It represents the income element included in the price for the issue and redemption of shares. Listed investments and investments with prices quoted in over the counter markets or by market makers are stated at the last traded prices as at 12 noon on the valuation day for the purpose of determining net asset value per share for subscriptions and redemptions and for various fee calculations. The Company has adopted IFRS 13 and changed its valuation input for financial assets and liabilities measured at fair value, based on a quoted price in an active market, to last traded prices in cases where the last traded price falls within the bid-ask spread (last traded price cannot be used where it falls outside of the bid-ask spread). As all of the last traded prices for the Company’s financial assets and liabilities fall within the bid-ask spread, there is no variance, other than those due to timing between the Net Assets per the financial statements and the published Net Asset Value disclosed in Note 13. Transaction costs Transaction costs are costs incurred to acquire financial assets or liabilities at fair value through profit or loss. They include fees and commissions paid to agents, advisers, brokers and dealers. Transaction costs, when incurred, are immediately recognised in profit or loss as an expense.
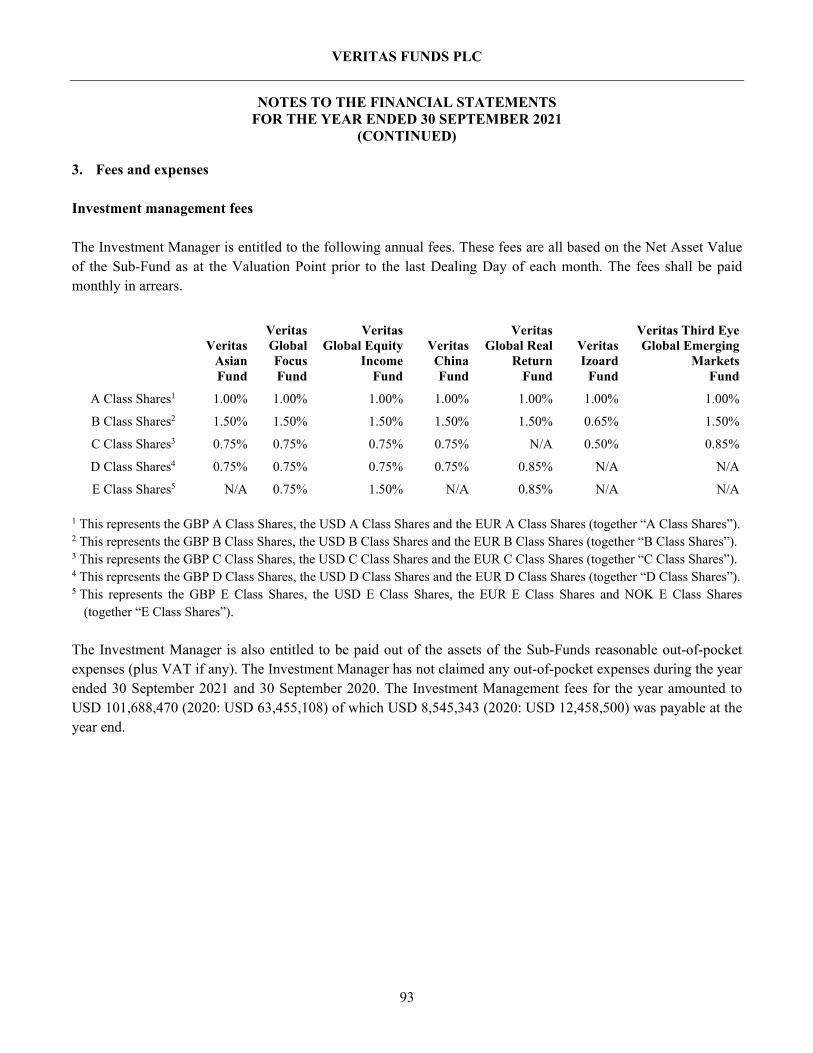
VERITAS FUNDS PLC
NOTES TO THE FINANCIAL STATEMENTS FOR THE YEAR ENDED 30 SEPTEMBER 2021
(CONTINUED)
93
3. Fees and expenses Investment management fees The Investment Manager is entitled to the following annual fees. These fees are all based on the Net Asset Value of the Sub-Fund as at the Valuation Point prior to the last Dealing Day of each month. The fees shall be paid monthly in arrears.
Veritas Asian Fund
Veritas Global Focus Fund
Veritas Global Equity
Income Fund
Veritas China Fund
Veritas Global Real
Return Fund
Veritas Izoard
Fund
Veritas Third Eye Global Emerging
Markets Fund
A Class Shares1 1.00% 1.00% 1.00% 1.00% 1.00% 1.00% 1.00%
B Class Shares2 1.50% 1.50% 1.50% 1.50% 1.50% 0.65% 1.50%
C Class Shares3 0.75% 0.75% 0.75% 0.75% N/A 0.50% 0.85%
D Class Shares4 0.75% 0.75% 0.75% 0.75% 0.85% N/A N/A
E Class Shares5 N/A 0.75% 1.50% N/A 0.85% N/A N/A 1 This represents the GBP A Class Shares, the USD A Class Shares and the EUR A Class Shares (together “A Class Shares”). 2 This represents the GBP B Class Shares, the USD B Class Shares and the EUR B Class Shares (together “B Class Shares”). 3 This represents the GBP C Class Shares, the USD C Class Shares and the EUR C Class Shares (together “C Class Shares”). 4 This represents the GBP D Class Shares, the USD D Class Shares and the EUR D Class Shares (together “D Class Shares”). 5 This represents the GBP E Class Shares, the USD E Class Shares, the EUR E Class Shares and NOK E Class Shares
(together “E Class Shares”).
The Investment Manager is also entitled to be paid out of the assets of the Sub-Funds reasonable out-of-pocket expenses (plus VAT if any). The Investment Manager has not claimed any out-of-pocket expenses during the year ended 30 September 2021 and 30 September 2020. The Investment Management fees for the year amounted to USD 101,688,470 (2020: USD 63,455,108) of which USD 8,545,343 (2020: USD 12,458,500) was payable at the year end.

VERITAS FUNDS PLC
NOTES TO THE FINANCIAL STATEMENTS FOR THE YEAR ENDED 30 SEPTEMBER 2021
(CONTINUED)
94
3. Fees and expenses (continued) Depositary fees Brown Brothers Harriman Trustee Services (Ireland) Limited, the “Depositary”, receives a monthly fee at the applicable annual rate specified in the table below based on the aggregate net asset value of the Company. Aggregate Net Assets (USD) Rate (basis points)
First 4 billion 0.80
Above 4 billion 0.60
Sub-depositary fees and agent charges will be recoverable out of the assets of the Sub-Fund and are at normal commercial rates. The Depositary is also entitled to be paid out of the assets of the Sub-Fund reasonable out-of-pocket expenses (plus VAT, if any). The depositary fee for the year amounted to USD 3,373,155 (2020: USD 1,799,143) of which USD 706,103 (2020: USD 475,913) was payable at the year end. Administration fees Brothers Harriman Fund Administration Services (Ireland) Limited, the “Administrator”, receives an annual fee at the applicable rate specified in the table below based on the total net asset value of the Company that is advised by the Investment Manager. Total Net Assets (USD) Rate (basis points)
First 4 billion 1.10
4 – 8 billion 0.90
8 – 12 billion 0.65
Above 12 billion 0.45
The administration fee is subject to a minimum monthly charge of USD 3,000. Additional services and management information will be subject to a fee based on time and charges. The Administrator is also entitled to be paid out of the assets of the Sub-Fund reasonable out-of-pocket expenses (plus VAT, if any). The administration fee for the year amounted to USD 2,325,718 (2020: USD 1,670,163) of which USD 650,245 (2020: USD 477,200) was payable at the year end.

VERITAS FUNDS PLC
NOTES TO THE FINANCIAL STATEMENTS FOR THE YEAR ENDED 30 SEPTEMBER 2021
(CONTINUED)
95
3. Fees and expenses (continued) Directors’ fees The Directors are entitled to an annual fee as remuneration for their services per annum plus reasonable out of pocket expenses. The total of such remuneration for the current year is USD 48,939 (2020: USD 76,498) of which USD 36,165 (2020: USD 45,611) is payable at year end. Mr Mike Kirby, Mr Brian Wilkinson and Mr Michael Morris are entitled to receive a maximum of EUR 25,000 each per annual as remuneration for their services. During 2021, Mr Richard Grant retired from the executive role at Veritas Asset Management however retained his position on the Board of Veritas Funds Plc. Mr Richard Grant has waived his entitlement to Directors’ fees for the financial year ended 30 September 2021. He will receive a maximum of EUR 25,000 per annum from 1 January 2022. Ms Nicola Lakin was appointed to the Board on 15 April 2021 and is a Managing Partner at the Investment Manager and will therefore waive her entitlement to Directors’ fees. Transaction costs The below table provides an analysis of the total transaction costs for the year ended 30 September 2021.
Veritas Asian Fund USD
Veritas Global Focus
Fund USD
Veritas Global Equity Income Fund
GBP
Veritas China
Fund USD
Veritas Global Real
Return Fund GBP
30 Sep 2021 30 Sep 2021 30 Sep 2021 30 Sep 2021 30 Sep 2021 Total transaction costs 13,009,103 846,561 88,589 219,932 100,990
Veritas Izoard Fund
USD
Veritas Third Eye Global Emerging
Markets Fund USD
Total USD
30 Sep 2021 30 Sep 2021 30 Sep 2021 Total transaction costs 15,508 15,333 14,365,990

VERITAS FUNDS PLC
NOTES TO THE FINANCIAL STATEMENTS FOR THE YEAR ENDED 30 SEPTEMBER 2021
(CONTINUED)
96
3. Fees and expenses (continued) Transaction costs (continued) The below table provides an analysis of the total transaction costs for the year ended 30 September 2020.
Veritas Asian Fund USD
Veritas Global Focus
Fund USD
Veritas Global Equity Income Fund
GBP
Veritas China
Fund USD
Veritas Global Real
Return Fund GBP
30 Sep 2020 30 Sep 2020 30 Sep 2020 30 Sep 2020 30 Sep 2020 Total transaction costs 6,814,557 1,561,381 266,389 99,513 202,276
Veritas Izoard Fund
USD
Veritas Third Eye Global Emerging
Markets Fund USD
Total USD
30 Sep 2020 30 Sep 2020 30 Sep 2020 Total transaction costs 39,552 16,700 9,129,438 Auditors’ fees Audit fees for the year ended 30 September 2021 amounted to USD 123,336 (2020: USD 109,573) and the amount outstanding as at 30 September 2021 was USD 123,336 (2020: USD 109,573). Fees and expenses earned by the statutory auditors, PricewaterhouseCoopers, in respect of the financial period are as follows: 30 Sep 2021 30 Sep 2020 USD USD Audit of financial statements 123,336 109,573 Tax advisory services 93,275 108,502 Total 216,611 218,075

VERITAS FUNDS PLC
NOTES TO THE FINANCIAL STATEMENTS FOR THE YEAR ENDED 30 SEPTEMBER 2021
(CONTINUED)
97
4. Taxation Under current law and practice the Company qualifies as an investment undertaking as defined in Section 739B of the Taxes Consolidation Act, 1997, ended. On that basis, it is not chargeable to Irish tax on its income or gains. However, Irish tax may arise on the happening of a "chargeable event". A chargeable event includes any distribution payments to shareholders or any encashment, redemption, cancellation or transfer of shares and the holding of shares at the end of each eight year period beginning with the acquisition of such shares. No Irish tax will arise on the Company in respect of chargeable events in respect of: (a) a shareholder who is neither Irish resident nor ordinarily resident in Ireland for tax purposes, at the time of the
chargeable event, provided appropriate valid declarations in accordance with the provisions of the Taxes Consolidation Act, 1997, are held by the Company or the Company has been authorised by the Irish Revenue to make gross payments in the absence of appropriate declarations; and
(b) certain exempted Irish tax resident shareholders who have provided the Company with the necessary signed
statutory declarations. Dividends, interest and capital gains (if any) received on investments made by the Company may be subject to withholding taxes imposed by the country from which the investment income/gains are received and such taxes may not be recoverable by the Company or its shareholders. India’s Central Board of Direct Taxes has withdrawn the exemptions provided under Section 10 of the Income-tax Act, 1961 and has introduced a new section, 112A in the Act through clause 31 of the Finance Bill, 2018. Accordingly, long-term capital gains arising from transfer of long-term capital asset exceeding INR100,000 will be taxed at a concessional rate of 10% without indexation benefit, plus applicable cess and surcharge. The tax will be imposed only on long-term capital asset transfers that take place after 1 April 2018 and will be calculated by subtracting the cost of acquisition (on or before 31 January 2018) from the full value of the consideration on the asset transfer. Gains accrued up to 31 January 2018 will continue to be exempted. On 14 November 2014, the Ministry of Finance (“MOF”) and the State Administration of Taxation (“SAT”) of People’s Republic of China (“PRC”) issued a notice regarding the tax treatment of capital gains derived by Qualified Foreign Institutional Investors (“QFIIs”). Under the notice, the MOF and SAT granted a temporary exemption from tax on capital gains derived by QFIIs from trading equity investments with effect from November 17, 2014. Although the notice states the exemption from tax on capital gains is temporary, no end date was provided. Currently, a 10% PRC withholding tax rate is imposed on dividends and interests obtained by the Sub-Funds.

VERITAS FUNDS PLC
NOTES TO THE FINANCIAL STATEMENTS FOR THE YEAR ENDED 30 SEPTEMBER 2021
(CONTINUED)
98
5. Distributions In accordance with the Sub-Funds’ constitution, the Sub-Funds may distribute its distributable income to shareholders and may declare dividends on class of Shares. Distributions will not be paid without prior notice to Shareholders. The Directors have obtained confirmation from HM Revenue & Customs that the entry of the Company into the Reporting Fund regime was accepted with effect from 1 October 2010. It is intended that the Company will conduct its affairs so as to ensure that the shares will qualify for reporting fund status throughout its life. However, though the Directors will endeavour to ensure that the Shares qualify for reporting fund status throughout its life, this cannot be guaranteed. Not all share classes will be suitable for qualification under the Reporting Fund regime. Under the reporting status regime, UK resident holders of an interest in a reporting fund will be subject to UK income tax or corporation tax on the share of the reporting Sub-Funds’ income attributable to their holding in the Sub-Funds’, whether or not distributed. Any gains will continue to be subject to capital gains tax or corporation tax on chargeable gains. Distributions made are also subject to equalisation. Equalisation is operated in connection with the issue and redemption of shares. It represents the income element included in the price for the issue and redemption of shares. Distribution for the year ended 30 September 2021
Veritas Asian
Fund USD
Veritas Global Focus
Fund USD
Veritas Global Equity Income Fund
GBP
Veritas China
Fund USD
Veritas Global Real
Return Fund GBP
Net distribution for the year - (194,559) (7,367,808) - - Add: Equalisation income received on issue of shares - - - - - Deduct: Equalisation income paid on redemption of shares - (19,121) (653,485) - - Total distributions paid - (213,680) (8,021,293) - -

VERITAS FUNDS PLC
NOTES TO THE FINANCIAL STATEMENTS FOR THE YEAR ENDED 30 SEPTEMBER 2021
(CONTINUED)
99
5. Distributions (continued)
Distribution for the year ended 30 September 2021
Veritas
Izoard Fund USD
Veritas Third Eye Global Emerging
Markets Fund USD
30 Sep 2021
Total USD
Net distribution for the year (268,824) - (10,550,649) Add: Equalisation income received on issue of shares 5,159 - 5,159 Deduct: Equalisation income paid on redemption of shares (25,494) - (939,301) Total distributions paid (289,159) - (11,484,791)
Distribution for the year ended 30 September 2020
Veritas Asian
Fund USD
Veritas Global Focus
Fund USD
Veritas Global Equity Income Fund
GBP
Veritas China
Fund USD
Veritas Global Real
Return Fund GBP
Net distribution for the year (1,075,285) (1,204,374) (11,203,934) - - Add: Equalisation income received on issue of shares 3,903
25,217
-
- -
Deduct: Equalisation income paid on redemption of shares
(48,669)
(85,255)
(759,210)
- -
Total distributions paid (1,120,051) (1,264,412) (11,963,144) - -
Distribution for the year ended 30 September 2020
Veritas
Izoard Fund USD
Veritas Third Eye Global Emerging
Markets Fund USD
30 Sep 2020
Total USD
Net distribution for the year (558,430) - (17,127,587) Add: Equalisation income received on issue of shares
15,016 - 44,136
Deduct: Equalisation income paid on redemption of shares
- - (1,102,220)
Total distributions paid (543,414) - (18,185,671)

VERITAS FUNDS PLC
NOTES TO THE FINANCIAL STATEMENTS FOR THE YEAR ENDED 30 SEPTEMBER 2021
(CONTINUED)
100
5. Distributions (continued) The dividends paid for the year ended 30 September 2021 were as follows (Share Class represents the names of the Share Classes in existence as at the year ended 30 September 2021):
Fund Share Class Date Gross Amount Veritas Global Equity Income Fund EUR A Class Shares 31 March 2021 EUR 55,312 Veritas Global Equity Income Fund EUR B Class Shares 31 March 2021 EUR 10,152 Veritas Global Equity Income Fund EUR D Class Shares 31 March 2021 EUR 11,958 Veritas Global Equity Income Fund GBP A Class Shares 31 March 2021 GBP 537,743 Veritas Global Equity Income Fund GBP B Class Shares 31 March 2021 GBP 70,537 Veritas Global Equity Income Fund GBP D Class Shares 31 March 2021 GBP 1,738,748 Veritas Global Equity Income Fund USD A Class Shares 31 March 2021 USD 52,364 Veritas Global Equity Income Fund USD B Class Shares 31 March 2021 USD 162,956 Veritas Global Equity Income Fund USD D Class Shares 31 March 2021 USD 34,198 Veritas Global Equity Income Fund USD E Class Shares 31 March 2021 USD 22,045 Veritas Global Equity Income Fund EUR A Class Shares 30 September 2021 EUR 106,197 Veritas Global Equity Income Fund EUR B Class Shares 30 September 2021 EUR 16,808 Veritas Global Equity Income Fund EUR D Class Shares 30 September 2021 EUR 21,387 Veritas Global Equity Income Fund GBP A Class Shares 30 September 2021 GBP 998,802 Veritas Global Equity Income Fund GBP B Class Shares 30 September 2021 GBP 123,037 Veritas Global Equity Income Fund GBP D Class Shares 30 September 2021 GBP 3,152,133 Veritas Global Equity Income Fund USD A Class Shares 30 September 2021 USD 101,956 Veritas Global Equity Income Fund USD B Class Shares 30 September 2021 USD 303,246 Veritas Global Equity Income Fund USD D Class Shares 30 September 2021 USD 37,891 Veritas Global Equity Income Fund USD E Class Shares 30 September 2021 USD 39,369 Veritas Global Focus Fund EUR D Class Shares 30 September 2021 EUR 830 Veritas Global Focus Fund GBP D Class Shares 30 September 2021 GBP 112,973 Veritas Global Focus Fund USD D Class Shares 30 September 2021 USD 41,830 Veritas Izoard Fund GBP C Class Shares 30 September 2021 GBP 127,804 Veritas Izoard Fund USD C Class Shares 30 September 2021 USD 97,132
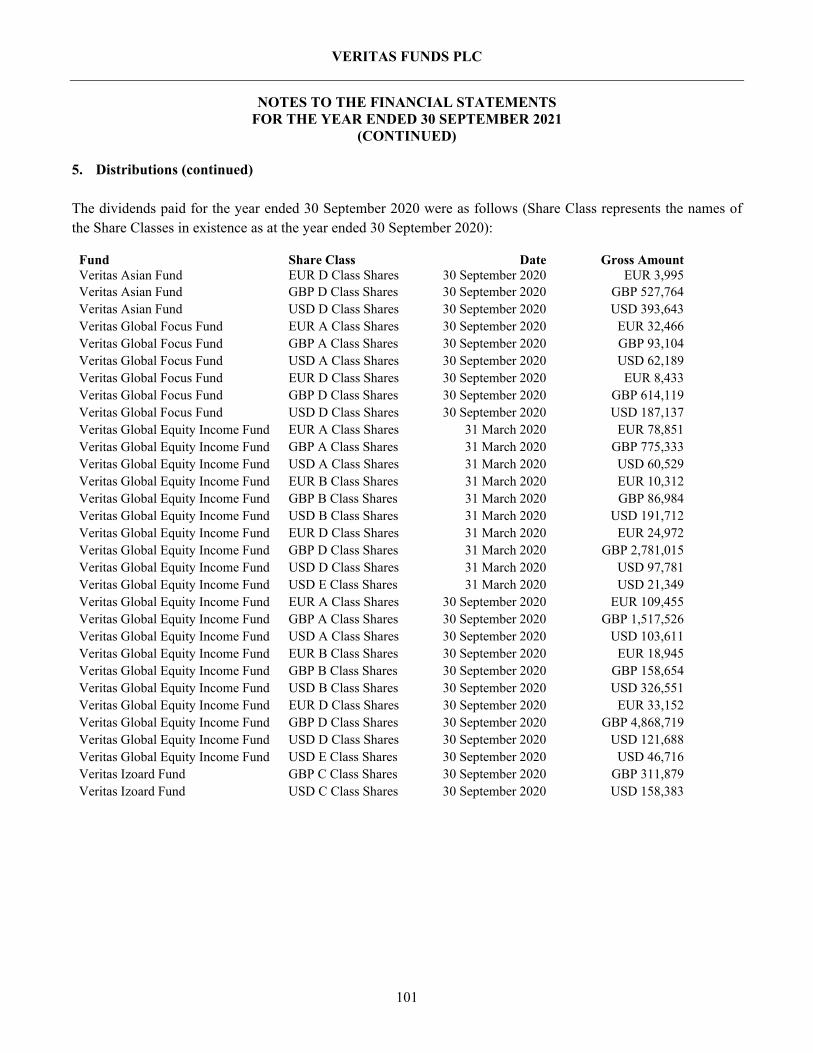
VERITAS FUNDS PLC
NOTES TO THE FINANCIAL STATEMENTS FOR THE YEAR ENDED 30 SEPTEMBER 2021
(CONTINUED)
101
5. Distributions (continued) The dividends paid for the year ended 30 September 2020 were as follows (Share Class represents the names of the Share Classes in existence as at the year ended 30 September 2020):
Fund Share Class Date Gross Amount Veritas Asian Fund EUR D Class Shares 30 September 2020 EUR 3,995 Veritas Asian Fund GBP D Class Shares 30 September 2020 GBP 527,764 Veritas Asian Fund USD D Class Shares 30 September 2020 USD 393,643 Veritas Global Focus Fund EUR A Class Shares 30 September 2020 EUR 32,466 Veritas Global Focus Fund GBP A Class Shares 30 September 2020 GBP 93,104 Veritas Global Focus Fund USD A Class Shares 30 September 2020 USD 62,189 Veritas Global Focus Fund EUR D Class Shares 30 September 2020 EUR 8,433 Veritas Global Focus Fund GBP D Class Shares 30 September 2020 GBP 614,119 Veritas Global Focus Fund USD D Class Shares 30 September 2020 USD 187,137 Veritas Global Equity Income Fund EUR A Class Shares 31 March 2020 EUR 78,851 Veritas Global Equity Income Fund GBP A Class Shares 31 March 2020 GBP 775,333 Veritas Global Equity Income Fund USD A Class Shares 31 March 2020 USD 60,529 Veritas Global Equity Income Fund EUR B Class Shares 31 March 2020 EUR 10,312 Veritas Global Equity Income Fund GBP B Class Shares 31 March 2020 GBP 86,984 Veritas Global Equity Income Fund USD B Class Shares 31 March 2020 USD 191,712 Veritas Global Equity Income Fund EUR D Class Shares 31 March 2020 EUR 24,972 Veritas Global Equity Income Fund GBP D Class Shares 31 March 2020 GBP 2,781,015 Veritas Global Equity Income Fund USD D Class Shares 31 March 2020 USD 97,781 Veritas Global Equity Income Fund USD E Class Shares 31 March 2020 USD 21,349 Veritas Global Equity Income Fund EUR A Class Shares 30 September 2020 EUR 109,455 Veritas Global Equity Income Fund GBP A Class Shares 30 September 2020 GBP 1,517,526 Veritas Global Equity Income Fund USD A Class Shares 30 September 2020 USD 103,611 Veritas Global Equity Income Fund EUR B Class Shares 30 September 2020 EUR 18,945 Veritas Global Equity Income Fund GBP B Class Shares 30 September 2020 GBP 158,654 Veritas Global Equity Income Fund USD B Class Shares 30 September 2020 USD 326,551 Veritas Global Equity Income Fund EUR D Class Shares 30 September 2020 EUR 33,152 Veritas Global Equity Income Fund GBP D Class Shares 30 September 2020 GBP 4,868,719 Veritas Global Equity Income Fund USD D Class Shares 30 September 2020 USD 121,688 Veritas Global Equity Income Fund USD E Class Shares 30 September 2020 USD 46,716 Veritas Izoard Fund GBP C Class Shares 30 September 2020 GBP 311,879 Veritas Izoard Fund USD C Class Shares 30 September 2020 USD 158,383

VERITAS FUNDS PLC
NOTES TO THE FINANCIAL STATEMENTS FOR THE YEAR ENDED 30 SEPTEMBER 2021
(CONTINUED)
102
6. Gains and losses from financial assets and liabilities at fair value through profit and loss 30 September 2021
Veritas Asian
Fund USD
Veritas Global Focus
Fund USD
Veritas Global Equity Income Fund
GBP
Veritas China
Fund USD
Veritas Global Real
Return Fund GBP
Financial assets and liabilities at fair value through profit or loss
Realised gains/(losses) - Equity and debt investments and contracts for difference 876,116,264 384,188,015 10,363,287 4,944,997 34,119,361 - Forward contracts – 342,056 (46,822) – (3,647,685) - Futures contracts – – – – (36,686,047) Change in unrealised gains/(losses) - Equity and debt investments and contracts for difference 633,164,356 397,324,645 35,977,736 (3,297,250) 12,561,320 - Forward contracts – 634,478 (24,925) 22 (2,341,146) - Futures contracts – – – – 2,369,440 Net gain/(loss) from financial assets and liabilities at fair value through profit or loss 1,509,280,620 782,489,194 46,269,276 1,647,769 6,375,243
30 September 2021
Veritas
Izoard Fund USD
Veritas Third Eye Global Emerging
Markets Fund USD
Total USD
Realised gains/(losses) - Equity and debt investments and contracts for difference 4,829,964 179,399 1,331,159,832 - Forward contracts – – (4,716,093) - Futures contracts – – (50,226,867) Change in unrealised gains/(losses) - Equity and debt investments and contracts for difference 11,435,819 2,468,953 1,107,551,345 - Forward contracts – – (2,604,888) - Futures contracts – – 3,244,000 Net gain/(loss) from financial assets and liabilities at fair value through profit or loss 16,265,783 2,648,352 2,384,407,329

VERITAS FUNDS PLC
NOTES TO THE FINANCIAL STATEMENTS FOR THE YEAR ENDED 30 SEPTEMBER 2021
(CONTINUED)
103
6. Gains and losses from financial assets and liabilities at fair value through profit and loss (continued) 30 September 2020
Veritas Asian
Fund USD
Veritas Global Focus
Fund USD
Veritas Global Equity Income Fund
GBP
Veritas China
Fund USD
Veritas Global Real
Return Fund GBP
Financial assets and liabilities at fair value through profit or loss
Realised gains/(losses) - Equity and debt investments and contracts for difference 348,360,118 210,325,093 7,643,419 8,482,829 17,730,279 - Forward contracts (20) 1,123,094 (147,723) – (4,715,743) - Futures contracts – – – – (6,146,376) Change in unrealised gains/(losses) - Equity and debt investments and contracts for difference 877,943,516 90,207,274 (58,621,485) 3,075,601 444,276 - Forward contracts – (908,543) 75,871 – 4,075,758 - Futures contracts – – – – 1,671,044 Net gain/(loss) from financial assets and liabilities at fair value through profit or loss 1,226,303,614 300,746,918 (51,049,918) 11,558,430 13,059,238
30 September 2020
Veritas
Izoard Fund USD
Veritas Third Eye Global Emerging
Markets Fund USD
Total USD
Realised gains/(losses) - Equity and debt investments and contracts for difference 1,736,864 (465,629) 600,800,889 - Forward contracts – – (5,079,791) - Futures contracts – – (7,839,088) Change in unrealised gains/(losses) - Equity and debt investments and contracts for difference 4,005,890 1,522,219 902,555,288 - Forward contracts – – 4,386,445 - Futures contracts – – 2,131,249 Net gain/(loss) from financial assets and liabilities at fair value through profit or loss 5,742,754 1,056,590 1,496,954,992

VERITAS FUNDS PLC
NOTES TO THE FINANCIAL STATEMENTS FOR THE YEAR ENDED 30 SEPTEMBER 2021
(CONTINUED)
104
7. Financial assets and liabilities at fair value through profit or loss The following table presents the financial instruments carried on the Statement of Financial Position by caption and by level within the valuation hierarchy as at 30 September 2021:
Veritas Asian Fund 30 September 2021 Level 1
USDLevel 2
USDLevel 3
USDTotalUSD
Financial assets at fair value through profit or loss Equities 7,013,212,159 – – 7,013,212,159 Collective Investment Schemes 730,236,470 – – 730,236,470 Equity Warrants – 106,520,781 – 106,520,781
Total 7,743,448,629 106,520,781 – 7,849,969,410
Veritas Global Focus Fund 30 September 2021 Level 1
USDLevel 2
USDLevel 3*
USDTotalUSD
Financial assets at fair value through profit or loss Equities 3,400,450,834 – – 3,400,450,834 Collective Investment Schemes 206,045,934 – – 206,045,934 Forward Currency Contracts – 76,295 – 76,295
Total 3,606,496,768 76,295 – 3,606,573,063
Financial liabilities at fair value through profit or loss Forward Currency Contracts – (374,366) – (374,366)
Total – (374,366) – (374,366)
*RREEF China Commercial Trust with Nil investment value is classified under Level 3. It has been priced at Nil as all distributions relating to the investment have been disbursed to shareholders.

VERITAS FUNDS PLC
NOTES TO THE FINANCIAL STATEMENTS FOR THE YEAR ENDED 30 SEPTEMBER 2021
(CONTINUED)
105
7. Financial assets and liabilities at fair value through profit or loss (continued)
Veritas Global Equity Income Fund 30 September 2021 Level 1
GBPLevel 2
GBPLevel 3*
GBPTotalGBP
Financial assets at fair value through profit or loss Equities 243,975,670 – – 243,975,670 Collective Investment Schemes 266,208 – – 266,208 Forward Currency Contracts – 36,988 – 36,988
Total 244,241,878 36,988 – 244,278,866
Financial liabilities at fair value through profit or loss Forward Currency Contracts – (638) – (638)
Total – (638) – (638)
Veritas China Fund 30 September 2021 Level 1
USDLevel 2
USDLevel 3
USDTotalUSD
Financial assets at fair value through profit or loss Bond – 556,403 – 556,403 Equities 43,294,539 – – 43,294,539 Collective Investment Schemes 6,001,978 – – 6,001,978 Equity Warrants – 3,635,787 – 3,635,787 Forward Currency Contracts – 22 – 22
Total 49,296,517 4,192,212 – 53,488,729
*RREEF China Commercial Trust with Nil investment value is classified under Level 3. It has been priced at Nil as all distributions relating to the investment have been disbursed to shareholders.

VERITAS FUNDS PLC
NOTES TO THE FINANCIAL STATEMENTS FOR THE YEAR ENDED 30 SEPTEMBER 2021
(CONTINUED)
106
7. Financial assets and liabilities at fair value through profit or loss (continued)
Veritas Global Real Return Fund 30 September 2021 Level 1
GBPLevel 2
GBPLevel 3*
GBPTotalGBP
Financial assets at fair value through profit or loss Equities 248,579,822 – – 248,579,822 Collective Investment Schemes 636 – – 636 Future Contracts 4,713,478 – – 4,713,478 Forward Currency Contracts – 1,087,555 – 1,087,555
Total 253,293,936 1,087,555 – 254,381,491
Financial liabilities at fair value through profit or loss Future Contract (34,075) – – (34,075)Forward Currency Contracts – (71,663) – (71,663)
Total (34,075) (71,663) – (105,738)
Veritas Izoard Fund 30 September 2021 Level 1
USDLevel 2
USDLevel 3
USDTotalUSD
Financial assets at fair value through profit or loss Equities 75,405,710 – – 75,405,710 Collective Investment Schemes 2,456 – – 2,456
Total 75,408,166 – – 75,408,166
Veritas Third Eye Global Emerging Markets Fund 30 September 2021 Level 1
USDLevel 2
USDLevel 3
USDTotalUSD
Financial assets at fair value through profit or loss Equities 13,128,840 – – 13,128,840 Collective Investment Schemes 1,954 – – 1,954 Equity Warrants – 3,053,955 – 3,053,955
Total 13,130,794 3,053,955 – 16,184,749
*RREEF China Commercial Trust with Nil investment value is classified under Level 3. It has been priced at Nil as all distributions relating to the investment have been disbursed to shareholders.

VERITAS FUNDS PLC
NOTES TO THE FINANCIAL STATEMENTS FOR THE YEAR ENDED 30 SEPTEMBER 2021
(CONTINUED)
107
7. Financial assets and liabilities at fair value through profit or loss (continued) The following table presents the financial instruments carried on the Statement of Financial Position by caption and by level within the valuation hierarchy as at 30 September 2020:
Veritas Asian Fund 30 September 2020 Level 1
USDLevel 2
USDLevel 3
USDTotalUSD
Financial assets at fair value through profit or loss Equities 4,816,552,830 – – 4,816,552,830 Collective Investment Schemes 433,374,215 – – 433,374,215
Total 5,249,927,045 – – 5,249,927,045
Veritas Global Focus Fund 30 September 2020 Level 1
USDLevel 2
USDLevel 3*
USDTotalUSD
Financial assets at fair value through profit or loss Equities 3,349,406,629 – – 3,349,406,629 Collective Investment Schemes 421 – – 421 Forward Currency Contracts – 48,827 – 48,827
Total 3,349,407,050 48,827 – 3,349,455,877 Financial liabilities at fair value through profit or loss Forward Currency Contracts – (981,376) – (981,376)
Total – (981,376) – (981,376)
*RREEF China Commercial with Nil investment value is classified under Level 3. It has been priced at Nil as all distributions relating to the investment have been disbursed to shareholders.

VERITAS FUNDS PLC
NOTES TO THE FINANCIAL STATEMENTS FOR THE YEAR ENDED 30 SEPTEMBER 2021
(CONTINUED)
108
7. Financial assets and liabilities at fair value through profit or loss (continued) Veritas Global Equity Income Fund 30 September 2020 Level 1
GBPLevel 2
GBPLevel 3*
GBPTotalGBP
Financial assets at fair value through profit or loss Equities 298,671,828 – – 298,671,828 Collective Investment Schemes 265,806 – – 265,806 Forward Currency Contracts – 63,749 – 63,749
Total 298,937,634 63,749 – 299,001,383 Financial liabilities at fair value through profit or loss Forward Currency Contracts – (2,474) – (2,474)
Total – (2,474) – (2,474)
Veritas China Fund 30 September 2020 Level 1
USDLevel 2
USDLevel 3
USDTotalUSD
Financial assets at fair value through profit or loss Bond – 517,120 – 517,120 Equities 26,088,319 – – 26,088,319 Collective Investment Schemes 3,500,410 – – 3,500,410
Total 29,588,729 517,120 – 30,105,849
Veritas Global Real Return Fund 30 September 2020 Level 1
GBPLevel 2
GBPLevel 3*
GBPTotalGBP
Financial assets at fair value through profit or loss Equities 275,634,667 – – 275,634,667 Collective Investment Schemes 1 – – 1 Future Contracts 2,309,963 – – 2,309,963 Forward Currency Contracts – 3,500,112 – 3,500,112
Total 277,944,631 3,500,112 – 281,444,743 Financial liabilities at fair value through profit or loss Forward Currency Contracts – (143,074) – (143,074)
Total – (143,074) – (143,074)
*RREEF China Commercial with Nil investment value is classified under Level 3. It has been priced at Nil as all distributions relating to the investment have been disbursed to shareholders.

VERITAS FUNDS PLC
NOTES TO THE FINANCIAL STATEMENTS FOR THE YEAR ENDED 30 SEPTEMBER 2021
(CONTINUED)
109
7. Financial assets and liabilities at fair value through profit or loss (continued) Veritas Izoard Fund 30 September 2020 Level 1
USDLevel 2
USDLevel 3
USDTotalUSD
Financial assets at fair value through profit or loss Equities 68,298,334 – – 68,298,334 Collective Investment Schemes 2,000,445 – – 2,000,445
Total 70,298,779 – – 70,298,779
Veritas Third Eye Global Emerging Markets Fund 30 September 2020 Level 1
USDLevel 2
USDLevel 3
USDTotalUSD
Financial assets at fair value through profit or loss Equities 10,403,139 – – 10,403,139 Collective Investment Schemes 802,411 – – 802,411 Equity Warrants – 1,595,832 – 1,595,832
Total 11,205,550 1,595,832 – 12,801,382
In determining an instrument's placement within the hierarchy, the Directors separate the Company's investment portfolio into two categories: investments and derivative instruments. Each of these categories can further be divided between financial assets or financial liabilities. Investments Investments whose values are based on quoted market prices in active markets, and are therefore classified within level 1. Investments that trade in markets that are not considered to be active, but are valued based on quoted market prices, dealer quotations or alternative pricing sources supported by observable inputs are classified within level 2. Investments classified within level 3 have significant unobservable inputs, as they trade infrequently or not at all. When observable prices are not available for these securities, the Directors uses one or more valuation techniques (e.g., the market approach or the income approach) for which sufficient and reliable data is available. Within level 3, the use of the market approach generally consists of using comparable market transactions, while the use of the income approach generally consists of the net present value of estimated future cash flows, adjusted as appropriate for liquidity, credit, market and/or other risk factors.

VERITAS FUNDS PLC
NOTES TO THE FINANCIAL STATEMENTS FOR THE YEAR ENDED 30 SEPTEMBER 2021
(CONTINUED)
110
7. Financial assets and liabilities at fair value through profit or loss (continued) Investments (continued) The inputs used by the Directors in estimating the value of investments in collective investment schemes classified as level 3 includes the redemption value based on the net asset value of the respective collective investment scheme, as indicated by the management of the underlying collective investment schemes. Level 3 investments may also be adjusted to reflect illiquidity and/or non-transferability, with the amount of such discount estimated by the Directors in the absence of market information. Assumptions used by the Directors due to the lack of observable inputs may significantly impact the resulting fair value and therefore the Company's results of operations. Derivative Instruments Derivative instruments can be exchange-traded or privately negotiated over-the-counter ("OTC"). OTC derivatives, such as generic forward foreign exchange contracts and CFD’s have inputs which can generally be corroborated by market data and are therefore classified within level 2. Futures are exchange traded and are therefore classified as level 1. The Company considers the transfers between different levels to occur when there is a change in significant observable and unobservable inputs for a particular investment. There were no transfers between different level of investments during the year ended 30 September 2021 (30 September 2020: Nil). The Company's assets and liabilities (by class) not measured at fair value but for which fair value is disclosed are level 1. These assets and liabilities are carried at amortised cost, their carrying values are a reasonable approximation of fair value.

VERITAS FUNDS PLC
NOTES TO THE FINANCIAL STATEMENTS FOR THE YEAR ENDED 30 SEPTEMBER 2021
(CONTINUED)
111
7. Financial assets and liabilities at fair value through profit or loss (continued) Offsetting Financial Instruments Veritas Global Focus Fund 30 September 2021 The following tables present the Fund’s financial assets and liabilities subject to offsetting, enforceable master netting arrangements and similar agreements. Financial assets which are subject to enforceable master netting arrangements or similar agreements are detailed in the following table.
Description of type of financial assets
Gross amount of recognised
financial assets
Gross amounts of financial
liabilities offset in the
statement of financial position
Net amount of financial assets
presented in the statement
of financial position
Gross amounts not offset in the statement of financial
position
Net amount
Financial instrument*
Cash
collateral received*
USD USD USD USD USD USD Forwards HSBC 76,295 - 76,295 (76,295) - -
76,295 - 76,295 (76,295) - -
Financial liabilities which are subject to enforceable master netting arrangements or similar agreements are detailed in the following table.
Description of type of financial liabilities
Gross amount of recognised
financial liabilities
Gross amounts of financial
assets offset in the
statement of financial position
Net amount of financial liabilities
presented in the statement
of financial position
Gross amounts not offset in the statement of financial
position
Net amount
Financial instrument*
Cash
collateral pledged*
USD USD USD USD USD USD Forwards HSBC 374,366 - 374,366 (76,295) - 298,071
374,366 - 374,366 (76,295) - 298,071

VERITAS FUNDS PLC
NOTES TO THE FINANCIAL STATEMENTS FOR THE YEAR ENDED 30 SEPTEMBER 2021
(CONTINUED)
112
7. Financial assets and liabilities at fair value through profit or loss (continued) Offsetting Financial Instruments (continued) Veritas Global Equity Income Fund 30 September 2021 The following tables present the Fund’s financial assets and liabilities subject to offsetting, enforceable master netting arrangements and similar agreements. Financial assets which are subject to enforceable master netting arrangements or similar agreements are detailed in the following table.
Description of type of financial assets
Gross amount of recognised
financial assets
Gross amounts of financial
liabilities offset in the
statement of financial position
Net amount of financial assets
presented in the statement
of financial position
Gross amounts not offset in the statement of financial
position
Net amount
Financial instrument*
Cash
collateral received*
GBP GBP GBP GBP GBP GBP Forwards HSBC 36,988 - 36,988 (638) - 36,350
36,988 - 36,988 (638) - 36,350
Financial liabilities which are subject to enforceable master netting arrangements or similar agreements are detailed in the following table.
Description of type of financial liabilities
Gross amount of recognised
financial liabilities
Gross amounts of financial
assets offset in the
statement of financial position
Net amount of financial liabilities
presented in the statement
of financial position
Gross amounts not offset in the statement of financial
position
Net amount
Financial instrument*
Cash
collateral pledged*
GBP GBP GBP GBP GBP GBP Forwards HSBC 638 - 638 (638) - -
638 - 638 (638) - -

VERITAS FUNDS PLC
NOTES TO THE FINANCIAL STATEMENTS FOR THE YEAR ENDED 30 SEPTEMBER 2021
(CONTINUED)
113
7. Financial assets and liabilities at fair value through profit or loss (continued) Offsetting Financial Instruments (continued) Veritas China Fund 30 September 2021
The following tables present the Fund’s financial assets and liabilities subject to offsetting, enforceable master netting arrangements and similar agreements.
Financial assets which are subject to enforceable master netting arrangements or similar agreements are detailed in the following table.
Description of type of financial assets
Gross amount of recognised
financial assets
Gross amounts of financial
liabilities offset in the
statement of financial position
Net amount of financial assets
presented in the statement
of financial position
Gross amounts not offset in the statement of financial
position
Net amount
Financial instrument*
Cash
collateral received*
USD USD USD USD USD USD Forwards Brown Brothers Harriman & Co 22 - 22 - - 22
22 - 22 - - 22

VERITAS FUNDS PLC
NOTES TO THE FINANCIAL STATEMENTS FOR THE YEAR ENDED 30 SEPTEMBER 2021
(CONTINUED)
114
7. Financial assets and liabilities at fair value through profit or loss (continued) Offsetting Financial Instruments (continued) Veritas Global Real Return Fund 30 September 2021 The following tables present the Fund’s financial assets and liabilities subject to offsetting, enforceable master netting arrangements and similar agreements. Financial assets which are subject to enforceable master netting arrangements or similar agreements are detailed in the following table.
Description of type of financial assets
Gross amount of recognised
financial assets
Gross amounts of financial
liabilities offset in the
statement of financial position
Net amount of financial assets
presented in the statement
of financial position
Gross amounts not offset in the statement of financial
position
Net amount
Financial instrument*
Cash
collateral received*
GBP GBP GBP GBP GBP GBP Forwards Brown Brothers Harriman & Co 24,271 - 24,271 (24,271) - - HSBC 1,063,284 - 1,063,284 (21,977) - 1,041,307
1,087,555 - 1,087,555 (46,248) - 1,041,307
Financial liabilities which are subject to enforceable master netting arrangements or similar agreements are detailed in the following table.
Description of type of financial liabilities
Gross amount of recognised
financial liabilities
Gross amounts of financial
assets offset in the
statement of financial position
Net amount of financial liabilities
presented in the statement
of financial position
Gross amounts not offset in the statement of financial
position
Net amount
Financial instrument*
Cash
collateral pledged*
GBP GBP GBP GBP GBP GBP Forwards Brown Brothers Harriman & Co 49,686 - 49,686 (24,271) - 25,415 HSBC 21,977 - 21,977 (21,977) - -
71,663 - 71,663 (46,248) - 25,415

VERITAS FUNDS PLC
NOTES TO THE FINANCIAL STATEMENTS FOR THE YEAR ENDED 30 SEPTEMBER 2021
(CONTINUED)
115
7. Financial assets and liabilities at fair value through profit or loss (continued) Offsetting Financial Instruments (continued) Veritas Global Focus Fund 30 September 2020 The following tables present the Fund’s financial assets and liabilities subject to offsetting, enforceable master netting arrangements and similar agreements. Financial assets which are subject to enforceable master netting arrangements or similar agreements are detailed in the following table.
Description of type of financial assets
Gross amount of recognised
financial assets
Gross amounts of financial
liabilities offset in the
statement of financial position
Net amount of financial assets
presented in the statement
of financial position
Gross amounts not offset in the statement of financial
position
Net amount
Financial instrument*
Cash
collateral received*
USD USD USD USD USD USD Forwards HSBC 48,827 - 48,827 (48,827) - -
48,827 - 48,827 (48,827) - -
Financial liabilities which are subject to enforceable master netting arrangements or similar agreements are detailed in the following table.
Description of type of financial liabilities
Gross amount of recognised
financial liabilities
Gross amounts of financial
assets offset in the
statement of financial position
Net amount of financial liabilities
presented in the statement
of financial position
Gross amounts not offset in the statement of financial
position
Net amount
Financial instrument*
Cash
collateral pledged*
USD USD USD USD USD USD Forwards HSBC 981,376 - 981,376 (48,827) - 932,549
981,376 - 981,376 (48,827) - 932,549

VERITAS FUNDS PLC
NOTES TO THE FINANCIAL STATEMENTS FOR THE YEAR ENDED 30 SEPTEMBER 2021
(CONTINUED)
116
7. Financial assets and liabilities at fair value through profit or loss (continued) Offsetting Financial Instruments (continued) Veritas Global Equity Income Fund 30 September 2020 The following tables present the Fund’s financial assets and liabilities subject to offsetting, enforceable master netting arrangements and similar agreements. Financial assets which are subject to enforceable master netting arrangements or similar agreements are detailed in the following table.
Description of type of financial assets
Gross amount of recognised
financial assets
Gross amounts of financial
liabilities offset in the
statement of financial position
Net amount of financial assets
presented in the statement
of financial position
Gross amounts not offset in the statement of financial
position
Net amount
Financial instrument*
Cash
collateral received*
GBP GBP GBP GBP GBP GBP Forwards HSBC 63,749 - 63,749 (2,474) - 61,275
63,749 - 63,749 (2,474) - 61,275
Financial liabilities which are subject to enforceable master netting arrangements or similar agreements are detailed in the following table.
Description of type of financial liabilities
Gross amount of recognised
financial liabilities
Gross amounts of financial
assets offset in the
statement of financial position
Net amount of financial liabilities
presented in the statement
of financial position
Gross amounts not offset in the statement of financial
position
Net amount
Financial instrument*
Cash
collateral pledged*
GBP GBP GBP GBP GBP GBP Forwards HSBC 2,474 - 2,474 (2,474) - -
2,474 - 2,474 (2,474) - -

VERITAS FUNDS PLC
NOTES TO THE FINANCIAL STATEMENTS FOR THE YEAR ENDED 30 SEPTEMBER 2021
(CONTINUED)
117
7. Financial assets and liabilities at fair value through profit or loss (continued) Offsetting Financial Instruments (continued) Veritas Global Real Return Fund 30 September 2020 The following tables present the Fund’s financial assets and liabilities subject to offsetting, enforceable master netting arrangements and similar agreements. Financial assets which are subject to enforceable master netting arrangements or similar agreements are detailed in the following table.
Description of type of financial assets
Gross amount of recognised
financial assets
Gross amounts of financial
liabilities offset in the
statement of financial position
Net amount of financial assets
presented in the statement
of financial position
Gross amounts not offset in the statement of financial
position
Net amount
Financial instrument*
Cash
collateral received*
GBP GBP GBP GBP GBP GBP Forwards Brown Brothers Harriman & Co 35,611 - 35,611 (25,923) - 9,688 HSBC 3,464,501 - 3,464,501 (117,151) - 3,347,350
3,500,112 - 3,500,112 (143,074) - 3,357,038

VERITAS FUNDS PLC
NOTES TO THE FINANCIAL STATEMENTS FOR THE YEAR ENDED 30 SEPTEMBER 2021
(CONTINUED)
118
7. Financial assets and liabilities at fair value through profit or loss (continued) Offsetting Financial Instruments (continued) Veritas Global Real Return Fund (continued) 30 September 2020 (continued) Financial liabilities which are subject to enforceable master netting arrangements or similar agreements are detailed in the following table.
Description of type of financial liabilities
Gross amount of recognised
financial liabilities
Gross amounts of financial
assets offset in the
statement of financial position
Net amount of financial liabilities
presented in the statement
of financial position
Gross amounts not offset in the statement of financial
position
Net amount
Financial instrument*
Cash
collateral pledged*
GBP GBP GBP GBP GBP GBP Forwards Brown Brothers Harriman & Co 25,923 - 25,923 (25,923) - - HSBC 117,151 - 117,151 (117,151) - -
143,074 - 143,074 (143,074) - -
*Cash collateral and other financial instruments amounts disclosed in the above tables have been limited to the net amount of financial assets or liabilities presented in the Statement of Financial Position to eliminate the effect of over collateralisation. The net amount represents the net amount due to the counterparty in the event of a default based on contractual set-off rights under the applicable ISDA/Master-Netting agreement. The actual value of collateral may be more or less than the amount presented.

VERITAS FUNDS PLC
NOTES TO THE FINANCIAL STATEMENTS FOR THE YEAR ENDED 30 SEPTEMBER 2021
(CONTINUED)
119
8. Cash and cash equivalents, margin cash held with brokers and bank overdraft As at 30 September 2021
Veritas Asian
Fund USD
Veritas Global Focus
Fund USD
Veritas Global Equity Income Fund
GBP
Veritas China
Fund USD
Veritas Global Real
Return Fund GBP
Cash and cash equivalents ANZ 868,561 - - 3,036,534 - Barclays - - - - - Brown Brothers Harriman 25,360,347 - - 6,042 - Citibank - - 3,577,935 - 5,960,772 HSBC Bank Plc - 830,131 - - 40,356 JPMorgan 257,039,076 - - - - National Australia Bank - - - 3,178,939 - Sumitomo - 49,739,953 786,794 3,178,939 442,630 283,267,984 50,570,084 4,364,729 9,400,454 6,443,758 Cash Margins UBS - - - 265 7,970,440 - - - 265 7,970,440 Bank overdraft Brown Brothers Harriman - (337) (501) - (17) - (337) (501) - (17)
Veritas
Izoard Fund USD
Veritas Third Eye Global Emerging
Markets Fund USD
Total* USD
Cash and cash equivalents ANZ - - 3,905,095 Barclays - 39,621 39,621 Brown Brothers Harriman - - 24,986,488 Citibank - - 12,814,299 HSBC Bank Plc - - 884,345 JPMorgan 2,511,020 - 259,550,096 National Australia Bank - - 3,178,939 Sumitomo 17,964 - 54,588,464 2,528,984 39,621 359,947,347 Cash Margins UBS - - 10,707,754 - - 10,707,754 Bank overdraft Brown Brothers Harriman - - (1,033) - - (1,033)
*The figures have been adjusted to account for balances held in the name of the Company on cash collection accounts.

VERITAS FUNDS PLC
NOTES TO THE FINANCIAL STATEMENTS FOR THE YEAR ENDED 30 SEPTEMBER 2021
(CONTINUED)
120
8. Cash and cash equivalents, margin cash held with brokers and bank overdraft (continued) As at 30 September 2020
Veritas Asian
Fund USD
Veritas Global Focus
Fund USD
Veritas Global Equity Income Fund
GBP
Veritas China
Fund USD
Veritas Global Real
Return Fund GBP
Cash and cash equivalents ANZ - - - 1,527,848 - Barclays - 54,794,040 - - - Brown Brothers Harriman 1,525 - 42 10,336 - HSBC Bank Plc 638,927 - - - - JPMorgan - - - 1,872,813 461,111 Sumitomo 135,992,913 616,941 9,059,106 3,745,626 - UBS 7,914 - - 639,616 - 136,641,279 55,410,981 9,059,148 7,796,239 461,111 Cash Margins UBS - - - 266 13,282,481 - - - 266 13,282,481 Bank overdraft Brown Brothers Harriman - (78) - - (309,112) - (78) - - (309,112)
Veritas Izoard Fund
USD
Veritas Third Eye Global Emerging
Markets Fund USD
Total* USD
Cash and cash equivalents ANZ - - 1,527,848 Barclays - - 54,794,040 Brown Brothers Harriman 36,250 6,088 99,429 HSBC Bank Plc - - 638,927 JPMorgan 3,154,471 70,219 5,688,970 Sumitomo - - 151,975,595 UBS - 640,845 1,288,375 3,190,721 717,152 216,013,184 Cash Margins UBS - - 17,037,704 - - 17,037,704 Bank overdraft Brown Brothers Harriman - - (396,576) - - (396,576)

VERITAS FUNDS PLC
NOTES TO THE FINANCIAL STATEMENTS FOR THE YEAR ENDED 30 SEPTEMBER 2021
(CONTINUED)
121
9. Financial instruments and associated risks The Company’s investing activities expose it to various types of risk which are associated with the financial instruments and markets in which it invests. The most significant types of financial risk to which the Company is exposed are market risk, credit risk, liquidity risk. Market risk includes other price risk, currency risk and interest rate risk. The Company maintains positions in a variety of derivative and non-derivative financial instruments as dictated by its investment management strategy. Asset allocation is determined by the Company’s Investment Manager who manages the distribution of the assets to achieve the investment objectives. Divergence from target asset allocations and the composition of the portfolio is monitored by the Company’s Investment Manager. The nature and extent of the financial instruments outstanding at the date of the Statement of Financial Position and the risk management policies employed by the Company are discussed below: a. Market risk Market risk is the risk that changes in interest rates, foreign exchange rates or equity and commodity prices will make an instrument less valuable or more onerous. All financial instruments are recognised at fair value, and all changes in market conditions directly affect net income. The Company uses the absolute value at risk (“VaR”) model to calculate the global exposure. The global exposure, using the absolute VaR approach, is calculated as described in the next paragraph. The Company’s market risk is managed on a daily basis by the Investment Manager within a rigorous risk management framework through diversification of the investment portfolio across countries and industries. In addition the Investment Manager uses a risk analysis system, Excerpt, to calculate ex-ante risk. The system has been developed by EM Applications, and is a well tested robust and accurate predictive model. On a monthly basis, the Investment Manager’s Head of Performance & Risk produces reports across the entire fund range of the Company, containing decomposition of risk across asset class, currencies, sectors, countries and individual positions. The risk is separated into systematic and specific risk, allowing for accurate analysis of the composition of the relevant fund. The report also contains stress tests based on historic events which moved markets significantly, and potential events which the Investment Manager judges could affect the funds. Value at Risk is calculated using 25,000 Monte Carlo simulations, and is reported at 99% confidence levels. The holding period and the historical observation period are defined as 20 days and 5 years, respectively. This is reported in conjunction with Conditional Value-at-Risk (VaR) in order to examine potential extreme events and the impact on the funds. VaR is calculated daily in accordance with UCITS rules. Minuted meetings are then held with the portfolio managers to discuss the reports. Back testing of the model used is conducted and the results are reported to the Board of Directors on a quarterly basis.

VERITAS FUNDS PLC
NOTES TO THE FINANCIAL STATEMENTS FOR THE YEAR ENDED 30 SEPTEMBER 2021
(CONTINUED)
122
9. Financial instruments and associated risks (continued) a) Market risk (continued) The Company, may employ techniques and instruments including but not limited to futures, options, FX forwards, Contracts for Difference (CFDs) and equity swaps (all as described in detail below) relating to transferable securities and/or other financial instruments in which it invests for Efficient Portfolio Management purposes and for investment purposes. The below table provides an analysis of the VaR measures and leverage levels for the Sub-Funds of the Company for the year ended 30 September 2021 and 30 September 2020. Veritas Asian Fund 30 Sep 2021 30 Sep 2020 VaR as at the year end (11.46%) (10.43%) Lowest VaR limit utilized during the year (10.57%) (7.27%) Highest VaR limit utilized during the year (13.29%) (11.83%) Average VaR limit utilized during the year (11.83%) (9.21%) Lowest leverage level employed during the year - - Highest leverage level employed during the year 0.23% - Average leverage level employed during the year 0.02% -
Veritas Global Focus Fund 30 Sep 2021 30 Sep 2020 VaR as at the year end (10.66%) (10.69%) Lowest VaR limit utilized during the year (10.59%) (6.01%) Highest VaR limit utilized during the year (11.74%) (10.78%) Average VaR limit utilized during the year (11.04%) (8.18%) Lowest leverage level employed during the year - - Highest leverage level employed during the year - 0.10% Average leverage level employed during the year - 0.01%
Veritas Global Equity Income Fund 30 Sep 2021 30 Sep 2020 VaR as at the year end (8.60%) (7.94%) Lowest VaR limit utilized during the year (7.86%) (5.90%) Highest VaR limit utilized during the year (8.87%) (8.50%) Average VaR limit utilized during the year (8.47%) (7.14%) Lowest leverage level employed during the year - - Highest leverage level employed during the year - - Average leverage level employed during the year - -
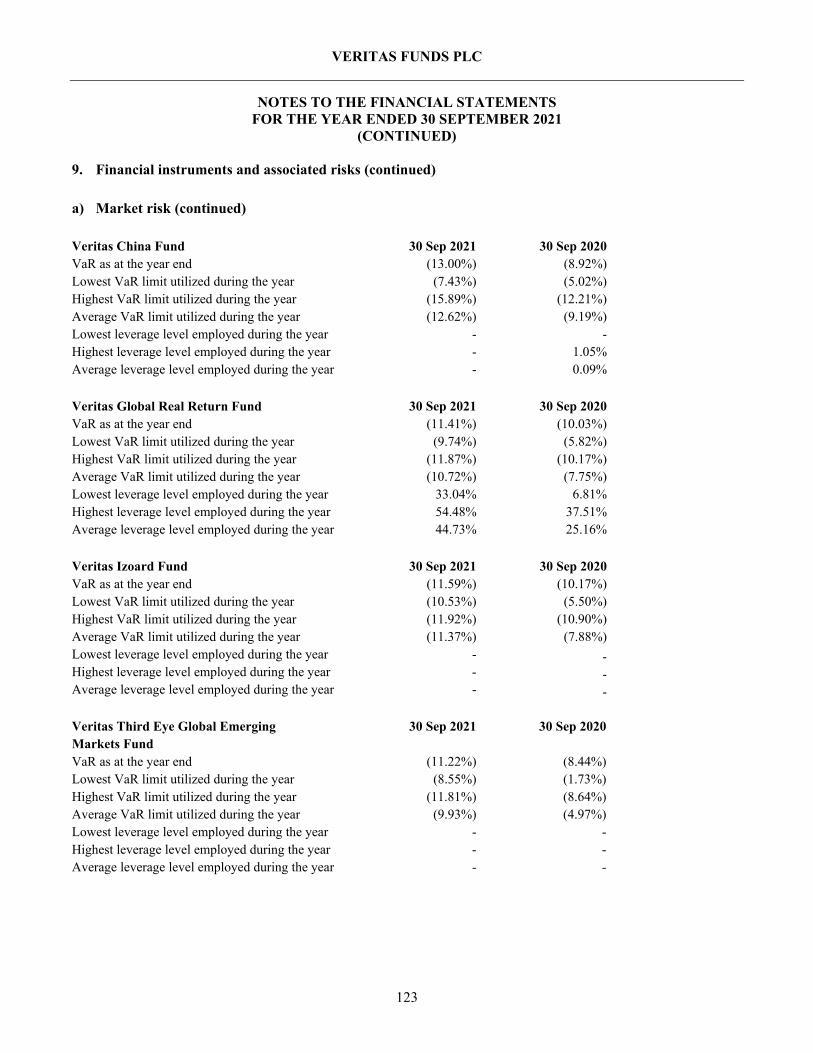
VERITAS FUNDS PLC
NOTES TO THE FINANCIAL STATEMENTS FOR THE YEAR ENDED 30 SEPTEMBER 2021
(CONTINUED)
123
9. Financial instruments and associated risks (continued) a) Market risk (continued) Veritas China Fund 30 Sep 2021 30 Sep 2020 VaR as at the year end (13.00%) (8.92%) Lowest VaR limit utilized during the year (7.43%) (5.02%) Highest VaR limit utilized during the year (15.89%) (12.21%) Average VaR limit utilized during the year (12.62%) (9.19%) Lowest leverage level employed during the year - - Highest leverage level employed during the year - 1.05% Average leverage level employed during the year - 0.09%
Veritas Global Real Return Fund 30 Sep 2021 30 Sep 2020 VaR as at the year end (11.41%) (10.03%) Lowest VaR limit utilized during the year (9.74%) (5.82%) Highest VaR limit utilized during the year (11.87%) (10.17%) Average VaR limit utilized during the year (10.72%) (7.75%) Lowest leverage level employed during the year 33.04% 6.81% Highest leverage level employed during the year 54.48% 37.51% Average leverage level employed during the year 44.73% 25.16%
Veritas Izoard Fund 30 Sep 2021 30 Sep 2020 VaR as at the year end (11.59%) (10.17%) Lowest VaR limit utilized during the year (10.53%) (5.50%) Highest VaR limit utilized during the year (11.92%) (10.90%) Average VaR limit utilized during the year (11.37%) (7.88%) Lowest leverage level employed during the year - - Highest leverage level employed during the year - - Average leverage level employed during the year - - Veritas Third Eye Global Emerging Markets Fund
30 Sep 2021 30 Sep 2020
VaR as at the year end (11.22%) (8.44%) Lowest VaR limit utilized during the year (8.55%) (1.73%) Highest VaR limit utilized during the year (11.81%) (8.64%) Average VaR limit utilized during the year (9.93%) (4.97%) Lowest leverage level employed during the year - - Highest leverage level employed during the year - - Average leverage level employed during the year - -

VERITAS FUNDS PLC
NOTES TO THE FINANCIAL STATEMENTS FOR THE YEAR ENDED 30 SEPTEMBER 2021
(CONTINUED)
124
9. Financial instruments and associated risks (continued) a) Market risk (continued) To achieve the Company’s investment aims the Investment Manager employs a global thematic and unconstrained investment approach with the ability to hold a level of cash if insufficient compelling equity opportunities are identified. The Investment Manager seeks investment opportunities regardless of where the company is domiciled (i.e. globally). As a result the theoretical investment universe is all global companies. However, as the investment criteria utilised for selecting equities involves quality measures, liquidity/size constraints as well as valuation measures, investments in most developing countries will not be considered. As examples, in Latin America only a selected few Mexican and Brazilian companies would qualify under our investment criteria. In Asia a number of investment opportunities are available in countries including Hong Kong, South Korea, Malaysia and Singapore. The Investment Manager does not attempt to manipulate the portfolio to deliver a certain country and sector weighting and allocations are therefore solely a function of bottom up analysis. However the Investment Manager does ensure a satisfactory level of diversification by way of both sector and geography although this is not based on index weightings. Details of the Company’s investment portfolio and derivatives at the Statement of Financial Position date are disclosed in the schedule of investments. The Company uses the commitment approach for Veritas Global Focus Fund, Veritas Asian Fund, Veritas Global Equity Income Fund, Veritas China Fund, Veritas Izoard Fund and Veritas Third Eye Global Emerging Markets Fund and VaR approach for Veritas Global Real Return Fund to calculate the global exposure to ensure that the use of financial derivative instruments is within the limits specified by the Central Bank. Where the commitment approach is used to calculate the global exposure no leverage should arise. Other price risk Other price risk is the risk that the fair values of equities or future cash flows of a financial instrument will fluctuate because of changes in market prices (other than those arising from interest rate risk or currency risk). The Investment Manager attempts to mitigate this risk through the construction of a well-diversified portfolio. In accordance with the Company’s policies and procedures in place, the Investment Manager monitors the Company’s overall other price risk on a daily basis, and the Board of Directors reviews it on a quarterly basis. There were no changes in the other price risk management policies and procedures from the prior year ended 30 September 2020.

VERITAS FUNDS PLC
NOTES TO THE FINANCIAL STATEMENTS FOR THE YEAR ENDED 30 SEPTEMBER 2021
(CONTINUED)
125
9. Financial instruments and associated risks (continued) a) Market risk (continued) Currency risk Currency risk is the risk that the fair value of future cash flows of a financial instrument will fluctuate because of changes in foreign exchange rates. The Company may invest in financial instruments and enter into transactions denominated in currencies other than its functional currency. Consequently, the Company is exposed to risks that the exchange rate of its currency relative to other foreign currencies may change in a manner that has an adverse effect on the value of that portion of the Company’s assets or liabilities denominated in currencies other than the Sub-Funds’ respective functional currency. Monetary items are units of currency held and assets and liabilities to be received or paid in a fixed or determinable number of units of currency. Monetary assets and liabilities include cash and cash equivalents, marketable debt securities, trade receivables and payables including due to/from brokers, and monies due to/from brokers. All assets and liabilities that do not meet the definition of monetary items are classified as non-monetary. Marketable equity investments are considered non-monetary assets. The currency risk associated with equities is included in other price risk. Once paid in or accumulated, all elements of net assets attributable to holders of redeemable participating shares are non-monetary. The Sub-Funds are authorised for purposes of efficient portfolio management to enter into forward foreign exchange contracts for the purpose of managing the foreign currency exposure arising from the Sub-Funds’ investment or anticipated investment in securities denominated in foreign currencies. Interest rate risk Interest rate risk is the risk that the fair value of future cash flows of a financial instrument will fluctuate because of changes in market interest rates. The majority of the Company’s financial assets and liabilities in Veritas Asian Fund, Veritas Global Focus Fund, Veritas Global Equity Income Fund, Veritas Global Real Return Fund, Veritas Izoard Fund and Veritas Third Eye Global Emerging Markets Fund are non-interest bearing and as a result, these Sub-Funds are not subject to significant amounts of risk due to fluctuations in the prevailing levels of market interest rates. Any cash and cash equivalents, time deposits and bank overdrafts held by these Sub-Funds are held at short term market rates and therefore are not exposed to significant amounts of interest rate risk.

VERITAS FUNDS PLC
NOTES TO THE FINANCIAL STATEMENTS FOR THE YEAR ENDED 30 SEPTEMBER 2021
(CONTINUED)
126
9. Financial instruments and associated risks (continued) a) Market risk (continued) In accordance with the Company’s policies and procedures in place, the Investment Manager monitors the Company’s overall interest rate risk on a daily basis, and the Board of Directors reviews it on a quarterly basis. The following tables set out the interest profile of Sub-Funds which hold interest bearing financial assets as at 30 September 2021 and 30 September 2020. An estimate is also given of the effects of a hypothetical 100 basis points increase and decrease in interest rates on assets that are subject to interest rate risk. Veritas China Fund as of 30 September 2021
Floating rate
Fixed rate Financial assets
on which no Total financial assets financial assets interest is paid Currency USD USD USD USD US Dollar 556,403 - 556,403 - Currency
Fixed rate financial
assets weighted average interest rate
Fixed rate financial assets weighted
average period for which rate is fixed
US Dollar 1.25% 0.97 years Veritas China Fund as of 30 September 2020
Floating rate
Fixed rate Financial assets
on which no Total financial assets financial assets interest is paid Currency USD USD USD USD US Dollar 517,120 - 517,120 - Currency
Fixed rate financial
assets weighted average interest rate
Fixed rate financial assets weighted
average period for which rate is fixed
US Dollar 1.25% 1.99 years

VERITAS FUNDS PLC
NOTES TO THE FINANCIAL STATEMENTS FOR THE YEAR ENDED 30 SEPTEMBER 2021
(CONTINUED)
127
9. Financial instruments and associated risks (continued) b) Credit risk Credit risk is the risk that a counterparty to a financial instrument will fail to discharge an obligation or commitment that it has entered into with the Company. Credit risk is generally higher when a non-exchange traded financial instrument is involved because the counterparty for non-exchange traded financial instruments is not backed by an exchange clearing house. Credit risk associated with investing activities is managed by the Investment Manager as part of the overall investment process. To reduce the Company’s counterparty credit exposures, securities trading is primarily conducted on recognised exchanges and on a delivery-versus-payment basis. The risk of default is considered minimal, as delivery of securities sold is only made once the depositary has received payment. Payment is made on a purchase once the securities have been received by the depositary. The trade will fail if either party fails to meet its obligation. In addition, the Investment Manager seeks to enter into netting agreements with counterparties that would allow receivables and payables to that counterparty to be offset. The exposure of debt securities as at 30 September 2021 based on credit rating is as follows:
Veritas China Fund Credit rating Agency Debt Securities Held Long USD Non rated N/A 556,403 Total 556,403 The exposure of debt securities as at 30 September 2020 based on credit rating is as follows:
Veritas China Fund Credit rating Agency Debt Securities Held Long USD Non rated N/A 517,120 Total 517,120

VERITAS FUNDS PLC
NOTES TO THE FINANCIAL STATEMENTS FOR THE YEAR ENDED 30 SEPTEMBER 2021
(CONTINUED)
128
9. Financial instruments and associated risks (continued) b) Credit risk (continued) All financial instruments, other than derivatives, are cleared through and held in custody by Brown Brothers Harriman & Co. The Company is subject to credit risk to the extent that this institution may be unable to fulfil its obligations either to return the Company’s securities or repay amounts owed. Management does not anticipate any losses as a result of this concentration. Substantially all of the cash of the Company as of 30 September 2021 and 30 September 2020 was held by: 30 September 2021 S&P Fitch ANZ AA- Barclays BBB Brown Brothers Harriman & Co. A+ Citibank A+ HSBC Bank plc A- JPMorgan A- National Bank of Australia AA- Sumitomo A- UBS A-
30 September 2020 S&P Fitch ANZ AA- Barclays BBB Brown Brothers Harriman & Co. A+ HSBC Bank plc A+ JPMorgan A- Sumitomo A UBS A+
These institutions are rated by prominent credit rating agencies. The Company’s investments in participatory notes and derivative financial instruments including forward contracts and contract for differences are also subject to credit risk. The risk that counterparties to both derivative and other instruments might default on their obligations is monitored on an on-going basis. To manage the level of credit risk, the Company deals with counterparties of good credit standing. The Company’s credit risk exposure is represented by the carrying amounts of cash and cash equivalents, margin cash, due from brokers, debt investments and open gains on contracts for difference and forward currency contracts at the Statement of Financial Position date.

VERITAS FUNDS PLC
NOTES TO THE FINANCIAL STATEMENTS FOR THE YEAR ENDED 30 SEPTEMBER 2021
(CONTINUED)
129
9. Financial instruments and associated risks (continued) c) Liquidity risk Liquidity risk is the risk that an entity will encounter difficulty in meeting obligations associated with financial liabilities. The Company’s constitution provides for the daily creation and cancellation of shares and it is therefore exposed to the liquidity risk of meeting shareholder redemptions at any time. The Company’s financial instruments include investments in derivative contracts traded over-the-counter, which are not traded in an organised public market and which generally may be illiquid. As a result, the Company may not be able to liquidate quickly some of its investments in these instruments at an amount close to its fair value in order to meet its liquidity requirements, or to respond to specific events such as deterioration in the credit worthiness of any particular issuer. The Company’s listed securities are considered to be readily realisable as they are all listed on major global stock exchanges. In accordance with the Company’s policies and procedures in place, the Investment Manager monitors the Company’s overall liquidity risk on a daily basis, and the Board of Directors reviews it on a quarterly basis. Substantially all of the Company's liabilities included in the Statement of Financial Position at 30 September 2021 and 2020 on pages 68 to 71 are payable within one month. The following tables shows the contractual, undiscounted cash flows of the Company’s derivative financial assets and liabilities settled gross as at 30 September 2021 and 2020. Veritas Asian Fund The Veritas Asian Fund did not have any derivative financial assets and liabilities settled gross as at 30 September 2021 and 30 September 2020.

VERITAS FUNDS PLC
NOTES TO THE FINANCIAL STATEMENTS FOR THE YEAR ENDED 30 SEPTEMBER 2021
(CONTINUED)
130
9. Financial instruments and associated risks (continued) c) Liquidity risk (continued) Veritas Global Focus Fund 30 September 2021
Less than 1 month
USD
1 to 3 months
USD
3 months to 1 year
USD Derivative financial assets and liabilities settled gross - Forward contracts Outflows (31,508,048) - - Inflows 31,209,977 - - Total (298,071) - - 30 September 2020
Less than 1 month
USD
1 to 3 months
USD
3 months to 1 year
USD Derivative financial assets and liabilities settled gross - Forward contracts Outflows (17,849,475) - - Inflows 16,916,926 - - Total (932,549) - - Veritas Global Equity Income Fund 30 September 2021
Less than 1 month
GBP
1 to 3 months
GBP
3 months to 1 year
GBP Derivative financial assets and liabilities settled gross - Forward contracts Outflows (1,445,953) - - Inflows 1,482,303 - - Total 36,350 - - 30 September 2020
Less than 1 month
GBP
1 to 3 months
GBP
3 months to 1 year
GBP Derivative financial assets and liabilities settled gross - Forward contracts Outflows (1,704,769) - - Inflows 1,766,044 - - Total 61,275 - -

VERITAS FUNDS PLC
NOTES TO THE FINANCIAL STATEMENTS FOR THE YEAR ENDED 30 SEPTEMBER 2021
(CONTINUED)
131
9. Financial instruments and associated risks (continued) c) Liquidity risk (continued) Veritas China Fund 30 September 2021
Less than 1 month
USD
1 to 3 months
USD
3 months to 1 year
USD Derivative financial assets and liabilities settled gross - Forward contracts Outflows (6,004) - - Inflows 6,026 - - Total 22 - - The Veritas China Fund did not have any derivative financial assets and liabilities settled gross as at 30 September 2020. Veritas Global Real Return Fund 30 September 2021
Less than 1 month
GBP
1 to 3 months
GBP
3 months to 1 year
GBP Derivative financial assets and liabilities settled gross - Forward contracts Outflows (85,796,110) - - Inflows 86,812,002 - - Total 1,015,892 - - 30 September 2020
Less than 1 month
GBP
1 to 3 months
GBP
3 months to 1 year
GBP Derivative financial assets and liabilities settled gross - Forward contracts Outflows (111,155,072) - - Inflows 114,512,110 - - Total 3,357,038 - - Veritas Izoard Fund The Veritas Izoard Fund did not have any derivative financial assets and liabilities settled gross as at 30 September 2021 and 30 September 2020.

VERITAS FUNDS PLC
NOTES TO THE FINANCIAL STATEMENTS FOR THE YEAR ENDED 30 SEPTEMBER 2021
(CONTINUED)
132
9. Financial instruments and associated risks (continued) c) Liquidity risk (continued) Veritas Third Eye Global Emerging Markets Fund The Veritas Third Eye Global Emerging Markets Fund did not have any derivative financial assets and liabilities settled gross as at 30 September 2021 and 30 September 2020. 10. Exchange rates The following exchange rates were used to translate assets and liabilities into the functional currency (United States Dollar) at 30 September 2021 and 30 September 2020 for the Veritas Asian Fund, Veritas Global Focus Fund, Veritas China Fund, Veritas Izoard Fund and the Veritas Third Eye Global Emerging Markets Fund.
30 September 2021
30 September 2020
Australian Dollar 1.39121 1.40519 British Pound 0.74438 0.77961 Chinese Yuan 6.47100 6.81340 Danish Krona 6.42740 6.35910 Euro 0.86434 0.85393 Hong Kong Dollar 7.78890 7.75005 Indian Rupee 74.31450 73.73670 Japanese Yen - 105.71500 Korean Won 1186.08000 1,169.25000 Mexican Peso 20.54755 22.32600 New Taiwanese Dollar 27.83000 28.97200 Norwegian Krone 8.81880 - Swedish Krona 8.80075 9.00445 Swiss Franc 0.93660 0.92195 Thai Baht - 31.65500

VERITAS FUNDS PLC
NOTES TO THE FINANCIAL STATEMENTS FOR THE YEAR ENDED 30 SEPTEMBER 2021
(CONTINUED)
133
10. Exchange rates (continued)
The following exchange rates were used to translate assets and liabilities into the functional currency (GBP) at 30 September 2021 and 30 September 2020 for the Veritas Global Equity Income Fund and Veritas Global Real Return Fund.
30 September 2021
30 September 2020
Australian Dollar 1.86895 1.80243
Euro 1.16116 1.09534
Hong Kong Dollar 10.46361 9.94099
Singapore Dollar 1.82911 1.75672
South African Rand 20.42835 21.60510
Swedish Krona 11.82293 11.55001
Swiss Franc 1.25823 1.18259
US Dollar 1.34340 1.28270
11. Related parties and connected persons
As at 30 September 2021, Mr Richard Grant was a Managing Partner of the Investment Manager and as such had an interest in the relationship between the Company and the Investment Manager. He ceased acting as a Managing Partner of the Investment Manager from 1 November 2021. Mr Richard Grant was also director of Veritas Asset Management (Asia) Ltd, a sub-advisor to the Investment Manager on Veritas Asian Fund and Veritas China Fund (until 1 November 2021). Mr Richard Grant held 528 shares (30 September 2020: Nil) in Veritas Asian Fund, 12,517 shares (30 September 2020: 17,946) in Veritas Global Equity Income Fund, 5,567 shares (30 September 2020: 5,567) in Veritas China Fund, 204,421 shares (30 September 2020: 204,421) in Veritas Global Real Return Fund, 10,404 shares (30 September 2020: 10,323) in Veritas Izoard Fund and 2,500 shares (30 September 2020: 2,500) in Veritas Third Eye Global Emerging Markets Fund. Mrs Catherine Grant, wife of Director Mr Richard Grant held 5,301 shares (30 September 2020: 5,299) in Veritas Global Focus Fund.
Ms Nicola Lakin is the Chief Operating Officer and a Managing Partner of the Investment Manager (since 1 November 2021) and as such has an interest in the relationship between the Company and the Investment Manager. Ms Nicola Lakin is also director of Veritas Asset Management (Asia) Ltd (since 16 June 2021). Ms Nicola Lakin held 87 shares in Veritas Asian Fund, 1,569 shares in Veritas Global Focus Fund, 142 shares in Veritas China Fund and 800 shares in Veritas Global Real Return Fund. Mr Russell Lakin, husband of Ms Nicola Lakin held 36 shares in Veritas Asian Fund.
The Company uses the services of KB Associates for the provision of a Money Laundering Reporting Officer (the “MLRO”). The MLRO fee for the financial year amounted to USD 21,489 (30 September 2020: USD 20,032) and the amount outstanding as at 30 September 2020 was USD Nil (30 September 2020: Nil). Mr Mike Kirby who is a Director of the Company, is the Managing Principal of KB Associates.

VERITAS FUNDS PLC
NOTES TO THE FINANCIAL STATEMENTS FOR THE YEAR ENDED 30 SEPTEMBER 2021
(CONTINUED)
134
11. Related parties and connected persons (continued) Veritas Asset Management LLP, the Investment Manager, is a related party under the IAS 24 “Related Party Disclosures”. Please refer note 3 for the fees payable to these parties and the amounts due at the year end. 12. Share capital The authorised share capital of the Company is €38,100 divided into 38,100 Management Shares of €1 each and 500,000,000,000 Shares of no par value initially designated as unclassified shares. The issued share capital of the Company is €38,100 divided into Management Shares of €1 each of which one quarter has been paid up and which are beneficially owned as to 38,093 Management Shares by Veritas Asset Management LLP and as to one Management Share each by seven nominees of Veritas Asset Management LLP. The unclassified shares are available for issue as Shares. Management Shares do not entitle the holders to any dividend and on a winding-up entitle the holder to receive the amount paid up thereon but not otherwise to participate in the assets of the Company. The movement in the number of participating redeemable shares during the years ended 30 September 2021 and 30 September 2020 is as follows: Veritas Asian Fund 2020 2020 2020 EUR A Class GBP A Class USD A Class
At 1 October 2019 55,193 339,355 298,183 Issued 66,046 156,208 209,604 Redeemed (47,139) (154,429) (175,497) At 30 September 2020 74,100 341,134 332,290 2021 2021 2021 EUR A Class GBP A Class USD A Class
At 1 October 2020 74,100 341,134 332,290 Issued 84,868 223,658 341,371 Redeemed (59,313) (122,869) (270,070) At 30 September 2021 99,655 441,923 403,591

VERITAS FUNDS PLC
NOTES TO THE FINANCIAL STATEMENTS FOR THE YEAR ENDED 30 SEPTEMBER 2021
(CONTINUED)
135
12. Share capital (continued) Veritas Asian Fund (continued) 2020 2020 2020 EUR B Class GBP B Class USD B Class
At 1 October 2019 770 17,976 164,358 Issued 1 19,616 117,605 Redeemed (1) (18,701) (51,281) At 30 September 2020 770 18,891 230,682 2021 2021 2021 EUR B Class GBP B Class USD B Class
At 1 October 2020 770 18,891 230,682 Issued 27,732 6,970 543,073 Redeemed (2,231) (12,001) (151,633) At 30 September 2021 26,271 13,860 622,122 2020 2020 2020 GBP C Class USD C Class GBP D Class
At 1 October 2019 248,082 2,335,190 536,246 Issued 115,854 3,506,997 241,591 Redeemed (35,007) (1,299,863) (65,750) At 30 September 2020 328,929 4,542,324 712,087 2021 2021 2021 GBP C Class USD C Class GBP D Class
At 1 October 2020 328,929 4,542,324 712,087 Issued 199,798 2,466,576 232,786 Redeemed (53,856) (2,197,150) (107,140) At 30 September 2021 474,871 4,811,750 837,733 2020 2020 2020 USD D Class EUR C Class EUR D Class
At 1 October 2019 197,955 713 8,687 Issued 663,015 43,538 949 Redeemed (92,246) (8,414) (1,654) At 30 September 2020 768,724 35,837 7,982

VERITAS FUNDS PLC
NOTES TO THE FINANCIAL STATEMENTS FOR THE YEAR ENDED 30 SEPTEMBER 2021
(CONTINUED)
136
12. Share capital (continued) Veritas Asian Fund (continued) 2021 2021 2021 USD D Class EUR C Class EUR D Class
At 1 October 2020 768,724 35,837 7,982 Issued 167,060 181,495 61,716 Redeemed (80,863) (74,849) (3,626) At 30 September 2021 854,921 142,483 66,072 2021 2021 2021 EUR A
Accumulation Class*
GBP A Accumulation
Class**
USD A Accumulation
Class*** At 1 October 2020 - - - Issued 43,566 17,531 40,546 Redeemed (158) (3,137) (18) At 30 September 2021 43,408 14,394 40,528 2021 USD B
Accumulation Class****
At 1 October 2020 - Issued 102,129 Redeemed (1,843) At 30 September 2021 100,286 * Launched: 11 March 2021 ** Launched: 2 November 2020 *** Launched: 1 February 2021 **** Launched: 2 March 2021
Veritas Global Focus Fund 2020 2020 2020 GBP A Class USD A Class EUR A Class
At 1 October 2019 5,096,724 4,731,102 4,062,776 Issued 439,710 804,920 75,013 Redeemed (904,939) (1,441,843) (28,210) At 30 September 2020 4,631,495 4,094,179 4,109,579

VERITAS FUNDS PLC
NOTES TO THE FINANCIAL STATEMENTS FOR THE YEAR ENDED 30 SEPTEMBER 2021
(CONTINUED)
137
12. Share capital (continued) Veritas Global Focus Fund (continued) 2021 2021 2021 GBP A Class USD A Class EUR A Class
At 1 October 2020 4,631,495 4,094,179 4,109,579 Issued 879,239 1,150,919 24,233 Redeemed (1,060,726) (1,592,796) (57,904) At 30 September 2021 4,450,008 3,652,302 4,075,908 2020 2020 2020 GBP B Class USD B Class EUR B Class
At 1 October 2019 142,694 313,207 7,039 Issued 17,043 1,469 - Redeemed (20,490) (2,840) (521) At 30 September 2020 139,247 311,836 6,518 2021 2021 2021 GBP B Class USD B Class EUR B Class
At 1 October 2020 139,247 311,836 6,518 Issued 12,032 16,204 8 Redeemed (22,319) (82,970) (2,740) At 30 September 2021 128,960 245,070 3,786 2020 2020 2020 GBP C Class USD C Class EUR C Class
At 1 October 2019 24,874,395 12,978,826 3,615,816 Issued 1,481,119 7,222,924 271,253 Redeemed (2,643,674) (6,585,370) (1,388,520) At 30 September 2020 23,711,840 13,616,380 2,498,549
2021 2021 2021 GBP C Class USD C Class EUR C Class
At 1 October 2020 23,711,840 13,616,380 2,498,549 Issued 1,617,187 5,276,928 315,890 Redeemed (6,681,323) (4,863,912) (230,580) At 30 September 2021 18,647,704 14,029,396 2,583,859

VERITAS FUNDS PLC
NOTES TO THE FINANCIAL STATEMENTS FOR THE YEAR ENDED 30 SEPTEMBER 2021
(CONTINUED)
138
12. Share capital (continued) Veritas Global Focus Fund (continued)
2020 2020 2020 GBP D Class USD D Class EUR D Class
At 1 October 2019 6,046,869 1,447,180 24,565 Issued 771,926 301,385 78,491 Redeemed (2,650,004) (71,710) (15,302) At 30 September 2020 4,168,791 1,676,855 87,754
2021 2021 2021 GBP D Class USD D Class EUR D Class
At 1 October 2020 4,168,791 1,676,855 87,754 Issued 1,110,642 154,483 16,275 Redeemed (1,670,059) (151,374) (65,425) At 30 September 2021 3,609,374 1,679,964 38,604 2020 NOK E Class
At 1 October 2019 121,011 Issued 443,264 Redeemed (187,229) At 30 September 2020 377,046 2021 NOK E Class
At 1 October 2020 377,046 Issued 494,326 Redeemed (288,443) At 30 September 2021 582,929 Veritas Global Equity Income Fund 2020 2020 2020 GBP A Class USD A Class EUR A Class
At 1 October 2019 390,513 45,143 29,651 Issued 21,947 39,571 5,405 Redeemed (65,199) (47,201) (12,123) At 30 September 2020 347,261 37,513 22,933
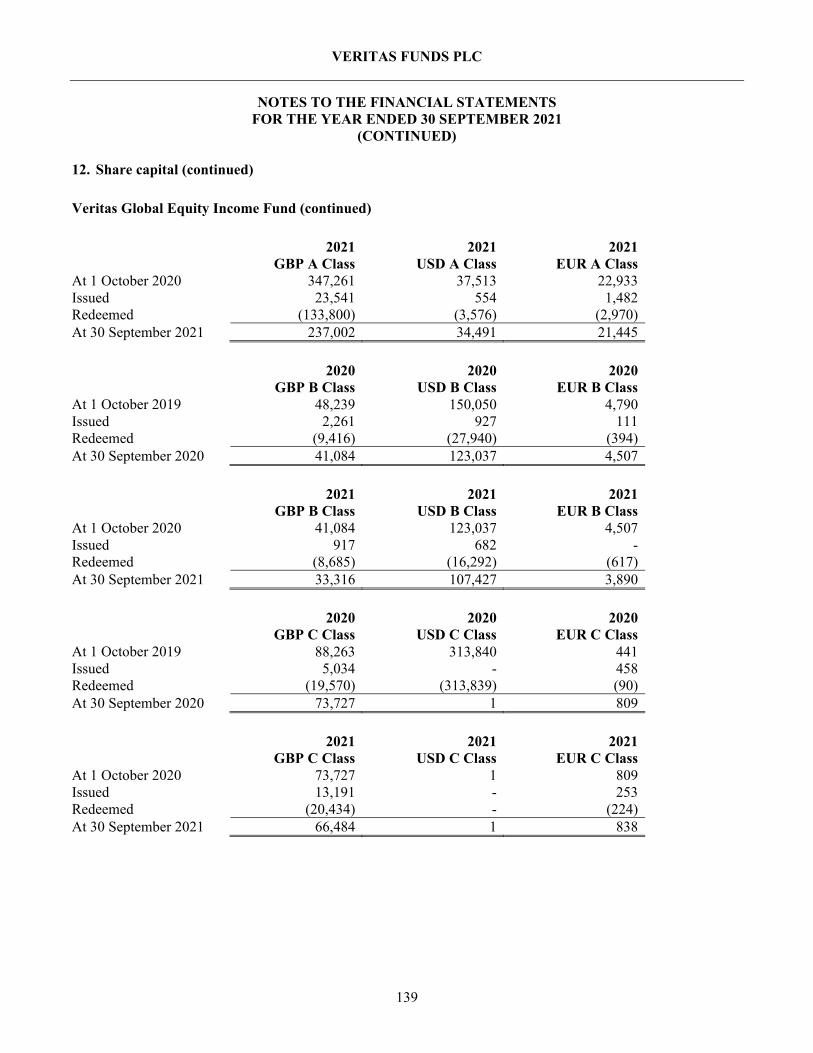
VERITAS FUNDS PLC
NOTES TO THE FINANCIAL STATEMENTS FOR THE YEAR ENDED 30 SEPTEMBER 2021
(CONTINUED)
139
12. Share capital (continued) Veritas Global Equity Income Fund (continued) 2021 2021 2021 GBP A Class USD A Class EUR A Class
At 1 October 2020 347,261 37,513 22,933 Issued 23,541 554 1,482 Redeemed (133,800) (3,576) (2,970) At 30 September 2021 237,002 34,491 21,445 2020 2020 2020 GBP B Class USD B Class EUR B Class
At 1 October 2019 48,239 150,050 4,790 Issued 2,261 927 111 Redeemed (9,416) (27,940) (394) At 30 September 2020 41,084 123,037 4,507 2021 2021 2021 GBP B Class USD B Class EUR B Class
At 1 October 2020 41,084 123,037 4,507 Issued 917 682 - Redeemed (8,685) (16,292) (617) At 30 September 2021 33,316 107,427 3,890 2020 2020 2020 GBP C Class USD C Class EUR C Class
At 1 October 2019 88,263 313,840 441 Issued 5,034 - 458 Redeemed (19,570) (313,839) (90) At 30 September 2020 73,727 1 809 2021 2021 2021 GBP C Class USD C Class EUR C Class
At 1 October 2020 73,727 1 809 Issued 13,191 - 253 Redeemed (20,434) - (224) At 30 September 2021 66,484 1 838

VERITAS FUNDS PLC
NOTES TO THE FINANCIAL STATEMENTS FOR THE YEAR ENDED 30 SEPTEMBER 2021
(CONTINUED)
140
12. Share capital (continued) Veritas Global Equity Income Fund (continued) 2020 2020 2020 GBP D Class USD D Class EUR D Class
At 1 October 2019 1,493,035 67,726 11,210 Issued 75,066 4,129 994 Redeemed (521,407) (30,111) (5,586) At 30 September 2020 1,046,694 41,744 6,618 2021 2021 2021 GBP D Class USD D Class EUR D Class
At 1 October 2020 1,046,694 41,744 6,618 Issued 47,557 1,086 275 Redeemed (393,578) (30,721) (2,783) At 30 September 2021 700,673 12,109 4,110 2020 USD E Class
At 1 October 2019 13,187 Issued 418 Redeemed - At 30 September 2020 13,605 2021 USD E Class
At 1 October 2020 13,605 Issued 417 Redeemed (1,930) At 30 September 2021 12,092 Veritas China Fund 2020 2020 2020 GBP A Class USD A Class EUR A Class
At 1 October 2019 29,367 111,693 148 Issued 4,300 1,552 585 Redeemed (2,763) (3,179) (77) At 30 September 2020 30,904 110,066 656

VERITAS FUNDS PLC
NOTES TO THE FINANCIAL STATEMENTS FOR THE YEAR ENDED 30 SEPTEMBER 2021
(CONTINUED)
141
12. Share capital (continued) Veritas China Fund (continued) 2021 2021 2021 GBP A Class USD A Class EUR A Class
At 1 October 2020 30,904 110,066 656 Issued 40,610 58,257 511 Redeemed (13,006) (2,954) (586) At 30 September 2021 58,508 165,369 581 2020 2020 GBP B Class EUR B Class
At 1 October 2019 4,522 614 Issued 9,547 - Redeemed (1,889) (213) At 30 September 2020 12,180 401 2021 2021 GBP B Class EUR B Class
At 1 October 2020 12,180 401 Issued 6,443 - Redeemed (2,188) - At 30 September 2021 16,435 401 Veritas Global Real Return Fund 2020 2020 2020 GBP A Class USD A Class EUR A Class
At 1 October 2019 3,890,680 585,960 436,861 Issued 1,237,232 255,371 1,603,265 Redeemed (1,079,046) (177,610) (768,133) At 30 September 2020 4,048,866 663,721 1,271,993 2021 2021 2021 GBP A Class USD A Class EUR A Class
At 1 October 2020 4,048,866 663,721 1,271,993 Issued 1,678,452 57,947 2,017,417 Redeemed (1,233,799) (134,522) (2,112,049) At 30 September 2021 4,493,519 587,146 1,177,361

VERITAS FUNDS PLC
NOTES TO THE FINANCIAL STATEMENTS FOR THE YEAR ENDED 30 SEPTEMBER 2021
(CONTINUED)
142
12. Share capital (continued) Veritas Global Real Return Fund (continued) 2020 2020 2020 GBP B Class USD B Class EUR B Class
At 1 October 2019 312,586 214,320 56,508 Issued 448,274 34,452 44,843 Redeemed (419,373) (147,067) (49,758) At 30 September 2020 341,487 101,705 51,593 2021 2021 2021 GBP B Class USD B Class EUR B Class
At 1 October 2020 341,487 101,705 51,593 Issued 25,569 9,280 157,680 Redeemed (138,014) (20,314) (31,100) At 30 September 2021 229,042 90,671 178,173 2020 2020 2020 GBP D Class EUR D Class USD D Class
At 1 October 2019 8,197,748 864,044 1,159,797 Issued 807,319 168,257 892,363 Redeemed (3,131,227) (272,594) (462,976) At 30 September 2020 5,873,840 759,707 1,589,184 2021 2021 2021 GBP D Class EUR D Class USD D Class
At 1 October 2020 5,873,840 759,707 1,589,184 Issued 929,465 199,708 255,626 Redeemed (1,462,284) (384,301) (991,628) At 30 September 2021 5,341,021 575,114 853,182 2020 2020 EUR E Class USD E Class*
At 1 October 2019 181,922 - Issued 44,247 62,984 Redeemed - - At 30 September 2020 226,169 62,984

VERITAS FUNDS PLC
NOTES TO THE FINANCIAL STATEMENTS FOR THE YEAR ENDED 30 SEPTEMBER 2021
(CONTINUED)
143
12. Share capital (continued) Veritas Global Real Return Fund (continued) 2021 2021 EUR E Class** USD E Class
At 1 October 2020 226,169 62,984 Issued - 7,923 Redeemed (226,169) - At 30 September 2021 - 70,907
* Launched: 29 November 2019 ** Liquidated: 8 July 2021
Veritas Izoard Fund 2020 2020 GBP C Class USD C Class
At 1 October 2019 235,847 130,195 Issued 2,247 32,104 Redeemed - (14,430) At 30 September 2020 238,094 147,869 2020 2020 GBP C Class USD C Class
At 1 October 2020 238,094 147,869 Issued 1,274 20,458 Redeemed (50,000) (685) At 30 September 2021 189,368 167,642 Veritas Third Eye Global Emerging Markets Fund 2020 2020 GBP A Class USD A Class
At 1 October 2019 48,989 63,399 Issued 1,643 - Redeemed (770) - At 30 September 2020 49,862 63,399 2021 2021 GBP A Class USD A Class
At 1 October 2020 49,862 63,399 Issued 1,794 - Redeemed (1,413) - At 30 September 2021 50,243 63,399

VERITAS FUNDS PLC
NOTES TO THE FINANCIAL STATEMENTS FOR THE YEAR ENDED 30 SEPTEMBER 2021
(CONTINUED)
144
13. Net asset value The Company has adopted IFRS 13 and changed its valuation input for financial assets and liabilities measured at fair value, based on a quoted price in an active market, to last traded prices. As all of the last traded prices for the Company’s financial assets and liabilities fall within the bid-ask spread, there is no variance, other than those due to timing between the Net Assets per the financial statements and the published Net Asset Value. Net assets attributable to holders of redeemable participating shares represent a liability in the Statement of Financial Position, carried at the redemption amount that would be payable at the Statement of Financial Position date if the shareholder exercised the right to redeem the share to the Company. Reconciliation between dealing NAV as at 12pm on 30 September 2021 and Financial Statements NAV as at close of business 30 September 2021:
2021
Veritas Asian Fund
Veritas Global Focus
Fund
Veritas Global Equity Income
Fund
Veritas China Fund
USD USD GBP USD Dealing NAV (30 September 2021) at Mid prices at 12 pm
8,155,203,833
3,686,644,270
252,728,900
63,578,790
Adjustment for as of dealing 36,442,181 (51,934) (7,921) 4,621
Change in Net Asset value due to price change from 12 pm to close of business
22,853,583
(32,594,802)
(2,677,135)
94,324
NAV as per Valuations (30 September 2021) at last traded prices at close of business
8,214,499,597
3,653,997,534
250,043,844
63,677,735
2021
Veritas Global Real Return
Fund
Veritas Izoard
Fund
Veritas Third Eye Global Emerging
Markets Fund GBP USD USD Dealing NAV (30 September 2021) at Mid prices at 12 pm
269,756,208
78,389,724 16,275,923
Adjustment for as of dealing 7,609 (1) (10,435) Change in Net Asset value due to price change from 12 pm to close of business
(1,383,535)
(729,862)
(38,486)
NAV as per Valuations (30 September 2021) at last traded prices at close of business
268,380,282
77,659,861
16,227,002

VERITAS FUNDS PLC
NOTES TO THE FINANCIAL STATEMENTS FOR THE YEAR ENDED 30 SEPTEMBER 2021
(CONTINUED)
145
13. Net asset value (continued) Reconciliation between dealing NAV as at 12pm on 30 September 2020 and Financial Statements NAV as at close of business 30 September 2020:
2020
Veritas Asian Fund
Veritas Global Focus
Fund
Veritas Global Equity Income
Fund
Veritas China Fund
USD USD GBP USD Dealing NAV (30 September 2020) at Mid prices at 12 pm
5,370,766,714
3,348,338,973
305,731,980
37,456,273
Adjustment for as of dealing (1,793,515) (15,111) (128,768) 32,561
Change in Net Asset value due to price change from 12 pm to close of business
8,295,626
30,751,579
(662,099)
75,824
NAV as per Valuations (30 September 2020) at last traded prices at close of business
5,377,268,825
3,379,075,441
304,941,113
37,564,658
2020
Veritas Global Real Return
Fund
Veritas Izoard
Fund
Veritas Third Eye Global Emerging
Markets Fund GBP USD USD Dealing NAV (30 September 2020) at Mid prices at 12 pm
291,022,220
70,555,431 13,485,703
Adjustment for as of dealing 777,863 (2,166) (11,345) Change in Net Asset value due to price change from 12 pm to close of business
326,792
350,287 79,876
NAV as per Valuations (30 September 2020) at last traded prices at close of business
292,126,875
70,903,552 13,554,234

VERITAS FUNDS PLC
NOTES TO THE FINANCIAL STATEMENTS FOR THE YEAR ENDED 30 SEPTEMBER 2021
(CONTINUED)
146
14. Comparative net asset value
Veritas Asian Fund
NAV
Per Share Total NAV
NAV Per Share
Total NAV
NAV Per Share
Total NAV
Share Class 2021 2021 2020 2020 2019 2019 USD A Class Shares 783.82 316,342,479 622.27 206,773,366 462.19 137,815,802 GBP A Class Shares 1,083.55 478,844,609 900.93 307,336,373 697.83 236,810,940 EUR A Class Shares 772.02 76,935,964 605.52 44,869,148 482.24 26,615,980 USD B Class Shares 538.77 335,182,415 429.87 99,162,986 320.88 52,739,586 GBP B Class Shares 789.43 10,941,447 659.66 12,461,650 513.51 9,230,660 EUR B Class Shares 562.67 14,781,909 443.65 341,612 354.99 273,421 USD C Class Shares 802.41 3,860,983,218 635.44 2,886,371,857 470.79 1,099,385,551 GBP C Class Shares 1,112.41 528,249,016 922.61 303,473,613 712.84 176,843,239 EUR C Class Shares 784.36 111,758,363 613.65 21,991,471 487.80 347,791 USD D Class Shares 784.46 670,649,944 621.22 477,547,113 460.64 91,184,920 GBP D Class Shares 1,087.15 910,741,725 901.67 642,064,798 697.23 373,887,544 EUR D Class Shares 775.20 51,218,998 606.52 4,841,231 482.21 4,188,986 EUR A Accumulation Class* 772.02 33,511,636 - - - - GBP A Accumulation Class** 1,083.53 15,596,376 - - - - USD A Accumulation Class*** 783.83 31,766,908 - - - - USD B Accumulation Class**** 539.09 54,062,787 - - - -
* Launched: 11 March 2021 ** Launched: 2 November 2020 *** Launched: 1 February 2021 **** Launched: 2 March 2021

VERITAS FUNDS PLC
NOTES TO THE FINANCIAL STATEMENTS FOR THE YEAR ENDED 30 SEPTEMBER 2021
(CONTINUED)
147
14. Comparative net asset value (continued) Veritas Global Focus Fund
NAV
Per Share Total NAV
NAV Per Share
Total NAV
NAV Per Share
Total NAV
Share Class 2021 2021 2020 2020 2019 2019 USD A Class Shares 47.78 174,524,304 38.86 159,120,214 35.53 168,097,604 GBP A Class Shares 60.40 268,782,926 51.45 238,297,967 49.05 250,005,500 EUR A Class Shares 25.11 102,339,131 20.18 82,914,650 19.78 80,350,591 USD B Class Shares 33.81 8,284,964 27.63 8,617,343 25.38 7,949,100 GBP B Class Shares 45.28 5,839,229 38.76 5,397,150 37.12 5,297,153 EUR B Class Shares 29.34 111,079 23.69 154,413 23.33 164,199 USD C Class Shares 53.25 747,116,104 43.21 588,305,112 39.38 511,159,241 GBP C Class Shares 67.12 1,251,711,397 57.04 1,352,441,396 54.22 1,348,671,817 EUR C Class Shares 46.46 120,033,424 37.24 93,036,731 36.40 131,602,179 USD D Class Shares 49.61 83,335,746 40.27 67,520,673 36.81 53,267,353 GBP D Class Shares 62.66 226,174,071 53.27 222,079,545 50.78 307,065,723 EUR D Class Shares 43.17 1,666,684 34.63 3,038,751 33.94 833,750 NOK E Class Shares 409.78 238,874,657 338.89 127,778,031 320.82 38,823,339
Veritas Global Equity Income Fund
NAV
Per Share Total NAV
NAV Per Share
Total NAV
NAV Per Share
Total NAV
Share Class 2021 2021 2020 2020 2019 2019 USD A Class Shares 141.67 4,886,361 115.83 4,345,087 127.95 5,775,906 GBP A Class Shares 204.08 48,366,585 174.73 60,677,187 201.26 78,595,103 EUR A Class Shares 239.63 5,138,639 193.53 4,438,231 229.22 6,796,619 USD B Class Shares 136.36 14,648,252 112.05 13,786,184 124.40 18,666,886 GBP B Class Shares 182.27 6,072,415 156.85 6,444,041 181.58 8,759,306 EUR B Class Shares 213.46 830,373 173.27 780,942 206.29 988,197 USD C Class Shares 217.00 217 170.00 170 179.33 56,281,011 GBP C Class Shares 309.65 20,586,782 256.41 18,904,411 283.83 25,051,403 EUR C Class Shares 363.41 304,535 283.78 229,578 323.01 142,293 USD D Class Shares 149.40 1,809,065 121.84 5,086,214 134.25 9,092,129 GBP D Class Shares 216.11 151,424,044 184.57 193,183,986 212.04 316,583,722 EUR D Class Shares 250.11 1,028,220 201.53 1,333,706 238.07 2,668,871 USD E Class Shares 157.50 1,904,530 135.65 1,845,529 155.96 2,056,693

VERITAS FUNDS PLC
NOTES TO THE FINANCIAL STATEMENTS FOR THE YEAR ENDED 30 SEPTEMBER 2021
(CONTINUED)
148
14. Comparative net asset value (continued) Veritas China Fund
NAV
Per Share Total NAV
NAV Per Share
Total NAV
NAV Per Share
Total NAV
Share Class 2021 2021 2020 2020 2019 2019 USD A Class Shares 240.22 39,724,600 223.87 24,640,497 151.86 16,961,277 GBP A Class Shares 238.31 13,943,099 232.61 7,188,533 164.54 4,832,114 EUR A Class Shares 223.60 129,913 205.69 134,934 149.63 22,063 GBP B Class Shares 225.04 3,698,567 220.76 2,688,803 156.94 709,724 EUR B Class Shares 222.05 89,043 205.47 82,394 150.03 92,087
Veritas Global Real Return Fund
NAV
Per Share Total NAV
NAV Per Share
Total NAV
NAV Per Share
Total NAV
Share Class 2021 2021 2020 2020 2019 2019 USD A Class Shares 35.08 20,599,012 33.67 22,344,885 32.11 18,812,871 GBP A Class Shares 19.35 86,963,238 18.52 74,996,184 17.69 68,836,575 EUR A Class Shares 18.75 22,072,879 18.13 23,056,675 17.56 7,669,973 USD B Class Shares 33.09 3,000,245 31.91 3,245,328 30.59 6,555,819 GBP B Class Shares 18.50 4,237,064 17.79 6,076,483 17.08 5,339,580 EUR B Class Shares 19.53 3,480,112 18.98 979,133 18.48 1,044,035 USD D Class Shares 35.19 30,027,283 33.72 53,592,489 32.13 37,260,764 GBP D Class Shares 19.47 103,977,896 18.60 109,280,953 17.74 145,463,303 EUR D Class Shares 18.85 10,843,700 18.20 13,828,456 17.61 15,219,081 USD E Class Shares* 36.72 2,603,989 33.51 2,110,611 - - EUR E Class Shares** - - 18.54 4,193,070 18.18 3,307,468
* Launched: 29 November 2019 ** Liquidated: 8 July 2021
Veritas Izoard Fund
NAV
Per Share Total NAV
NAV Per Share
Total NAV
NAV Per Share
Total NAV
Share Class 2021 2021 2020 2020 2019 2019 USD C Class Shares 166.82 27,965,455 135.72 20,069,223 124.30 16,183,364 GBP C Class Shares 195.34 36,991,518 166.45 39,630,724 158.97 37,492,630

VERITAS FUNDS PLC
NOTES TO THE FINANCIAL STATEMENTS FOR THE YEAR ENDED 30 SEPTEMBER 2021
(CONTINUED)
149
14. Comparative net asset value (continued)
Veritas Third Eye Global Emerging Markets Fund
NAV
Per Share Total NAV
NAV Per Share
Total NAV
NAV Per Share
Total NAV
Share Class 2021 2021 2020 2020 2019 2019 USD A Class Shares 127.88 8,107,477 107.22 6,797,923 98.82 6,264,913 GBP A Class Shares 120.30 6,044,012 105.64 5,267,258 101.53 4,973,635
15. Significant matters arising during the year On 1 November 2020, Mr Richard Grant, the Director of the Company, acquired 528 shares of GBP A Class of Veritas Asian Fund. Mr Michael Morris and Ms Nicola Lakin were appointed directors of the Company effective from 1 January 2021 and 15 April 2021, respectively. Ms Nicola Lakin was appointed director of Veritas Asset Management (Asia) Ltd effective from 16 June 2021. Matheson was appointed Legal Adviser to the Company effective from 10 May 2021. Matsack Trust Limited was appointed Company Secretary effective from 13 May 2021. Addendum to the prospectus of Veritas Funds Plc was issued at 5 March 2021 to account for changes resulting from Sustainable Financial Disclosures Regulation. Beginning in January 2020, global financial markets have experienced significant volatility resulting from the spread of a novel coronavirus known as COVID-19. The outbreak of COVID-19 has resulted in travel and border restrictions, quarantines, supply chain disruptions, lower consumer demand and general market uncertainty. The effects of COVID-19 may continue to adversely affect the global economy, the economies of certain nations and individual issuers, all of which may negatively impact the Company's performance. The United Kingdom (“UK”) officially left the EU on 31 January 2020 but remained subject to EU regulations during an agreed transitionary phase until 31 December 2020. Although a free trade agreement was ratified by both the EU and the UK in December 2020 and the transitionary phase has ended, there remains a number of uncertainties in connection with the UK’s relationship with the EU in regards to potential regulatory alignment or equivalence. Until the terms of regulations are clearer, it is not possible to determine the full impact that the UK’s departure and/or any related matters may have on the Company and its investments. From 1 January 2021 a memorandum of understanding is in place between the UK’s Financial Conduct Authority, the European Securities and Markets Authority and the EU which permits the continued delegation of investment management to Veritas Asset Management.

VERITAS FUNDS PLC
NOTES TO THE FINANCIAL STATEMENTS FOR THE YEAR ENDED 30 SEPTEMBER 2021
(CONTINUED)
150
15. Significant matters arising during the year (continued) EUR A Accumulation Class, GBP A Accumulation Class, USD A Accumulation Class and USD B Accumulation Class of the Veritas Asian Fund were launched on 11 March 2021, 2 November 2020, 1 February 2021 and 2 March 2021, respectively. USD E Class Shares of the Veritas Global Real Return Fund was liquidated on 8 July 2021. BBH&Co. (“BBH”) has entered into an agreement with State Street Corporation (“State Street”) under which State Street will acquire BBH’s Investor Services business; which includes its custody, fund accounting and administration, transfer agency, depositary services, foreign exchange and securities lending services. The completion of the transaction is subject to customary closing conditions and regulatory approvals. During this period, there has been no change to the current control environment and no impact to the execution of control activities. There were no other significant events during the year. 16. Soft commissions The Company has not entered into any soft commission arrangements during the financial year ended 30 September 2021 and 30 September 2020. 17. Cross liability Each Sub-Fund is segregated and there are no cross liabilities between the Sub-Funds. 18. Subsequent events The new prospectus for the Company was issued at 1 October 2021. KBA Consulting Management Limited was appointed the Manager of the Company effective from 1 October 2021. Mr Richard Grant ceased acting as a Managing Partner of the Investment Manager and director of Veritas Asset Management (Asia) Ltd from 1 November 2021. He will continue as a director on the Board of the Company. There were no other significant events subsequent to the year-end. 19. Approval of financial statements The Financial Statements were approved by the Board of Directors on 14 December 2021.

VERITAS FUNDS PLC
151
VERITAS ASIAN FUND
SCHEDULE OF CHANGES IN INVESTMENTS (UNAUDITED) FOR THE YEAR ENDED 30 SEPTEMBER 2021
Largest purchases Units Cost (USD)Afterpay Ltd. 1,018,431 80,525,952Alibaba Group Holding Ltd. 2,137,039 65,890,937Anta Sports Products Ltd. 5,000,000 74,035,645China Tourism Group Duty Free Corp. Ltd. 2,428,772 96,444,353Guangzhou Kingmed Diagnostics Group Co. Ltd. 6,812,112 144,477,984Hangzhou First Applied Material Co. Ltd. 3,999,982 78,317,281HDFC Bank Ltd. 13,052,100 253,015,835Hindustan Unilever Ltd. 2,600,000 76,331,045JD.com, Inc. 3,000,000 133,462,144Jiangsu Yanghe Brewery Joint-Stock Co. Ltd. 2,499,982 81,588,309KE Holdings, Inc. 2,500,000 145,000,000Kotak Mahindra Bank Ltd. 5,500,000 122,586,934Kuaishou Technology 4,100,000 141,298,613Kweichow Moutai Co. Ltd. 439,691 133,456,429LG Chem Ltd. 471,700 369,580,127LONGi Green Energy Technology Co. Ltd. 15,499,664 227,579,162Meituan Dianping 2,000,000 82,137,204Midea Group Co. Ltd. 11,310,130 143,924,902Reliance Industries Ltd. 3,000,000 85,909,051Samsung Electronics Co. Ltd. 2,600,000 171,048,964Samsung SDI Co. Ltd. 440,000 239,080,081Sany Heavy Industry Co. Ltd. 34,407,192 214,722,212Sea Ltd. 970,000 181,947,352Shenzhen Inovance Technology Co. Ltd. 24,004,300 308,984,885Sungrow Power Supply Co. Ltd. 21,439,507 228,142,717Sungrow Power Supply Co. Ltd. (Warrant 21/04/2022) 4,638,968 92,675,619Taiwan Semiconductor Manufacturing Co. Ltd. 13,173,100 253,780,790Tata Consultancy Services Ltd. 4,133,071 177,120,970Tencent Holdings Ltd. 1,800,000 140,336,882Wuliangye Yibin Co. Ltd. 2,459,879 106,519,138WuXi AppTec Co. Ltd. 2,799,848 58,829,415Wuxi Lead Intelligent Equipment Co. Ltd. 20,499,706 210,591,896
The Schedule of Changes in Investments reflects the aggregate purchases of a security exceeding one percent of the total value of purchases for the year and aggregate sales of a security exceeding one percent of the total sales for the year.

VERITAS FUNDS PLC
152
VERITAS ASIAN FUND
SCHEDULE OF CHANGES IN INVESTMENTS (UNAUDITED) FOR THE YEAR ENDED 30 SEPTEMBER 2021
Largest sales Units Proceeds (USD)Aier Eye Hospital Group Co. Ltd. 23,948,103 222,365,990Alibaba Group Holding Ltd. 11,940,000 345,704,902Alibaba Health Information Technology Ltd. 41,000,000 117,419,865Anta Sports Products Ltd. 5,000,000 79,069,292Aristocrat Leisure Ltd. 6,300,000 155,757,369China Gas Holdings Ltd. 18,580,000 68,742,832China Tourism Group Duty Free Corp. Ltd. 5,678,584 210,932,007CP ALL PCL 31,000,000 60,821,886CSL Ltd. 272,700 59,441,507Goodman Group 4,095,000 56,595,075HDFC Bank Ltd. 1,200,000 92,045,130JD.com, Inc. 4,500,000 174,493,153Jiangsu Hengrui Medicine Co. Ltd. 5,199,729 85,745,880Jiangsu Yanghe Brewery Joint-Stock Co. Ltd. 2,499,982 73,505,711KE Holdings, Inc. 2,500,000 138,158,043Kuaishou Technology 4,100,000 104,770,818Li Ning Co. Ltd. 24,100,000 163,569,680Meituan Dianping 8,000,000 293,727,104Pinduoduo, Inc. 1,950,000 207,483,547REA Group Ltd. 480,000 50,634,306ResMed, Inc. 4,000,000 97,245,863Samsung Electronics Co. Ltd. 1,880,000 134,054,506Sany Heavy Industry Co. Ltd. 34,407,192 137,720,138Sea Ltd. 421,000 103,226,326Shenzhen Mindray Bio-Medical Electronics Co. Ltd. 1,899,700 133,123,002Sungrow Power Supply Co. Ltd. 7,000,000 143,384,782Taiwan Semiconductor Manufacturing Co. Ltd. 4,000,000 81,777,003Tencent Holdings Ltd. 4,008,300 306,312,800Transurban Group 16,600,000 167,569,753Wuliangye Yibin Co. Ltd. 6,462,184 216,847,810WuXi AppTec Co. Ltd. 4,553,700 109,580,667Wuxi Biologics Cayman, Inc. 5,000,000 74,271,205
The Schedule of Changes in Investments reflects the aggregate purchases of a security exceeding one percent of the total value of purchases for the year and aggregate sales of a security exceeding one percent of the total sales for the year.

VERITAS FUNDS PLC
153
VERITAS GLOBAL FOCUS FUND
SCHEDULE OF CHANGES IN INVESTMENTS (UNAUDITED) FOR THE YEAR ENDED 30 SEPTEMBER 2021
Largest purchases Units Cost (USD)Alibaba Group Holding Ltd. 76,800 18,393,769Amazon.com, Inc. 43,900 154,519,180Becton Dickinson & Co 203,500 47,321,279Catalent, Inc. 173,800 18,160,934Charter Communications, Inc. 12,700 7,846,784CoStar Group, Inc. 234,900 87,853,273CVS Health Corp. 557,100 43,934,267Facebook, Inc. 31,600 11,638,760Fiserv, Inc. 256,200 28,694,400Illumina, Inc. 95,503 32,740,201Microsoft Corp. 634,000 142,329,374Moody's Corp. 417,200 118,026,833Unilever PLC 1,244,600 67,364,283Vinci S.A. 316,500 28,107,578
Largest sales Units Proceeds (USD)Abbott Laboratories 823,863 102,576,699Aena SME S.A. 137,700 22,736,703Airbus SE 1,162,800 133,315,201Alphabet, Inc. 66,600 158,355,326BAE Systems PLC 3,932,500 29,751,863Catalent, Inc. 182,900 23,371,500Charter Communications, Inc. 172,303 123,206,250Cochlear Ltd. 425,824 76,048,041Cooper Cos, Inc. 87,700 37,407,670CVS Health Corp. 486,000 36,713,205Intercontinental Exchange, Inc. 408,700 47,162,711Mastercard, Inc. 122,300 42,204,660Microsoft Corp. 78,000 22,362,182Moody's Corp. 169,300 63,892,808Nestle S.A. 560,538 69,490,893Philip Morris International, Inc. 1,284,383 109,584,184Safran S.A. 690,600 99,299,220Sonic Healthcare Ltd. 1,573,632 41,719,012Svenska Handelsbanken AB 11,931,446 121,299,196Unilever PLC 906,100 53,908,473UnitedHealth Group, Inc. 50,500 19,270,367
The Schedule of Changes in Investments reflects the aggregate purchases of a security exceeding one percent of the total value of purchases for the year and aggregate sales of a security exceeding one percent of the total sales for the year.

VERITAS FUNDS PLC
154
VERITAS GLOBAL EQUITY INCOME FUND
SCHEDULE OF CHANGES IN INVESTMENTS (UNAUDITED) FOR THE YEAR ENDED 30 SEPTEMBER 2021
Largest purchases Units Cost (GBP)General Dynamics Corp. 80,100 9,165,077Industria de Diseno Textil S.A. 366,100 8,322,403Safran S.A. 13,900 1,349,298Vinci S.A. 16,200 1,265,214Vivendi SE 260,900 2,472,263
Largest sales Units Proceeds (GBP)Aena SME S.A. 65,000 7,842,764Airbus SE 100,700 8,849,129Ascendas Real Estate Investment Trust 2,772,300 4,793,558BAE Systems PLC 1,093,200 5,898,510BP PLC 2,263,692 6,793,388British American Tobacco PLC 157,900 4,293,489Cisco Systems, Inc. 119,400 4,245,531CVS Health Corp. 82,600 4,617,264Diageo PLC 132,600 4,271,377Ferguson PLC 40,200 3,528,346MSC Industrial Direct Co., Inc. 51,600 3,321,283Nestle S.A. 21,400 1,946,730NetLink NBN Trust 12,345,200 6,664,565Pfizer, Inc. 125,500 3,601,010Philip Morris International, Inc. 125,100 8,008,206Reckitt Benckiser Group PLC 31,000 2,199,161Sanofi 20,000 1,340,221Sonic Healthcare Ltd. 240,333 4,729,529Svenska Handelsbanken AB 462,200 3,463,609Unibail-Rodamco-Westfield 76,600 2,490,642Unilever NV 32,000 1,529,632Unilever PLC 31,100 1,364,164United Overseas Bank Ltd. 212,900 2,842,079Universal Music Group NV 116,000 2,487,140Vivendi SE 292,200 6,906,379Welltower, Inc. 146,700 8,178,963
The Schedule of Changes in Investments reflects the aggregate purchases of a security exceeding one percent of the total value of purchases for the year and aggregate sales of a security exceeding one percent of the total sales for the year.

VERITAS FUNDS PLC
155
VERITAS CHINA FUND
SCHEDULE OF CHANGES IN INVESTMENTS (UNAUDITED) FOR THE YEAR ENDED 30 SEPTEMBER 2021
Largest purchases Units Cost (USD)Alibaba Group Holding Ltd. 75,000 2,468,091A Anta Sports Products Ltd. 100,000 1,912,323Bilibili Inc. 20,000 2,390,088By-health Co. Ltd. 300,000 1,208,524China Gas Holdings Ltd. 506,000 1,854,434China Tourism Group Duty Free Corp. Ltd. 79,994 3,337,069Estun Automation Co. Ltd. 959,992 4,677,371Guangzhou GRG Metrology & Test Co. Ltd. 429,978 2,723,920Guangzhou Kingmed Diagnostics Group Co. Ltd. 261,956 4,631,994Hangzhou First Applied Material Co. Ltd. 100,000 1,901,882Innovent Biologics, Inc. 150,000 1,654,857JD.com, Inc. 75,000 4,005,931Jiangsu Yanghe Brewery Joint-Stock Co. Ltd. 100,000 3,207,580JS Global Lifestyle Co. Ltd. 650,000 1,764,213JW Cayman Therapeutics Co. Ltd. 300,000 1,320,313KE Holdings, Inc. 40,000 2,545,664Kuaishou Technology 85,000 2,869,422Kweichow Moutai Co. Ltd. 4,300 1,312,064Li Ning Co. Ltd. 200,000 1,267,591LONGi Green Energy Technology Co. Ltd. 199,918 2,289,286Luzhou Laojiao Co. Ltd. 85,000 3,261,562Meituan Dianping 80,000 2,918,124Microport Scientific Corp. 400,000 1,674,691Midea Group Co. Ltd. 179,998 2,222,483Pinduoduo, Inc 8,000 1,061,356Sany Heavy Industry Co. Ltd. 400,000 2,650,444Shandong Sinocera Functional Material Co. Ltd. 300,000 1,873,419Shenzhen Inovance Technology Co. Ltd. 250,000 3,830,594Shenzhen Mindray Bio-Medical Electronics Co. Ltd. 49,947 2,678,784Skshu Paint Co. Ltd. 50,000 1,143,610Sungrow Power Supply Co. Ltd. 319,999 3,269,440Wuliangye Yibin Co. Ltd. 77,413 3,327,823WuXi AppTec Co. Ltd. 120,000 2,279,704Wuxi Biologics Cayman, Inc. 150,000 1,880,163Wuxi Lead Intelligent Equipment Co. Ltd. 149,998 1,394,646Xinyi Glass Holdings Ltd. 500,000 2,010,735Yatsen Holding Ltd. 200,000 4,290,673Yunnan Energy New Material Co. Ltd. 30,000 1,300,665Zhejiang Sanhua Intelligent Controls Co. Ltd. 799,975 2,781,990Zhejiang Shuanghuan Driveline Co. Ltd. (Warrant 04/08/2026) 1,000,000 3,325,743
The Schedule of Changes in Investments reflects the aggregate purchases of a security exceeding one percent of the total value of purchases for the year and aggregate sales of a security exceeding one percent of the total sales for the year.

VERITAS FUNDS PLC
156
VERITAS CHINA FUND
SCHEDULE OF CHANGES IN INVESTMENTS (UNAUDITED) FOR THE YEAR ENDED 30 SEPTEMBER 2021
Largest sales Units Proceeds (USD)Aier Eye Hospital Group Co. Ltd. 130,950 1,161,350Alibaba Group Holding Ltd. 115,000 3,503,278Anta Sports Products Ltd. 100,000 1,581,386Bilibili Inc. 20,000 3,001,972China Gas Holdings Ltd. 706,000 2,459,544China Tourism Group Duty Free Corp. Ltd. 119,994 4,660,130Dian Diagnostics Group Co. Ltd. 200,000 1,076,114ENN Energy Holdings Ltd. 150,000 2,600,468GSX Techedu Inc. 10,000 1,035,126Guangzhou Kingmed Diagnostics Group Co. Ltd. 120,000 2,528,219Innovent Biologics, Inc. 150,000 1,224,469JD.com, Inc. 95,000 3,531,333Jiangsu Yanghe Brewery Joint-Stock Co. Ltd. 100,000 2,940,249Jinxin Fertility Group Ltd. 700,000 1,354,774KE Holdings, Inc. 40,000 2,296,574Kuaishou Technology 85,000 2,186,009Kweichow Moutai Co. Ltd. 4,000 1,303,497Li Ning Co. Ltd. 300,000 2,001,423LONGi Green Energy Technology Co. Ltd. 231,894 3,201,058Luzhou Laojiao Co. Ltd. 189,300 5,587,050Meituan Dianping 80,000 2,951,862Microport Scientific Corp. 400,000 2,071,249Pinduoduo, Inc. 26,000 2,813,783Poly Property Services Co. Ltd. 150,000 1,024,842Sany Heavy Industry Co. Ltd. 400,000 1,644,911Shandong Sinocera Functional Material Co. Ltd. 360,000 2,580,543Shanghai M&G Stationery, Inc. 75,000 1,118,717Shenzhen Mindray Bio-Medical Electronics Co. Ltd. 49,947 3,517,472Songcheng Performance Development Co. Ltd. 349,886 893,476Sungrow Power Supply Co. Ltd. 140,000 3,069,489TAL Education Group 15,000 1,004,501Tencent Holdings Ltd. 20,000 1,598,941Topchoice Medical Corp. 35,000 1,239,586Venus MedTech Hangzhou, Inc. 100,000 1,225,456Wuliangye Yibin Co. Ltd. 77,413 2,471,229WuXi AppTec Co. Ltd. 50,000 1,367,241Yatsen Holding Ltd. 200,000 2,840,555
The Schedule of Changes in Investments reflects the aggregate purchases of a security exceeding one percent of the total value of purchases for the year and aggregate sales of a security exceeding one percent of the total sales for the year.

VERITAS FUNDS PLC
157
VERITAS GLOBAL REAL RETURN FUND
SCHEDULE OF CHANGES IN INVESTMENTS (UNAUDITED) FOR THE YEAR ENDED 30 SEPTEMBER 2021
Largest purchases Units Cost (GBP)Alibaba Group Holding Ltd. 8,400 1,480,585Amazon.com, Inc. 4,300 10,982,642Becton Dickinson & Co. 19,300 3,360,749Canadian Pacific Railway Ltd. 36,400 1,794,415Catalent, Inc. 12,600 956,358CoStar Group, Inc. 10,100 5,946,633CVS Health Corp. 70,600 4,147,138Fiserv, Inc. 29,000 2,450,581Illumina, Inc. 10,475 2,664,927Microsoft Corp. 73,500 12,261,540Moody's Corp. 29,400 5,960,074Unilever PLC 91,486 3,554,024Vinci S.A. 32,600 2,243,064
The Schedule of Changes in Investments reflects the aggregate purchases of a security exceeding one percent of the total value of purchases for the year and aggregate sales of a security exceeding one percent of the total sales for the year.

VERITAS FUNDS PLC
158
VERITAS GLOBAL REAL RETURN FUND
SCHEDULE OF CHANGES IN INVESTMENTS (UNAUDITED) FOR THE YEAR ENDED 30 SEPTEMBER 2021
Largest sales Units Proceeds (GBP)Abbott Laboratories 98,900 8,842,467Aena SME S.A. 23,300 2,826,943Airbus SE 143,600 11,937,093Alibaba Group Holding Ltd. 12,100 1,846,840Alphabet, Inc. 8,500 14,284,012BAE Systems PLC 675,700 3,605,020Becton Dickinson & Co. 10,900 1,983,940Canadian Pacific Railway Ltd. 13,400 3,489,875Catalent, Inc. 23,200 2,241,443Charter Communications, Inc. 13,000 7,118,602Cochlear Ltd. 74,200 9,347,270Cooper Cos, Inc 13,700 4,025,675CVS Health Corp. 106,600 5,491,898Facebook, Inc. 6,500 1,452,324Fiserv, Inc. 22,700 1,802,449Intercontinental Exchange, Inc. 61,100 5,052,296Mastercard, Inc. 15,000 3,961,764Microsoft Corp. 18,900 3,555,819Moody's Corp. 5,000 1,346,280Nestle S.A. 62,100 5,484,184Safran S.A. 95,000 10,071,846Sonic Healthcare Ltd. 132,551 2,718,917Svenska Handelsbanken AB 1,162,100 8,668,749Unilever PLC 68,100 2,983,164UnitedHealth Group, Inc. 11,500 2,988,332Vinci S.A. 30,100 2,266,764
The Schedule of Changes in Investments reflects the aggregate purchases of a security exceeding one percent of the total value of purchases for the year and aggregate sales of a security exceeding one percent of the total sales for the year.

VERITAS FUNDS PLC
159
VERITAS IZOARD FUND
SCHEDULE OF CHANGES IN INVESTMENTS (UNAUDITED) FOR THE YEAR ENDED 30 SEPTEMBER 2021
Largest purchases Units Cost (USD)Alibaba Group Holding Ltd. 11,400 2,924,233CVS Health Corp. 6,100 520,812Microsoft Corp. 16,300 3,732,054Moody's Corp. 8,400 2,376,390Unilever PLC 8,000 432,900Vinci S.A. 8,600 704,643
Largest sales Units Proceeds (USD)Airbus SE 28,900 3,260,766Alphabet, Inc. 2,100 4,487,170British American Tobacco PLC 74,300 2,877,809Canadian Pacific Railway Ltd. 6,000 443,330Charter Communications, Inc. 767 484,677Cooper Cos, Inc. 1,900 801,438CVS Health Corp. 12,500 932,012Intercontinental Exchange, Inc. 200 22,736Nestle S.A. 11,400 1,434,504Philip Morris International, Inc. 37,400 3,188,144Safran S.A. 4,500 629,024Sonic Healthcare Ltd. 24,028 666,047Unilever PLC 6,300 381,298Vinci S.A. 2,300 240,484
The Schedule of Changes in Investments reflects the aggregate purchases of a security exceeding one percent of the total value of purchases for the year and aggregate sales of a security exceeding one percent of the total sales for the year.

VERITAS FUNDS PLC
160
VERITAS THIRD EYE GLOBAL EMERGING MARKETS FUND
SCHEDULE OF CHANGES IN INVESTMENTS (UNAUDITED) FOR THE YEAR ENDED 30 SEPTEMBER 2021
Largest purchases Units Cost (USD)Alibaba Group Holding Ltd. 3,700 116,567Avenue Supermarts Ltd. (Warrant 07/10/2025) 7,800 216,931Divi's Laboratories Ltd. (Warrant 09/02/2026) 5,100 258,280Epiroc AB 13,800 204,514Foshan Haitian Flavouring & Food Co. Ltd. 24,900 418,800Indian Energy Exchange Ltd. (Warrant 18/11/2024) 48,000 245,638Jiangsu Yanghe Brewery Joint-Stock Co. Ltd. 2,800 72,914Kotak Mahindra Bank Ltd. 33,600 776,163Kotak Mahindra Bank Ltd. (Warrant 02/06/2025) 32,800 833,938Nestle S.A. 1,300 150,161Netflix, Inc. 1,300 679,160New Oriental Education & Technology Group, Inc. 1,400 226,576Pernod Ricard S.A. 600 114,454Safran S.A. 1,900 243,224SAP SE 2,200 316,280Tata Consultancy Services Ltd. (Warrant 25/02/2025) 1,500 67,254Tencent Holdings Ltd. 3,200 210,010Thermo Fisher Scientific, Inc. 1,300 589,716Wuliangye Yibin Co. Ltd. 12,100 396,938Yihai International Holding Ltd. 71,000 418,240
The Schedule of Changes in Investments reflects the aggregate purchases of a security exceeding one percent of the total value of purchases for the year and aggregate sales of a security exceeding one percent of the total sales for the year.
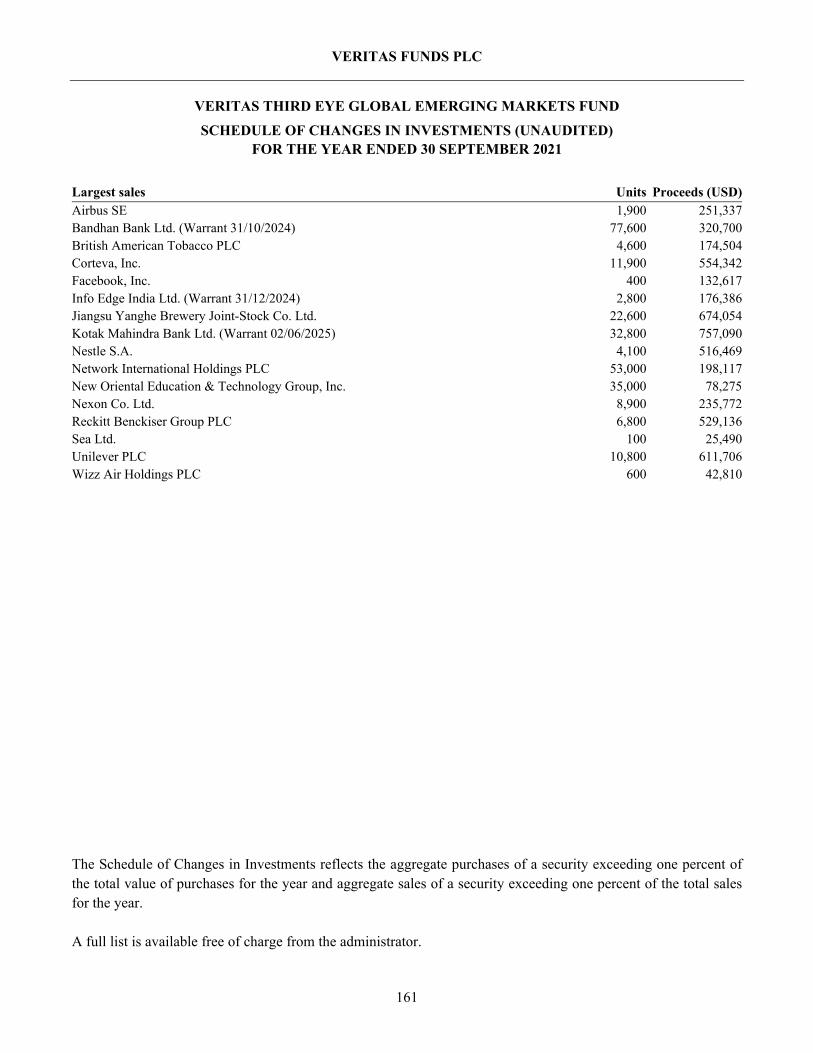
VERITAS FUNDS PLC
161
VERITAS THIRD EYE GLOBAL EMERGING MARKETS FUND
SCHEDULE OF CHANGES IN INVESTMENTS (UNAUDITED) FOR THE YEAR ENDED 30 SEPTEMBER 2021
Largest sales Units Proceeds (USD)Airbus SE 1,900 251,337Bandhan Bank Ltd. (Warrant 31/10/2024) 77,600 320,700British American Tobacco PLC 4,600 174,504Corteva, Inc. 11,900 554,342Facebook, Inc. 400 132,617Info Edge India Ltd. (Warrant 31/12/2024) 2,800 176,386Jiangsu Yanghe Brewery Joint-Stock Co. Ltd. 22,600 674,054Kotak Mahindra Bank Ltd. (Warrant 02/06/2025) 32,800 757,090Nestle S.A. 4,100 516,469Network International Holdings PLC 53,000 198,117New Oriental Education & Technology Group, Inc. 35,000 78,275Nexon Co. Ltd. 8,900 235,772Reckitt Benckiser Group PLC 6,800 529,136Sea Ltd. 100 25,490Unilever PLC 10,800 611,706Wizz Air Holdings PLC 600 42,810
The Schedule of Changes in Investments reflects the aggregate purchases of a security exceeding one percent of the total value of purchases for the year and aggregate sales of a security exceeding one percent of the total sales for the year. A full list is available free of charge from the administrator.

VERITAS FUNDS PLC
162
SUPPLEMENTARY INFORMATION (UNAUDITED) 1. Total expense ratio The total expense ratio for each share class of each Sub-Fund for the year ended 30 September 2021 is as follows: Veritas Asian Fund USD A Class Shares 1.06% GBP A Class Shares 1.06% EUR A Class Shares 1.06% USD B Class Shares 1.56% GBP B Class Shares 1.56% EUR B Class Shares 1.57% USD C Class Shares 0.81% GBP C Class Shares 0.81% EUR C Class Shares 0.81% USD D Class Shares 0.81% GBP D Class Shares 0.81% EUR D Class Shares 0.82% USD A Accumulation Class* 1.08% GBP A Accumulation Class** 1.07% EUR A Accumulation Class*** 1.08% USD B Accumulation Class**** 1.58% Veritas Global Focus Fund USD A Class Shares 1.03% GBP A Class Shares 1.03% EUR A Class Shares 1.03% USD B Class Shares 1.53% GBP B Class Shares 1.53% EUR B Class Shares 1.53% USD C Class Shares 0.78% GBP C Class Shares 0.78% EUR C Class Shares 0.78% USD D Class Shares 0.78% GBP D Class Shares 0.78% EUR D Class Shares 0.78% NOK E Class Shares 0.78% Veritas Global Equity Income Fund USD A Class Shares 1.07% GBP A Class Shares 1.07% EUR A Class Shares 1.07% USD B Class Shares 1.57% GBP B Class Shares 1.57%
* Launched: 11 March 2021 ** Launched: 2 November 2020 *** Launched: 1 February 2021 **** Launched: 2 March 2021

VERITAS FUNDS PLC
163
SUPPLEMENTARY INFORMATION (UNAUDITED) (CONTINUED) 1. Total expense ratio (continued) Veritas Global Equity Income Fund (continued) EUR B Class Shares 1.57% USD C Class Shares 0.00% GBP C Class Shares 0.82% EUR C Class Shares 0.82% USD D Class Shares 0.82% GBP D Class Shares 0.82% EUR D Class Shares 0.82% USD E Class Shares 1.57% Veritas China Fund USD A Class Shares 1.18% GBP A Class Shares 1.18% EUR A Class Shares 1.17% GBP B Class Shares 1.68% EUR B Class Shares 1.67% Veritas Global Real Return Fund USD A Class Shares 1.05% GBP A Class Shares 1.05% EUR A Class Shares 1.05% USD B Class Shares 1.55% GBP B Class Shares 1.55% EUR B Class Shares 1.55% USD D Class Shares 0.90% GBP D Class Shares 0.90% EUR D Class Shares 0.90% USD E Class Shares 0.90% EUR E Class Shares 0.91% Veritas Izoard Fund USD C Class Shares 0.54% GBP C Class Shares 0.54% Veritas Third Eye Global Emerging Markets Fund USD A Class Shares 1.25% GBP A Class Shares 1.25%

VERITAS FUNDS PLC
164
SUPPLEMENTARY INFORMATION (UNAUDITED) (CONTINUED) 2. Fund performance data The percentage total return of one share, of each share class from inception is calculated in accordance with the Swiss Funds Association and is detailed below:
Share Class
12 month period to
30 September 2021
Inception to
30 September 2021
Veritas Asian Fund USD A Class Shares 25.96% 683.82% GBP A Class Shares 20.27% 983.55% EUR A Class Shares 27.50% 672.02% USD B Class Shares 25.33% 438.77% GBP B Class Shares 19.67% 689.43% EUR B Class Shares 26.83% 462.67% USD C Class Shares 26.28% 155.78% GBP C Class Shares 20.57% 131.63% EUR C Class Shares 27.82% 69.45% USD D Class Shares 26.28% 146.64% GBP D Class Shares 20.57% 126.14% EUR D Class Shares 27.81% 92.37% USD A Accumulation Class* N/A (5.10%) GBP A Accumulation Class** N/A 14.35% EUR A Accumulation Class*** N/A 4.42% USD B Accumulation Class**** N/A (3.80%) Veritas Asian Fund Benchmark MSCI AC Asia Pacific ex Japan (USD A Class Shares) MSCI AC Asia Pacific ex Japan (GBP A Class Shares) MSCI AC Asia Pacific ex Japan (EUR A Class Shares) MSCI AC Asia Pacific ex Japan (USD B Class Shares) MSCI AC Asia Pacific ex Japan (GBP B Class Shares) MSCI AC Asia Pacific ex Japan (EUR B Class Shares) MSCI AC Asia Pacific ex Japan (USD C Class Shares) MSCI AC Asia Pacific ex Japan (GBP C Class Shares) MSCI AC Asia Pacific ex Japan (EUR C Class Shares) MSCI AC Asia Pacific ex Japan (USD D Class Shares) MSCI AC Asia Pacific ex Japan (GBP D Class Shares) MSCI AC Asia Pacific ex Japan (EUR D Class Shares) MSCI AC Asia Pacific ex Japan (USD A Accumulation Class) MSCI AC Asia Pacific ex Japan (GBP A Accumulation Class) MSCI AC Asia Pacific ex Japan (EUR A Accumulation Class) MSCI AC Asia Pacific ex Japan (USD B Accumulation Class)
* Launched: 11 March 2021 ** Launched: 2 November 2020 *** Launched: 1 February 2021 **** Launched: 2 March 2021

VERITAS FUNDS PLC
165
SUPPLEMENTARY INFORMATION (UNAUDITED) (CONTINUED) 2. Fund performance data (continued)
Share Class
12 month period to
30 September 2021
Inception to
30 September 2021
Veritas Global Focus Fund USD A Class Shares 22.95% 377.85% GBP A Class Shares 17.39% 504.01% EUR A Class Shares 24.45% 151.08% USD B Class Shares 22.34% 238.07% GBP B Class Shares 16.82% 352.79% EUR B Class Shares 23.85% 193.39% USD C Class Shares 23.26% 432.54% GBP C Class Shares 17.69% 571.24% EUR C Class Shares 24.76% 364.55% USD D Class Shares 23.19% 396.06% GBP D Class Shares 17.63% 526.63% EUR D Class Shares 24.68% 331.74% NOK E Class Shares 20.92% 26.83% Veritas Global Equity Income Fund USD A Class Shares 22.31% 41.67% GBP A Class Shares 16.79% 104.08% EUR A Class Shares 23.82% 139.63% USD B Class Shares 21.69% 36.36% GBP B Class Shares 16.20% 82.27% EUR B Class Shares 23.19% 113.46% USD C Class Shares 27.65% 117.00% GBP C Class Shares 20.76% 209.65% EUR C Class Shares 28.06% 263.41% USD D Class Shares 22.62% 49.40% GBP D Class Shares 17.09% 116.11% EUR D Class Shares 24.11% 150.11% USD E Class Shares 16.11% 57.50% Veritas China Fund USD A Class Shares 7.30% 140.22% GBP A Class Shares 2.45% 138.31% EUR A Class Shares 8.71% 123.60% GBP B Class Shares 1.94% 125.04% EUR B Class Shares 8.07% 122.05%

VERITAS FUNDS PLC
166
SUPPLEMENTARY INFORMATION (UNAUDITED) (CONTINUED) 2. Fund performance data (continued)
Share Class
12 month period to
30 September 2021
Inception to
30 September 2021
Veritas Global Real Return Fund USD A Class Shares 4.21% 250.83% GBP A Class Shares 4.48% 93.53% EUR A Class Shares 3.43% 87.48% USD B Class Shares 3.70% 230.89% GBP B Class Shares 3.96% 84.99% EUR B Class Shares 2.92% 95.32% USD D Class Shares 4.36% 45.76% GBP D Class Shares 4.64% 94.68% EUR D Class Shares 3.58% 32.62% USD E Class Shares 9.59% 13.42% EUR E Class Shares* N/A 31.58% Veritas Izoard Fund USD C Class Shares 22.91% 66.82% GBP C Class Shares 17.36% 95.34% Veritas Third Eye Global Emerging Markets Fund USD A Class Shares 19.26% 27.88% GBP A Class Shares 13.87% 20.30%
* Liquidated: 8 July 2021

VERITAS FUNDS PLC
167
SUPPLEMENTARY INFORMATION (UNAUDITED) (CONTINUED) 2. Fund performance data (continued)
Share Class
12 month period to
30 September 2020
Inception to
30 September 2020
Veritas Asian Fund USD A Class Shares 34.64% 522.27% GBP A Class Shares 29.10% 800.93% EUR A Class Shares 25.56% 505.52% USD B Class Shares 33.96% 329.87% GBP B Class Shares 28.46% 559.66% EUR B Class Shares 24.98% 343.65% USD C Class Shares 34.97% 102.56% GBP C Class Shares 29.43% 92.11% EUR C Class Shares 25.80% 32.57% USD D Class Shares 34.86% 95.31% GBP D Class Shares 29.32% 87.55% EUR D Class Shares 25.78% 50.51% Veritas Asian Fund Benchmark MSCI AC Asia Pacific ex Japan (USD A Class Shares) MSCI AC Asia Pacific ex Japan (GBP A Class Shares) MSCI AC Asia Pacific ex Japan (EUR A Class Shares) MSCI AC Asia Pacific ex Japan (USD B Class Shares) MSCI AC Asia Pacific ex Japan (GBP B Class Shares) MSCI AC Asia Pacific ex Japan (EUR B Class Shares) MSCI AC Asia Pacific ex Japan (USD C Class Shares) MSCI AC Asia Pacific ex Japan (GBP C Class Shares) MSCI AC Asia Pacific ex Japan (EUR C Class Shares) MSCI AC Asia Pacific ex Japan (USD D Class Shares) MSCI AC Asia Pacific ex Japan (GBP D Class Shares)

VERITAS FUNDS PLC
168
SUPPLEMENTARY INFORMATION (UNAUDITED) (CONTINUED) 2. Fund performance data (continued)
Share Class
12 month period to
30 September 2020
Inception to
30 September 2020
Veritas Global Focus Fund USD A Class Shares 9.39% 288.65% GBP A Class Shares 4.89% 414.52% EUR A Class Shares 2.02% 101.76% USD B Class Shares 8.88% 176.34% GBP B Class Shares 4.41% 287.60% EUR B Class Shares 1.55% 136.90% USD C Class Shares 9.70% 332.06% GBP C Class Shares 5.20% 470.37% EUR C Class Shares 2.31% 272.36% USD D Class Shares 9.40% 302.66% GBP D Class Shares 4.91% 432.72% EUR D Class Shares 2.03% 246.28% NOK E Class Shares 5.63% 4.89% Veritas Global Equity Income Fund USD A Class Shares (9.47%) 15.83% GBP A Class Shares (13.18%) 74.73% EUR A Class Shares (15.57%) 93.53% USD B Class Shares (9.93%) 12.05% GBP B Class Shares (13.62%) 56.85% EUR B Class Shares (16.00%) 73.27% USD C Class Shares (5.20%) 70.00% GBP C Class Shares (9.66%) 156.41% EUR C Class Shares (12.15%) 183.78% USD D Class Shares (9.24%) 21.84% GBP D Class Shares (12.96%) 84.57% EUR D Class Shares (15.35%) 101.53% USD E Class Shares (13.02%) 35.65% Veritas China Fund USD A Class Shares 47.42% 123.87% GBP A Class Shares 41.37% 132.61% EUR A Class Shares 37.47% 105.69% GBP B Class Shares 40.66% 120.76% EUR B Class Shares 36.96% 105.47%

VERITAS FUNDS PLC
169
SUPPLEMENTARY INFORMATION (UNAUDITED) (CONTINUED) 2. Fund performance data (continued)
Share Class
12 month period to
30 September 2020
Inception to
30 September 2020
Veritas Global Real Return Fund USD A Class Shares 4.86% 236.66% GBP A Class Shares 4.69% 85.23% EUR A Class Shares 3.24% 81.26% USD B Class Shares 4.32% 219.09% GBP B Class Shares 4.17% 77.94% EUR B Class Shares 2.72% 89.78% USD D Class Shares 4.97% 39.66% GBP D Class Shares 4.85% 86.05% EUR D Class Shares 3.34% 28.03% USD E Class Shares* N/A 3.50% EUR E Class Shares 1.97% 18.25% Veritas Izoard Fund USD C Class Shares 9.19% 35.72% GBP C Class Shares 4.71% 66.45% Veritas Third Eye Global Emerging Markets Fund USD A Class Shares 8.51% 7.22% GBP A Class Shares 0.00% 1.53%
* Launched: 29 November 2019
Past performance is no indication of current or future performance and that the performance data do not take account of commissions and costs incurred on the issue and redemption of units. The Extract Prospectus, the documents of the Company listed in the Extract Prospectus, the yearly and half-yearly reports as well as the Articles and the simplified Extract Prospectus, can be obtained, or be ordered free of charge, from the Zurich branch of the Swiss Representative during normal business hours.

VERITAS FUNDS PLC
170
ADDITIONAL INFORMATION (UNAUDITED) UCITS V – Disclosure of Remuneration Policy Veritas Funds Plc (the “Company”) has implemented a remuneration policy pursuant to Directive 2014/91/EU of the European Parliament and of the Council of 23 July 2014 amending Directive 2009/65/EC on the coordination of laws, regulations and administrative provisions relating to undertakings for collective investment in transferable securities (UCITS) as regards to depositary functions, remuneration policies and sanctions (the “UCITS V Directive”). This remuneration policy has been adopted by the Board of Directors in their supervisory function and who will be responsible for (i) reviewing the general principles of the remuneration policy on an annual basis and (ii) ensuring that the implementation of the remuneration policy is subject to review on an annual basis. Any revisions to the remuneration policy will also require their approval. As of 30 September 2021 the Company was a self-managed investment company with no employees, other than the Board of Directors. This remuneration policy addresses the remuneration requirements of the UCITS V Directive as they apply to the Company. The Company will ensure that appropriate contractual arrangements are put in place with entities to which investment management is delegated to ensure that the UCITS remuneration rules are not circumvented or that such delegates are subject to regulatory requirements on remuneration which are equally effective as those applicable under the ESMA Guidelines on Sound Remuneration Policies under the UCITS Directive ESMA 2016/575 (the “ESMA Guidelines”). Contractual arrangements relate to any payments made to delegates’ identified staff as compensation for performance of investment management activities on behalf of the Company. The Board of Directors of the Company consists of only non-executive Directors. The members of the Board of Directors receive a fixed fee only and do not receive performance-based remuneration therefore avoiding a potential conflict of interest. The basic fee of a Board member is set at a level that is on par with the rest of the market and reflects the qualifications and contribution required in view of the Company’s business strategy, objectives, values and the values of its Shareholders, the extent of the responsibilities of the Board and the number of board meetings. No pension contributions are payable on Board members’ fees. Taking into account the Company’s size, internal organisation nature, the scope and complexity of its activities, the Board of Directors has decided to dis-apply the remuneration committee requirement. The Board is satisfied that this disapplication is reconcilable with the risk profile, risk appetite and the strategy of the Company and its Sub-Funds. Additionally as the Company does not pay any variable remuneration to any of the Directors appointed by the Company, the “pay out process rules” as set out in the UCITS V Directive are not applicable to the Company and an assessment of whether they need to be dis-applied is not required. Remuneration of Veritas Asset Management LLP (the “Investment Manager”) split into fixed and variable is detailed in Note 3 of the financial statements. During the period, remuneration of USD 101,688,470 was earned by the Company to the Investment Manager of which USD 8,545,343 remained outstanding at period end.
VERITAS FUNDS PLC
171
ADDITIONAL INFORMATION (UNAUDITED) (CONTINUED) UCITS V – Disclosure of Remuneration Policy (continued) The Investment Manager is regulated by the UK Financial Conduct Authority ("FCA") and complies with the Remuneration Code of the FCA ("the Code"). As part of the Code, the Investment Manager discloses on an annual basis, its remuneration policies and procedures, and the proportion of overall remuneration (both fixed and variable) that is assigned to senior management (including executives) and members of staff of the Investment Manager whose actions have a material impact on the risk profile of the Company and other investment mandates run by the Investment Manager ("Code Staff"). In the most recent disclosure, the proportion of overall remuneration assigned to Code Staff was over 90%.
Related Documents