Gamma-ray observations of Tycho’s supernova remnant with VERITAS and Fermi S. Archambault 1 , A. Archer 2 , W. Benbow 3 , R. Bird 4 , E. Bourbeau 1 , M. Buchovecky 4 , J. H. Buckley 2 , V. Bugaev 2 , M. Cerruti 3 , M. P. Connolly 5 , W. Cui 6,7 , V. V. Dwarkadas 8 , M. Errando 2 , A. Falcone 9 , Q. Feng 1 , J. P. Finley 6 , H. Fleischhack 10 , L. Fortson 11 , A. Furniss 12 , S. Griffin 1 , M. H¨ utten 10 , D. Hanna 1 , J. Holder 13 , C. A. Johnson 14 , P. Kaaret 15 , P. Kar 16 , N. Kelley-Hoskins 10 , M. Kertzman 17 , D. Kieda 16 , M. Krause 10 , S. Kumar 13 , M. J. Lang 5 , G. Maier 10 , S. McArthur 6 , A. McCann 1 , P. Moriarty 5 , R. Mukherjee 18 , D. Nieto 19 , S. O’Brien 16 , R. A. Ong 4 , A. N. Otte 21 , N. Park 22* , M. Pohl 23,10 , A. Popkow 4 , E. Pueschel 20 , J. Quinn 20 , K. Ragan 1 , P. T. Reynolds 24 , G. T. Richards 21 , E. Roache 3 , I. Sadeh 10 , M. Santander 18 , G. H. Sembroski 6 , K. Shahinyan 11 , P. Slane 25 , D. Staszak 22 , I. Telezhinsky 23,10 , S. Trepanier 1 , J. Tyler 1 , S. P. Wakely 22 , A. Weinstein 26 , T. Weisgarber 27 , P. Wilcox 15 , A. Wilhelm 23,10 , D. A. Williams 14 , B. Zitzer 1 ABSTRACT High-energy gamma-ray emission from supernova remnants (SNRs) has provided a unique perspective for studies of Galactic cosmic-ray acceleration. Tycho’s SNR is a particularly good target because it is a young, type Ia SNR that is well-studied over a wide range of energies and located in a relatively clean environment. Since the detection of gamma-ray emission from Tycho’s SNR by VERITAS and Fermi -LAT, there have been several theoretical models proposed to explain its broadband emission and high-energy morphology. We report on an update to the gamma-ray measurements of Tycho’s SNR with 147 hours of VERITAS and 84 months of Fermi -LAT observations, which represents about a factor of two increase in exposure over previously published data. About half of the VERITAS data benefited from a camera upgrade, which has made it possible to extend the TeV measurements toward lower energies. The TeV spectral index measured by VERITAS is consistent with previous results, but the expanded energy range softens a straight power-law fit. At energies higher than 400 GeV, the power-law index is 2.92 ± 0.42 stat ± 0.20 sys . It is also softer than the spectral index in the GeV energy range, 2.14 ± 0.09 stat ± 0.02 sys , measured by this study using Fermi –LAT data. The centroid position of the gamma-ray emission is coincident with the center of the remnant, as well as with the centroid measurement of Fermi –LAT above 1 GeV. The results are consistent with an SNR shell origin of the emission, as many models assume. The updated spectrum points to a lower maximum particle energy than has been suggested previously. Subject headings: supernova remnant: general – supernova remnant: individual(Tycho’s SNR) – gamma rays: observations 1 Physics Department, McGill University, Montreal, QC H3A 2T8, Canada 2 Department of Physics, Washington University, St. Louis, MO 63130, USA 3 Fred Lawrence Whipple Observatory, Harvard- Smithsonian Center for Astrophysics, Amado, AZ 85645, USA 4 Department of Physics and Astronomy, University of California, Los Angeles, CA 90095, USA 5 School of Physics, National University of Ireland Gal- 1 arXiv:1701.06740v1 [astro-ph.HE] 24 Jan 2017

Welcome message from author
This document is posted to help you gain knowledge. Please leave a comment to let me know what you think about it! Share it to your friends and learn new things together.
Transcript

Gamma-ray observations of Tycho’s supernova remnant withVERITAS and Fermi
S. Archambault1, A. Archer2, W. Benbow3, R. Bird4, E. Bourbeau1, M. Buchovecky4,J. H. Buckley2, V. Bugaev2, M. Cerruti3, M. P. Connolly5, W. Cui6,7, V. V. Dwarkadas8,
M. Errando2, A. Falcone9, Q. Feng1, J. P. Finley6, H. Fleischhack10, L. Fortson11,A. Furniss12, S. Griffin1, M. Hutten10, D. Hanna1, J. Holder13, C. A. Johnson14, P. Kaaret15,
P. Kar16, N. Kelley-Hoskins10, M. Kertzman17, D. Kieda16, M. Krause10, S. Kumar13,M. J. Lang5, G. Maier10, S. McArthur6, A. McCann1, P. Moriarty5, R. Mukherjee18,
D. Nieto19, S. O’Brien16, R. A. Ong4, A. N. Otte21, N. Park22∗, M. Pohl23,10, A. Popkow4,E. Pueschel20, J. Quinn20, K. Ragan1, P. T. Reynolds24, G. T. Richards21, E. Roache3,
I. Sadeh10, M. Santander18, G. H. Sembroski6, K. Shahinyan11, P. Slane25, D. Staszak22,I. Telezhinsky23,10, S. Trepanier1, J. Tyler1, S. P. Wakely22, A. Weinstein26,T. Weisgarber27, P. Wilcox15, A. Wilhelm23,10, D. A. Williams14, B. Zitzer1
ABSTRACT
High-energy gamma-ray emission from supernova remnants (SNRs) has provided a uniqueperspective for studies of Galactic cosmic-ray acceleration. Tycho’s SNR is a particularly goodtarget because it is a young, type Ia SNR that is well-studied over a wide range of energiesand located in a relatively clean environment. Since the detection of gamma-ray emission fromTycho’s SNR by VERITAS and Fermi -LAT, there have been several theoretical models proposedto explain its broadband emission and high-energy morphology. We report on an update tothe gamma-ray measurements of Tycho’s SNR with 147 hours of VERITAS and 84 monthsof Fermi -LAT observations, which represents about a factor of two increase in exposure overpreviously published data. About half of the VERITAS data benefited from a camera upgrade,which has made it possible to extend the TeV measurements toward lower energies. The TeVspectral index measured by VERITAS is consistent with previous results, but the expandedenergy range softens a straight power-law fit. At energies higher than 400 GeV, the power-lawindex is 2.92±0.42stat±0.20sys. It is also softer than the spectral index in the GeV energy range,2.14±0.09stat ±0.02sys, measured by this study using Fermi–LAT data. The centroid position ofthe gamma-ray emission is coincident with the center of the remnant, as well as with the centroidmeasurement of Fermi–LAT above 1 GeV. The results are consistent with an SNR shell originof the emission, as many models assume. The updated spectrum points to a lower maximumparticle energy than has been suggested previously.
Subject headings: supernova remnant: general – supernova remnant: individual(Tycho’s SNR) – gammarays: observations
1Physics Department, McGill University, Montreal, QCH3A 2T8, Canada
2Department of Physics, Washington University, St.Louis, MO 63130, USA
3Fred Lawrence Whipple Observatory, Harvard-
Smithsonian Center for Astrophysics, Amado, AZ 85645,USA
4Department of Physics and Astronomy, University ofCalifornia, Los Angeles, CA 90095, USA
5School of Physics, National University of Ireland Gal-
1
arX
iv:1
701.
0674
0v1
[as
tro-
ph.H
E]
24
Jan
2017

1. Tycho’s SNR as a Cosmic Ray acceler-ator
Supernova remnants (SNRs) have been sug-gested to be the main accelerators of Galactic cos-mic rays (CRs) (Ginzburg & Syrovatsky 1961).Several studies have proposed that SNRs can effi-
way, University Road, Galway, Ireland6Department of Physics and Astronomy, Purdue Uni-
versity, West Lafayette, IN 47907, USA7Department of Physics and Center for Astrophysics,
Tsinghua University, Beijing 100084, China.8Department of Astronomy and Astrophysics, Univer-
sity of Chicago, Chicago, IL, 606379Department of Astronomy and Astrophysics, 525
Davey Lab, Pennsylvania State University, UniversityPark, PA 16802, USA
10DESY, Platanenallee 6, 15738 Zeuthen, Germany11School of Physics and Astronomy, University of Min-
nesota, Minneapolis, MN 55455, USA12Department of Physics, California State University -
East Bay, Hayward, CA 94542, USA13Department of Physics and Astronomy and the Bartol
Research Institute, University of Delaware, Newark, DE19716, USA
14Santa Cruz Institute for Particle Physics and Depart-ment of Physics, University of California, Santa Cruz, CA95064, USA
15Department of Physics and Astronomy, University ofIowa, Van Allen Hall, Iowa City, IA 52242, USA
16Department of Physics and Astronomy, University ofUtah, Salt Lake City, UT 84112, USA
17Department of Physics and Astronomy, DePauw Uni-versity, Greencastle, IN 46135-0037, USA
18Department of Physics and Astronomy, Barnard Col-lege, Columbia University, NY 10027, USA
19Physics Department, Columbia University, New York,NY 10027, USA
20School of Physics, University College Dublin, Belfield,Dublin 4, Ireland
21School of Physics and Center for Relativistic Astro-physics, Georgia Institute of Technology, 837 State StreetNW, Atlanta, GA 30332-0430
22Enrico Fermi Institute, University of Chicago, Chicago,IL 60637, USA
23Institute of Physics and Astronomy, University of Pots-dam, 14476 Potsdam-Golm, Germany
24Department of Physical Sciences, Cork Institute ofTechnology, Bishopstown, Cork, Ireland
25Harvard-Smithsonian Center for Astrophysics, 60 Gar-den Street, Cambridge, MA 02138, USA
26Department of Physics and Astronomy, Iowa State Uni-versity, Ames, IA 50011, USA
27Department of Physics, University of Wisconsin-Madison, Madison, WI 53706, USA
*E-mail: [email protected]
ciently convert the kinetic energy of the supernovaexplosion to generate relativistic CRs via diffu-sive shock acceleration (Bell 1978a,b; Schure et al.2012; Reynolds 2008). Indirect evidence of the ac-celeration of the leptonic component of CRs upto 100 TeV has been provided by the detectionof non-thermal X-ray emission from the rims ofseveral remnants (e.g. Koyama et al. 1995). Cor-responding evidence for hadronic acceleration hasbeen elusive, but the improved sensitivity of GeV–TeV gamma-ray telescopes over the past decadehas opened a new window to study the interac-tions of high-energy particles around SNRs.
Gamma rays can be generated as bremsstrahlungradiation when electrons and positrons interactwith ambient matter, or as a result of inverseCompton scattering of low energy photons aroundSNRs. Hadronic particle interactions can also cre-ate gamma rays via the pion-decay process. Bycombining our knowledge of the SNR environmentwith gamma-ray observations, we can study theacceleration and propagation of particles in andaround the remnant. The recent detection of apion-decay signature from two middle-aged SNRs,IC 443 and W44, by Fermi -LAT has demonstratedthe existence of hadronic particle acceleration inSNRs (Ackermann et al. 2013). However, sev-eral questions remain to be answered, such as themaximum energies to which particles can be accel-erated in SNRs, the efficiency of the accelerationin the remnants, and the nature of the accelerationprocess. Resolving these questions is necessary todetermine whether SNRs are indeed the main ac-celerators of Galactic cosmic rays up to the “knee”region (∼ 3 PeV).
Gamma-ray observations of young SNRs (withages less than a few thousand years) can providevaluable data to address these questions. YoungSNRs are usually well studied over a wide energyrange. Non-thermal X-ray emission is detectedfrom many of these objects, providing data toinvestigate the acceleration processes of the elec-trons, and to gauge the strength of the magneticfields (Reynolds et al. 2012). The ages of theseremnants are also better constrained than those ofolder remnants. In particular, the ages of “histori-cal” SNRs are well known. These are all importantingredients that allow the development of detailedemission models. Furthermore, young SNRs canaccelerate particles to higher energies than older
2
remnants can (Berezhko & Volk 1997; Dwarkadaset al. 2012; Bell 2014). Thus they serve as betterprobes of the maximum energy to which particlescan be accelerated in SNRs.
SNR G120.1+1.4, also known as “Tycho’s su-pernova remnant” (hereafter referred to as Ty-cho), is one of the best-studied young SNRs.It is the remnant of a historical supernova thatwas observed in 1572. The historical light curverecords (Baade 1945) and ejecta composition mea-surements in the X-ray band (Decourchelle et al.2001) suggested a Type Ia origin, which was con-firmed by spectroscopic analysis of the light echofrom the explosion (Krause et al. 2008). The radioand X-ray expansion rate measurements suggestthat the global evolutionary state of Tycho is pre-Sedov, while local regions with higher density areevolutionarily more advanced (Aharonian et al.2001).
X-ray images for energies higher than 4 keVmeasured by Chandra show thin filamentarystructures in the rim of Tycho (Hwang et al.2002), which have been interpreted as non-thermalX-ray emission generated by high-energy elec-trons (Bamba et al. 2005). Parizot et al. (2006)estimated the magnetic field strength at the rimof the SNR to be about 200 µG, assuming thatthe widths of the filament structures are due toradiative energy loss of high-energy electrons. Forsuch a strong magnetic field, the radiative losseslimit the maximum electron energy. As a result,the maximum energies of electrons and protonscan be different. Parizot et al. (2006) also esti-mated the maximum electron energy (hereafterdefined as the cut-off energy for primary particlesfollowing a power-law distribution with an expo-nential cut-off) to be 5–7 TeV by using the X-raycut-off energy obtained by comparison of X-rayfluxes and radio fluxes. Based on their estimationof the magnetic field strength, diffusion coefficient,and X-ray spectral cut-off energy, the maximumenergy of accelerated protons in the remnant wasestimated to be in the range of 100 TeV–2 PeV. Analternative explanation for such thin filaments wasgiven by Pohl et al. (2005), who suggested thatthey may be the result of magnetic field damping,in which case the magnetic field may not be ashigh and the acceleration of particles would beless efficient. Cassam-Chenaı et al. (2007) stud-ied the intensity profile of radio and X-ray bands
at the rim with a hydrodynamic model to testthese two scenarios, suggesting a combination ofcooling and rapid damping to explain the filamentstructures.
Deep observations with Chandra have revealedregular patterns, or “stripes”, of non-thermalemission. Eriksen et al. (2011) interpreted thegaps between these stripes as arising from the gy-ration of high-energy protons in a magnetic field,providing evidence of proton acceleration up to100 TeV–1 PeV. In contrast, Bykov et al. (2011)explained these stripes as the result of magneticfield turbulence. Although their explanation isdifferent, they estimated the maximum proton en-ergy responsible for the stripes to be also on theorder of 1 PeV.
Recent NuSTAR observations have been usedto study the correlation of shock velocity and ex-pansion parameters with measurements of the X-ray spectral rolloff energy (Lopez et al. 2015).The rolloff energy Erolloff is a characteristic syn-chrotron cut-off energy proportional to BE2
max,where B is the magnetic field strength and Emaxis an assumed exponential cut-off energy in theelectron spectrum (Reynolds & Keohane 1999).The authors suggested that the scenario of themaximum electron energy being limited by theage of SNR, instead of by radiative energy lossof electrons, best fits the data. They estimatedthe maximum energy of electrons (and protons, inthis case) to be 5–12 TeV. This led to an estima-tion of the magnetic field strength of around 30µG, which is lower than suggested by a radio andX-ray morphology study which included both en-ergy loss and magnetic damping scenarios (Tranet al. 2015). Also, it is lower than the minimummagnetic field strength of 80 µG required to ex-plain the multi-wavelength emission from radio toTeV gamma-ray energies, as suggested by Acciariet al. (2011). Lopez et al. (2015) noted that, alter-natively, a higher magnetic field and a loss-limitedmaximum electron energy can be accommodatedif the correlation of X-ray rolloff energy with theshock velocity arose from the obliquity effect—theacceleration rate dependency on the angle betweenthe shock front and the local magnetic field.
Detections of gamma-ray emission at TeV (Ac-ciari et al. 2011) and GeV (Giordano et al. 2012)energies provide additional data to study the ac-celeration of high-energy particles in Tycho. The
3

gamma-ray measurements also provide another di-agnostic by which to estimate the maximum en-ergy of hadrons in the remnant.
Several models were developed to explain thegamma-ray emission from Tycho (Slane et al.2014; Berezhko et al. 2013; Zhang et al. 2013; Mor-lino & Caprioli 2012; Atoyan & Dermer 2012), in-cluding two detailed studies (Morlino & Caprioli2012; Slane et al. 2014) that modeled the full spec-tral energy distribution of Tycho from radio togamma-ray energies, along with the morphology ofthe radio and X-ray emission. Most of these mod-els, with one exception (Atoyan & Dermer 2012),conclude that the gamma-ray emission from Ty-cho is predominantly produced by hadronic inter-actions, although the details of the models varyconsiderably. Morlino & Caprioli (2012) estimatedthe maximum proton energy to be 470 TeV basedon a semi-analytical calculation, while Slane et al.(2014) estimated it to be 50 TeV from a full hy-drodynamic simulation.
The shape of Tycho in the radio band and in X-rays is roughly spherical. Detailed regional expan-sion rate differences measured in radio (Reynosoet al. 1997) and X-ray (Katsuda et al. 2010) sug-gest that the northern, northeastern, and easternparts of the shell of the remnant may be expand-ing into denser regions compared to the southernparts of the remnant. A recent study by Williamset al. (2013) reported on the existence of an az-imuthal density variation around the rim of Tychousing Spitzer data, showing that the northeasternregion has 3–10 times higher density compared tothe southwestern region of the remnant.
A large molecular cloud was observed near Ty-cho in the north/northeastern region. Interactionsbetween the northeastern region of the remnantand the molecular cloud were suggested based onradio HI and CO measurements (Reynoso et al.1999; Lee et al. 2004). However, these were notconfirmed in later measurements (Tian & Leahy2011).
The TeV gamma-ray image of Tycho presentedin 2011 by VERITAS shows the morphology of theemission to be compatible with a point source.The peak of the TeV emission shows indicationsof being offset from the center of the remnanttowards the northeastern part of the remnant,where the density of the surrounding medium ishigher and the molecular cloud is observed along
Fig. 1.— Smoothed Fermi TS map with theP8R2 CLEAN V6 IRF for energies higher than 1GeV. The map was smoothed with a Gaussian ker-nel with a radius of 0.06◦. The magenta contoursindicate the Chandra X-ray intensity at energiesabove 4.1 keV1. The cyan line is the previouslypublished 95% confidence area for the Fermi -LATposition (Giordano et al. 2012). The centroid anderror of 3FGL J0025.7+6404 are marked with across and dashed green line (Acero et al. 2015).The best-fit position and 68% confidence level ofthis study are shown with a red cross mark and ared circle.
the line of sight. Although the measured offset,0.04◦± 0.023◦stat ± 0.014◦sys, is not statistically dif-ferent from zero, this introduced the question ofwhether the gamma-ray emission is dominated bypion decay resulting from hadronic interactionswithin the entire swept-up SNR shell, from thehigh density regions of the shell, or by interactionswith the molecular cloud.
VERITAS has conducted deeper observationsof Tycho to improve both the flux and centroidmeasurements reported previously. In this paper,we update our originally published high-energygamma-ray results with a factor of two increase inVERITAS exposure, coupled with a Fermi -LATanalysis with improved sensitivity and a deeperexposure than previously shown. We compare ex-isting theoretical models with the updated mea-surements, study the maximum energy of particlesthat can be accelerated in Tycho, and discuss theorigin of the gamma-ray emission.
4

2. Fermi observation of Tycho’s SNR
2.1. Analysis
The Fermi Gamma-ray Space Telescope waslaunched in 2008 June. The principal Fermiscience instrument, the Large Area Telescope(Fermi -LAT), has provided all-sky coverage inthe 20 MeV to >300 GeV energy range over eightyears. In June 2015, the Fermi collaboration re-leased “Pass 8” LAT data for analysis (Atwoodet al. 2013). Pass 8 provides a larger effectivearea, especially for the lowest and highest en-ergies, with an improved point spread function(PSF) compared to previous data releases (At-wood et al. 2013). In this paper, we update ourprevious study (Park et al. 2015a) to a Pass 8analysis.
We analyzed a dataset of 84 months, from 2008August to 2015 August, selecting events with en-ergies from 300 MeV to 500 GeV that fall within aradius of 25◦ centered on the position of the rem-nant. The publicly available Fermi Science Tools1
were used for the analysis.
The recommended quality cuts for standardanalysis were implemented. All sources from the3FGL catalog (Acero et al. 2015) that fall withina 40◦ radius around Tycho were included in theanalysis for modeling. A binned-likelihood anal-ysis with a bin size of 0.1◦ was performed firstfor the 3FGL source position associated with Ty-cho (3FGL J0025.7+6404). The results were latercompared by repeating the analysis with the best-fit position of the emission from the Tycho regionfrom this analysis of the Fermi -LAT data. Theanalysis method maximizes the likelihood of allsources within the region of interest for the givensource model. Fluxes of the diffuse backgroundemission as well as all sources except five weaksources located within a radius of 10◦ around Ty-cho were allowed to vary for the likelihood analy-sis. Fluxes were also allowed to vary for sourceslocated within a radius of 15◦ around Tycho andthat have a statistical significance higher than 15σin the 3FGL catalog. The source spectral indexwas allowed to vary for sources located within aradius of 3◦ around Tycho. These parameters wereset to ensure the convergence of the likelihood fit.
1http://fermi.gsfc.nasa.gov/ssc
Fig. 2.— The updated Fermi spectrum overlaidwith the previous results. The solid red line showsthe 1σ statistical error band from the full fit.
2.2. Results
The statistical significance of the emission iscalculated from the Test Statistic (TS) of the like-lihood ratio test, defined as twice the difference ofthe log likelihood between the given source modeland the null hypothesis. The overall fit from 300MeV to 500 GeV yields a TS of 107 for 3FGLJ0025.7+6404, assuming a power-law distributionof photon energies. The best source position wasestimated with gtfindsrc for energies higher than1 GeV by using the P8R2 CLEAN V6 instrumentresponse function (IRF). This IRF was chosen be-cause its smaller PSF can provide a sharper imagethan the standard IRF, P8R2 SOURCE V6. Theresult showed the best-fit position of Right Ascen-sion (RA) 0h25m24s.39 and declination 64◦8′25′′
with a 68% statistical error of 0.02◦. The TS valueof the likelihood analysis at the best-fit positionwas 130.
Figure 1 shows a TS map generated usingthe Fermi tool gttsmap for the region aroundTycho. The TS maps for two different IRFs,P8R2 CLEAN V6 and P8R2 SOURCE V6, werechecked for energies higher than 1 GeV, and bothagree within the statistical errors. The 68% con-fidence region from this study agrees with the re-sults of the previous paper, as well as with the po-sition of the 3FGL source associated with Tycho.The centroid position coincides with the centroidof the X-ray emission within the statistical error.
While we used the P8R2 CLEAN V6 IRF for
5

the source position study, we report spectral re-sults from the best-fit position analyzed with theP8R2 SOURCE V6 IRF to increase the number ofevents. For the spectral studies, systematic uncer-tainties were estimated as the root-mean-square(RMS) of results from six different analyses thatused different IRFs, two different regions of inter-est, and the maximum and minimum of the sys-tematic error on the effective area1. The measuredintegral flux for energies higher than 300 MeV is(3.60±0.62stat±0.12sys)×10−9 cm−2 s−1, assum-ing a power-law distribution of photon energies.The estimated spectral index is 2.14 ± 0.09stat ±0.02sys. The results agree within 1σ with the dis-covery paper (Giordano et al. 2012) and with pre-vious results with Pass 7 reprocessed data (Parket al. 2015b).
The entire energy range was divided into evenlyspaced energy bins (in logarithmic scale) to com-pute the spectral energy distribution (SED). Anindividual likelihood analysis was performed foreach bin using the fitted spectral parameters fromthe analysis of the entire energy range. All pa-rameters except the flux of Tycho were fixed.The flux was calculated for bins with TS valueshigher than 4. Figure 2 shows the SED withthe P8R2 SOURCE V6 IRF. Only statistical er-rors are shown in the figure since these domi-nate over the systematic uncertainties consideredin this study.
3. VERITAS observation of Tycho’s SNR
VERITAS is an array of four atmosphericCherenkov telescopes located at the Fred LawrenceWhipple Observatory in southern Arizona (Weekeset al. 2002). The telescope is designed to study as-trophysical sources of gamma-ray emission in the85 GeV–30 TeV range by detecting the Cherenkovlight generated by air showers, cascades resultingfrom the interactions of the gamma rays in theatmosphere. Each of the four telescopes coversa field of view of 3.5◦ with a 499-pixel photo-multiplier tube (PMT) camera at the focal plane,collecting light from a 12 meter diameter reflec-tor consisting of segmented mirrors. A coincidentCherenkov signal that triggers at least two out offour telescopes is required to trigger an array-wide
1http://fermi.gsfc.nasa.gov/ssc/data/analysis/
scitools/Aeff_Systematics.html
read-out of the PMT signals (Holder et al. 2006).In its current configuration, the array has the sen-sitivity to detect a point source with a flux of 1%of the Crab Nebula flux within 25 hours, and hasan angular resolution better than 0.1◦ at 1 TeV.
The current performance of VERITAS is aresult of two major hardware upgrades thatchanged the properties of the telescope array sig-nificantly: the relocation of one of the telescopesin 2009 (Perkins et al. 2009) and a camera up-grade in 2012 (Kieda et al. 2013). The telescoperelocation improved the overall angular resolutionand the selection efficiency for gamma rays bymaking the array more symmetric. This enhancedthe ability to measure morphological informationof the gamma-ray showers. The VERITAS cam-eras were equipped with high quantum efficiencyPMTs during the 2012 upgrade. This made the ar-ray more sensitive to weaker signals, thus loweringthe energy threshold of the array and improvingthe background rejection power in the low energyrange (Park et al. 2015a).
3.1. Observation
VERITAS has observed Tycho since 2008, col-lecting a total of 147 hours of data over five observ-ing seasons, spanning both major upgrades of thearray. The discovery of gamma-ray emission fromTycho was reported by VERITAS based on 67hours of observation during 2008-2010. VERITAShas accumulated a total of 80 more hours sincethe detection paper, 74 hours of which were col-lected following the 2012 upgrade, with enhancedsensitivity at energies lower than a few TeV.
Data were collected as close as possible to Ty-cho’s culmination, resulting in an average eleva-tion of 55◦ over all observations. Observationswere performed in “wobble” mode, in which thetelescope is pointed 0.5◦ away from the target inthe four cardinal directions (Fomin et al. 1994).
3.2. Analysis
A standard Hillas moment analysis has beenused for this study (Hillas 1985). A detailed de-scription of the VERITAS data analysis procedurecan be found in Daniel et al. (2007), and a descrip-tion of the analysis tools can be found in Coganet al. (2007). Cuts for the analysis were selecteda priori to provide good sensitivity for a point
6

source with 0.9% of the gamma-ray flux of theCrab Nebula. Cuts were optimized, using CrabNebula data, separately for the 2009–2011 datasetand for the 2012–2015 dataset to account for in-strumental changes due to the hardware upgrade.The optimized cuts for 2009–2011 were also usedfor the 2008–2009 data after verifying their sensi-tivity on Crab Nebula data from this earlier pe-riod. Cuts were optimized to achieve a good com-promise between broadband differential sensitivityand a low threshold energy. As a result, cuts forthe 2009–2011 dataset have an energy thresholdvalue at an elevation angle corresponding to theobservations of Tycho of 800 GeV, similar to theanalysis presented in the discovery paper, whilecuts for the 2012–2015 set have a lower energythreshold value of 400 GeV with similar sensitiv-ity. A cut on the angular distance from the testposition to the reconstructed arrival direction ofthe shower was set to be 0.1◦ for both sets ofcuts. Results were verified with an independentsecondary analysis (Maier 2016).
3.3. Results
The analysis of the combined set of VERITASdata detected gamma-ray emission from Tychowith a significance of 6.9σ. Figure 3 shows thegamma-ray count map with the previously pub-lished centroid position and the updated centroidposition. The map was smoothed with a Gaussiankernel with a radius of 0.06◦.
The centroid position is estimated by maximiz-ing the likelihood value of the data for a givenbackground model and a source model. The back-ground model was constructed from the data byestimating the spatial distribution of events out-side of the source region, which was defined as acircle with a radius of 0.3◦ around the center of Ty-cho. For the source model, it is assumed that thegamma-ray distribution is produced by an unre-solved point source. In this case, the source modelcan be described as an instrumental PSF. The PSFis described by a two-dimensional King function,
K(r) = N0(1 + (r/r0)2)−β
where N0 is a normalization factor, r is an angulardistance from the centroid, r0 is a radius, and β isan index.
Two parameters, the radius and index, which
Fig. 3.— Smoothed VERITAS gamma-ray countmap of the region around Tycho’s SNR. The 1σstatistical error on the centroid position obtainedby Acciari et al. (2011) is drawn with a bluedashed circle. The updated centroid position ismarked with a red cross and 68 and 95% confi-dence levels of the position are shown with redcontours. Each contour was determined from a fitwith two degrees of freedom. Chandra’s measure-ment of the X-ray emission with energies largerthan 4.1 keV is shown by the magenta contours.Black contours are the 12CO (J=1-0) emissionintegrated over the velocity range -68 km s−1
to -50 km s−1 using the measurements from theFive College Radio Astronomy Observatory Sur-vey (Heyer et al. 1998). NuSTAR’s measurementsof X-rays in the energy range between 20 keV and40 keV (Lopez et al. 2015) after smoothing areshown by the cyan contours. The best-fit positionand 68% confidence level of the updated Fermianalysis are shown as a green x mark and circle.
define the shape of the PSF, are fixed to the best-fit values from a fit to simulated data. The sim-ulated data were weighted to match the observa-tional elevation and azimuth and measured spec-tral index of Tycho. This method assumes thatmeasured event counts follow a Poisson distribu-tion instead of a normal distribution, providingmore accurate estimations of centroid positionscompared to the method used for the previous pa-per (Acciari et al. 2011).
The centroid position reported was estimatedonly with the 2012–2015 dataset because it has
7
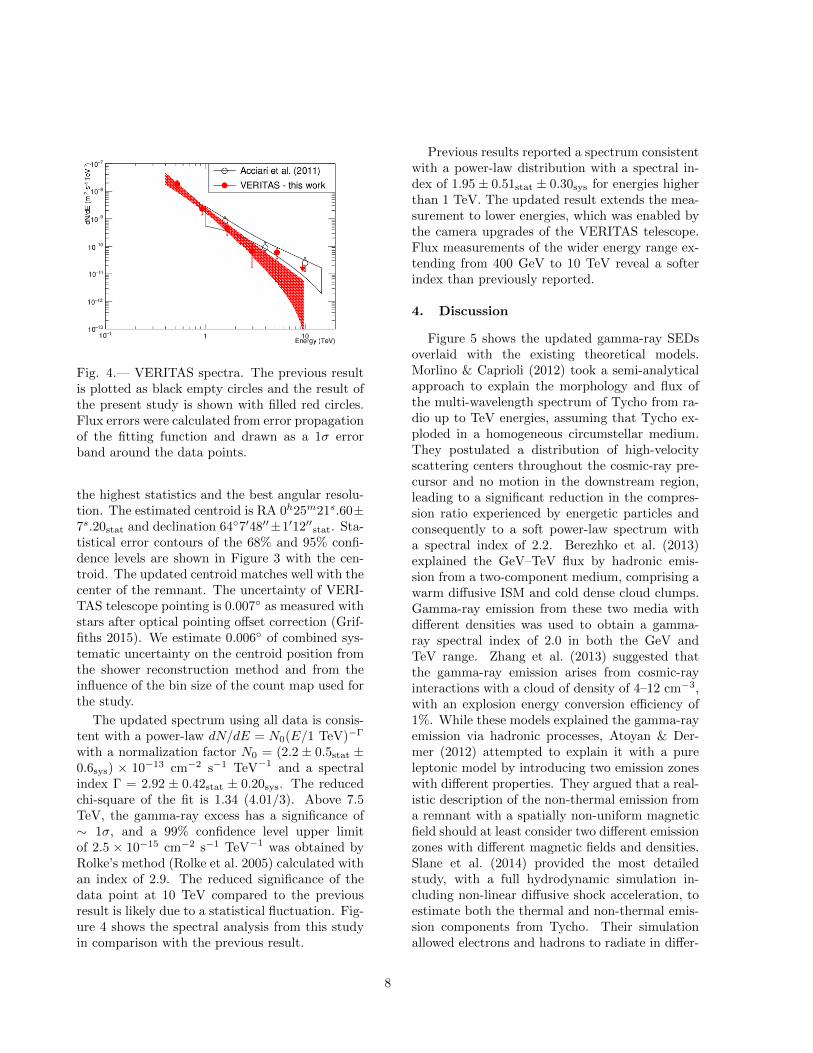
Fig. 4.— VERITAS spectra. The previous resultis plotted as black empty circles and the result ofthe present study is shown with filled red circles.Flux errors were calculated from error propagationof the fitting function and drawn as a 1σ errorband around the data points.
the highest statistics and the best angular resolu-tion. The estimated centroid is RA 0h25m21s.60±7s.20stat and declination 64◦7′48′′±1′12′′stat. Sta-tistical error contours of the 68% and 95% confi-dence levels are shown in Figure 3 with the cen-troid. The updated centroid matches well with thecenter of the remnant. The uncertainty of VERI-TAS telescope pointing is 0.007◦ as measured withstars after optical pointing offset correction (Grif-fiths 2015). We estimate 0.006◦ of combined sys-tematic uncertainty on the centroid position fromthe shower reconstruction method and from theinfluence of the bin size of the count map used forthe study.
The updated spectrum using all data is consis-tent with a power-law dN/dE = N0(E/1 TeV)−Γ
with a normalization factor N0 = (2.2 ± 0.5stat ±0.6sys) × 10−13 cm−2 s−1 TeV−1 and a spectralindex Γ = 2.92 ± 0.42stat ± 0.20sys. The reducedchi-square of the fit is 1.34 (4.01/3). Above 7.5TeV, the gamma-ray excess has a significance of∼ 1σ, and a 99% confidence level upper limitof 2.5 × 10⁻¹⁵ cm−2 s−1 TeV−1 was obtained byRolke’s method (Rolke et al. 2005) calculated withan index of 2.9. The reduced significance of thedata point at 10 TeV compared to the previousresult is likely due to a statistical fluctuation. Fig-ure 4 shows the spectral analysis from this studyin comparison with the previous result.
Previous results reported a spectrum consistentwith a power-law distribution with a spectral in-dex of 1.95 ± 0.51stat ± 0.30sys for energies higherthan 1 TeV. The updated result extends the mea-surement to lower energies, which was enabled bythe camera upgrades of the VERITAS telescope.Flux measurements of the wider energy range ex-tending from 400 GeV to 10 TeV reveal a softerindex than previously reported.
4. Discussion
Figure 5 shows the updated gamma-ray SEDsoverlaid with the existing theoretical models.Morlino & Caprioli (2012) took a semi-analyticalapproach to explain the morphology and flux ofthe multi-wavelength spectrum of Tycho from ra-dio up to TeV energies, assuming that Tycho ex-ploded in a homogeneous circumstellar medium.They postulated a distribution of high-velocityscattering centers throughout the cosmic-ray pre-cursor and no motion in the downstream region,leading to a significant reduction in the compres-sion ratio experienced by energetic particles andconsequently to a soft power-law spectrum witha spectral index of 2.2. Berezhko et al. (2013)explained the GeV–TeV flux by hadronic emis-sion from a two-component medium, comprising awarm diffusive ISM and cold dense cloud clumps.Gamma-ray emission from these two media withdifferent densities was used to obtain a gamma-ray spectral index of 2.0 in both the GeV andTeV range. Zhang et al. (2013) suggested thatthe gamma-ray emission arises from cosmic-rayinteractions with a cloud of density of 4–12 cm−3,with an explosion energy conversion efficiency of1%. While these models explained the gamma-rayemission via hadronic processes, Atoyan & Der-mer (2012) attempted to explain it with a pureleptonic model by introducing two emission zoneswith different properties. They argued that a real-istic description of the non-thermal emission froma remnant with a spatially non-uniform magneticfield should at least consider two different emissionzones with different magnetic fields and densities.Slane et al. (2014) provided the most detailedstudy, with a full hydrodynamic simulation in-cluding non-linear diffusive shock acceleration, toestimate both the thermal and non-thermal emis-sion components from Tycho. Their simulationallowed electrons and hadrons to radiate in differ-
8

Fig. 5.— Fermi and VERITAS SEDs with theo-retical models. Filled red squares show the Fermiresults and filled red circles show the VERITAS re-sults from this study. The models discussed in thetext appear as the solid red line (prefered model Afrom Slane et al. (2014)), the magenta short bro-ken dashed line (Berezhko et al. 2013), the bluelarge broken dashed line (Zhang et al. 2013), thegreen dashed line (Morlino & Caprioli 2012), thecyan dotted line (the leptonic model from Atoyan& Dermer (2012)), and the brown double-brokendashed line (Morlino & Blasi (2016) with a neutralfraction of 0.6).
ent environments and to be shocked at differenttimes. Their best-fit model suggested that theGeV–TeV gamma-ray emission is dominated by ahadronic component.
All of the models described above were devel-oped to explain the previously published GeV–TeV gamma-ray emission. The updated fluxes ofTeV gamma-ray emission found in this paper forenergies higher than 400 GeV are inconsistent withall these models. The models may need to be re-calculated to fit the updated gamma-ray spectra.
The spectral index of 2.9 measured in the en-ergy range of VERITAS (E>400 GeV) is some-what softer than that measured in Fermi ’s en-ergy range (E<500 GeV). This may indicate acut-off of the gamma-ray spectrum around a fewTeV or lower. To test a possible spectral in-dex change in the GeV–TeV gamma-ray range,we performed a goodness of fit test of the com-bined dataset of Fermi and VERITAS with a sin-gle power-law dN/dE = N0(E/1 TeV)−Γ and a
Fig. 6.— Fermi and VERITAS SEDs overlaidwith combined fit results. Flux errors calculatedfrom the error propagation of the fitting functionare drawn as a 1σ statistical error band in redlines.The Fermi-VERITAS combined fit resultswith a single power-law fit and a single power-lawwith a cut-off are shown with a black solid lineand a gray short dashed line.
power-law with an exponential cut-off dN/dE =N0(E/1 TeV)−Γe−E/Ecut . Figure 6 and Table 1show the results. Both spectral forms are consis-tent within 2σ, although we note that the statis-tical uncertainties are large.
Recently, Morlino & Blasi (2016) tried to ex-plain the updated VERITAS spectrum by assum-ing that the gamma-ray emission is dominatedby the dense northeastern region of the remnant.They took into account the presence of neutral hy-drogen close to the shock, giving rise to Balmer-dominated shocks. They suggested that steepspectra such as those seen in Tycho occur dueto the presence of charge-exchange reactions re-sulting from neutral hydrogen entering the shockfront, and that a high neutral hydrogen fraction(> 70%) could give spectra as steep as those seenin Tycho. This would primarily occur in dense re-gions where the neutral hydrogen fraction is high-est and velocities lower. This model can providelow maximum energies, but these spectra wouldonly arise in the denser regions, and not the rem-nant as a whole.
Previous measurements from VERITAS re-ported a possible slight displacement of the emis-sion toward the northeastern region of the rem-
9

Table 1: Fit results of the Fermi -VERITAS com-bined dataset.
Single Single power-power-law law + cut-off
N0 (10−13 cm−2 s−1 TeV−1) 1.72 ± 0.29stat 4.16 ± 2.11stat
Γ 2.28 ± 0.03stat 2.14 ± 0.08stat
Ecut (TeV) N/A 1.70 ± 1.23stat
χ2 / n.d.f. 11.9 / 9 8.87 / 8
nant where a higher density of the surroundingmedium was measured and a molecular cloud wasobserved along the line of sight. The updatedcentroid measurement is consistent with the pre-vious result within 2σ, but it is coincident withthe center of the shell rather than offset towardthe northeastern region. We also compared im-ages of VERITAS data divided into two energybins (one with energies lower than 800 GeV andthe other with energies higher than 800 GeV),and found no significant centroid shift. Updatedspatial distributions of gamma rays by Fermi andVERITAS look similar and their centroids matchwithin the 68% confidence level. Consequently,there is no statistical evidence that the GeV andTeV emission regions are different.
We tested several spatial templates againstthe spatial distribution of the gamma rays ob-served by VERITAS. Table 2 shows the results ofthe likelihood ratio test. For each template, wesmeared the source template with events drawnfrom gamma-ray simulations folded with the in-strumental response of VERITAS. These simu-lated events were matched to the observationalconditions for Tycho, namely the spectral index,elevation, and azimuthal angles. A combinedsource and background model was then comparedto a pure background model. As with the cen-troid study, only the data from the 2012–2015seasons were used for this study because this dataset has the highest statistics and the best angularresolution.
The geometric center of the X-ray emission ob-served by Chandra, RA 0h25m19s.9 and declina-tion 64◦8′18.2′′(Ruiz-Lapuente et al. 2004), wasused as the center of the remnant to define themodel template. This location was also used asthe location of the source to build a point sourcetemplate. Although we do not expect to have acentral compact object in Tycho, we added thepoint source template to test whether the current
Table 2: Result of likelihood ratio tests of VER-ITAS spatial distribution with different spatialtemplates.
Model -∆ lnL Significance (σ)
Point source 15.5 5.6Uniform shell emission 13.5 5.2
NE quarter dominated emission 12.3 5.0SW quarter dominated emission 6.67 3.7
Uniform molecular cloud emission 0.804 1.3
gamma-ray measurement can distinguish betweenpoint-like and extended source models for Tycho.To test for uniform shell emission, we used a sim-ple ring shape template with uniform density withan inner radius of 0.063◦ and an outer radius of0.07◦. We tested two additional templates: one inwhich only the northeastern (NE) quarter of thering was included and another that used only thesouthwestern (SW) quarter of the ring. The caseof NE quarter dominated emission was motivatedto test for TeV emission originating only from thedensest region of the shell. The SW quarter dom-inated emission’s case was to test if the TeV emis-sion would coincide with the brightest portion ofthe SNR at energies above 20 keV, as measured byNuSTAR. For the uniform molecular cloud emis-sion’s case, we assumed the entire molecular cloudcontour shown in Figure 3 to be the source of thegamma rays.
The result from the point-source templateshows the highest significance, followed by theuniform shell emission model. Meanwhile, thecase for the uniform molecular cloud emission isthe least favorable. To compare the models, weadopt a Bayesian approach, computing the pos-terior odds ratios under the assumption that theprior probability ratio between any two models isunity. We require a posterior odds ratio greaterthan 150 to provide “decisive” evidence in favorof one model over another (Kass & Raftery 1995).We find no strong evidence to prefer the pointsource or the NE quarter dominated emission incomparison to the uniform shell emission. Thiscan be caused by different or more complicatedunderlying gamma-ray distributions than the sim-ple models considered here. It is difficult to drawstrong conclusions, due to the limited statistics ofthe data sample. When we compare the uniformshell emission model to the SW quarter domi-nated emission and the uniform molecular cloud
10

emission, the posterior odds ratios are 960 and3.4 × 105; thus we can rule out both models.
5. Conclusions
We updated the high-energy gamma-ray studiesof Tycho with a factor of two increased exposurefor both VERITAS and Fermi -LAT data. Theimproved low energy sensitivity of VERITAS al-lowed us to extend the TeV measurements towardlower energies. While the results are compatiblewith earlier measurements, we calculate a some-what softer index compared to the previous mea-surement, which was calculated only for energieshigher than 1 TeV. Both a single power-law anda single power-law with a cut-off describe the up-dated GeV–TeV fluxes consistently. The updatedVERITAS result indicates a likely lower maximumparticle energy than anticipated from theoreticalstudies developed to explain the previous data.These models may need to be revisited. The up-dated TeV centroid matches well with both thecenter of the remnant and the updated GeV cen-troid. The spatial distribution of the VERITASsource can be explained as either a point sourceor a uniform shell emission, while SW quarterdominated emission and uniform molecular cloudemission are disfavored.
This research is supported by grants from theU.S. Department of Energy Office of Science, theU.S. National Science Foundation and the Smith-sonian Institution, and by NSERC in Canada. Weacknowledge the excellent work of the technicalsupport staff at the Fred Lawrence Whipple Ob-servatory and at the collaborating institutions inthe construction and operation of the instrument.The VERITAS Collaboration is grateful to TrevorWeekes for his seminal contributions and leader-ship in the field of VHE gamma-ray astrophysics,which made this study possible.
Facility: VERITAS.
REFERENCES
Acciari, V. A., et al. 2011, ApJ, 730, L20
Acero, F., et al. 2015, ApJS, 218, 23
Ackermann, M., et al. 2013, Science, 339, 807
Aharonian, F. A., et al. 2001, A&A, 373, 292
Atoyan, A., & Dermer, C. D. 2012, A&A, 749, L26
Atwood, W., et al. 2013, arXiv.org,arXiv:1303.3514
Baade, W. 1945, ApJ, 102, 309
Bamba, A., et al. 2005, ApJ, 621, 793
Bell, A. R. 1978a, MNRAS, 182, 147
—. 1978b, MNRAS, 182, 443
—. 2014, Braz. J. Phys., 44, 415
Berezhko, E. G., et al. 2013, ApJ, 763, 14
Berezhko, E. G., & Volk, H. J. 1997, Aph, 7, 183
Bykov, A. M., et al. 2011, A&A, 735, L40
Cassam-Chenaı, G., et al. 2007, ApJ, 665, 315
Cogan, P., et al. 2007, ICRC Proc.,arXiv:0709.4233
Daniel, M. K., et al. 2007, ICRC Proc.,arXiv:0709.4006
Decourchelle, A., et al. 2001, A&A, 365, L218
Dwarkadas, V. V., et al. 2012, arXiv.org,arXiv:1206.5018
Eriksen, K. A., et al. 2011, ApJ, 728, L28
Fomin, V. P., et al. 1994, Aph, 2, 137
Ginzburg, V. L., & Syrovatsky, S. I. 1961, Prog.Theor. Phy. Supp., 20, 1
Giordano, F., et al. 2012, ApJ, 744, L2
Griffiths, S. T. 2015, PhD thesis, The Universityof Iowa
Heyer, M. H., et al. 1998, ApJS, 115, 241
Hillas, A. M. 1985, ICRC Proc.
Holder, J., et al. 2006, Aph, 25, 391
Hwang, U., et al. 2002, ApJ, 581, 1101
Kass, R. E., & Raftery, A. E. 1995, J. Amer.Statist. Assoc., 90, 773
Katsuda, S., et al. 2010, ApJ, 709, 1387
11

Kieda, D. B., et al. 2013, arXiv.org,arXiv:1308.4849
Koyama, K., et al. 1995, Nature, 378, 255
Krause, O., et al. 2008, Nature, 456, 617
Lee, J.-J., et al. 2004, ApJ, 605, L113
Lopez, L. A., et al. 2015, ApJ, 814, 132
Maier, G. 2016, https://znwiki3.ifh.de/CTA/
Eventdisplay%20Software
Morlino, G., & Blasi, P. 2016, A&A, 589, A7
Morlino, G., & Caprioli, D. 2012, A&A, 538, A81
Ohira, Y. 2016, ApJ, 817, 137
Parizot, E., et al. 2006, A&A, 453, 387
Park, N., et al. 2015a, arXiv.org, arXiv:1508.07070
—. 2015b, arXiv.org, arXiv:1508.07068
Perkins, J. S., et al. 2009, arXiv.org,arXiv:0912.3841
Pohl, M., et al. 2005, ApJ, 626, L101
Reynolds, S. P. 2008, ARA&A, 46, 89
Reynolds, S. P., et al. 2012, Space Sci. Rev., 166,231
Reynolds, S. P., & Keohane, J. W. 1999, ApJ, 525,368
Reynoso, E. M., et al. 1997, ApJ, 491, 816
—. 1999, AJ, 117, 1827
Rolke, W. A., et al. 2005, NIM A, 551, 493
Ruiz-Lapuente, P., et al. 2004, Nature, 431, 1069
Schure, K. M., et al. 2012, Space Sci. Rev., 173,491
Slane, P., et al. 2014, ApJ, 783, 33
Tian, W. W., & Leahy, D. A. 2011, A&A, 729,L15
Tran, A., et al. 2015, ApJ, 812, 101
Weekes, T. C., et al. 2002, Aph, 17, 221
Williams, B. J., et al. 2013, ApJ, 770, 129
Zhang, X., et al. 2013, MNRAS, 429, L25
This 2-column preprint was prepared with the AAS LATEXmacros v5.2.
12
Related Documents