281 TS 8 – Metrology, testing and calibration INGEO 2014 – 6 th International Conference on Engineering Surveying Prague, Czech republic, April 3-4, 2014 Verification of Selected Precision Parameters of the Trimble S8 DR Plus Robotic Total Station Sokol, Š., Bajtala, M. and Ježko, J. Slovak University of Technology, Faculty of Civil Engineering, Radlinského 11, 81368 Bratislava, Slovakia, Web site: www.svf.stuba.sk E-mail: [email protected], [email protected], [email protected] Abstract Prerequisite for liable execution of surveying works and acquisition of reliable results is usage of an instrument which meets the accuracy required for the selected type of work. For this purpose it is possible to carry out testing of the instrument using standards from ISO 17123 standard set or other test methods and procedures. In the presented paper results from testing the precision of the Trimble S8 DR Plus Robotic total station by means of selected standards from the ISO 17123 set are published. Key words: ISO 17123, testing, stability of parameters, universal measuring station 1 INTRODUCTION Market with the surveying technology currently offers a large number of devices from different manufacturers. This offer is several times higher than demands of surveyors for the new devices. Increasing number of manufactures and models logically leads to the loss of overview of available technology for professional surveyors. Assumption for reliable execution of the surveying activities is usage of an instrument which meets required accuracy for executing works (Gašinec, 2005) and (Gašinec, 2010). For this purpose it is possible to carry out testing of the instruments using the ISO 17123 standards or by means of own testing procedure. Submitted paper deals with the testing of selected precision parameters of the Trimble S8 DR Plus Robotic total station in terms of the ISO 17123 standard. 1.1 TRIMBLE S8 DR PLUS ROBOTIC The manufacturer of the Trimble S8 total station classifies this instrument into the second class of accuracy. Regarding the distance measurement mode, the instrument is available in DR Plus or DR HP configurations. The Trimble S8 total station finds its application in precise staking out, control network establishment, measurement of displacements and deformations in tunnel construction, automated control of construction vehicles and other surveying and related applications (Gašinec, 2005) and (Gašinec, 2010). The tested total station serves for educational and scientific activities at the Department of Surveying SUT in Bratislava and is available in the DR Plus ROBOTIC configuration including other Trimble technologies (MagDrive, Vision, SurePoint and Autolock).

Welcome message from author
This document is posted to help you gain knowledge. Please leave a comment to let me know what you think about it! Share it to your friends and learn new things together.
Transcript

281
TS 8 – Metrology, testing and calibration INGEO 2014 – 6th International Conference on Engineering Surveying Prague, Czech republic, April 3-4, 2014
Verification of Selected Precision Parameters of the Trimble S8 DR Plus Robotic Total Station Sokol, Š., Bajtala, M. and Ježko, J. Slovak University of Technology, Faculty of Civil Engineering, Radlinského 11, 81368 Bratislava, Slovakia, Web site: www.svf.stuba.sk E-mail: [email protected], [email protected], [email protected] Abstract
Prerequisite for liable execution of surveying works and acquisition of reliable results is usage of an instrument which meets the accuracy required for the selected type of work. For this purpose it is possible to carry out testing of the instrument using standards from ISO 17123 standard set or other test methods and procedures. In the presented paper results from testing the precision of the Trimble S8 DR Plus Robotic total station by means of selected standards from the ISO 17123 set are published.
Key words: ISO 17123, testing, stability of parameters, universal measuring station
1 INTRODUCTION Market with the surveying technology currently offers a large number of devices from
different manufacturers. This offer is several times higher than demands of surveyors for the new devices. Increasing number of manufactures and models logically leads to the loss of overview of available technology for professional surveyors. Assumption for reliable execution of the surveying activities is usage of an instrument which meets required accuracy for executing works (Gašinec, 2005) and (Gašinec, 2010). For this purpose it is possible to carry out testing of the instruments using the ISO 17123 standards or by means of own testing procedure. Submitted paper deals with the testing of selected precision parameters of the Trimble S8 DR Plus Robotic total station in terms of the ISO 17123 standard.
1.1 TRIMBLE S8 DR PLUS ROBOTIC
The manufacturer of the Trimble S8 total station classifies this instrument into the second class of accuracy. Regarding the distance measurement mode, the instrument is available in DR Plus or DR HP configurations. The Trimble S8 total station finds its application in precise staking out, control network establishment, measurement of displacements and deformations in tunnel construction, automated control of construction vehicles and other surveying and related applications (Gašinec, 2005) and (Gašinec, 2010). The tested total station serves for educational and scientific activities at the Department of Surveying SUT in Bratislava and is available in the DR Plus ROBOTIC configuration including other Trimble technologies (MagDrive, Vision, SurePoint and Autolock).

282 INGEO 2014
General specifications performance DR PLUS (Trimble, 2011): Angle measurement precision (DIN 18723): Standard deviation of angle…........….. 2" (6cc) Standard deviation of direction ….. 1,4" (4,2cc) Distance measurement precision Prism mode: Standard ...................................2 mm + 2 ppm Standard deviation according to ISO17123-4 ...................................................1 mm + 2 ppm Tracking ....................................4 mm + 2 ppm DR mode: Standard ....................................2 mm + 2 ppm Tracking ....................................4 mm + 2 ppm
Figure 1 The basic controls and features
2 TESTING THE PRECISION OF A TOTAL STATION
One of the possible approach for testing the precision of surveying instruments is application of the ISO 17123 standard, „Optics and optical instruments. Field procedures for testing the geodetic and surveying instruments.” The test procedures described in the standards have been developed specifically for in situ applications without the need for special ancillary equipment and are purposefully designed to minimize atmospheric influences (ISO 17123-3, ISO 17123-4 and ISO 17123-5). The standard contains clearly specified measurement procedure, mathematical processing of the measured data as well as practical example of numerical calculation. The standard provides a simplified and full test procedure for most of the tested characteristics. The simplified test procedure provides an estimate as to whether the precision of a given total station is within the specified permitted deviation according to ISO 4463-1. The full test procedure shall be adopted to determine the best achievable measure of precision of a total station its ancillary equipment under field conditions. The statistical tests shall be carried out to answer the following questions (ISO 17123-3, ISO 17123-4 and ISO 17123-5):
a) Is the calculated experimental standard deviation, s, smaller than or equal to corresponding value σ stated by the manufacturer or smaller than another predetermined value σ?
b) Do two experimental standard deviations, s and s% , as determined from two different samples of measurements belong to the same population, assuming that both samples have the same degree of freedom, ν?
The experimental standard deviations, s and s% , may be obtained from:
• two samples of measurements by the same instrument but different observers, • two samples of measurements by the same instrument at different times, • two samples of measurements by different instruments.

Sokol, Š. et al.: Verification of selected precision parameters... 283 2.1 TESTING THE PRECISION OF THE MEASUREMENT OF HORIZONTAL
DIRECTIONS AND VERTICAL ANGLES ACCORDING TO ISO 17123-3
The proposal for the test field, measurement requirements, testing procedure and processing are stated in ISO 17123-3. The standard provides simplified test procedure and full test procedure. Full test procedure, should be adapted to determine the highest attainable precision for measuring with a particular theodolite or total station and their attachments in field conditions. Therefore, we carried out the full test procedure.
For testing the precision of horizontal directions 5 points were stabilized using the nails in the area of Freedom Square. For measuring horizontal directions tripods with reflective prisms were set over the points. Targets were approximately at the same height as the horizon of the device and were evenly distributed around the station at distances of about 100 m (Fig. 2). For test of vertical angles, we used 4 points above each other at a distance of about 50 m from the station (Fig. 2).
Figure 2 Configurations of the test field: left - horizontal direction, right - vertical angles
For the full test procedure we carried out four series of measurements by manual targeting
and four series using Autolock with automatic measurement of directions. The series were measured on different days and under different weather conditions. Each series consisted of measurements of three ranks on 5 targets for the horizontal directions and 4 targets for vertical angles. All targets were measured in two faces of the telescope. The calculations were carried out according to ISO 17123-3 and are presented in the following tables. Table 1 Standard deviations of Hz, V and Index-error according to ISO 17123-3
No Manual targeting
is (cc) Average
s (cc) Automatic targeting
is (cc) Average
s (cc) i Hz V I-error Hz V I-error Hz V I-error Hz V I-error1 5,9 2,3 1,4
5,2 2,0 -4,7
4,0 4,3 -36,2
4,4 3,7 -36,7 2 5,0 2,2 -8,5 4,0 3,2 -37,3
3 4,6 1,7 -6,5 5,2 3,6 -34,2
4 5,2 1,7 -5,4 4,4 3,6 -39,2
284 INGEO 2014
To answer the question 1, the null hypothesis H0 is formulated σ≤s and is not rejected if the following condition is fulfilled (ISO 17123-3):
( )
υυχ
σ α21−×≤s .04,5 2,12,4 cccc ss ≤⇒×≤⇒ (1)
To answer the question 2, the null hypothesis H0 is formulated ss ~= and is not rejected if the following condition is fulfilled (ISO 17123-3):
( ) ( ) .02,2~49,0 ,~,1
2
2
2/12
2
2/1
≤≤⇒≤≤ −− s
sFss
Fυυ
υυ αα
(2)
Table 2 Results of testing the precision of the horizontal directions according to ISO 17123-3
No Manual targeting Automatic targeting
Result Result ( cc ) ( cc ) 1 2 5,9 5,0 1,39 H0 is not rejected 4,0 4,0 1,00 H0 is not rejected 1 3 5,9 4,6 1,65 H0 is not rejected 4,0 5,2 0,59 H0 is not rejected 1 4 5,9 5,2 1,29 H0 is not rejected 4,0 4,4 0,83 H0 is not rejected 2 3 5,0 4,6 1,18 H0 is not rejected 4,0 5,2 0,59 H0 is not rejected 2 4 5,0 5,2 0,92 H0 is not rejected 4,0 4,4 0,83 H0 is not rejected 3 4 4,6 5,2 0,78 H0 is not rejected 5,2 4,4 1,40 H0 is not rejected
Table 3 Results of testing the precision of the vertical angles according to ISO 17123-3
No Manual targeting Automatic targeting
Result Result ( cc ) ( cc ) 1 2 2,3 2,2 1,09 H0 is not rejected 4,3 3,2 1,81 H0 is not rejected 1 3 2,3 1,7 1,83 H0 is not rejected 4,3 3,6 1,43 H0 is not rejected 1 4 2,3 1,7 1,83 H0 is not rejected 4,3 3,6 1,43 H0 is not rejected 2 3 2,2 1,7 1,67 H0 is not rejected 3,2 3,6 0,79 H0 is not rejected 2 4 2,2 1,7 1,67 H0 is not rejected 3,2 3,6 0,79 H0 is not rejected 3 4 1,7 1,7 1,00 H0 is not rejected 3,6 3,6 1,00 H0 is not rejected
Comparing the results, we can conclude with the uncertainty of 5% that the observed
standard deviation obtained from the measurement of horizontal directions by manual targeting is greater than a priori standard deviation σ declared by the manufacturer. Here is shown probability that the human factor possibility influenced the error of measurement. Regard to Automatic measurement the human factor is suppressed, which was also reflected in the result, where the standard deviation was lower than specified by the manufacturer. Also when measured vertical angles with both ways targeting there were obtained favourable results. When testing the vertical angles they are tested even to the null hypothesis H0 (vertical index error δ is equal to zero), where their acceptation shall be in the following condition (ISO 17123-3): ( ) .3,0 2/1 ×≤⇒×≤ − sts δυδ αδ (3)
From the results it is seen that the null hypothesis is rejected. It's also logical because the manufacturers do not seek the equipment to eliminate vertical index error to zero, because this would be technically difficult, as the vertical index error is variable. Therefore, we would like to state that testing of the vertical index error in the relevant standard has no practical justification when measured in two positions of the telescope.

Sokol, Š. et al.: Verification of selected precision parameters... 285 2.2 TESTING THE PRECISION OF THE DISTANCE MEASUREMENT
ACCORDING TO ISO 17123-4 As in the previous test, we focused on the full test procedure. In a flat terrain we set the test
line containing 7 points. Mutual distance between end points had value of d0 = 453,61 m. Derivation of the distances between the intermediate points is based on the knowledge of the total distance of the test line and the wavelength λ of the EDM unit embedded in the device (in our case λ = 0,74 m ). Procedure to calculate the distances between the intermediate points is given in the relevant standard. We mention only the resulting values (d1=30,69m, d2=90,57m, d3=150,45m, d4=120,51m, d5=60,63m, d6=0,75m). Schedule of measuring the distances is shown in figure 3 (right).
Figure 3 Configuration of the test line and measured distances
The Trimble reflective prism with designation PN58026007 and zero-point
correction mm 0,350 −=δ was used for the measurement. During the distance measurement we implemented the corrections of the air temperature and the atmospheric pressure. We carried out two series of measurements in all combination using standard and tracking mode. The processing was made by means of the least square method. Following table shows the resulting standard deviations for once measured distance and zero-point correction of the prism for standard mode and tracking mode. Table 4 Standard deviations of the distance measurement and zero-point correction according to ISO 17123-4
No Standard mode
is [mm] Average s [mm]
Tracking mode is [mm]
Average s [mm]
i si δi sδ si δi sδ si δi sδ si δi sδ 1 0,7 -35,6 0,3
0,7 -35,6 0,3 0,7 -35,5 0,3
0,7 -35,5 0,3 2 0,6 -35,5 0,3 0,7 -35,5 0,3
To answer the question 1, the null hypothesis H0 is formulated σ≤s and is not rejected if
the following condition is fulfilled (ISO 17123-4):
( )
υυχ
σ α21
0−×≤s .30,1 0 ×≤⇒ σs (4)

286 INGEO 2014
To answer the question 2, the null hypothesis H0 is formulated ss ~= and is not rejected if the following condition is fulfilled (ISO 17123-4):
( ) ( ) 98,2~34,0 ,~,1
20
20
2/120
20
2/1
≤≤⇒≤≤ −− s
sF
ss
Fυυ
υυ αα
(5)
The aim the 3rd question is testing the equality of zero-point correction set by the manufacturer and obtained from the processing of measurements. The null hypothesis H0 is formulated 0δδ = and is not rejected in the following condition is fulfilled (ISO 17123-4): .14,20 ×≤− δδδ s (6)
Substitution of the respective values from table 4 to the above mentioned equations (4), (5) and (6) confirmed the null hypothesis for the standard and tracking mode.
2.3 TESTING THE PRECISION OF COORDINATES ACCORDING TO ISO 17123-5
The test point field in the shape of a triangle was located in the area of the Freedom Square in Bratislava. Tripods with tribrachs were set up at each corner of the triangle. The distances between points were approximately 100 m. Configuration of the test field was selected in accordance with the ISO 17123-5 standard. Test field distribution within the site is shown in Fig. 4.
Fig. 4 Configuration of the test field
The measurement was carried out twice in three series in a day. The measured sets of
results obtained by manual and automated targeting were subject for testing. Zero rectangular coordinates were set at each instrument station. The values of temperature, pressure and atmospheric moisture were registered to correct the distance measurements. Coordinates were always determined in both telescope faces. Reflective prism from the production of the Trimble Company with the PN58026007 type designation was used. The measurement procedure is the same in each series, the measurement starts at station 1 with targeting to points 2 and 3. This is followed by similar measurement from the second and third station. Processing of measured data is realized separately for the positional coordinates x, y and separately for the z coordinate. Necessary condition for processing of positional coordinates x, y is the transformation into the one coordinate system. On point 1, we choose the zero height point. The processing of the resulting coordinates and their standard deviations were determined by the least square method.
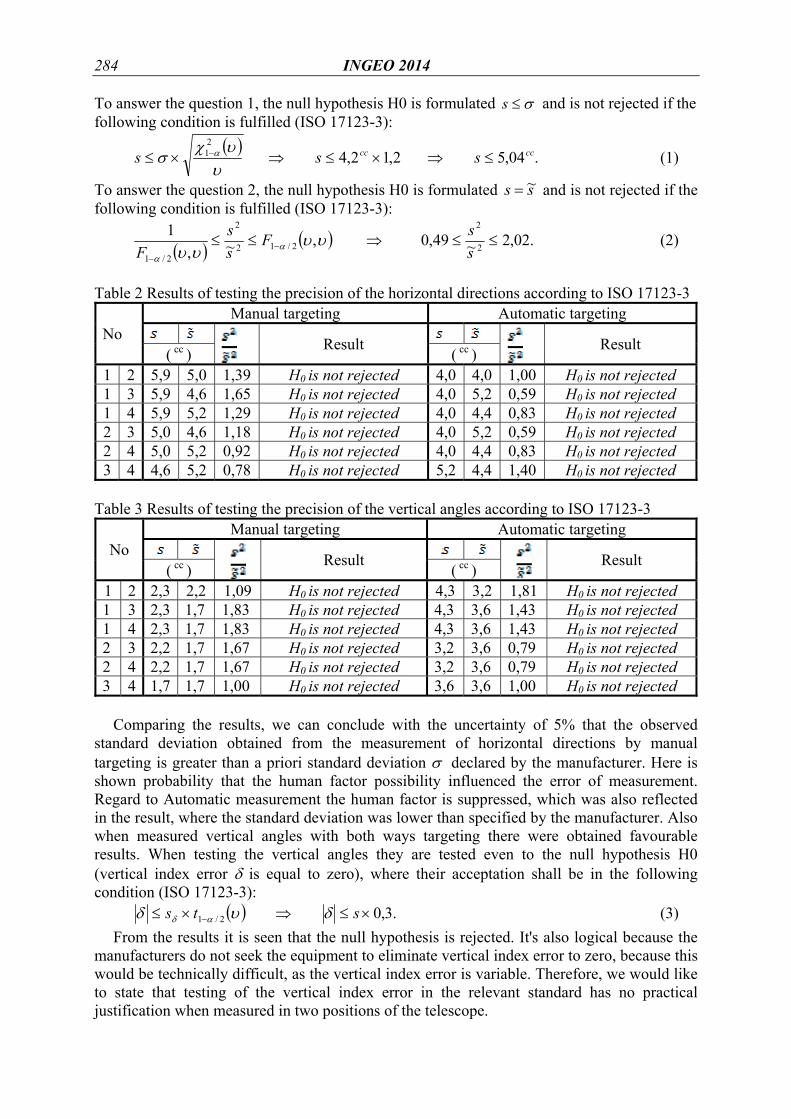
Calculated standard deviations once measured of x, y, and z coordinates in two faces of the telescope can be found in table 5.
Sokol, Š. et al.: Verification of selected precision parameters... 287
Table 5 Standard deviations of once measured x, y and z coordinates according to ISO 17123-5
Standard mode Tracking mode
Set [mm] Average of 2 sets [mm] Average of 2 sets i iXYs
iZs XYs Zs iXYs
iZs XYs Zs 1 1,2 0,5 1,1 0,5 0,7 0,4 0,7 0,5 2 1,0 0,4 0,7 0,5
To answer the question 1, the null hypothesis H0 is formulated σ≤s and is not rejected if the following condition is fulfilled (ISO 17123-5):
( )XY
XYXYs
υυχ
σ α21−×≤ 3,2,1 ×≤⇒ σXYs (7)
( )Z
ZZs
υυχ
σ α21−×≤ .29,1 ×≤⇒ σZs (8)
To answer the question 2, the null hypothesis H0 is formulated ss ~= and is not rejected if the following condition is fulfilled (ISO 17123-5):
( ) ( ) ,27,2~44,0 ,~,1
2
2
2/12
2
2/1
≤≤⇒≤≤ −− XY
XYXYXY
XY
XY
XYXY ssF
ss
Fυυ
υυ αα
(9)
( ) ( ) ,86,2~35,0 ,~,1
2
2
2/12
2
2/1
≤≤⇒≤≤ −− Z
ZZZ
Z
Z
ZZ ssF
ss
Fυυ
υυ αα
(10)
The standard deviation of the measured coordinates is not specified by the manufacturer of the instrument, however it can be determined by application of the error propagation law. For this purpose a knowledge about a priori standard deviation of the measured distance σd and the standard deviation of the measured horizontal (σα) and vertical angle (σβ) is needed. The derivation of standard errors is based on the formulas for individual rectangular coordinates x, y and z, which are in the functional relationships with the distance d, the horizontal angle α and the vertical angle β .
.sin ;cossin ;coscos ββαβα ×=××=××= dzdydx (11)
The values of the horizontal angle, vertical angle, slope distance and the calculated standard deviations are shown in table 6.
Table 6 Calculated standard deviations XYZYX and σσσσ , ,
Taking into account the values from table 5 and equations (7), (8), (9), (10) we can assume
that the standard deviations XYs and Zs obtained from processing of the measurements are smaller than or equal to the calculated a priori standard deviations shown in table 6 at 5 % significance level.
g55,118≅α Standard mode [mm] Tracking mode [mm] g91,1≅β Xσ Yσ XYσ Zσ Xσ Yσ XYσ Zσ
md 75,99− 0,7 1,2 1,4 0,7 1,4 4,0 4,3 0,7
288 INGEO 2014
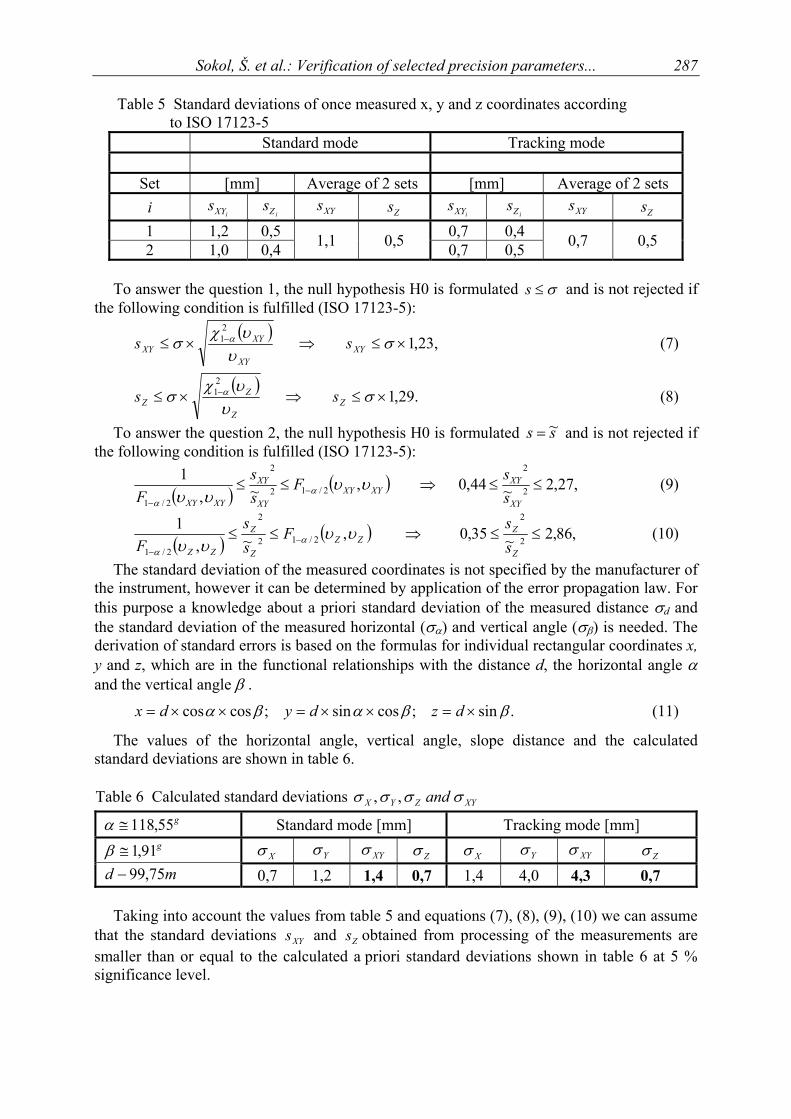
Table 7 Statistical testing to the 2nd question based on ISO 17123-5
From table 7 we assume that the partial standard deviations obtained from individual sets
of measurements (for the standard and tracking distance measurement mode) come from the same population at 5% significance level.
3 CONCLUSION In submitted paper is described test of the precision of the Trimble S8 DR Plus Robotic
total station according to the ISO 17123 standards. Precision of the horizontal directions, the vertical angles and significance of the index error for manual and automatic targeting using Autolock was verified according to the ISO 17123-3 standard. Distance measurement precision and value of the zero-point correction was tested in terms of ISO 17123-4 standard. Testing the precision of plane rectangular coordinates x, y and height coordinate z was realized by means of the ISO 17123-5 standard. Due to the fact that the manufacturer does not specify precision of the coordinate determination, the relevant characteristics of precision were derived applying the error propagation law using precision of the horizontal angles, the vertical angles and the horizontal distances declared by the manufacturer. Precision declared by the manufacturer was not reached for manually measured horizontal directions and testing the index error showed its significant non-zero value. REFERENCES ISO 17123-3: Optic and optical instruments. Field procedures for testing geodetic and surveying instruments: Part 3. Theodolites. SÚTN Bratislava, 2010. ISO 17123-4: Optic and optical instruments – Field procedures for testing geodetic and surveying instruments: Part 4: Electro-optical distance meters (EDM measurement to reflector). SÚTN Bratislava, 2013. ISO 17123-5: Optic and optical instruments – Field procedures for testing geodetic and surveying instruments: Part 5: Total stations. SÚTN Bratislava, 2012. Trimble, 2011. Trimble S8 Total Station Datasheet [online]. [cit. 2013-12-12].:<http://trl.trimble.com/docushare/dsweb/Get/Document-390412/022543-410F_TrimbleS8_DS_1011_LR.pdf> ISO 4463-1: Measurement methods for building. Setting-out and measurement. Part 3: Check-lists for the procurement of surveys and measurement services. SUTN 2002. GAŠINEC, J., GAŠINCOVÁ, S.: Substardand practices of adjustment measurements in local geodetic networks. In: Acta Montanistica Slovaca, 2005. Volume 10, n. 2, p. 94-103. - ISSN 1335-1788 GAŠINEC, J., GAŠINCOVÁ, S.: Adjustment of positional geodetic networks by unconventional estimations. In: Acta Montanistica Slovaca 2010. Volume 15, n. 1, p. 71-85. - ISSN 1335-1788.
Sets Standard mode ZXY ss , [mm] Tracking mode ZXY ss , [mm]
s s~ 2
2
~ss Result s s~
2
2
~ss Result
1 2 1,2 1,0 1,44 H0 for XYs is not reject. 0,7 0,7 1,00 H0 for XYs is not reject.
1 2 0,5 0,4 1,56 H0 for Zs is not reject. 0,4 0,5 0,64 H0 for Zs is not reject.
Related Documents