Verification of Analysis of GDAS and NCUM-DA with Radiosonde Observations using MET Sujata Pattanayak, V. S. Prasad and E.N. Rajagopal August 2020 TECNICAL REPORT NMRF/TR/08/2020 National Centre for Medium Range Weather Forecasting Ministry of Earth Sciences, Government of India A-50, Sector-62, Noida-201 309, INDIA

Welcome message from author
This document is posted to help you gain knowledge. Please leave a comment to let me know what you think about it! Share it to your friends and learn new things together.
Transcript
1
Verification of Analysis of GDAS and
NCUM-DA with Radiosonde
Observations using MET
Sujata Pattanayak, V. S. Prasad and E.N. Rajagopal
August 2020
TE
CN
ICA
L R
EP
OR
T
NMRF/TR/08/2020
National Centre for Medium Range Weather Forecasting
Ministry of Earth Sciences, Government of India
A-50, Sector-62, Noida-201 309, INDIA

2
Verification of Analysis of GDAS and NCUM-DA
with Radiosonde Observations using MET
Sujata Pattanayak, V. S. Prasad and E.N. Rajagopal
August 2020
National Centre for Medium Range Weather Forecasting
Ministry of Earth Sciences
A-50, Sector-62, Noida-201 309, INDIA

3
Ministry of Earth Sciences
National Centre for Medium Range Weather Forecasting
Document Control Data Sheet
1 Name of the Institute National Centre for Medium Range Weather Forecasting
2 Document Number NMRF/TR/08/2020
3 Date of Publication August 2020
4 Title of the document Verification of Analysis of GDAS and NCUM-DA with
Radiosonde Observations using MET
5 Type of Document Technical Report
6 No. of Pages, Figures and
Tables
27 Pages, 8 Figures, 4 Tables
7 Number of References 12
8 Author (S) Sujata Pattanayak, V. S. Prasad and E.N. Rajagopal
9 Originating Unit NCMRWF
10 Abstract The National Centre for Medium Range Weather Forecasting
(NCMRWF) generates daily analysis based on Global Data
Assimilation System (GDAS) and also based on NCMRWF
Unified Model (NCUM) Data Assimilation (NCUM-DA). This
technical report presents a comprehensive statistics on the
performance of the GDAS and NCUM-DA analysis as per the
Commission for Basic Systems (CBS) guidelines using Model
Evaluation Tool (MET). The performances of the two analyses
are evaluated over 12 different regions covering the entire
globe. The verification of analysis is carried out against the
radiosonde (RS/RW) observations available over the specific
regions at 12 hourly intervals (00 & 12 UTC). The daily,
weekly and monthly statistics in terms of mean error, RMSE,
Pearson Correlation Coefficient, and Anomaly Correlation etc.
are computed for temperature, geopotential height, zonal (u)
and meridional (v) wind components at standard pressure
levels. This verification methodology will also be helpful in
inter-comparison of the two analyses with the other operational
centres worldwide.
11 Security
classification
Non-Secure
12 Distribution Unrestricted Distribution
13 Key Words GDAS Analysis, NCUM-DA Analysis, radiosonde observation,
CBS score
4
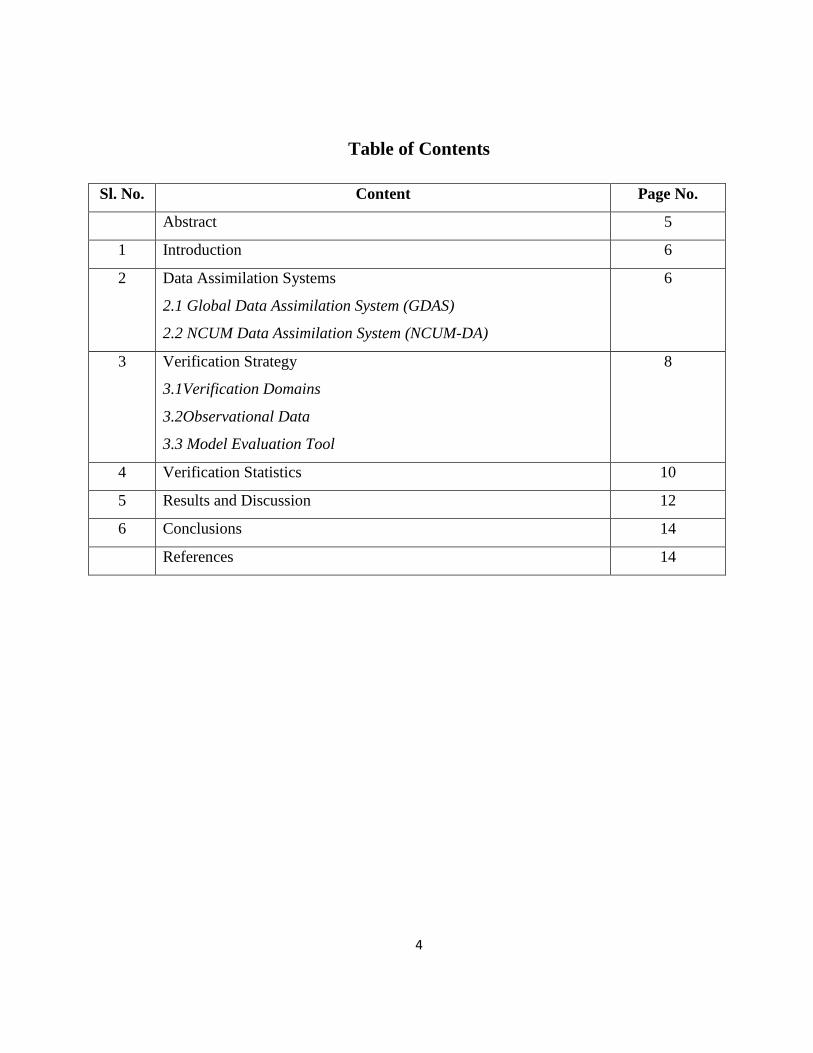
Table of Contents
Sl. No. Content Page No.
Abstract 5
1 Introduction 6
2 Data Assimilation Systems
2.1 Global Data Assimilation System (GDAS)
2.2 NCUM Data Assimilation System (NCUM-DA)
6
3 Verification Strategy
3.1Verification Domains
3.2Observational Data
3.3 Model Evaluation Tool
8
4 Verification Statistics 10
5 Results and Discussion 12
6 Conclusions 14
References 14
5
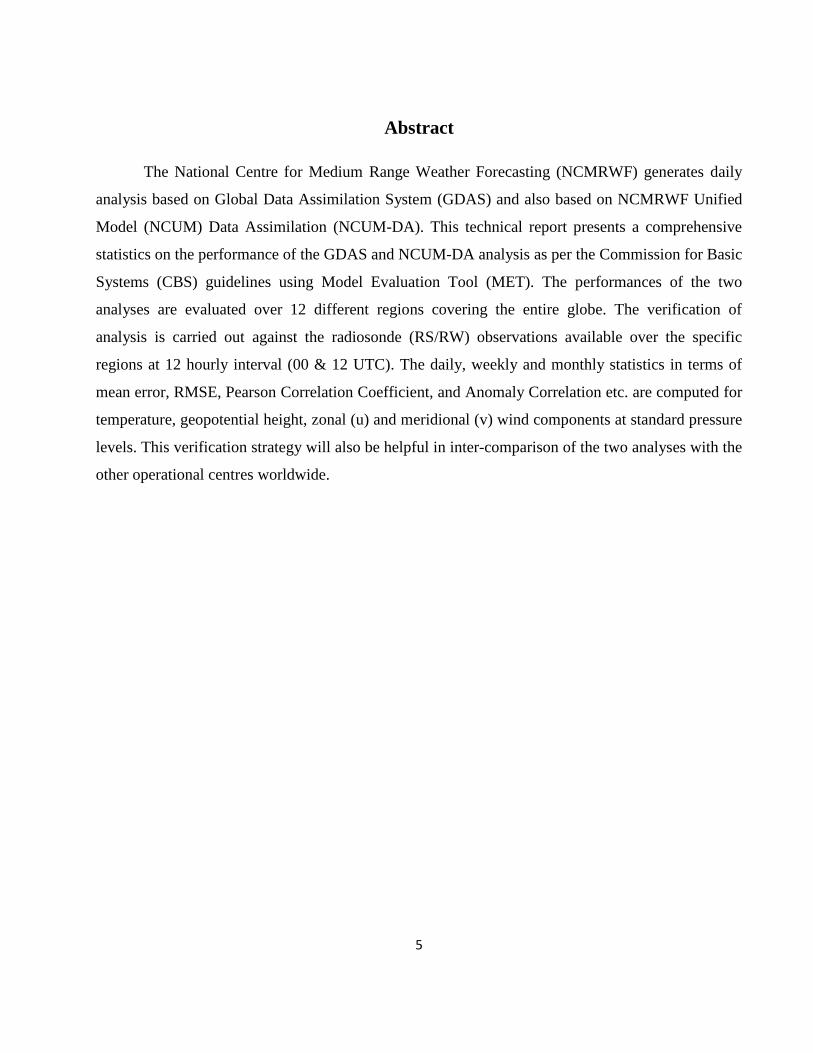
Abstract
The National Centre for Medium Range Weather Forecasting (NCMRWF) generates daily
analysis based on Global Data Assimilation System (GDAS) and also based on NCMRWF Unified
Model (NCUM) Data Assimilation (NCUM-DA). This technical report presents a comprehensive
statistics on the performance of the GDAS and NCUM-DA analysis as per the Commission for Basic
Systems (CBS) guidelines using Model Evaluation Tool (MET). The performances of the two
analyses are evaluated over 12 different regions covering the entire globe. The verification of
analysis is carried out against the radiosonde (RS/RW) observations available over the specific
regions at 12 hourly interval (00 & 12 UTC). The daily, weekly and monthly statistics in terms of
mean error, RMSE, Pearson Correlation Coefficient, and Anomaly Correlation etc. are computed for
temperature, geopotential height, zonal (u) and meridional (v) wind components at standard pressure
levels. This verification strategy will also be helpful in inter-comparison of the two analyses with the
other operational centres worldwide.
6
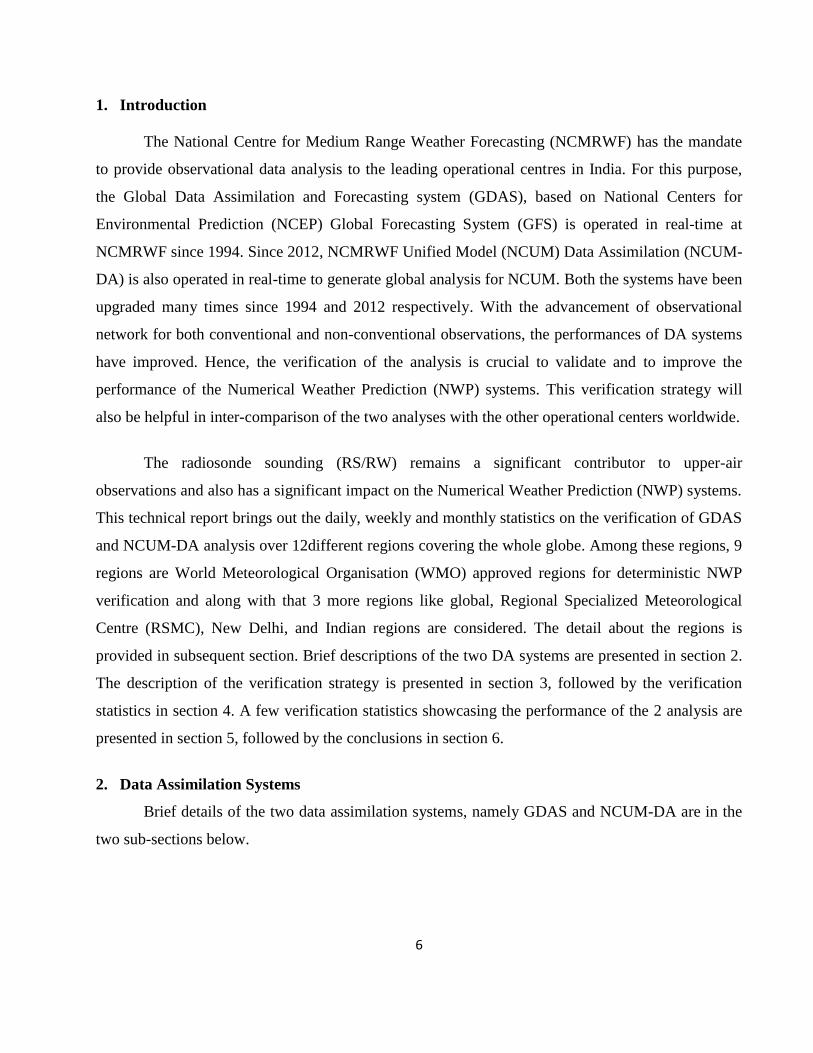
1. Introduction
The National Centre for Medium Range Weather Forecasting (NCMRWF) has the mandate
to provide observational data analysis to the leading operational centres in India. For this purpose,
the Global Data Assimilation and Forecasting system (GDAS), based on National Centers for
Environmental Prediction (NCEP) Global Forecasting System (GFS) is operated in real-time at
NCMRWF since 1994. Since 2012, NCMRWF Unified Model (NCUM) Data Assimilation (NCUM-
DA) is also operated in real-time to generate global analysis for NCUM. Both the systems have been
upgraded many times since 1994 and 2012 respectively. With the advancement of observational
network for both conventional and non-conventional observations, the performances of DA systems
have improved. Hence, the verification of the analysis is crucial to validate and to improve the
performance of the Numerical Weather Prediction (NWP) systems. This verification strategy will
also be helpful in inter-comparison of the two analyses with the other operational centers worldwide.
The radiosonde sounding (RS/RW) remains a significant contributor to upper-air
observations and also has a significant impact on the Numerical Weather Prediction (NWP) systems.
This technical report brings out the daily, weekly and monthly statistics on the verification of GDAS
and NCUM-DA analysis over 12different regions covering the whole globe. Among these regions, 9
regions are World Meteorological Organisation (WMO) approved regions for deterministic NWP
verification and along with that 3 more regions like global, Regional Specialized Meteorological
Centre (RSMC), New Delhi, and Indian regions are considered. The detail about the regions is
provided in subsequent section. Brief descriptions of the two DA systems are presented in section 2.
The description of the verification strategy is presented in section 3, followed by the verification
statistics in section 4. A few verification statistics showcasing the performance of the 2 analysis are
presented in section 5, followed by the conclusions in section 6.
2. Data Assimilation Systems
Brief details of the two data assimilation systems, namely GDAS and NCUM-DA are in the
two sub-sections below.
7
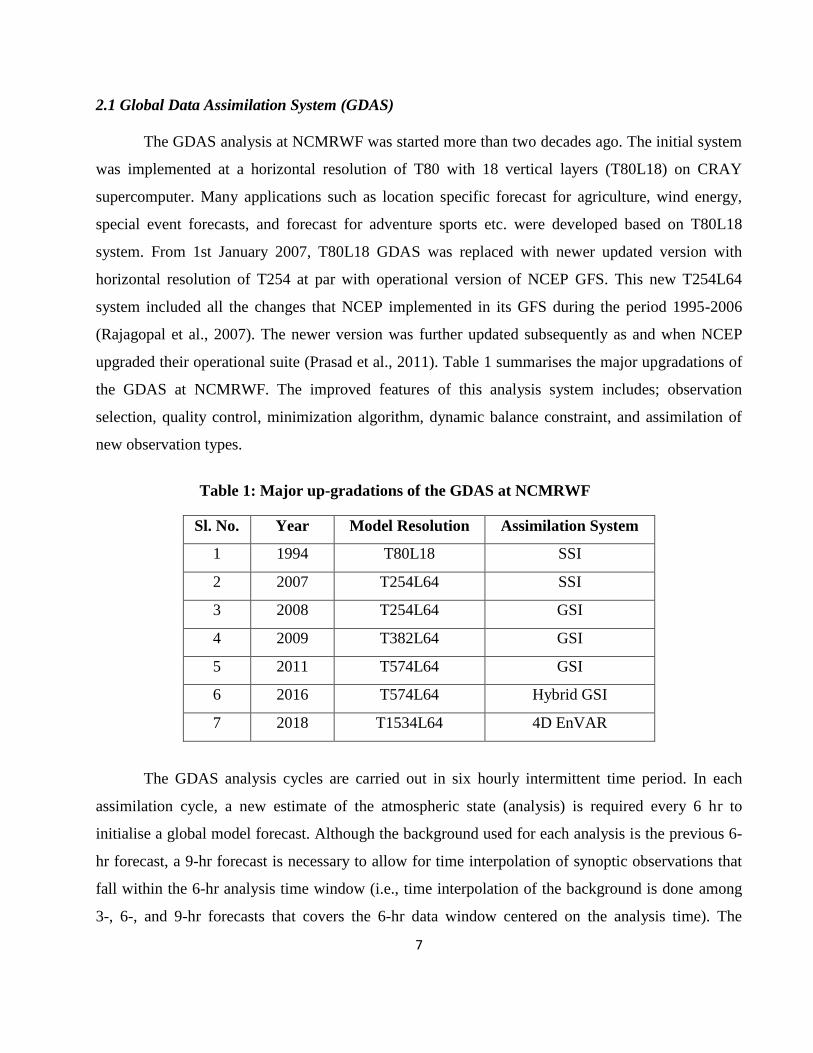
2.1 Global Data Assimilation System (GDAS)
The GDAS analysis at NCMRWF was started more than two decades ago. The initial system
was implemented at a horizontal resolution of T80 with 18 vertical layers (T80L18) on CRAY
supercomputer. Many applications such as location specific forecast for agriculture, wind energy,
special event forecasts, and forecast for adventure sports etc. were developed based on T80L18
system. From 1st January 2007, T80L18 GDAS was replaced with newer updated version with
horizontal resolution of T254 at par with operational version of NCEP GFS. This new T254L64
system included all the changes that NCEP implemented in its GFS during the period 1995-2006
(Rajagopal et al., 2007). The newer version was further updated subsequently as and when NCEP
upgraded their operational suite (Prasad et al., 2011). Table 1 summarises the major upgradations of
the GDAS at NCMRWF. The improved features of this analysis system includes; observation
selection, quality control, minimization algorithm, dynamic balance constraint, and assimilation of
new observation types.
Table 1: Major up-gradations of the GDAS at NCMRWF
Sl. No. Year Model Resolution Assimilation System
1 1994 T80L18 SSI
2 2007 T254L64 SSI
3 2008 T254L64 GSI
4 2009 T382L64 GSI
5 2011 T574L64 GSI
6 2016 T574L64 Hybrid GSI
7 2018 T1534L64 4D EnVAR
The GDAS analysis cycles are carried out in six hourly intermittent time period. In each
assimilation cycle, a new estimate of the atmospheric state (analysis) is required every 6 hr to
initialise a global model forecast. Although the background used for each analysis is the previous 6-
hr forecast, a 9-hr forecast is necessary to allow for time interpolation of synoptic observations that
fall within the 6-hr analysis time window (i.e., time interpolation of the background is done among
3-, 6-, and 9-hr forecasts that covers the 6-hr data window centered on the analysis time). The
8
analyses so obtained are then used as the initial condition for subsequent forecasts and the cycle
continues. The details of the analysis system can be found in Kleist et al. (2009) and the results of
pre-implementation test carried out at NCMRWF can be found in Rajagopal et al. (2007). The
subsequent upgradations of the GDAS are elaborated in Prasad et al. (2011) and Prasad et al. (2014).
The GDAS analysis has wide range of applications in India, namely, to initialise the daily the IMD-
GFS for medium range prediction, INCOIS GODAS for ocean analysis, weekly extended range (4
weeks) prediction using IMD-GFS & MM-CFS and MM-CFS for seasonal prediction on a monthly
basis. In addition, the GDAS has been used in the generation of a 20 year (1999-2018) global
retrospective reanalysis (Prasad et al., 2017), generation of high resolution hindcasts (Johny and
Prasad, 2020) and used in satellite data assimilation studies (Johny et al., 2020).
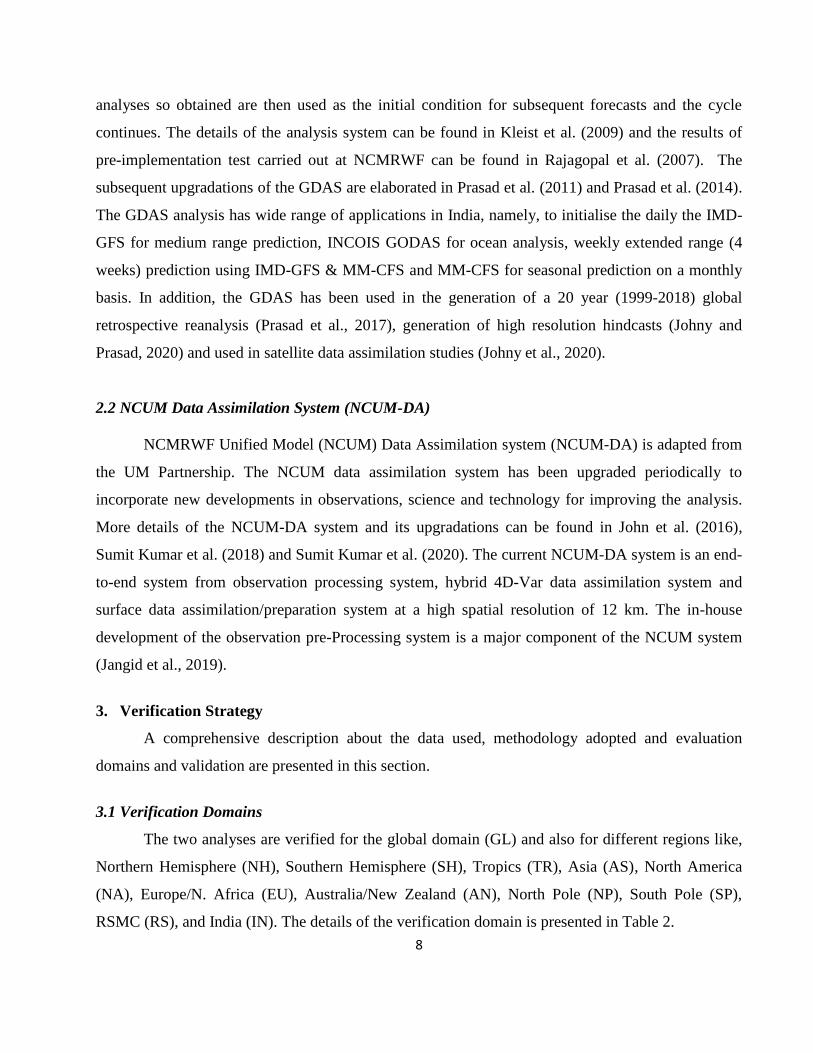
2.2 NCUM Data Assimilation System (NCUM-DA)
NCMRWF Unified Model (NCUM) Data Assimilation system (NCUM-DA) is adapted from
the UM Partnership. The NCUM data assimilation system has been upgraded periodically to
incorporate new developments in observations, science and technology for improving the analysis.
More details of the NCUM-DA system and its upgradations can be found in John et al. (2016),
Sumit Kumar et al. (2018) and Sumit Kumar et al. (2020). The current NCUM-DA system is an end-
to-end system from observation processing system, hybrid 4D-Var data assimilation system and
surface data assimilation/preparation system at a high spatial resolution of 12 km. The in-house
development of the observation pre-Processing system is a major component of the NCUM system
(Jangid et al., 2019).
3. Verification Strategy
A comprehensive description about the data used, methodology adopted and evaluation
domains and validation are presented in this section.
3.1 Verification Domains
The two analyses are verified for the global domain (GL) and also for different regions like,
Northern Hemisphere (NH), Southern Hemisphere (SH), Tropics (TR), Asia (AS), North America
(NA), Europe/N. Africa (EU), Australia/New Zealand (AN), North Pole (NP), South Pole (SP),
RSMC (RS), and India (IN). The details of the verification domain is presented in Table 2.
9
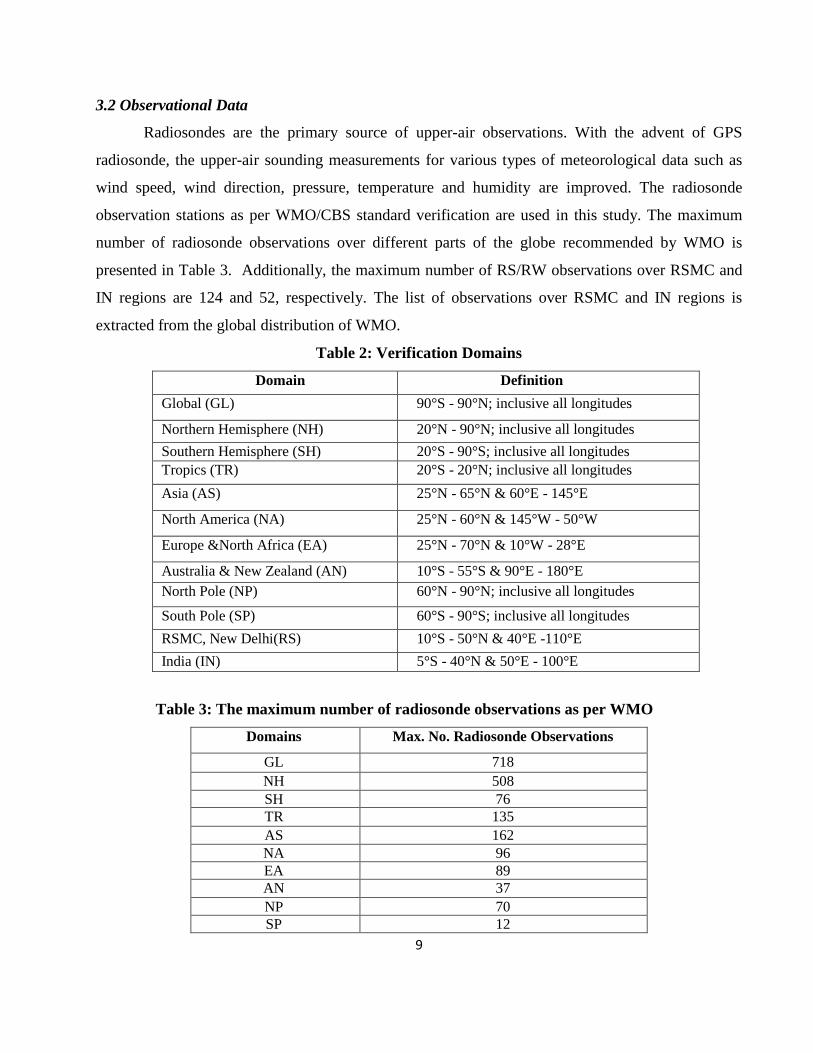
3.2 Observational Data
Radiosondes are the primary source of upper-air observations. With the advent of GPS
radiosonde, the upper-air sounding measurements for various types of meteorological data such as
wind speed, wind direction, pressure, temperature and humidity are improved. The radiosonde
observation stations as per WMO/CBS standard verification are used in this study. The maximum
number of radiosonde observations over different parts of the globe recommended by WMO is
presented in Table 3. Additionally, the maximum number of RS/RW observations over RSMC and
IN regions are 124 and 52, respectively. The list of observations over RSMC and IN regions is
extracted from the global distribution of WMO.
Table 2: Verification Domains
Domain Definition
Global (GL) 90°S - 90°N; inclusive all longitudes
Northern Hemisphere (NH) 20°N - 90°N; inclusive all longitudes
Southern Hemisphere (SH) 20°S - 90°S; inclusive all longitudes
Tropics (TR) 20°S - 20°N; inclusive all longitudes
Asia (AS) 25°N - 65°N & 60°E - 145°E
North America (NA) 25°N - 60°N & 145°W - 50°W
Europe &North Africa (EA) 25°N - 70°N & 10°W - 28°E
Australia & New Zealand (AN) 10°S - 55°S & 90°E - 180°E
North Pole (NP) 60°N - 90°N; inclusive all longitudes
South Pole (SP) 60°S - 90°S; inclusive all longitudes
RSMC, New Delhi(RS) 10°S - 50°N & 40°E -110°E
India (IN) 5°S - 40°N & 50°E - 100°E
Table 3: The maximum number of radiosonde observations as per WMO
Domains Max. No. Radiosonde Observations
GL 718
NH 508
SH 76
TR 135
AS 162
NA 96
EA 89
AN 37
NP 70
SP 12
10
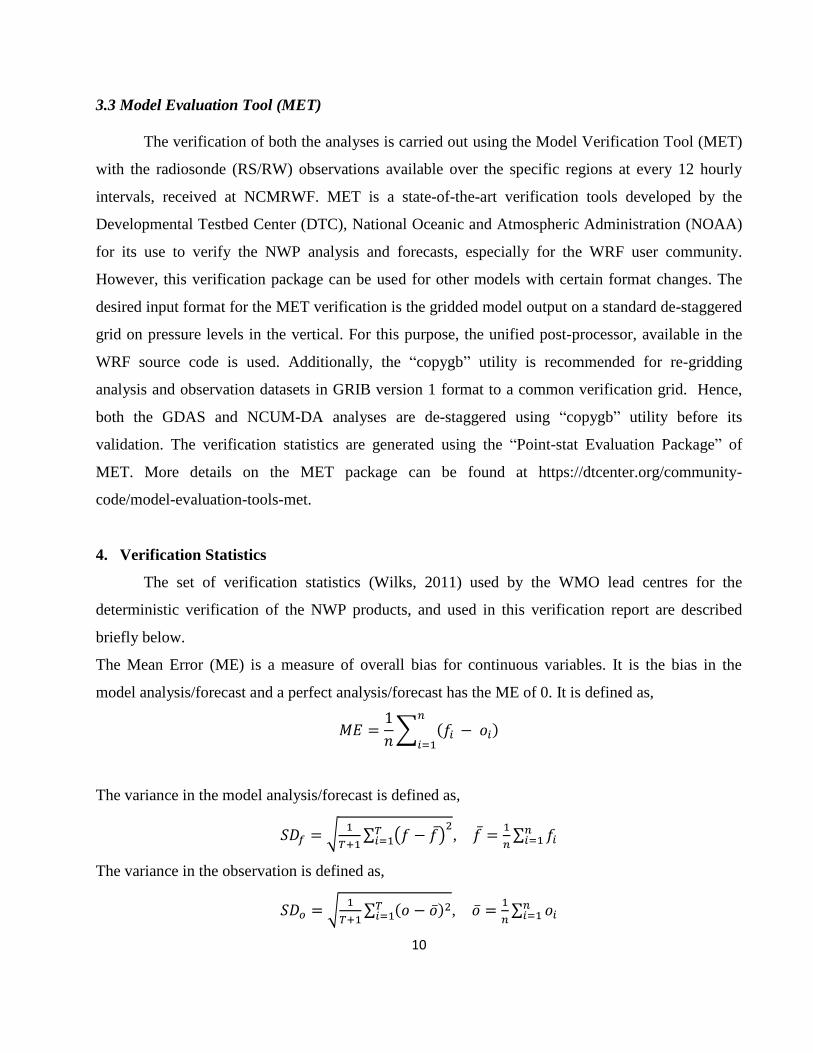
3.3 Model Evaluation Tool (MET)
The verification of both the analyses is carried out using the Model Verification Tool (MET)
with the radiosonde (RS/RW) observations available over the specific regions at every 12 hourly
intervals, received at NCMRWF. MET is a state-of-the-art verification tools developed by the
Developmental Testbed Center (DTC), National Oceanic and Atmospheric Administration (NOAA)
for its use to verify the NWP analysis and forecasts, especially for the WRF user community.
However, this verification package can be used for other models with certain format changes. The
desired input format for the MET verification is the gridded model output on a standard de-staggered
grid on pressure levels in the vertical. For this purpose, the unified post-processor, available in the
WRF source code is used. Additionally, the “copygb” utility is recommended for re-gridding
analysis and observation datasets in GRIB version 1 format to a common verification grid. Hence,
both the GDAS and NCUM-DA analyses are de-staggered using “copygb” utility before its
validation. The verification statistics are generated using the “Point-stat Evaluation Package” of
MET. More details on the MET package can be found at https://dtcenter.org/community-
code/model-evaluation-tools-met.
4. Verification Statistics
The set of verification statistics (Wilks, 2011) used by the WMO lead centres for the
deterministic verification of the NWP products, and used in this verification report are described
briefly below.
The Mean Error (ME) is a measure of overall bias for continuous variables. It is the bias in the
model analysis/forecast and a perfect analysis/forecast has the ME of 0. It is defined as,
𝑀𝐸 =1
𝑛∑ (𝑓𝑖 − 𝑜𝑖)
𝑛
𝑖=1
The variance in the model analysis/forecast is defined as,
𝑆𝐷𝑓 = √1
𝑇+1∑ (𝑓 − 𝑓)̅
2𝑇𝑖=1 , 𝑓̅ =
1
𝑛∑ 𝑓𝑖
𝑛𝑖=1
The variance in the observation is defined as,
𝑆𝐷𝑜 = √1
𝑇+1∑ (𝑜 − �̅�)2𝑇
𝑖=1 , �̅� =1
𝑛∑ 𝑜𝑖
𝑛𝑖=1

11
The root mean square error (RMSE) can be defined as,
𝑅𝑀𝑆𝐸 = √1
𝑛∑(𝑓𝑖 − 𝑜𝑖)2
The Pearson correlation coefficient (PRCORR) measures the strength of linear association between the
model analysis/forecast and observations. It is defined as,
𝑃𝑅𝐶𝑂𝑅𝑅 = ∑ (𝑓 − 𝑓)̅(𝑜 − �̅�)𝑇
𝑖=1
√∑(𝑓𝑖 − 𝑓)̅2
√∑(𝑜𝑖 − �̅�)2
The value of the PRCORR ranges between -1 and 1. A value of 1 indicates perfect correlation and a
value of -1 indicates perfect negative correlation. A value of 0 indicates that the forecasts and
observations are not correlated.
Additionally, the anomaly correlation coefficient is estimated which is the equivalent to the Pearson
correlation coefficient, but both the observation and forecast are first adjusted to the climatological
value. It measures the strength of linear association between forecast anomalies and observed
anomalies. It is defined as,
𝐴𝑁𝑂𝑀𝐶𝑂𝑅𝑅 = ∑(𝑓𝑖 − 𝑐)(𝑜𝑖 − 𝑐)
√∑(𝑓𝑖 − 𝑐)2 √(𝑜𝑖 − 𝑐)2
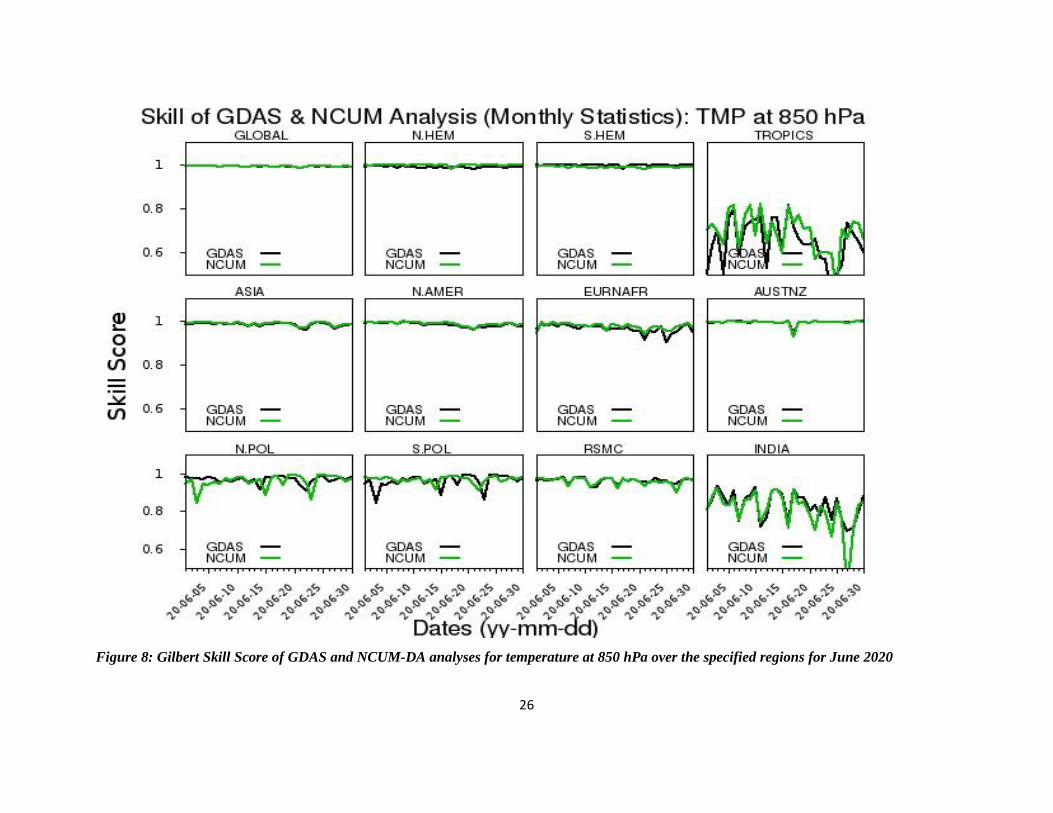
The skill of the analysis evaluated through Gilbert Skill Score (GSS). It is defined as follows.
𝐺𝑆𝑆 = 𝑎 −
(𝑎+𝑏)(𝑎+𝑐)
𝑎+𝑏+𝑐+𝑑
𝑎 + 𝑏 + 𝑐 −(𝑎+𝑏)(𝑎+𝑐)
𝑎+𝑏+𝑐+𝑑
𝐾 =(𝑎 + 𝑏)(𝑎 + 𝑐) + (𝑐 + 𝑑)(𝑏 + 𝑑)
𝑎 + 𝑏 + 𝑐 + 𝑑
The value of a, b, c, d are measures as in Table 4.
12
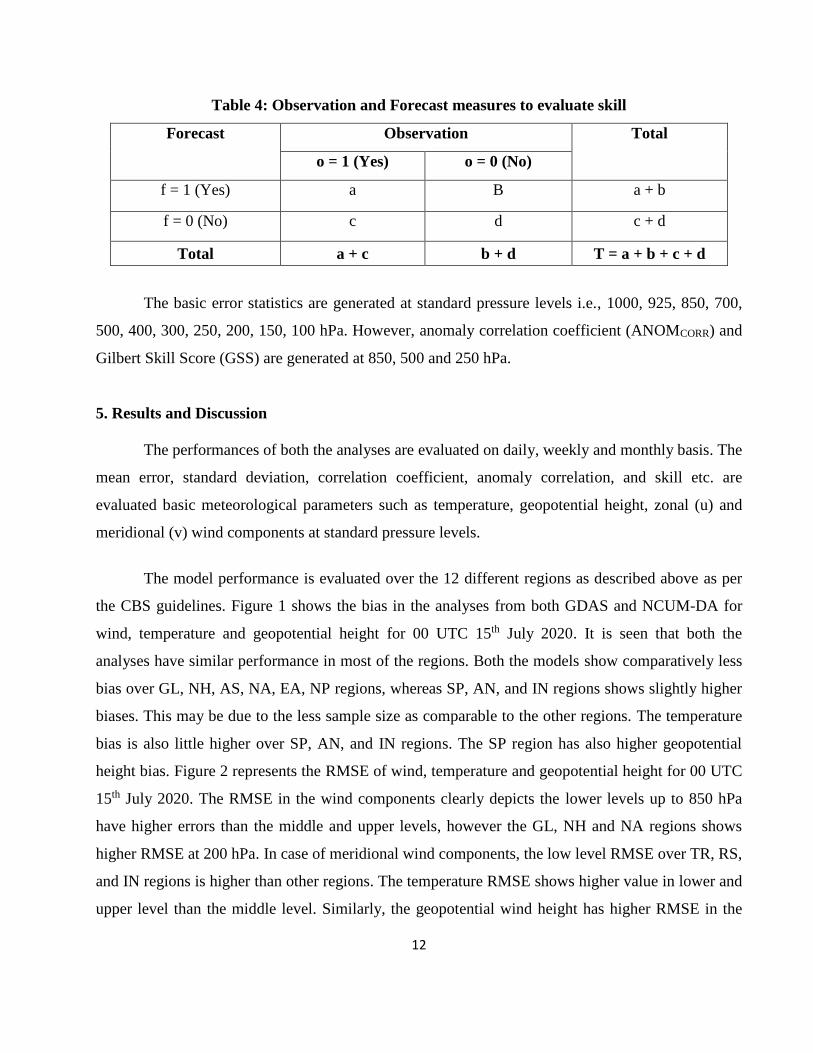
Table 4: Observation and Forecast measures to evaluate skill
Forecast Observation Total
o = 1 (Yes) o = 0 (No)
f = 1 (Yes) a B a + b
f = 0 (No) c d c + d
Total a + c b + d T = a + b + c + d
The basic error statistics are generated at standard pressure levels i.e., 1000, 925, 850, 700,
500, 400, 300, 250, 200, 150, 100 hPa. However, anomaly correlation coefficient (ANOMCORR) and
Gilbert Skill Score (GSS) are generated at 850, 500 and 250 hPa.
5. Results and Discussion
The performances of both the analyses are evaluated on daily, weekly and monthly basis. The
mean error, standard deviation, correlation coefficient, anomaly correlation, and skill etc. are
evaluated basic meteorological parameters such as temperature, geopotential height, zonal (u) and
meridional (v) wind components at standard pressure levels.
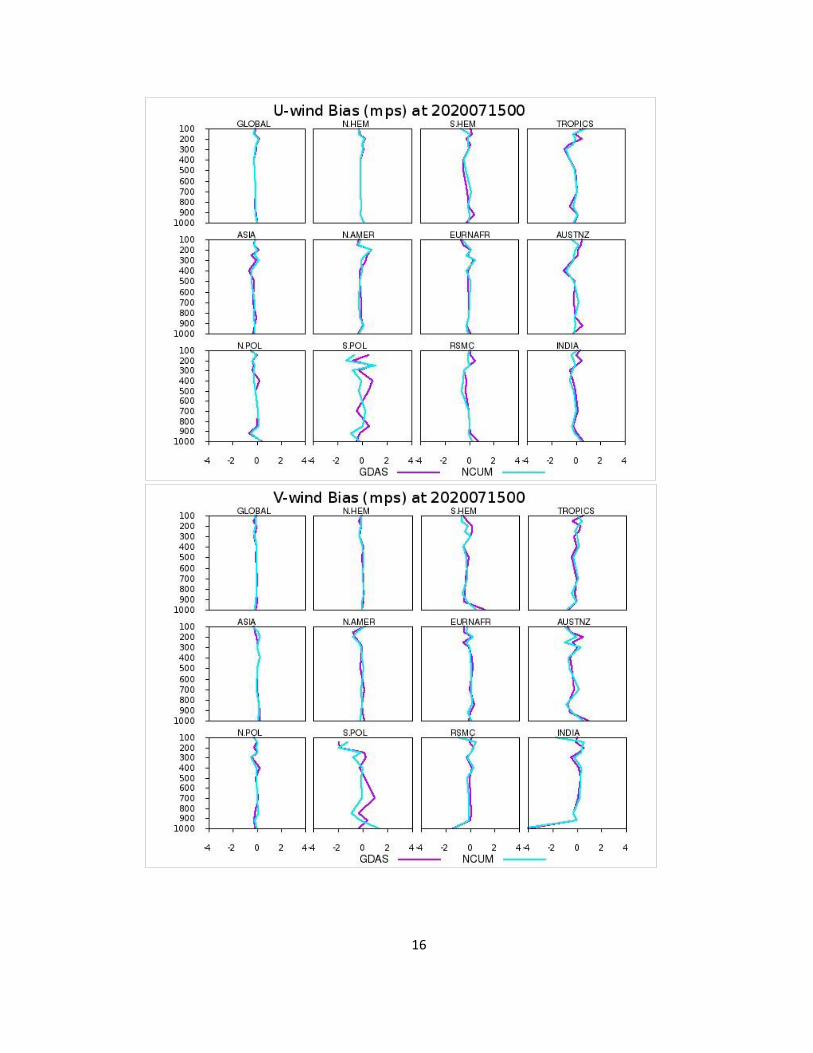
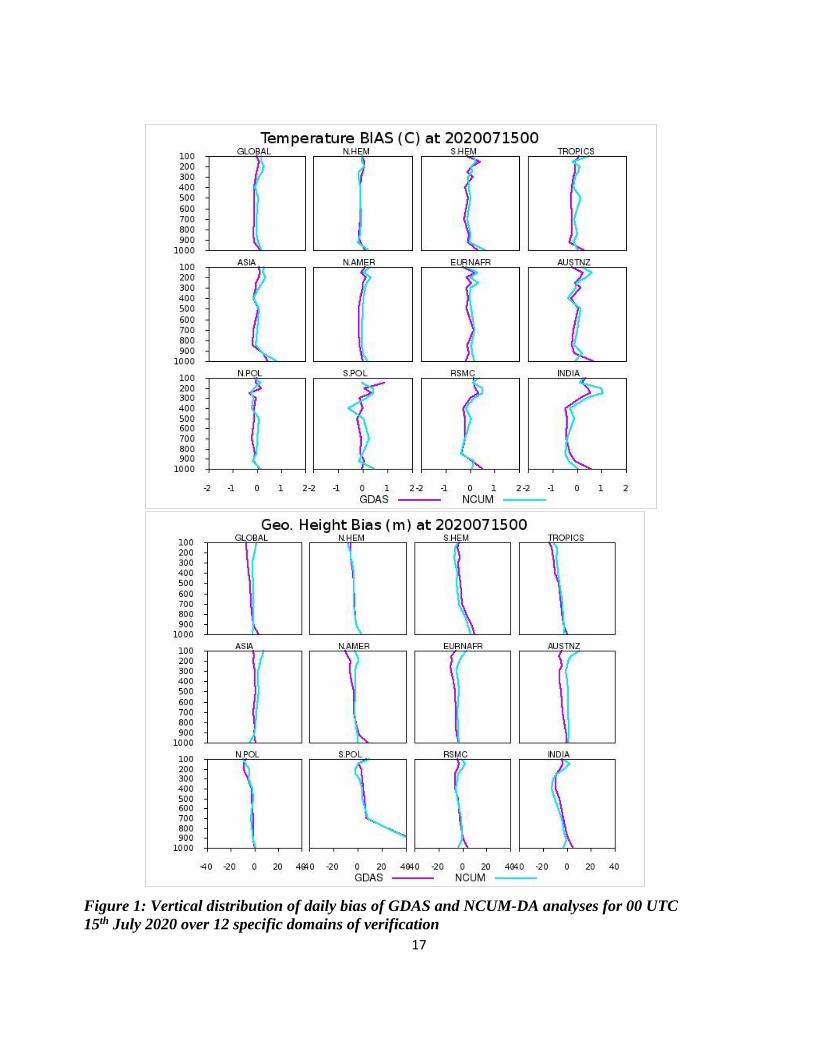
The model performance is evaluated over the 12 different regions as described above as per
the CBS guidelines. Figure 1 shows the bias in the analyses from both GDAS and NCUM-DA for
wind, temperature and geopotential height for 00 UTC 15th July 2020. It is seen that both the
analyses have similar performance in most of the regions. Both the models show comparatively less
bias over GL, NH, AS, NA, EA, NP regions, whereas SP, AN, and IN regions shows slightly higher
biases. This may be due to the less sample size as comparable to the other regions. The temperature
bias is also little higher over SP, AN, and IN regions. The SP region has also higher geopotential
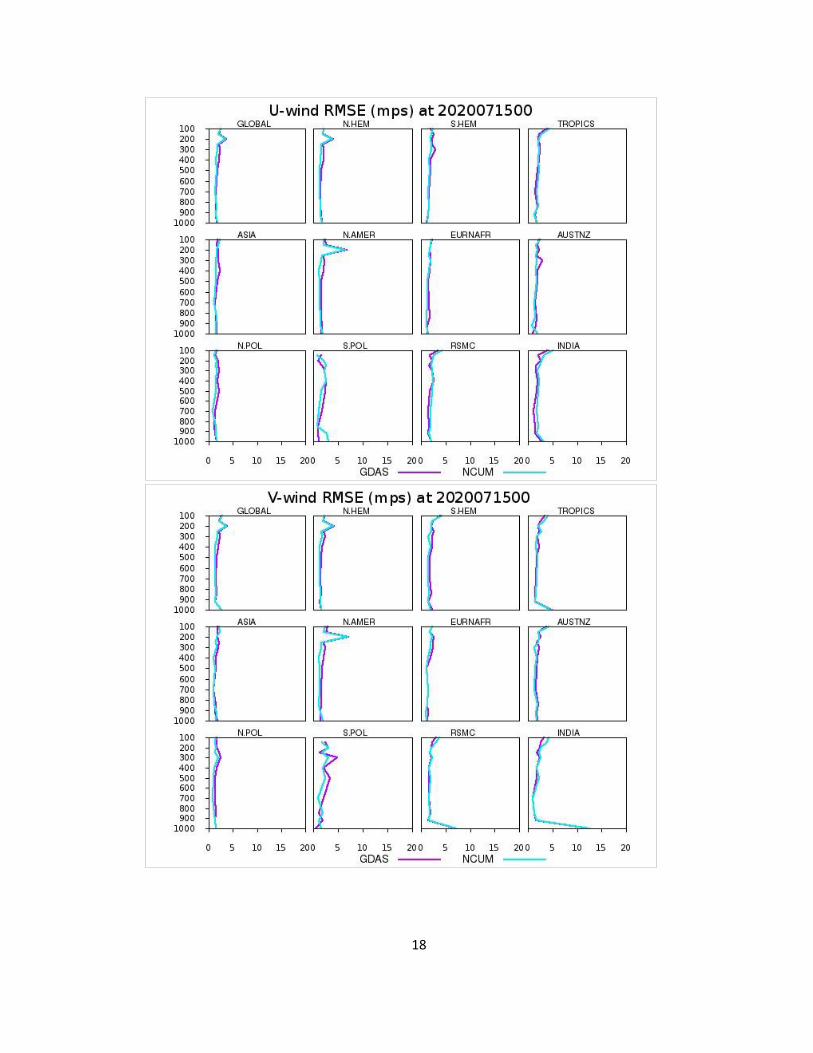
height bias. Figure 2 represents the RMSE of wind, temperature and geopotential height for 00 UTC
15th July 2020. The RMSE in the wind components clearly depicts the lower levels up to 850 hPa
have higher errors than the middle and upper levels, however the GL, NH and NA regions shows
higher RMSE at 200 hPa. In case of meridional wind components, the low level RMSE over TR, RS,
and IN regions is higher than other regions. The temperature RMSE shows higher value in lower and
upper level than the middle level. Similarly, the geopotential wind height has higher RMSE in the
13
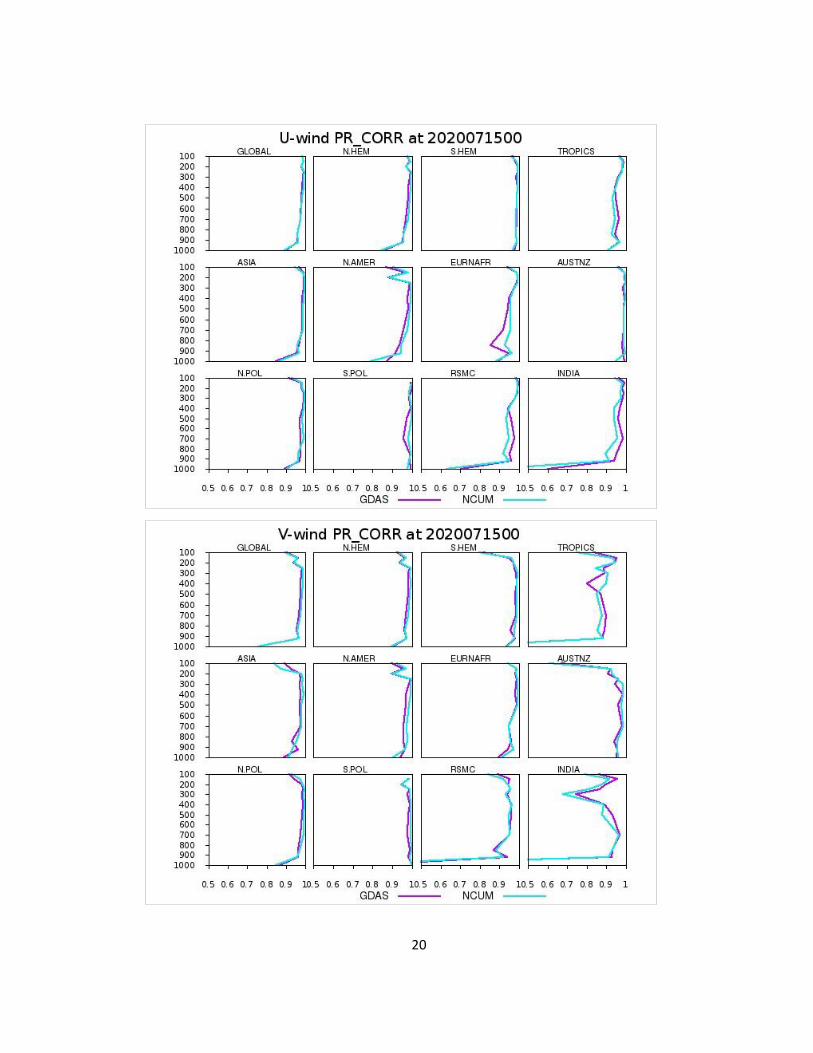
lower levels over SH and SP regions than the other regions. Figure 3 represents the vertical
distribution of Pearson correlation coefficient for wind, temperature and geopotential height for 00
UTC 15th July 2020. Both the analysis presents similar type of results in terms of correlation.
The performance of the analysis is also evaluated in terms of weekly and monthly at 850, 500
and 250 hPa levels. For the weekly charts, last 7 days statistics are generated on each day. This will
be helpful in estimating the performance of analysis for a weekly basis. Apart from this, weekly
statistics will illustrate the behaviour of the analysis for recent couple of days which will be helpful
in modifying the analysis system. Figure 4 shows the weekly statistics of Mean Error, RMSE,
Pearson correlation and anomaly correlation for zonal (u) and meridional (v) wind components at
850 hPa and temperature and geopotential height at 500 hPa over the Global region for 24-30 July
2020. Both the analyses are performing in a similar way except for few exceptions. Figure 5
represents the weekly statistics of Mean Error, RMSE, Pearson correlation and anomaly correlation
for zonal (u) and meridional (v) wind components at 850 hPa and temperature and geopotential
height at 500 hPa over Indian region for 24-30 July 2020. Over Indian region, the GDAS analysis is
found to be slightly better than NCUM-DA analysis during this verification week.
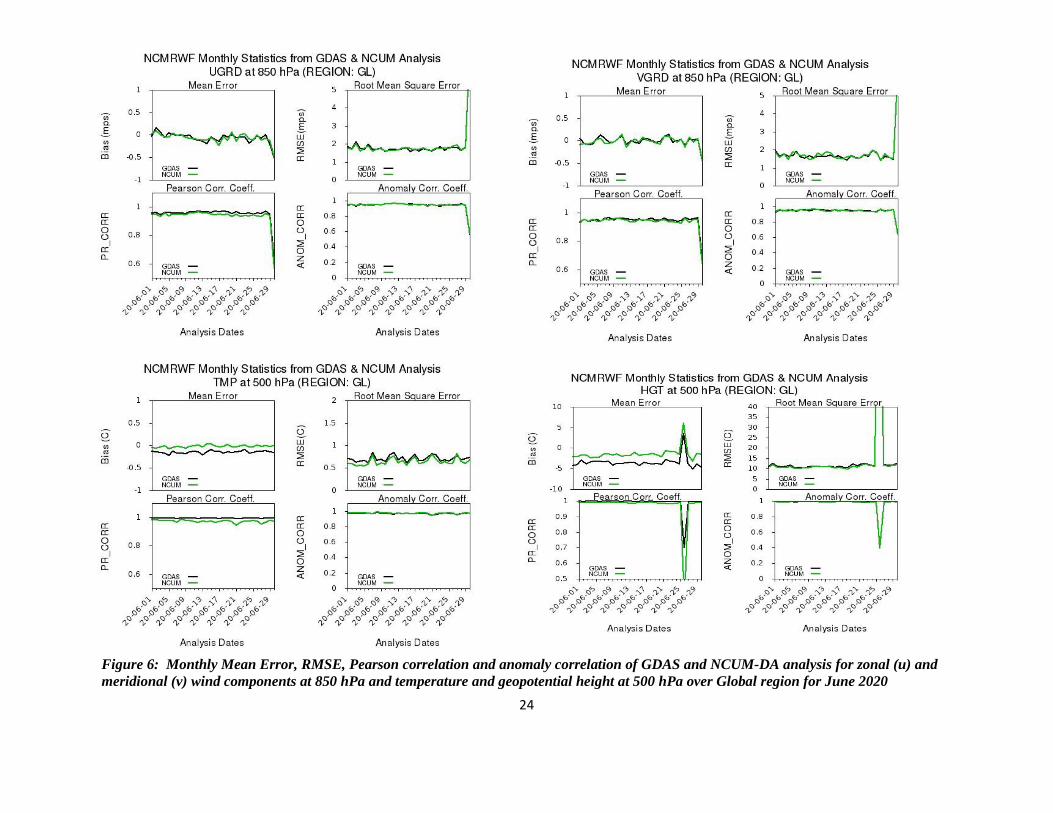
The monthly statistics shown in Figure 6 represents the Mean Error, RMSE, Pearson
correlation coefficient and anomaly correlation for zonal (u) and meridional (v) wind components at
850 hPa and temperature and geopotential height at 500 hPa over Global region for June 2020. Both
the analysis represents more or less in a similar way for all the meteorological parameters except
geopotential height, which exhibit a very sharp increase in bias, RMSE and with less correlation
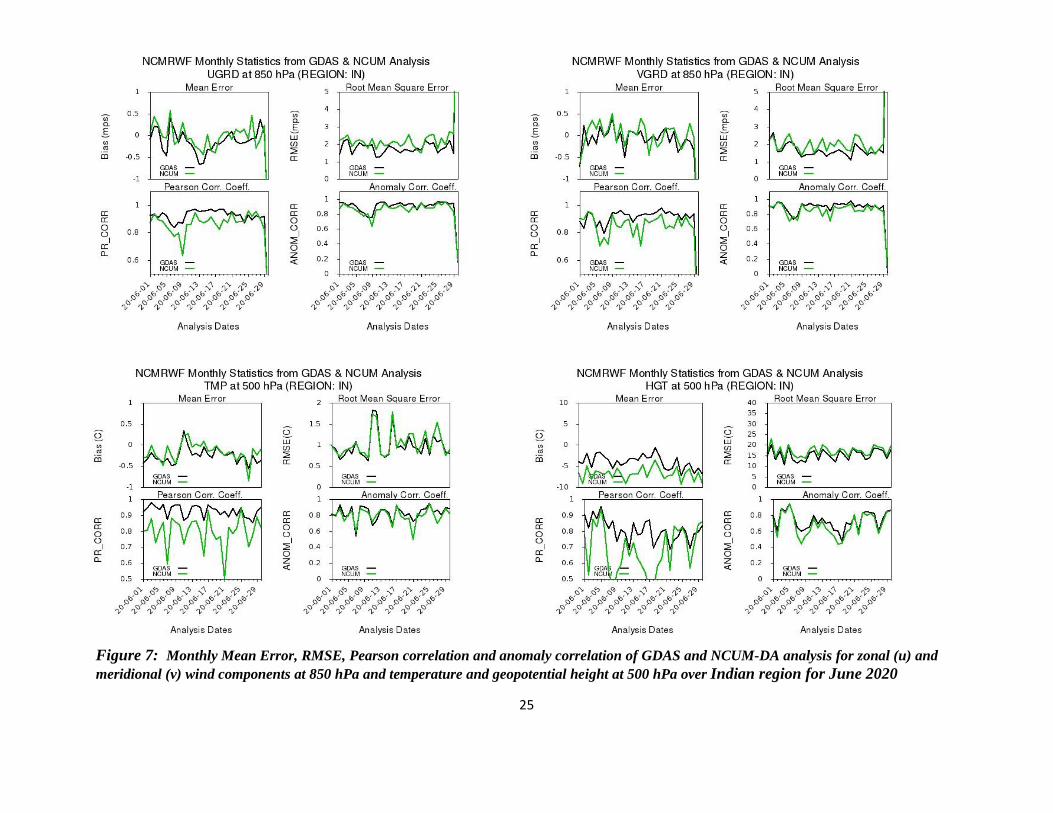
coefficient on 26th June 2020. Figure 7 shows the monthly statistics of Mean Error, RMSE, Pearson
correlation coefficient and anomaly correlation for zonal (u) and meridional (v) wind components at
850 hPa and temperature and geopotential height at 500 hPa over the Indian region. The results
indicate that GDAS analysis has slightly less Mean Error, RMSE and higher correlation compared to
NCUM-DA analysis during June 2020. More results of the verification of the two analyses (GDAS
and NCUM-DA) are available in near real-time on NCMRWF’s internal webpage at
http://192.168.1.100/product_main_ncmrwf_analysis_verification.php
14
6. Conclusions
The performance of the GDAS and NCUM-DA analysis is evaluated over 12 different
regions and the CBS score is computed on daily, weekly and monthly basis over those regions using
Model Evaluation Tool (MET). In addition to the specified regions of ECMWF, WMO Lead Centre
for Deterministic NWP Verification, the scores are computed over three more regions such as global,
RSMC and India. The MET has the capability to validate the model analyses/forecasts with the
gridded or point observations and using this tool some of the important meteorological parameters
are verified. The daily statistics clearly shows similar type of performance for both the analysis. The
weekly and monthly analysis over the global region also presents similar statistics for both GDAS
and NCUM-DA analyses. The weekly and monthly verification over the Indian region shows a
slightly better performance of GDAS analysis during the comparison period. This verification
strategy will also be helpful in inter-comparison of the two analyses with the other operational
centres worldwide. The real-time verification statistics of the two analyses against observations will
be made available in NCMRWF’s webpage (https://www.ncmrwf.gov.in) soon.
References
Buddhi Prakash Jangid, Bushair M. T., S. Indira Rani, Gibies George, Sumit Kumar and John P.
George, 2019: Improved NCUM Observation Pre-Processing System (NOPpS),
NMRF/TR/05/2019, 16p. (https://www.ncmrwf.gov.in/Reports-eng/NOPps_TR_May2019.pdf)
Johny, C.J., Sanjeev Kumar and V.S. Prasad, 2020: Validation and Impact of SCATSAT-1
Scatterometer Winds, Pure Appl. Geophys., 176, 2659–2678. (https://doi.org/10.1007/s00024-
019-02096-5).
Johny, C. J. and V. S. Prasad, 2020: Application of hind cast in identifying extreme events over
India, J. Earth Syst. Sci. (2020) 129:163 (https://doi.org/10.1007/s12040-020-01435-8).
John P George, S. Indira Rani, A. Jayakumar, Saji Mohandas, Swapan Mallick, R. Rakhi, M. N. R.
Sreevathsa and E. N. Rajagopal, 2016: NCUM Data Assimilation System, NMRF/TR/01/2016,
20p. (https://www.ncmrwf.gov.in/NCUM-Data%20Assimilation.pdf)
Kleist, Daryl T., David F. Parrish, John C. Derber, Russ Treadon, Ronald M. Errico and Runhua
Yang, 2009: Improving Incremental Balance in the GSI 3DVAR Analysis System, Mon. Wea.
Rev., 137, 1046-1060. (https://doi.org/10.1175/2008MWR2623.1)
15
Prasad V.S., Saji Mohandas, Munmun Das Gupta, E.N. Rajagopal and Surya Kanti Dutta, 2011:
Implementation of Upgraded Global Forecasting Systems (T382L64 and T574L64) at
NCMRWF, NCMR/TR/5/2011, 76p. (https://www.ncmrwf.gov.in/gfs_report_final.pdf)
Prasad, V. S., Mohandas, S., Dutta, S. K., Das Gupta, M., Iyengar, G. R., Rajagopal, E. N., and
Basu, S., 2014: Improvements in medium range weather forecasting system of India. J. Earth
Syst. Sci., 123(2), 247–258. (https://www.ias.ac.in/article/fulltext/jess/123/02/0247-0258)
Prasad V. S., C. J. Johny, P. Mali, Sanjeev Kumar Singh and E. N. Rajagopal, 2017: Global
retrospective analysis using NGFS for the period 2000–2011, Current Science, 112 (2), 370-
377. (https://www.currentscience.ac.in/Volumes/112/02/0370.pdf)
Rajagopal, E.N., Munmun Das Gupta, Saji Mohandas, V.S. Prasad, John P. George, G. R. Iyengar
and D. Preveen Kumar, 2007: Implementation of T254L64 Global Forecast System at
NCMRWF, NMRF/TR/1/2007, 42p. (https://www.ncmrwf.gov.in/gfs_report_final-t264.pdf)
Sumit Kumar, A. Jayakumar, M. T. Bushair, Buddhi Prakash J., Gibies George, Abhishek Lodh, S.
Indira Rani, Saji Mohandas, John P. George and E. N. Rajagopal, 2018: Implementation of
New High Resolution NCUM Analysis-Forecast System in Mihir HPCS, NMRF/TR/01/2018,
17p. (https://www.ncmrwf.gov.in/NCUM-Report-Aug2018_final.pdf)
Sumit Kumar, M. T. Bushair, Buddhi Prakash J., Abhishek Lodh, Priti Sharma, Gibies George, S.
Indira Rani, John P. George, A. Jayakumar, Saji Mohandas, Sushant Kumar, Kuldeep Sharma,
S. Karunasagar and E. N. Rajagopal, 2020: NCUM Global NWP System: Version 6
(NCUM-G:V6), NMRF/TR/06/2020, 32p. (https://www.ncmrwf.gov.in/New_NCUM-
Implementation_Report)
Wilks, D., 2011: Statistical methods in Atmospheric Sciences, 3rd Edition, Academic Press, ISBN
9780123850225
16
17
Figure 1: Vertical distribution of daily bias of GDAS and NCUM-DA analyses for 00 UTC
15th July 2020 over 12 specific domains of verification
18

19
Figure 2: Vertical distribution of daily RMSE of GDAS and NCUM-DA analyses for
00 UTC 15th July 2020 over 12 specific domains of verification
20
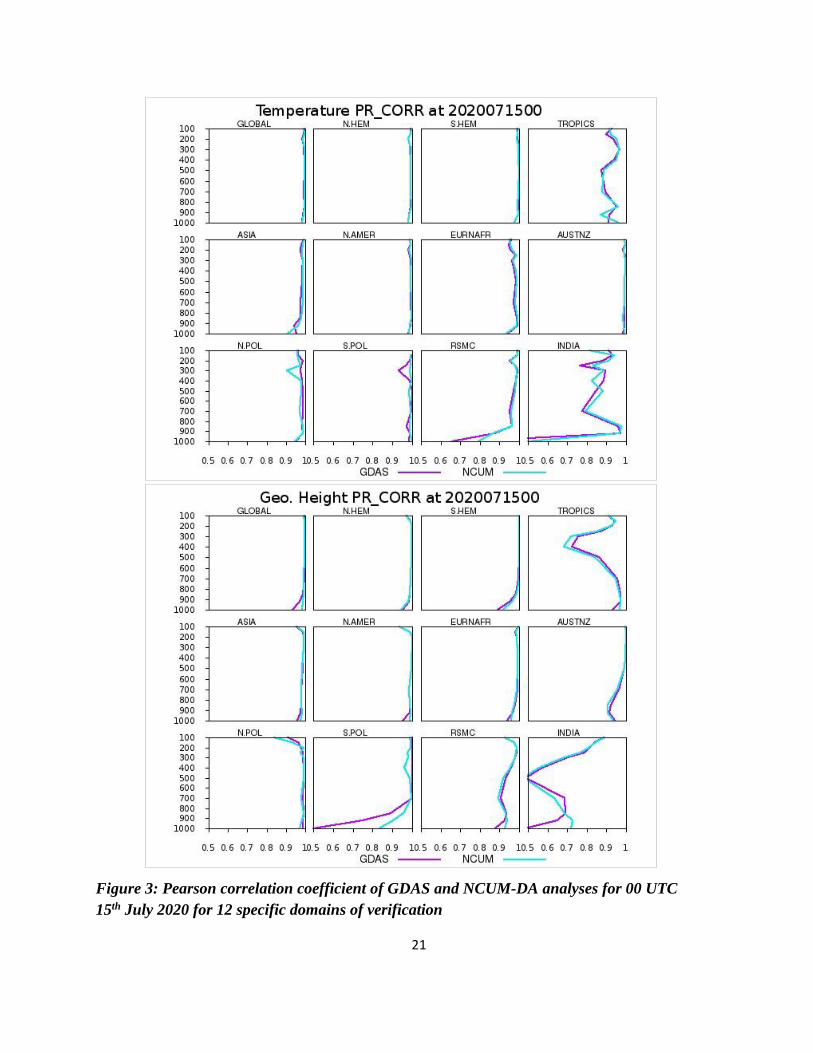
21
Figure 3: Pearson correlation coefficient of GDAS and NCUM-DA analyses for 00 UTC
15th July 2020 for 12 specific domains of verification

22
Figure 4: Weekly Mean Error, RMSE, Pearson correlation and anomaly correlation of GDAS and NCUM-DA analysis for zonal (u) and
meridional (v) wind components at 850 hPa and temperature and geopotential height at 500 hPa over Global region for 24-30 July 2020

23
Figure 5: Weekly Mean Error, RMSE, Pearson correlation and anomaly correlation of GDAS and NCUM-DA analysis for zonal (u) and
meridional (v) wind components at 850 hPa and temperature and geopotential height at 500 hPa over Indian region for 24-30 July 2020
24
Figure 6: Monthly Mean Error, RMSE, Pearson correlation and anomaly correlation of GDAS and NCUM-DA analysis for zonal (u) and
meridional (v) wind components at 850 hPa and temperature and geopotential height at 500 hPa over Global region for June 2020
25
Figure 7: Monthly Mean Error, RMSE, Pearson correlation and anomaly correlation of GDAS and NCUM-DA analysis for zonal (u) and
meridional (v) wind components at 850 hPa and temperature and geopotential height at 500 hPa over Indian region for June 2020
26
Figure 8: Gilbert Skill Score of GDAS and NCUM-DA analyses for temperature at 850 hPa over the specified regions for June 2020
27
National Centre for Medium Range Weather Forecasting
Ministry of Earth Sciences
A-50, Sector-62, Noida-201 309, INDIA
https://www.ncmrwf.gov.in
Related Documents