ORE Open Research Exeter TITLE Verification of a Rapid Mooring and Foundation Design Tool AUTHORS Weller, SD; Hardwick, J; Gomez, S; et al. JOURNAL Proceedings of the Institution of Mechanical Engineers, Part M: Journal of Engineering for the Maritime Environment DEPOSITED IN ORE 23 June 2017 This version available at http://hdl.handle.net/10871/28164 COPYRIGHT AND REUSE Open Research Exeter makes this work available in accordance with publisher policies. A NOTE ON VERSIONS The version presented here may differ from the published version. If citing, you are advised to consult the published version for pagination, volume/issue and date of publication

Welcome message from author
This document is posted to help you gain knowledge. Please leave a comment to let me know what you think about it! Share it to your friends and learn new things together.
Transcript

ORE Open Research Exeter
TITLE
Verification of a Rapid Mooring and Foundation Design Tool
AUTHORS
Weller, SD; Hardwick, J; Gomez, S; et al.
JOURNAL
Proceedings of the Institution of Mechanical Engineers, Part M: Journal of Engineering for the MaritimeEnvironment
DEPOSITED IN ORE
23 June 2017
This version available at
http://hdl.handle.net/10871/28164
COPYRIGHT AND REUSE
Open Research Exeter makes this work available in accordance with publisher policies.
A NOTE ON VERSIONS
The version presented here may differ from the published version. If citing, you are advised to consult the published version for pagination, volume/issue and date ofpublication

Verification of a Rapid Mooring and Foundation Design Tool
S.D. Weller1, J. Hardwick1, S. Gomez2, J. Heath2, R. Jensen2, N. McLean3, L. Johanning1.
1(Renewable Energy, College of Engineering, Mathematics and Physical Sciences), University of Exeter, Penryn Campus, UK 2Sandia National Laboratories, New Mexico, Albuquerque, USA 3Tension Technology International Ltd, Eastbourne, Sussex, UK
Corresponding author
S.D. Weller, Renewable Energy, College of Engineering, Mathematics and Physical Sciences, University of Exeter, Penryn Campus, Penryn, Cornwall UK TR10 9EZ Email: [email protected]
ABSTRACT
Marine Renewable Energy (MRE) devices require mooring and foundation systems that are suitable in
terms of device operation, are robust and also cost effective. In the initial stages of mooring and
foundation development a large number of possible configuration permutations exist. Filtering of
unsuitable designs is possible using information specific to the deployment site (i.e. bathymetry,
environmental conditions) and device (i.e. mooring and/or foundation system role and cable
connection requirements). The identification of a final solution requires detailed analysis, which
includes load cases based on extreme environmental statistics following certification guidance
processes. Static and/or quasi-static modelling of the mooring and/or foundation system serves as an
intermediate design filtering stage enabling dynamic time-domain analysis to be focused on a small
number of potential configurations.
Mooring and foundation design is therefore reliant on logical decision making throughout this stage-
gate process. The open-source DTOcean (Optimal Design Tools for Ocean Energy Arrays) Tool includes
a Mooring and Foundation (MF) module, which automates the configuration selection process for
fixed and floating wave and tidal energy devices. As far as the authors are aware this is one of the first
tools to be developed for the purpose of identifying potential solutions during the initial stages of MRE
design. Whilst the MF module does not replace a full design assessment, it provides in addition to
suitable configuration solutions, assessments in terms of reliability, economics and environmental
impact. This paper provides insight into the solution identification approach used by the module and
features the verification of both the mooring system calculations and the foundation design using
commercial software. Several case studies are investigated; a floating wave energy converter and
several anchoring systems. It is demonstrated that the MF module is able to provide device and/or
site developers with rapid mooring and foundation design solutions to appropriate design criteria.
Keywords
Marine Renewable Energy; DTOcean; Quasi-static analysis; Mooring system; Foundation; Anchor;
Verification;

Introduction
Economies of scale dictate that in order for electricity generation from wave and tidal energy to be
commercially competitive with conventional generation methods, arrays comprising 10s-100s of
devices are required. To-date only a few of array demonstration projects have included open-water
field trials with arrays comprising less than 50 devices, for example Nova Innovation (300kW total;
Shetland, UK), DCNS (1MW total; Paimpol-Bréhat, France), Carnegie Clean Energy (720kW total; Perth,
Australia) and Seabased (1MW total; Sotenäs, Sweden). The rollout of projects with larger generation
capacity is at present limited to arrays of tidal energy devices, for example the MeyGen Phase 1A
project (6MW total; Pentland Firth, Scotland). These, and other projects are motivated by the globally
significant worldwide wave and tidal resource. The UK’s Department for Business, Energy & Industrial
Strategy estimated in 2013 [1] that MRE devices can meet up to 20% of the UK’s current electricity
demand (equivalent to 30-50GW of installed capacity). The marine renewable energy (MRE) industry
is however nascent and there is considerable development needed before it becomes a key player in
the electricity generation mix. In the context of ambitious cost reduction targets (i.e. an overall cost
of energy of £0.07-£0.10/kWh by 2030 [2]) developers are faced with two intrinsically linked
challenges; i) ensuring sufficient device performance over a wide range of conditions and ii) favourable
availability between maintenance intervals. The environmental impact of technologies is also an
important consideration as it is often a requirement of the site consenting process. It is estimated to
cost between €50m to €100m [3] to take a design from concept to a single functional prototype. The
design of hardware (i.e. devices, moorings and/or foundation systems and electrical architecture) and
planning of operations (i.e. installation, decommissioning and maintenance) will therefore have a
direct impact on how long it will take for the project’s CAPEX and OPEX to be recuperated and hence
long-term project economies.
DTOcean Tool Overview
In the early stages of planning arrays of MRE devices, there are a large number of possible design
permutations, which if analysed separately would require significant computational time. Broadly
there are three cross-cutting assessment criteria that can be used to determine the feasibility of
aforementioned design hardware and operations: i) LCoE (Levelised Cost of Energy), ii) reliability and
iii) environmental impact. Under the European Commission 7th Framework ENERGY 2013-1 call the
Optimal Design Tools for Ocean Energy Arrays (DTOcean) project developed a system-level tool for
assessing the three feasibility criteria for the first generation of MRE device arrays. Several key aspects
are analysed by the Tool using integrated modules including; array layout, electrical system
architecture, mooring and foundation systems as well as lifecycle logistics (including array
maintenance and operation), with the modules supported by a customisable database. Coded in the
Python 2.7 programming language and hosted by the European Commission [4], the software and
supporting database are open-source allowing a community of users to use and/or adapt the source
code for their own requirements. Whilst this is not the first piece of software that has been developed
for mooring design (e.g. OPTIMOOR [5]) or array planning (e.g. SI-Ocean [6]), as far as the authors are
aware it is the first integrated design tool that: i) captures several key aspects of MRE array design, ii)
includes a database which is customisable and iii) is open-source. It is the objective of this paper to
report results of verification comparisons between the MF module and mooring analysis (Orcaflex [7])
and finite element software (CUBIT [8] and Sierra/SM [9]) software programs.

Figure 1. Dataflow through the DTOcean Tool.
At the centre of the Tool architecture is a Core which links the modules, database and graphical user
interface (GUI). A schematic is displayed in Figure 1 with respect to the mooring and foundation (MF)
module, which is the focus of the following sections.
Mooring and Foundation (MF) Design Module
The MF module is designed as a preliminary analysis and precursor to more detailed, fully dynamic
simulations carried out using commercial systems-based software packages or bespoke codes. The
purpose of the DTOcean MF module is to perform static and quasi-static analysis to develop mooring
and foundation solutions that:
are suitable for a given site, the MRE device (and substation), and expected loading conditions;
retain the integrity of the electrical umbilical that connects the MRE device to the subsea cable
(floating devices);
are spatially compatible with the array layout;
where practicable fulfil the requirements and/or constraints determined by the user and/or
in terms of reliability and/or environmental concerns; and
have the lowest capital cost.
Module methodology
The MF module is designed to have a modular structure. This increases speed and reduces the
computing power needed as not all scenarios will require every part of the module to be used [10],
e.g. if the user has already identified a mooring system then the foundation sub-module can be used
to focus just on the anchoring system design. For a more detailed explanation of the MF module
structure and processing stages the reader is directed to the Technical Manual [11].
It is understood by the authors that dynamic coupling between mooring and wave loads on a moored
vessel or device can have an impact on both the maximum device excursions and maximum line loads
particularly if dynamic amplification of the moored device motion response is significant. This is
accounted for, to an extent, in conventional quasi-static analysis by solution of the equation of motion
in the frequency domain for first- and second order-wave loads but not in the MF mooring module
calculations described.
These limitations are a consequence given through the objectives from the DTOcean Tool
development, which were primarily focused on the LCoE prediction of array installations, and with
specific requirements towards analysis speed. It is not claimed that the MF module provides full
capabilities of typical quasi-static analysis approaches (e.g. [12]). Hence the presented comparison is

essentially intended to inform users about possible implications related to outputs in comparison to
industry quasi-static analysis tools, and how the MF module predictions should be used in context of
a comprehensive engineering mooring design approach.
Figure 2. Simplified dataflow within the MF module.
Figure 2 presents a graphical representation of the dataflow through the MF module. Referring to the
number labels in this figure, the following calculation stages are used:
1. The complexity of designing a mooring and foundation system means that there are
potentially a large number of input variables required in order conduct mooring analysis. To
reduce these, the MF module database contains default values for certain variables that can
be overwritten by the user if information is known. Some of these variables are used
throughout the DTOcean suite (e.g. site bathymetry, certain device parameters) whereas
others are specific to the MF module (e.g. seafloor soil conditions). The variables can be
broadly defined by four categories:
Device variables: e.g. device dimensions, profile, locations of fairlead points (floating
devices), centre of gravity, first-order wave excitation transfer functions

Environmental variables: e.g. current speed, wave parameters, wind speed
Seafloor variables: e.g. bathymetry, soil type, friction coefficients
User defined parameters: e.g. maximum allowed displacement, pre-defined mooring
or foundation constraints
2. The Loads submodule uses input parameters to first check that all devices are positioned
within the bathymetry grid and then determines the environmental loads applied to the
device and, if relevant, the support structure. If first-order wave forces are provided either
from the DTOcean hydrodynamics module or by the user (i.e. from WAMIT/NEMOH analysis)
then these forces are combined with the current (1/7th power law or uniform profile) and wind
forces to produce the total applied loads on the device. If load coefficients are not provided
then, depending on the device dimensions and wave conditions, the loads are calculated using
either a diffraction theory approximation and a F-K force coefficient approach [13, 14, 15, 16,
17, 18, 19] or by solving the Morison equation [20, 21, 13]. Depending on the device operation,
mean drift is estimated using several approaches; fixed vertical cylinders [22], floating vertical
cylinders [23] and fixed/floating cuboids [24]. Coefficients for drag and added mass are taken
from several sources [25, 26]. Warnings are displayed if the calculations involve parameters
outside of the range applicable to the theories or experimental data used.
3. For floating devices the Mooring submodule is used to select components from the DTOcean
(or other user provided) database and then calculate mooring line tensions (using an approach
similar to that reported by Masciola [27]) to determine if the assembled mooring system is
suitable for the loads applied to the device. Both catenary and taut mooring systems can be
analysed by the MF module. The device equilibrium position is calculated by adjusting the
displacement of the device until the translational (X, Y and Z) force balance is achieved. If the
calculated line tensions are below the minimum break load (MBL) of the components
(including specified factors of safety; FOS [12]) and the final position is within the user
specified excursion limits then the mooring system is deemed to be acceptable. If either of
these conditions is violated in either the Ultimate Limit State (ULS) or the Accident Limit State
(ALS; with one line removed) then one or more new components are selected and the process
is repeated. If no suitable configuration can be found using components in the program’s
database then the Tool will increase the number of mooring lines and restart the calculation
process.
4. A critical part of a floating MRE device is the power cable or umbilical. Within the Umbilical
submodule a lazy-wave geometry is defined, and tensions and bend radii are determined
based on the position of the device during ULS from the Mooring submodule. Checks are
carried out within the submodule to ensure that the calculated tensions do not exceed the
specified MBL of the umbilical and the minimum bend radius limit is not violated. Once these
checks are passed details regarding the umbilical length and required flotation are output.
5. For floating devices the loads on the anchors are an output of the mooring design calculations
whereas for fixed devices the foundation loads are calculated from the forces applied to the
device and support structure. Depending on user-defined criteria, seabed bathymetry and
geotechnics as well as device characteristics the module will select one or more
anchor/foundation types from the following list: drag embedment, direct embedment,
gravity-based, piles, suction caissons and shallow foundations. The design of the foundation
is determined from a series of analytical calculations to ensure that the holding capacity is
sufficient to support the expected loads [28, 29, 30, 31, 32, 33]. If more than one type of
foundation is suitable then the lowest cost solution is identified. The user is given the option
of forcing the tool to produce uniform foundations or allowing multiple types across the array.

6. MRE device arrays, like farms of offshore wind turbines, typically have one or more
substations to transfer power back to the shore. This equipment also requires a foundation
and two types are covered by the MF module; piles for above surface substations and gravity
foundations for subsea systems. Instead of repeating code in the MF module, the Substation
submodule calls the relevant functions within the Foundation submodule.
7. The outputs of the MF module are collated by the Core for use by the other modules and/or
are displayed to the User.
Verification using Test Scenarios
As part of the DTOcean Tool development process the outputs of the MF module were verified using
commercial software (mooring systems; Orcaflex and foundation systems; CUBIT and Sierra/SM).
Example results are presented in the following subsections and for further information the reader is
directed to DTOcean Deliverable 7.3 [34]. An overview of the verification process is provided in Figure
3.
Figure 3: The verification process summarised for (left) floating and (right) fixed device scenarios.
Numerical verification of mooring systems
To carry out basic verification of the DTOcean MF module calculations, the module was used to design
moorings for a floating cylinder, referred to as the ‘bean can model’ (Table 1), representing a floating
wave energy converter subjected to the five scenarios listed in Table 2. Selected load cases and
environmental condition parameters: Hm0 (significant wave height), Tp (peak period) and Dir
(direction).Table 2. These scenarios were selected from a list of 50 based on design environmental
conditions at potential Shetland farm sites and possible mooring configurations (e.g. mooring systems
with specific footprints and either catenary chain or taut polyester lines).

After running the DTOcean MF module calculations for each scenario, a static verification of the
calculated device position and mooring line tension was performed by taking the total environmental
load calculated by MF Loads submodule and identified mooring system and replicating the static
analysis in Orcaflex for both the ULS and ALS scenarios. Comparison of the device excursion and line
tensions estimated by Orcaflex and the MF module for each scenario for the ULS and ALS events are
tabulated in Table 3.
The ‘Bean can’ Model Floating Cylinder
Height [m] 14.43
Diameter [m] 9.42
Mass [kg] 628557.5
Displacement at equilibrium [m^3] 613.23 (without mooring lines)
Surface Roughness 0.009 Table 1. Parameters of the 'bean can' WEC model.
Sce
nar
io
Wave (Direction from) Current (Direction to)
Wind (Direction from)
Water depth (m)
|x|=|y| (m)
Mooring system type Hm0
(m) Tp (s)
Dir (°N)
γ (-) Speed (m/s)
Dir (°N)
Speed (m/s)
Dir (°N)
1 13 14.8 90 3.3 0.7 135 39.8 120 100 188.573 Catenary Chain
2 13 14.8 90 3.3 0.7 135 39.8 120 100 364.221 Taut Polyester
3 13 14.8 90 3.3 0.7 135 39.8 120 50 196.687 Catenary Chain
4 13 14.8 90 3.3 0.7 135 39.8 120 50 233.648 Taut Polyester
5 10.48 14.8 90 3.3 0.7 135 39.8 120 25 124.509 Taut Polyester
Table 2. Selected load cases and environmental condition parameters: Hm0 (significant wave height), Tp (peak period) and Dir (direction).

Table 3. Parameters of mooring system designed by the DTOcean MF module. The symbol * denotes line lengths in the range of 290.48 - 299.34 m.
Case 1 2 3 4 5
Limit State ULS ALS ULS ALS ULS ALS ULS ALS ULS ALS
Number of Lines 4 4 4 4 7 7 4 4 4 4
Line Length (m) 320.76 320.76 518.9 518.9 * * 328.69 328.69 172.48 172.48
Line weight per unit length (N/m)
1411.5 1411.5 183.84 183.84 1412.5 1412.5 234.06 234.06 263.61 263.61
Axial Stiffness at equilibrium position (kN)
662811 662811 37088 37088 662826 662826 38807 38807 37981 37981
DTOcean Module Results
Equilibrium Position (m)
X 0.13 0.13 0.12 127.01 0.22 12.92 0.62 75.9 0.37 41.48
Y 53.8 53.8 49.53 140.5 15.72 -1.74 17.87 85.17 9.47 39.46
Z 5.71 5.71 4.95 5.07 5.58 5.84 4.96 5.21 5.4 5.92
Line Tension (kN) 1 134.49 133.03 6.6 3.1 78.1 132.17 16.23 4.35 14.03 28.97
2 134.61 2285.2 6.64 584.21 116.41 119.64 17.89 1743.4 15.86 2215.9
3 1471.6 4060 1418.2 3310.6 179.51 86.27 1721.8 4069.2 1864.5 5636.5
4 1557.1 N/A 1493.1 N/A 1403.7 3720.6 1797.8 N/A 1952 N/A
5 1523.2 N/A
6 185.54 462.26
7 118.26 1423.1
Orcaflex Results
Equilibrium Position (m)
X 0.16 106.94 2.06 162.2 -0.59 7.00 0.47 73.84 0.29 39.78
Y 58 111.61 76.35 192.82 17.77 21.98 14.04 85.16 8.02 45.96
Z -5.65 -4.98 -5.01 -5.11 -5.74 -5.36 -4.92 -5.01 -5.11 -5.06
Line Tension (kN) 1 145.86 157.53 24.96 21.42 181.89 177.13 35.63 12.38 11.21 4.96
2 146.01 792.05 26.6 987.23 80.59 64.97 39.1 1923.6 13.08 2019.8
3 1442.3 2545 1385.4 2624.7 261.81 223.50 1747.2 3777 1860.1 4030.6
4 1522.5 N/A 1450 N/A 1683.15 2672.19 1821.9 N/A 1948.4 N/A
5 1398.07 N/A
6 318.71 1176.65
7 203.72 214.69

Figure 4. Comparison between static solutions from the MF module (red lines/bars) and Orcaflex (blue lines/bars) for Scenarios 1, 2, 4 and 5 a) ULS and b) ALS scenarios. c) Comparison for Scenario 3. Note: scaling on each y-axis.
The MF module successfully provided a mooring and foundation solution for all five scenarios. For
Scenario 1, 2, 4 and 5 an acceptable mooring configuration was identified using four lines
configuration identified as module input. For Scenario 3 however no four line solution was available
(a)
(b)
(c)
and the module determined that this particular scenario required a configuration with seven mooring
lines. The solutions provided by the module can be seen in Table 3 with comparisons made to Orcaflex
static simulations in Figure 4.
Numerical verification of foundation-anchor systems
Verification of foundation-anchor algorithms of the MF module was performed using finite element
analysis (FEA). The algorithms were based on analytical solutions from references [28, 29, 30, 31].
Since the purpose of the DTOcean Tool is to provide scoping estimates of cost, the main goal of the
foundation-anchor algorithms is to determine reasonable designs for cost estimation. The FEA is
intended to verify that the designs are adequate to support specified load requirements. The FEA
procedure focuses on worst case loading scenarios for suction caisson, direct embedment foundation-
anchor, pile foundation-anchor, and shallow gravity foundation-anchor designs produced by MF
module. To investigate foundation-anchor response as function of seafloor geomaterials, the
foundation-anchors are assumed to be emplaced in various sediments or rock, including soft clay,
dense sand, loose sand, and hard rock.
Model development for the FEA was created using output from the MF module, which provided soil
(used as a general term to refer to seafloor sediments or rock) and foundation-anchor system material
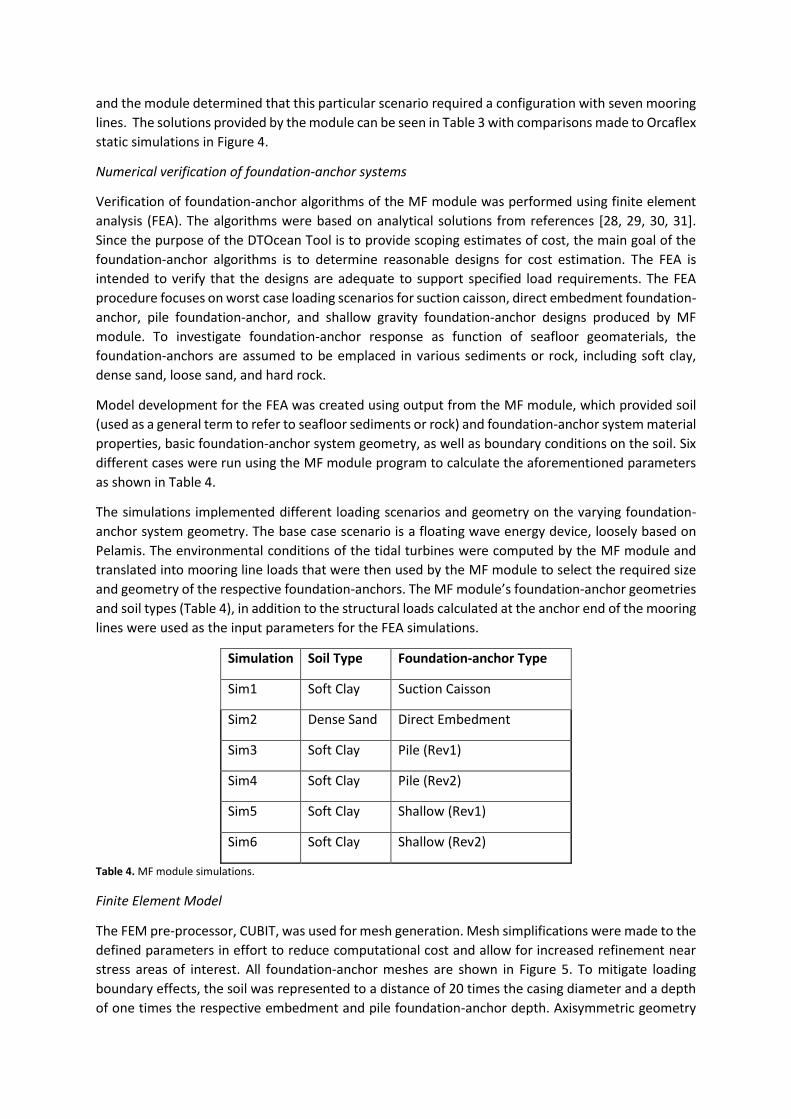
properties, basic foundation-anchor system geometry, as well as boundary conditions on the soil. Six
different cases were run using the MF module program to calculate the aforementioned parameters
as shown in Table 4.
The simulations implemented different loading scenarios and geometry on the varying foundation-
anchor system geometry. The base case scenario is a floating wave energy device, loosely based on
Pelamis. The environmental conditions of the tidal turbines were computed by the MF module and
translated into mooring line loads that were then used by the MF module to select the required size
and geometry of the respective foundation-anchors. The MF module’s foundation-anchor geometries
and soil types (Table 4), in addition to the structural loads calculated at the anchor end of the mooring
lines were used as the input parameters for the FEA simulations.
Simulation Soil Type Foundation-anchor Type
Sim1 Soft Clay Suction Caisson
Sim2 Dense Sand Direct Embedment
Sim3 Soft Clay Pile (Rev1)
Sim4 Soft Clay Pile (Rev2)
Sim5 Soft Clay Shallow (Rev1)
Sim6 Soft Clay Shallow (Rev2)
Table 4. MF module simulations.
Finite Element Model
The FEM pre-processor, CUBIT, was used for mesh generation. Mesh simplifications were made to the
defined parameters in effort to reduce computational cost and allow for increased refinement near
stress areas of interest. All foundation-anchor meshes are shown in Figure 5. To mitigate loading
boundary effects, the soil was represented to a distance of 20 times the casing diameter and a depth
of one times the respective embedment and pile foundation-anchor depth. Axisymmetric geometry

was implemented to reduce computational cost. The material model used for the soil is the Soil and
Crushable Foam material model, which was originally formulated by Krieg [35] and is currently
implemented in Sierra/SM, based on PRONTO 3D [36].
Figure 5. Full mesh of the suction caisson configuration shown in (a) isometric view, (b) load location of the representative
caisson pad eye, (c) full mesh of the direct embedment foundation-anchor configuration shown in isometric view, (d) load
location of the representative foundation-anchor plate pad eye, (e) full hex mesh of the shallow gravity foundation
configuration shown in isometric view, (f) load location of the representative foundation-anchor pad eye, (g) full mesh of the
pile foundation-anchor design configuration shown in isometric view, and (h) load location of the representative pile pad
eye.
Model parameters. The foundation-anchor system design parameters used in the FEA are shown in
Table 5 - Table 8. The embedment foundation-anchor and shallow gravity foundation-anchor pad eyes
were located in the middle of the foundation-anchor plate, axisymmetric across the cross-section.
(a) (b)
(c) (d)
(e) (f)
(g) (h)

Definition Units Value: Sim1
Caisson diameter m 5 x 3.5
Caisson length m 7.925 x 5.5
Caisson thickness m 0.0254 x 0.06
Padeye load N 1.353111E+6
Angle Degrees 0
Pad eye location m 5.5
Relative soil depth m 120
Overburden pressure Pa 1.177E+6
Pad eye foundation-anchor length m 0.305
Pad eye foundation-anchor width m 0.305 Table 5. Suction caisson design parameters.
Definition Units Value: Sim2
Plate width m 2
Plate length m 3.5
Plate thickness m 0.1
Pad eye load N 1.353E+6
Angle Degrees 90
Embedded depth m 8.625
Relative soil depth m 120
Overburden pressure Pa 1.177E+6
Pad eye foundation-anchor length m 1.44
Pad eye foundation-anchor width m 0.61 Table 6. Embedded foundation-anchor design parameters.
Definition Units Value: Sim3 Value: Sim4
Horizontal Load (x) N -1,088,723 3,977,200
Horizontal Load (y) N -924,297 -1,387,872
Vertical Load (z) N 205,506 965,273
Pile Diameter m 3.00 3.50
Pile Grout Diameter m 0 0
Pile Length m 6 32
Pile Thickness m 0.06 0.06
Overburden pressure Pa 1.177E+6 1.177E+6 Table 7. Pile foundation-anchor design parameters.
Definition Units Value: Sim5 Value: Sim6
Horizontal Load (x) N -1,088,723 3,977,200
Horizontal Load (y) N -924,297 -1,387,872
Vertical Load (z) N 205,506 965,273
Foundation-anchor Width m 12.33 18.76
Foundation-anchor Length m 12.33 18.76
Foundation-anchor Height m 0.65 1.07
Embedment Depth m 1.23 1.88
Overburden pressure Pa 1.177E+6 1.177E+6
Pad eye anchor length m 0.305 0.305
Pad eye anchor width m 0.305 0.305 Table 8. Shallow gravity foundation-anchor design parameters.

The material properties used to parameterize the FEA model are shown in Table 9. A0, A1, and A2, are
material constants and the coefficients of the polynomial that relates the mean pressure to the yield
stress in the soil and crushable foam constitutive model. Specifically, A0 defines the soil cohesion and
A1 is the slope of the line that defines the conical yield surface when A2 is set to zero. All foundation-
anchor systems utilized soil properties as shown in Table 4 with identical steel properties.
Definition Units Soft Clay Dense sand Steel
Density kg
m3
1,762 2,163 7,860
Young Modulus Pa 13.41E+6 65E+6 1.999E+11
Poisson’s Ratio - 0.45 0.35 0.3
A0 Pa 35910 0 -
A1 Degrees 0 38.5 -
A2 Degrees 0 0 -
Yield Stress Pa - - 427.7E+6
Table 9. Material model parameters.
Loading and boundary conditions. The simulation approach implemented the loadings described in
the model dimensions and loading levels denoted in Table 5 - Table 8. All foundation-anchor systems
applied the pad eye load evenly distributed across pad eye foundation-anchor. This was accomplished
by dividing the prescribed load across the respective node surface of the pad eye. The soil mass
bottom faces were fixed in the vertical direction, the front cross section faces were fixed normal to
their surfaces, and the outer circumferential surfaces of the soil mass were allowed to move only in
the vertical orientation. Sierra/SM [6] explicit quasi-static mode solver was utilized for these
simulations. A uniform seafloor friction coefficient of 0.5 was implemented in the design studies.
Foundation-anchor verification results. Contour plots of Von Mises stress, Equivalent Plastic Strain
(EQPS), and maximum volumetric strain are shown in Figure 6 for the shallow gravity foundation-
anchor Sim6 design. Non-magnified displacements are shown in this figure. The shallow gravity
foundation-anchor results show Von Mises stress of 36 kPa uniformly distributed across the soil
volume principally due to the overburden pressure and a significant stress relief on the bottom left of
the foundation-anchor load application; a change due to the altered horizontal and vertical load
resultant vector. Localized plastic strain is present at the foundation-anchor corners, reaching
approximately 1.0 EQPS and averaging approximately 0.5 EQPS in nearby surrounding soft clay
bordering the foundation-anchor. The EQPS quickly dissipates to zero around the outer surrounding
clay mass. Maximum compressive volumetric strain for the foundation-anchor design reaches 0.03
and occurs in the surrounding foundation-anchor soil. The summarized results for the other five
foundation-anchor simulations can be found in the DTOcean report D7.3 [34]. Plastic strain was
observed in localized locations around the immediate volume across all foundation-anchor designs.
To compare and summarize performance results across all foundation-anchor simulations, an EQPS
ratio of the immediate effected soil volume was taken to that of upper half of the domain modelled,
as shown in Figure 5. This metric was used to illuminate the areas of high strain. To determine the
proportion of high strain to the overall volume, a ratio metric was used. This metric gives visual and
numeric insight into the level of localized strain near the respective foundation, in addition to the rate
at which the high strain diminishes in the surrounding volume. As shown in Table 10, all ratios of the
effected volume were less than 1 percent to the upper half of the domain, a conservative estimate
when compared to the entire domain. A lower threshold value of 0.05 was chosen (except for Sim2

with 0.001), where overburden pressure alone in foundation-anchor scenarios caused strain
exceeding 0.2.
Figure 6. Von Mises stress (Pa) shown in (a) front view (b) plan view and (c) sliced midway through the shallow gravity
foundation-anchor Sim6. EQPS shown in (d) front view (e) plan view and (f) sliced midway through the shallow gravity
foundation-anchor Sim6. Maximum volumetric strain shown in (g) front view (h) plan view and (i) sliced midway through the
shallow gravity foundation-anchor Sim6.
(a) (d)
(b) (e)
(c) (f)
(g) (h)
(i)

Simulation Soil
type
Foundation-
anchor type Threshold EQPS ≥ 0.05*
Ratio of threshold
volume with upper
half of formation
volume (%)
Sim1 Soft
Clay
Suction
Caisson
0.303
Sim2 Dense
Sand
Direct
Embedment
(*at 0.001)
0.034
Sim3 Soft
Clay
Pile
(Rev1)
0.376
Sim4 Soft
Clay
Pile
(Rev2)
0.470

Sim5 Soft
Clay
Shallow
(Rev1)
0.942
Sim6 Soft
Clay
Shallow
(Rev2)
0.985
Table 10. Foundation-anchor immediate volume threshold.
Discussion
Moorings
Utilising the total environmental loads calculated by the MF module the static analysis produced
solutions that were assessed using Orcaflex for both device excursion and fairlead line tensions for
ULS and ALS scenarios.
Good agreement (< 10% line tensions) is noted between the Orcaflex and module results for the
highest loaded line in each of the ULS scenarios (Table 3 and Figure 4). This line was removed for ALS
analysis, transferring its load to the other lines. For most of the analysed scenarios a similar level of
good agreement is noted for the most loaded lines. While large percentage differences are noted for
slack and semi-taut lines in both ULS and ALS scenarios, the differences in terms of absolute tension
are of a similar magnitude to the maximum loaded line. Agreement is generally poor for very low line
tensions and this is due to the different calculation methods used by Orcaflex and the mooring
module. Orcaflex uses a lumped-mass method [37] where the line is able to deform in three
dimensions. The catenary equations used by the mooring module assume that the line stays on a two-
dimensional plane between the fairlead and foundation, hence when a line is slack it is possible that
the line will have a different geometry, a different length of line resting on the seafloor and therefore
a different line tension. Closer agreement for all line tensions would of course be preferable. However
as a high level design tool (and precursor to detailed dynamic analysis following recommended
practices e.g. [12]), the module satisfies the requirement to adequately estimate the highest design
loads as these represent the largest forces expected from extreme environmental conditions at the
site.
Foundations
The suction caisson, direct embedment foundation-anchor, shallow gravity foundation-anchor and
pile foundation-anchor designs show localized stress and strain under the prescribed loading
conditions, but the respective dense sand soil and soft clay soil masses do not fail throughout the soil
volume. The proposed designs provide adequate foundation-anchor systems for the respective load

scenarios proposed. This analysis demonstrates that the simplified solutions given by the MF module
provide an adequate design for estimating costs and performing a relative cost analysis. Neither the
solutions generated by the MF module nor the verification work done by the FEA’s are intended as a
final design. To obtain a finalized design, a more extensive FEA would need to be performed using
better material models and higher certainty of material model parameters that are based on actual
field data.
Conclusions
The DTOcean Tool is a system-level software package which can be used to carry out high-level scoping
studies of MRE device arrays encompassing several key design aspects and able to determine the
feasibility of identified solutions in terms of project economics, system reliability and environmental
impact. The MF module is one of the integrated Tool modules which can be used to identify potential
mooring and/or foundation systems for a given set of user-defined parameters relating to the site,
device(s) and role of the mooring and/or foundation system. This paper has introduced the
functionality of the MF module and provide insight into the process of verifying module outputs with
relevant commercial software. The module has demonstrated an acceptable level of accuracy in the
context of the basic mooring and foundation load analysis necessary for the initial design identification
as a forerunner to more detailed analysis.
Acknowledgements
S.D. Weller, J. Hardwick, N. Mclean and L. Johanning were funded from the European Community's
Seventh Framework Programme for DTOcean Project, Grant agreement number: 608597.
S. Gomez, J. Heath, R. Jensen, and J. Roberts were funded by the Department of Energy’s (DOE) Energy
Efficiency and Renewable Energy (EERE) Program’s Wind and Water Power Technologies Office.
Sandia National Laboratories is a multi-program laboratory managed and operated by Sandia
Corporation, a wholly owned subsidiary of Lockheed Martin Corporation, for the U.S. Department of
Energy's National Nuclear Security Administration under contract DE-AC04-94AL85000. SAND
Number: 2013-6867 C
References
[1] Department for Business, Energy & Industrial Strategy, UK Government. Wave and tidal
energy: part of the UK's energy mix; 2013.
[2] Energy Technologies Institute. Wave Energy. Insights from the Energy Technologies Institute;
2015.
[3] Ocean Energy Forum. Ocean Energy Strategic Roadmap. Building Ocean Energy for Europe;
2016.
[4] European Commission. DTOcean Optimal Design Tools for Ocean Energy Arrays [Internet].
Strategic Energy Technologies Information System [cited 15-01-2017]. Available from:
https://setis.ec.europa.eu/dt-ocean/
[5] Tension Technology International. OPTIMOOR Mooring Analysis Software for Ships & Barges
[Internet]. Tension Technology International [cited 24-03-2017]. Available from:
https://www.tensiontech.com/_app_/resources/documents/www.tensiontech.com/TN01_Optimoo
r.pdf

[6] DHI. SI-Ocean Tidal & Wave Energy map [Internet]. DHI [cited: 24-03-2017]. Available from:
http://si-ocean.dhigroup.com/map.
[7] Orcina. OrcaFlex [Internet]. Orcina [cited: 01-12-2016]. Available from:
https://www.orcina.com/SoftwareProducts/OrcaFlex/index.php
[8] Blacker T, Owen SJ, Staten ML et al. CUBIT Geometry and Mesh Generation Toolkit 15.2 User
Documentation. SAND Report 2016-1649 R. Sandia National Laboratories, Albuquerque, NM and
Livermore; 2016.
[9] SIERRA Solid Mechanics Team. Sierra/SolidMechanics 4.40 User’s Guide. SAND Report 2016-
2707. Sandia National Laboratories, Albuquerque, NM and Livermore, CA; 2016.
[10] DTOcean. DTOcean User Manual (Release); 2016.
[11] DTOcean. DTOcean Technical Manual (Release); 2016.
[12] Det Norske Veritas. Position Mooring: DNV-OS-E301; 2015.
[13] Chakrabarti S. Handbook of Offshore Engineering. Oxford, UK: Elsevier; 2005.
[14] Hogben N and Standing RG. Wave loads on large bodies. International Symposium of
Dynamic Marine Vehicle Structures in Water; London, UK; 1974.
[15] Wilson JF. Dynamics of Offshore Structures. Hoboken, USA: John Wiley & Sons, Inc; 2003.
[16] McCamy R and Fuchs R. Wave forces on piles: a diffraction theory. Tech. Memo No. 69. U.S.
Army Corps of Engrs; 1954.
[17] Oortmerssen V. The Interaction between a Vertical Cylinder and Regular Waves. Symposium
on Offshore Hydrodynamics; Wageningen, Netherlands; 1971.
[18] McCormick ME. Ocean Engineering Mechanics: With Applications. Cambridge, UK:
Cambridge University Press; 2010.
[19] McCormick ME and Cerquetti J. Alternative Wave-Induced Force and Moment Expressions
for a Fixed, Vertical, Truncated, Circular Cylinder in Waters of Finite Depth. 23rd International
Conference on Offshore Mechanics and Arctic Engineering; Vancouver, Canada; 2004.
[20] Journée JMJ and Massie WW. Offshore Hydromechanics. Delft, Netherlands; Delft University
of Technology; 2001.
[21] Faltinsen OM. Sea loads on ships and offshore structures. Cambridge, UK; Cambridge
University Press; 1990.
[22] McIver P. Mean drift forces on arrays of bodies due to incident long waves. Journal of Fluid
Mechanics. 1987; 185: 469-482.
[23] Eatock Taylor R, Hu CS and Nielsen FG. Mean drift forces on a slowly advancing vertical
cylinder in long waves. Applied Ocean Research. 1990; 12 (3): 141-152.
[24] Remery GFM and Hermans AJ. The slow drift oscillations of a moored object in random seas.
Journal of the Society of Petroleum Engineering 1972; 12: 191-199.
[25] Det Norske Veritas. Environmental Conditions and Environmental Loads: DNV-RP-C205;
2014.

[26] EDSU. Fluid forces, pressures and moments on rectangular blocks: ESDU 71016; 1978.
[27] Masciola MD .Instructional and Theory Guide to the Mooring Analysis Program. Phase I: The
Multi–Segmented Quasi-Static Model; 2013.
[28] Thompson D and Beasley DJ. SP-2209-OCN Handbook for Marine Geotechnical Engineering.
Naval Facilities Engineering Command Port, Hueneme, CA; 2012.
[29] Taiebat HA and Carter JP. Interaction of forces on caissons in undrained soils. 15th
International Offshore and Polar Engineering Conference; Seoul, Korea; 2005.
[30] Randolph M and Gourvenec S. Offshore geotechnical engineering. CRC Press; Oxford, UK;
2011.
[31] Deng W, Carter JP and Taiebat HA. Prediction of the lateral capacity of suction caissons.
Computer Methods and Advances in Geomechanics: Proceedings of the 10th International
Conference on Computer Methods and Advances in Geomechanics; Tucson, USA; 2000.
[32] Det Norske Veritas. Design and Installation of Fluke Anchors: DNV-RP-E301; 2012.
[33] Det Norske Veritas. Design and installation of plate anchors in clay: DNV-RP-E302; 2002.
[34] DTOcean. Analysis of Ocean Energy Arrays: application to real case studies, validation and
optimisation. Deliverable 7.3 of the DTOcean project; 2016.
[35] Krieg RD. A Simple Constitutive Description for Soils and Crushable Foams. SC-DR-72-0883.
Sandia National Laboratories, Albuquerque, NM and Livermore, CA; 1978.
[36] Taylor LM and Flanagan DP. Pronto 3D A Three-Dimensional Transient Solid Dynamics
Program: SAND87-1912. Sandia National Laboratories, Albuquerque, NM and Livermore, CA; 1989.
[37] Orcina. Orcaflex Documentation [Internet]. Orcina [cited: 11-10-2016]. Available from:
https://www.orcina.com/SoftwareProducts/OrcaFlex/Documentation/Help/
Related Documents