Journal of Clinical Investigation Vol. 42, No. 1, 1963 THE PRESSURE-FLOW RELATIONSHIPS OF THE INTRATHORACIC AIRWAY IN MAN* BY ROBERT E. HYATT t AND ROGER E. WILCOX (From the Cardiopulmonary Laboratory, Department of Medicine and Department of Surgery, Beckley Memorial Hospital [Miners Memorial Hospital Association], Beckley, W. Va.) (Submitted for publication July 6, 1962; accepted September 1, 1962) Measurement of the pressure-flow relationships of the human respiratory tract is basic to the study of ventilatory mechanics. The relation- ship of respiratory air flow to the total pressure drop along the respiratory tree (alveolus to mouth) has been extensively studied and been shown to depend on lung inflation (1-3) and the type and degree of airway disease (4). Re- cently the total pressure drop has been parti- tioned into that occurring along the lower or intrathoracic airways (alveolus to trachea) and that along the upper or extrathoracic airways (trachea to mouth) (5, 6). The resistance of the upper airway with mouth breathing was found 1) to comprise a significant portion of the total airway resistance in normal subjects, 2) to vary from subject to subject as well as in a given subject, 3) to depend on the type of breathing maneuver employed, and 4) to vary inversely with lung inflation to a slight degree (6). Only limited consideration has been given to the pressure-flow behavior of the lower airways (7). Yet in the evaluation of normal and ab- normal ventilatory mechanics one is primarily interested in the behavior of the intrathoracic airways. It is the purpose of this study to analyze the pressure-flow characteristics of the lower airway in normal and emphysematous sub- jects and to relate the results to the usual methods of evaluating airway resistance in man. THEORY If one neglects the effect of gravity on the gas, the pressures along a stream of gas flowing * Presented in part at the Forty-sixth Annual Meeting of the Federation of American Societies for Experimental Biology, Atlantic City, N. J., April 16, 1962. (Fed. Proc. 1962, 21, 444.) Supported by grants from the Miners Memorial Hospital Association, Washington, D. C., and the National Heart Institute (U. S. Public Health Service Grant H-5112), Bethesda, Md. t Present address: Section of Physiology, Mayo Clinic, Rochester, Minn. through a nonuniform conduit system, such as the bronchial tree, may be analyzed by consider- ing two properties of the flow, its frictional prop- erties and its inertial properties. At any mo- ment there are two superimposed pressure drops along the system related to these properties. A frictional pressure drop will exist related to the physical properties of the gas and to the flow geometry of the airways in a rather complicated manner. An inertial pressure drop will also exist related to the density of the gas and to the acceleration of the flow. The acceleration of the flow is of two varieties, local and convective. Local acceleration is the rate of change of veloc- ity of the gas particles that occurs with time. Convective acceleration is the rate of change of velocity of the particles that occurs with the distance traveled by the gas particles, such as would occur with converging or diverging flow boundaries. In both cases the rate of change of velocity must be accompanied by a force or pressure gradient according to Newton's Second Law. The transient pressure drop associated with local acceleration in the airway has been shown to be negligible (8) and will be omitted from this analysis. The pressure drop associated with convective acceleration has not been thoroughly studied and may not be negligible. Therefore, in analyzing the pressure difference between two points in a stream, as between alveolus and trachea in this study, one may consider this difference to consist of two pressure drops, one representing the energy dissipated between the points due to frictional losses in the stream and one representing the energy to accel- erate or decelerate the gas particles between the two points associated with the converging or di- verging flow boundaries (Bernoulli effect). The flow leaving the alveoli is essentially equal to that in the trachea. Moreover, the gas particles leaving the alveoli have extremely low velocities. 29

Welcome message from author
This document is posted to help you gain knowledge. Please leave a comment to let me know what you think about it! Share it to your friends and learn new things together.
Transcript
Journal of Clinical InvestigationVol. 42, No. 1, 1963
THE PRESSURE-FLOW RELATIONSHIPS OF THE INTRATHORACICAIRWAY IN MAN*
BY ROBERT E. HYATT t AND ROGER E. WILCOX
(From the Cardiopulmonary Laboratory, Department of Medicine and Department of Surgery,Beckley Memorial Hospital [Miners Memorial Hospital Association], Beckley, W. Va.)
(Submitted for publication July 6, 1962; accepted September 1, 1962)
Measurement of the pressure-flow relationshipsof the human respiratory tract is basic to thestudy of ventilatory mechanics. The relation-ship of respiratory air flow to the total pressuredrop along the respiratory tree (alveolus tomouth) has been extensively studied and beenshown to depend on lung inflation (1-3) and thetype and degree of airway disease (4). Re-cently the total pressure drop has been parti-tioned into that occurring along the lower orintrathoracic airways (alveolus to trachea) andthat along the upper or extrathoracic airways(trachea to mouth) (5, 6). The resistance ofthe upper airway with mouth breathing wasfound 1) to comprise a significant portion of thetotal airway resistance in normal subjects, 2) tovary from subject to subject as well as in a givensubject, 3) to depend on the type of breathingmaneuver employed, and 4) to vary inverselywith lung inflation to a slight degree (6).Only limited consideration has been given to
the pressure-flow behavior of the lower airways(7). Yet in the evaluation of normal and ab-normal ventilatory mechanics one is primarilyinterested in the behavior of the intrathoracicairways. It is the purpose of this study toanalyze the pressure-flow characteristics of thelower airway in normal and emphysematous sub-jects and to relate the results to the usualmethods of evaluating airway resistance in man.
THEORY
If one neglects the effect of gravity on the gas,the pressures along a stream of gas flowing
* Presented in part at the Forty-sixth Annual Meetingof the Federation of American Societies for ExperimentalBiology, Atlantic City, N. J., April 16, 1962. (Fed. Proc.1962, 21, 444.) Supported by grants from the MinersMemorial Hospital Association, Washington, D. C., andthe National Heart Institute (U. S. Public Health ServiceGrant H-5112), Bethesda, Md.
t Present address: Section of Physiology, Mayo Clinic,Rochester, Minn.
through a nonuniform conduit system, such asthe bronchial tree, may be analyzed by consider-ing two properties of the flow, its frictional prop-erties and its inertial properties. At any mo-ment there are two superimposed pressure dropsalong the system related to these properties. Africtional pressure drop will exist related to thephysical properties of the gas and to the flowgeometry of the airways in a rather complicatedmanner. An inertial pressure drop will alsoexist related to the density of the gas and to theacceleration of the flow. The acceleration of theflow is of two varieties, local and convective.Local acceleration is the rate of change of veloc-ity of the gas particles that occurs with time.Convective acceleration is the rate of change ofvelocity of the particles that occurs with thedistance traveled by the gas particles, such aswould occur with converging or diverging flowboundaries. In both cases the rate of change ofvelocity must be accompanied by a force orpressure gradient according to Newton's SecondLaw. The transient pressure drop associatedwith local acceleration in the airway has beenshown to be negligible (8) and will be omittedfrom this analysis. The pressure drop associatedwith convective acceleration has not beenthoroughly studied and may not be negligible.
Therefore, in analyzing the pressure differencebetween two points in a stream, as betweenalveolus and trachea in this study, one mayconsider this difference to consist of two pressuredrops, one representing the energy dissipatedbetween the points due to frictional losses in thestream and one representing the energy to accel-erate or decelerate the gas particles between thetwo points associated with the converging or di-verging flow boundaries (Bernoulli effect). Theflow leaving the alveoli is essentially equal tothat in the trachea. Moreover, the gas particlesleaving the alveoli have extremely low velocities.
29

ROBERT E. HYATT AND ROGER E. WILCOX
As the particles travel toward the trachea, theirvelocities increase with the diminishing cross-sectional area of the conduit. Even if the fric-tional losses were negligible, a pressure differencewould exist between alveolus and trachea to pro-duce this velocity difference (convective accelera-tion). Similarly, during inspiration a pressuredrop must exist to decelerate the tracheal gasparticles to alveolar velocities. In either casethe tracheal pressure associated with the con-vective acceleration of the gas will be negativewith respect to the alveolus and will favor airwaynarrowing.
P2A
pi
a P2
It follows that in interpreting the lower airwaypresssure-flow behavior it is necessary to esti-mate the convective and frictional pressure dropsseparately since each has independent signifi-cance. The convective pressure drop representsthat energy stored in the flow as kinetic energy.The frictional pressure drop represents thatenergy lost in the flow as heat. These dropsmay be estimated by simultaneously measuringlateral tracheal air pressure, alveolar pressure,and total respiratory flow. A curve relatingflow to the total pressure drop from alveolus totrachea can then be constructed. If in turn the
PI-P2 = ARPAPi = KAV2/2gVI = V/A
K = I
Pi - P2 = A P2
AP2 = Kfv2/2gV2 = V/ a
a < AV2 > VI
v=V
AP2 > ApiK > I
FIG. 1. EFFECT OF DIFFERENT VELOCITY PROFILES ON CONVECTIVE ACCELERATION PRESSURE DROP. At top, a uni-form or blunt velocity profile (dotted line) is depicted. The pressure drop from alveolus (Pi) to trachea (P2) due to con-vective acceleration is P1 - P2 or AP1. A is the anatomic cross-sectional area of the trachea and V the flow. Meansectional velocity, 01, equals V/A. K equals 1 in this case. Below is shown a hypothetical velocity profile (dotted line)in which the velocity is shown distributed entirely in the center of the stream. Flow in this case, t0, equals the flow, t, inthe above example. Anatomic area, A, is also the same. The velocity profile, however, as depicted by the velocityvectors, is quite different with high velocities in the center of the stream through the area, a, and zero velocity everywhereelse. The effective cross-sectional area, a, for this case is smaller than the anatomic area, A, which was the effective areain the above case. The resultant mean sectional velocity, V2, is greater than that in the uniform case, f2 > 01. It fol-lows that the pressure drop due to convective acceleration is also greater, AP2 > AP1. Therefore, K must be greater than1 in this nonuniform case. Had the velocity profile in this last example been assumed blunt, both the velocity and thepressure drop due to convective acceleration would have been underestimated. The fitting constant, K, corrects for suchvariations in velocity profile.
30

PRESSURE-FLOW BEHAVIOR OF INTRATHORACIC AIRWAYS
convective pressure drop can be calculated foreach flow, it is possible to derive a flow versus
frictional pressure drop curve by subtractingthe convective term from the measured totalpressure drop. Such a plot would be of value,since in the clinical evaluation of airway diseaseone is primarily interested in the frictional lossesof the flow.The convective pressure drop may be calcu-
lated if 1) alveolar gas velocity is assumed to bezero, 2) the tracheal cross-sectional area is known,3) the gas velocity distribution across the tracheais defined, and 4) total respiratory flow is known.The convective acceleration pressure drop,APC.A. in cm H20, may then be computed fromthe formula:
APC.A. 2-g
where p is the gas density, g the acceleration ofgravity, v the average gas velocity across thetrachea, and K a constant related to a spatialintegration of gas velocity over the cross-sectionof the trachea. The value of K is equal to unityfor a perfectly blunt velocity profile and equal to2 for a parabolic profile (9). In the general case
K will vary somewhere between these values.The theory evaluating K is somewhat involved(9) and fortunately, in anticipation of the resultsto be presented, need not be explored here. Wemay compute v from the formula:
V = V/A1, [2]
where V is the flow at the mouth in centimeters3per second and A is the tracheal cross-sectionalarea in centimeters2.To summarize, the instantaneous pressure
drop from alveolus to trachea, APA-T, is the sumof two pressure drops:
APA-T = AP(friction) + APC.A.
= AP(friction) + 2pV
[3]
[4]
A knowledge of K would permit computation ofthe convective term and, hence, calculation ofAP(friction). The importance of assessing thetracheal velocity profile is illustrated in Figure 1.
METHODS
Isovolume pressure-flow curves. Respiratory gas flowwas measured with a concentric cylinder flowmeter (10).Respiratory volumes were recorded by a Krogh spiro-
TABLE I
Clinical data on subjects
Max. mid-Vital expir. Total Flow
Subject Age Height capacity flow* lung cap. RV/TLCt resistance+
yrs cm L LIsec L % cm H20/L/secNormal1 30 168 4.2 2.8 6.3 33 2.02 35 178 4.5 3.5 5.7 21 1.23 36 174 5.5 4.5 7.7 28 0.64 39 169 4.1 4.5 6.4 39 2.25 50 173 3.5 2.9 6.9 50 2.26 53 179 5.4 2.9 7.1 25 1.0
Emphysematous1 31 175 2.7 0.3 7.0 63 3.92 34 168 5.0 0.9 3.33 41 166 4.1 1.7 2.04 42 170 4.0 1.3 6.7 38 3.75 44 165 3.0 0.8 12.96 60 178 3.0 0.6 7.0 68 6.67 60 170 4.3 2.1 3.58 60 163 3.8 1.3 7.2 55 3.69 61 168 3.6 1.1 4.110 63 178 3.6 2.2 7.8 53 2.511 63 173 4.1 0.9 3.7
* Reference 20.t RV = residual volume; TLC = total lung capacity.t Measured at 1 L per second during inspiration in tidal volume range. Relates total pressure drop (alveolus to
mouth) to flow.
31
II]

ROBERT E. HYATT AND ROGER E. WILCOX
meter, the displacement of which was measured by an
angular differential transformer.After skin anesthesia, a blunt 19-gauge needle with the
tapered end cut off at right angles was introduced into thetrachea 2 to 3 cm below the cricoid cartilage and placedunder fluoroscopic vision. Lateral tracheal gas pressure
was recorded from this needle.Intrathoracic pressure was estimated from an air-filled
balloon (11) placed in the lower esophagus. The pressure
drop from balloon to blunt tracheal needle was plottedagainst corresponding respiratory flow on an oscilloscope.In a given run only pressure (P) and flow (V) points at a
specific lung volume were plotted. The difference betweenballoon and lateral tracheal pressure can be used to repre-
sent the pressure drop from alveolus to trachea if one neg-
lects tissue friction' and also corrects for the pressure oflung elastic recoil. An isovolume pressure-flow curve
automatically corrects for the elastic recoil since its zero
flow intercept is the static retractive force of the lung atthat volume. These isovolume pressure-flow (PV) curves
were recorded in 6 normal and 1 1 emphysematous subjects.Table I lists pertinent clinical data for the subjects.Thoracic gas volumes were measured by a volume dis-placement body plethysmograph (12). All volumes are
expressed at ambient temperature and pressure saturatedwith water vapor (A TPS). The details of obtaining iso-volume PV curves are described elsewhere (6, 13).
Tracheal velocity. Measurement of tracheal velocitywas based on the Pitot principle which states that thevelocity at a point in a stream may be estimated by meas-
uring the difference between the lateral presssure and theimpact or stagnation pressure of the stream. This is ex-
pressed in the relationship:
v = /2gAP/p, [5]
MPACT
NEEDLE
BLUNT
NEEDLE
TRACHEALWALL
FIG. 2. ARRANGEMENT OF NEEDLES FOR ESTIMATING
TRACHEAL VELOCITY. The blunt needle samples lateraltracheal gas pressure. The impact needle with a sideopening is directed into the flow and samples the impact or
stagnation pressure of the stream.
I This equation assumes that the pressure drop fromtrachea to mouth remains small compared to ambientpressure.
2 Variously called the tissue component of total pulmo-nary flow resistance or tissue viscous resistance.
TABLE II
Expiratory velocity (cm per second) at flow of2 L per second *
Velocity 1 mmCenterline from
Subject velocity tracheal wall
A 2,580 2,370B 1,500 1,740C 1,150 1,440D 880 640E 1,350 1,400
* These velocities have not been corrected for the 30 percent overestimation by Pitot tube.
where v is velocity in centimeters per second and AP thedifference between lateral and impact pressures. In thefive cases in which tracheal velocity was measured, a secondneedle with a side opening was introduced at the sametracheal level as the blunt needle. Simultaneous lateraland impact pressures were recorded from the blunt andside-opening needles on separate matched pressure trans-ducers. The experimental arrangement is shown schemat-ically in Figure 2. The difference between these pressureswas determined electrically and used to compute velocityfrom the above expression. The dynamic response of thesystem (needles, connecting tubing, and gauges) was flatto 45 per cent through 10 cycles per second.The velocity distribution across the trachea was deter-
mined by sampling impact pressures along the trachealradius at varying flows. The position of the impactneedle was adjusted under fluoroscopic vision. The bluntneedle was kept stationary. The velocity profile of thetrachea was evaluated for inspiratory and expiratory flowsranging from 0.5 to 4.5 L per second.The accuracy with which this modified Pitot tube esti-
mated velocity was tested in a plastic tube of known radius.A subject breathed through the tube, generating variousflows. Velocity was determined at carefully measuredpoints along the tube radius by using the same needlesemployed in the human studies. The total flow based onthese velocity determinations was calculated by arithmeticintegration and compared to the corresponding flow re-corded by the respiratory flowmeter. Over a wide rangeof flows the Pitot tube used in this study was found to over-estimate velocity by approximately 30 per cent. Thismeasurement error affected the magnitude of velocitynoted but not the pattern of the velocity distribution acrossthe trachea.The dimensions of the trachea were obtained from an-
terior-posterior and lateral radiographs. The tracheacross-section most nearly approached an ellipse. Majorand minor radii corrected for X-ray beam divergence weredetermined for the site of measurement and used to calcu-late tracheal cross-sectional area.
RESULTS
Tracheal velocity profile. Table I I recordsexpiratory velocities in the five subjects at twosites in the trachea, centerline and a point ap-
32.

PRESSURE-FLOW BEHAVIOR OF INTRATHORACIC AIRWAYS
proximately 1 mm from the tracheal wall.These measurements were made at a flow of 2 Lper second. In each case the velocity near thewall is approximately equal to that at the center.
In three subjects wall velocity slightly exceedscenterline velocity, presumably representing ran-
dom measurement error. However, the mean
values of expiratory velocity for the entire group
at the centerline and wall are quite similar,1,492 and 1,518 cm per second, respectively.Velocities at intermediate sites were similarlyclose to centerline velocity. The values duringinspiration showed the same pattern. Thesedata indicate that under the conditions of thisstudy and at the flows studied, the trachealvelocity profile during inspiration and expirationis essentially blunt. It seems reasonable to as-
sume that K is equal to 1. Thus, average gas
velocity across the trachea, v, may be calculatedby dividing flow at the mouth, V, by trachealcross-sectional area, A. Then,
APC.A. =,2p172 [6]AP*2gA2'
Table III estimates the error resulting fromthe assumption of a blunt profile. The meas-
ured expiratory centerline velocity was first cor-
rected for the 30 per cent overestimation by thePitot tube determined from the model study.This corrected velocity was then multiplied bythe tracheal area derived from radiographs togive calculated flow. All measurements were
made at 2 L per second. The assumption of a
blunt profile overestimates flow in four of thefive subjects and leads to an average overestima-tion of about 10 per cent. These estimates as-
sume the tracheal cross-sectional area measure-
ments to be accurate and the pressure drop fromtrachea to flowmeter small (cf. footnote 1).
Isovolume P Vcurves. Figure 3 presents iso-volume PV curves of the lower airway in a nor-
mal subject. The solid lines define the relation-ship of flow to the total pressure drop from eso-
phageal balloon to lateral tracheal pressure tap.The dashed curves in the figure indicate theeffect of subtracting the convective accelerationterm, APC.A., and represent the frictional pres-
sure drop versus flow behavior of the lower air-way. The tendency for frictional flow resistanceto decrease with increasing lung inflation is seen.
Figure 4 from an emphysematous subject showsthe decrease in maximal expiratory flow andincrease in expiratory and inspiratory resistanceof the lower airways characteristic of this dis-ease. At these low flows the convective pressure
drop is small compared to the large frictionaldrop and is not shown.
Table IV presents pertinent data on 33 iso-volume PV curves obtained in this study. In-cluded is the total alveolus to trachea pressure
drop at maximum expiratory flow. In no case
was maximum expiratory flow associated with a
pressure in excess of 18.3 cm H20. The resist-ance values in this table are for the lower airway.
DISCUSSION
Theoretical estimates based on the criticalReynolds number indicate that turbulence prob-ably occurs in the trachea at flows slightly lessthan 0.5 L per second (14). Recent studies ofbronchial casts by Dekker (15) and West andHugh-Jones (16)supporttheseestimates. Flowsbelow 0.5 L per second were not carefully evalu-ated in the present study. Moreover, the pres-
ent data do not identify the type of flow produc-ing the nearly blunt profile found. It couldresult from either turbulent or laminar flow.
TABLE III
Estimate of error in assuming blunt profile
Expiratory centerlinevelocity
Tracheal Calculated MeasuredSubject Measured Corrected * area flow flow
cm /sec cm2 LIsec LIsecA 2,580 1,806 1.22 2.20 2.0B 1,500 1,050 2.89 3.03 2.0C 1,150 805 2.65 2.13 2.0D 880 616 2.61 1.60 2.0E 1,350 945 2.22 2.08 2.0
* Corrected for 30 per cent overestimation by Pitot tube used.
33
ROBERT E. HYATT AND ROGER E. WILCOX
EXPIRATORY V (L/S)
/
//
/
I
(-)
I/
II
6
B
3
C
(+)
20
2
3
A P CMS. H20
(ESOPHAGUS- TRACHEA)
4
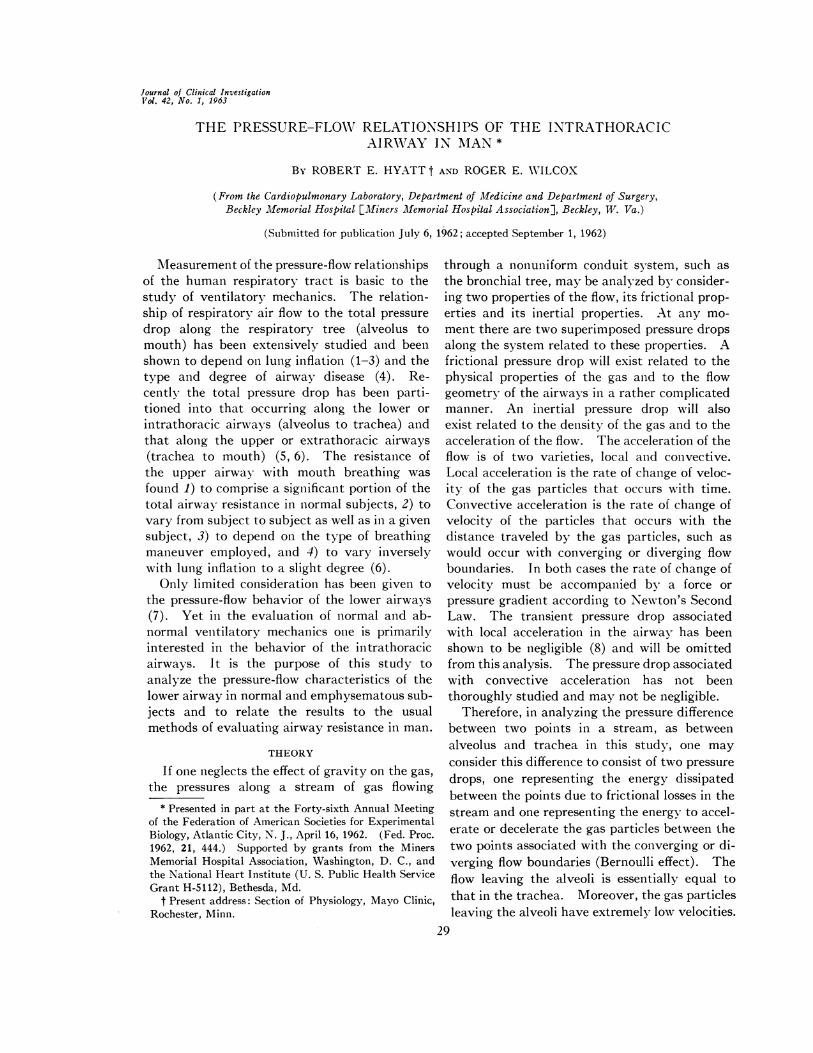
INSPIRATORY V (L/S)FIG. 3. LOWER AIRWAY ISOVOLUME PV CURVES FOR NORMAL SUBJECT 2. Curves A, B, and C measured at 49, 44,
and 28 per cent of vital capacity, respectively. Solid curves relate total pressure drop to flow and dashed curves relatefrictional pressure drop to flow. Flow given in L per second (L/S).
The important observation is that a nearly bluntprofile appears to obtain in the trachea in man.This greatly simplifies correction of the lowerairway PV relationships for the convective ac-celeration pressure drop. It does not necessarilyfollow, however, that the velocity profile is bluntin the smaller airways.The general contours of the total pressure
versus flow curves of the lower airway are similarto those previously published for the' entire air-way (2, 13). The effect of correcting the lowerairway PV curves for the convective term is seenin Figure 3. The contours of the curves relatingfrictional pressure drop to flow (dashed lines) arequite similar to those relating total pressure drop
to flow (solid lines) until flows of about 2 L persecond are reached. Since airway resistance isdefined as the ratio of airway pressure drop toflow, it is apparent that failure to correct for theconvective acceleration pressure drop leads to anoverestimation of expiratory and an underestima-tion of inspiratory frictional resistance. Mead(7) has questioned whether this factor may ex-plain in part the reported differences in resist-ance between the respiratory phases. The pres-ent data in normal subjects corrected for convec-tive acceleration showed lower airway inspiratoryfrictional resistance to be approximately 85 percent of expiratory resistance at 1 L per second.Owing to the marked alinearity of the expiratory
34
I
I

PRESSURE-FLOW BEHAVIOR OF INTRATHORACIC AIRWAYS
limbs of the isovolume PV curves, this differencebecomes even greater at higher flows. In theemphysematous subjects, the inspiratory fric-tional resistance of the lower airway averaged67 per cent of the expiratory resistance.The absolute value of the convective accelera-
tion term is not great. In a trachea of 1 cmradius, APC.A. equals 0.5 cm H20 at 2 L persecond and 3.2 cm H20 at 5 L per second. How-ever, the convective term may constitute a size-able portion of the total lower airway pressuredrop, particularly in normal subjects. For curveA, Figure 3, it amounts to 17 and 34 per cent ofthe total drop at expiratory flows of 1 and 3 Lper second, respectively. Failure to consider the
convective term could lead to errors in estimat-ing the magnitude of small changes in frictionalairway resistance induced by various experimen-tal procedures, such as inhalation of cigarettesmoke and bronchodilator drugs.
There are certain assumptions in the correctionfor convective acceleration in this study. First,it is assumed that tracheal cross-sectional area atthe site of pressure measurement, i.e., in theextrathoracic trachea, remains constant through-out the breathing maneuvers employed. Therecent work of Dekker and Ladeboer (17) sup-ports this assumption. Utilizing roentgeno-graphic techniques, they noted no change in thedimensions of the upper cervical trachea during
EXPIRATORY V (L/S)
I . ,
8 6/4
6
5
4
3
(+)2
2 A P CMS. H
(ESOPHAGUS - TRACHEA)3
4
INSPIRATORY V (L/S)FIG. 4. LOWER AIRWAY ISOVOLUME PV CURVES FOR EMPHYSEMATOUS SUBJECT 8. Top curve was measured at 80
per cent of vital capacity and has no maximum. Lower curve measured at 52 per cent of vital capacity. Curves re-
late total pressure drop to flow in L per second (L/S).
(./2
35
I
36 ROBERT E. HYATT AND ROGER E. WILCOX
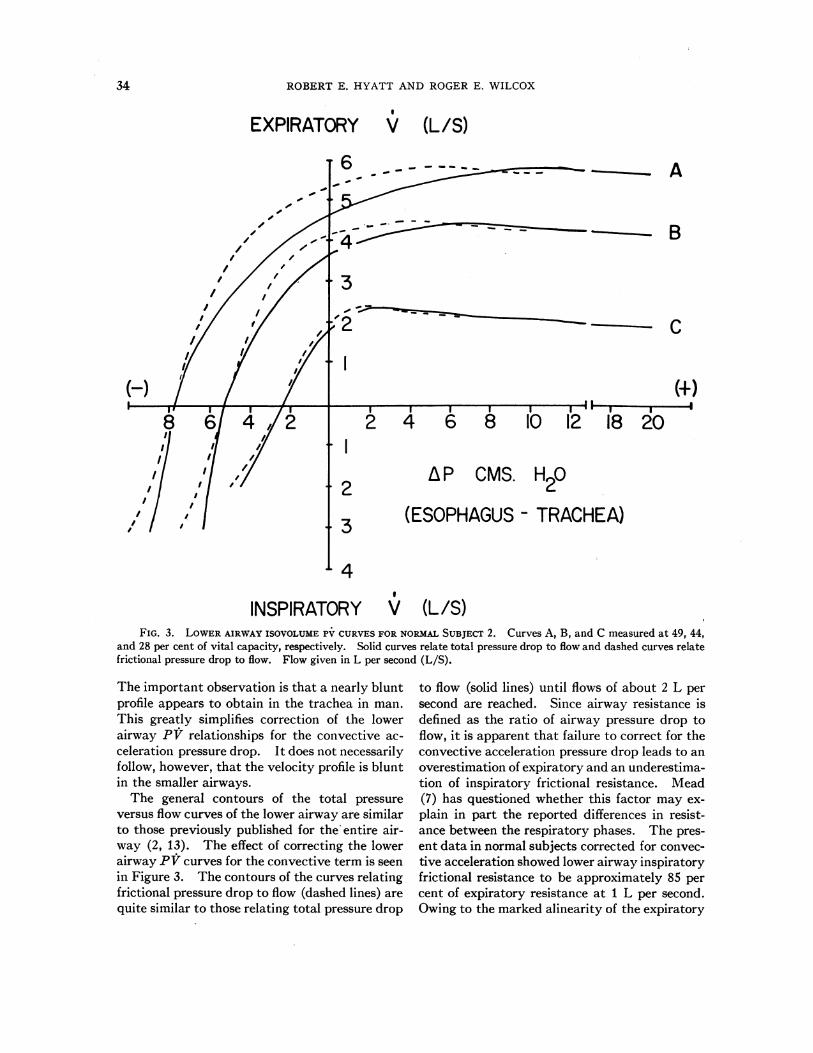
TABLE IV
Lower airway isovolume PY curves
Max. Pressure at Resistance*Curve Lung expir. max. expir.
Subject no. inflation* flow flowf Expiration Inspiration
% VC Llsec cm H20 cm H0O/L/secNormal1 a 47 4.0 4.0 0.9 0. 7
b 44 3.4 3.7 0.8 1.0c 22 1.9 3.0 1.2 0.9
2 a 49 5.9 10.5 0.8 0.8b 44 4.6 6.8 0.8 0.6c 33 3.3 2.6 0.7 0.6d 28 2.4 2.4 1.0 1.0e 20 0.9 2.1 3.0 1.7
3 a§ 55 7.6 16.3 0.34 a 54 5.4 8.2 0.2 0.15 a 43 3.7 10.0 1.5 0.96 a§ 57 5.6 18.3 0.5
b§ 50 4.1 7.8 1.1c§ 441 3.4 3.8 1.1
Emphysematous1 a 61 1.1 3.0 3.3 2.2
b 46 0.9 0.0 4.0 2.02 a 64 1.8 5.8 3.8 2.4
b 54 1.6 2.0 3.0 2.03 a 63 3.3 6.7 1.2 1.04 a 38 1.8 13.5 3.6 2.9
b 35 1.5 2.5 4.2 2.4c 13 0.7 3.7 5.0 4.8
5 a 66 0.9 0.8 8.6 6.0b 53 0.5 2.0 13.2 6.0
6 a 53 1.3 4.0 8.3 4.17 a 63 3.0 4.0 2.4 2.68 a 52 1.7 5.8 2.5 2.09 a 67 1.6 5.5 3.8 3.0
b 64 1.3 2.0 5.1 2.710 a§ 53 3.3 1.1 1.2
b§ 33 2.0 1.4 2.311 a 32 2.0 2.4 1.8 1.9
b 22 0.9 -0.8 3.0 2.1
* Volume at which curve measured is expressed as per cent of VC. 100 per cent would equal the point of maximalinflation.
t Pressure refers to difference between esophageal balloon and lateral tracheal pressure.$ Resistance calculated from pressure drop from balloon to lateral tracheal tap and measured at 1 L per second.§ Only expiratory limb obtained.
such violent respiratory maneuvers as cough andartificial wheezing. We have observed fluoro-scopically the region of the trachea where ourmeasurements were made during the respiratorymaneuvers employed. No change in anterior-posterior diameter was detected. If trachealarea changed with increasing flows, the flow ver-sus velocity relationships would not be linear.They were linear for the flows studied. Nor wasthere a consistent tendency for inspiratory veloc-ity to differ from expiratory velocity at the sameflow levels. This indicates that tracheal areawas the same during both inspiration and expira-tion.
It is also assumed that the velocity profile
remains blunt at all flows. Our data supportthis assmuption, but we have no data for flowsunder 0.5 and over 4.5 L per second.
Errors in estimating tracheal cross-sectionalarea could also have a significant effect on thedata, since, as can be seen from Equation 6,APC.A. varies inversely with the fourth powerof the radius. There is a tendency for the tra-chea to narrow in the region where our measure-ments were made which adds to the difficulty ofobtaining exact diameter measurements. Also,as Harris has shown (18), anterior-posteriortracheal diameter is affected by the attitude ofthe head and somewhat by the degree of lunginflation. These variables were not rigidly con-
PRESSURE-FLOW BEHAVIOR OF INTRATHORACIC AIRWAYS
trolled when we obtained our tracheal radio-graphs. Hence, the measured tracheal areasmay differ somewhat from those existing duringthe experimental procedures. This could bearon the accuracy of the calculations presented inTable Ill.
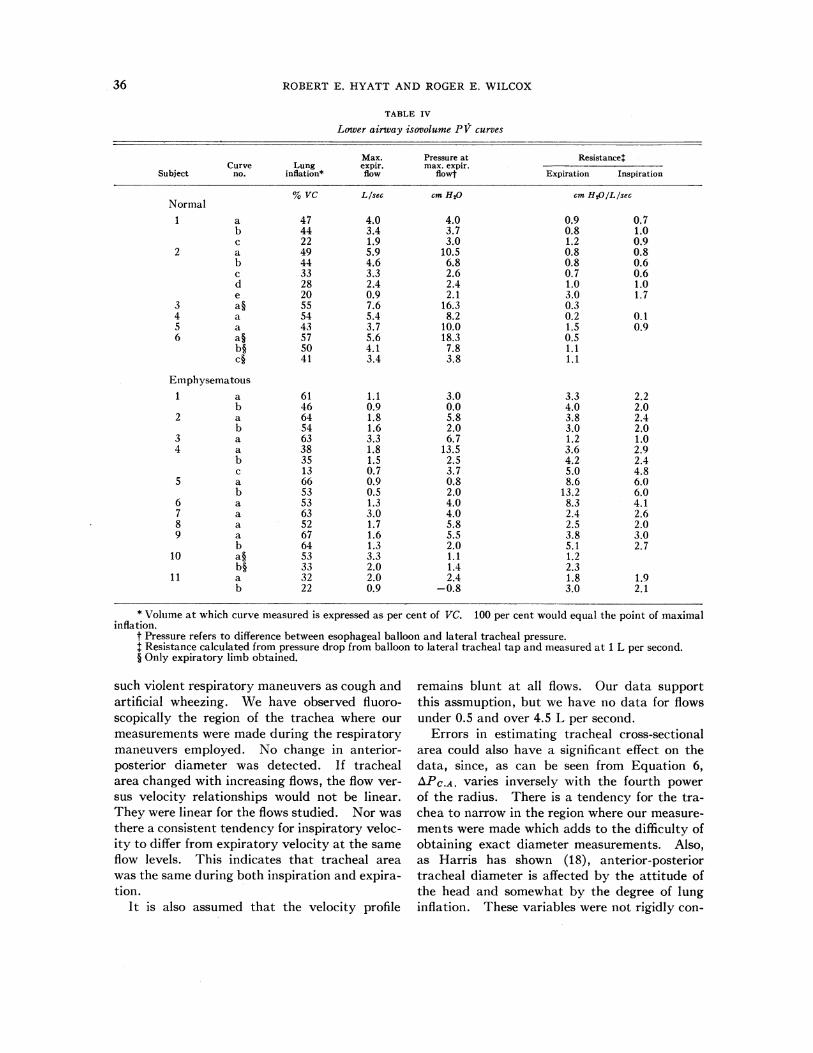
In the study of pulmonary aerodynamics oneis frequently interested in assessing the pressuregradient related to the frictional losses along theintrathoracic airways. In this study the resist-ance of the extrathoracic airway was excluded bymeasuring lateral tracheal pressure. Frictionallosses of the lower airway were then determinedby calculating and subtracting the value of theconvective term from the total lower airway
pressure drop. Another approach would havebeen to measure the pressure difference betweenalveolus and impact tracheal needle, whichwould have yielded the frictional PV relation-ships directly.
In routine clinical work it is not feasible toperform tracheal punctures. Resistance is fre-quently calculated from the PV relationshipsmeasured by an esophageal balloon and lateraloral pressure tap. If the diameter of the tubecontaining the oral tap is known and the profileis assumed to be blunt, the convective term can behandled as in this study. Similarly, an impactoral tap might be employed, again yielding thefrictional resistance directly. However, it must
EXPIRATORY V (L/S)T 6
(-)
4 2
A
2
(+I)
2
2 4 6 8 10 12 18 20
aP CMS. H20
3
4INSPIRATORY ' (L/S)
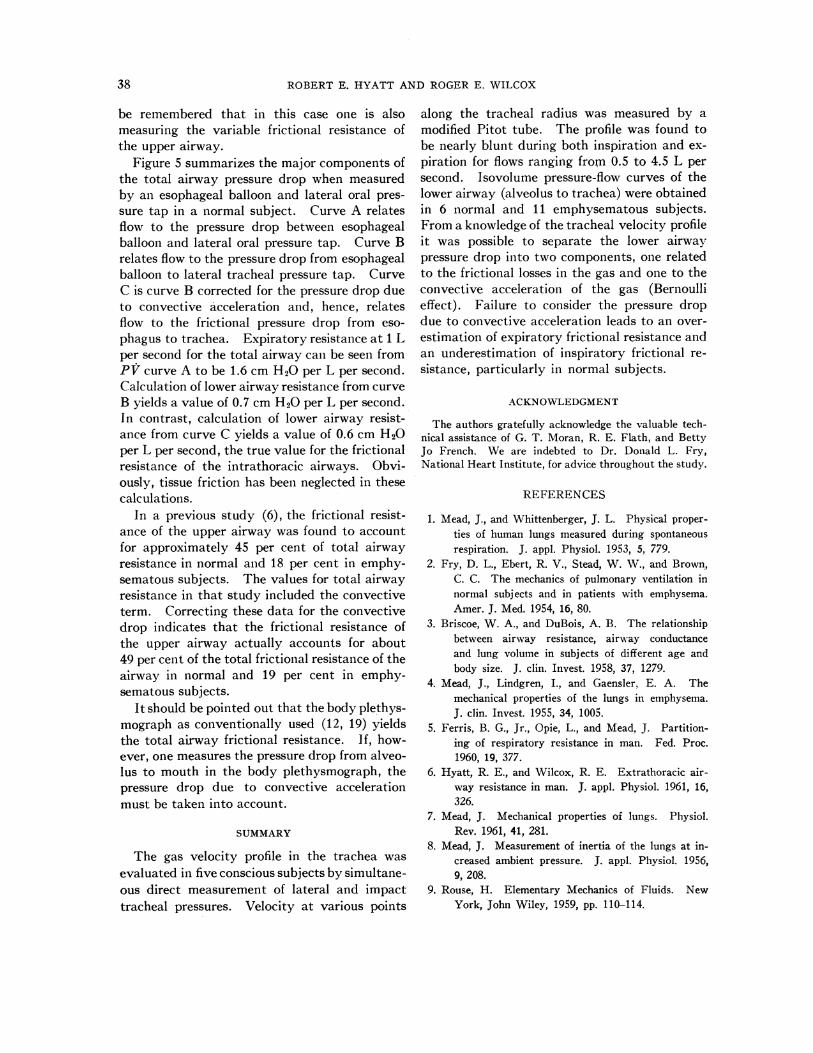
FIG. 5. 'MAJOR COMPONENTS OF TOTAL AIRWAY PRESSURE DROP IN NORMAL SUBJECT 2. All curves measured at 44per cent of vital capacity. Flow is in L per second (L/S). Curve A relates flow to total pressure drop from esophagealballoon to lateral oral pressure tap. Curve B relates flow to pressure drop between esophageal balloon and lateraltracheal pressure tap. Curve C is curve B with calculated convective acceleration pressure drop subtracted.
37
I
I
ROBERT E. HYATT AND ROGER E. WILCOX
be remembered that in this case one is alsomeasuring the variable frictional resistance ofthe upper airway.
Figure 5 summarizes the major components ofthe total airway pressure drop when measuredby an esophageal balloon and lateral oral pres-sure tap in a normal subject. Curve A relatesflow to the pressure drop between esophagealballoon and lateral oral pressure tap. Curve Brelates flow to the pressure drop from esophagealballoon to lateral tracheal pressure tap. CurveC is curve B corrected for the pressure drop dueto convective acceleration and, hence, relatesflow to the frictional pressure drop from eso-phagus to trachea. Expiratory resistance at 1 Lper second for the total airway can be seen fromPV curve A to be 1.6 cm H20 per L per second.Calculation of lower airway resistance from curveB yields a value of 0.7 cm H20 per L per second.In contrast, calculation of lower airway resist-ance from curve C yields a value of 0.6 cm H20per L per second, the true value for the frictionalresistance of the intrathoracic airways. Obvi-ously, tissue friction has been neglected in thesecalculations.
In a previous study (6), the frictional resist-ance of the upper airway was found to accountfor approximately 45 per cent of total airwayresistance in normal and 18 per cent in emphy-sematous subjects. The values for total airwayresistance in that study included the convectiveterm. Correcting these data for the convectivedrop indicates that the frictional resistance ofthe upper airway actually accounts for about49 per cent of the total frictional resistance of theairway in normal and 19 per cent in emphy-sematous subjects.
It should be pointed out that the body plethys-mograph as conventionally used (12, 19) yieldsthe total airway frictional resistance. If, how-ever, one measures the pressure drop from alveo-lus to mouth in the body plethysmograph, thepressure drop due to convective accelerationmust be taken into account.
SUMMARY
The gas velocity profile in the trachea wasevaluated in five conscious subjects by simultane-ous direct measurement of lateral and impacttracheal pressures. Velocity at various points
along the tracheal radius was measured by amodified Pitot tube. The profile was found tobe nearly blunt during both inspiration and ex-piration for flows ranging from 0.5 to 4.5 L persecond. Isovolume pressure-flow curves of thelower airway (alveolus to trachea) were obtainedin 6 normal and 11 emphysematous subjects.From a knowledge of the tracheal velocity profileit was possible to separate the lower airwaypressure drop into two components, one relatedto the frictional losses in the gas and one to theconvective acceleration of the gas (Bernoullieffect). Failure to consider the pressure dropdue to convective acceleration leads to an over-estimation of expiratory frictional resistance andan underestimation of inspiratory frictional re-sistance, particularly in normal subjects.
ACKNOWLEDGMENT
The authors gratefully acknowledge the valuable tech-nical assistance of G. T. Moran, R. E. Flath, and BettyJo French. We are indebted to Dr. Donald L. Fry,National Heart Institute, for advice throughout the study.
REFERENCES
1. Mead, J., and Whittenberger, J. L. Physical proper-ties of human lungs measured during spontaneousrespiration. J. appl. Physiol. 1953, 5, 779.
2. Fry, D. L., Ebert, R. V., Stead, W. W., and Brown,C. C. The mechanics of pulmonary ventilation innormal subj ects and in patients with emphysema.Amer. J. Med. 1954, 16, 80.
3. Briscoe, W. A., and DuBois, A. B. The relationshipbetween airway resistance, airway conductanceand lung volume in subjects of different age andbody size. J. clin. Invest. 1958, 37, 1279.
4. Mead, J., Lindgren, I., and Gaensler, E. A. Themechanical properties of the lungs in emphysema.J. clin. Invest. 1955, 34, 1005.
5. Ferris, B. G., Jr., Opie, L., and Mead, J. Partition-ing of respiratory resistance in man. Fed. Proc.1960, 19, 377.
6. Hyatt, R. E., and Wilcox, R. E. Extrathoracic air-way resistance in man. J. appl. Physiol. 1961, 16,326.
7. Mead, J. Mechanical properties of lungs. Physiol.Rev. 1961, 41, 281.
8. Mead, J. Measurement of inertia of the lungs at in-creased ambient pressure. J. appl. Physiol. 1956,9, 208.
9. Rouse, H. Elementary Mechanics of Fluids. NewYork, John Wiley, 1959, pp. 110-114.
38

PRESSURE-FLOW BEHAVIOR OF INTRATHORACIC AIRWAYS
10. Fry, D. L., Hyatt, R. E., McCall, C. B., and Mallos,A. J. Evaluation of three types of respiratoryflowmeters. J. appl. Physiol. 1957, 10, 210.
11. Schilder, D. P., Hyatt, R. E., and Fry, D. L. Animproved balloon system for measuring intraesopha-geal pressure. J. appl. Physiol. 1959, 14, 1057.
12. Mead, J. Volume displacement body plethysmographfor respiratory measurements in human subjects.J. appl. Physiol. 1960, 15, 736.
13. Hyatt, R. E., Schilder, D. P., and Fry, D. L. Re-lationship between maximum expiratory flow anddegree of lung inflation. J. appl. Physiol. 1958,13, 331.
14. Gaensler, E. A., Maloney, J. V., Jr., and Bj6rk, V. 0.
Bronchospirometry. II. Experimental observa-tions and theoretical considerations of resistancebreathing. J. Lab. clin. Med. 1952, 39, 935.
15. Dekker, E. Transition between laminar and turbu-lent flow in human trachea. J. appl. Physiol. 1961,16, 1060.
16. \Vest, J. B., and Hugh-Jones, P. Patterns of gas flowin the upper bronchial tree. J. appl. Physiol. 1959,14, 753.
17. Dekker, E., and Ladeboer, R. C. Compression of thetracheobronchial tree by the action of the volun-tary respiratory musculature in normal individualsand in patients with asthma and emphysema.Amer. J. Roentgenol. 1961, 85, 217.
18. Harris, R. S. The effect of extension of the headand neck upon the infrahyoid respiratory passage
and the supraclavicular portion of the humantrachea. Thorax 1959, 14, 176.
19. DuBois, A. B., Botelho, S. Y., and Comroe, J. H., Jr.A new method for measuring airway resistance inman using a body plethysmograph: values in nor-
mal subjects and in patients with respiratory dis-ease. J. clin. Invest. 1956, 35, 327.
20. Leuallen, E. C., and Fowler, W. S. Maximal mid-expiratory flow. Amer. Rev. Tuberc. 1955, 72,783.
39
Related Documents


