Market Feasibility Analysis Veranda at Assembly Senior Apartments Doraville, DeKalb County, Georgia Prepared for: Integral Development Effective Date: May 13, 2019 Site Inspection: May 1, 2019

Welcome message from author
This document is posted to help you gain knowledge. Please leave a comment to let me know what you think about it! Share it to your friends and learn new things together.
Transcript
Market Feasibility Analysis
Veranda at Assembly Senior Apartments Doraville, DeKalb County, Georgia
Prepared for: Integral Development
Effective Date: May 13, 2019 Site Inspection: May 1, 2019
Veranda at Assembly | Table of Contents
Page i
TABLE OF CONTENTS 1. EXECUTIVE SUMMARY .................................................................................................... 1 2. INTRODUCTION .............................................................................................................. 8 A. Overview of Subject .............................................................................................................................................. 8 B. Purpose of Report ................................................................................................................................................. 8 C. Format of Report .................................................................................................................................................. 8 D. Client, Intended User, and Intended Use ............................................................................................................. 8 E. Applicable Requirements ...................................................................................................................................... 8 F. Scope of Work ...................................................................................................................................................... 8 G. Report Limitations ................................................................................................................................................ 9 3. PROJECT DESCRIPTION .................................................................................................. 10 A. Project Overview ................................................................................................................................................ 10 B. Project Type and Target Market ......................................................................................................................... 10 C. Building Types and Placement ............................................................................................................................ 10 D. Detailed Project Description ............................................................................................................................... 11
1. Project Description ..................................................................................................................................... 11 2. Proposed Timing of Development ............................................................................................................. 11
4. SITE EVALUATION ......................................................................................................... 12 A. Site Analysis ........................................................................................................................................................ 12
1. Site Location ............................................................................................................................................... 12 2. Existing and Proposed Uses ....................................................................................................................... 13 3. General Description of Land Uses Surrounding the Subject Site ............................................................... 14 4. Overview of The Assembly Redevelopment Plan ...................................................................................... 15 5. Land Uses Surrounding the Subject Site .................................................................................................... 16
B. Neighborhood Analysis ....................................................................................................................................... 17 1. General Description of Neighborhood ....................................................................................................... 17 2. Neighborhood Planning Activities .............................................................................................................. 17 3. Public Safety ............................................................................................................................................... 18
C. Site Visibility and Accessibility ............................................................................................................................ 19 1. Visibility ...................................................................................................................................................... 19 2. Vehicular Access ......................................................................................................................................... 19 3. Availability of Public and Inter-Regional Transit ........................................................................................ 19 4. Pedestrian Access ....................................................................................................................................... 20 5. Accessibility Improvements under Construction and Planned .................................................................. 20
D. Residential Support Network .............................................................................................................................. 21 1. Key Facilities and Services near the Subject Site ........................................................................................ 21 2. Essential Services ....................................................................................................................................... 21 3. Commercial Goods and Services ................................................................................................................ 22 4. Recreational Amenities .............................................................................................................................. 23 5. Location of Low-Income Housing ............................................................................................................... 23
E. Site Conclusion ................................................................................................................................................... 23 5. MARKET AREA .............................................................................................................. 24 A. Introduction ........................................................................................................................................................ 24 B. Delineation of Market Area ................................................................................................................................ 24 6. COMMUNITY DEMOGRAPHIC DATA .............................................................................. 26 A. Introduction and Methodology .......................................................................................................................... 26 B. Trends in Population and Households ................................................................................................................ 26
1. Recent Past Trends ..................................................................................................................................... 26 2. Projected Trends ........................................................................................................................................ 27 3. Building Permit Trends ............................................................................................................................... 27 4. Trends in Older Adult Households ............................................................................................................. 28
Veranda at Assembly | Table of Contents
Page i i
C. Demographic Characteristics .............................................................................................................................. 28 1. Age Distribution and Household Type ....................................................................................................... 28 2. Renter Household Characteristics .............................................................................................................. 29 3. Income Characteristics ............................................................................................................................... 31
7. EMPLOYMENT TREND ................................................................................................... 34 A. Introduction ........................................................................................................................................................ 34 B. Labor Force, Resident Employment, and Unemployment .................................................................................. 34
1. Trends in County Labor Force and Resident Employment ......................................................................... 34 2. Trends in County Unemployment Rate ...................................................................................................... 34
A. Commutation Patterns ....................................................................................................................................... 35 B. At-Place Employment ......................................................................................................................................... 35
1. Trends in Total At-Place Employment ........................................................................................................ 35 2. At-Place Employment by Industry Sector................................................................................................... 36 3. Major Employers ........................................................................................................................................ 37 4. Recent Economic Expansions and Contractions ........................................................................................ 39
C. Conclusions on Local Economics......................................................................................................................... 39 8. PROJECT-SPECIFIC AFFORDABILITY & DEMAND ANALYSIS ............................................. 40 A. Affordability Analysis .......................................................................................................................................... 40
1. Methodology .............................................................................................................................................. 40 2. Affordability Analysis ................................................................................................................................. 41 3. Conclusions of Affordability ....................................................................................................................... 43
B. Demand Estimates and Capture Rates ............................................................................................................... 43 1. Methodology .............................................................................................................................................. 43 2. Demand Analysis ........................................................................................................................................ 44 3. DCA Demand Conclusions .......................................................................................................................... 44
9. COMPETITIVE RENTAL ANALYSIS ................................................................................... 45 A. Introduction and Sources of Information ........................................................................................................... 45 B. Overview of Market Area Housing Stock ............................................................................................................ 45 C. Survey of Age-Restricted Rental Communities ................................................................................................... 47
1. Introduction to the Age Restricted Rental Housing Survey ....................................................................... 47 2. Location ...................................................................................................................................................... 47 3. Age of Communities ................................................................................................................................... 48 4. Structure Type and Size .............................................................................................................................. 48 5. Unit Distribution ......................................................................................................................................... 48 6. Vacancy Rates ............................................................................................................................................ 49 7. Recent Absorption History ......................................................................................................................... 49 8. Rents .......................................................................................................................................................... 49
D. Survey of Age-Restricted Rental Communities ................................................................................................... 49 1. Payment of Utility Costs ............................................................................................................................. 49 2. Unit Features and Services ......................................................................................................................... 49 3. Parking ....................................................................................................................................................... 50 4. Community Amenities ................................................................................................................................ 50
E. Survey of General Occupancy Rental Communities ........................................................................................... 51 1. Introduction to the Rental Housing Survey ................................................................................................ 51 2. Location ...................................................................................................................................................... 51 3. Vacancy Rates ............................................................................................................................................ 52 4. Effective Rents ........................................................................................................................................... 52 5. Scattered Site Rentals ................................................................................................................................ 53 6. DCA Average Market Rent ......................................................................................................................... 53
F. Multi-Family Pipeline .......................................................................................................................................... 54 G. Housing Authority Data ...................................................................................................................................... 54 H. Existing Low-Income Rental Housing .................................................................................................................. 55 I. Impact of Abandoned, Vacant, or Foreclosed Homes ........................................................................................ 56
Veranda at Assembly | Table of Contents
Page i i i
10. FINDINGS AND CONCLUSIONS ................................................................................... 57 A. Key Findings ........................................................................................................................................................ 57 B. Product Evaluation ............................................................................................................................................. 59 C. Price Position ...................................................................................................................................................... 60 11. ABSORPTION AND STABILIZATION RATES .................................................................. 62 A. Absorption Estimate ........................................................................................................................................... 62 B. Impact on Existing and Pipeline Rental Market .................................................................................................. 62 12. INTERVIEWS .............................................................................................................. 62 13. CONCLUSIONS AND RECOMMENDATIONS ................................................................. 63 APPENDIX 1 UNDERLYING ASSUMPTIONS AND LIMITING CONDITIONS ............................... 64 APPENDIX 2 ANALYST CERTIFICATIONS ............................................................................... 66 APPENDIX 3 NCHMA CERTIFICATION .................................................................................... 67 APPENDIX 4 ANALYST RESUMES ......................................................................................... 68 APPENDIX 5 DCA CHECKLIST ............................................................................................... 71 APPENDIX 6 RENTAL COMMUNITY PROFILES ....................................................................... 76
TABLES, FIGURES AND MAPS Table 1 Detailed Unit Mix and Rents, Veranda at Assembly ...................................................................................... 11 Table 2 Unit Features and Community Amenities ...................................................................................................... 11 Table 3 Key Facilities and Services .............................................................................................................................. 21 Table 4 Population and Household Projections .......................................................................................................... 26 Table 5 Persons per Household, Veranda Market Area .............................................................................................. 27 Table 6 Building Permits by Structure Type, DeKalb County ...................................................................................... 27 Table 7 Trends in Senior Households, Veranda Market Area ..................................................................................... 28 Table 8 Age Distribution ............................................................................................................................................. 29 Table 9 Households by Household Type ...................................................................................................................... 29 Table 10 Households by Tenure 2000 - 2019............................................................................................................. 30 Table 11 Households by Tenure 2021 ........................................................................................................................ 30 Table 12 Senior Households by Tenure (55+), 2019 .................................................................................................. 30 Table 13 Renter Households by Age of Householder ................................................................................................ 31 Table 14 Renter Households by Household Size ......................................................................................................... 31 Table 15 Household Income ........................................................................................................................................ 32 Table 16 Senior Household Income, Households 55+ ................................................................................................. 32 Table 17 Senior Household Income by Tenure, Households 55+ ................................................................................ 33 Table 18 Rent Burdened and Substandard Housing, Veranda Market Area ............................................................... 33 Table 19 Labor Force and Unemployment Rates ........................................................................................................ 34 Table 20 Commutation Data, Veranda Market Area ................................................................................................... 35 Table 21 Major Employers, Metro Atlanta ................................................................................................................. 38 Table 22 Recent Economic Expansions and Contractions, DeKalb County ................................................................. 39 Table 22 2021 Total and Renter Income Distribution, Veranda Market Area ............................................................ 40 Table 24 LIHTC Income and Rent Limits, Atlanta-Sandy Springs-Roswell HUD Metro Area ..................................... 41 Table 25 Affordability Analysis, Veranda at Assembly ................................................................................................ 42 Table 26 Homeownership to Rental Housing Conversion .......................................................................................... 43 Table 27 Overall Demand Estimates, Veranda at Assembly ...................................................................................... 44 Table 28 Demand Estimates by Floor Plan, Veranda at Assembly ............................................................................. 44 Table 29 Dwelling Units by Structure and Tenure ...................................................................................................... 45 Table 30 Dwelling Units by Year Built and Tenure ...................................................................................................... 46 Table 31 Value of Owner-Occupied Housing Stock ..................................................................................................... 46 Table 32 Rental Summary, Senior Rental Communities .............................................................................................. 48 Table 33 Utility Arrangement and Unit Features ......................................................................................................... 50
Veranda at Assembly | Table of Contents
Page iv
Table 34 Community Amenities .................................................................................................................................. 50 Table 35 Rental Summary, Unit Distribution, Size, and Pricing – Surveyed Communities .......................................... 52 Table 36 Average Market Rents, Most Comparable Properties .................................................................................. 53 Table 37 Average Market Rent and Rent Advantage Summary ................................................................................. 54 Table 38 Subsidized Communities, Veranda Market Area ......................................................................................... 55 Table 39 Foreclosure Data, ZIP Code 30341, April 2019 ............................................................................................. 56 Figure 1 Site Plan ......................................................................................................................................................... 10 Figure 2 Views of Subject Site ...................................................................................................................................... 13 Figure 3 Satellite Image of Subject Site ....................................................................................................................... 14 Figure 4 Assembly Yards Master Plan .......................................................................................................................... 15 Figure 5 Views of Surrounding Land Uses ................................................................................................................... 16 Figure 6 Planned Transit Improvements, Northeast Atlanta ....................................................................................... 20 Figure 7 At-Place Employment, DeKalb County .......................................................................................................... 36 Figure 8 Total Employment by Sector ......................................................................................................................... 37 Figure 9 Employment Change by Sector, 2011-2018 Q3 ............................................................................................ 37 Figure 10 Price Position ............................................................................................................................................... 60
Map 1 Site Location .................................................................................................................................................... 12 Map 2 Crime Index ...................................................................................................................................................... 19 Map 3 Location of Key Facilities and Services ............................................................................................................ 22 Map 4 Veranda Market Area ...................................................................................................................................... 25 Map 5 Major Employers, Metro Atlanta...................................................................................................................... 38 Map 6 Surveyed Senior Rental Communities ............................................................................................................. 47 Map 7 Surveyed Rental Communities ........................................................................................................................ 51 Map 8 Subsidized Rental Communities ...................................................................................................................... 55
Veranda at Assembly | Executive Summary
Page 1
1. EXECUTIVE SUMMARY
Integral Development has retained Real Property Research Group, Inc. (RPRG) to conduct a comprehensive market feasibility analysis for Veranda at Assembly, a proposed senior-oriented rental community in Doraville, DeKalb County, Georgia. Veranda at Assembly will offer 100 newly constructed rental units financed in part by nine percent Low Income Housing Tax Credits (LIHTC) allocated by the Georgia Department of Community Affairs (DCA). Eighty units will benefit from tax credits and will be reserved for households earning up to 30 percent, 60 percent, and 80 percent of the Area Median Income (AMI), adjusted for household size. Thirty of these LIHTC units will receive Project Based Rental Assistance (PBRA) through the DeKalb County Housing Authority. Veranda at Assembly will also offer 20 market rate units, which will be unencumbered by tenant rent and income restrictions. All units will be restricted to households with householder age 55 or older. Veranda at Assembly will be part of Assembly Yards, the first phase of a planned mixed-use and transit-oriented development called The Assembly on the 165-acre site of the former General Motors Doraville Plant. The following report, including the executive summary, is based on DCA’s 2019 market study requirements.
1. Project Description
The subject site is in the northern portion of Assembly Yards, the first phase of The Assembly mixed-use development in the City of Doraville. The subject site and The Assembly mixed-use development are situated on the site of the former General Motors Plant at the southeast corner of the Interstate 285 and Peachtree Industrial Boulevard interchange in northern DeKalb County.
Veranda at Assembly will offer 100 newly constructed senior rental units (55+) restricted to households earning up to 30 percent, 60 percent, and 80 percent of the Area Median Income (AMI), adjusted for household size. Twenty units will be market rate.
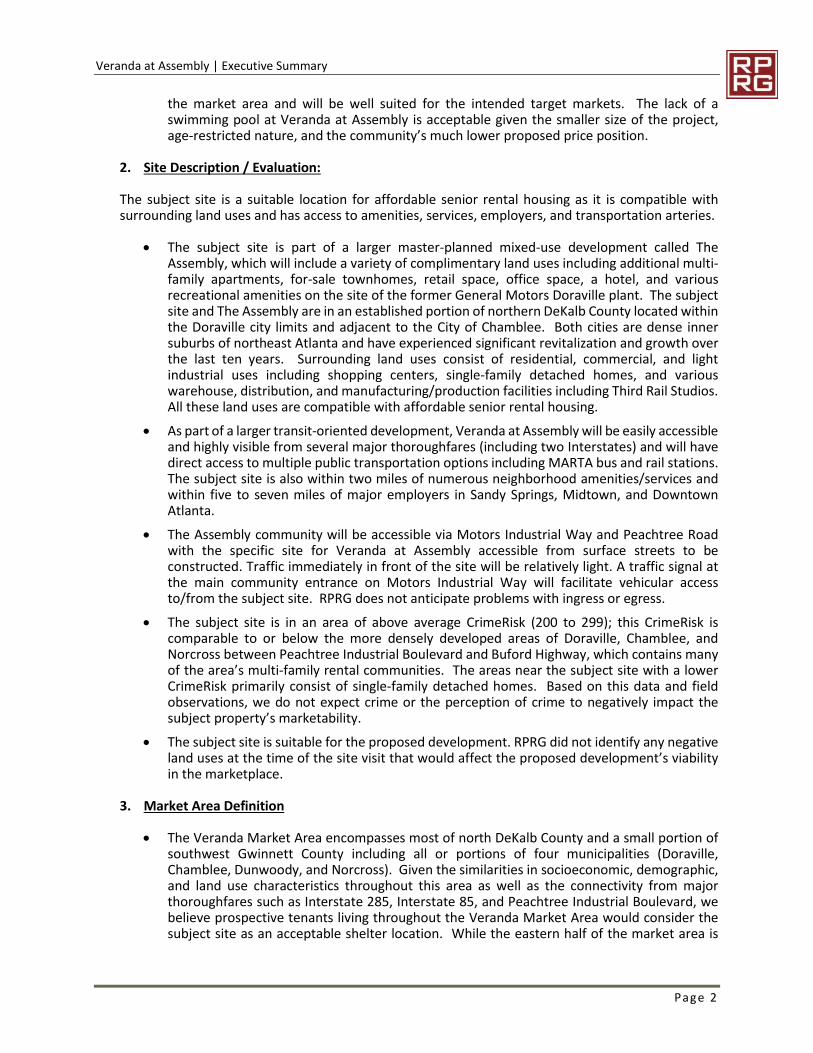
A detailed summary of the subject property, including the rent and unit configuration, is shown in the table below. The rents shown will include trash removal.
Veranda at Assembly will offer a range, refrigerator, dishwasher, garbage disposal, and microwave in the kitchen as well as ceiling fans, central heating and air-conditioning, washers/dryer connections, grab bars, and emergency call systems in each unit. These unit features will be competitive with surveyed senior and general occupancy rental communities in the market area including existing LIHTC communities. The proposed unit features will be well received by the target market.
Veranda at Assembly will have a community amenity package that will include a multi-purpose room, community garden, fitness center, game room, laundry room, and computer center. This amenity package will be competitive with existing senior LIHTC communities in
Unit Mix/Rents
Type Bed Bath Income Target Units Square Feet
Contract Rent
Proposed/Max LIHTC Rent
Utility Allowance
Gross LIHTC Rent
Mid-Rise 1 1 30% AMI / PBRA 30 700 $705 $289 $126 $415
Mid-Rise 1 1 60% AMI 25 700 N/A $705 $126 $831
Mid-Rise 1 1 80% AMI 25 700 N/A $705 $126 $831
Mid-Rise 2 2 Market 20 1,050 N/A $1,150 - $1,150Total 100
Lesser of contract rent and maximum LIHTC rent is analyzed for PBRA units.Source: Integral Development Rents include trash removal.
Veranda at Assembly | Executive Summary
Page 2
the market area and will be well suited for the intended target markets. The lack of a swimming pool at Veranda at Assembly is acceptable given the smaller size of the project, age-restricted nature, and the community’s much lower proposed price position.
2. Site Description / Evaluation:
The subject site is a suitable location for affordable senior rental housing as it is compatible with surrounding land uses and has access to amenities, services, employers, and transportation arteries.
The subject site is part of a larger master-planned mixed-use development called The Assembly, which will include a variety of complimentary land uses including additional multi-family apartments, for-sale townhomes, retail space, office space, a hotel, and various recreational amenities on the site of the former General Motors Doraville plant. The subject site and The Assembly are in an established portion of northern DeKalb County located within the Doraville city limits and adjacent to the City of Chamblee. Both cities are dense inner suburbs of northeast Atlanta and have experienced significant revitalization and growth over the last ten years. Surrounding land uses consist of residential, commercial, and light industrial uses including shopping centers, single-family detached homes, and various warehouse, distribution, and manufacturing/production facilities including Third Rail Studios. All these land uses are compatible with affordable senior rental housing.
As part of a larger transit-oriented development, Veranda at Assembly will be easily accessible and highly visible from several major thoroughfares (including two Interstates) and will have direct access to multiple public transportation options including MARTA bus and rail stations. The subject site is also within two miles of numerous neighborhood amenities/services and within five to seven miles of major employers in Sandy Springs, Midtown, and Downtown Atlanta.
The Assembly community will be accessible via Motors Industrial Way and Peachtree Road with the specific site for Veranda at Assembly accessible from surface streets to be constructed. Traffic immediately in front of the site will be relatively light. A traffic signal at the main community entrance on Motors Industrial Way will facilitate vehicular access to/from the subject site. RPRG does not anticipate problems with ingress or egress.
The subject site is in an area of above average CrimeRisk (200 to 299); this CrimeRisk is comparable to or below the more densely developed areas of Doraville, Chamblee, and Norcross between Peachtree Industrial Boulevard and Buford Highway, which contains many of the area’s multi-family rental communities. The areas near the subject site with a lower CrimeRisk primarily consist of single-family detached homes. Based on this data and field observations, we do not expect crime or the perception of crime to negatively impact the subject property’s marketability.
The subject site is suitable for the proposed development. RPRG did not identify any negative land uses at the time of the site visit that would affect the proposed development’s viability in the marketplace.
3. Market Area Definition
The Veranda Market Area encompasses most of north DeKalb County and a small portion of southwest Gwinnett County including all or portions of four municipalities (Doraville, Chamblee, Dunwoody, and Norcross). Given the similarities in socioeconomic, demographic, and land use characteristics throughout this area as well as the connectivity from major thoroughfares such as Interstate 285, Interstate 85, and Peachtree Industrial Boulevard, we believe prospective tenants living throughout the Veranda Market Area would consider the subject site as an acceptable shelter location. While the eastern half of the market area is
Veranda at Assembly | Executive Summary
Page 3
generally more affluent than the western portion of the market area, the subject site is located on the edge of the more affluent areas and is likely to draw tenants from both areas.
Despite its proximity, the market area does not extend into the adjacent cities of Brookhaven, Sandy Springs, or Tucker, which are distinct and separate submarkets with many intervening rental alternatives.
The boundaries of the Veranda Market Area and their approximate distance from the subject site are Fulton County (3.8 miles to the north), Jimmy Carter Boulevard (4.6 miles to the east), Dresden Drive and Briarcliff Road NE (2.5 miles to the south), and Fulton County (3.5 miles to the west).
4. Community Demographic Data
The Veranda Market Area’s household base has grown steadily over the last nineteen years, a trend projected to continue over the next two years. During this time, senior household growth in the market area outpaced total household growth (on a percentage basis) though this includes both net migration and aging in place. o The market area expanded steadily between the 2000 and 2010 Census counts, gaining
934 people (0.8 percent) and 468 households (1.0 percent) per year. Growth remained strong in the market area from 2010 to 2019 with population and household growth rates of 984 people (0.7 percent) and 374 households (0.7 percent) annually.
o Esri projects the market area will continue its strong growth with the addition of 1,211 people (0.9 percent) and 480 households (0.9 percent) per year over the next two years. This will bring the population in the market area to 139,846 and the household base to 55,105 in 2021.
o The Veranda Market Area added 387 households with householder age 55+ per year from 2010 to 2019. Strong senior household growth is expected to continue with the annual addition of 330 senior households (55+) from 2019 to 2021.
The demographics of the Veranda Market Area are reflective of dense suburban market with a mixture of household types.
o The two largest population cohorts in the market area are Adults age 35 to 61 (34.1 percent) and Young Adults age 20 to 34 (26.4 percent). Twenty percent of the market area’s population is age 55 or older.
o The market area’s household base was relatively distributed as of the 2010 Census with multi-person households without children and single persons accounting for a slightly higher percentage (roughly 33 to 36 percent each) of households than households with children (31.3 percent).
o Among renter households, 57.2 percent are comprised of young and working age adults age 25 to 44 while 15.5 percent are age 55 or older.
o Sixty-one percent of market area renter households contained one or two persons as of the 2010 Census while 13.6 percent contained three persons and 25.4 percent contained four or more persons.
Sixty-one percent of all households in the Veranda Market Area were renters in 2019, above the DeKalb County rental rate of 48.2 percent. Over the last nine years, renter households accounted for all net household growth. RPRG projects renter households will continue to account for a disproportionate percentage of net household growth (75 percent), which would increase the market area’s renter percentage slightly over the next two years to 61.2 percent.
Veranda at Assembly | Executive Summary
Page 4
The Veranda Market Area had a 2019 median income of $60,851 and a 2019 senior median income (55+) of $61,937. By tenure, senior households (55+) had a median income of $48,794 among renters and median income of $68,842 among owners. The market area has a significant proportion of low and moderate-income senior renter households (55+) including 26.4 percent earning less than $25,000, 24.8 percent earning $25,000 to $49,999, and 30.7 percent earning $50,000 to $99,999. Approximately 18 percent of senior renter households (55+) have incomes of $100,000 or more.
We do not believe foreclosed, abandoned, or vacant single/multi-family homes will impact the subject property’s ability to lease its units given its age-restricted and affordable nature.
5. Economic Data:
DeKalb County’s economy is performing very well with significant job growth over the past seven years, a trend expected to continue in the near term. The county’s unemployment rate is less than half of the recession-era peak and is just above state and national rates. DeKalb County’s continued economic growth will continue to drive housing demand in the market area.
The county’s unemployment rate has fallen to an eleven-year low of 4.0 percent in 2018, just above below state and national levels of 3.9 percent.
DeKalb County’s economy has steadily grown over the last seven years with the addition of more than 24,000 new jobs including an average of 5,500 new jobs over the last four years. This trend continued through the third quarter of 2018 with the net addition of 2,593 jobs.
Education-Health, Trade-Transportation-Utilities, and Professional-Business are DeKalb County’s largest economic sectors with a combined 55.3 percent of jobs. The Government sector accounts for 14.3 percent of the county’s jobs and is the only remaining sector to account for at least 10 percent of DeKalb County’s total employment.
Nine of 11 sectors added jobs in DeKalb County since 2011 including the three largest sectors. The Financial Activities sector added jobs at the fastest pace with net growth of 38.8 percent while the three largest sectors grew by 17.4 percent (Education-Health), 4.1 percent (Trade-Transportation-Utilities), and 10.1 percent (Professional-Business). The Government sector lost 10.9 percent of its jobs and Natural Resources-Mining sector lost 23.2 percent; however, the Natural Resources-Mining sector accounts for less than 0.1 percent of the county’s jobs.
Strong job growth continued in the county through the third quarter of 2018 and is likely to continue over the next three years as several additional economic expansions haven been announced within the last two years.
6. Project Specific Affordability and Demand Analysis:
Veranda at Assembly will contain 100 units including 80 LIHTC units reserved for households earning at or below 30 percent, 60 percent, and 80 percent of the Area Median Income (AMI). Twenty units will be market rate. Additionally, 30 LIHTC units will have PBRA (all 30 percent units) and minimum income limits will not apply for these units. For purposes of this analysis, the affordability analysis has been conducted without this additional subsidy to test if the subject property can be successful without PBRA. By AMI level:
o The proposed 30 percent units (without PBRA) will target renter householders (55+) earning from $12,450 to $16,845. The 30 units would need to capture 12.4 percent of the 243 income-qualified renter households (55+) to lease-up.
o The proposed 60 percent units will target renter householders (55+) earning from $24,930 to $33,690. The 25 proposed 60 percent units would need to capture 5.0 percent of the 498 income-qualified renter households (55+) to lease-up.
Veranda at Assembly | Executive Summary
Page 5
o The proposed 80 percent units will target renter householders (55+) earning from $24,930 to $44,920. The 25 proposed units at 80 percent AMI would need to capture 2.3 percent of the 1,066 income-qualified renter households (55+) to lease-up.
o All proposed LIHTC units will target renter householders (55+) earning from $12,450 to $44,920. The 80 proposed LIHTC units would need to capture 6.1 percent of the 1,309 income-qualified renter households (55+) to lease-up.
o The proposed market rate units will target renter householders (55+) earning from $34,500 to $71,880. The 20 proposed market rate units would need to capture 1.2 percent of the 1,689 income-qualified renter households (55+) to lease-up.
o All proposed units will target renter householders (55+) earning from $12,450 to $71,880. The 100 proposed units would need to capture 4.0 percent of the 2,476 income-qualified renter households (55+) to lease-up.
All affordability capture rates are within reasonable and achievable levels for an age-restricted rental community with or without PBRA on a portion of units indicating sufficient income-qualified renter households (55+) will exist in the market area as of 2021 to support the proposed 100 units at Veranda at Assembly.
We have calculated demand without PBRA assuming rents are set at the lesser of the proposed contract rent and maximum allowable LIHTC rent for PBRA units (30 percent AMI) to test market conditions. Capture rates for the subject property are 18.7 percent for 30 percent units, 7.6 percent for 60 percent units, 3.5 percent for 80 percent units, 9.2 percent for all LIHTC units, 1.8 percent for market rate units, and 6.1 percent for all units. As Veranda at Assembly will only offer one floor plan type at each AMI level, capture rates by floor plan are equal to capture rates by AMI. The overall capture rates by bedroom type are 9.2 percent for one-bedroom units and 1.8 percent for two-bedroom units. With the inclusion of PBRA, the capture rate for 30 percent LIHTC units and the project overall would be reduced.
All capture rates are within DCA thresholds with and without PBRA on a portion of units and indicate sufficient demand in the market area to support the proposed Veranda at Assembly.
7. Competitive Rental Analysis
RPRG surveyed five senior rental communities and 19 general occupancy communities in the market area including five senior and one general occupancy LIHTC properties. The rental market is performing well with limited vacancies especially among senior LIHTC communities.
The five senior communities reported an aggregate vacancy rate of 1.1 percent including PBRA units and a 2.3 percent vacancy rate excluding PBRA units. All five senior communities also reported lengthy waiting lists for LIHTC and PBRA units. Among the 19 general occupancy communities surveyed, the aggregate vacancy rate was 2.8 percent for more than 4,600 units and the lone LIHTC community was fully occupied with a waiting list. Average effective rents among surveyed senior communities (including incentives and the cost of trash removal) were:
o One-bedroom units had an average effective rent of $762 for 692 square feet or $1.10 per square foot. One-bedroom LIHTC rents ranged from $325 for 30 percent units to $814 for 60 percent units. The average effective market rate rent among surveyed communities was $1,002 for 684 square feet or $1.46 per square foot.
o Two-bedroom units had an average effective rent of $888 for 912 square feet or $0.97 per square foot. Two-bedroom LIHTC rents ranged from $380 for 30 percent units to $930 for 60 percent units. The average effective market rate rent among surveyed communities was $1,190 for 911 square feet or $1.31 per square foot.
Veranda at Assembly | Executive Summary
Page 6
Average effective rents among surveyed general occupancy communities (including incentives and the cost of trash removal) were:
o One-bedroom units had an average effective rent of $1,141 with an average unit size of 810 square feet and an average rent per square foot of $1.41. Upper Tier communities reported an average effective one-bedroom rent of $1,423 compared to $936 at Lower Tier communities. The long one-bedroom LIHTC rent was $820 for 60 percent units.
o Two-bedroom units had an average effective rent of $1,393 with an average unit size of 1,164 square feet and an average rent per square foot of $1.20. Upper Tier communities reported an average effective two-bedroom rent of $1,810 compared to $1,115 at Lower Tier communities. The lone two-bedroom LIHTC rent was $980 for 60 percent units.
Based on comparable market rate units in the market area, “average market rent” is $1,308 for one-bedroom units and $1,641 for two-bedroom units. The subject property’s proposed 30 percent, 60 percent, and 80 percent rents all have rent advantages ranging from 85.5 to 352.6 percent with an overall LIHTC average of 185.7 percent. While not necessarily expected to have a rent advantage, the proposed market rate rents have a rent advantage 42.7 percent.
No LIHTC communities have received allocations in the Veranda Market Area over the last three years. Outside of LIHTC communities, three market rate rental communities are currently under construction including two general occupancy communities (Windsor Parkview Phase II and SLX Atlanta) and one senior community (Attiva Peachtree). Given Attiva Peachtree’s advertised rents will be more than $1,000 higher than those proposed at the subject property, it will not directly compete with the subject property’s market rate units. The two general occupancy communities under construction will offer a combined 503 rental units and will also not directly compete with the subject property due to differences in age and income targeting.
8. Absorption/Stabilization Estimates
Based on the product to be constructed, the inclusion of PBRA on 30 units, and the factors discussed above, we conservatively estimate Veranda at Assembly’s will lease-up at a rate of at least 15 units per month. This overall absorption estimate is a weighted average based on an estimated absorption rate of 11 units per month for LIHTC and market rate units and 25 units per month for PBRA units. At this rate, the subject property will reach a stabilized occupancy of at least 93 percent in six to seven months. If the subject property did not have PBRA on 30 of its 100 units, it would still reach a stabilized occupancy of at least 93 percent within eight to nine months.
Based on strong senior household growth, low vacancy rates, reasonable affordability and demand capture rates, and the attractive product to be constructed, we do not expect Veranda at Assembly to have negative impact on existing or planned LIHTC communities in the Veranda Market Area.
9. Overall Conclusion / Recommendation
Based on projected senior household growth, reasonable affordability and demand capture rates, and strong senior and general occupancy rental market conditions, sufficient demand exists to support the proposed units at Veranda at Assembly. As such, RPRG believes that the proposed Veranda at Assembly will be able to successfully reach and maintain a stabilized occupancy of at least 93 percent following its entrance into the rental market. The subject property will be competitively positioned
Veranda at Assembly | Executive Summary
Page 7
with the existing senior and general occupancy LIHTC and market rate communities in the Veranda Market Area and will offer a high-quality affordable rental community at an appealing site location. We recommend proceeding with the project as planned.
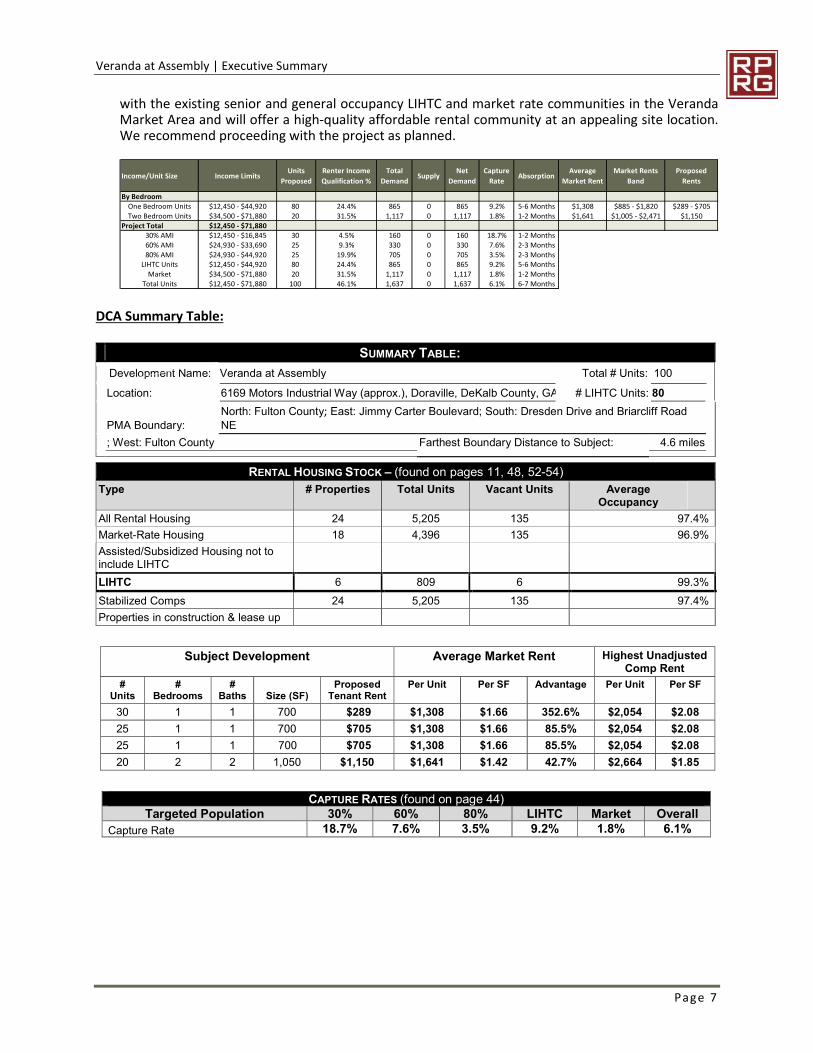
DCA Summary Table:
Income/Unit Size Income Limits Units Proposed
Renter Income Qualification %
Total Demand Supply Net
DemandCapture
Rate Absorption Average Market Rent
Market Rents Band
Proposed Rents
By BedroomOne Bedroom Units $12,450 - $44,920 80 24.4% 865 0 865 9.2% 5-6 Months $1,308 $885 - $1,820 $289 - $705Two Bedroom Units $34,500 - $71,880 20 31.5% 1,117 0 1,117 1.8% 1-2 Months $1,641 $1,005 - $2,471 $1,150
Project Total $12,450 - $71,88030% AMI $12,450 - $16,845 30 4.5% 160 0 160 18.7% 1-2 Months60% AMI $24,930 - $33,690 25 9.3% 330 0 330 7.6% 2-3 Months80% AMI $24,930 - $44,920 25 19.9% 705 0 705 3.5% 2-3 Months
LIHTC Units $12,450 - $44,920 80 24.4% 865 0 865 9.2% 5-6 MonthsMarket $34,500 - $71,880 20 31.5% 1,117 0 1,117 1.8% 1-2 Months
Total Units $12,450 - $71,880 100 46.1% 1,637 0 1,637 6.1% 6-7 Months
SUMMARY TABLE: Development Name: Veranda at Assembly Total # Units: 100
Location: 6169 Motors Industrial Way (approx.), Doraville, DeKalb County, GA # LIHTC Units: 80
PMA Boundary: North: Fulton County; East: Jimmy Carter Boulevard; South: Dresden Drive and Briarcliff Road NE
; West: Fulton County Farthest Boundary Distance to Subject: 4.6 miles
RENTAL HOUSING STOCK – (found on pages 11, 48, 52-54) Type # Properties Total Units Vacant Units Average
Occupancy
All Rental Housing 24 5,205 135 97.4% Market-Rate Housing 18 4,396 135 96.9% Assisted/Subsidized Housing not to include LIHTC
LIHTC 6 809 6 99.3% Stabilized Comps 24 5,205 135 97.4% Properties in construction & lease up
Subject Development Average Market Rent Highest Unadjusted Comp Rent
# Units
# Bedrooms
# Baths
Size (SF)
Proposed Tenant Rent
Per Unit Per SF Advantage Per Unit Per SF
30 1 1 700 $289 $1,308 $1.66 352.6% $2,054 $2.08 25 1 1 700 $705 $1,308 $1.66 85.5% $2,054 $2.08 25 1 1 700 $705 $1,308 $1.66 85.5% $2,054 $2.08 20 2 2 1,050 $1,150 $1,641 $1.42 42.7% $2,664 $1.85
CAPTURE RATES (found on page 44) Targeted Population 30% 60% 80% LIHTC Market Overall
Capture Rate 18.7% 7.6% 3.5% 9.2% 1.8% 6.1%
Veranda at Assembly | Introduction
Page 8
2. INTRODUCTION
A. Overview of Subject The subject of this report is Veranda at Assembly, a proposed senior-oriented rental community in Doraville, DeKalb County, Georgia. Veranda at Assembly will offer 100 newly constructed rental units financed in part by nine percent Low Income Housing Tax Credits (LIHTC) allocated by the Georgia Department of Community Affairs (DCA). Eighty units will benefit from tax credits and will be reserved for households earning up to 30 percent, 60 percent, and 80 percent of the Area Median Income (AMI), adjusted for household size. Thirty of these LIHTC units will receive Project Based Rental Assistance (PBRA) through the DeKalb County Housing Authority. Veranda at Assembly will also offer 20 market rate units, which will be unencumbered by tenant rent and income restrictions. All units will be restricted to households with householder age 55 or older. Veranda at Assembly will be part of Assembly Yards, the first phase of a planned mixed-use and transit-oriented development called The Assembly on the 165-acre site of the former General Motors Doraville Plant.
B. Purpose of Report The purpose of this market study is to perform a market feasibility analysis through an examination of the economic context, a demographic analysis of the defined market area, a competitive housing analysis, a derivation of demand, and an affordability analysis.
C. Format of Report The report format is comprehensive and conforms to DCA’s 2019 Market Study Manual and Qualified Allocation Plan (QAP). The market study also considered the National Council of Housing Market Analysts’ (NCHMA) recommended Model Content Standards and Market Study Index.
D. Client, Intended User, and Intended Use The Client is Integral Development (Developer). Along with the Client, the Intended Users are DCA, potential lenders, and investors.
E. Applicable Requirements This market study is intended to conform to the requirements of the following:
DCA’s 2019 Market Study Manual and Qualified Allocation Plan (QAP). The National Council of Housing Market Analysts’ (NCHMA) Recommended Model Content.
F. Scope of Work To determine the appropriate scope of work for the assignment, we considered the intended use of the market study, the needs of the user, the complexity of the property, and other pertinent factors. Our concluded scope of work is described below:
Please refer to Appendix 5 for a detailed list of DCA requirements as well as the corresponding pages of requirements within the report.
Michael Riley (Senior Analyst) conducted a site visit on May 1, 2019. Primary information gathered through field and phone interviews was used throughout the
various sections of this report. The interviewees included rental community property
Veranda at Assembly | Introduction
Page 9
managers and planning/development officials with the City of Doraville, City of Chamblee, City of Norcross, City of Dunwoody, DeKalb County, and Gwinnett County.
This report utilizes HUD’s 2018 Rent and Income Limits per DCA’s 2019 QAP. All pertinent information obtained was incorporated in the appropriate section(s) of this
report.
G. Report Limitations The conclusions reached in a market assessment are inherently subjective and should not be relied upon as a determinative predictor of results that will actually occur in the marketplace. There can be no assurance that the estimates made or assumptions employed in preparing this report will in fact be realized or that other methods or assumptions might not be appropriate. The conclusions expressed in this report are as of the date of this report, and an analysis conducted as of another date may require different conclusions. The actual results achieved will depend on a variety of factors, including the performance of management, the impact of changes in general and local economic conditions, and the absence of material changes in the regulatory or competitive environment. Reference is made to the statement of Underlying Assumptions and Limiting Conditions contained in Appendix I of this report.
Veranda at Assembly | Project Description
Page 10
3. PROJECT DESCRIPTION
A. Project Overview Veranda at Assembly is a proposed 100-unit senior rental community that will be newly constructed and restricted to households with householder age 55 or older. Eighty units (80 percent) will benefit from tax credits and will be reserved for households earning at or below 30 percent, 60 percent, and 80 percent of the Area Median Income (AMI), adjusted for household size; 30 LIHTC units will also receive Project Based Rental Assistance (PBRA) through the DeKalb County Housing Authority. Tenants of PBRA units will only pay a percentage of their adjusted gross income toward rent and will not be subject to minimum income limits. Twenty units at Veranda at Assembly will be market rate.
Veranda at Assembly will be part of the first phase of The Assembly mixed-use development (Assembly Yards), which is located on the site of the former General Motors Doraville Plant. In addition to the subject property, Assembly Yards is expected to contain a mixture of for-sale townhomes, multi-family rental housing, office space, retail/restaurant space, recreational amenities, and a hotel in addition to Third Rail Studios (film/tv product facility) and the SERTA Simmons corporate headquarters which are now open. The planned transit-oriented development will be connected to the existing Doraville MARTA station and future Interstate 285 express lanes with autonomous shuttle transportation provided by NAVI throughout the development.
B. Project Type and Target Market Veranda at Assembly will target very low to moderate income renter households age 55 and older. The unit mix of one and two-bedroom units will primarily target single persons and couples.
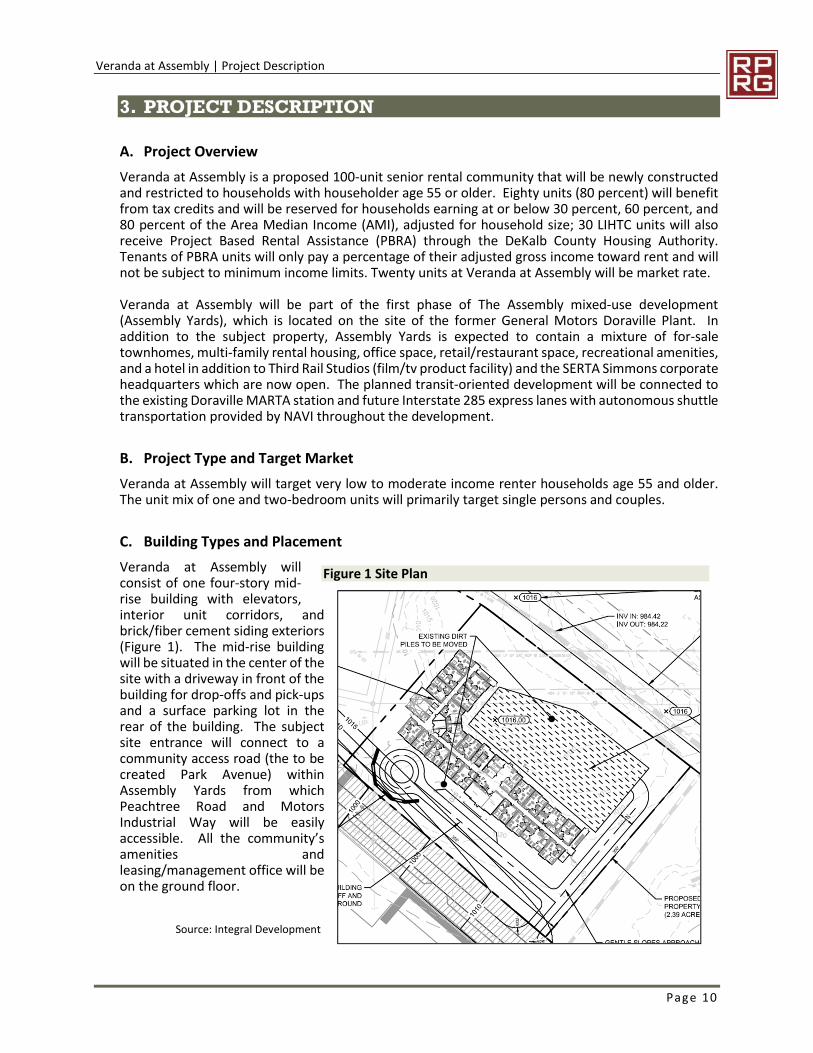
C. Building Types and Placement Veranda at Assembly will consist of one four-story mid-rise building with elevators, interior unit corridors, and brick/fiber cement siding exteriors (Figure 1). The mid-rise building will be situated in the center of the site with a driveway in front of the building for drop-offs and pick-ups and a surface parking lot in the rear of the building. The subject site entrance will connect to a community access road (the to be created Park Avenue) within Assembly Yards from which Peachtree Road and Motors Industrial Way will be easily accessible. All the community’s amenities and leasing/management office will be on the ground floor.
Figure 1 Site Plan
Source: Integral Development
Veranda at Assembly | Project Description
Page 11
D. Detailed Project Description
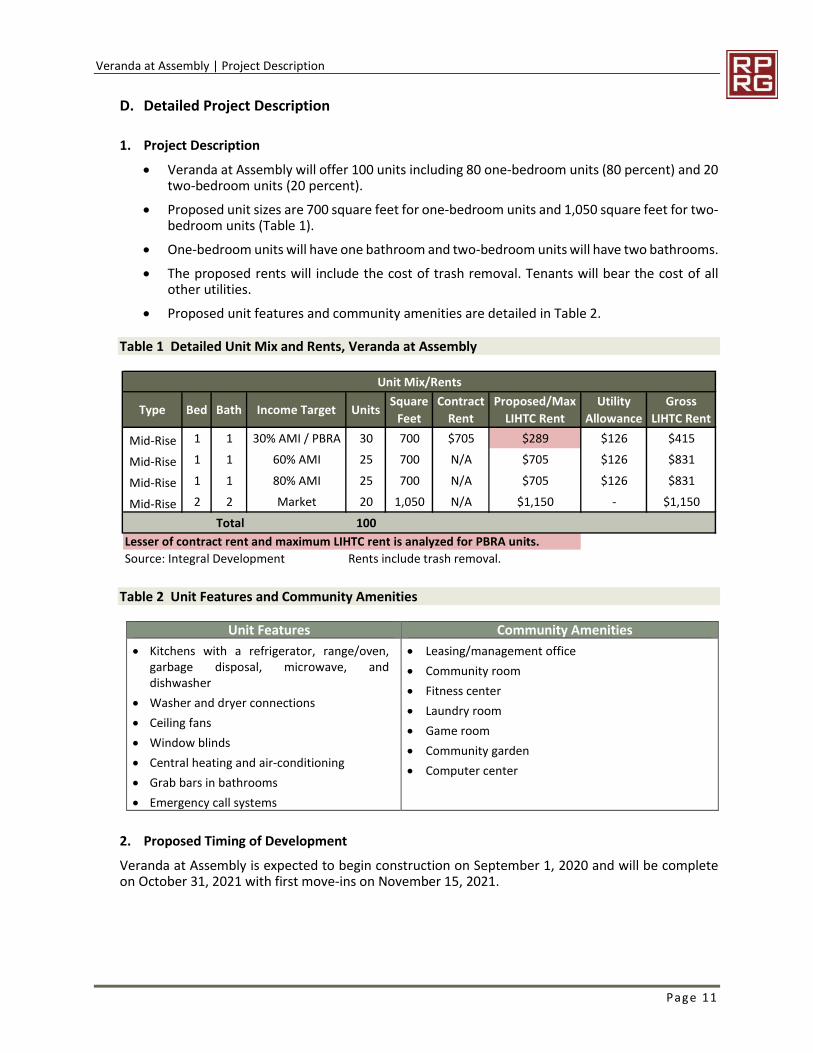
1. Project Description Veranda at Assembly will offer 100 units including 80 one-bedroom units (80 percent) and 20
two-bedroom units (20 percent). Proposed unit sizes are 700 square feet for one-bedroom units and 1,050 square feet for two-
bedroom units (Table 1). One-bedroom units will have one bathroom and two-bedroom units will have two bathrooms. The proposed rents will include the cost of trash removal. Tenants will bear the cost of all
other utilities. Proposed unit features and community amenities are detailed in Table 2.
Table 1 Detailed Unit Mix and Rents, Veranda at Assembly
Table 2 Unit Features and Community Amenities
Unit Features Community Amenities Kitchens with a refrigerator, range/oven,
garbage disposal, microwave, and dishwasher
Washer and dryer connections Ceiling fans Window blinds Central heating and air-conditioning Grab bars in bathrooms Emergency call systems
Leasing/management office Community room Fitness center Laundry room Game room Community garden Computer center
2. Proposed Timing of Development Veranda at Assembly is expected to begin construction on September 1, 2020 and will be complete on October 31, 2021 with first move-ins on November 15, 2021.
Unit Mix/Rents
Type Bed Bath Income Target Units Square Feet
Contract Rent
Proposed/Max LIHTC Rent
Utility Allowance
Gross LIHTC Rent
Mid-Rise 1 1 30% AMI / PBRA 30 700 $705 $289 $126 $415
Mid-Rise 1 1 60% AMI 25 700 N/A $705 $126 $831
Mid-Rise 1 1 80% AMI 25 700 N/A $705 $126 $831
Mid-Rise 2 2 Market 20 1,050 N/A $1,150 - $1,150Total 100
Lesser of contract rent and maximum LIHTC rent is analyzed for PBRA units.Source: Integral Development Rents include trash removal.
Veranda at Assembly | Site Evaluation
Page 12
4. SITE EVALUATION
A. Site Analysis
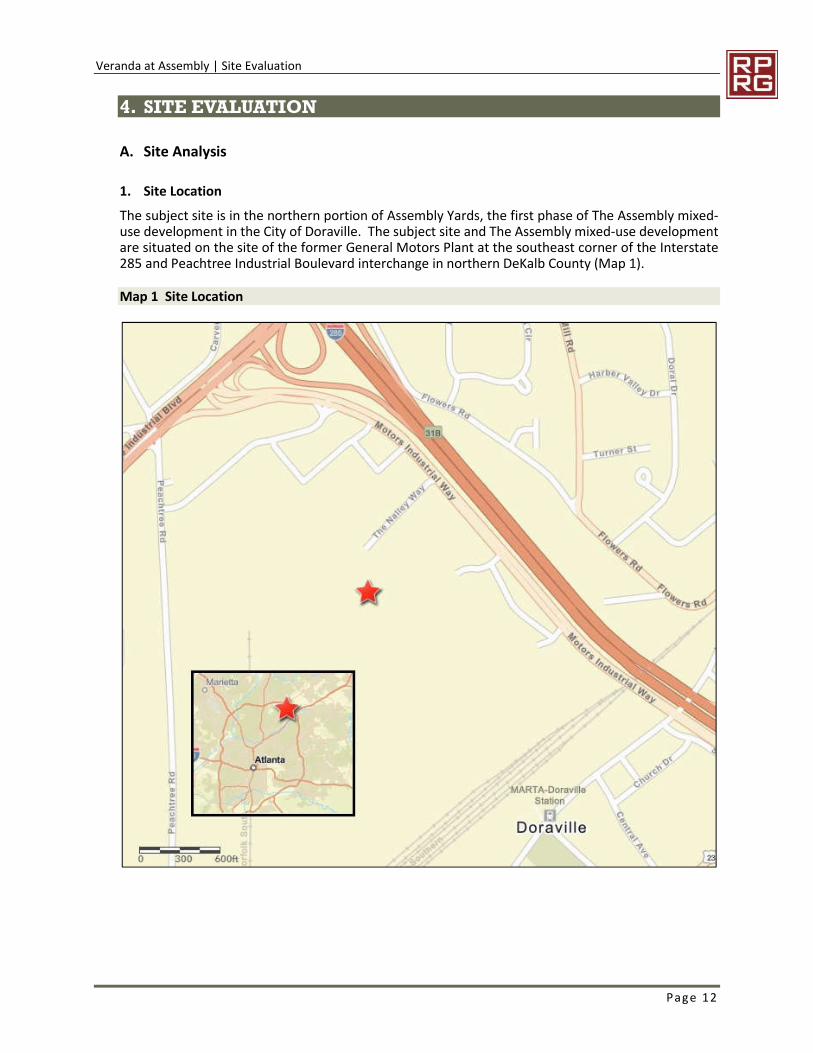
1. Site Location The subject site is in the northern portion of Assembly Yards, the first phase of The Assembly mixed-use development in the City of Doraville. The subject site and The Assembly mixed-use development are situated on the site of the former General Motors Plant at the southeast corner of the Interstate 285 and Peachtree Industrial Boulevard interchange in northern DeKalb County (Map 1).
Map 1 Site Location
Veranda at Assembly | Site Evaluation
Page 13
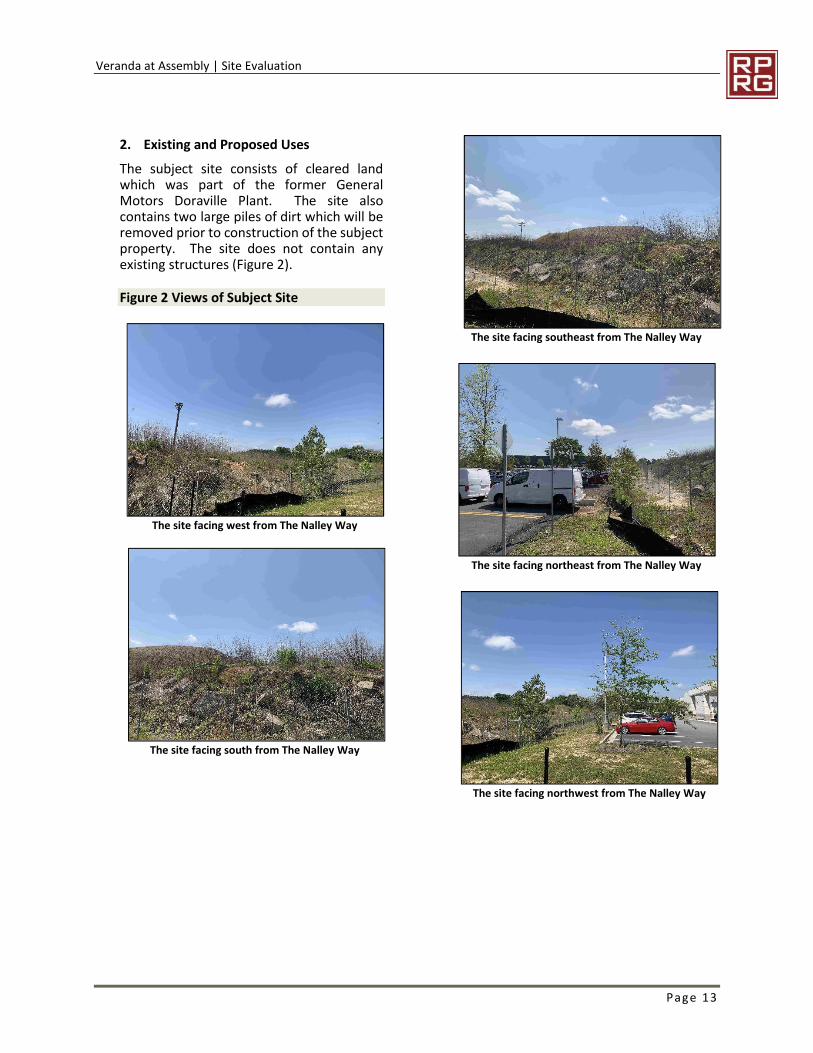
2. Existing and Proposed Uses The subject site consists of cleared land which was part of the former General Motors Doraville Plant. The site also contains two large piles of dirt which will be removed prior to construction of the subject property. The site does not contain any existing structures (Figure 2).
Figure 2 Views of Subject Site
The site facing west from The Nalley Way
The site facing south from The Nalley Way
The site facing southeast from The Nalley Way
The site facing northeast from The Nalley Way
The site facing northwest from The Nalley Way
Veranda at Assembly | Site Evaluation
Page 14
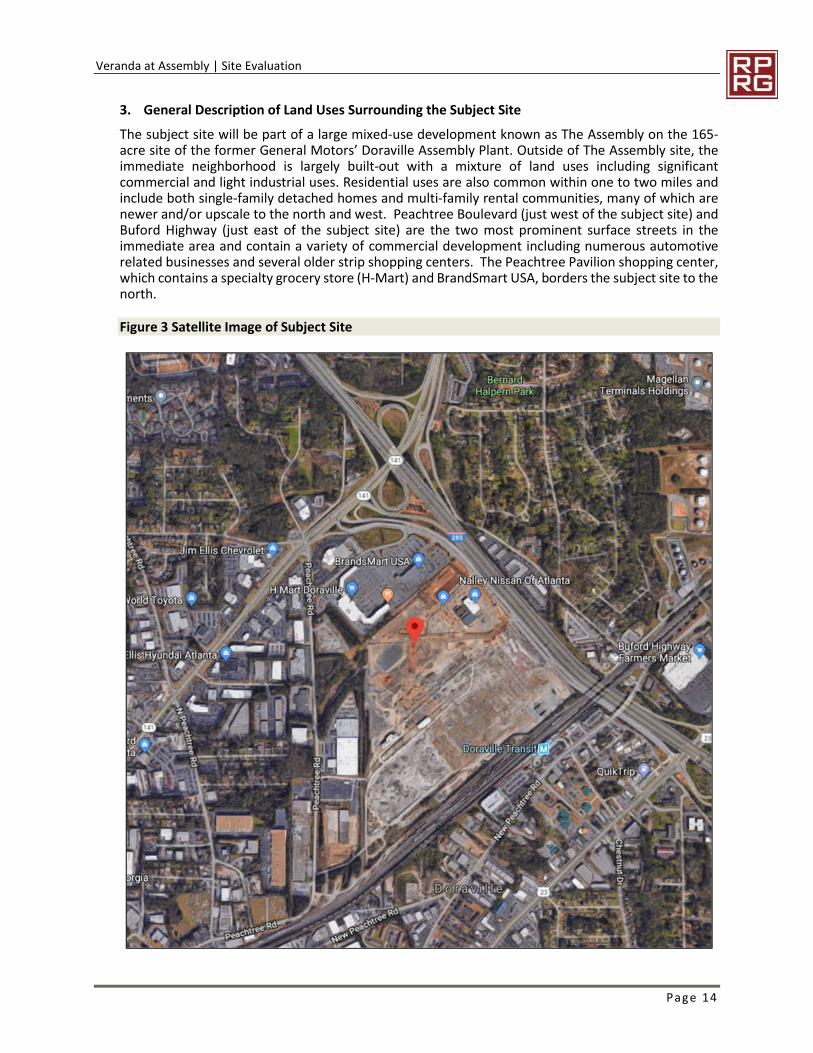
3. General Description of Land Uses Surrounding the Subject Site The subject site will be part of a large mixed-use development known as The Assembly on the 165-acre site of the former General Motors’ Doraville Assembly Plant. Outside of The Assembly site, the immediate neighborhood is largely built-out with a mixture of land uses including significant commercial and light industrial uses. Residential uses are also common within one to two miles and include both single-family detached homes and multi-family rental communities, many of which are newer and/or upscale to the north and west. Peachtree Boulevard (just west of the subject site) and Buford Highway (just east of the subject site) are the two most prominent surface streets in the immediate area and contain a variety of commercial development including numerous automotive related businesses and several older strip shopping centers. The Peachtree Pavilion shopping center, which contains a specialty grocery store (H-Mart) and BrandSmart USA, borders the subject site to the north.
Figure 3 Satellite Image of Subject Site
Veranda at Assembly | Site Evaluation
Page 15
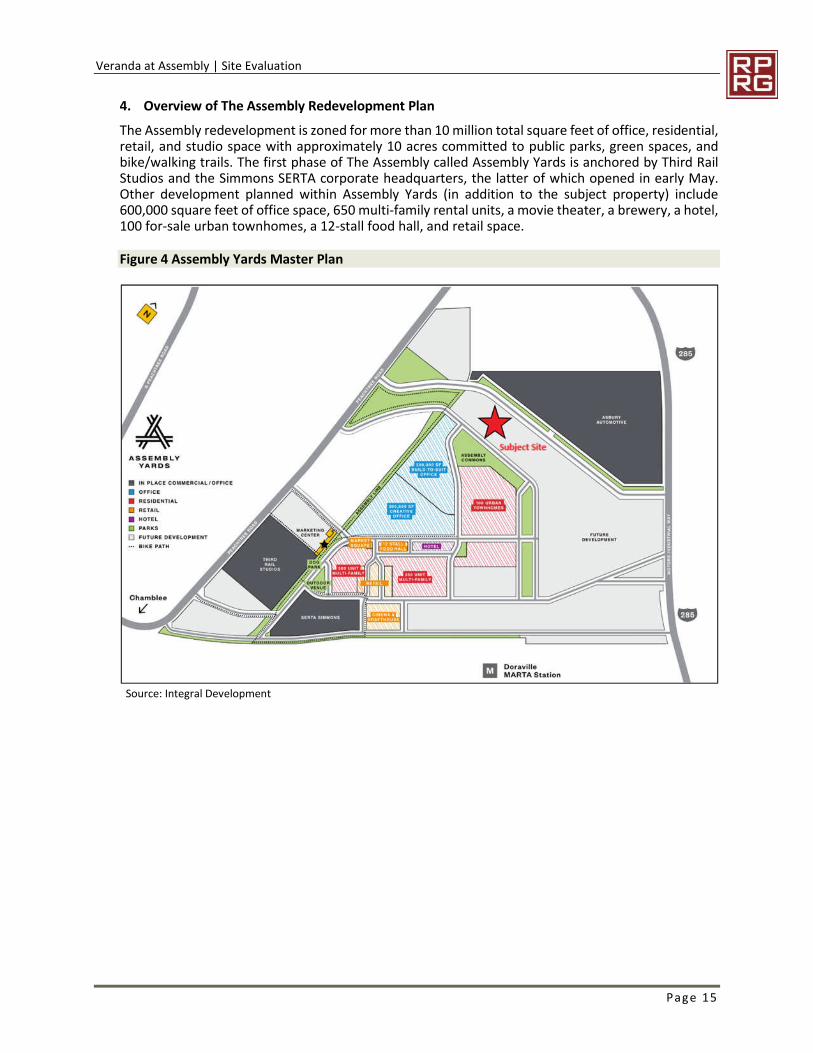
4. Overview of The Assembly Redevelopment Plan The Assembly redevelopment is zoned for more than 10 million total square feet of office, residential, retail, and studio space with approximately 10 acres committed to public parks, green spaces, and bike/walking trails. The first phase of The Assembly called Assembly Yards is anchored by Third Rail Studios and the Simmons SERTA corporate headquarters, the latter of which opened in early May. Other development planned within Assembly Yards (in addition to the subject property) include 600,000 square feet of office space, 650 multi-family rental units, a movie theater, a brewery, a hotel, 100 for-sale urban townhomes, a 12-stall food hall, and retail space.
Figure 4 Assembly Yards Master Plan
Source: Integral Development
Veranda at Assembly | Site Evaluation
Page 16
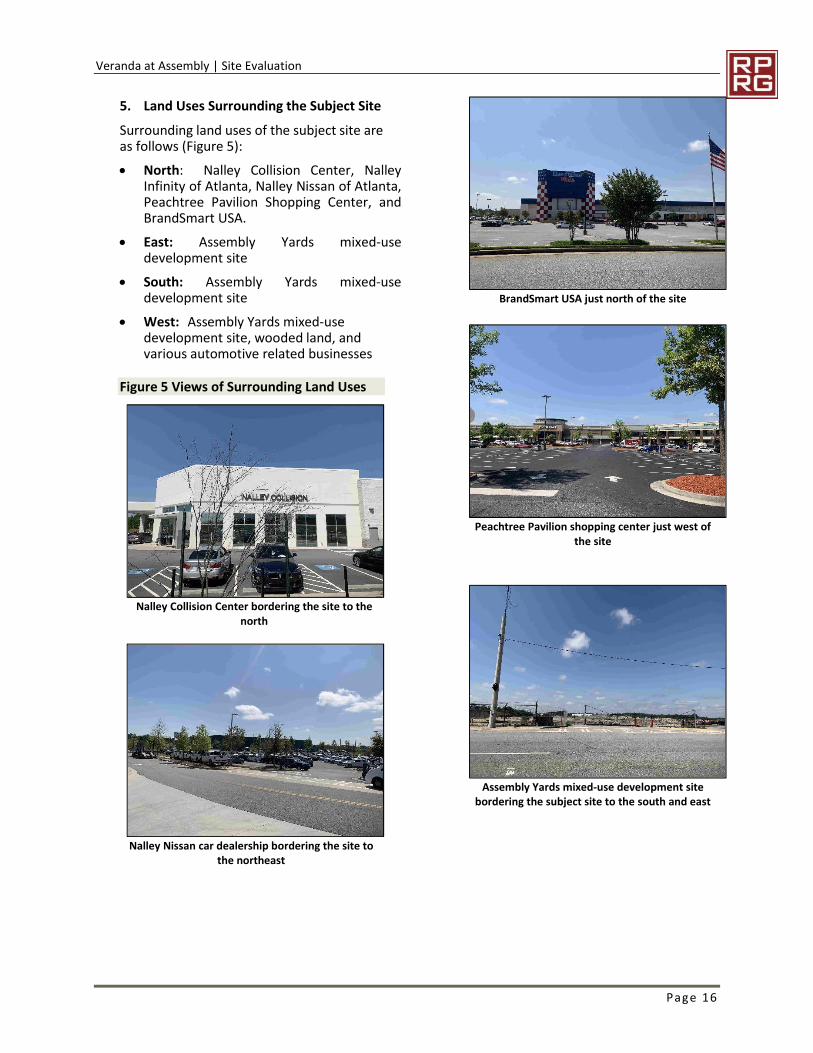
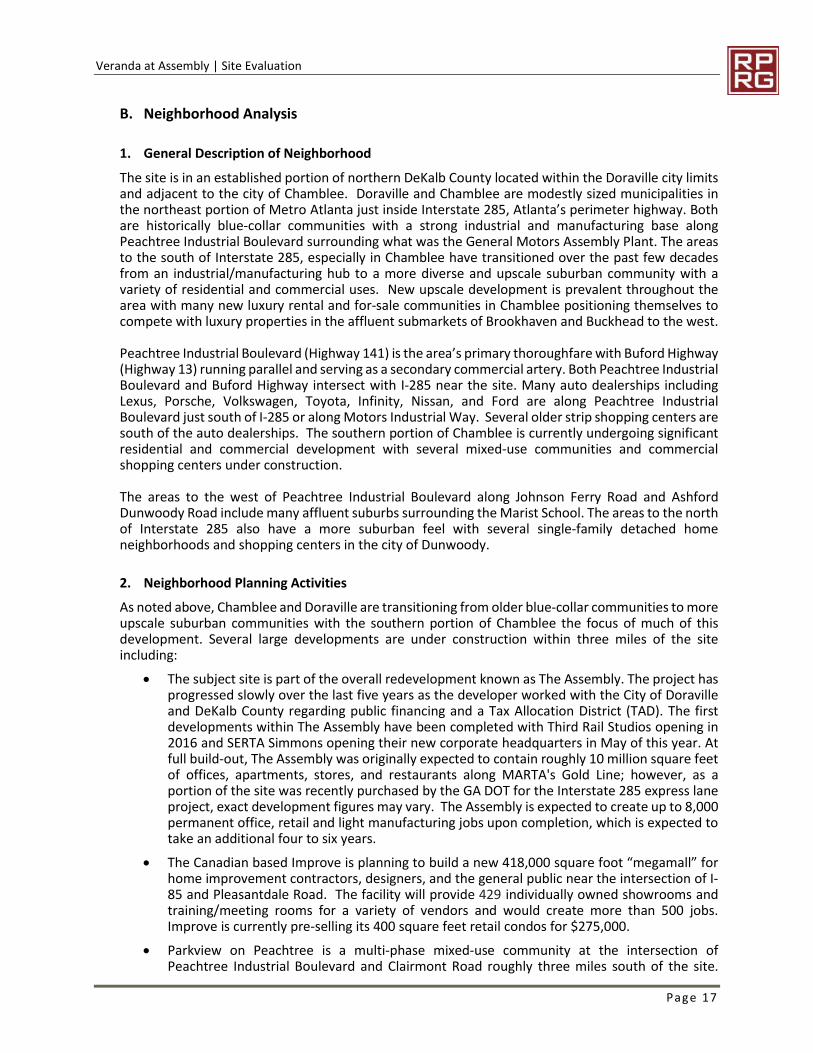
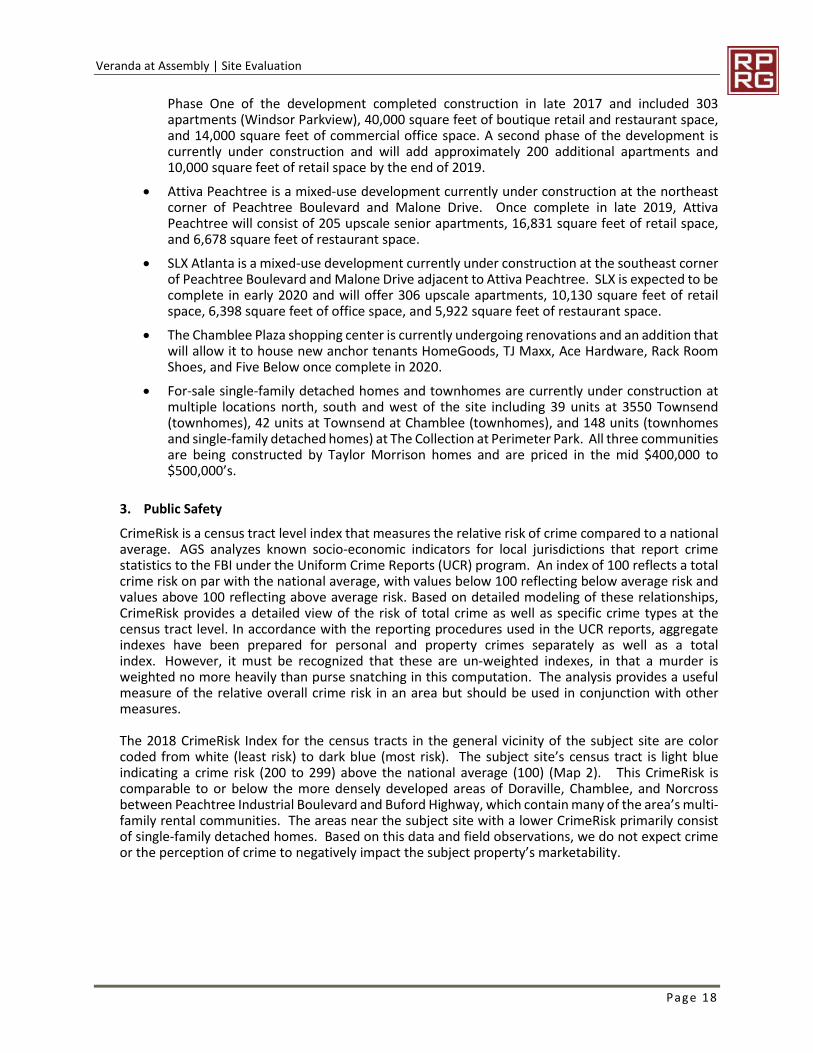
5. Land Uses Surrounding the Subject Site Surrounding land uses of the subject site are as follows (Figure 5): North: Nalley Collision Center, Nalley
Infinity of Atlanta, Nalley Nissan of Atlanta, Peachtree Pavilion Shopping Center, and BrandSmart USA.
East: Assembly Yards mixed-use development site
South: Assembly Yards mixed-use development site
West: Assembly Yards mixed-use development site, wooded land, and various automotive related businesses
Figure 5 Views of Surrounding Land Uses
Nalley Collision Center bordering the site to the
north
Nalley Nissan car dealership bordering the site to
the northeast
BrandSmart USA just north of the site
Peachtree Pavilion shopping center just west of
the site
Assembly Yards mixed-use development site
bordering the subject site to the south and east
Veranda at Assembly | Site Evaluation
Page 17
B. Neighborhood Analysis
1. General Description of Neighborhood The site is in an established portion of northern DeKalb County located within the Doraville city limits and adjacent to the city of Chamblee. Doraville and Chamblee are modestly sized municipalities in the northeast portion of Metro Atlanta just inside Interstate 285, Atlanta’s perimeter highway. Both are historically blue-collar communities with a strong industrial and manufacturing base along Peachtree Industrial Boulevard surrounding what was the General Motors Assembly Plant. The areas to the south of Interstate 285, especially in Chamblee have transitioned over the past few decades from an industrial/manufacturing hub to a more diverse and upscale suburban community with a variety of residential and commercial uses. New upscale development is prevalent throughout the area with many new luxury rental and for-sale communities in Chamblee positioning themselves to compete with luxury properties in the affluent submarkets of Brookhaven and Buckhead to the west. Peachtree Industrial Boulevard (Highway 141) is the area’s primary thoroughfare with Buford Highway (Highway 13) running parallel and serving as a secondary commercial artery. Both Peachtree Industrial Boulevard and Buford Highway intersect with I-285 near the site. Many auto dealerships including Lexus, Porsche, Volkswagen, Toyota, Infinity, Nissan, and Ford are along Peachtree Industrial Boulevard just south of I-285 or along Motors Industrial Way. Several older strip shopping centers are south of the auto dealerships. The southern portion of Chamblee is currently undergoing significant residential and commercial development with several mixed-use communities and commercial shopping centers under construction.
The areas to the west of Peachtree Industrial Boulevard along Johnson Ferry Road and Ashford Dunwoody Road include many affluent suburbs surrounding the Marist School. The areas to the north of Interstate 285 also have a more suburban feel with several single-family detached home neighborhoods and shopping centers in the city of Dunwoody.
2. Neighborhood Planning Activities As noted above, Chamblee and Doraville are transitioning from older blue-collar communities to more upscale suburban communities with the southern portion of Chamblee the focus of much of this development. Several large developments are under construction within three miles of the site including:
The subject site is part of the overall redevelopment known as The Assembly. The project has progressed slowly over the last five years as the developer worked with the City of Doraville and DeKalb County regarding public financing and a Tax Allocation District (TAD). The first developments within The Assembly have been completed with Third Rail Studios opening in 2016 and SERTA Simmons opening their new corporate headquarters in May of this year. At full build-out, The Assembly was originally expected to contain roughly 10 million square feet of offices, apartments, stores, and restaurants along MARTA's Gold Line; however, as a portion of the site was recently purchased by the GA DOT for the Interstate 285 express lane project, exact development figures may vary. The Assembly is expected to create up to 8,000 permanent office, retail and light manufacturing jobs upon completion, which is expected to take an additional four to six years.
The Canadian based Improve is planning to build a new 418,000 square foot “megamall” for home improvement contractors, designers, and the general public near the intersection of I-85 and Pleasantdale Road. The facility will provide 429 individually owned showrooms and training/meeting rooms for a variety of vendors and would create more than 500 jobs. Improve is currently pre-selling its 400 square feet retail condos for $275,000.
Parkview on Peachtree is a multi-phase mixed-use community at the intersection of Peachtree Industrial Boulevard and Clairmont Road roughly three miles south of the site.
Veranda at Assembly | Site Evaluation
Page 18
Phase One of the development completed construction in late 2017 and included 303 apartments (Windsor Parkview), 40,000 square feet of boutique retail and restaurant space, and 14,000 square feet of commercial office space. A second phase of the development is currently under construction and will add approximately 200 additional apartments and 10,000 square feet of retail space by the end of 2019.
Attiva Peachtree is a mixed-use development currently under construction at the northeast corner of Peachtree Boulevard and Malone Drive. Once complete in late 2019, Attiva Peachtree will consist of 205 upscale senior apartments, 16,831 square feet of retail space, and 6,678 square feet of restaurant space.
SLX Atlanta is a mixed-use development currently under construction at the southeast corner of Peachtree Boulevard and Malone Drive adjacent to Attiva Peachtree. SLX is expected to be complete in early 2020 and will offer 306 upscale apartments, 10,130 square feet of retail space, 6,398 square feet of office space, and 5,922 square feet of restaurant space.
The Chamblee Plaza shopping center is currently undergoing renovations and an addition that will allow it to house new anchor tenants HomeGoods, TJ Maxx, Ace Hardware, Rack Room Shoes, and Five Below once complete in 2020.
For-sale single-family detached homes and townhomes are currently under construction at multiple locations north, south and west of the site including 39 units at 3550 Townsend (townhomes), 42 units at Townsend at Chamblee (townhomes), and 148 units (townhomes and single-family detached homes) at The Collection at Perimeter Park. All three communities are being constructed by Taylor Morrison homes and are priced in the mid $400,000 to $500,000’s.
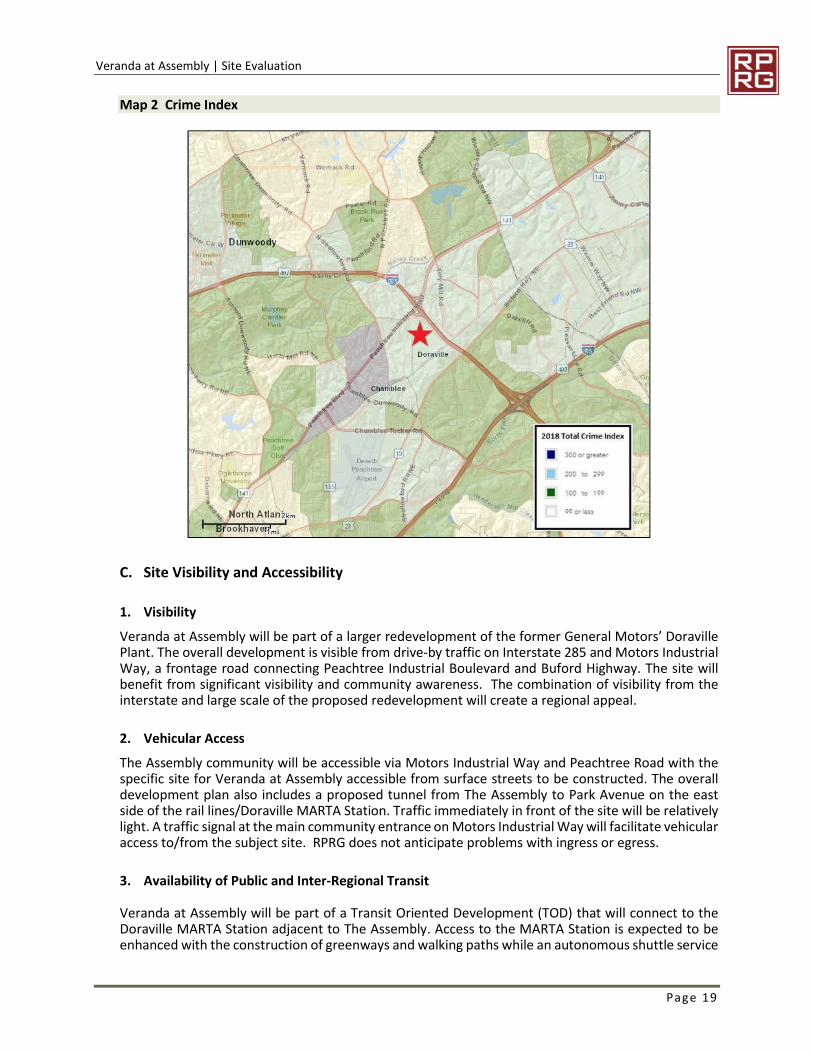
3. Public Safety CrimeRisk is a census tract level index that measures the relative risk of crime compared to a national average. AGS analyzes known socio-economic indicators for local jurisdictions that report crime statistics to the FBI under the Uniform Crime Reports (UCR) program. An index of 100 reflects a total crime risk on par with the national average, with values below 100 reflecting below average risk and values above 100 reflecting above average risk. Based on detailed modeling of these relationships, CrimeRisk provides a detailed view of the risk of total crime as well as specific crime types at the census tract level. In accordance with the reporting procedures used in the UCR reports, aggregate indexes have been prepared for personal and property crimes separately as well as a total index. However, it must be recognized that these are un-weighted indexes, in that a murder is weighted no more heavily than purse snatching in this computation. The analysis provides a useful measure of the relative overall crime risk in an area but should be used in conjunction with other measures.
The 2018 CrimeRisk Index for the census tracts in the general vicinity of the subject site are color coded from white (least risk) to dark blue (most risk). The subject site’s census tract is light blue indicating a crime risk (200 to 299) above the national average (100) (Map 2). This CrimeRisk is comparable to or below the more densely developed areas of Doraville, Chamblee, and Norcross between Peachtree Industrial Boulevard and Buford Highway, which contain many of the area’s multi-family rental communities. The areas near the subject site with a lower CrimeRisk primarily consist of single-family detached homes. Based on this data and field observations, we do not expect crime or the perception of crime to negatively impact the subject property’s marketability.
Veranda at Assembly | Site Evaluation
Page 19
Map 2 Crime Index
C. Site Visibility and Accessibility
1. Visibility Veranda at Assembly will be part of a larger redevelopment of the former General Motors’ Doraville Plant. The overall development is visible from drive-by traffic on Interstate 285 and Motors Industrial Way, a frontage road connecting Peachtree Industrial Boulevard and Buford Highway. The site will benefit from significant visibility and community awareness. The combination of visibility from the interstate and large scale of the proposed redevelopment will create a regional appeal.
2. Vehicular Access The Assembly community will be accessible via Motors Industrial Way and Peachtree Road with the specific site for Veranda at Assembly accessible from surface streets to be constructed. The overall development plan also includes a proposed tunnel from The Assembly to Park Avenue on the east side of the rail lines/Doraville MARTA Station. Traffic immediately in front of the site will be relatively light. A traffic signal at the main community entrance on Motors Industrial Way will facilitate vehicular access to/from the subject site. RPRG does not anticipate problems with ingress or egress.
3. Availability of Public and Inter-Regional Transit
Veranda at Assembly will be part of a Transit Oriented Development (TOD) that will connect to the Doraville MARTA Station adjacent to The Assembly. Access to the MARTA Station is expected to be enhanced with the construction of greenways and walking paths while an autonomous shuttle service
Veranda at Assembly | Site Evaluation
Page 20
provided by NAVI will be available to transport residents and patrons to the MARTA station and throughout other portions of the community. The subject site and The Assembly community will be accessible from Motors Industrial Way between Peachtree Industrial Boulevard and Buford Highway, both of which connect to Interstate 285 and the communities of Chamblee, Brookhaven, and ultimately Buckhead. Interstate 85 runs parallel to Peachtree Industrial Boulevard just east of the site and provides an alternate connection to downtown Atlanta and north to Gwinnett County.
Peachtree-DeKalb Airport (PDK), one mile to the southeast, is a county owned general aviation facility served by Southern Airways Express. Priority Jet also provides charter service through PDK. Hartsfield Jackson International Airport is approximately 22 miles southwest of the subject site.
4. Pedestrian Access Residents of Veranda at Assembly will be within walking distance of the various mixed-uses of The Assembly once they are constructed. As the subject site is one the first planned developments, it will not immediately be within walking distance of commercial uses other than those in the adjacent Peachtree Plaza shopping center. The site is within walking distance of MARTA’s Doraville rail station, which will be accessed by a newly constructed tunnel.
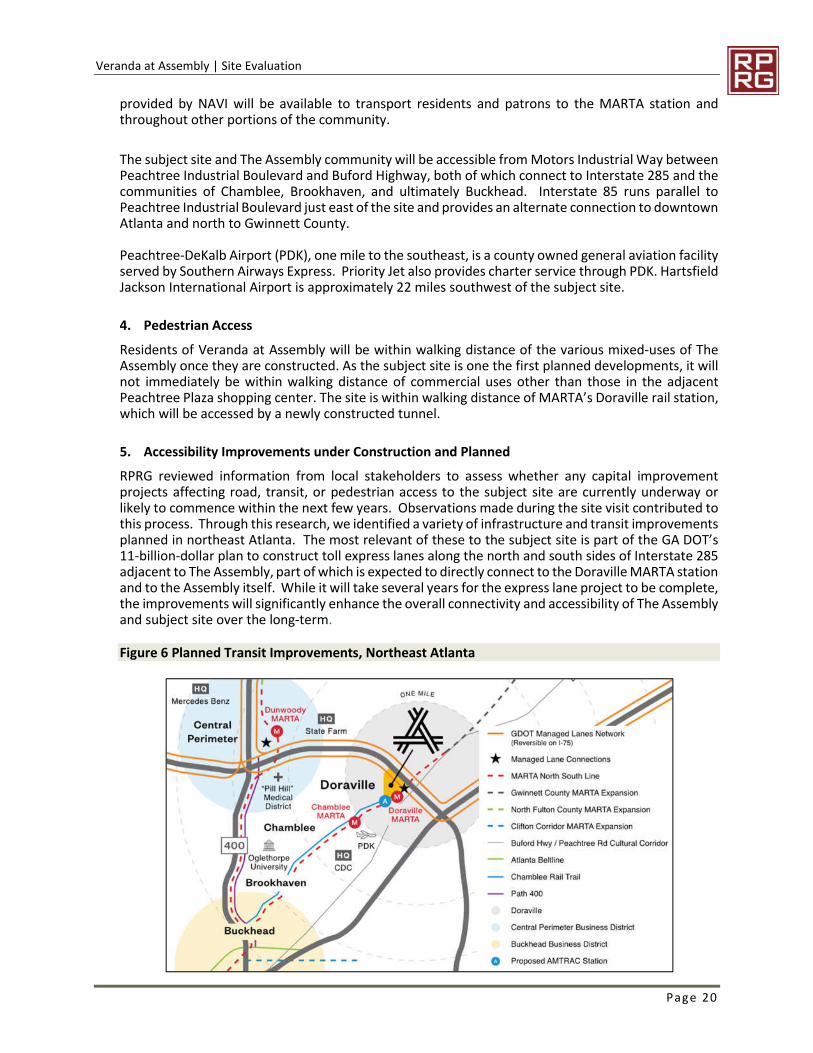
5. Accessibility Improvements under Construction and Planned RPRG reviewed information from local stakeholders to assess whether any capital improvement projects affecting road, transit, or pedestrian access to the subject site are currently underway or likely to commence within the next few years. Observations made during the site visit contributed to this process. Through this research, we identified a variety of infrastructure and transit improvements planned in northeast Atlanta. The most relevant of these to the subject site is part of the GA DOT’s 11-billion-dollar plan to construct toll express lanes along the north and south sides of Interstate 285 adjacent to The Assembly, part of which is expected to directly connect to the Doraville MARTA station and to the Assembly itself. While it will take several years for the express lane project to be complete, the improvements will significantly enhance the overall connectivity and accessibility of The Assembly and subject site over the long-term.
Figure 6 Planned Transit Improvements, Northeast Atlanta
Veranda at Assembly | Site Evaluation
Page 21
D. Residential Support Network
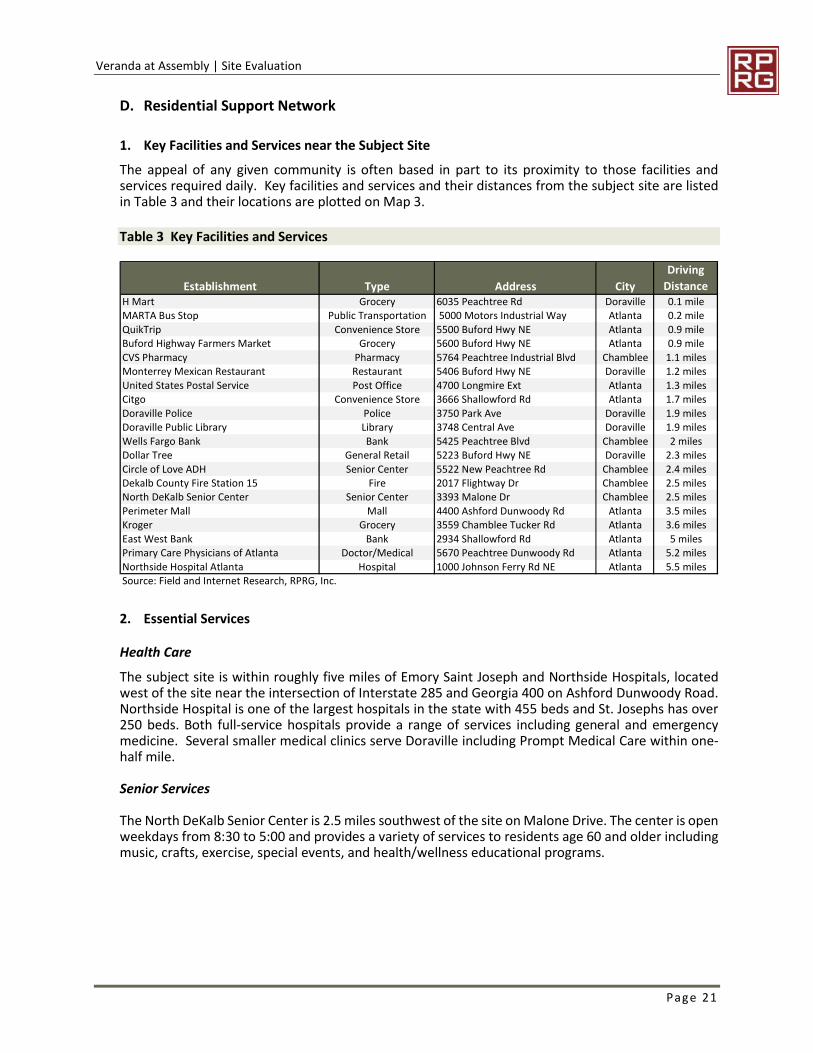
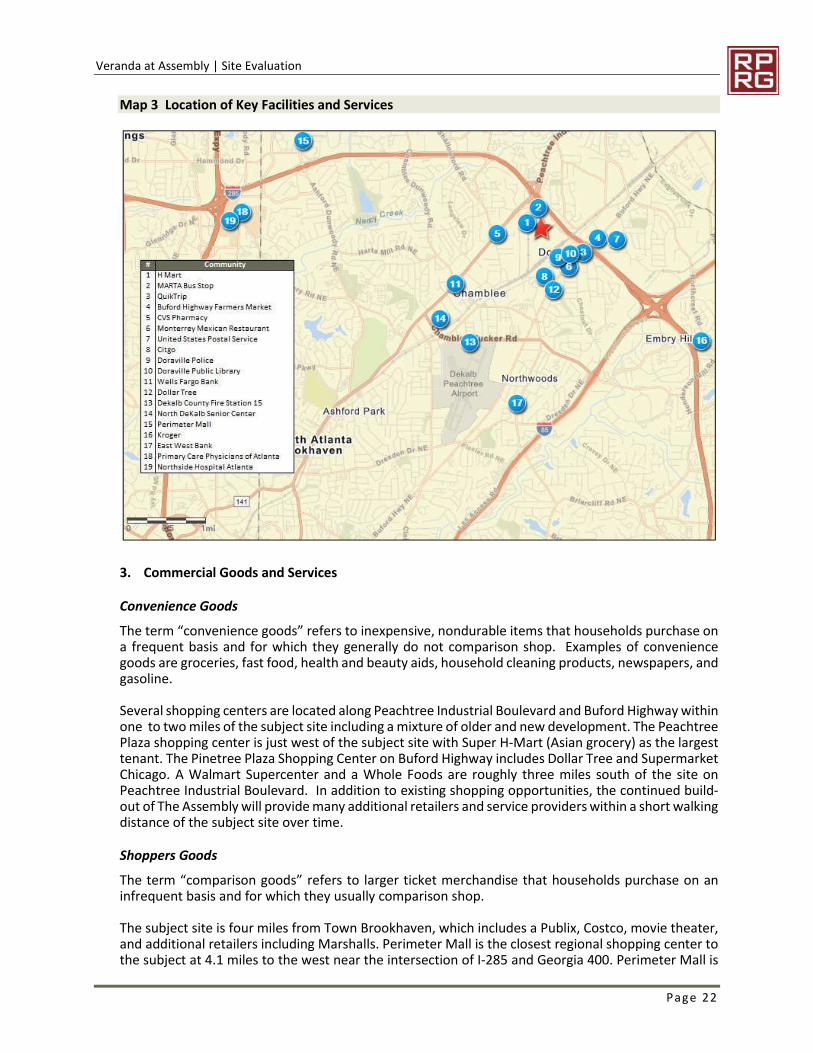
1. Key Facilities and Services near the Subject Site The appeal of any given community is often based in part to its proximity to those facilities and services required daily. Key facilities and services and their distances from the subject site are listed in Table 3 and their locations are plotted on Map 3.
Table 3 Key Facilities and Services
2. Essential Services
Health Care
The subject site is within roughly five miles of Emory Saint Joseph and Northside Hospitals, located west of the site near the intersection of Interstate 285 and Georgia 400 on Ashford Dunwoody Road. Northside Hospital is one of the largest hospitals in the state with 455 beds and St. Josephs has over 250 beds. Both full-service hospitals provide a range of services including general and emergency medicine. Several smaller medical clinics serve Doraville including Prompt Medical Care within one-half mile.
Senior Services
The North DeKalb Senior Center is 2.5 miles southwest of the site on Malone Drive. The center is open weekdays from 8:30 to 5:00 and provides a variety of services to residents age 60 and older including music, crafts, exercise, special events, and health/wellness educational programs.
Establishment Type Address CityDriving
DistanceH Mart Grocery 6035 Peachtree Rd Doraville 0.1 mileMARTA Bus Stop Public Transportation 5000 Motors Industrial Way Atlanta 0.2 mileQuikTrip Convenience Store 5500 Buford Hwy NE Atlanta 0.9 mileBuford Highway Farmers Market Grocery 5600 Buford Hwy NE Atlanta 0.9 mileCVS Pharmacy Pharmacy 5764 Peachtree Industrial Blvd Chamblee 1.1 milesMonterrey Mexican Restaurant Restaurant 5406 Buford Hwy NE Doraville 1.2 milesUnited States Postal Service Post Office 4700 Longmire Ext Atlanta 1.3 milesCitgo Convenience Store 3666 Shallowford Rd Atlanta 1.7 milesDoraville Police Police 3750 Park Ave Doraville 1.9 milesDoraville Public Library Library 3748 Central Ave Doraville 1.9 milesWells Fargo Bank Bank 5425 Peachtree Blvd Chamblee 2 milesDollar Tree General Retail 5223 Buford Hwy NE Doraville 2.3 milesCircle of Love ADH Senior Center 5522 New Peachtree Rd Chamblee 2.4 milesDekalb County Fire Station 15 Fire 2017 Flightway Dr Chamblee 2.5 milesNorth DeKalb Senior Center Senior Center 3393 Malone Dr Chamblee 2.5 milesPerimeter Mall Mall 4400 Ashford Dunwoody Rd Atlanta 3.5 milesKroger Grocery 3559 Chamblee Tucker Rd Atlanta 3.6 milesEast West Bank Bank 2934 Shallowford Rd Atlanta 5 milesPrimary Care Physicians of Atlanta Doctor/Medical 5670 Peachtree Dunwoody Rd Atlanta 5.2 milesNorthside Hospital Atlanta Hospital 1000 Johnson Ferry Rd NE Atlanta 5.5 milesSource: Field and Internet Research, RPRG, Inc.
Veranda at Assembly | Site Evaluation
Page 22
Map 3 Location of Key Facilities and Services
3. Commercial Goods and Services
Convenience Goods
The term “convenience goods” refers to inexpensive, nondurable items that households purchase on a frequent basis and for which they generally do not comparison shop. Examples of convenience goods are groceries, fast food, health and beauty aids, household cleaning products, newspapers, and gasoline.
Several shopping centers are located along Peachtree Industrial Boulevard and Buford Highway within one to two miles of the subject site including a mixture of older and new development. The Peachtree Plaza shopping center is just west of the subject site with Super H-Mart (Asian grocery) as the largest tenant. The Pinetree Plaza Shopping Center on Buford Highway includes Dollar Tree and Supermarket Chicago. A Walmart Supercenter and a Whole Foods are roughly three miles south of the site on Peachtree Industrial Boulevard. In addition to existing shopping opportunities, the continued build-out of The Assembly will provide many additional retailers and service providers within a short walking distance of the subject site over time.
Shoppers Goods
The term “comparison goods” refers to larger ticket merchandise that households purchase on an infrequent basis and for which they usually comparison shop.
The subject site is four miles from Town Brookhaven, which includes a Publix, Costco, movie theater, and additional retailers including Marshalls. Perimeter Mall is the closest regional shopping center to the subject at 4.1 miles to the west near the intersection of I-285 and Georgia 400. Perimeter Mall is
Veranda at Assembly | Site Evaluation
Page 23
an upscale mall with 1.5 million square feet of leasable space, making it the second largest mall in Georgia. The mall has over 200 stores and 4 major stores include Von Maur, Dillard's, Macy's, and Nordstrom.
4. Recreational Amenities
The subject site is near a variety of city and county parks including Bernard Halpern Park to the north, Flowers Park to the east, Brook Run Park to the northwest, and Murphy Candler Park to the west. Brookrun is 100+ acres with a dog run, walking trails, playground, and community garden. Murphy Candler Park comprises 135 acres and includes a walking trail around a lake, swimming pool, sports fields, and picnic areas. The Peachtree Golf Club and Oglethorpe University’s Museum, Library, and Performing Arts Center are south of the site within roughly four miles and the Doraville Public library is within one-half mile of the site to the east. In addition to these existing recreational amenities, several amenities are planned within The Assembly mixed-use development including a dog park, walking trails, an outdoor event space, and public greenspace all of which will be within a short walking distance of the subject site.
5. Location of Low-Income Housing A list and map of existing low-income housing in the Veranda Market Area are provided in the Existing Low-Income Rental Housing section of this report, starting on page 55.
E. Site Conclusion The subject site will be part of a larger master planned community on the site of the former GM Doraville Plant, which is expected to be completed over the next four to six years. While the overall appeal of the site will be largely dependent on the completion of the proposed infrastructure and other complimentary uses, the site is highly visible and easily accessible from multiple transportation options including Interstates 285 and 85, Georgia 400, and an adjacent MARTA rail station. All surrounding residential and commercial land uses, as well as those planned as part of The Assembly master-planned community, are compatible with the proposed use of affordable senior rental housing and will enhance the subject site’s appeal once completed. The local submarket is also experiencing significant growth, which will continue to improve the quality of development surrounding the site. Based on these factors, the subject site is appropriate for its intended use and it will be well received by its target markets.
Veranda at Assembly | Market Area
Page 24
5. MARKET AREA
A. Introduction The primary market area for Veranda at Assembly is defined as the geographic area from which future residents of the community would primarily be drawn and in which competitive rental housing alternatives are located. In defining the market area, RPRG sought to accommodate the joint interests of conservatively estimating housing demand and reflecting the realities and dynamics of the local rental housing marketplace.
B. Delineation of Market Area The Veranda Market Area encompasses most of north DeKalb County and a small portion of southwest Gwinnett County including all or portions of four municipalities (Doraville, Chamblee, Dunwoody, and Norcross) (Map 4). Given the similarities in socioeconomic, demographic, and land use characteristics throughout this area as well as the connectivity from major thoroughfares such as Interstate 285, Interstate 85, and Peachtree Industrial Boulevard, we believe prospective tenants living throughout the Veranda Market Area would consider the subject site as an acceptable shelter location. While the eastern half of the market area is generally more affluent than the western portion of the market area, the subject site is located on the edge of the more affluent areas and is likely to draw tenants from both areas. Despite its proximity, the market area does not extend into the adjacent cities of Brookhaven, Sandy Springs, or Tucker, which are distinct and separate submarkets with many intervening rental alternatives.
The boundaries of the Veranda Market Area and their approximate distance from the subject site are:
North: Fulton County ................................................................................... (3.8 miles) East: Jimmy Carter Boulevard ...................................................................... (4.6 miles) South: Dresden Drive and Briarcliff Road NE ................................................ (2.5 miles) West: Fulton County ..................................................................................... (3.5 miles)
The Veranda Market Area is compared to DeKalb County, which is considered the secondary market area for the purposes of this analysis. Demand estimates are based only on the Veranda Market Area.
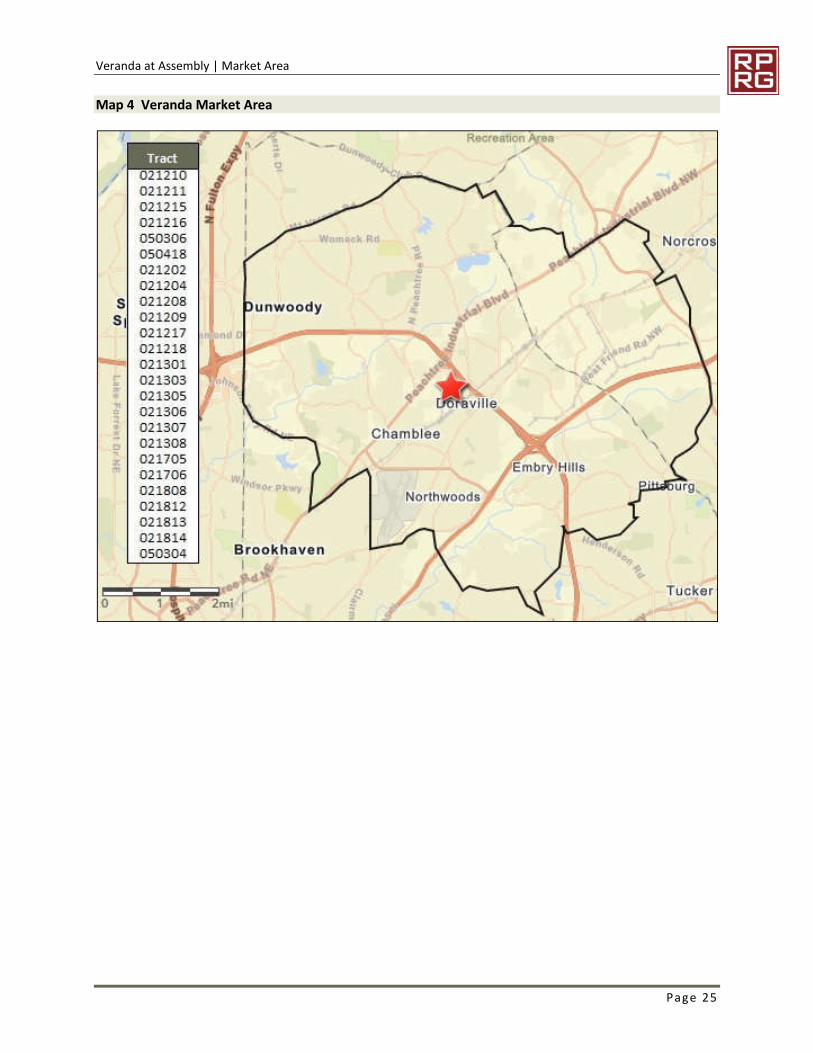
Veranda at Assembly | Market Area
Page 25
Map 4 Veranda Market Area
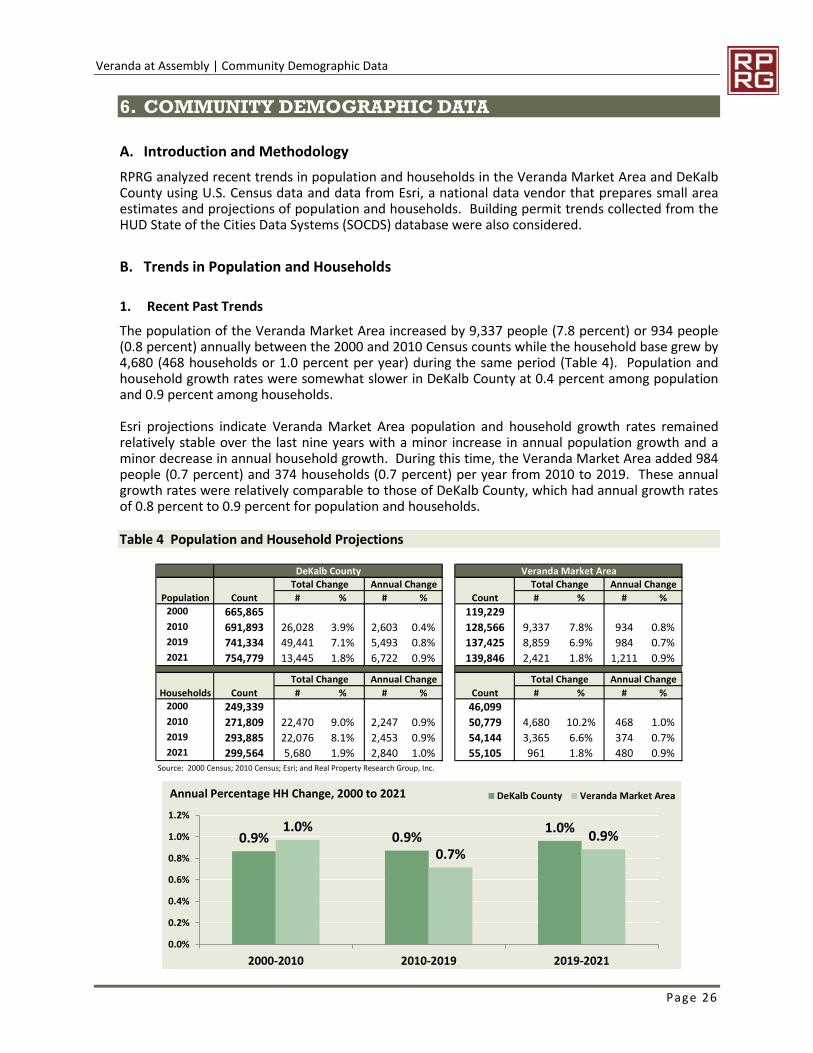
Veranda at Assembly | Community Demographic Data
Page 26
6. COMMUNITY DEMOGRAPHIC DATA
A. Introduction and Methodology RPRG analyzed recent trends in population and households in the Veranda Market Area and DeKalb County using U.S. Census data and data from Esri, a national data vendor that prepares small area estimates and projections of population and households. Building permit trends collected from the HUD State of the Cities Data Systems (SOCDS) database were also considered.
B. Trends in Population and Households
1. Recent Past Trends The population of the Veranda Market Area increased by 9,337 people (7.8 percent) or 934 people (0.8 percent) annually between the 2000 and 2010 Census counts while the household base grew by 4,680 (468 households or 1.0 percent per year) during the same period (Table 4). Population and household growth rates were somewhat slower in DeKalb County at 0.4 percent among population and 0.9 percent among households.
Esri projections indicate Veranda Market Area population and household growth rates remained relatively stable over the last nine years with a minor increase in annual population growth and a minor decrease in annual household growth. During this time, the Veranda Market Area added 984 people (0.7 percent) and 374 households (0.7 percent) per year from 2010 to 2019. These annual growth rates were relatively comparable to those of DeKalb County, which had annual growth rates of 0.8 percent to 0.9 percent for population and households.
Table 4 Population and Household Projections
DeKalb County Veranda Market AreaTotal Change Annual Change Total Change Annual Change
Population Count # % # % Count # % # %2000 665,865 119,2292010 691,893 26,028 3.9% 2,603 0.4% 128,566 9,337 7.8% 934 0.8%2019 741,334 49,441 7.1% 5,493 0.8% 137,425 8,859 6.9% 984 0.7%2021 754,779 13,445 1.8% 6,722 0.9% 139,846 2,421 1.8% 1,211 0.9%
Total Change Annual Change Total Change Annual ChangeHouseholds Count # % # % Count # % # %
2000 249,339 46,0992010 271,809 22,470 9.0% 2,247 0.9% 50,779 4,680 10.2% 468 1.0%2019 293,885 22,076 8.1% 2,453 0.9% 54,144 3,365 6.6% 374 0.7%2021 299,564 5,680 1.9% 2,840 1.0% 55,105 961 1.8% 480 0.9%
Source: 2000 Census; 2010 Census; Esri; and Real Property Research Group, Inc.
0.9% 0.9% 1.0%1.0%
0.7%0.9%
0.0%
0.2%
0.4%
0.6%
0.8%
1.0%
1.2%
2000-2010 2010-2019 2019-2021
DeKalb County Veranda Market AreaAnnual Percentage HH Change, 2000 to 2021
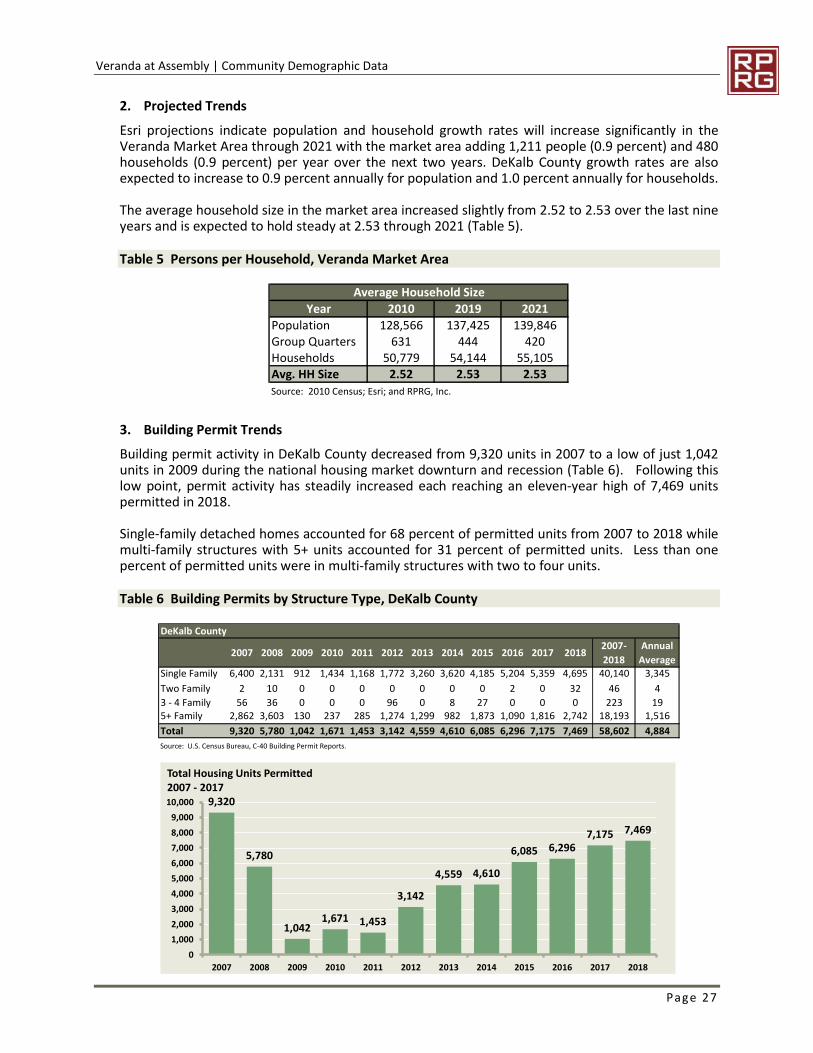
Veranda at Assembly | Community Demographic Data
Page 27
2. Projected Trends Esri projections indicate population and household growth rates will increase significantly in the Veranda Market Area through 2021 with the market area adding 1,211 people (0.9 percent) and 480 households (0.9 percent) per year over the next two years. DeKalb County growth rates are also expected to increase to 0.9 percent annually for population and 1.0 percent annually for households.
The average household size in the market area increased slightly from 2.52 to 2.53 over the last nine years and is expected to hold steady at 2.53 through 2021 (Table 5).
Table 5 Persons per Household, Veranda Market Area
3. Building Permit Trends Building permit activity in DeKalb County decreased from 9,320 units in 2007 to a low of just 1,042 units in 2009 during the national housing market downturn and recession (Table 6). Following this low point, permit activity has steadily increased each reaching an eleven-year high of 7,469 units permitted in 2018.
Single-family detached homes accounted for 68 percent of permitted units from 2007 to 2018 while multi-family structures with 5+ units accounted for 31 percent of permitted units. Less than one percent of permitted units were in multi-family structures with two to four units.
Table 6 Building Permits by Structure Type, DeKalb County
Year 2010 2019 2021Population 128,566 137,425 139,846Group Quarters 631 444 420Households 50,779 54,144 55,105Avg. HH Size 2.52 2.53 2.53Source: 2010 Census; Esri; and RPRG, Inc.
Average Household Size
DeKalb County
2007 2008 2009 2010 2011 2012 2013 2014 2015 2016 2017 2018 2007-2018
Annual Average
Single Family 6,400 2,131 912 1,434 1,168 1,772 3,260 3,620 4,185 5,204 5,359 4,695 40,140 3,345Two Family 2 10 0 0 0 0 0 0 0 2 0 32 46 43 - 4 Family 56 36 0 0 0 96 0 8 27 0 0 0 223 195+ Family 2,862 3,603 130 237 285 1,274 1,299 982 1,873 1,090 1,816 2,742 18,193 1,516Total 9,320 5,780 1,042 1,671 1,453 3,142 4,559 4,610 6,085 6,296 7,175 7,469 58,602 4,884Source: U.S. Census Bureau, C-40 Building Permit Reports.
9,320
5,780
1,0421,671 1,453
3,142
4,559 4,610
6,085 6,2967,175 7,469
01,0002,0003,0004,0005,0006,0007,0008,0009,000
10,000
2007 2008 2009 2010 2011 2012 2013 2014 2015 2016 2017 2018
Total Housing Units Permitted 2007 - 2017
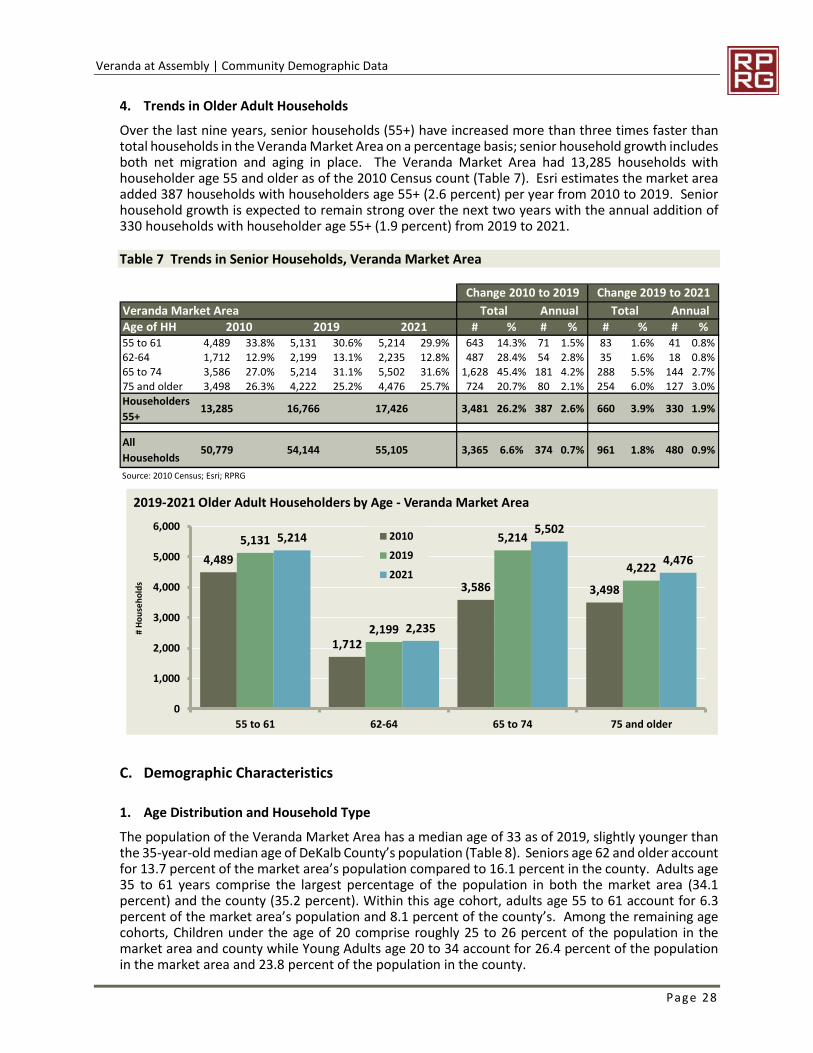
Veranda at Assembly | Community Demographic Data
Page 28
4. Trends in Older Adult Households Over the last nine years, senior households (55+) have increased more than three times faster than total households in the Veranda Market Area on a percentage basis; senior household growth includes both net migration and aging in place. The Veranda Market Area had 13,285 households with householder age 55 and older as of the 2010 Census count (Table 7). Esri estimates the market area added 387 households with householders age 55+ (2.6 percent) per year from 2010 to 2019. Senior household growth is expected to remain strong over the next two years with the annual addition of 330 households with householder age 55+ (1.9 percent) from 2019 to 2021.
Table 7 Trends in Senior Households, Veranda Market Area
C. Demographic Characteristics
1. Age Distribution and Household Type The population of the Veranda Market Area has a median age of 33 as of 2019, slightly younger than the 35-year-old median age of DeKalb County’s population (Table 8). Seniors age 62 and older account for 13.7 percent of the market area’s population compared to 16.1 percent in the county. Adults age 35 to 61 years comprise the largest percentage of the population in both the market area (34.1 percent) and the county (35.2 percent). Within this age cohort, adults age 55 to 61 account for 6.3 percent of the market area’s population and 8.1 percent of the county’s. Among the remaining age cohorts, Children under the age of 20 comprise roughly 25 to 26 percent of the population in the market area and county while Young Adults age 20 to 34 account for 26.4 percent of the population in the market area and 23.8 percent of the population in the county.
Veranda Market Area Total Annual Total AnnualAge of HH 2010 2019 2021 # % # % # % # %55 to 61 4,489 33.8% 5,131 30.6% 5,214 29.9% 643 14.3% 71 1.5% 83 1.6% 41 0.8%62-64 1,712 12.9% 2,199 13.1% 2,235 12.8% 487 28.4% 54 2.8% 35 1.6% 18 0.8%65 to 74 3,586 27.0% 5,214 31.1% 5,502 31.6% 1,628 45.4% 181 4.2% 288 5.5% 144 2.7%75 and older 3,498 26.3% 4,222 25.2% 4,476 25.7% 724 20.7% 80 2.1% 254 6.0% 127 3.0%Householders 55+ 13,285 16,766 17,426 3,481 26.2% 387 2.6% 660 3.9% 330 1.9%
All Households 50,779 54,144 55,105 3,365 6.6% 374 0.7% 961 1.8% 480 0.9%
Source: 2010 Census; Esri; RPRG
Change 2010 to 2019 Change 2019 to 2021
4,489
1,712
3,586 3,498
5,131
2,199
5,214
4,222
5,214
2,235
5,502
4,476
0
1,000
2,000
3,000
4,000
5,000
6,000
55 to 61 62-64 65 to 74 75 and older
# Ho
useh
olds
2019-2021 Older Adult Householders by Age - Veranda Market Area
201020192021
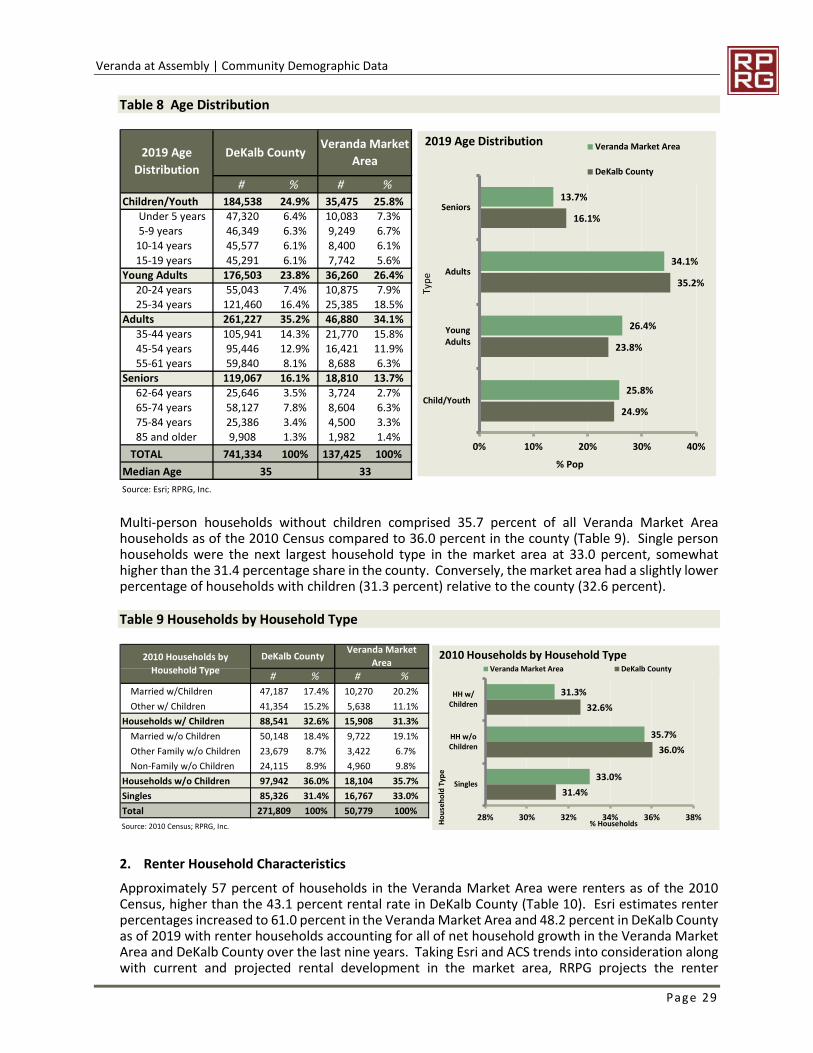
Veranda at Assembly | Community Demographic Data
Page 29
Table 8 Age Distribution
Multi-person households without children comprised 35.7 percent of all Veranda Market Area households as of the 2010 Census compared to 36.0 percent in the county (Table 9). Single person households were the next largest household type in the market area at 33.0 percent, somewhat higher than the 31.4 percentage share in the county. Conversely, the market area had a slightly lower percentage of households with children (31.3 percent) relative to the county (32.6 percent).
Table 9 Households by Household Type
2. Renter Household Characteristics Approximately 57 percent of households in the Veranda Market Area were renters as of the 2010 Census, higher than the 43.1 percent rental rate in DeKalb County (Table 10). Esri estimates renter percentages increased to 61.0 percent in the Veranda Market Area and 48.2 percent in DeKalb County as of 2019 with renter households accounting for all of net household growth in the Veranda Market Area and DeKalb County over the last nine years. Taking Esri and ACS trends into consideration along with current and projected rental development in the market area, RRPG projects the renter
# % # %Children/Youth 184,538 24.9% 35,475 25.8% Under 5 years 47,320 6.4% 10,083 7.3% 5-9 years 46,349 6.3% 9,249 6.7% 10-14 years 45,577 6.1% 8,400 6.1% 15-19 years 45,291 6.1% 7,742 5.6%Young Adults 176,503 23.8% 36,260 26.4% 20-24 years 55,043 7.4% 10,875 7.9% 25-34 years 121,460 16.4% 25,385 18.5%Adults 261,227 35.2% 46,880 34.1% 35-44 years 105,941 14.3% 21,770 15.8% 45-54 years 95,446 12.9% 16,421 11.9% 55-61 years 59,840 8.1% 8,688 6.3%Seniors 119,067 16.1% 18,810 13.7% 62-64 years 25,646 3.5% 3,724 2.7% 65-74 years 58,127 7.8% 8,604 6.3% 75-84 years 25,386 3.4% 4,500 3.3% 85 and older 9,908 1.3% 1,982 1.4% TOTAL 741,334 100% 137,425 100%Median AgeSource: Esri; RPRG, Inc.
35 33
DeKalb County Veranda Market Area2019 Age
Distribution
24.9%
23.8%
35.2%
16.1%
25.8%
26.4%
34.1%
13.7%
0% 10% 20% 30% 40%
Child/Youth
YoungAdults
Adults
Seniors
% Pop
Type
2019 Age Distribution Veranda Market Area
DeKalb County
# % # %Married w/Children 47,187 17.4% 10,270 20.2%Other w/ Children 41,354 15.2% 5,638 11.1%
Households w/ Children 88,541 32.6% 15,908 31.3%Married w/o Children 50,148 18.4% 9,722 19.1%Other Family w/o Children 23,679 8.7% 3,422 6.7%Non-Family w/o Children 24,115 8.9% 4,960 9.8%
Households w/o Children 97,942 36.0% 18,104 35.7%Singles 85,326 31.4% 16,767 33.0%Total 271,809 100% 50,779 100%Source: 2010 Census; RPRG, Inc.
2010 Households by Household Type
DeKalb County Veranda Market Area
31.4%
36.0%
32.6%
33.0%
35.7%
31.3%
28% 30% 32% 34% 36% 38%
Singles
HH w/oChildren
HH w/Children
% HouseholdsHous
ehol
d Ty
pe
2010 Households by Household TypeVeranda Market Area DeKalb County
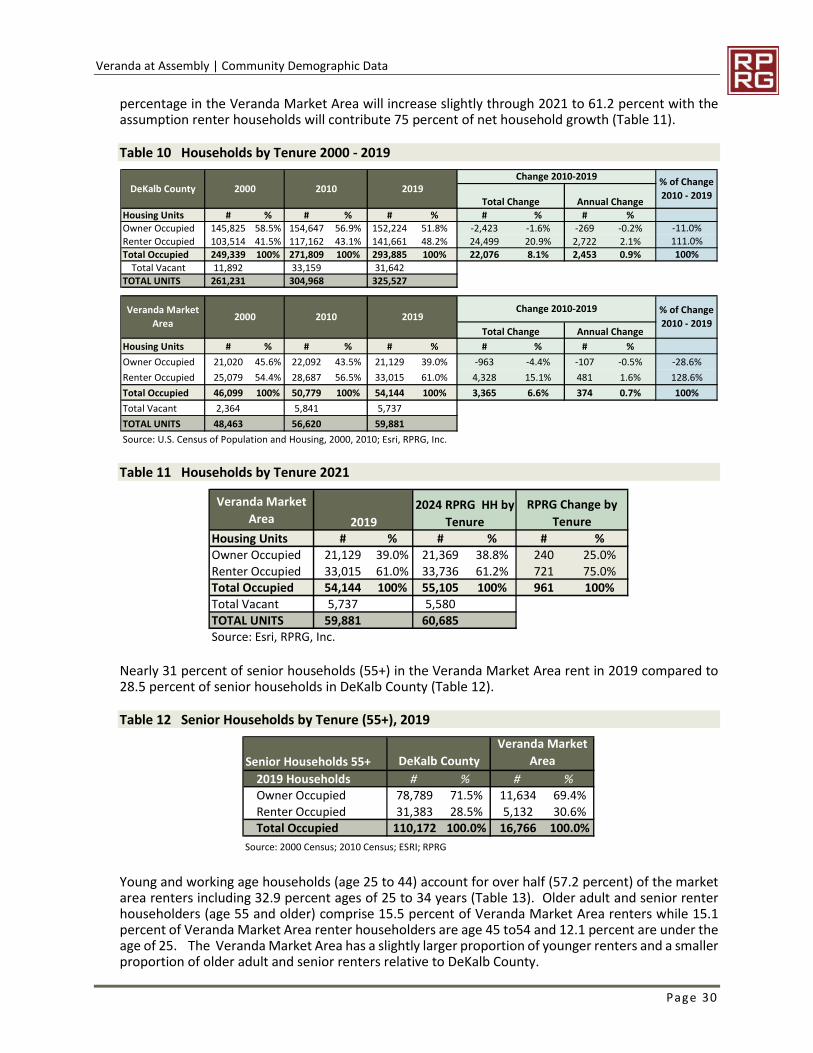
Veranda at Assembly | Community Demographic Data
Page 30
percentage in the Veranda Market Area will increase slightly through 2021 to 61.2 percent with the assumption renter households will contribute 75 percent of net household growth (Table 11).
Table 10 Households by Tenure 2000 - 2019
Table 11 Households by Tenure 2021
Nearly 31 percent of senior households (55+) in the Veranda Market Area rent in 2019 compared to 28.5 percent of senior households in DeKalb County (Table 12).
Table 12 Senior Households by Tenure (55+), 2019
Young and working age households (age 25 to 44) account for over half (57.2 percent) of the market area renters including 32.9 percent ages of 25 to 34 years (Table 13). Older adult and senior renter householders (age 55 and older) comprise 15.5 percent of Veranda Market Area renters while 15.1 percent of Veranda Market Area renter householders are age 45 to54 and 12.1 percent are under the age of 25. The Veranda Market Area has a slightly larger proportion of younger renters and a smaller proportion of older adult and senior renters relative to DeKalb County.
Housing Units # % # % # % # % # %Owner Occupied 145,825 58.5% 154,647 56.9% 152,224 51.8% -2,423 -1.6% -269 -0.2%Renter Occupied 103,514 41.5% 117,162 43.1% 141,661 48.2% 24,499 20.9% 2,722 2.1%Total Occupied 249,339 100% 271,809 100% 293,885 100% 22,076 8.1% 2,453 0.9%
Total Vacant 11,892 33,159 31,642TOTAL UNITS 261,231 304,968 325,527
Housing Units # % # % # % # % # %Owner Occupied 21,020 45.6% 22,092 43.5% 21,129 39.0% -963 -4.4% -107 -0.5%Renter Occupied 25,079 54.4% 28,687 56.5% 33,015 61.0% 4,328 15.1% 481 1.6%Total Occupied 46,099 100% 50,779 100% 54,144 100% 3,365 6.6% 374 0.7%Total Vacant 2,364 5,841 5,737TOTAL UNITS 48,463 56,620 59,881Source: U.S. Census of Population and Housing, 2000, 2010; Esri, RPRG, Inc.
Veranda Market Area 2000 2010 2019
DeKalb County 2000 2010 2019
128.6%100%
Change 2010-2019 % of Change 2010 - 2019Total Change Annual Change
-11.0%111.0%100%
Change 2010-2019 % of Change 2010 - 2019
Total Change Annual Change
-28.6%
Veranda Market Area 2019
2024 RPRG HH by Tenure
Housing Units # % # % # %Owner Occupied 21,129 39.0% 21,369 38.8% 240 25.0%Renter Occupied 33,015 61.0% 33,736 61.2% 721 75.0%Total Occupied 54,144 100% 55,105 100% 961 100%Total Vacant 5,737 5,580TOTAL UNITS 59,881 60,685Source: Esri, RPRG, Inc.
RPRG Change by Tenure
Senior Households 55+ DeKalb CountyVeranda Market
Area2019 Households # % # %Owner Occupied 78,789 71.5% 11,634 69.4%Renter Occupied 31,383 28.5% 5,132 30.6%Total Occupied 110,172 100.0% 16,766 100.0%
Source: 2000 Census; 2010 Census; ESRI; RPRG
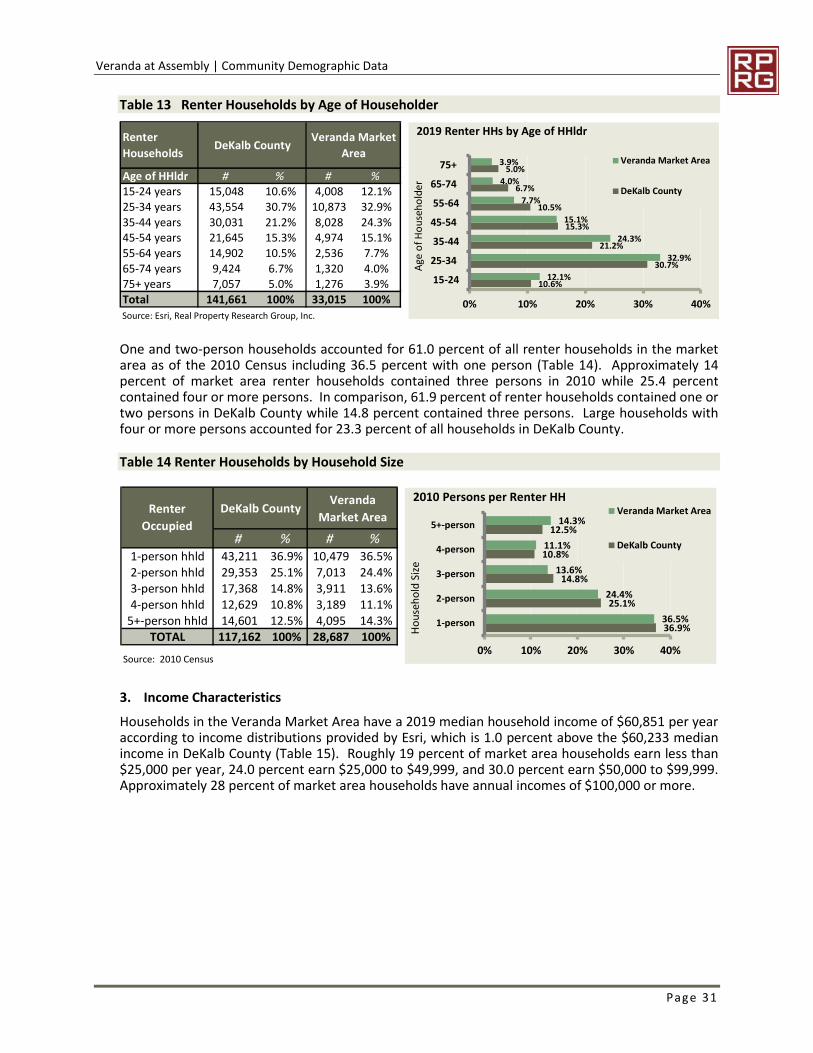
Veranda at Assembly | Community Demographic Data
Page 31
Table 13 Renter Households by Age of Householder
One and two-person households accounted for 61.0 percent of all renter households in the market area as of the 2010 Census including 36.5 percent with one person (Table 14). Approximately 14 percent of market area renter households contained three persons in 2010 while 25.4 percent contained four or more persons. In comparison, 61.9 percent of renter households contained one or two persons in DeKalb County while 14.8 percent contained three persons. Large households with four or more persons accounted for 23.3 percent of all households in DeKalb County.
Table 14 Renter Households by Household Size
3. Income Characteristics Households in the Veranda Market Area have a 2019 median household income of $60,851 per year according to income distributions provided by Esri, which is 1.0 percent above the $60,233 median income in DeKalb County (Table 15). Roughly 19 percent of market area households earn less than $25,000 per year, 24.0 percent earn $25,000 to $49,999, and 30.0 percent earn $50,000 to $99,999. Approximately 28 percent of market area households have annual incomes of $100,000 or more.
Renter Households DeKalb County Veranda Market
Area
Age of HHldr # % # %15-24 years 15,048 10.6% 4,008 12.1% 125-34 years 43,554 30.7% 10,873 32.9% 135-44 years 30,031 21.2% 8,028 24.3% 145-54 years 21,645 15.3% 4,974 15.1% 255-64 years 14,902 10.5% 2,536 7.7%65-74 years 9,424 6.7% 1,320 4.0% 275+ years 7,057 5.0% 1,276 3.9% 2Total 141,661 100% 33,015 100%Source: Esri, Real Property Research Group, Inc.
10.6%
30.7%
21.2%
15.3%
10.5%
6.7%
5.0%
12.1%
32.9%
24.3%
15.1%
7.7%
4.0%
3.9%
0% 10% 20% 30% 40%
15-2425-3435-4445-5455-6465-74
75+
Age
of H
ouse
hold
er
2019 Renter HHs by Age of HHldr
Veranda Market Area
DeKalb County
DeKalb County Veranda Market Area
# % # %1-person hhld 43,211 36.9% 10,479 36.5%2-person hhld 29,353 25.1% 7,013 24.4%3-person hhld 17,368 14.8% 3,911 13.6%4-person hhld 12,629 10.8% 3,189 11.1%
5+-person hhld 14,601 12.5% 4,095 14.3%TOTAL 117,162 100% 28,687 100%
Source: 2010 Census
Renter Occupied
36.9%
25.1%
14.8%
10.8%
12.5%
36.5%
24.4%
13.6%
11.1%
14.3%
0% 10% 20% 30% 40%
1-person
2-person
3-person
4-person
5+-person
Hous
ehol
d Si
ze
2010 Persons per Renter HHVeranda Market Area
DeKalb County
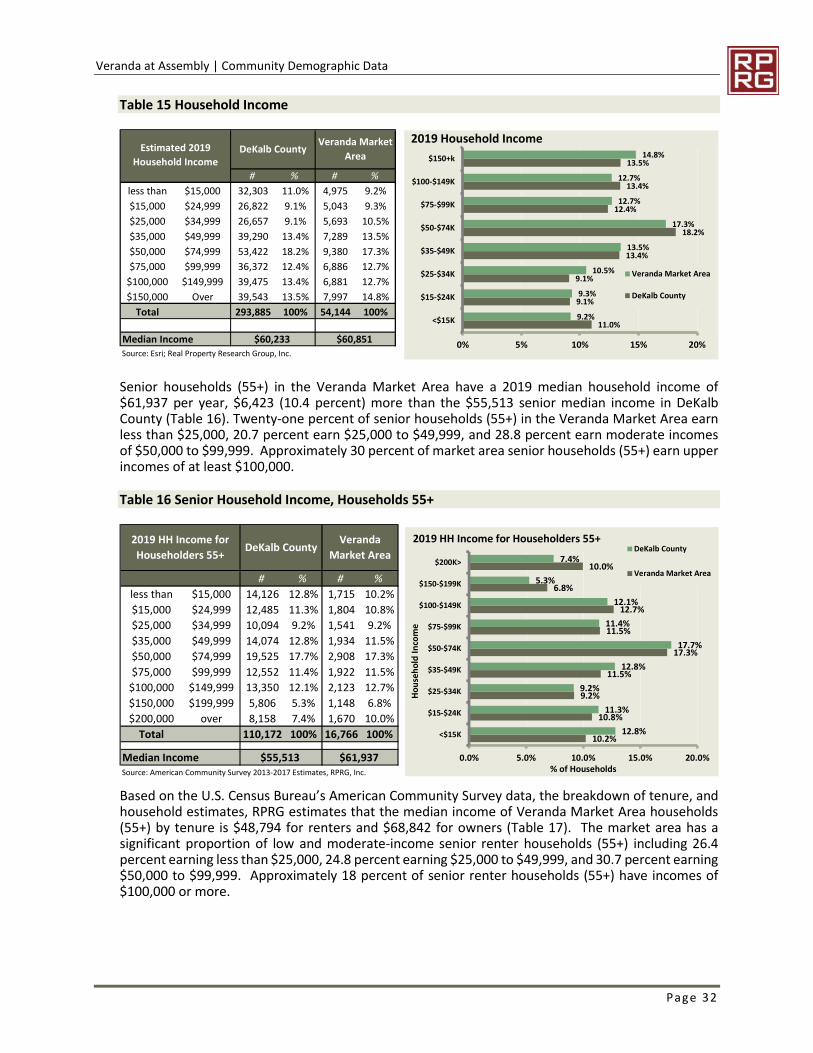
Veranda at Assembly | Community Demographic Data
Page 32
Table 15 Household Income
Senior households (55+) in the Veranda Market Area have a 2019 median household income of $61,937 per year, $6,423 (10.4 percent) more than the $55,513 senior median income in DeKalb County (Table 16). Twenty-one percent of senior households (55+) in the Veranda Market Area earn less than $25,000, 20.7 percent earn $25,000 to $49,999, and 28.8 percent earn moderate incomes of $50,000 to $99,999. Approximately 30 percent of market area senior households (55+) earn upper incomes of at least $100,000.
Table 16 Senior Household Income, Households 55+
Based on the U.S. Census Bureau’s American Community Survey data, the breakdown of tenure, and household estimates, RPRG estimates that the median income of Veranda Market Area households (55+) by tenure is $48,794 for renters and $68,842 for owners (Table 17). The market area has a significant proportion of low and moderate-income senior renter households (55+) including 26.4 percent earning less than $25,000, 24.8 percent earning $25,000 to $49,999, and 30.7 percent earning $50,000 to $99,999. Approximately 18 percent of senior renter households (55+) have incomes of $100,000 or more.
# % # %
less than $15,000 32,303 11.0% 4,975 9.2% 2$15,000 $24,999 26,822 9.1% 5,043 9.3% 3$25,000 $34,999 26,657 9.1% 5,693 10.5% 4$35,000 $49,999 39,290 13.4% 7,289 13.5% 5$50,000 $74,999 53,422 18.2% 9,380 17.3% 6$75,000 $99,999 36,372 12.4% 6,886 12.7% 7
$100,000 $149,999 39,475 13.4% 6,881 12.7% 8$150,000 Over 39,543 13.5% 7,997 14.8% 9
Total 293,885 100% 54,144 100% 10
Median Income $60,233 $60,851 Source: Esri; Real Property Research Group, Inc.
Veranda Market AreaDeKalb CountyEstimated 2019
Household Income
11.0%
9.1%
9.1%
13.4%
18.2%
12.4%
13.4%
13.5%
9.2%
9.3%
10.5%
13.5%
17.3%
12.7%
12.7%
14.8%
0% 5% 10% 15% 20%
<$15K
$15-$24K
$25-$34K
$35-$49K
$50-$74K
$75-$99K
$100-$149K
$150+k
2019 Household Income
Veranda Market Area
DeKalb County
# % # %less than $15,000 14,126 12.8% 1,715 10.2%$15,000 $24,999 12,485 11.3% 1,804 10.8%$25,000 $34,999 10,094 9.2% 1,541 9.2%$35,000 $49,999 14,074 12.8% 1,934 11.5%$50,000 $74,999 19,525 17.7% 2,908 17.3%$75,000 $99,999 12,552 11.4% 1,922 11.5%$100,000 $149,999 13,350 12.1% 2,123 12.7%$150,000 $199,999 5,806 5.3% 1,148 6.8%$200,000 over 8,158 7.4% 1,670 10.0%
Total 110,172 100% 16,766 100%
Median IncomeSource: American Community Survey 2013-2017 Estimates, RPRG, Inc.
2019 HH Income for Householders 55+
Veranda Market AreaDeKalb County
$61,937 $55,513 10.2%
10.8%
9.2%
11.5%
17.3%
11.5%
12.7%
6.8%
10.0%
12.8%
11.3%
9.2%
12.8%
17.7%
11.4%
12.1%
5.3%
7.4%
0.0% 5.0% 10.0% 15.0% 20.0%
<$15K
$15-$24K
$25-$34K
$35-$49K
$50-$74K
$75-$99K
$100-$149K
$150-$199K
$200K>
% of Households
Hous
ehol
d In
com
e
DeKalb County
Veranda Market Area
2019 HH Income for Householders 55+
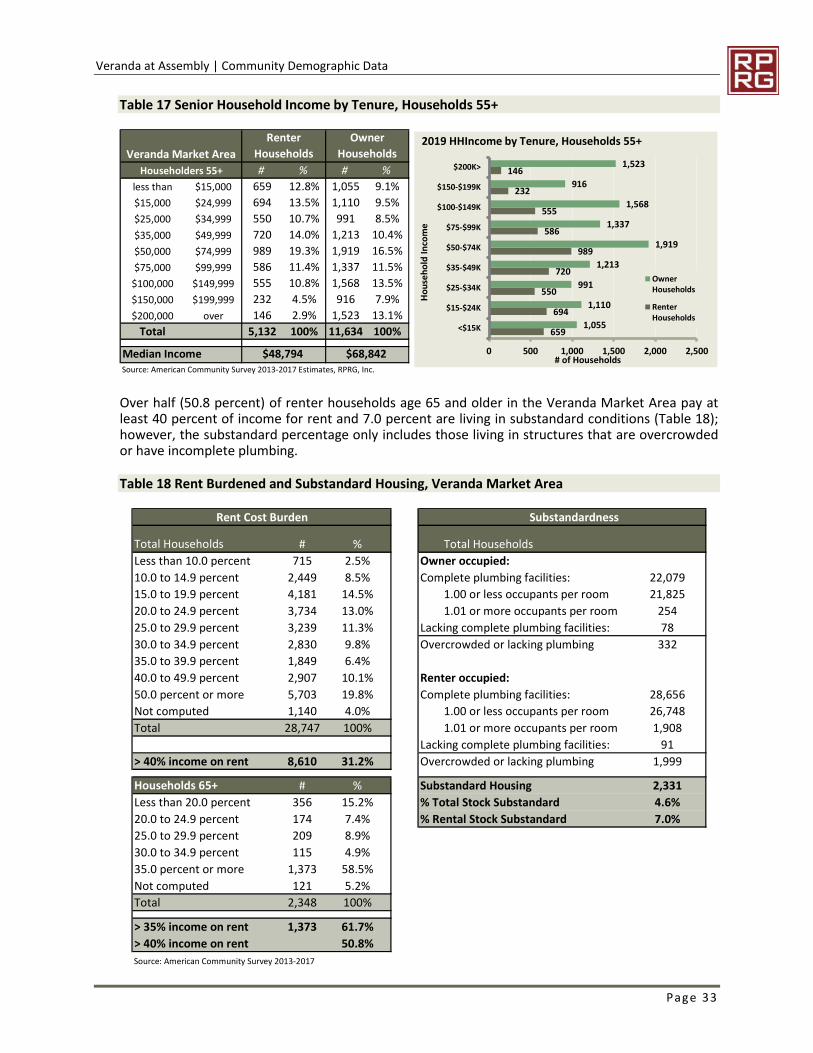
Veranda at Assembly | Community Demographic Data
Page 33
Table 17 Senior Household Income by Tenure, Households 55+
Over half (50.8 percent) of renter households age 65 and older in the Veranda Market Area pay at least 40 percent of income for rent and 7.0 percent are living in substandard conditions (Table 18); however, the substandard percentage only includes those living in structures that are overcrowded or have incomplete plumbing.
Table 18 Rent Burdened and Substandard Housing, Veranda Market Area
# % # %
less than $15,000 659 12.8% 1,055 9.1% 2$15,000 $24,999 694 13.5% 1,110 9.5% 3$25,000 $34,999 550 10.7% 991 8.5% 4$35,000 $49,999 720 14.0% 1,213 10.4% 5$50,000 $74,999 989 19.3% 1,919 16.5% 6$75,000 $99,999 586 11.4% 1,337 11.5% 7$100,000 $149,999 555 10.8% 1,568 13.5% 8$150,000 $199,999 232 4.5% 916 7.9% 9$200,000 over 146 2.9% 1,523 13.1% 10
Total 5,132 100% 11,634 100%
Median Income 23Source: American Community Survey 2013-2017 Estimates, RPRG, Inc.
Renter Households
Owner Households
$48,794 $68,842
Veranda Market AreaHouseholders 55+
659
694
550
720
989
586
555
232
146
1,055
1,110
991
1,213
1,919
1,337
1,568
916
1,523
0 500 1,000 1,500 2,000 2,500
<$15K
$15-$24K
$25-$34K
$35-$49K
$50-$74K
$75-$99K
$100-$149K
$150-$199K
$200K>
# of Households
Hous
ehol
d In
com
e
2019 HHIncome by Tenure, Households 55+
OwnerHouseholds
RenterHouseholds
Rent Cost Burden Substandardness
Total Households # % Total HouseholdsLess than 10.0 percent 715 2.5% Owner occupied:10.0 to 14.9 percent 2,449 8.5% Complete plumbing facilities: 22,07915.0 to 19.9 percent 4,181 14.5% 1.00 or less occupants per room 21,82520.0 to 24.9 percent 3,734 13.0% 1.01 or more occupants per room 25425.0 to 29.9 percent 3,239 11.3% Lacking complete plumbing facilities: 7830.0 to 34.9 percent 2,830 9.8% Overcrowded or lacking plumbing 33235.0 to 39.9 percent 1,849 6.4%40.0 to 49.9 percent 2,907 10.1% Renter occupied:50.0 percent or more 5,703 19.8% Complete plumbing facilities: 28,656Not computed 1,140 4.0% 1.00 or less occupants per room 26,748Total 28,747 100% 1.01 or more occupants per room 1,908
Lacking complete plumbing facilities: 91> 40% income on rent 8,610 31.2% Overcrowded or lacking plumbing 1,999
Households 65+ # % Substandard Housing 2,331Less than 20.0 percent 356 15.2% % Total Stock Substandard 4.6%20.0 to 24.9 percent 174 7.4% % Rental Stock Substandard 7.0%25.0 to 29.9 percent 209 8.9%30.0 to 34.9 percent 115 4.9%35.0 percent or more 1,373 58.5%Not computed 121 5.2%Total 2,348 100%
> 35% income on rent 1,373 61.7%> 40% income on rent 50.8%Source: American Community Survey 2013-2017
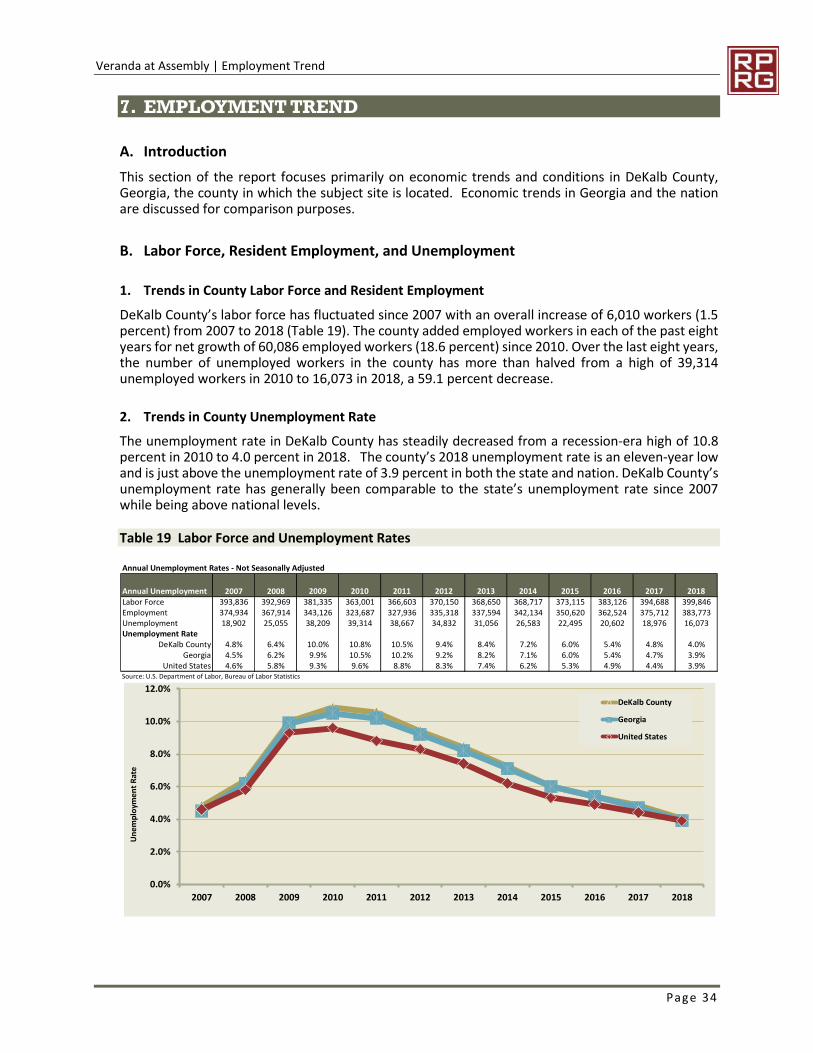
Veranda at Assembly | Employment Trend
Page 34
7. EMPLOYMENT TREND
A. Introduction This section of the report focuses primarily on economic trends and conditions in DeKalb County, Georgia, the county in which the subject site is located. Economic trends in Georgia and the nation are discussed for comparison purposes.
B. Labor Force, Resident Employment, and Unemployment
1. Trends in County Labor Force and Resident Employment DeKalb County’s labor force has fluctuated since 2007 with an overall increase of 6,010 workers (1.5 percent) from 2007 to 2018 (Table 19). The county added employed workers in each of the past eight years for net growth of 60,086 employed workers (18.6 percent) since 2010. Over the last eight years, the number of unemployed workers in the county has more than halved from a high of 39,314 unemployed workers in 2010 to 16,073 in 2018, a 59.1 percent decrease.
2. Trends in County Unemployment Rate The unemployment rate in DeKalb County has steadily decreased from a recession-era high of 10.8 percent in 2010 to 4.0 percent in 2018. The county’s 2018 unemployment rate is an eleven-year low and is just above the unemployment rate of 3.9 percent in both the state and nation. DeKalb County’s unemployment rate has generally been comparable to the state’s unemployment rate since 2007 while being above national levels.
Table 19 Labor Force and Unemployment Rates
Annual Unemployment Rates - Not Seasonally Adjusted
Annual Unemployment 2007 2008 2009 2010 2011 2012 2013 2014 2015 2016 2017 2018Labor Force 393,836 392,969 381,335 363,001 366,603 370,150 368,650 368,717 373,115 383,126 394,688 399,846Employment 374,934 367,914 343,126 323,687 327,936 335,318 337,594 342,134 350,620 362,524 375,712 383,773Unemployment 18,902 25,055 38,209 39,314 38,667 34,832 31,056 26,583 22,495 20,602 18,976 16,073Unemployment Rate
DeKalb County 4.8% 6.4% 10.0% 10.8% 10.5% 9.4% 8.4% 7.2% 6.0% 5.4% 4.8% 4.0%Georgia 4.5% 6.2% 9.9% 10.5% 10.2% 9.2% 8.2% 7.1% 6.0% 5.4% 4.7% 3.9%
United States 4.6% 5.8% 9.3% 9.6% 8.8% 8.3% 7.4% 6.2% 5.3% 4.9% 4.4% 3.9%Source: U.S. Department of Labor, Bureau of Labor Statistics
0.0%
2.0%
4.0%
6.0%
8.0%
10.0%
12.0%
2007 2008 2009 2010 2011 2012 2013 2014 2015 2016 2017 2018
DeKalb County
Georgia
United States
Unem
ploy
men
t Rat
e
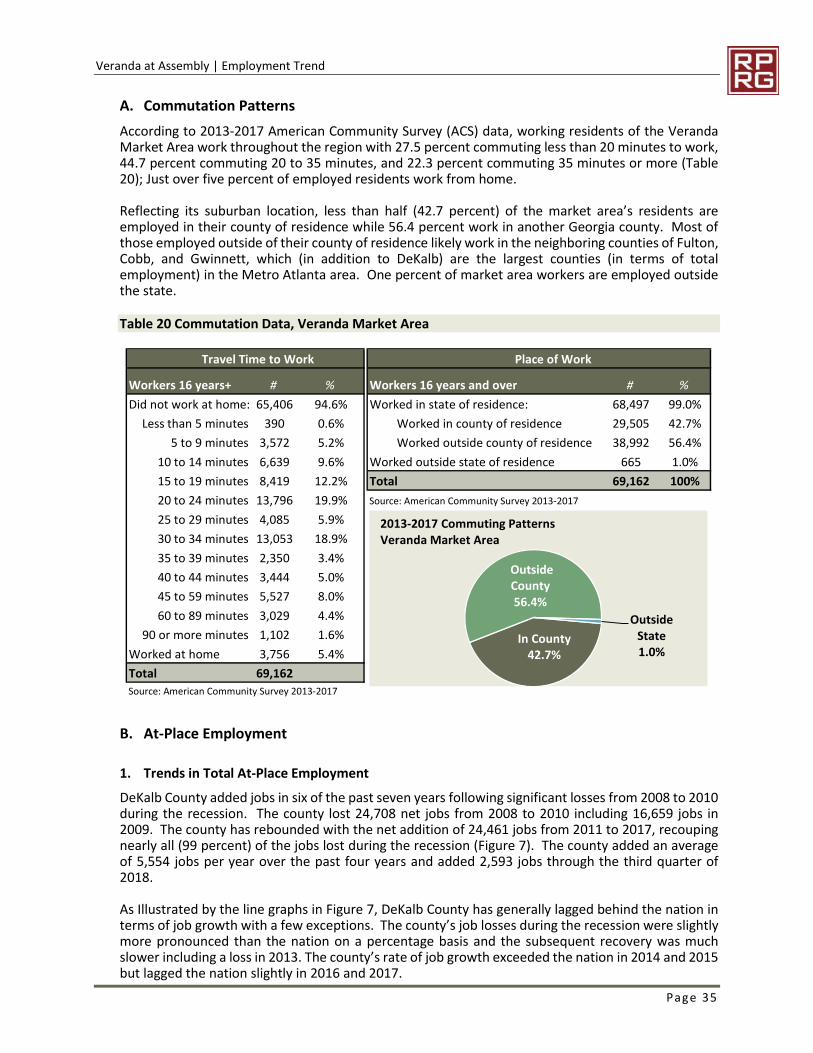
Veranda at Assembly | Employment Trend
Page 35
A. Commutation Patterns According to 2013-2017 American Community Survey (ACS) data, working residents of the Veranda Market Area work throughout the region with 27.5 percent commuting less than 20 minutes to work, 44.7 percent commuting 20 to 35 minutes, and 22.3 percent commuting 35 minutes or more (Table 20); Just over five percent of employed residents work from home.
Reflecting its suburban location, less than half (42.7 percent) of the market area’s residents are employed in their county of residence while 56.4 percent work in another Georgia county. Most of those employed outside of their county of residence likely work in the neighboring counties of Fulton, Cobb, and Gwinnett, which (in addition to DeKalb) are the largest counties (in terms of total employment) in the Metro Atlanta area. One percent of market area workers are employed outside the state.
Table 20 Commutation Data, Veranda Market Area
B. At-Place Employment
1. Trends in Total At-Place Employment DeKalb County added jobs in six of the past seven years following significant losses from 2008 to 2010 during the recession. The county lost 24,708 net jobs from 2008 to 2010 including 16,659 jobs in 2009. The county has rebounded with the net addition of 24,461 jobs from 2011 to 2017, recouping nearly all (99 percent) of the jobs lost during the recession (Figure 7). The county added an average of 5,554 jobs per year over the past four years and added 2,593 jobs through the third quarter of 2018.
As Illustrated by the line graphs in Figure 7, DeKalb County has generally lagged behind the nation in terms of job growth with a few exceptions. The county’s job losses during the recession were slightly more pronounced than the nation on a percentage basis and the subsequent recovery was much slower including a loss in 2013. The county’s rate of job growth exceeded the nation in 2014 and 2015 but lagged the nation slightly in 2016 and 2017.
Travel Time to Work Place of Work
Workers 16 years+ # % Workers 16 years and over # %Did not work at home: 65,406 94.6% Worked in state of residence: 68,497 99.0%
Less than 5 minutes 390 0.6% Worked in county of residence 29,505 42.7%5 to 9 minutes 3,572 5.2% Worked outside county of residence 38,992 56.4%
10 to 14 minutes 6,639 9.6% Worked outside state of residence 665 1.0%15 to 19 minutes 8,419 12.2% Total 69,162 100%20 to 24 minutes 13,796 19.9% Source: American Community Survey 2013-2017
25 to 29 minutes 4,085 5.9%30 to 34 minutes 13,053 18.9%35 to 39 minutes 2,350 3.4%40 to 44 minutes 3,444 5.0%45 to 59 minutes 5,527 8.0%60 to 89 minutes 3,029 4.4%
90 or more minutes 1,102 1.6%Worked at home 3,756 5.4%Total 69,162Source: American Community Survey 2013-2017
In County42.7%
Outside County56.4%
Outside State 1.0%
2013-2017 Commuting PatternsVeranda Market Area
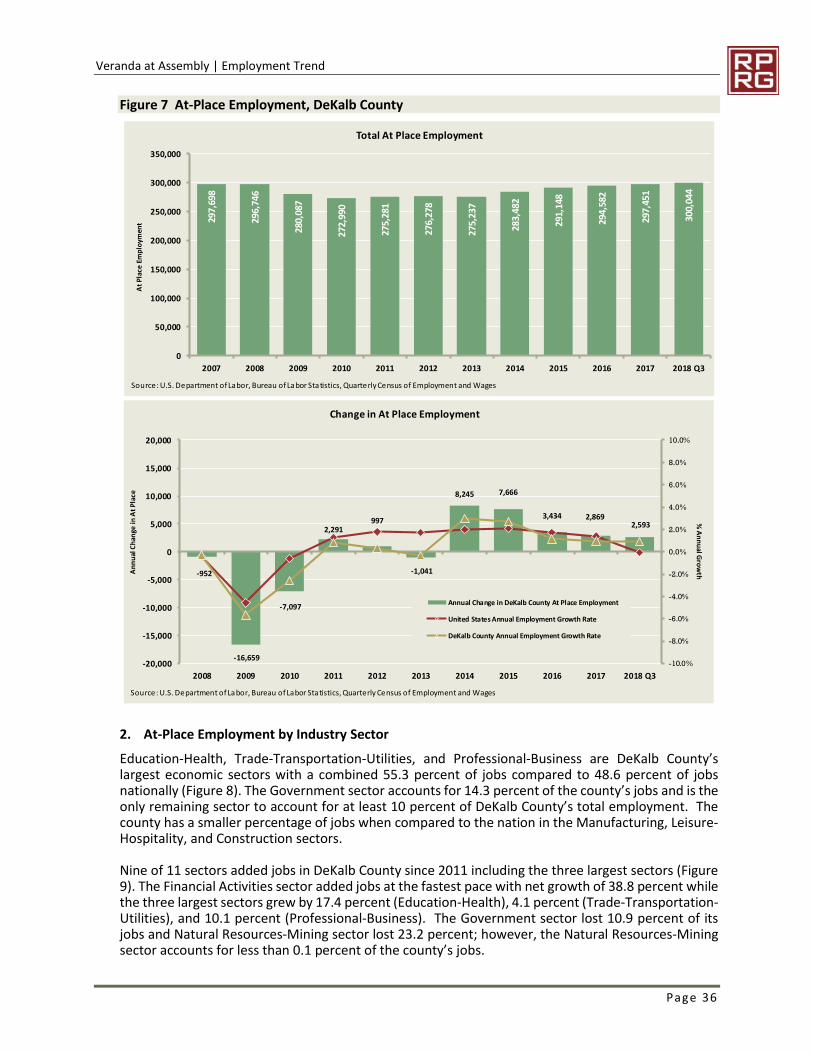
Veranda at Assembly | Employment Trend
Page 36
Figure 7 At-Place Employment, DeKalb County
2. At-Place Employment by Industry Sector Education-Health, Trade-Transportation-Utilities, and Professional-Business are DeKalb County’s largest economic sectors with a combined 55.3 percent of jobs compared to 48.6 percent of jobs nationally (Figure 8). The Government sector accounts for 14.3 percent of the county’s jobs and is the only remaining sector to account for at least 10 percent of DeKalb County’s total employment. The county has a smaller percentage of jobs when compared to the nation in the Manufacturing, Leisure-Hospitality, and Construction sectors.
Nine of 11 sectors added jobs in DeKalb County since 2011 including the three largest sectors (Figure 9). The Financial Activities sector added jobs at the fastest pace with net growth of 38.8 percent while the three largest sectors grew by 17.4 percent (Education-Health), 4.1 percent (Trade-Transportation-Utilities), and 10.1 percent (Professional-Business). The Government sector lost 10.9 percent of its jobs and Natural Resources-Mining sector lost 23.2 percent; however, the Natural Resources-Mining sector accounts for less than 0.1 percent of the county’s jobs.
297,
698
296,
746
280,
087
272,
990
275,
281
276,
278
275,
237
283,
482
291,
148
294,
582
297,
451
300,
044
0
50,000
100,000
150,000
200,000
250,000
300,000
350,000
2007 2008 2009 2010 2011 2012 2013 2014 2015 2016 2017 2018 Q3
At P
lace
Empl
oym
ent
Total At Place Employment
Source: U.S. Department of Labor, Bureau of Labor Sta tistics, Quarterly Census of Employment and Wages
-952
-16,659
-7,097
2,291997
-1,041
8,245 7,666
3,434 2,8692,593
-10.0%
-8.0%
-6.0%
-4.0%
-2.0%
0.0%
2.0%
4.0%
6.0%
8.0%
10.0%
-20,000
-15,000
-10,000
-5,000
0
5,000
10,000
15,000
20,000
2008 2009 2010 2011 2012 2013 2014 2015 2016 2017 2018 Q3
Change in At Place Employment
Annual Change in DeKalb County At Place Employment
United States Annual Employment Growth Rate
DeKalb County Annual Employment Growth Rate
Annu
al C
hang
e in
At P
lace
% Annual Grow
th
Source: U.S. Department of Labor, Bureau of Labor Statistics, Quarterly Census of Employment and Wages
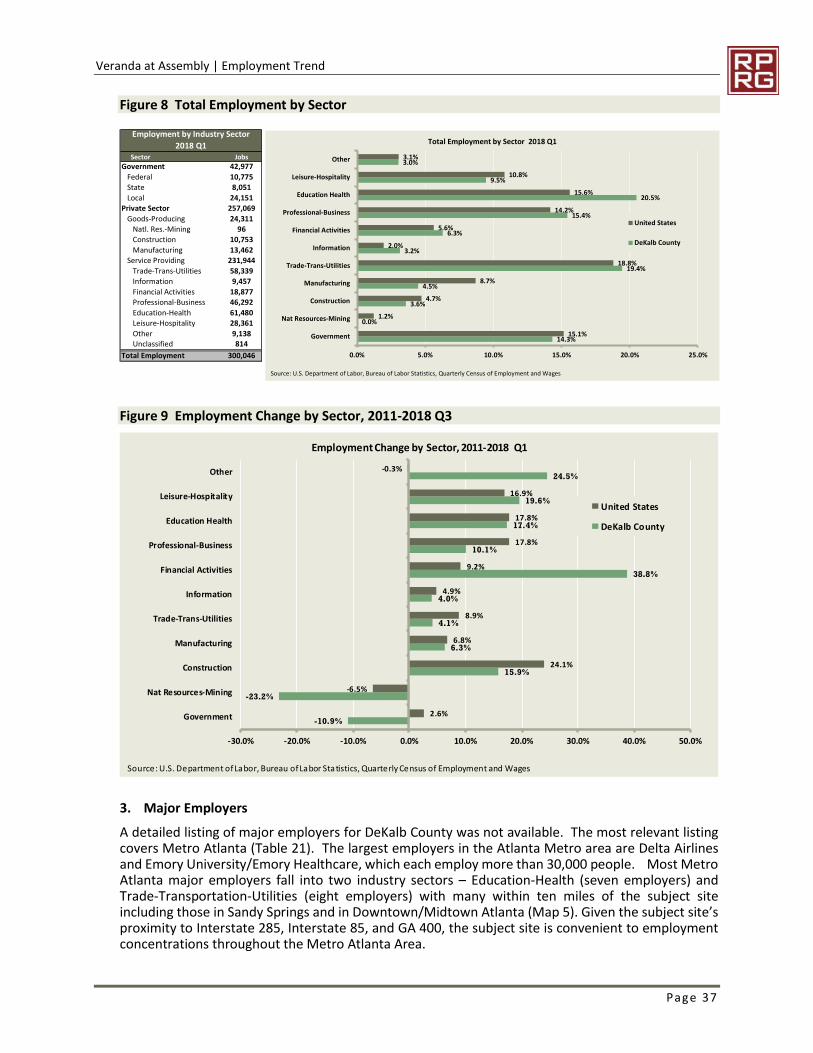
Veranda at Assembly | Employment Trend
Page 37
Figure 8 Total Employment by Sector
Figure 9 Employment Change by Sector, 2011-2018 Q3
3. Major Employers A detailed listing of major employers for DeKalb County was not available. The most relevant listing covers Metro Atlanta (Table 21). The largest employers in the Atlanta Metro area are Delta Airlines and Emory University/Emory Healthcare, which each employ more than 30,000 people. Most Metro Atlanta major employers fall into two industry sectors – Education-Health (seven employers) and Trade-Transportation-Utilities (eight employers) with many within ten miles of the subject site including those in Sandy Springs and in Downtown/Midtown Atlanta (Map 5). Given the subject site’s proximity to Interstate 285, Interstate 85, and GA 400, the subject site is convenient to employment concentrations throughout the Metro Atlanta Area.
Employment by Industry Sector 2018 Q1
Sector JobsGovernment 42,977 Federal 10,775 State 8,051 Local 24,151Private Sector 257,069 Goods-Producing 24,311 Natl. Res.-Mining 96 Construction 10,753 Manufacturing 13,462 Service Providing 231,944 Trade-Trans-Utilities 58,339 Information 9,457 Financial Activities 18,877 Professional-Business 46,292 Education-Health 61,480 Leisure-Hospitality 28,361 Other 9,138 Unclassified 814Total Employment 300,046
14.3%
0.0%
3.6%
4.5%
19.4%
3.2%
6.3%
15.4%
20.5%
9.5%
3.0%
15.1%
1.2%
4.7%
8.7%
18.8%
2.0%
5.6%
14.2%
15.6%
10.8%
3.1%
0.0% 5.0% 10.0% 15.0% 20.0% 25.0%
Government
Nat Resources-Mining
Construction
Manufacturing
Trade-Trans-Utilities
Information
Financial Activities
Professional-Business
Education Health
Leisure-Hospitality
Other
Total Employment by Sector 2018 Q1
United States
DeKalb County
Source: U.S. Department of Labor, Bureau of Labor Statistics, Quarterly Census of Employment and Wages
-10.9%
-23.2%
15.9%
6.3%
4.1%
4.0%
38.8%
10.1%
17.4%
19.6%
24.5%
2.6%
-6.5%
24.1%
6.8%
8.9%
4.9%
9.2%
17.8%
17.8%
16.9%
-0.3%
-30.0% -20.0% -10.0% 0.0% 10.0% 20.0% 30.0% 40.0% 50.0%
Government
Nat Resources-Mining
Construction
Manufacturing
Trade-Trans-Utilities
Information
Financial Activities
Professional-Business
Education Health
Leisure-Hospitality
Other
Employment Change by Sector, 2011-2018 Q1
United States
DeKalb County
Source: U.S. Department of Labor, Bureau of Labor Statistics, Quarterly Census of Employment and Wages
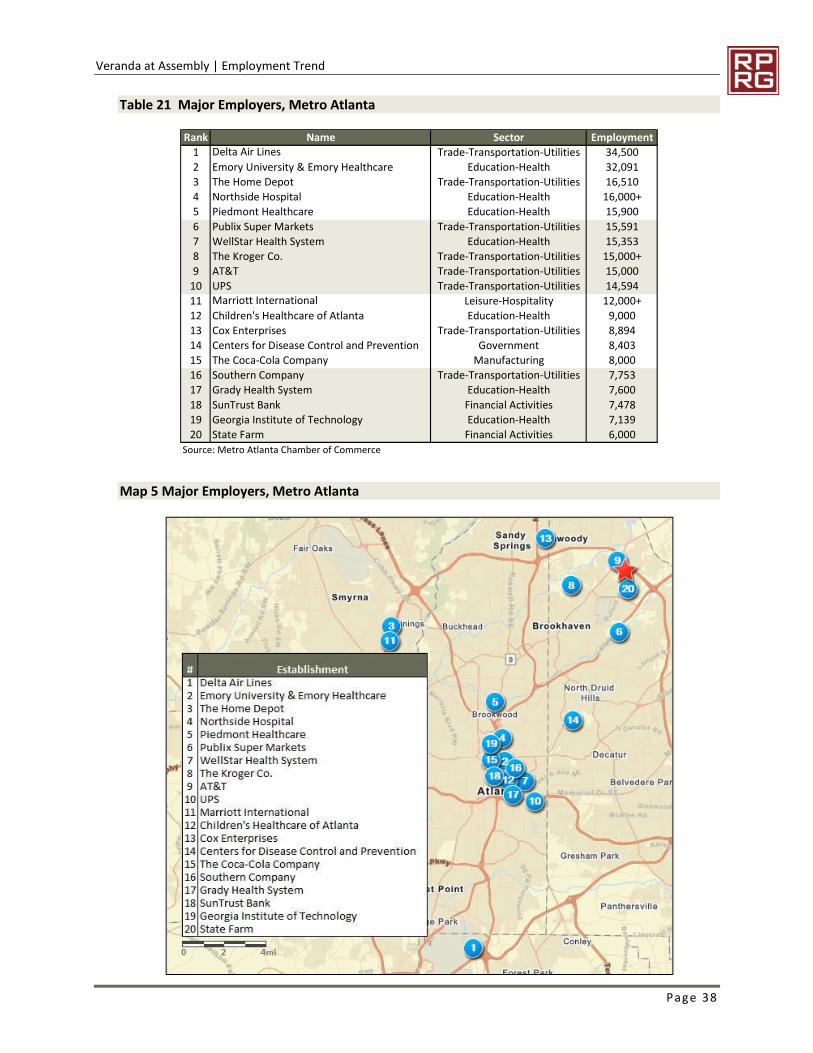
Veranda at Assembly | Employment Trend
Page 38
Table 21 Major Employers, Metro Atlanta
Map 5 Major Employers, Metro Atlanta
Rank Name Sector Employment1 Delta Air Lines Trade-Transportation-Utilities 34,5002 Emory University & Emory Healthcare Education-Health 32,0913 The Home Depot Trade-Transportation-Utilities 16,5104 Northside Hospital Education-Health 16,000+5 Piedmont Healthcare Education-Health 15,9006 Publix Super Markets Trade-Transportation-Utilities 15,5917 WellStar Health System Education-Health 15,3538 The Kroger Co. Trade-Transportation-Utilities 15,000+9 AT&T Trade-Transportation-Utilities 15,000
10 UPS Trade-Transportation-Utilities 14,59411 Marriott International Leisure-Hospitality 12,000+12 Children's Healthcare of Atlanta Education-Health 9,00013 Cox Enterprises Trade-Transportation-Utilities 8,89414 Centers for Disease Control and Prevention Government 8,40315 The Coca-Cola Company Manufacturing 8,00016 Southern Company Trade-Transportation-Utilities 7,75317 Grady Health System Education-Health 7,60018 SunTrust Bank Financial Activities 7,47819 Georgia Institute of Technology Education-Health 7,13920 State Farm Financial Activities 6,000
Source: Metro Atlanta Chamber of Commerce
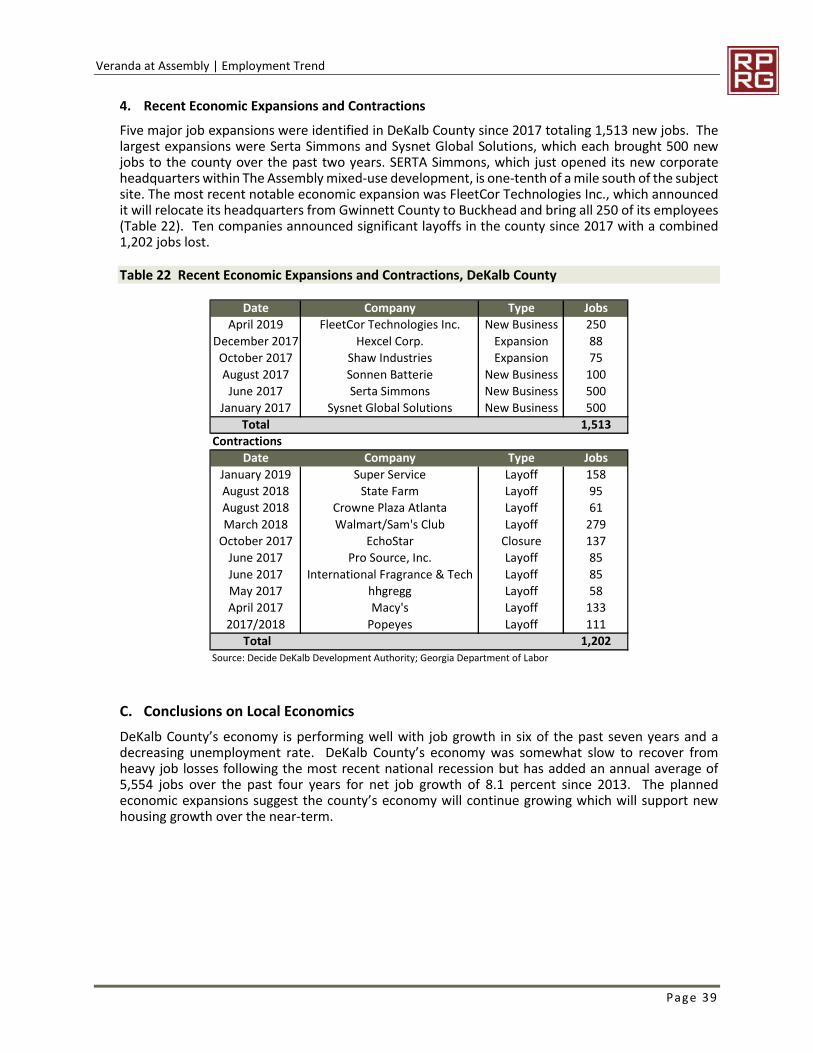
Veranda at Assembly | Employment Trend
Page 39
4. Recent Economic Expansions and Contractions Five major job expansions were identified in DeKalb County since 2017 totaling 1,513 new jobs. The largest expansions were Serta Simmons and Sysnet Global Solutions, which each brought 500 new jobs to the county over the past two years. SERTA Simmons, which just opened its new corporate headquarters within The Assembly mixed-use development, is one-tenth of a mile south of the subject site. The most recent notable economic expansion was FleetCor Technologies Inc., which announced it will relocate its headquarters from Gwinnett County to Buckhead and bring all 250 of its employees (Table 22). Ten companies announced significant layoffs in the county since 2017 with a combined 1,202 jobs lost.
Table 22 Recent Economic Expansions and Contractions, DeKalb County
C. Conclusions on Local Economics DeKalb County’s economy is performing well with job growth in six of the past seven years and a decreasing unemployment rate. DeKalb County’s economy was somewhat slow to recover from heavy job losses following the most recent national recession but has added an annual average of 5,554 jobs over the past four years for net job growth of 8.1 percent since 2013. The planned economic expansions suggest the county’s economy will continue growing which will support new housing growth over the near-term.
Date Company Type JobsApril 2019 FleetCor Technologies Inc. New Business 250
December 2017 Hexcel Corp. Expansion 88October 2017 Shaw Industries Expansion 75August 2017 Sonnen Batterie New Business 100June 2017 Serta Simmons New Business 500
January 2017 Sysnet Global Solutions New Business 500Total 1,513
ContractionsDate Company Type Jobs
January 2019 Super Service Layoff 158August 2018 State Farm Layoff 95August 2018 Crowne Plaza Atlanta Layoff 61March 2018 Walmart/Sam's Club Layoff 279
October 2017 EchoStar Closure 137June 2017 Pro Source, Inc. Layoff 85June 2017 International Fragrance & Tech Layoff 85May 2017 hhgregg Layoff 58April 2017 Macy's Layoff 1332017/2018 Popeyes Layoff 111
Total 1,202Source: Decide DeKalb Development Authority; Georgia Department of Labor
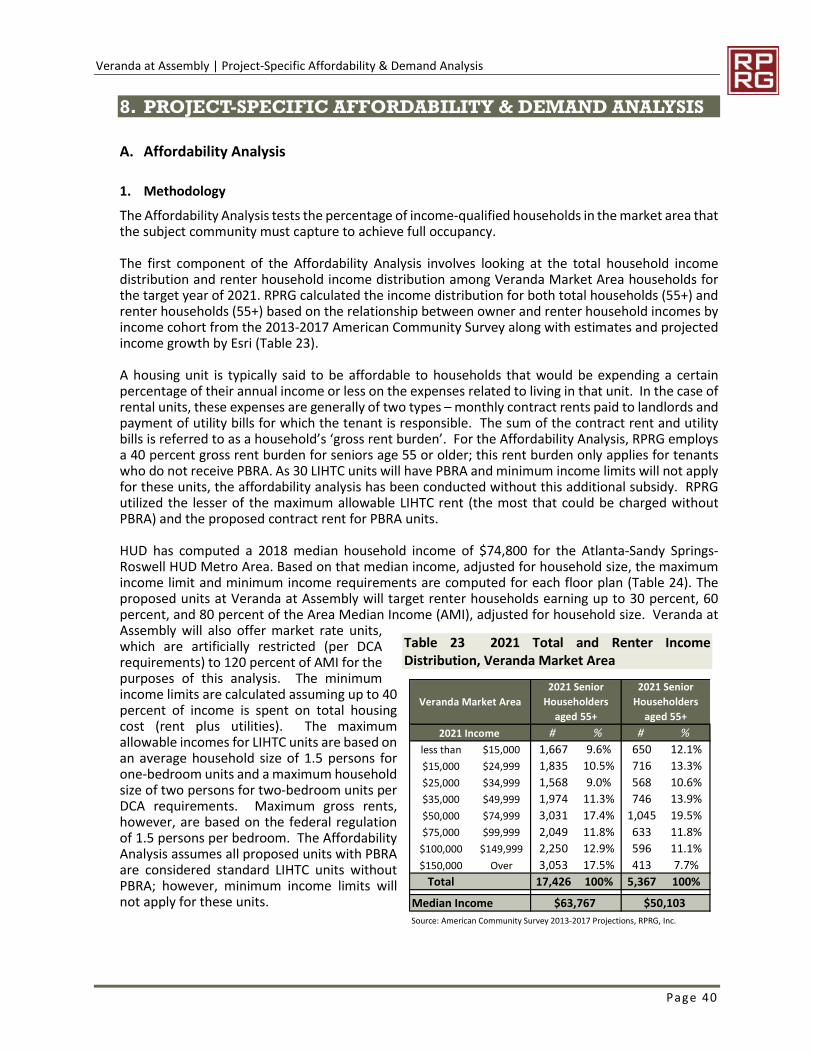
Veranda at Assembly | Project-Specific Affordability & Demand Analysis
Page 40
8. PROJECT-SPECIFIC AFFORDABILITY & DEMAND ANALYSIS
A. Affordability Analysis
1. Methodology The Affordability Analysis tests the percentage of income-qualified households in the market area that the subject community must capture to achieve full occupancy.
The first component of the Affordability Analysis involves looking at the total household income distribution and renter household income distribution among Veranda Market Area households for the target year of 2021. RPRG calculated the income distribution for both total households (55+) and renter households (55+) based on the relationship between owner and renter household incomes by income cohort from the 2013-2017 American Community Survey along with estimates and projected income growth by Esri (Table 23).
A housing unit is typically said to be affordable to households that would be expending a certain percentage of their annual income or less on the expenses related to living in that unit. In the case of rental units, these expenses are generally of two types – monthly contract rents paid to landlords and payment of utility bills for which the tenant is responsible. The sum of the contract rent and utility bills is referred to as a household’s ‘gross rent burden’. For the Affordability Analysis, RPRG employs a 40 percent gross rent burden for seniors age 55 or older; this rent burden only applies for tenants who do not receive PBRA. As 30 LIHTC units will have PBRA and minimum income limits will not apply for these units, the affordability analysis has been conducted without this additional subsidy. RPRG utilized the lesser of the maximum allowable LIHTC rent (the most that could be charged without PBRA) and the proposed contract rent for PBRA units.
HUD has computed a 2018 median household income of $74,800 for the Atlanta-Sandy Springs-Roswell HUD Metro Area. Based on that median income, adjusted for household size, the maximum income limit and minimum income requirements are computed for each floor plan (Table 24). The proposed units at Veranda at Assembly will target renter households earning up to 30 percent, 60 percent, and 80 percent of the Area Median Income (AMI), adjusted for household size. Veranda at Assembly will also offer market rate units, which are artificially restricted (per DCA requirements) to 120 percent of AMI for the purposes of this analysis. The minimum income limits are calculated assuming up to 40 percent of income is spent on total housing cost (rent plus utilities). The maximum allowable incomes for LIHTC units are based on an average household size of 1.5 persons for one-bedroom units and a maximum household size of two persons for two-bedroom units per DCA requirements. Maximum gross rents, however, are based on the federal regulation of 1.5 persons per bedroom. The Affordability Analysis assumes all proposed units with PBRA are considered standard LIHTC units without PBRA; however, minimum income limits will not apply for these units.
Table 23 2021 Total and Renter Income Distribution, Veranda Market Area
2021 Income # % # %less than $15,000 1,667 9.6% 650 12.1%$15,000 $24,999 1,835 10.5% 716 13.3%$25,000 $34,999 1,568 9.0% 568 10.6%$35,000 $49,999 1,974 11.3% 746 13.9%$50,000 $74,999 3,031 17.4% 1,045 19.5%$75,000 $99,999 2,049 11.8% 633 11.8%
$100,000 $149,999 2,250 12.9% 596 11.1%$150,000 Over 3,053 17.5% 413 7.7%
Total 17,426 100% 5,367 100%Median IncomeSource: American Community Survey 2013-2017 Projections, RPRG, Inc.
Veranda Market Area
$63,767 $50,103
2021 Senior Householders
aged 55+
2021 Senior Householders
aged 55+
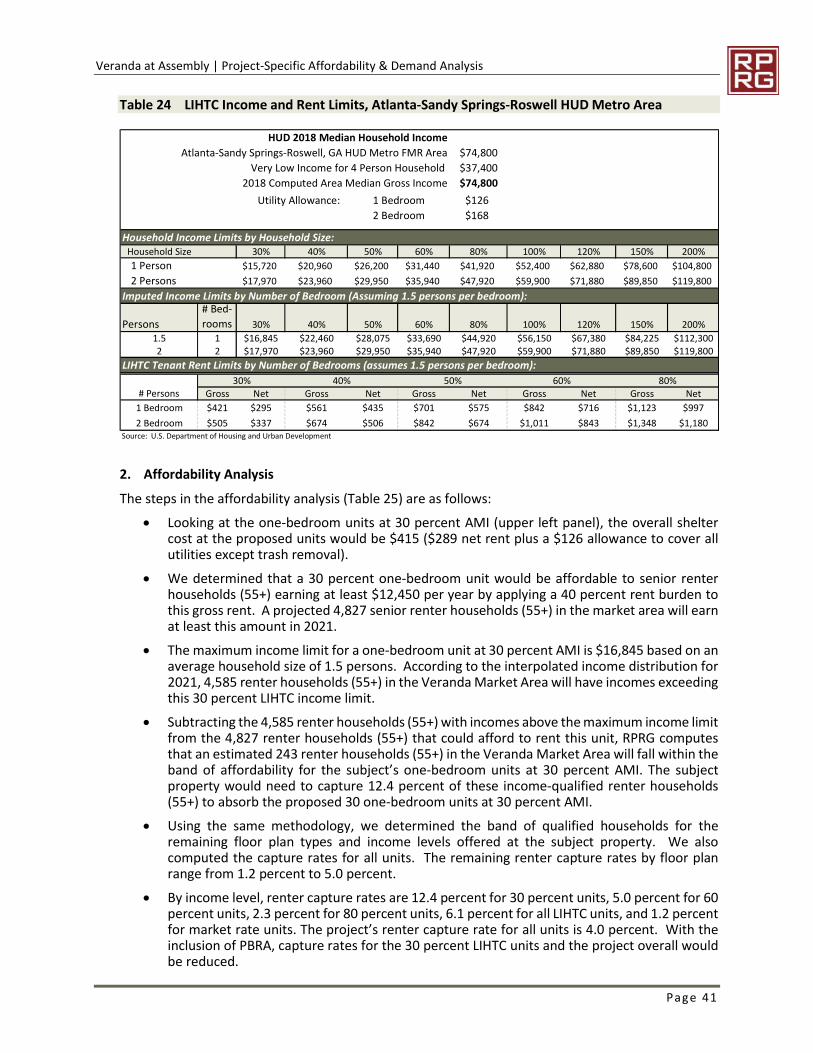
Veranda at Assembly | Project-Specific Affordability & Demand Analysis
Page 41
Table 24 LIHTC Income and Rent Limits, Atlanta-Sandy Springs-Roswell HUD Metro Area
2. Affordability Analysis The steps in the affordability analysis (Table 25) are as follows:
Looking at the one-bedroom units at 30 percent AMI (upper left panel), the overall shelter cost at the proposed units would be $415 ($289 net rent plus a $126 allowance to cover all utilities except trash removal).
We determined that a 30 percent one-bedroom unit would be affordable to senior renter households (55+) earning at least $12,450 per year by applying a 40 percent rent burden to this gross rent. A projected 4,827 senior renter households (55+) in the market area will earn at least this amount in 2021.
The maximum income limit for a one-bedroom unit at 30 percent AMI is $16,845 based on an average household size of 1.5 persons. According to the interpolated income distribution for 2021, 4,585 renter households (55+) in the Veranda Market Area will have incomes exceeding this 30 percent LIHTC income limit.
Subtracting the 4,585 renter households (55+) with incomes above the maximum income limit from the 4,827 renter households (55+) that could afford to rent this unit, RPRG computes that an estimated 243 renter households (55+) in the Veranda Market Area will fall within the band of affordability for the subject’s one-bedroom units at 30 percent AMI. The subject property would need to capture 12.4 percent of these income-qualified renter households (55+) to absorb the proposed 30 one-bedroom units at 30 percent AMI.
Using the same methodology, we determined the band of qualified households for the remaining floor plan types and income levels offered at the subject property. We also computed the capture rates for all units. The remaining renter capture rates by floor plan range from 1.2 percent to 5.0 percent.
By income level, renter capture rates are 12.4 percent for 30 percent units, 5.0 percent for 60 percent units, 2.3 percent for 80 percent units, 6.1 percent for all LIHTC units, and 1.2 percent for market rate units. The project’s renter capture rate for all units is 4.0 percent. With the inclusion of PBRA, capture rates for the 30 percent LIHTC units and the project overall would be reduced.
HUD 2018 Median Household IncomeAtlanta-Sandy Springs-Roswell, GA HUD Metro FMR Area $74,800
Very Low Income for 4 Person Household $37,4002018 Computed Area Median Gross Income $74,800
Utility Allowance: $126$168
Household Income Limits by Household Size:Household Size 30% 40% 50% 60% 80% 100% 120% 150% 200%1 Person $15,720 $20,960 $26,200 $31,440 $41,920 $52,400 $62,880 $78,600 $104,8002 Persons $17,970 $23,960 $29,950 $35,940 $47,920 $59,900 $71,880 $89,850 $119,800
Imputed Income Limits by Number of Bedroom (Assuming 1.5 persons per bedroom):
Persons# Bed-rooms 30% 40% 50% 60% 80% 100% 120% 150% 200%
1.5 1 $16,845 $22,460 $28,075 $33,690 $44,920 $56,150 $67,380 $84,225 $112,3002 2 $17,970 $23,960 $29,950 $35,940 $47,920 $59,900 $71,880 $89,850 $119,800
LIHTC Tenant Rent Limits by Number of Bedrooms (assumes 1.5 persons per bedroom):30% 40% 50% 60% 80%
Gross Net Gross Net Gross Net Gross Net Gross Net1 Bedroom $421 $295 $561 $435 $701 $575 $842 $716 $1,123 $9972 Bedroom $505 $337 $674 $506 $842 $674 $1,011 $843 $1,348 $1,180
Source: U.S. Department of Housing and Urban Development
# Persons
1 Bedroom2 Bedroom
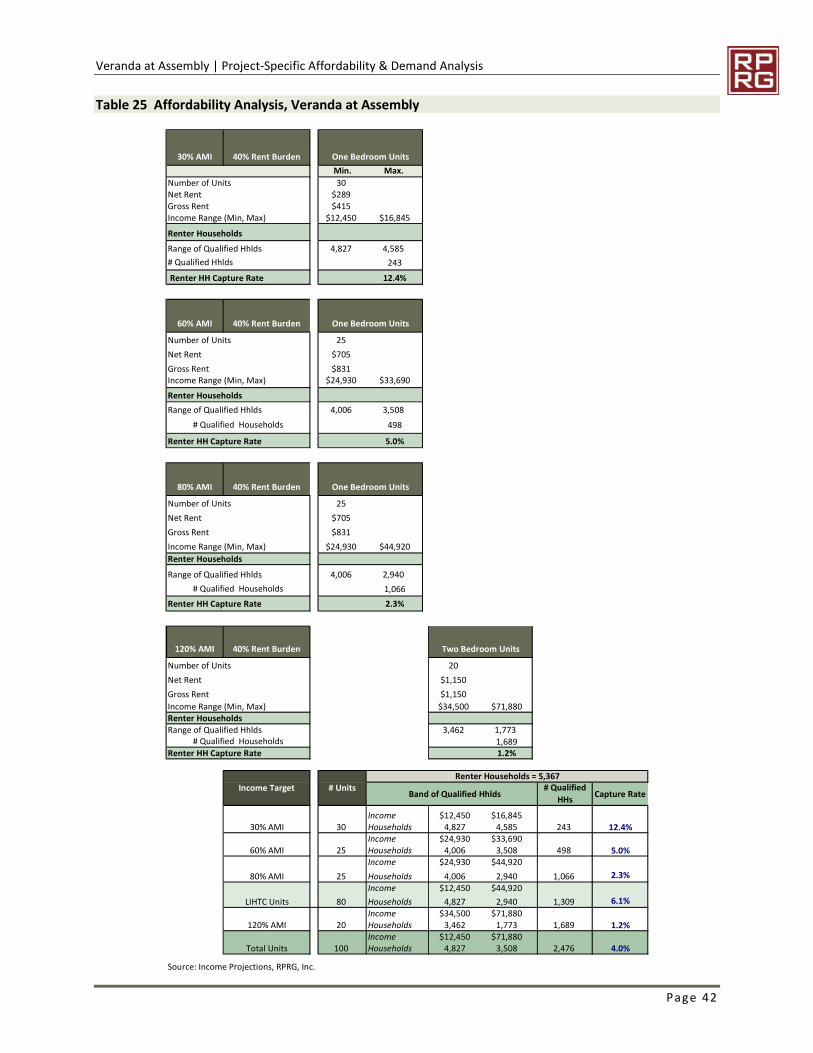
Veranda at Assembly | Project-Specific Affordability & Demand Analysis
Page 42
Table 25 Affordability Analysis, Veranda at Assembly
30% AMI 40% Rent Burden One Bedroom Units Two Bedroom Units Three Bedroom UnitsMin. Max. Min. Max. Min. Max.
Number of Units 30 0 0Net Rent $289 -- --Gross Rent $415 -- --Income Range (Min, Max) $12,450 $16,845 na 0 na naRenter HouseholdsRange of Qualified Hhlds 4,827 4,585 0 0 0 0
243 0 0 Renter HH Capture Rate 12.4% na na
60% AMI 40% Rent Burden One Bedroom Units Two Bedroom Units Three Bedroom Units
Number of Units 25 0 0Net Rent $705 -- --Gross Rent $831 -- --Income Range (Min, Max) $24,930 $33,690 na 0 na 0Renter HouseholdsRange of Qualified Hhlds 4,006 3,508 0 0 0 0
498 0 0
Renter HH Capture Rate 5.0% na na
80% AMI 40% Rent Burden One Bedroom Units Two Bedroom Units Three Bedroom Units
Number of Units 25 0 0Net Rent $705 -- --Gross Rent $831 -- --Income Range (Min, Max) $24,930 $44,920 na 0 na 0Renter HouseholdsRange of Qualified Hhlds 4,006 2,940 0 0 0 0
1,066 0 0Renter HH Capture Rate 2.3% na na
120% AMI 40% Rent Burden One Bedroom Units Two Bedroom Units Three Bedroom Units
Number of Units 0 20 0Net Rent -- $1,150 --Gross Rent -- $1,150 --Income Range (Min, Max) na 0 $34,500 $71,880 na 0Renter HouseholdsRange of Qualified Hhlds 0 0 3,462 1,773 0 0
0 1,689 0Renter HH Capture Rate na 1.2% na
Band of Qualified Hhlds# Qualified
HHs Capture Rate
Income $12,450 $16,84530% AMI 30 Households 4,827 4,585 243 12.4%
Income $24,930 $33,69060% AMI 25 Households 4,006 3,508 498 5.0%
Income $24,930 $44,92080% AMI 25 Households 4,006 2,940 1,066 2.3%
Income $12,450 $44,920LIHTC Units 80 Households 4,827 2,940 1,309 6.1%
Income $34,500 $71,880120% AMI 20 Households 3,462 1,773 1,689 1.2%
Income $12,450 $71,880Total Units 100 Households 4,827 3,508 2,476 4.0%
Source: Income Projections, RPRG, Inc.
# Qualified Households
# Qualified Households
# Qualified Hhlds
# Qualified Households
Income Target # UnitsRenter Households = 5,367
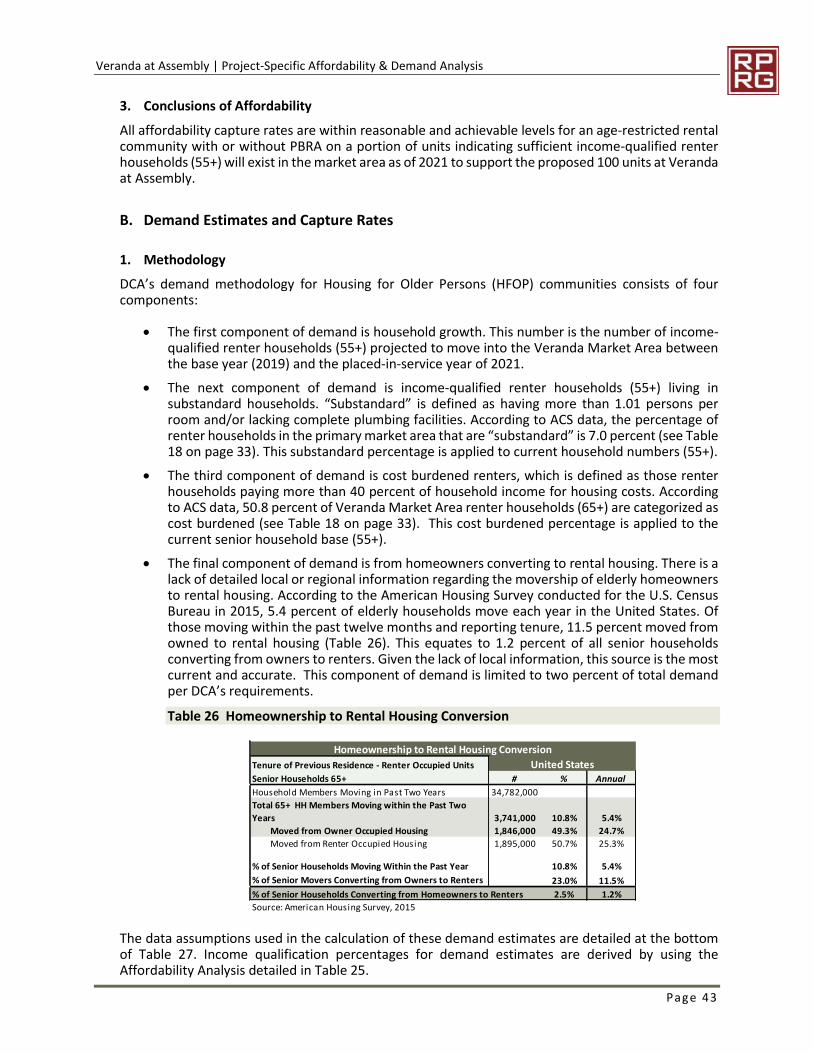
Veranda at Assembly | Project-Specific Affordability & Demand Analysis
Page 43
3. Conclusions of Affordability All affordability capture rates are within reasonable and achievable levels for an age-restricted rental community with or without PBRA on a portion of units indicating sufficient income-qualified renter households (55+) will exist in the market area as of 2021 to support the proposed 100 units at Veranda at Assembly.
B. Demand Estimates and Capture Rates
1. Methodology DCA’s demand methodology for Housing for Older Persons (HFOP) communities consists of four components:
The first component of demand is household growth. This number is the number of income-qualified renter households (55+) projected to move into the Veranda Market Area between the base year (2019) and the placed-in-service year of 2021.
The next component of demand is income-qualified renter households (55+) living in substandard households. “Substandard” is defined as having more than 1.01 persons per room and/or lacking complete plumbing facilities. According to ACS data, the percentage of renter households in the primary market area that are “substandard” is 7.0 percent (see Table 18 on page 33). This substandard percentage is applied to current household numbers (55+).
The third component of demand is cost burdened renters, which is defined as those renter households paying more than 40 percent of household income for housing costs. According to ACS data, 50.8 percent of Veranda Market Area renter households (65+) are categorized as cost burdened (see Table 18 on page 33). This cost burdened percentage is applied to the current senior household base (55+).
The final component of demand is from homeowners converting to rental housing. There is a lack of detailed local or regional information regarding the movership of elderly homeowners to rental housing. According to the American Housing Survey conducted for the U.S. Census Bureau in 2015, 5.4 percent of elderly households move each year in the United States. Of those moving within the past twelve months and reporting tenure, 11.5 percent moved from owned to rental housing (Table 26). This equates to 1.2 percent of all senior households converting from owners to renters. Given the lack of local information, this source is the most current and accurate. This component of demand is limited to two percent of total demand per DCA’s requirements.
Table 26 Homeownership to Rental Housing Conversion
The data assumptions used in the calculation of these demand estimates are detailed at the bottom of Table 27. Income qualification percentages for demand estimates are derived by using the Affordability Analysis detailed in Table 25.
Tenure of Previous Residence - Renter Occupied UnitsSenior Households 65+ # % AnnualHousehold Members Moving in Past Two Years 34,782,000Total 65+ HH Members Moving within the Past Two Years 3,741,000 10.8% 5.4%
Moved from Owner Occupied Housing 1,846,000 49.3% 24.7%Moved from Renter Occupied Housing 1,895,000 50.7% 25.3%
% of Senior Households Moving Within the Past Year 10.8% 5.4%% of Senior Movers Converting from Owners to Renters 23.0% 11.5%% of Senior Households Converting from Homeowners to Renters 2.5% 1.2%Source: American Housing Survey, 2015
United StatesHomeownership to Rental Housing Conversion
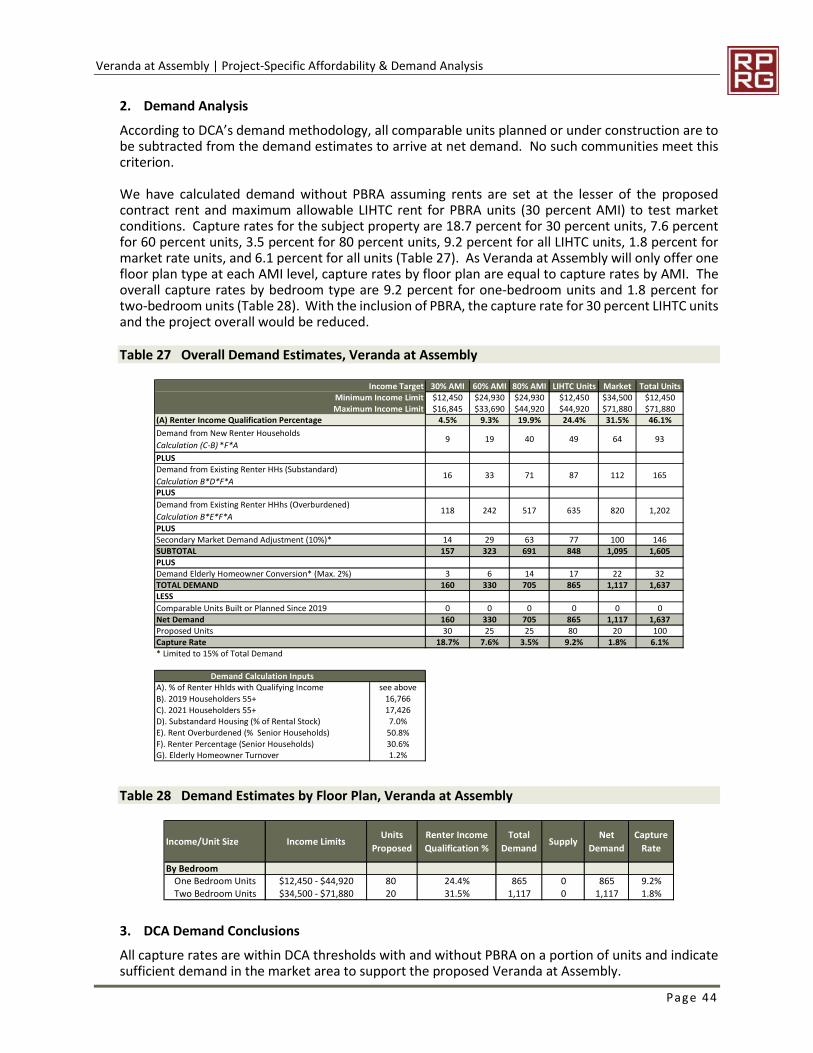
Veranda at Assembly | Project-Specific Affordability & Demand Analysis
Page 44
2. Demand Analysis According to DCA’s demand methodology, all comparable units planned or under construction are to be subtracted from the demand estimates to arrive at net demand. No such communities meet this criterion.
We have calculated demand without PBRA assuming rents are set at the lesser of the proposed contract rent and maximum allowable LIHTC rent for PBRA units (30 percent AMI) to test market conditions. Capture rates for the subject property are 18.7 percent for 30 percent units, 7.6 percent for 60 percent units, 3.5 percent for 80 percent units, 9.2 percent for all LIHTC units, 1.8 percent for market rate units, and 6.1 percent for all units (Table 27). As Veranda at Assembly will only offer one floor plan type at each AMI level, capture rates by floor plan are equal to capture rates by AMI. The overall capture rates by bedroom type are 9.2 percent for one-bedroom units and 1.8 percent for two-bedroom units (Table 28). With the inclusion of PBRA, the capture rate for 30 percent LIHTC units and the project overall would be reduced.
Table 27 Overall Demand Estimates, Veranda at Assembly
Table 28 Demand Estimates by Floor Plan, Veranda at Assembly
3. DCA Demand Conclusions All capture rates are within DCA thresholds with and without PBRA on a portion of units and indicate sufficient demand in the market area to support the proposed Veranda at Assembly.
Income Target 30% AMI 60% AMI 80% AMI LIHTC Units Market Total UnitsMinimum Income Limit $12,450 $24,930 $24,930 $12,450 $34,500 $12,450Maximum Income Limit $16,845 $33,690 $44,920 $44,920 $71,880 $71,880
(A) Renter Income Qualification Percentage 4.5% 9.3% 19.9% 24.4% 31.5% 46.1%Demand from New Renter Households Calculation (C-B) *F*A
9 19 40 49 64 93
PLUSDemand from Existing Renter HHs (Substandard) Calculation B*D*F*A
16 33 71 87 112 165
PLUSDemand from Existing Renter HHhs (Overburdened) Calculation B*E*F*A
118 242 517 635 820 1,202
PLUSSecondary Market Demand Adjustment (10%)* 14 29 63 77 100 146SUBTOTAL 157 323 691 848 1,095 1,605PLUSDemand Elderly Homeowner Conversion* (Max. 2%) 3 6 14 17 22 32TOTAL DEMAND 160 330 705 865 1,117 1,637LESSComparable Units Built or Planned Since 2019 0 0 0 0 0 0Net Demand 160 330 705 865 1,117 1,637Proposed Units 30 25 25 80 20 100Capture Rate 18.7% 7.6% 3.5% 9.2% 1.8% 6.1%* Limited to 15% of Total Demand
Demand Calculation InputsA). % of Renter Hhlds with Qualifying Income see aboveB). 2019 Householders 55+ 16,766C). 2021 Householders 55+ 17,426D). Substandard Housing (% of Rental Stock) 7.0%E). Rent Overburdened (% Senior Households) 50.8%F). Renter Percentage (Senior Households) 30.6%G). Elderly Homeowner Turnover 1.2%
Income/Unit Size Income Limits Units Proposed
Renter Income Qualification %
Total Demand Supply Net
DemandCapture
Rate
By BedroomOne Bedroom Units $12,450 - $44,920 80 24.4% 865 0 865 9.2%Two Bedroom Units $34,500 - $71,880 20 31.5% 1,117 0 1,117 1.8%
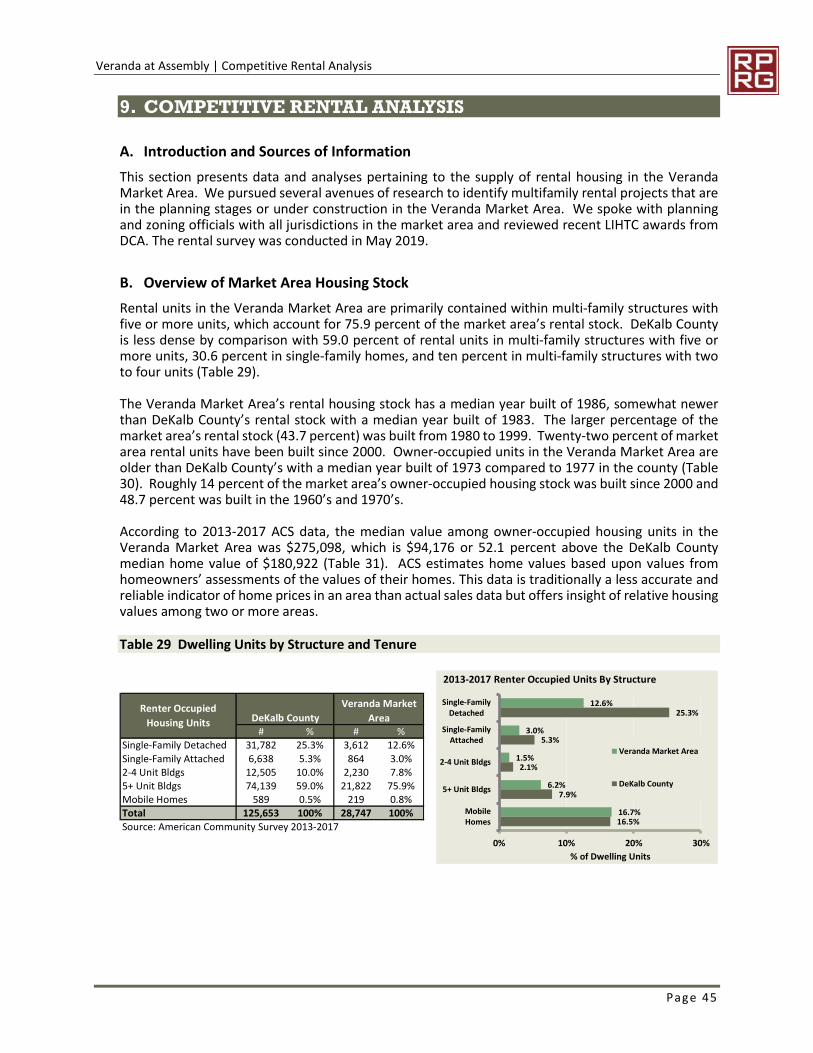
Veranda at Assembly | Competitive Rental Analysis
Page 45
9. COMPETITIVE RENTAL ANALYSIS
A. Introduction and Sources of Information This section presents data and analyses pertaining to the supply of rental housing in the Veranda Market Area. We pursued several avenues of research to identify multifamily rental projects that are in the planning stages or under construction in the Veranda Market Area. We spoke with planning and zoning officials with all jurisdictions in the market area and reviewed recent LIHTC awards from DCA. The rental survey was conducted in May 2019.
B. Overview of Market Area Housing Stock Rental units in the Veranda Market Area are primarily contained within multi-family structures with five or more units, which account for 75.9 percent of the market area’s rental stock. DeKalb County is less dense by comparison with 59.0 percent of rental units in multi-family structures with five or more units, 30.6 percent in single-family homes, and ten percent in multi-family structures with two to four units (Table 29).
The Veranda Market Area’s rental housing stock has a median year built of 1986, somewhat newer than DeKalb County’s rental stock with a median year built of 1983. The larger percentage of the market area’s rental stock (43.7 percent) was built from 1980 to 1999. Twenty-two percent of market area rental units have been built since 2000. Owner-occupied units in the Veranda Market Area are older than DeKalb County’s with a median year built of 1973 compared to 1977 in the county (Table 30). Roughly 14 percent of the market area’s owner-occupied housing stock was built since 2000 and 48.7 percent was built in the 1960’s and 1970’s.
According to 2013-2017 ACS data, the median value among owner-occupied housing units in the Veranda Market Area was $275,098, which is $94,176 or 52.1 percent above the DeKalb County median home value of $180,922 (Table 31). ACS estimates home values based upon values from homeowners’ assessments of the values of their homes. This data is traditionally a less accurate and reliable indicator of home prices in an area than actual sales data but offers insight of relative housing values among two or more areas.
Table 29 Dwelling Units by Structure and Tenure
DeKalb CountyVeranda Market
Area# % # %
Single-Family Detached 31,782 25.3% 3,612 12.6%Single-Family Attached 6,638 5.3% 864 3.0%2-4 Unit Bldgs 12,505 10.0% 2,230 7.8%5+ Unit Bldgs 74,139 59.0% 21,822 75.9%Mobile Homes 589 0.5% 219 0.8%Total 125,653 100% 28,747 100%Source: American Community Survey 2013-2017
Renter Occupied Housing Units
12.6%
3.0%
1.5%
6.2%
16.7%
25.3%
5.3%
2.1%
7.9%
16.5%
0% 10% 20% 30%
Single-FamilyDetached
Single-FamilyAttached
2-4 Unit Bldgs
5+ Unit Bldgs
MobileHomes
% of Dwelling Units
2013-2017 Renter Occupied Units By Structure
Veranda Market Area
DeKalb County
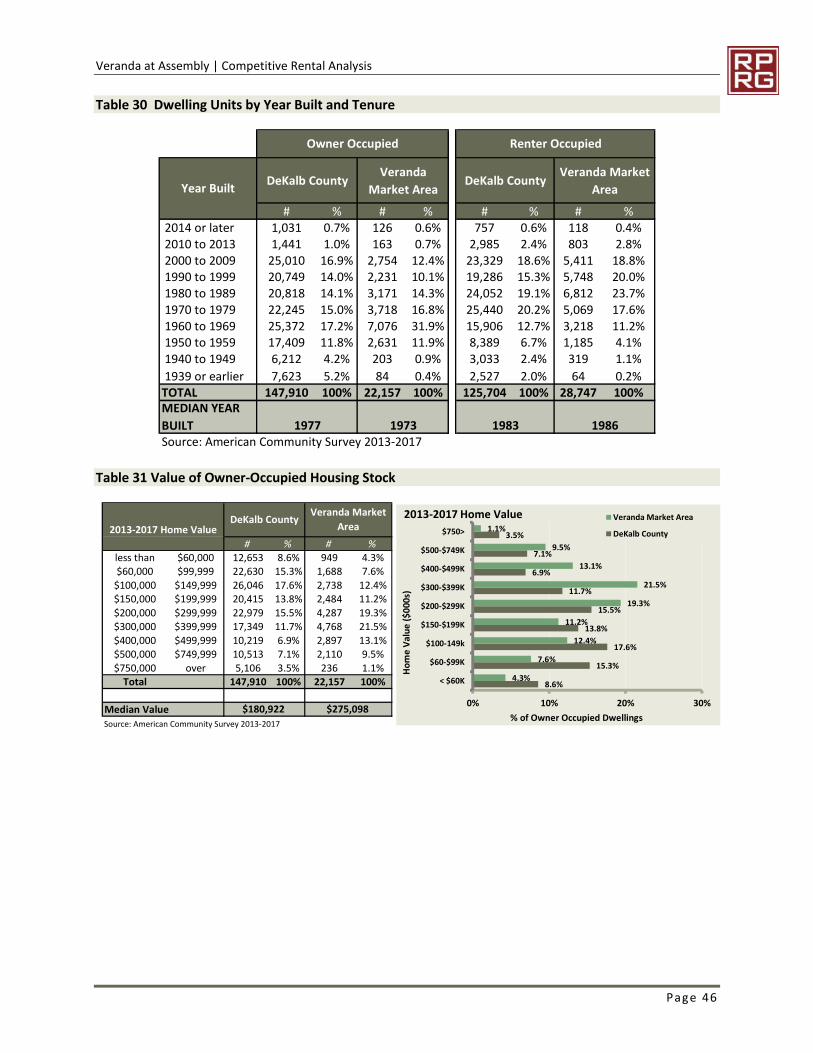
Veranda at Assembly | Competitive Rental Analysis
Page 46
Table 30 Dwelling Units by Year Built and Tenure
Table 31 Value of Owner-Occupied Housing Stock
DeKalb County Veranda Market Area
DeKalb County Veranda Market Area
# % # % # % # % 2014 or later 1,031 0.7% 126 0.6% 757 0.6% 118 0.4% 2010 to 2013 1,441 1.0% 163 0.7% 2,985 2.4% 803 2.8% 2000 to 2009 25,010 16.9% 2,754 12.4% 23,329 18.6% 5,411 18.8% 1990 to 1999 20,749 14.0% 2,231 10.1% 19,286 15.3% 5,748 20.0% 1980 to 1989 20,818 14.1% 3,171 14.3% 24,052 19.1% 6,812 23.7% 1970 to 1979 22,245 15.0% 3,718 16.8% 25,440 20.2% 5,069 17.6% 1960 to 1969 25,372 17.2% 7,076 31.9% 15,906 12.7% 3,218 11.2% 1950 to 1959 17,409 11.8% 2,631 11.9% 8,389 6.7% 1,185 4.1% 1940 to 1949 6,212 4.2% 203 0.9% 3,033 2.4% 319 1.1% 1939 or earlier 7,623 5.2% 84 0.4% 2,527 2.0% 64 0.2%TOTAL 147,910 100% 22,157 100% 125,704 100% 28,747 100%MEDIAN YEAR BUILT 1977 1973 1983 1986Source: American Community Survey 2013-2017
Renter OccupiedOwner Occupied
Year Built
# % # %
less than $60,000 12,653 8.6% 949 4.3%$60,000 $99,999 22,630 15.3% 1,688 7.6%$100,000 $149,999 26,046 17.6% 2,738 12.4%$150,000 $199,999 20,415 13.8% 2,484 11.2%$200,000 $299,999 22,979 15.5% 4,287 19.3%$300,000 $399,999 17,349 11.7% 4,768 21.5%$400,000 $499,999 10,219 6.9% 2,897 13.1%$500,000 $749,999 10,513 7.1% 2,110 9.5%$750,000 over 5,106 3.5% 236 1.1%
Total 147,910 100% 22,157 100%
Median ValueSource: American Community Survey 2013-2017
2013-2017 Home ValueDeKalb County Veranda Market
Area
$180,922 $275,098
8.6%
15.3%
17.6%
13.8%
15.5%
11.7%
6.9%
7.1%
3.5%
4.3%
7.6%
12.4%
11.2%
19.3%
21.5%
13.1%
9.5%
1.1%
0% 10% 20% 30%
< $60K
$60-$99K
$100-149k
$150-$199K
$200-$299K
$300-$399K
$400-$499K
$500-$749K
$750>
% of Owner Occupied Dwellings
Hom
e Va
lue
($00
0s)
2013-2017 Home Value Veranda Market Area
DeKalb County
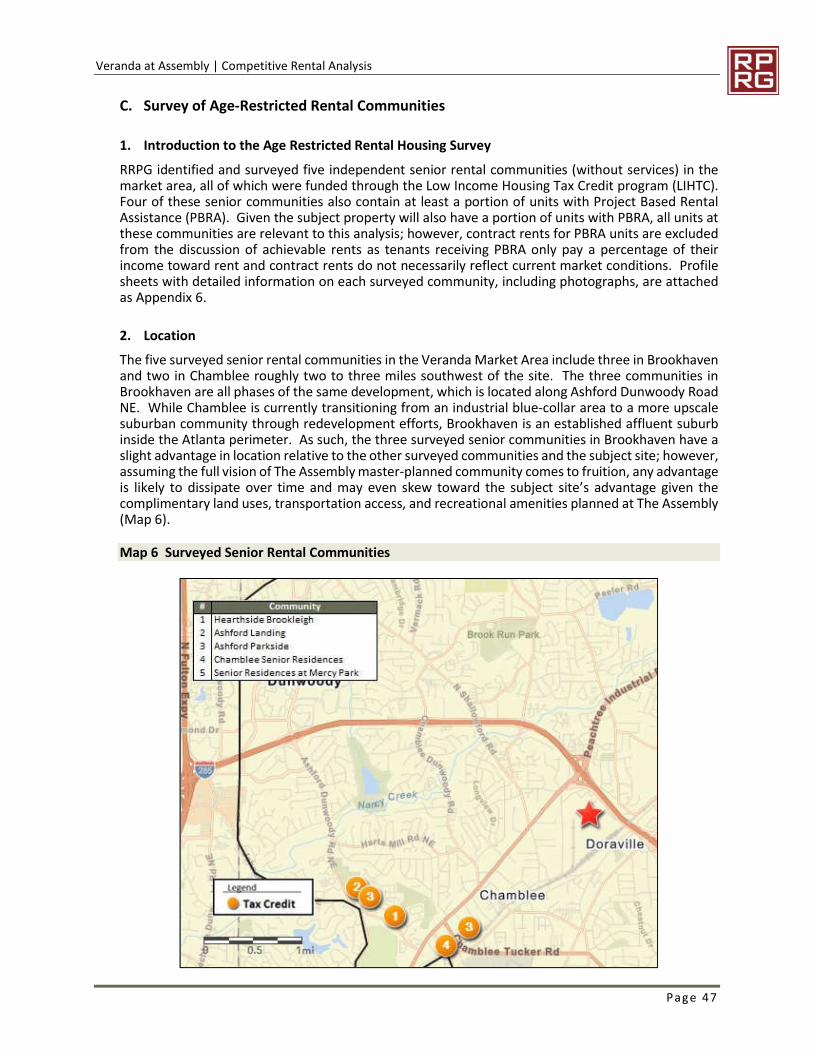
Veranda at Assembly | Competitive Rental Analysis
Page 47
C. Survey of Age-Restricted Rental Communities
1. Introduction to the Age Restricted Rental Housing Survey RRPG identified and surveyed five independent senior rental communities (without services) in the market area, all of which were funded through the Low Income Housing Tax Credit program (LIHTC). Four of these senior communities also contain at least a portion of units with Project Based Rental Assistance (PBRA). Given the subject property will also have a portion of units with PBRA, all units at these communities are relevant to this analysis; however, contract rents for PBRA units are excluded from the discussion of achievable rents as tenants receiving PBRA only pay a percentage of their income toward rent and contract rents do not necessarily reflect current market conditions. Profile sheets with detailed information on each surveyed community, including photographs, are attached as Appendix 6.
2. Location The five surveyed senior rental communities in the Veranda Market Area include three in Brookhaven and two in Chamblee roughly two to three miles southwest of the site. The three communities in Brookhaven are all phases of the same development, which is located along Ashford Dunwoody Road NE. While Chamblee is currently transitioning from an industrial blue-collar area to a more upscale suburban community through redevelopment efforts, Brookhaven is an established affluent suburb inside the Atlanta perimeter. As such, the three surveyed senior communities in Brookhaven have a slight advantage in location relative to the other surveyed communities and the subject site; however, assuming the full vision of The Assembly master-planned community comes to fruition, any advantage is likely to dissipate over time and may even skew toward the subject site’s advantage given the complimentary land uses, transportation access, and recreational amenities planned at The Assembly (Map 6).
Map 6 Surveyed Senior Rental Communities
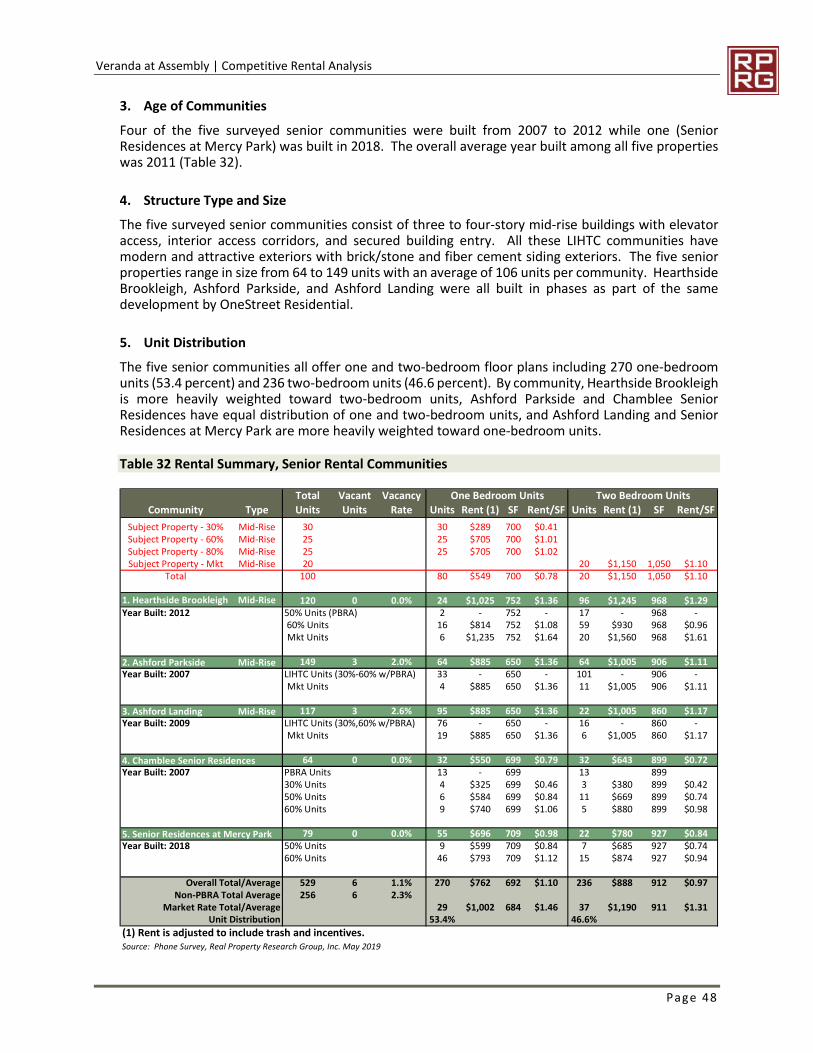
Veranda at Assembly | Competitive Rental Analysis
Page 48
3. Age of Communities Four of the five surveyed senior communities were built from 2007 to 2012 while one (Senior Residences at Mercy Park) was built in 2018. The overall average year built among all five properties was 2011 (Table 32).
4. Structure Type and Size The five surveyed senior communities consist of three to four-story mid-rise buildings with elevator access, interior access corridors, and secured building entry. All these LIHTC communities have modern and attractive exteriors with brick/stone and fiber cement siding exteriors. The five senior properties range in size from 64 to 149 units with an average of 106 units per community. Hearthside Brookleigh, Ashford Parkside, and Ashford Landing were all built in phases as part of the same development by OneStreet Residential.
5. Unit Distribution The five senior communities all offer one and two-bedroom floor plans including 270 one-bedroom units (53.4 percent) and 236 two-bedroom units (46.6 percent). By community, Hearthside Brookleigh is more heavily weighted toward two-bedroom units, Ashford Parkside and Chamblee Senior Residences have equal distribution of one and two-bedroom units, and Ashford Landing and Senior Residences at Mercy Park are more heavily weighted toward one-bedroom units.
Table 32 Rental Summary, Senior Rental Communities
Total Vacant VacancyCommunity Type Units Units Rate Units Rent (1) SF Rent/SF Units Rent (1) SF Rent/SF
Subject Property - 30% Mid-Rise 30 30 $289 700 $0.41Subject Property - 60% Mid-Rise 25 25 $705 700 $1.01Subject Property - 80% Mid-Rise 25 25 $705 700 $1.02Subject Property - Mkt Mid-Rise 20 20 $1,150 1,050 $1.10
Total 100 80 $549 700 $0.78 20 $1,150 1,050 $1.10
1. Hearthside Brookleigh Mid-Rise 120 0 0.0% 24 $1,025 752 $1.36 96 $1,245 968 $1.29Year Built: 2012 50% Units (PBRA) 2 - 752 - 17 - 968 -
60% Units 16 $814 752 $1.08 59 $930 968 $0.96Mkt Units 6 $1,235 752 $1.64 20 $1,560 968 $1.61
2. Ashford Parkside Mid-Rise 149 3 2.0% 64 $885 650 $1.36 64 $1,005 906 $1.11Year Built: 2007 LIHTC Units (30%-60% w/PBRA) 33 - 650 - 101 - 906 -
Mkt Units 4 $885 650 $1.36 11 $1,005 906 $1.11
3. Ashford Landing Mid-Rise 117 3 2.6% 95 $885 650 $1.36 22 $1,005 860 $1.17Year Built: 2009 LIHTC Units (30%,60% w/PBRA) 76 - 650 - 16 - 860 -
Mkt Units 19 $885 650 $1.36 6 $1,005 860 $1.17
4. Chamblee Senior Residences 64 0 0.0% 32 $550 699 $0.79 32 $643 899 $0.72Year Built: 2007 PBRA Units 13 - 699 13 899
30% Units 4 $325 699 $0.46 3 $380 899 $0.4250% Units 6 $584 699 $0.84 11 $669 899 $0.7460% Units 9 $740 699 $1.06 5 $880 899 $0.98
5. Senior Residences at Mercy Park 79 0 0.0% 55 $696 709 $0.98 22 $780 927 $0.84Year Built: 2018 50% Units 9 $599 709 $0.84 7 $685 927 $0.74
60% Units 46 $793 709 $1.12 15 $874 927 $0.94
Overall Total/Average 529 6 1.1% 270 $762 692 $1.10 236 $888 912 $0.97Non-PBRA Total Average 256 6 2.3%
Market Rate Total/Average 29 $1,002 684 $1.46 37 $1,190 911 $1.31Unit Distribution 53.4% 46.6%
(1) Rent is adjusted to include trash and incentives.Source: Phone Survey, Real Property Research Group, Inc. May 2019
One Bedroom Units Two Bedroom Units
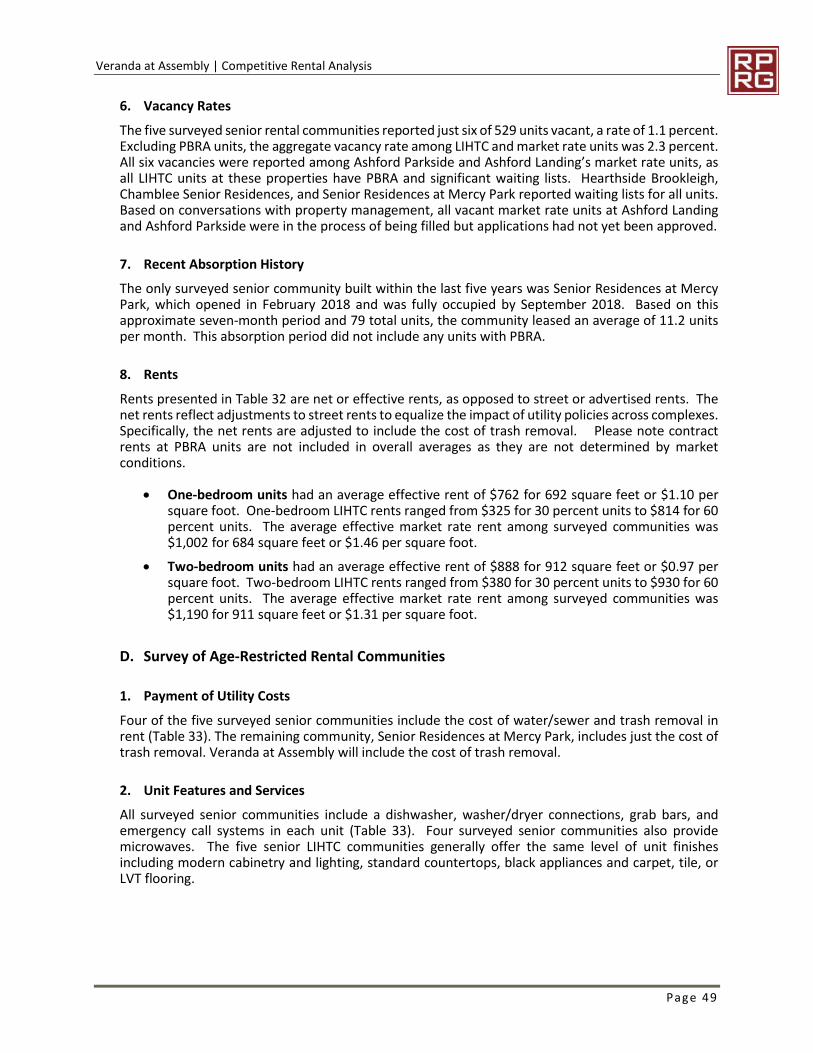
Veranda at Assembly | Competitive Rental Analysis
Page 49
6. Vacancy Rates The five surveyed senior rental communities reported just six of 529 units vacant, a rate of 1.1 percent. Excluding PBRA units, the aggregate vacancy rate among LIHTC and market rate units was 2.3 percent. All six vacancies were reported among Ashford Parkside and Ashford Landing’s market rate units, as all LIHTC units at these properties have PBRA and significant waiting lists. Hearthside Brookleigh, Chamblee Senior Residences, and Senior Residences at Mercy Park reported waiting lists for all units. Based on conversations with property management, all vacant market rate units at Ashford Landing and Ashford Parkside were in the process of being filled but applications had not yet been approved.
7. Recent Absorption History The only surveyed senior community built within the last five years was Senior Residences at Mercy Park, which opened in February 2018 and was fully occupied by September 2018. Based on this approximate seven-month period and 79 total units, the community leased an average of 11.2 units per month. This absorption period did not include any units with PBRA.
8. Rents Rents presented in Table 32 are net or effective rents, as opposed to street or advertised rents. The net rents reflect adjustments to street rents to equalize the impact of utility policies across complexes. Specifically, the net rents are adjusted to include the cost of trash removal. Please note contract rents at PBRA units are not included in overall averages as they are not determined by market conditions.
One-bedroom units had an average effective rent of $762 for 692 square feet or $1.10 per square foot. One-bedroom LIHTC rents ranged from $325 for 30 percent units to $814 for 60 percent units. The average effective market rate rent among surveyed communities was $1,002 for 684 square feet or $1.46 per square foot.
Two-bedroom units had an average effective rent of $888 for 912 square feet or $0.97 per square foot. Two-bedroom LIHTC rents ranged from $380 for 30 percent units to $930 for 60 percent units. The average effective market rate rent among surveyed communities was $1,190 for 911 square feet or $1.31 per square foot.
D. Survey of Age-Restricted Rental Communities
1. Payment of Utility Costs Four of the five surveyed senior communities include the cost of water/sewer and trash removal in rent (Table 33). The remaining community, Senior Residences at Mercy Park, includes just the cost of trash removal. Veranda at Assembly will include the cost of trash removal.
2. Unit Features and Services All surveyed senior communities include a dishwasher, washer/dryer connections, grab bars, and emergency call systems in each unit (Table 33). Four surveyed senior communities also provide microwaves. The five senior LIHTC communities generally offer the same level of unit finishes including modern cabinetry and lighting, standard countertops, black appliances and carpet, tile, or LVT flooring.
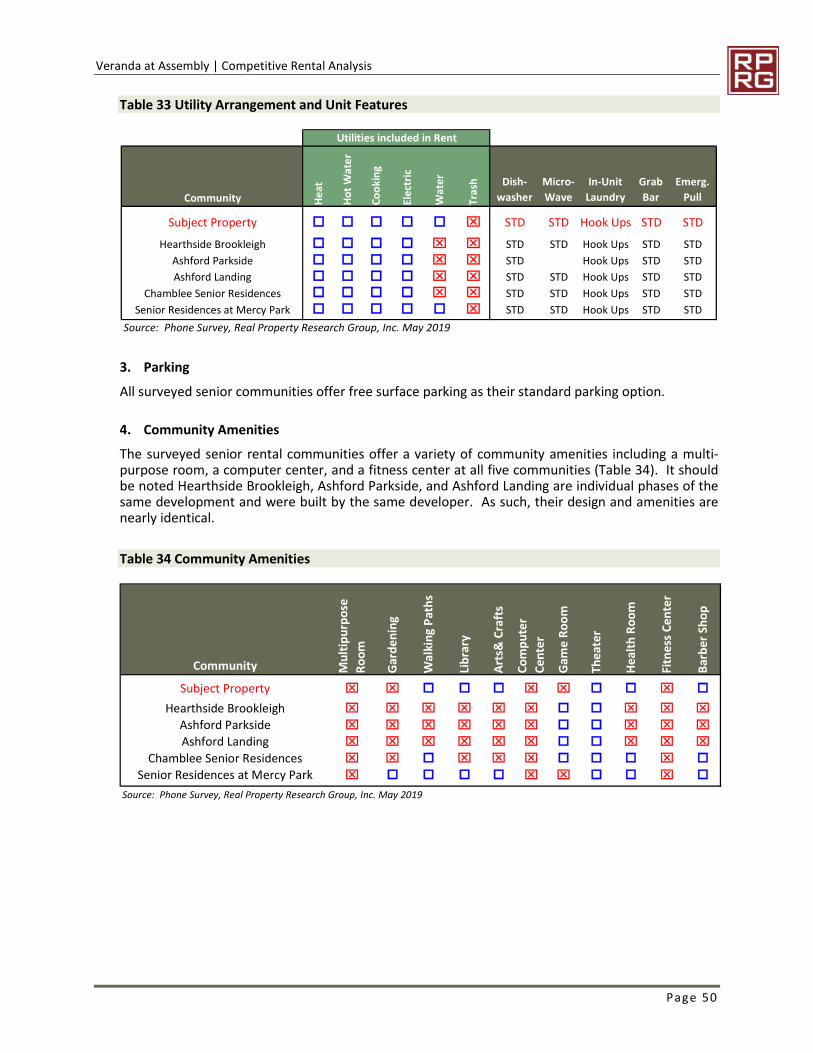
Veranda at Assembly | Competitive Rental Analysis
Page 50
Table 33 Utility Arrangement and Unit Features
3. Parking All surveyed senior communities offer free surface parking as their standard parking option.
4. Community Amenities The surveyed senior rental communities offer a variety of community amenities including a multi-purpose room, a computer center, and a fitness center at all five communities (Table 34). It should be noted Hearthside Brookleigh, Ashford Parkside, and Ashford Landing are individual phases of the same development and were built by the same developer. As such, their design and amenities are nearly identical.
Table 34 Community Amenities
Utilities included in Rent
Community Heat
Hot W
ater
Cook
ing
Elec
tric
Wat
er
Tras
h Dish-washer
Micro-Wave
In-Unit Laundry
Grab Bar
Emerg. Pull
Subject Property o o o o o x STD STD Hook Ups STD STDHearthside Brookleigh o o o o x x STD STD Hook Ups STD STD
Ashford Parkside o o o o x x STD Hook Ups STD STDAshford Landing o o o o x x STD STD Hook Ups STD STD
Chamblee Senior Residences o o o o x x STD STD Hook Ups STD STDSenior Residences at Mercy Park o o o o o x STD STD Hook Ups STD STD
Source: Phone Survey, Real Property Research Group, Inc. May 2019
Community Mul
tipur
pose
Ro
om
Gard
enin
g
Wal
king
Pat
hs
Libra
ry
Arts
& C
rafts
Com
pute
r Ce
nter
Gam
e Ro
om
Thea
ter
Heal
th R
oom
Fitn
ess C
ente
r
Barb
er S
hop
Subject Property x x o o o x x o o x o
Hearthside Brookleigh x x x x x x o o x x xAshford Parkside x x x x x x o o x x xAshford Landing x x x x x x o o x x x
Chamblee Senior Residences x x o x x x o o o x oSenior Residences at Mercy Park x o o o o x x o o x o
Source: Phone Survey, Real Property Research Group, Inc. May 2019
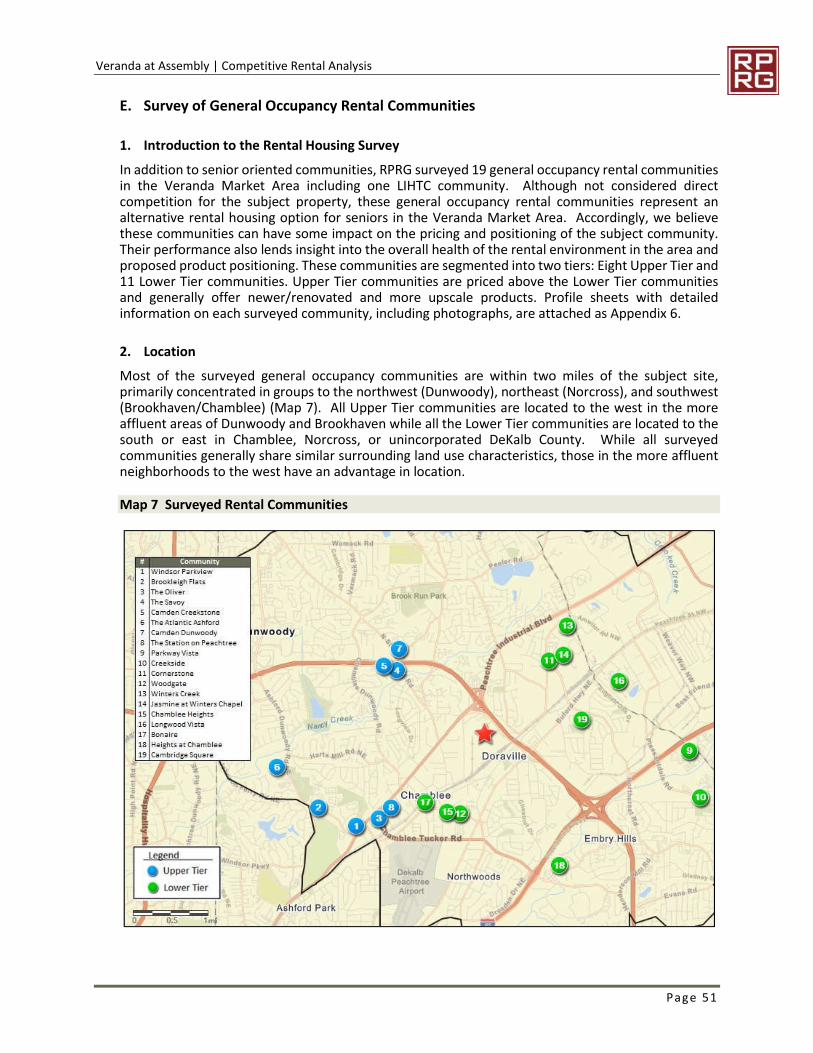
Veranda at Assembly | Competitive Rental Analysis
Page 51
E. Survey of General Occupancy Rental Communities
1. Introduction to the Rental Housing Survey In addition to senior oriented communities, RPRG surveyed 19 general occupancy rental communities in the Veranda Market Area including one LIHTC community. Although not considered direct competition for the subject property, these general occupancy rental communities represent an alternative rental housing option for seniors in the Veranda Market Area. Accordingly, we believe these communities can have some impact on the pricing and positioning of the subject community. Their performance also lends insight into the overall health of the rental environment in the area and proposed product positioning. These communities are segmented into two tiers: Eight Upper Tier and 11 Lower Tier communities. Upper Tier communities are priced above the Lower Tier communities and generally offer newer/renovated and more upscale products. Profile sheets with detailed information on each surveyed community, including photographs, are attached as Appendix 6.
2. Location Most of the surveyed general occupancy communities are within two miles of the subject site, primarily concentrated in groups to the northwest (Dunwoody), northeast (Norcross), and southwest (Brookhaven/Chamblee) (Map 7). All Upper Tier communities are located to the west in the more affluent areas of Dunwoody and Brookhaven while all the Lower Tier communities are located to the south or east in Chamblee, Norcross, or unincorporated DeKalb County. While all surveyed communities generally share similar surrounding land use characteristics, those in the more affluent neighborhoods to the west have an advantage in location.
Map 7 Surveyed Rental Communities
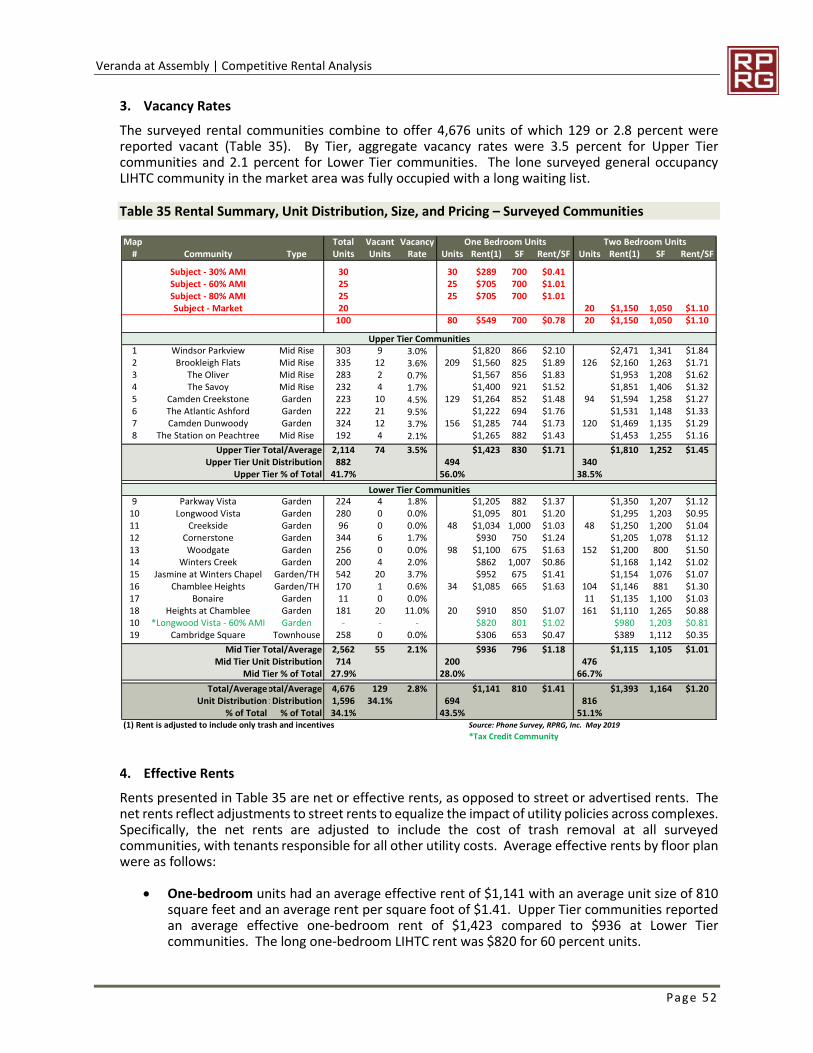
Veranda at Assembly | Competitive Rental Analysis
Page 52
3. Vacancy Rates The surveyed rental communities combine to offer 4,676 units of which 129 or 2.8 percent were reported vacant (Table 35). By Tier, aggregate vacancy rates were 3.5 percent for Upper Tier communities and 2.1 percent for Lower Tier communities. The lone surveyed general occupancy LIHTC community in the market area was fully occupied with a long waiting list.
Table 35 Rental Summary, Unit Distribution, Size, and Pricing – Surveyed Communities
4. Effective Rents Rents presented in Table 35 are net or effective rents, as opposed to street or advertised rents. The net rents reflect adjustments to street rents to equalize the impact of utility policies across complexes. Specifically, the net rents are adjusted to include the cost of trash removal at all surveyed communities, with tenants responsible for all other utility costs. Average effective rents by floor plan were as follows:
One-bedroom units had an average effective rent of $1,141 with an average unit size of 810 square feet and an average rent per square foot of $1.41. Upper Tier communities reported an average effective one-bedroom rent of $1,423 compared to $936 at Lower Tier communities. The long one-bedroom LIHTC rent was $820 for 60 percent units.
Map Total Vacant Vacancy One Bedroom Units Two Bedroom Units# Community Type Units Units Rate Units Rent(1) SF Rent/SF Units Rent(1) SF Rent/SF
Subject - 30% AMI 30 30 $289 700 $0.41Subject - 60% AMI 25 25 $705 700 $1.01Subject - 80% AMI 25 25 $705 700 $1.01Subject - Market 20 20 $1,150 1,050 $1.10
100 80 $549 700 $0.78 20 $1,150 1,050 $1.10
Upper Tier Communities1 Windsor Parkview Mid Rise 303 9 3.0% $1,820 866 $2.10 $2,471 1,341 $1.842 Brookleigh Flats Mid Rise 335 12 3.6% 209 $1,560 825 $1.89 126 $2,160 1,263 $1.713 The Oliver Mid Rise 283 2 0.7% $1,567 856 $1.83 $1,953 1,208 $1.624 The Savoy Mid Rise 232 4 1.7% $1,400 921 $1.52 $1,851 1,406 $1.325 Camden Creekstone Garden 223 10 4.5% 129 $1,264 852 $1.48 94 $1,594 1,258 $1.276 The Atlantic Ashford Garden 222 21 9.5% $1,222 694 $1.76 $1,531 1,148 $1.337 Camden Dunwoody Garden 324 12 3.7% 156 $1,285 744 $1.73 120 $1,469 1,135 $1.298 The Station on Peachtree Mid Rise 192 4 2.1% $1,265 882 $1.43 $1,453 1,255 $1.16
Upper Tier Total/Average 2,114 74 3.5% $1,423 830 $1.71 $1,810 1,252 $1.45Upper Tier Unit Distribution 882 494 340
Upper Tier % of Total 41.7% 56.0% 38.5%Lower Tier Communities
9 Parkway Vista Garden 224 4 1.8% $1,205 882 $1.37 $1,350 1,207 $1.1210 Longwood Vista Garden 280 0 0.0% $1,095 801 $1.20 $1,295 1,203 $0.9511 Creekside Garden 96 0 0.0% 48 $1,034 1,000 $1.03 48 $1,250 1,200 $1.0412 Cornerstone Garden 344 6 1.7% $930 750 $1.24 $1,205 1,078 $1.1213 Woodgate Garden 256 0 0.0% 98 $1,100 675 $1.63 152 $1,200 800 $1.5014 Winters Creek Garden 200 4 2.0% $862 1,007 $0.86 $1,168 1,142 $1.0215 Jasmine at Winters Chapel Garden/TH 542 20 3.7% $952 675 $1.41 $1,154 1,076 $1.0716 Chamblee Heights Garden/TH 170 1 0.6% 34 $1,085 665 $1.63 104 $1,146 881 $1.3017 Bonaire Garden 11 0 0.0% 11 $1,135 1,100 $1.0318 Heights at Chamblee Garden 181 20 11.0% 20 $910 850 $1.07 161 $1,110 1,265 $0.8810 *Longwood Vista - 60% AMI Garden - - - $820 801 $1.02 $980 1,203 $0.8119 Cambridge Square Townhouse 258 0 0.0% $306 653 $0.47 $389 1,112 $0.35
Mid Tier Total/Average 2,562 55 2.1% $936 796 $1.18 $1,115 1,105 $1.01Mid Tier Unit Distribution 714 200 476
Mid Tier % of Total 27.9% 28.0% 66.7%Total/AverageTotal/Average 4,676 129 2.8% $1,141 810 $1.41 $1,393 1,164 $1.20
Unit DistributionUnit Distribution 1,596 34.1% 694 816% of Total % of Total 34.1% 43.5% 51.1%
(1) Rent is adjusted to include only trash and incentives Source: Phone Survey, RPRG, Inc. May 2019*Tax Credit Community
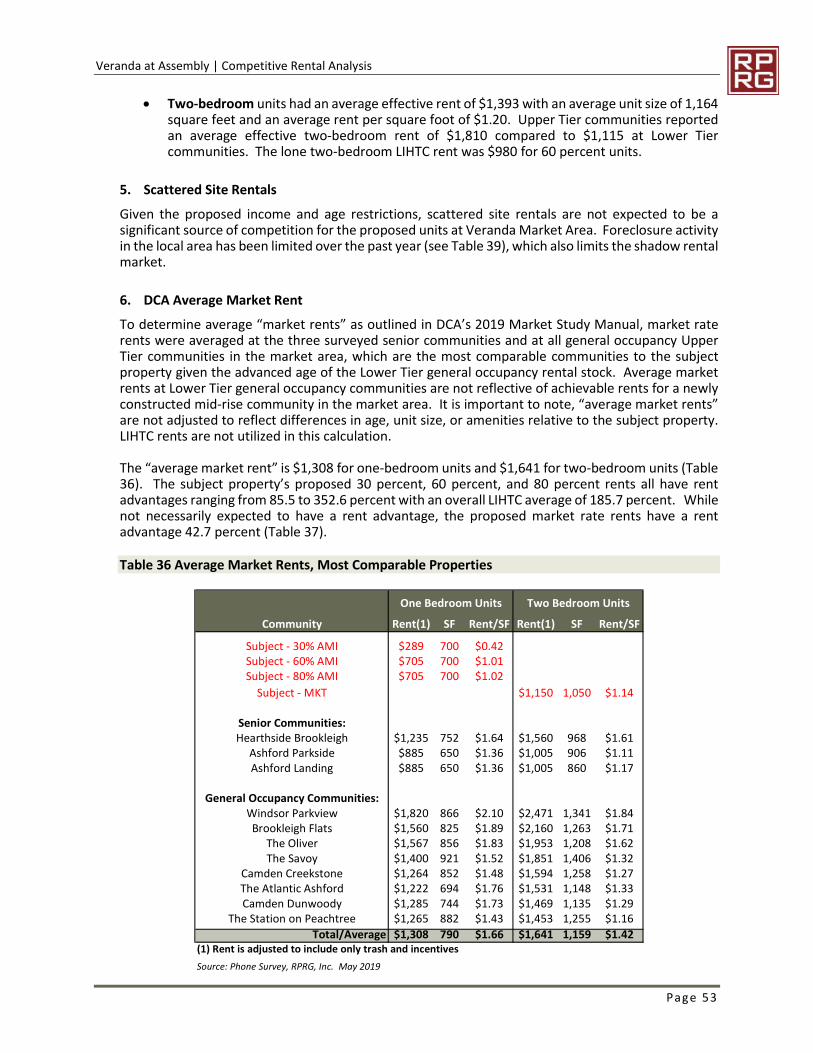
Veranda at Assembly | Competitive Rental Analysis
Page 53
Two-bedroom units had an average effective rent of $1,393 with an average unit size of 1,164 square feet and an average rent per square foot of $1.20. Upper Tier communities reported an average effective two-bedroom rent of $1,810 compared to $1,115 at Lower Tier communities. The lone two-bedroom LIHTC rent was $980 for 60 percent units.
5. Scattered Site Rentals Given the proposed income and age restrictions, scattered site rentals are not expected to be a significant source of competition for the proposed units at Veranda Market Area. Foreclosure activity in the local area has been limited over the past year (see Table 39), which also limits the shadow rental market.
6. DCA Average Market Rent To determine average “market rents” as outlined in DCA’s 2019 Market Study Manual, market rate rents were averaged at the three surveyed senior communities and at all general occupancy Upper Tier communities in the market area, which are the most comparable communities to the subject property given the advanced age of the Lower Tier general occupancy rental stock. Average market rents at Lower Tier general occupancy communities are not reflective of achievable rents for a newly constructed mid-rise community in the market area. It is important to note, “average market rents” are not adjusted to reflect differences in age, unit size, or amenities relative to the subject property. LIHTC rents are not utilized in this calculation.
The “average market rent” is $1,308 for one-bedroom units and $1,641 for two-bedroom units (Table 36). The subject property’s proposed 30 percent, 60 percent, and 80 percent rents all have rent advantages ranging from 85.5 to 352.6 percent with an overall LIHTC average of 185.7 percent. While not necessarily expected to have a rent advantage, the proposed market rate rents have a rent advantage 42.7 percent (Table 37).
Table 36 Average Market Rents, Most Comparable Properties
One Bedroom UnitsCommunity Rent(1) SF Rent/SF Rent(1) SF Rent/SF
Subject - 30% AMI $289 700 $0.42Subject - 60% AMI $705 700 $1.01Subject - 80% AMI $705 700 $1.02
Subject - MKT $1,150 1,050 $1.14
Senior Communities:Hearthside Brookleigh $1,235 752 $1.64 $1,560 968 $1.61
Ashford Parkside $885 650 $1.36 $1,005 906 $1.11Ashford Landing $885 650 $1.36 $1,005 860 $1.17
General Occupancy Communities:Windsor Parkview $1,820 866 $2.10 $2,471 1,341 $1.84Brookleigh Flats $1,560 825 $1.89 $2,160 1,263 $1.71
The Oliver $1,567 856 $1.83 $1,953 1,208 $1.62The Savoy $1,400 921 $1.52 $1,851 1,406 $1.32
Camden Creekstone $1,264 852 $1.48 $1,594 1,258 $1.27The Atlantic Ashford $1,222 694 $1.76 $1,531 1,148 $1.33Camden Dunwoody $1,285 744 $1.73 $1,469 1,135 $1.29
The Station on Peachtree $1,265 882 $1.43 $1,453 1,255 $1.161,159Total/Average $1,308 790 $1.66 $1,641 1,159 $1.42
(1) Rent is adjusted to include only trash and incentivesSource: Phone Survey, RPRG, Inc. May 2019
Two Bedroom Units
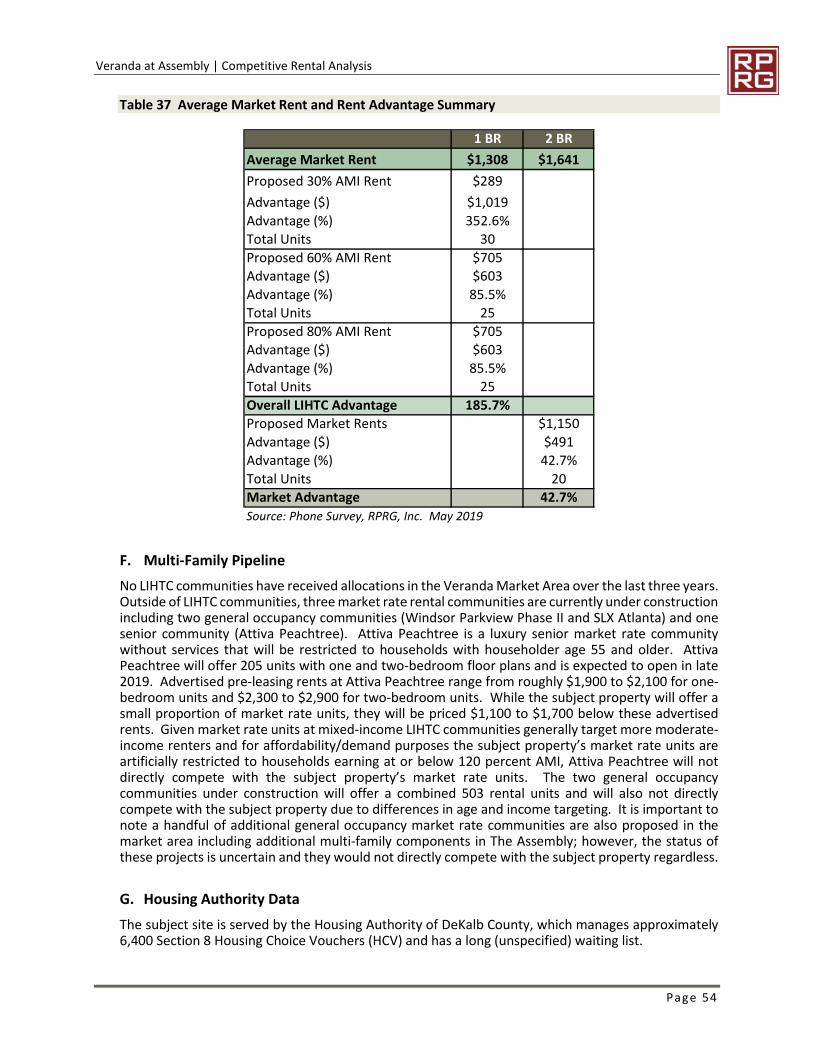
Veranda at Assembly | Competitive Rental Analysis
Page 54
Table 37 Average Market Rent and Rent Advantage Summary
F. Multi-Family Pipeline No LIHTC communities have received allocations in the Veranda Market Area over the last three years. Outside of LIHTC communities, three market rate rental communities are currently under construction including two general occupancy communities (Windsor Parkview Phase II and SLX Atlanta) and one senior community (Attiva Peachtree). Attiva Peachtree is a luxury senior market rate community without services that will be restricted to households with householder age 55 and older. Attiva Peachtree will offer 205 units with one and two-bedroom floor plans and is expected to open in late 2019. Advertised pre-leasing rents at Attiva Peachtree range from roughly $1,900 to $2,100 for one-bedroom units and $2,300 to $2,900 for two-bedroom units. While the subject property will offer a small proportion of market rate units, they will be priced $1,100 to $1,700 below these advertised rents. Given market rate units at mixed-income LIHTC communities generally target more moderate-income renters and for affordability/demand purposes the subject property’s market rate units are artificially restricted to households earning at or below 120 percent AMI, Attiva Peachtree will not directly compete with the subject property’s market rate units. The two general occupancy communities under construction will offer a combined 503 rental units and will also not directly compete with the subject property due to differences in age and income targeting. It is important to note a handful of additional general occupancy market rate communities are also proposed in the market area including additional multi-family components in The Assembly; however, the status of these projects is uncertain and they would not directly compete with the subject property regardless.
G. Housing Authority Data The subject site is served by the Housing Authority of DeKalb County, which manages approximately 6,400 Section 8 Housing Choice Vouchers (HCV) and has a long (unspecified) waiting list.
1 BR 2 BRAverage Market Rent $1,308 $1,641Proposed 30% AMI Rent $289Advantage ($) $1,019Advantage (%) 352.6%Total Units 30Proposed 60% AMI Rent $705Advantage ($) $603Advantage (%) 85.5%Total Units 25Proposed 80% AMI Rent $705Advantage ($) $603Advantage (%) 85.5%Total Units 25Overall LIHTC Advantage 185.7%Proposed Market Rents $1,150Advantage ($) $491Advantage (%) 42.7%Total Units 20Market Advantage 42.7%Source: Phone Survey, RPRG, Inc. May 2019
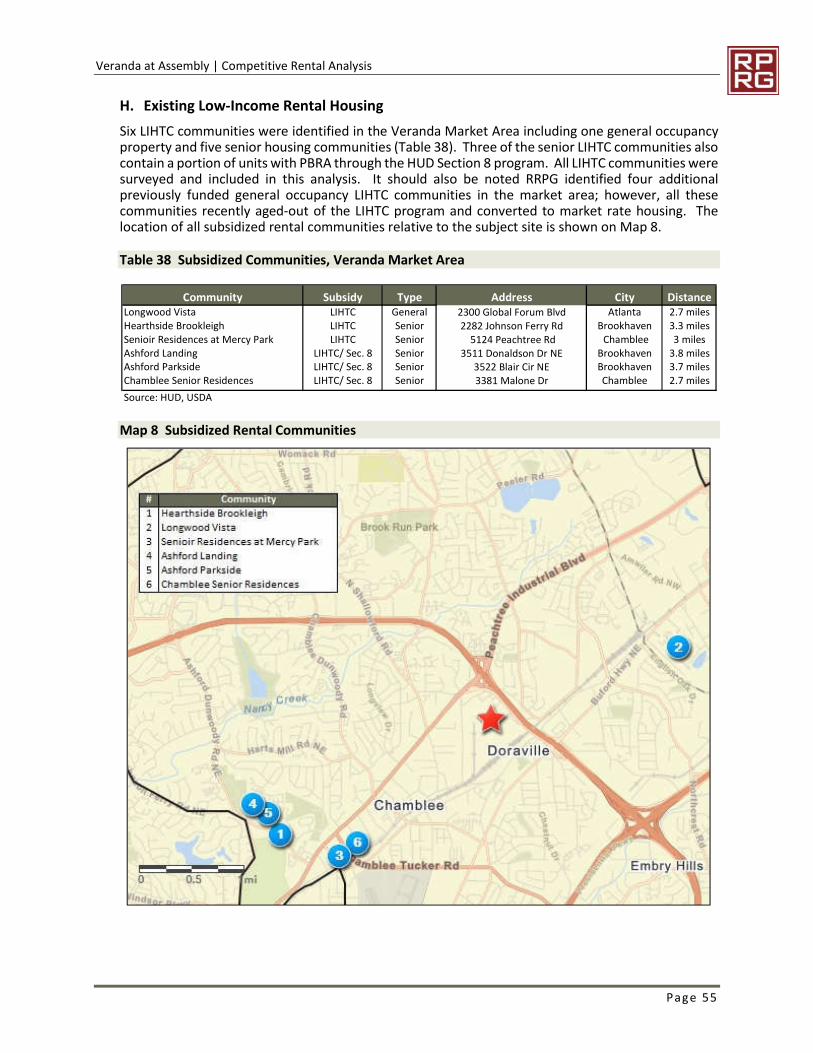
Veranda at Assembly | Competitive Rental Analysis
Page 55
H. Existing Low-Income Rental Housing Six LIHTC communities were identified in the Veranda Market Area including one general occupancy property and five senior housing communities (Table 38). Three of the senior LIHTC communities also contain a portion of units with PBRA through the HUD Section 8 program. All LIHTC communities were surveyed and included in this analysis. It should also be noted RRPG identified four additional previously funded general occupancy LIHTC communities in the market area; however, all these communities recently aged-out of the LIHTC program and converted to market rate housing. The location of all subsidized rental communities relative to the subject site is shown on Map 8.
Table 38 Subsidized Communities, Veranda Market Area
Map 8 Subsidized Rental Communities
Community Subsidy Type Address City DistanceLongwood Vista LIHTC General 2300 Global Forum Blvd Atlanta 2.7 milesHearthside Brookleigh LIHTC Senior 2282 Johnson Ferry Rd Brookhaven 3.3 milesSenioir Residences at Mercy Park LIHTC Senior 5124 Peachtree Rd Chamblee 3 milesAshford Landing LIHTC/ Sec. 8 Senior 3511 Donaldson Dr NE Brookhaven 3.8 milesAshford Parkside LIHTC/ Sec. 8 Senior 3522 Blair Cir NE Brookhaven 3.7 milesChamblee Senior Residences LIHTC/ Sec. 8 Senior 3381 Malone Dr Chamblee 2.7 milesGreenvilleSource: HUD, USDA
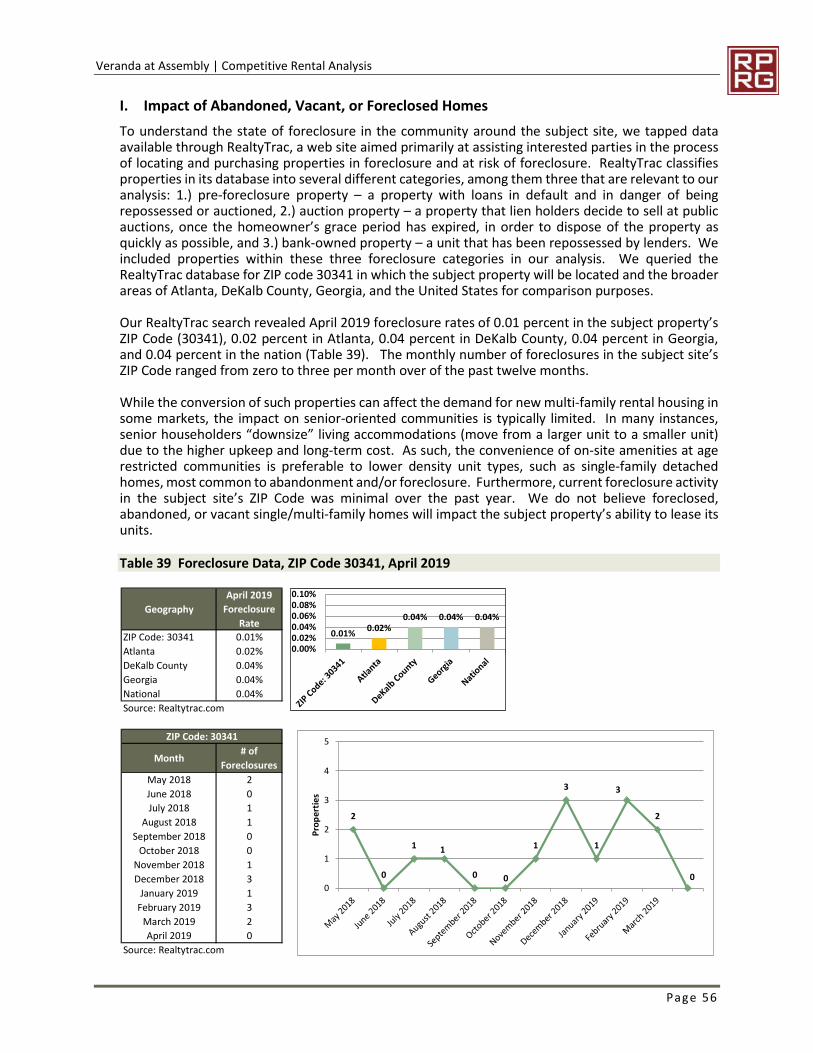
Veranda at Assembly | Competitive Rental Analysis
Page 56
I. Impact of Abandoned, Vacant, or Foreclosed Homes To understand the state of foreclosure in the community around the subject site, we tapped data available through RealtyTrac, a web site aimed primarily at assisting interested parties in the process of locating and purchasing properties in foreclosure and at risk of foreclosure. RealtyTrac classifies properties in its database into several different categories, among them three that are relevant to our analysis: 1.) pre-foreclosure property – a property with loans in default and in danger of being repossessed or auctioned, 2.) auction property – a property that lien holders decide to sell at public auctions, once the homeowner’s grace period has expired, in order to dispose of the property as quickly as possible, and 3.) bank-owned property – a unit that has been repossessed by lenders. We included properties within these three foreclosure categories in our analysis. We queried the RealtyTrac database for ZIP code 30341 in which the subject property will be located and the broader areas of Atlanta, DeKalb County, Georgia, and the United States for comparison purposes.
Our RealtyTrac search revealed April 2019 foreclosure rates of 0.01 percent in the subject property’s ZIP Code (30341), 0.02 percent in Atlanta, 0.04 percent in DeKalb County, 0.04 percent in Georgia, and 0.04 percent in the nation (Table 39). The monthly number of foreclosures in the subject site’s ZIP Code ranged from zero to three per month over of the past twelve months.
While the conversion of such properties can affect the demand for new multi-family rental housing in some markets, the impact on senior-oriented communities is typically limited. In many instances, senior householders “downsize” living accommodations (move from a larger unit to a smaller unit) due to the higher upkeep and long-term cost. As such, the convenience of on-site amenities at age restricted communities is preferable to lower density unit types, such as single-family detached homes, most common to abandonment and/or foreclosure. Furthermore, current foreclosure activity in the subject site’s ZIP Code was minimal over the past year. We do not believe foreclosed, abandoned, or vacant single/multi-family homes will impact the subject property’s ability to lease its units.
Table 39 Foreclosure Data, ZIP Code 30341, April 2019
GeographyApril 2019
Foreclosure Rate
ZIP Code: 30341 0.01%Atlanta 0.02%DeKalb County 0.04%Georgia 0.04%National 0.04%Source: Realtytrac.com
ZIP Code: 30341
Month # of Foreclosures
May 2018 2June 2018 0July 2018 1
August 2018 1September 2018 0
October 2018 0November 2018 1December 2018 3
January 2019 1February 2019 3
March 2019 2April 2019 0
Source: Realtytrac.com
0.01% 0.02%0.04% 0.04% 0.04%
0.00%0.02%0.04%0.06%0.08%0.10%
2
0
1 1
0 0
1
3
1
3
2
00
1
2
3
4
5
Prop
ertie
s
Veranda at Assembly | Findings and Conclusions
Page 57
10. FINDINGS AND CONCLUSIONS
A. Key Findings Based on the preceding review of the subject project and demographic and competitive housing trends in the Veranda Market Area, RPRG offers the following key findings:
Site and Neighborhood Analysis: The subject site is part of a larger master-planned mixed-use development called The Assembly, which will include a variety of complimentary land uses including additional multi-family apartments, for-sale townhomes, retail space, office space, a hotel, and various recreational amenities on the site of the former General Motors Doraville plant. The Assembly will be a transit-oriented development with connections to the adjacent Doraville MARTA station and the future Interstate 285 express lanes. The subject site and The Assembly are in an established portion of northern DeKalb County located within the Doraville city limits and adjacent to the City of Chamblee. Both cities are dense inner suburbs of northeast Atlanta and have experienced significant revitalization and growth over the last ten years. Surrounding land uses consist of residential, commercial, and light industrial uses including shopping centers, single-family detached homes, and various warehouse, distribution, and manufacturing/production facilities including Third Rail Studios. All these land uses are compatible with affordable senior rental housing. At present, most area amenities, shopping opportunities, and public transportation options are easily accessible within two miles of the site. Numerous additional recreational amenities and shopping opportunities will be within one-quarter mile of the subject site when future development within The Assembly is complete. The continued development of The Assembly will significantly enhance the subject site’s overall appeal.
Economic Context: DeKalb County’s economy has steadily grown over the last seven years with the addition of more than 24,000 new jobs including an average of over 5,500 jobs per year over the last four years. The county’s unemployment rate has also fallen to an eleven-year low of 4.0 percent in 2018, just above state and national levels of 3.9 percent. Strong job growth continued in the county through the third quarter of 2018 and is likely to continue over the next three years as several additional economic expansions have been announced within the last two years. This strong job growth will continue to drive housing demand in the market area.
Growth Trends: The market area expanded steadily between the 2000 and 2010 Census counts, gaining 934 people (0.8 percent) and 468 households (1.0 percent) per year. Growth remained strong in the market area from 2010 to 2019 with population and household growth rates of 984 people (0.7 percent) and 374 households (0.7 percent) annually. Esri projects the market area will continue its strong growth with the addition of 1,211 people (0.9 percent) and 480 households (0.9 percent) per year over the next two years. This will bring the population in the market area to 139,846 and the household base to 55,105 in 2021.
Senior household growth in the market area is expected to outpace total household growth over the next two years (on a percentage basis) though this includes both net migration and aging in place. The Veranda Market Area added 387 households with householder age 55+ per year from 2010 to 2019. Strong senior household growth is expected to continue with the annual addition of 330 senior households (55+) from 2019 to 2021.
Demographic Analysis: The demographics of the Veranda Market Area are reflective of dense suburban market with a mixture of household types. The two largest population cohorts in the market area are Adults age 35 to 61 (34.1 percent) and Young Adults age 20 to 34 (26.4 percent). Twenty percent of the market area’s population is age 55 or older. The market area’s household base was relatively distributed as of the 2010 Census with multi-person
Veranda at Assembly | Findings and Conclusions
Page 58
households without children and single persons accounting for a slightly higher percentage (roughly 33 to 36 percent each) of households than households with children (31.3 percent). Among renter households, 57.2 percent are comprised of young and working age adults age 25 to 44 while 15.5 percent are age 55 or older. Sixty-one percent of market area renter households contained one or two persons as of the 2010 Census while 13.6 percent contained three persons and 25.4 percent contained four or more persons. Sixty-one percent of all households in the Veranda Market Area were renters in 2019, above the DeKalb County rental rate of 48.2 percent. Over the last nine years, renter households accounted for all net household growth. RPRG projects renter households will continue to account for a disproportionate percentage of net household growth (75 percent), which would increase the market area’s renter percentage slightly over the next two years to 61.2 percent. The Veranda Market Area had a 2019 median income of $60,851 and a 2019 senior median income (55+) of $61,937. By tenure, senior households (55+) had a median income of $48,794 among renters and median income of $68,842 among owners. The market area has a significant proportion of low and moderate-income senior renter households (55+) including 26.4 percent earning less than $25,000, 24.8 percent earning $25,000 to $49,999, and 30.7 percent earning $50,000 to $99,999. Approximately 18 percent of senior renter households (55+) have incomes of $100,000 or more.
Competitive Housing Analysis: RPRG surveyed five senior LIHTC communities and 19 general occupancy communities in the market area, all of which were performing well. The five senior communities reported an aggregate vacancy rate of 1.1 percent including PBRA units and a 2.3 percent vacancy rate excluding PBRA units. All five senior communities also reported lengthy waiting lists for LIHTC and PBRA units. Among the 19 general occupancy communities surveyed, the aggregate vacancy rate was 2.8 percent for more than 4,600 units and the lone LIHTC community was fully occupied with a waiting list.
Average effective rents among surveyed senior communities (including incentives and the cost of trash removal) were:
o One-bedroom units had an average effective rent of $762 for 692 square feet or $1.10 per square foot. One-bedroom LIHTC rents ranged from $325 for 30 percent units to $814 for 60 percent units. The average effective market rate rent among surveyed communities was $1,002 for 684 square feet or $1.46 per square foot.
o Two-bedroom units had an average effective rent of $888 for 912 square feet or $0.97 per square foot. Two-bedroom LIHTC rents ranged from $380 for 30 percent units to $930 for 60 percent units. The average effective market rate rent among surveyed communities was $1,190 for 911 square feet or $1.31 per square foot.
Average effective rents among surveyed general occupancy communities (including incentives and the cost of trash removal) were:
o One-bedroom units had an average effective rent of $1,141 with an average unit size of 810 square feet and an average rent per square foot of $1.41. Upper Tier communities reported an average effective one-bedroom rent of $1,423 compared to $936 at Lower Tier communities. The long one-bedroom LIHTC rent was $820 for 60 percent units.
o Two-bedroom units had an average effective rent of $1,393 with an average unit size of 1,164 square feet and an average rent per square foot of $1.20. Upper Tier communities reported an average effective two-bedroom rent of $1,810 compared to $1,115 at Lower Tier communities. The lone two-bedroom LIHTC rent was $980 for 60 percent units.
Veranda at Assembly | Findings and Conclusions
Page 59
The “average market rent” is $1,308 for one-bedroom units and $1,641 for two-bedroom units. The subject property’s proposed 30 percent, 60 percent, and 80 percent rents all have rent advantages ranging from 85.5 to 352.6 percent with an overall LIHTC average of 185.7 percent. While not necessarily expected to have a rent advantage, the proposed market rate rents have a rent advantage 42.7 percent. No LIHTC communities have received allocations in the Veranda Market Area over the last three years. Outside of LIHTC communities, three market rate rental communities are currently under construction including two general occupancy communities (Windsor Parkview Phase II and SLX Atlanta) and one senior community (Attiva Peachtree). Given Attiva Peachtree’s advertised rents will be more than $1,000 higher than those proposed at the subject property, it will not directly compete with the subject property’s market rate units. The two general occupancy communities under construction will offer a combined 503 rental units and will also not directly compete with the subject property due to differences in age and income targeting.
B. Product Evaluation Considered in the context of the competitive environment, the relative position of Veranda at Assembly is as follows:
Site: The subject site is suitable for a rental housing development targeting very low to moderate income senior renter households age 55 and older. All surrounding land uses are compatible with the proposed development and will be significantly enhanced by the continued development of The Assembly. As part of a larger transit-oriented development, Veranda at Assembly will be easily accessible and highly visible from several major thoroughfares (including two Interstates) and will have direct access to multiple public transportation options including MARTA bus and rail stations. The subject site is also within two miles of numerous neighborhood amenities/services and within five to seven miles of major employers in Sandy Springs, Midtown, and Downtown Atlanta. The subject site is suitable for the proposed development.
Unit Distribution: The proposed unit mix for Veranda at Assembly includes 80 one-bedroom units (80 percent) and 20 two-bedroom units (20 percent) with all one-bedroom units containing tax credits and all two-bedroom units being market rate. This unit distribution is comparable to Ashford Landing and Senior Residences at Mercy Park, which also have comparable distributions of one and two-bedroom units. The concentration of one-bedroom units among LIHTC units will also allow the subject property to effectively target a greater proportion of very low to moderate income households given the lower rents for one-bedroom units. The proposed unit distribution appears reasonable and appropriate for the intended target markets.
Unit Size: The proposed unit sizes at Veranda at Assembly are 700 square feet for one-bedroom units and 950 to 1,050 square feet for two-bedroom units. These proposed unit sizes are larger than overall averages among surveyed senior communities in the market area. As such, all the proposed unit sizes appear reasonable and appropriate.
Unit Features: Veranda at Assembly will offer a range, refrigerator, dishwasher, garbage disposal, and microwave in the kitchen as well as ceiling fans, central heating and air-conditioning, washers/dryer connections, grab bars, and emergency call systems in each unit. These unit features will be competitive with surveyed senior and general occupancy rental communities in the market area including existing LIHTC communities. The proposed unit features will be well received by the target market.
Community Amenities: Veranda at Assembly will have a community amenity package that will include a multi-purpose room, community garden, fitness center, game room, laundry room, and computer center. This amenity package will be competitive with existing senior
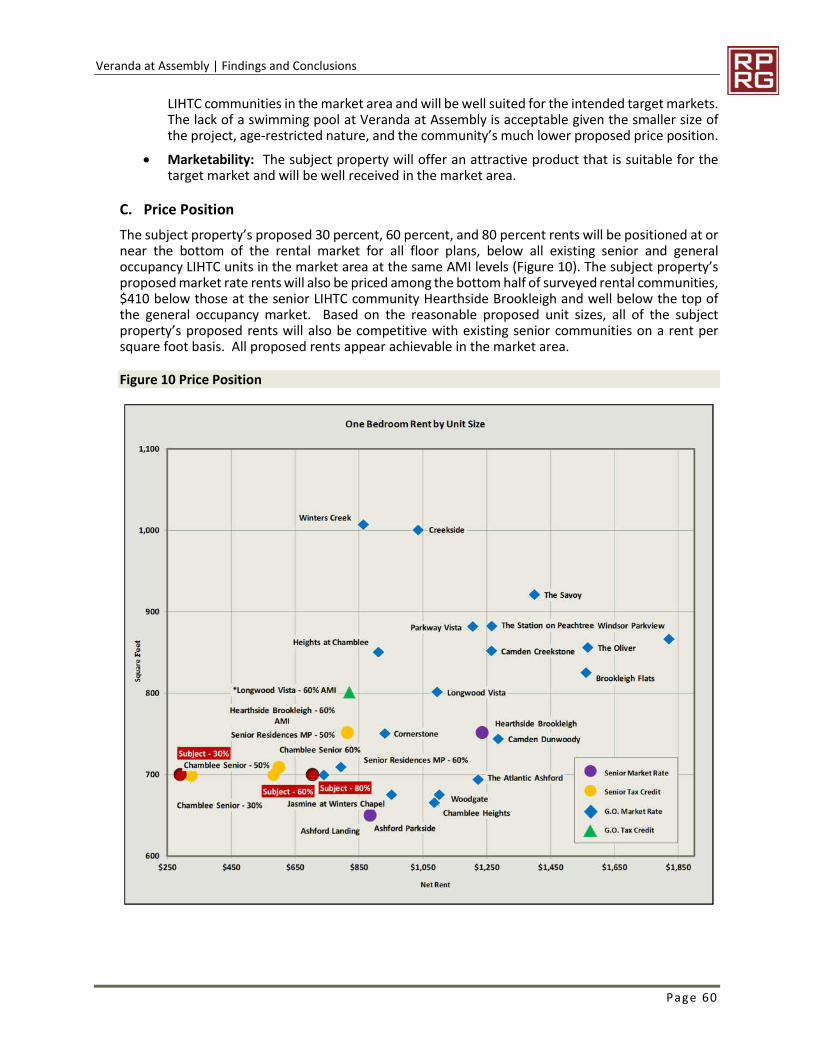
Veranda at Assembly | Findings and Conclusions
Page 60
LIHTC communities in the market area and will be well suited for the intended target markets. The lack of a swimming pool at Veranda at Assembly is acceptable given the smaller size of the project, age-restricted nature, and the community’s much lower proposed price position.
Marketability: The subject property will offer an attractive product that is suitable for the target market and will be well received in the market area.
C. Price Position The subject property’s proposed 30 percent, 60 percent, and 80 percent rents will be positioned at or near the bottom of the rental market for all floor plans, below all existing senior and general occupancy LIHTC units in the market area at the same AMI levels (Figure 10). The subject property’s proposed market rate rents will also be priced among the bottom half of surveyed rental communities, $410 below those at the senior LIHTC community Hearthside Brookleigh and well below the top of the general occupancy market. Based on the reasonable proposed unit sizes, all of the subject property’s proposed rents will also be competitive with existing senior communities on a rent per square foot basis. All proposed rents appear achievable in the market area.
Figure 10 Price Position
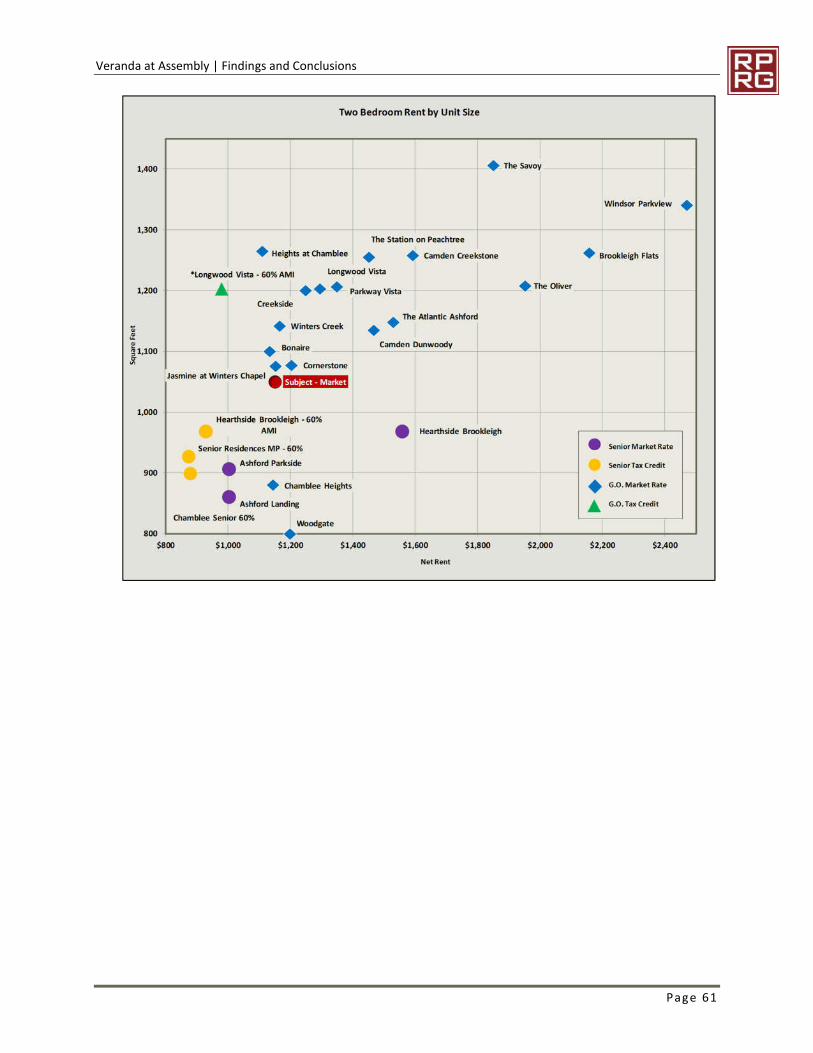
Veranda at Assembly | Findings and Conclusions
Page 61
Veranda at Assembly | Interviews
Page 62
11. ABSORPTION AND STABILIZATION RATES
A. Absorption Estimate One surveyed senior community in the market area (Senior Residences at Mercy Park) was built within the last five years and was able to provide an absorption history. Senior Residences at Mercy Park leased its 79 50 percent and 60 percent LIHTC units over roughly a seven-month period from February 2018 to September 2018, which equates to average of absorption rate of 11.2 units per month. In addition to recent absorption data, the absorption rate for Veranda at Assembly is based on projected senior renter household growth, income-qualified renter households in the market area, demand estimates, rental market conditions, and the marketability of the proposed site and product.
The Veranda Market Area is projected to add 330 senior households (55+) per year over the next two years, an annual growth rate of 1.9 percent.
Over 2,400 renter households (55+) will be income-qualified for one or more units proposed at Veranda at Assembly by 2021. This results in a low project capture rate of 4.0 percent.
All DCA demand capture rates are below DCA thresholds including a low overall capture rate of 6.1 percent.
The five surveyed senior communities in the market area reported just six of 529 units vacant, a rate of 1.1 percent. All reported vacancies were among market rate units as all LIHTC units and PBRA units had extensive waiting lists. The overall rental market was also performing well as the 19 surveyed general occupancy communities reported an aggregate vacancy rate of just 2.8 percent among more than 4,600 units.
Veranda at Assembly will offer a competitive product comparable or superior to existing senior and general occupancy LIHTC communities in the Veranda Market Area.
Based on the product to be constructed, the inclusion of PBRA on 30 units, and the factors discussed above, we conservatively estimate Veranda at Assembly will lease-up at a rate of at least 15 units per month. This overall absorption estimate is a weighted average based on an estimated absorption rate of 11 units per month for LIHTC and market rate units and 25 units per month for PBRA units. At this rate, the subject property will reach a stabilized occupancy of at least 93 percent in six to seven months. If the subject property did not have PBRA on 30 of its 100 units, it would still reach a stabilized occupancy of at least 93 percent within eight to nine months.
B. Impact on Existing and Pipeline Rental Market Based on strong senior household growth, low vacancy rates, reasonable affordability and demand capture rates, and the attractive product to be constructed, we do not expect Veranda at Assembly to have negative impact on existing or planned LIHTC communities in the Veranda Market Area.
12. INTERVIEWS Primary information gathered through field and phone interviews was used throughout the various sections of this report. The interviewees included rental community property managers and planning/development officials with the City of Doraville, City of Chamblee, City of Norcross, City of Dunwoody, DeKalb County, and Gwinnett County.
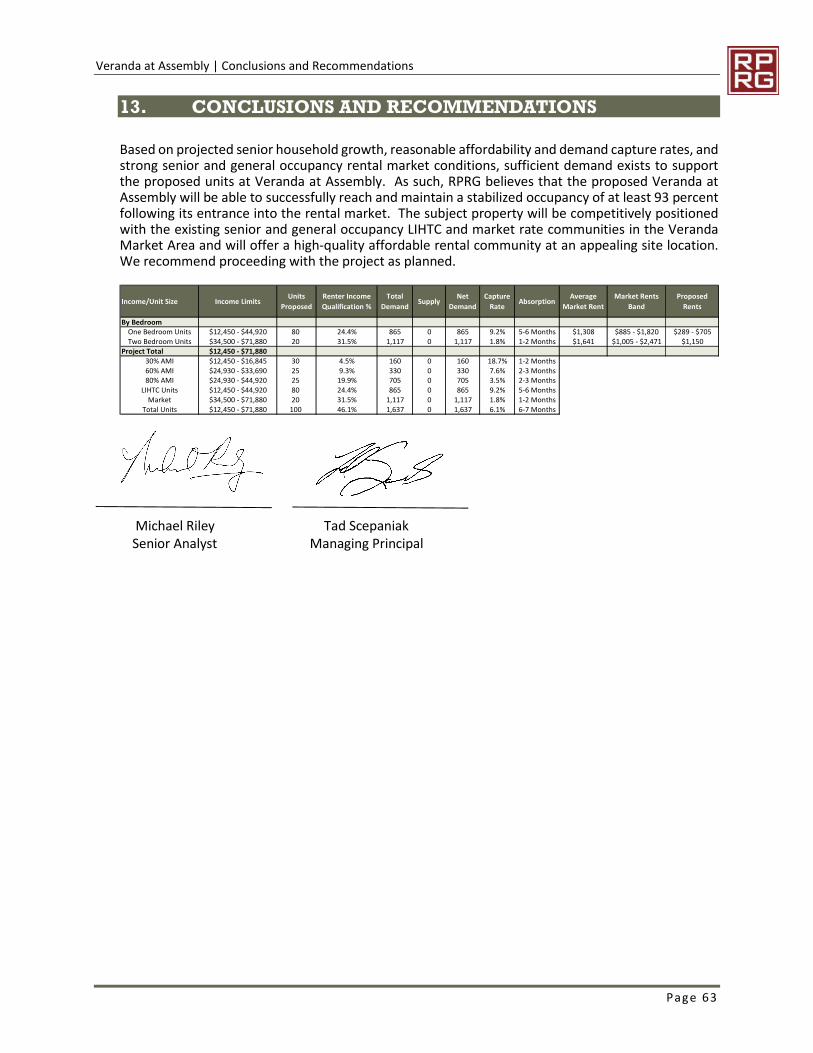
Veranda at Assembly | Conclusions and Recommendations
Page 63
13. CONCLUSIONS AND RECOMMENDATIONS
Based on projected senior household growth, reasonable affordability and demand capture rates, and strong senior and general occupancy rental market conditions, sufficient demand exists to support the proposed units at Veranda at Assembly. As such, RPRG believes that the proposed Veranda at Assembly will be able to successfully reach and maintain a stabilized occupancy of at least 93 percent following its entrance into the rental market. The subject property will be competitively positioned with the existing senior and general occupancy LIHTC and market rate communities in the Veranda Market Area and will offer a high-quality affordable rental community at an appealing site location. We recommend proceeding with the project as planned.
Michael Riley Tad Scepaniak Senior Analyst Managing Principal
Income/Unit Size Income Limits Units Proposed
Renter Income Qualification %
Total Demand Supply Net
DemandCapture
Rate Absorption Average Market Rent
Market Rents Band
Proposed Rents
By BedroomOne Bedroom Units $12,450 - $44,920 80 24.4% 865 0 865 9.2% 5-6 Months $1,308 $885 - $1,820 $289 - $705Two Bedroom Units $34,500 - $71,880 20 31.5% 1,117 0 1,117 1.8% 1-2 Months $1,641 $1,005 - $2,471 $1,150
Project Total $12,450 - $71,88030% AMI $12,450 - $16,845 30 4.5% 160 0 160 18.7% 1-2 Months60% AMI $24,930 - $33,690 25 9.3% 330 0 330 7.6% 2-3 Months80% AMI $24,930 - $44,920 25 19.9% 705 0 705 3.5% 2-3 Months
LIHTC Units $12,450 - $44,920 80 24.4% 865 0 865 9.2% 5-6 MonthsMarket $34,500 - $71,880 20 31.5% 1,117 0 1,117 1.8% 1-2 Months
Total Units $12,450 - $71,880 100 46.1% 1,637 0 1,637 6.1% 6-7 Months

Veranda at Assembly | Appendix 1 Underlying Assumptions and Limiting Conditions
Page 64
APPENDIX 1 UNDERLYING ASSUMPTIONS AND LIMITING CONDITIONS In conducting the analysis, we will make the following assumptions, except as otherwise noted in our report: 1. There are no zoning, building, safety, environmental or other federal, state or local laws, regulations or codes which would prohibit or impair the development, marketing or operation of the subject project in the manner contemplated in our report, and the subject project will be developed, marketed and operated in compliance with all applicable laws, regulations and codes. 2. No material changes will occur in (a) any federal, state or local law, regulation or code (including, without limitation, the Internal Revenue Code) affecting the subject project, or (b) any federal, state or local grant, financing or other program which is to be utilized in connection with the subject project. 3. The local, national and international economies will not deteriorate, and there will be no significant changes in interest rates or in rates of inflation or deflation. 4. The subject project will be served by adequate transportation, utilities and governmental facilities. 5. The subject project will not be subjected to any war, energy crisis, embargo, strike, earthquake, flood, fire or other casualty or act of God. 6. The subject project will be on the market at the time and with the product anticipated in our report, and at the price position specified in our report. 7. The subject project will be developed, marketed and operated in a highly professional manner. 8. No projects will be developed which will be in competition with the subject project, except as set forth in our report. 9. There are neither existing judgments nor any pending or threatened litigation, which could hinder the development, marketing or operation of the subject project.
Veranda at Assembly | Appendix 1 Underlying Assumptions and Limiting Conditions
Page 65
The analysis will be subject to the following limiting conditions, except as otherwise noted in our report: 1. The analysis contained in this report necessarily incorporates numerous estimates and assumptions with respect to property performance, general and local business and economic conditions, the absence of material changes in the competitive environment and other matters. Some estimates or assumptions, however, inevitably will not materialize, and unanticipated events and circumstances may occur; therefore, actual results achieved during the period covered by our analysis will vary from our estimates and the variations may be material. 2. Our absorption estimates are based on the assumption that the product recommendations set forth in our report will be followed without material deviation. 3. All estimates of future dollar amounts are based on the current value of the dollar, without any allowance for inflation or deflation. 4. We have no responsibility for considerations requiring expertise in other fields. Such considerations include, but are not limited to, legal matters, environmental matters, architectural matters, geologic considerations, such as soils and seismic stability, and civil, mechanical, electrical, structural and other engineering matters. 5. Information, estimates and opinions contained in or referred to in our report, which we have obtained from sources outside of this office, are assumed to be reliable and have not been independently verified. 6. The conclusions and recommendations in our report are subject to these Underlying Assumptions and Limiting Conditions and to any additional assumptions or conditions set forth in the body of our report.
Veranda at Assembly | Appendix 2 Analyst Certifications
Page 66
APPENDIX 2 ANALYST CERTIFICATIONS
I affirm that I have made a physical inspection of the market area and the subject property and that information has been used in the full study of the need and demand for the proposed units. The report was written according to DCA’s market study requirements, the information included is accurate and the report can be relied upon by DCA as a true assessment of the low-income housing rental market.
To the best of my knowledge, the market can support the project as shown in the study. I understand that any misrepresentation of this statement may result in the denial of further participation in DCA’s rental housing programs. I also affirm that I have no interest in the project or relationship with the ownership entity and my compensation is not contingent on this project being funded.
__________________
Michael Riley Senior Analyst Real Property Research Group, Inc. Warning: Title 18 U.S.C. 1001, provides in part that whoever knowingly and willfully makes or uses a document containing any false, fictitious, or fraudulent statement or entry, in any manner in the jurisdiction of any department or agency of the United States, shall be fined not more than $10,000 or imprisoned for not more than five years or both.
Veranda at Assembly | Appendix 3 NCHMA Certification
Page 67
APPENDIX 3 NCHMA CERTIFICATION
This market study has been prepared by Real Property Research Group, Inc., a member in good standing of the National Council of Housing Market Analysts (NCHMA). This study has been prepared in conformance with the standards adopted by NCHMA for the market analysts’ industry. These standards include the Standard Definitions of Key Terms Used in Market Studies for Affordable Housing Projects and Model Content Standards for the Content of Market Studies for Affordable Housing Projects. These Standards are designed to enhance the quality of market studies and to make them easier to prepare, understand, and use by market analysts and by the end users. These Standards are voluntary only, and no legal responsibility regarding their use is assumed by the National Council of Housing Market Analysts.
Real Property Research Group, Inc. is duly qualified and experienced in providing market analysis for Affordable Housing. The company’s principals participate in NCHMA educational and information sharing programs to maintain the highest professional standards and state-of-the-art knowledge. Real Property Research Group, Inc. is an independent market analyst. No principal or employee of Real Property Research Group, Inc. has any financial interest whatsoever in the development for which this analysis has been undertaken.
While the document specifies Real Property Research Group, Inc., the certification is always signed by the individual completing the study and attesting to the certification.
Real Property Research Group, Inc.
____ Tad Scepaniak___ _ Name
_ Managing Principal___ _
Title
_________May 13, 2019 _______ Date
Veranda at Assembly | Appendix 4 Analyst Resumes
Page 68
APPENDIX 4 ANALYST RESUMES
TAD SCEPANIAK Managing Principal
Tad Scepaniak assumed the role of Real Property Research Group’s Managing Principal in November 2017 following more than 15 years with the firm. Tad has extensive experience conducting market feasibility studies on a wide range of residential and mixed-use developments for developers, lenders, and government entities. Tad directs the firm’s research and production of feasibility studies including large-scale housing assessments to detailed reports for a specific project on a specific site. He has extensive experience analyzing affordable rental communities developed under the Low Income Housing Tax Credit (LIHTC) program and market-rate apartments developed under the HUD 221(d)(4) program and conventional financing. Tad is the key contact for research contracts many state housing finance agencies, including several that commission market studies for LIHTC applications. Tad is National Chair of the National Council of Housing Market Analysts (NCHMA) and previously served as Vice Chair and Co-Chair of Standards Committee. He has taken a lead role in the development of the organization's Standard Definitions and Recommended Market Study Content, and he has authored and co-authored white papers on market areas, derivation of market rents, and selection of comparable properties. Tad is also a founding member of the Atlanta chapter of the Lambda Alpha Land Economics Society. Areas of Concentration:
Low Income Tax Credit Rental Housing: Mr. Scepaniak has worked extensively with the Low Income Tax Credit program throughout the United States, with special emphasis on the Southeast and Mid-Atlantic regions.
Senior Housing: Mr. Scepaniak has conducted feasibility analysis for a variety of senior oriented rental housing. The majority of this work has been under the Low Income Tax Credit program; however his experience includes assisted living facilities and market rate senior rental communities.
Market Rate Rental Housing: Mr. Scepaniak has conducted various projects for developers of market rate rental housing. The studies produced for these developers are generally used to determine the rental housing needs of a specific submarket and to obtain financing.
Public Housing Authority Consultation: Tad has worked with Housing Authorities throughout the United States to document trends rental and for sale housing market trends to better understand redevelopment opportunities. He has completed studies examining development opportunities for housing authorities through the Choice Neighborhood Initiative or other programs in Florida, Georgia, North Carolina, South Carolina, Texas, and Tennessee.
Education: Bachelor of Science – Marketing; Berry College – Rome, Georgia
Veranda at Assembly | Appendix 4 Analyst Resumes
Page 69
ROBERT M. LEFENFELD Founding Principal
Mr. Lefenfeld, Founding Principal of the firm, with over 30 years of experience in the field of residential market research. Before founding Real Property Research Group in 2001, Bob served as an officer of research subsidiaries of Reznick Fedder & Silverman and Legg Mason. Between 1998 and 2001, Bob was Managing Director of RF&S Realty Advisors, conducting residential market studies throughout the United States. From 1987 to 1995, Bob served as Senior Vice President of Legg Mason Realty Group, managing the firm’s consulting practice and serving as publisher of a Mid-Atlantic residential data service, Housing Market Profiles. Prior to joining Legg Mason, Bob spent ten years with the Baltimore Metropolitan Council as a housing economist. Bob also served as Research Director for Regency Homes between 1995 and 1998, analyzing markets throughout the Eastern United States and evaluating the company’s active building operation.
Bob provides input and guidance for the completion of the firm’s research and analysis products. He combines extensive experience in the real estate industry with capabilities in database development and information management. Over the years, he has developed a series of information products and proprietary databases serving real estate professionals. Bob has lectured and written extensively about residential real estate market analysis. Bob has created and teaches the market study module for the MBA HUD Underwriting course and has served as an adjunct professor for the Graduate Programs in Real Estate Development, School of Architecture, Planning and Preservation, University of Maryland College Park. He is the past National Chair of the National Council of Housing Market Analysts (NCHMA) and currently chairs its FHA Committee.
Areas of Concentration:
Strategic Assessments: Mr. Lefenfeld has conducted numerous corridor analyses throughout the United States to assist building and real estate companies in evaluating development opportunities. Such analyses document demographic, economic, competitive, and proposed development activity by submarket and discuss opportunities for development.
Feasibility Analysis: Mr. Lefenfeld has conducted feasibility studies for various types of residential developments for builders and developers. Subjects for these analyses have included for-sale single-family and townhouse developments, age-restricted rental and for-sale developments, large multi-product PUDs, urban renovations and continuing care facilities for the elderly.
Information Products: Bob has developed a series of proprietary databases to assist clients in monitoring growth trends. Subjects of these databases have included for sale housing, pipeline information, and rental communities.
Education:
Master of Urban and Regional Planning; The George Washington University. Bachelor of Arts - Political Science; Northeastern University.
Veranda at Assembly | Appendix 4 Analyst Resumes
Page 70
MICHAEL RILEY Senior Analyst
Michael Riley entered the field of Real Estate Market Research in 2006, joining Real Property Research Group’s (RPRG) Atlanta office as a Research Associate upon college graduation. During Michael’s time as a Research Associate, he gathered economic, demographic, and competitive data for market feasibility analyses and other consulting projects completed by the firm. Since 2007, Michael has served as an Analyst for RPRG, conducting a variety of market analyses for affordable and market rate rental housing communities throughout the United States. In total, Michael has conducted work in eleven states and the District of Columbia with concentrations in the Southeast and Midwest regions. Areas of Concentration:
Low Income Housing Tax Credit Rental Housing – Michael has worked extensively with the Low-Income Housing Tax Credit program, evaluating general occupancy, senior oriented, and special needs developments for State allocating agencies, lenders, and developers. His work with the LIHTC program has spanned a wide range of project types, including newly constructed communities, adaptive reuses, and rehabilitations. Michael also has extensive experience analyzing multiple subsidy projects, such as those that contain rental assistance through the HUD Section 8/202 and USDA Section 515 programs.
Market Rate Rental Housing – Michael has analyzed various projects for lenders and
developers of market rate rental housing including those compliant with HUD MAP guidelines under the FHA 221(d)(4) program. The market rate studies produced are often used to determine the rental housing needs of a specific submarket and to obtain financing.
In addition to market analysis responsibilities, Michael has also assisted in the development of research tools for the organization, including a rent comparability table incorporated in many RPRG analyses.
Education: Bachelor of Business Administration – Finance; University of Georgia, Athens, GA
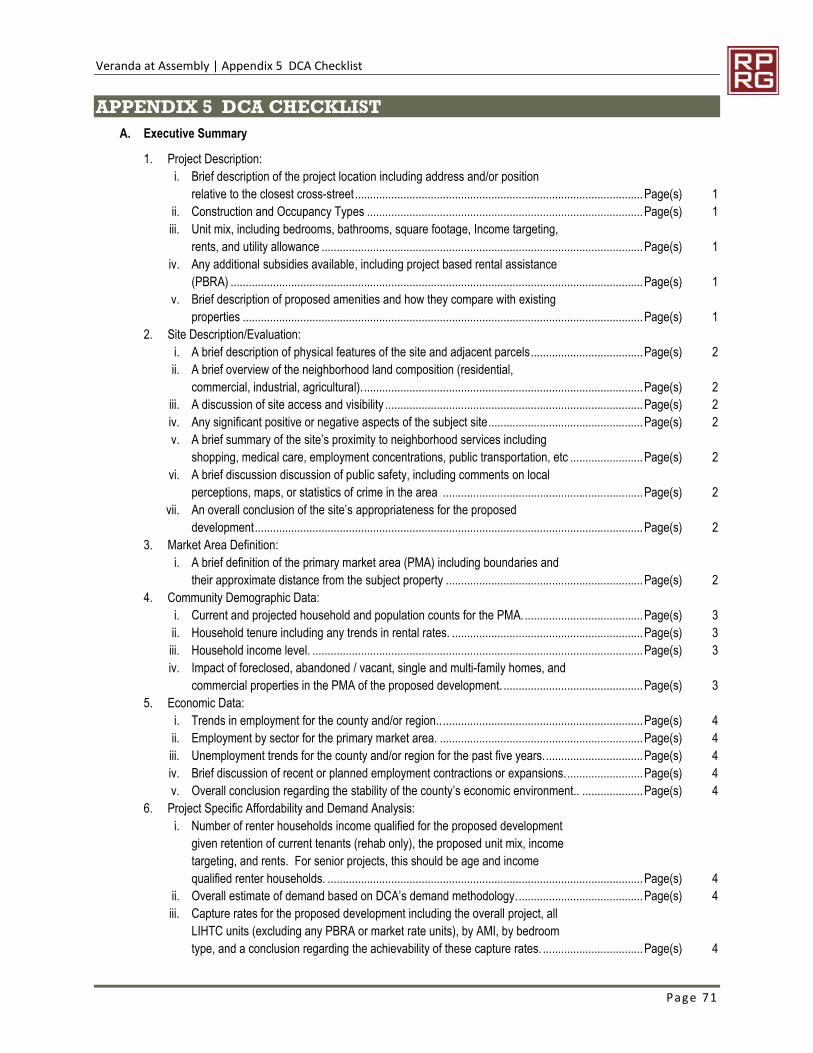
Veranda at Assembly | Appendix 5 DCA Checklist
Page 71
APPENDIX 5 DCA CHECKLIST A. Executive Summary
1. Project Description: i. Brief description of the project location including address and/or position
relative to the closest cross-street ............................................................................................... Page(s) 1 ii. Construction and Occupancy Types ........................................................................................... Page(s) 1 iii. Unit mix, including bedrooms, bathrooms, square footage, Income targeting,
rents, and utility allowance .......................................................................................................... Page(s) 1 iv. Any additional subsidies available, including project based rental assistance
(PBRA) ........................................................................................................................................ Page(s) 1 v. Brief description of proposed amenities and how they compare with existing
properties .................................................................................................................................... Page(s) 1 2. Site Description/Evaluation:
i. A brief description of physical features of the site and adjacent parcels ..................................... Page(s) 2 ii. A brief overview of the neighborhood land composition (residential,
commercial, industrial, agricultural). ............................................................................................ Page(s) 2 iii. A discussion of site access and visibility ..................................................................................... Page(s) 2 iv. Any significant positive or negative aspects of the subject site ................................................... Page(s) 2 v. A brief summary of the site’s proximity to neighborhood services including
shopping, medical care, employment concentrations, public transportation, etc ........................ Page(s) 2 vi. A brief discussion discussion of public safety, including comments on local
perceptions, maps, or statistics of crime in the area .................................................................. Page(s) 2 vii. An overall conclusion of the site’s appropriateness for the proposed
development ................................................................................................................................ Page(s) 2 3. Market Area Definition:
i. A brief definition of the primary market area (PMA) including boundaries and their approximate distance from the subject property ................................................................. Page(s) 2
4. Community Demographic Data: i. Current and projected household and population counts for the PMA. ....................................... Page(s) 3 ii. Household tenure including any trends in rental rates. ............................................................... Page(s) 3 iii. Household income level. ............................................................................................................. Page(s) 3 iv. Impact of foreclosed, abandoned / vacant, single and multi-family homes, and
commercial properties in the PMA of the proposed development. .............................................. Page(s) 3 5. Economic Data:
i. Trends in employment for the county and/or region.. .................................................................. Page(s) 4 ii. Employment by sector for the primary market area. ................................................................... Page(s) 4 iii. Unemployment trends for the county and/or region for the past five years. ................................ Page(s) 4 iv. Brief discussion of recent or planned employment contractions or expansions. ......................... Page(s) 4 v. Overall conclusion regarding the stability of the county’s economic environment.. .................... Page(s) 4
6. Project Specific Affordability and Demand Analysis: i. Number of renter households income qualified for the proposed development
given retention of current tenants (rehab only), the proposed unit mix, income targeting, and rents. For senior projects, this should be age and income qualified renter households. ........................................................................................................ Page(s) 4
ii. Overall estimate of demand based on DCA’s demand methodology. ......................................... Page(s) 4 iii. Capture rates for the proposed development including the overall project, all
LIHTC units (excluding any PBRA or market rate units), by AMI, by bedroom type, and a conclusion regarding the achievability of these capture rates. ................................. Page(s) 4
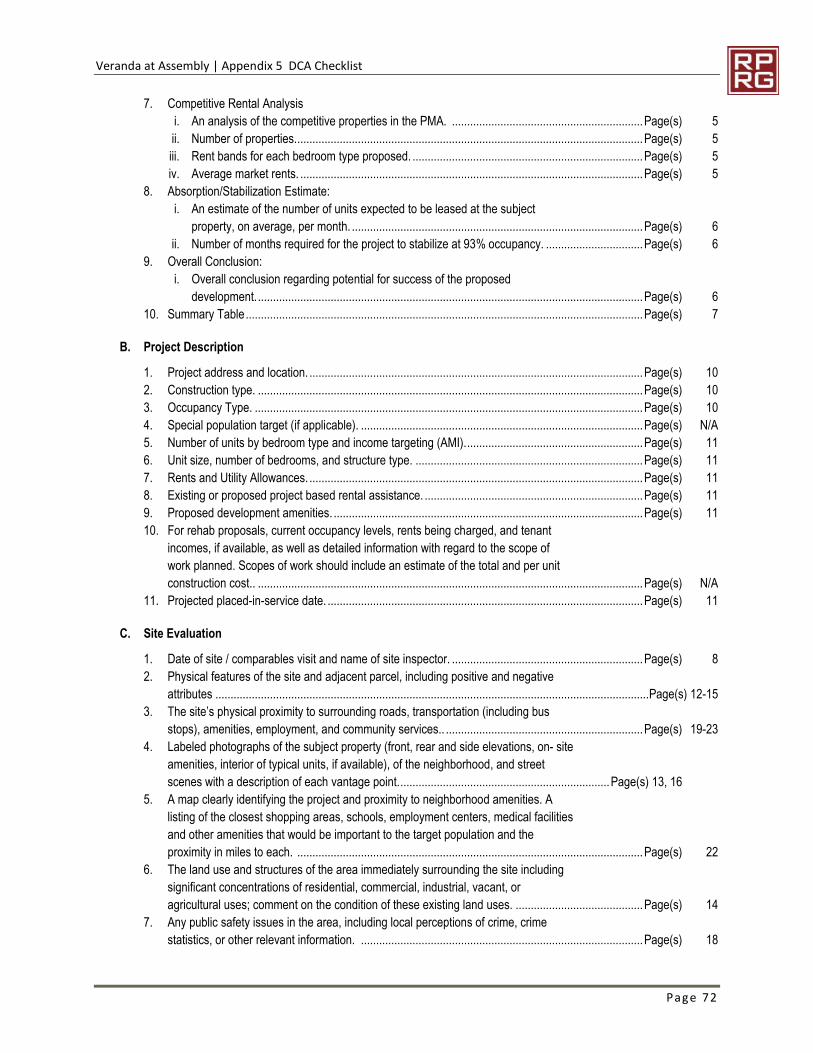
Veranda at Assembly | Appendix 5 DCA Checklist
Page 72
7. Competitive Rental Analysis i. An analysis of the competitive properties in the PMA. ............................................................... Page(s) 5 ii. Number of properties. .................................................................................................................. Page(s) 5 iii. Rent bands for each bedroom type proposed. ............................................................................ Page(s) 5 iv. Average market rents. ................................................................................................................. Page(s) 5
8. Absorption/Stabilization Estimate: i. An estimate of the number of units expected to be leased at the subject
property, on average, per month. ................................................................................................ Page(s) 6 ii. Number of months required for the project to stabilize at 93% occupancy. ................................ Page(s) 6
9. Overall Conclusion: i. Overall conclusion regarding potential for success of the proposed
development. ............................................................................................................................... Page(s) 6 10. Summary Table ................................................................................................................................... Page(s) 7
B. Project Description
1. Project address and location. .............................................................................................................. Page(s) 10 2. Construction type. ............................................................................................................................... Page(s) 10 3. Occupancy Type. ................................................................................................................................ Page(s) 10 4. Special population target (if applicable). ............................................................................................. Page(s) N/A 5. Number of units by bedroom type and income targeting (AMI). .......................................................... Page(s) 11 6. Unit size, number of bedrooms, and structure type. ........................................................................... Page(s) 11 7. Rents and Utility Allowances. .............................................................................................................. Page(s) 11 8. Existing or proposed project based rental assistance. ........................................................................ Page(s) 11 9. Proposed development amenities. ...................................................................................................... Page(s) 11 10. For rehab proposals, current occupancy levels, rents being charged, and tenant
incomes, if available, as well as detailed information with regard to the scope of work planned. Scopes of work should include an estimate of the total and per unit construction cost.. ............................................................................................................................... Page(s) N/A
11. Projected placed-in-service date. ........................................................................................................ Page(s) 11
C. Site Evaluation
1. Date of site / comparables visit and name of site inspector. ............................................................... Page(s) 8 2. Physical features of the site and adjacent parcel, including positive and negative
attributes ............................................................................................................................................... Page(s) 12-15 3. The site’s physical proximity to surrounding roads, transportation (including bus
stops), amenities, employment, and community services.. ................................................................. Page(s) 19-23 4. Labeled photographs of the subject property (front, rear and side elevations, on- site
amenities, interior of typical units, if available), of the neighborhood, and street scenes with a description of each vantage point. ..................................................................... Page(s) 13, 16
5. A map clearly identifying the project and proximity to neighborhood amenities. A listing of the closest shopping areas, schools, employment centers, medical facilities and other amenities that would be important to the target population and the proximity in miles to each. .................................................................................................................. Page(s) 22
6. The land use and structures of the area immediately surrounding the site including significant concentrations of residential, commercial, industrial, vacant, or agricultural uses; comment on the condition of these existing land uses. .......................................... Page(s) 14
7. Any public safety issues in the area, including local perceptions of crime, crime statistics, or other relevant information. ............................................................................................. Page(s) 18
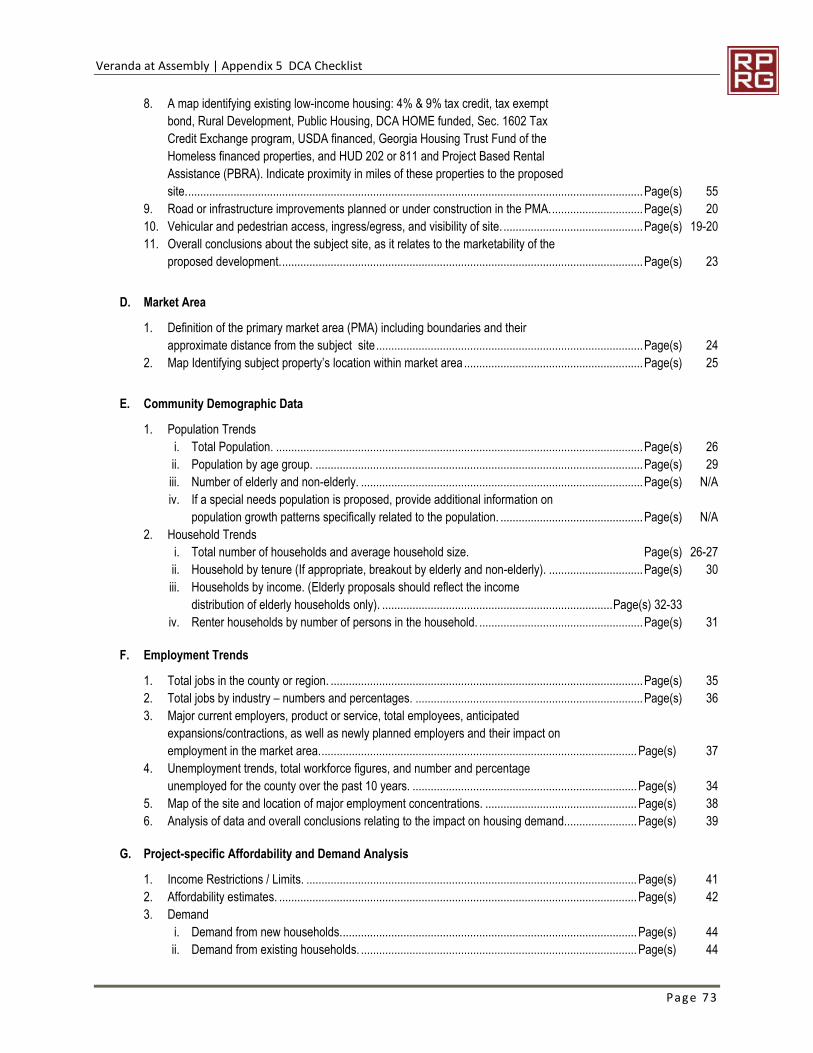
Veranda at Assembly | Appendix 5 DCA Checklist
Page 73
8. A map identifying existing low-income housing: 4% & 9% tax credit, tax exempt bond, Rural Development, Public Housing, DCA HOME funded, Sec. 1602 Tax Credit Exchange program, USDA financed, Georgia Housing Trust Fund of the Homeless financed properties, and HUD 202 or 811 and Project Based Rental Assistance (PBRA). Indicate proximity in miles of these properties to the proposed site. ...................................................................................................................................................... Page(s) 55
9. Road or infrastructure improvements planned or under construction in the PMA. .............................. Page(s) 20 10. Vehicular and pedestrian access, ingress/egress, and visibility of site. .............................................. Page(s) 19-20 11. Overall conclusions about the subject site, as it relates to the marketability of the
proposed development. ....................................................................................................................... Page(s) 23
D. Market Area
1. Definition of the primary market area (PMA) including boundaries and their approximate distance from the subject site ........................................................................................ Page(s) 24
2. Map Identifying subject property’s location within market area ........................................................... Page(s) 25
E. Community Demographic Data
1. Population Trends i. Total Population. ......................................................................................................................... Page(s) 26 ii. Population by age group. ............................................................................................................ Page(s) 29 iii. Number of elderly and non-elderly. ............................................................................................. Page(s) N/A iv. If a special needs population is proposed, provide additional information on
population growth patterns specifically related to the population. ............................................... Page(s) N/A 2. Household Trends
i. Total number of households and average household size. Page(s) 26-27 ii. Household by tenure (If appropriate, breakout by elderly and non-elderly). ............................... Page(s) 30 iii. Households by income. (Elderly proposals should reflect the income
distribution of elderly households only). ............................................................................ Page(s) 32-33 iv. Renter households by number of persons in the household. ...................................................... Page(s) 31
F. Employment Trends
1. Total jobs in the county or region. ....................................................................................................... Page(s) 35 2. Total jobs by industry – numbers and percentages. ........................................................................... Page(s) 36 3. Major current employers, product or service, total employees, anticipated
expansions/contractions, as well as newly planned employers and their impact on employment in the market area. ........................................................................................................ Page(s) 37
4. Unemployment trends, total workforce figures, and number and percentage unemployed for the county over the past 10 years. .......................................................................... Page(s) 34
5. Map of the site and location of major employment concentrations. .................................................. Page(s) 38 6. Analysis of data and overall conclusions relating to the impact on housing demand........................ Page(s) 39
G. Project-specific Affordability and Demand Analysis
1. Income Restrictions / Limits. ............................................................................................................. Page(s) 41 2. Affordability estimates. ...................................................................................................................... Page(s) 42 3. Demand
i. Demand from new households. ................................................................................................. Page(s) 44 ii. Demand from existing households. ........................................................................................... Page(s) 44
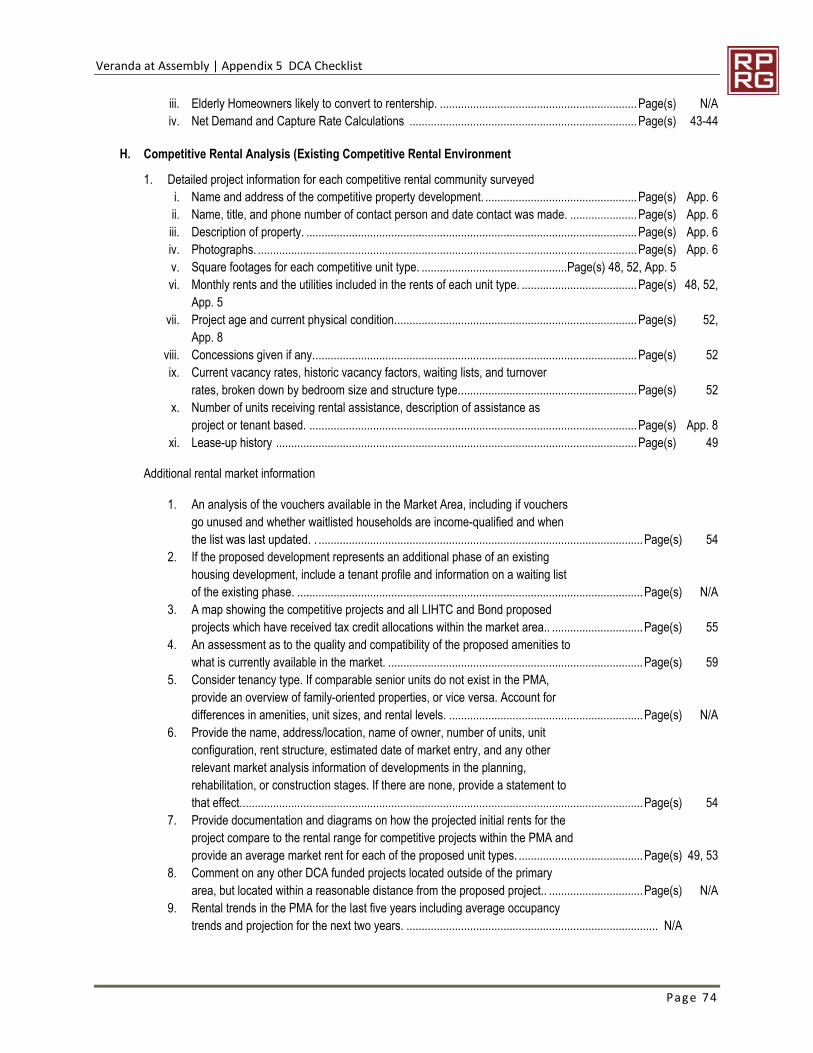
Veranda at Assembly | Appendix 5 DCA Checklist
Page 74
iii. Elderly Homeowners likely to convert to rentership. ................................................................. Page(s) N/A iv. Net Demand and Capture Rate Calculations ........................................................................... Page(s) 43-44
H. Competitive Rental Analysis (Existing Competitive Rental Environment
1. Detailed project information for each competitive rental community surveyed i. Name and address of the competitive property development. .................................................. Page(s) App. 6 ii. Name, title, and phone number of contact person and date contact was made. ...................... Page(s) App. 6 iii. Description of property. ............................................................................................................. Page(s) App. 6 iv. Photographs. ............................................................................................................................. Page(s) App. 6 v. Square footages for each competitive unit type. ................................................ Page(s) 48, 52, App. 5 vi. Monthly rents and the utilities included in the rents of each unit type. ...................................... Page(s) 48, 52,
App. 5 vii. Project age and current physical condition. ............................................................................... Page(s) 52,
App. 8 viii. Concessions given if any. .......................................................................................................... Page(s) 52 ix. Current vacancy rates, historic vacancy factors, waiting lists, and turnover
rates, broken down by bedroom size and structure type. .......................................................... Page(s) 52 x. Number of units receiving rental assistance, description of assistance as
project or tenant based. ............................................................................................................ Page(s) App. 8 xi. Lease-up history ....................................................................................................................... Page(s) 49
Additional rental market information
1. An analysis of the vouchers available in the Market Area, including if vouchers go unused and whether waitlisted households are income-qualified and when the list was last updated. . ........................................................................................................... Page(s) 54
2. If the proposed development represents an additional phase of an existing housing development, include a tenant profile and information on a waiting list of the existing phase. .................................................................................................................. Page(s) N/A
3. A map showing the competitive projects and all LIHTC and Bond proposed projects which have received tax credit allocations within the market area.. .............................. Page(s) 55
4. An assessment as to the quality and compatibility of the proposed amenities to what is currently available in the market. .................................................................................... Page(s) 59
5. Consider tenancy type. If comparable senior units do not exist in the PMA, provide an overview of family-oriented properties, or vice versa. Account for differences in amenities, unit sizes, and rental levels. ................................................................ Page(s) N/A
6. Provide the name, address/location, name of owner, number of units, unit configuration, rent structure, estimated date of market entry, and any other relevant market analysis information of developments in the planning, rehabilitation, or construction stages. If there are none, provide a statement to that effect.. ................................................................................................................................... Page(s) 54
7. Provide documentation and diagrams on how the projected initial rents for the project compare to the rental range for competitive projects within the PMA and provide an average market rent for each of the proposed unit types. ......................................... Page(s) 49, 53
8. Comment on any other DCA funded projects located outside of the primary area, but located within a reasonable distance from the proposed project.. ............................... Page(s) N/A
9. Rental trends in the PMA for the last five years including average occupancy trends and projection for the next two years. ................................................................................... N/A
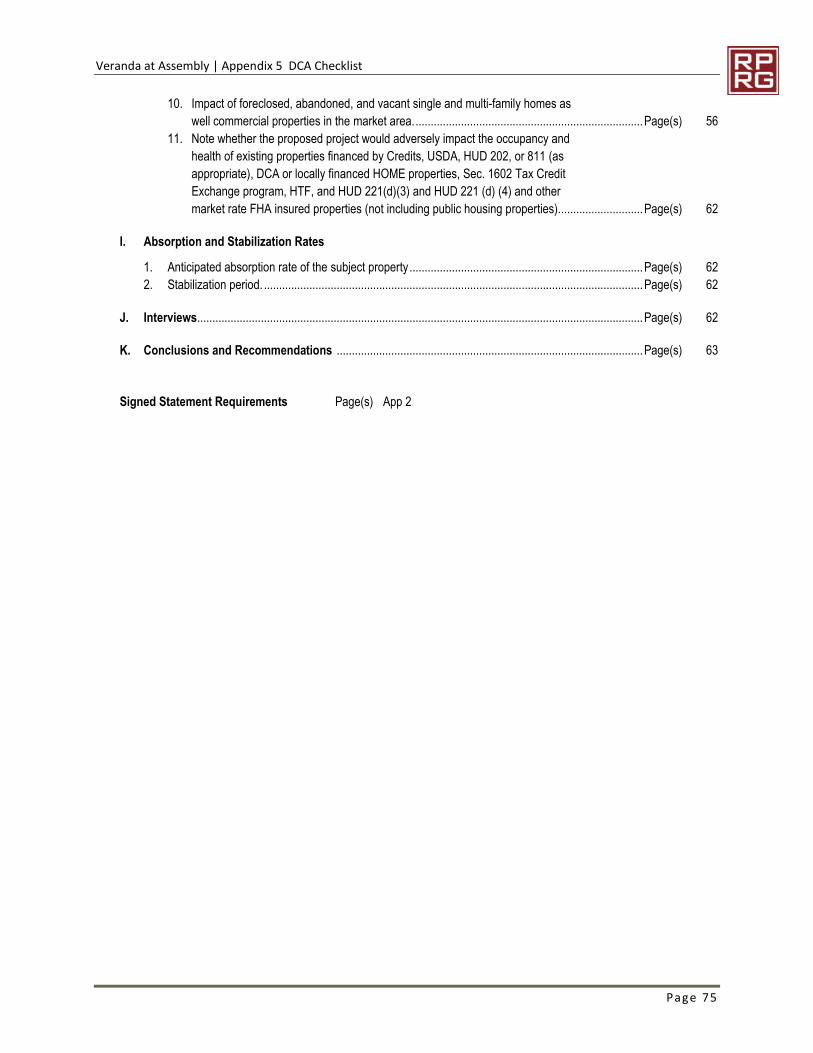
Veranda at Assembly | Appendix 5 DCA Checklist
Page 75
10. Impact of foreclosed, abandoned, and vacant single and multi-family homes as well commercial properties in the market area. ........................................................................... Page(s) 56
11. Note whether the proposed project would adversely impact the occupancy and health of existing properties financed by Credits, USDA, HUD 202, or 811 (as appropriate), DCA or locally financed HOME properties, Sec. 1602 Tax Credit Exchange program, HTF, and HUD 221(d)(3) and HUD 221 (d) (4) and other market rate FHA insured properties (not including public housing properties). ........................... Page(s) 62
I. Absorption and Stabilization Rates
1. Anticipated absorption rate of the subject property ............................................................................. Page(s) 62 2. Stabilization period. ............................................................................................................................. Page(s) 62
J. Interviews ................................................................................................................................................... Page(s) 62
K. Conclusions and Recommendations ..................................................................................................... Page(s) 63
Signed Statement Requirements Page(s) App 2
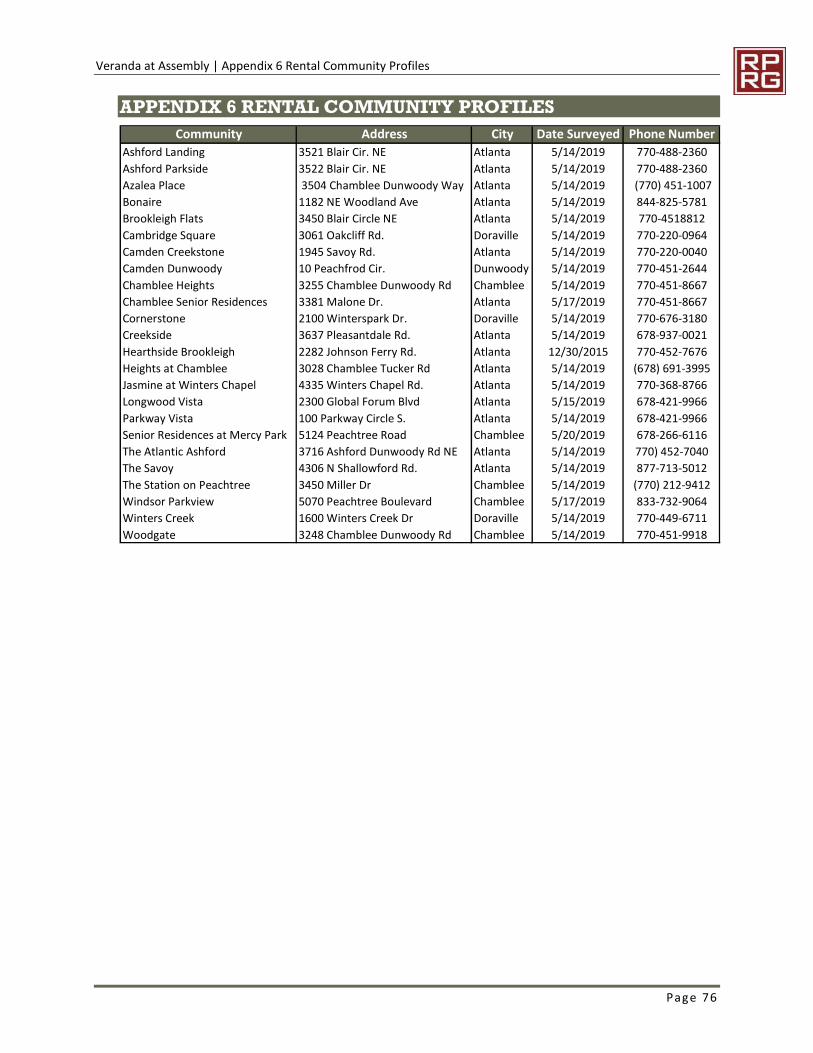
Veranda at Assembly | Appendix 6 Rental Community Profiles
Page 76
APPENDIX 6 RENTAL COMMUNITY PROFILES
Community Address City Date Surveyed Phone NumberAshford Landing 3521 Blair Cir. NE Atlanta 5/14/2019 770-488-2360Ashford Parkside 3522 Blair Cir. NE Atlanta 5/14/2019 770-488-2360Azalea Place 3504 Chamblee Dunwoody Way Atlanta 5/14/2019 (770) 451-1007Bonaire 1182 NE Woodland Ave Atlanta 5/14/2019 844-825-5781Brookleigh Flats 3450 Blair Circle NE Atlanta 5/14/2019 770-4518812Cambridge Square 3061 Oakcliff Rd. Doraville 5/14/2019 770-220-0964Camden Creekstone 1945 Savoy Rd. Atlanta 5/14/2019 770-220-0040Camden Dunwoody 10 Peachfrod Cir. Dunwoody 5/14/2019 770-451-2644Chamblee Heights 3255 Chamblee Dunwoody Rd Chamblee 5/14/2019 770-451-8667Chamblee Senior Residences 3381 Malone Dr. Atlanta 5/17/2019 770-451-8667Cornerstone 2100 Winterspark Dr. Doraville 5/14/2019 770-676-3180Creekside 3637 Pleasantdale Rd. Atlanta 5/14/2019 678-937-0021Hearthside Brookleigh 2282 Johnson Ferry Rd. Atlanta 12/30/2015 770-452-7676Heights at Chamblee 3028 Chamblee Tucker Rd Atlanta 5/14/2019 (678) 691-3995Jasmine at Winters Chapel 4335 Winters Chapel Rd. Atlanta 5/14/2019 770-368-8766Longwood Vista 2300 Global Forum Blvd Atlanta 5/15/2019 678-421-9966Parkway Vista 100 Parkway Circle S. Atlanta 5/14/2019 678-421-9966Senior Residences at Mercy Park 5124 Peachtree Road Chamblee 5/20/2019 678-266-6116The Atlantic Ashford 3716 Ashford Dunwoody Rd NE Atlanta 5/14/2019 770) 452-7040The Savoy 4306 N Shallowford Rd. Atlanta 5/14/2019 877-713-5012The Station on Peachtree 3450 Miller Dr Chamblee 5/14/2019 (770) 212-9412Windsor Parkview 5070 Peachtree Boulevard Chamblee 5/17/2019 833-732-9064Winters Creek 1600 Winters Creek Dr Doraville 5/14/2019 770-449-6711Woodgate 3248 Chamblee Dunwoody Rd Chamblee 5/14/2019 770-451-9918
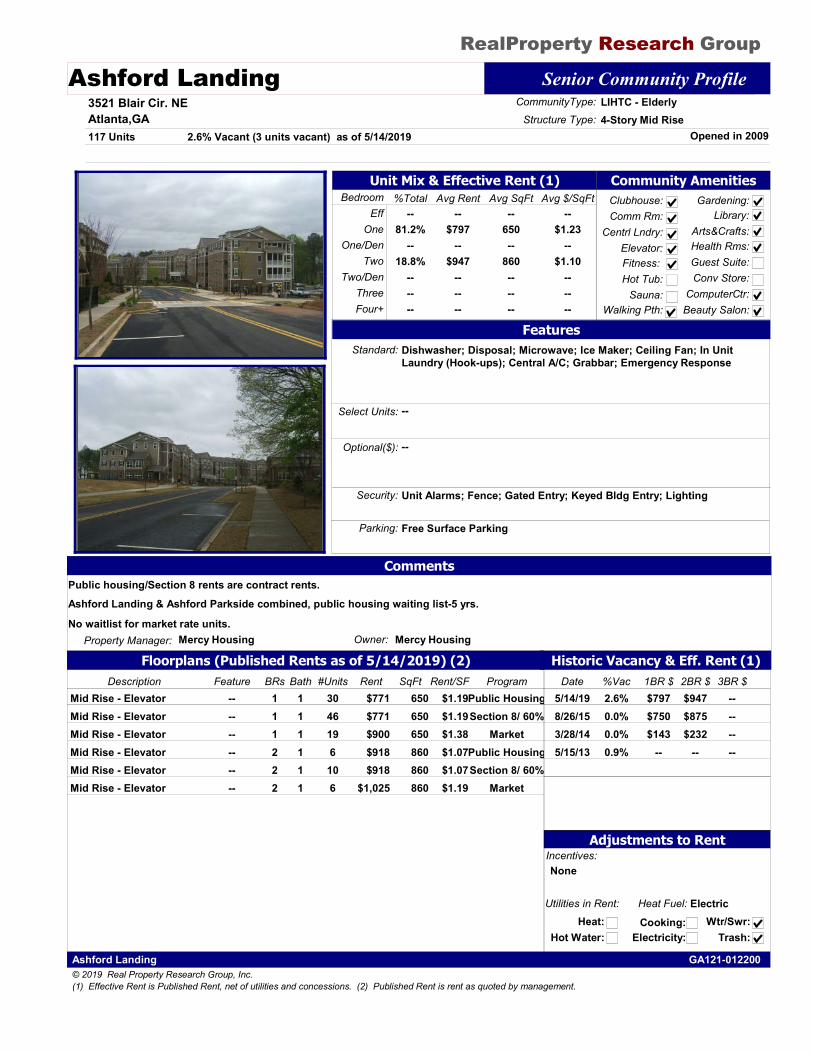
RealProperty Research Group
Ashford Landing Senior Community Profile3521 Blair Cir. NEAtlanta,GA
Property Manager: Mercy Housing
Opened in 2009
CommunityType: LIHTC - Elderly
117 UnitsStructure Type: 4-Story Mid Rise
Owner: Mercy Housing
Historic Vacancy & Eff. Rent (1)
Bedroom Avg $/SqFtAvg SqFt%Total Avg RentEff
One
Two
ThreeFour+
One/Den
Two/Den
--$797
--$947
------
--650--
860------
--$1.23
--$1.10
------
--81.2%
--18.8%
------
Utilities in Rent:
Heat:Heat Fuel: Electric
Hot Water:Cooking:
Electricity:Wtr/Swr:
Trash:
Community AmenitiesClubhouse:Comm Rm:
Centrl Lndry:
Fitness: Hot Tub:
Sauna:
Gardening:
Walking Pth:
Library:Arts&Crafts:Health Rms:Guest Suite:Conv Store:
ComputerCtr:
Floorplans (Published Rents as of 5/14/2019) (2)
Elevator:
2.6% Vacant (3 units vacant) as of 5/14/2019
FeaturesStandard: Dishwasher; Disposal; Microwave; Ice Maker; Ceiling Fan; In Unit
Laundry (Hook-ups); Central A/C; Grabbar; Emergency Response
Select Units: --
Optional($): --
Incentives:None
Security: Unit Alarms; Fence; Gated Entry; Keyed Bldg Entry; Lighting
Unit Mix & Effective Rent (1)
Adjustments to Rent
Parking: Free Surface Parking
CommentsPublic housing/Section 8 rents are contract rents.Ashford Landing & Ashford Parkside combined, public housing waiting list-5 yrs.
No waitlist for market rate units.
Beauty Salon:
Date %Vac 1BR $ 2BR $ 3BR $2.6%5/14/19 $797 $947 --0.0%8/26/15 $750 $875 --0.0%3/28/14 $143 $232 --0.9%5/15/13 -- -- --
Description BRs Bath Rent SqFt ProgramRent/SF#UnitsFeature1 1Mid Rise - Elevator $771 650 Public Housing$1.1930--1 1Mid Rise - Elevator $771 650 Section 8/ 60%$1.1946--1 1Mid Rise - Elevator $900 650 Market$1.3819--2 1Mid Rise - Elevator $918 860 Public Housing$1.076--2 1Mid Rise - Elevator $918 860 Section 8/ 60%$1.0710--2 1Mid Rise - Elevator $1,025 860 Market$1.196--
© 2019 Real Property Research Group, Inc. GA121-012200Ashford Landing
(1) Effective Rent is Published Rent, net of utilities and concessions. (2) Published Rent is rent as quoted by management.
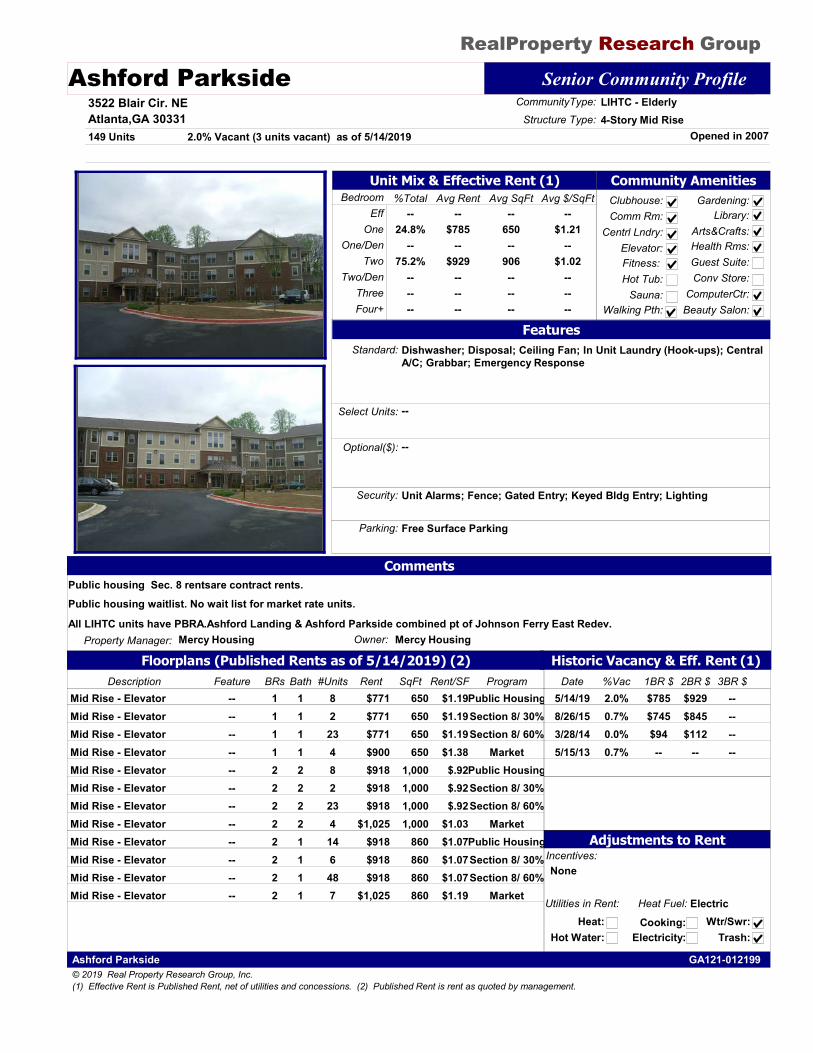
RealProperty Research Group
Ashford Parkside Senior Community Profile3522 Blair Cir. NEAtlanta,GA 30331
Property Manager: Mercy Housing
Opened in 2007
CommunityType: LIHTC - Elderly
149 UnitsStructure Type: 4-Story Mid Rise
Owner: Mercy Housing
Historic Vacancy & Eff. Rent (1)
Bedroom Avg $/SqFtAvg SqFt%Total Avg RentEff
One
Two
ThreeFour+
One/Den
Two/Den
--$785
--$929
------
--650--
906------
--$1.21
--$1.02
------
--24.8%
--75.2%
------
Utilities in Rent:
Heat:Heat Fuel: Electric
Hot Water:Cooking:
Electricity:Wtr/Swr:
Trash:
Community AmenitiesClubhouse:Comm Rm:
Centrl Lndry:
Fitness: Hot Tub:
Sauna:
Gardening:
Walking Pth:
Library:Arts&Crafts:Health Rms:Guest Suite:Conv Store:
ComputerCtr:
Floorplans (Published Rents as of 5/14/2019) (2)
Elevator:
2.0% Vacant (3 units vacant) as of 5/14/2019
FeaturesStandard: Dishwasher; Disposal; Ceiling Fan; In Unit Laundry (Hook-ups); Central
A/C; Grabbar; Emergency Response
Select Units: --
Optional($): --
Incentives:None
Security: Unit Alarms; Fence; Gated Entry; Keyed Bldg Entry; Lighting
Unit Mix & Effective Rent (1)
Adjustments to Rent
Parking: Free Surface Parking
CommentsPublic housing Sec. 8 rentsare contract rents.Public housing waitlist. No wait list for market rate units.
All LIHTC units have PBRA.Ashford Landing & Ashford Parkside combined pt of Johnson Ferry East Redev.
Beauty Salon:
Date %Vac 1BR $ 2BR $ 3BR $2.0%5/14/19 $785 $929 --0.7%8/26/15 $745 $845 --0.0%3/28/14 $94 $112 --0.7%5/15/13 -- -- --
Description BRs Bath Rent SqFt ProgramRent/SF#UnitsFeature1 1Mid Rise - Elevator $771 650 Public Housing$1.198--1 1Mid Rise - Elevator $771 650 Section 8/ 30%$1.192--1 1Mid Rise - Elevator $771 650 Section 8/ 60%$1.1923--1 1Mid Rise - Elevator $900 650 Market$1.384--2 2Mid Rise - Elevator $918 1,000 Public Housing$.928--2 2Mid Rise - Elevator $918 1,000 Section 8/ 30%$.922--2 2Mid Rise - Elevator $918 1,000 Section 8/ 60%$.9223--2 2Mid Rise - Elevator $1,025 1,000 Market$1.034--2 1Mid Rise - Elevator $918 860 Public Housing$1.0714--2 1Mid Rise - Elevator $918 860 Section 8/ 30%$1.076--2 1Mid Rise - Elevator $918 860 Section 8/ 60%$1.0748--2 1Mid Rise - Elevator $1,025 860 Market$1.197--
© 2019 Real Property Research Group, Inc. GA121-012199Ashford Parkside
(1) Effective Rent is Published Rent, net of utilities and concessions. (2) Published Rent is rent as quoted by management.
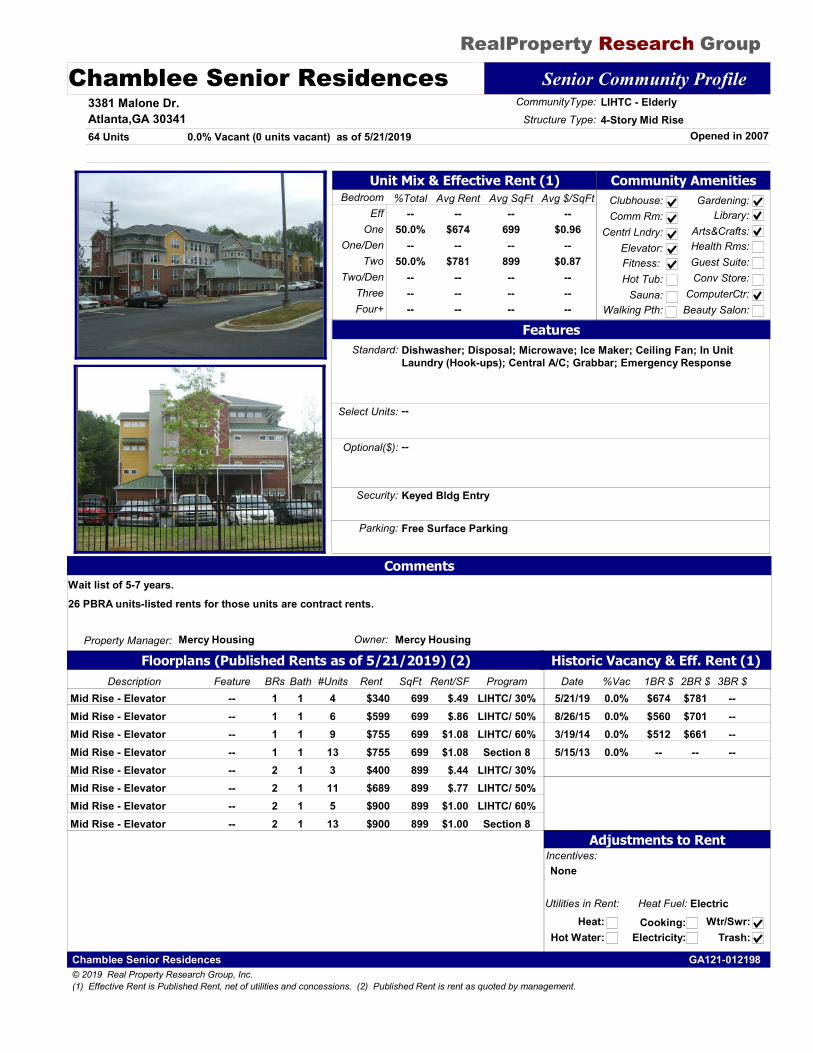
RealProperty Research Group
Chamblee Senior Residences Senior Community Profile3381 Malone Dr.Atlanta,GA 30341
Property Manager: Mercy Housing
Opened in 2007
CommunityType: LIHTC - Elderly
64 UnitsStructure Type: 4-Story Mid Rise
Owner: Mercy Housing
Historic Vacancy & Eff. Rent (1)
Bedroom Avg $/SqFtAvg SqFt%Total Avg RentEff
One
Two
ThreeFour+
One/Den
Two/Den
--$674
--$781
------
--699--
899------
--$0.96
--$0.87
------
--50.0%
--50.0%
------
Utilities in Rent:
Heat:Heat Fuel: Electric
Hot Water:Cooking:
Electricity:Wtr/Swr:
Trash:
Community AmenitiesClubhouse:Comm Rm:
Centrl Lndry:
Fitness: Hot Tub:
Sauna:
Gardening:
Walking Pth:
Library:Arts&Crafts:Health Rms:Guest Suite:Conv Store:
ComputerCtr:
Floorplans (Published Rents as of 5/21/2019) (2)
Elevator:
0.0% Vacant (0 units vacant) as of 5/21/2019
FeaturesStandard: Dishwasher; Disposal; Microwave; Ice Maker; Ceiling Fan; In Unit
Laundry (Hook-ups); Central A/C; Grabbar; Emergency Response
Select Units: --
Optional($): --
Incentives:None
Security: Keyed Bldg Entry
Unit Mix & Effective Rent (1)
Adjustments to Rent
Parking: Free Surface Parking
CommentsWait list of 5-7 years.26 PBRA units-listed rents for those units are contract rents.
Beauty Salon:
Date %Vac 1BR $ 2BR $ 3BR $0.0%5/21/19 $674 $781 --0.0%8/26/15 $560 $701 --0.0%3/19/14 $512 $661 --0.0%5/15/13 -- -- --
Description BRs Bath Rent SqFt ProgramRent/SF#UnitsFeature1 1Mid Rise - Elevator $340 699 LIHTC/ 30%$.494--1 1Mid Rise - Elevator $599 699 LIHTC/ 50%$.866--1 1Mid Rise - Elevator $755 699 LIHTC/ 60%$1.089--1 1Mid Rise - Elevator $755 699 Section 8$1.0813--2 1Mid Rise - Elevator $400 899 LIHTC/ 30%$.443--2 1Mid Rise - Elevator $689 899 LIHTC/ 50%$.7711--2 1Mid Rise - Elevator $900 899 LIHTC/ 60%$1.005--2 1Mid Rise - Elevator $900 899 Section 8$1.0013--
© 2019 Real Property Research Group, Inc. GA121-012198Chamblee Senior Residences
(1) Effective Rent is Published Rent, net of utilities and concessions. (2) Published Rent is rent as quoted by management.
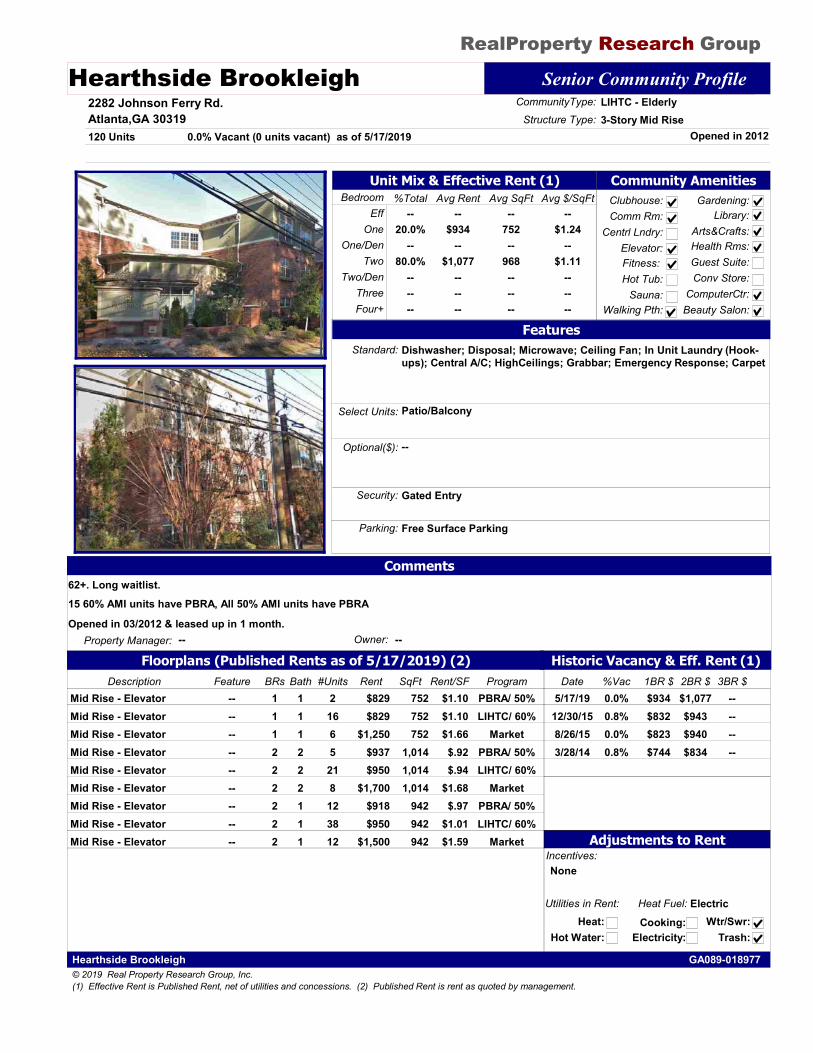
RealProperty Research Group
Hearthside Brookleigh Senior Community Profile2282 Johnson Ferry Rd.Atlanta,GA 30319
Property Manager: --
Opened in 2012
CommunityType: LIHTC - Elderly
120 UnitsStructure Type: 3-Story Mid Rise
Owner: --
Historic Vacancy & Eff. Rent (1)
Bedroom Avg $/SqFtAvg SqFt%Total Avg RentEff
One
Two
ThreeFour+
One/Den
Two/Den
--$934
--$1,077
------
--752--
968------
--$1.24
--$1.11
------
--20.0%
--80.0%
------
Utilities in Rent:
Heat:Heat Fuel: Electric
Hot Water:Cooking:
Electricity:Wtr/Swr:
Trash:
Community AmenitiesClubhouse:Comm Rm:
Centrl Lndry:
Fitness: Hot Tub:
Sauna:
Gardening:
Walking Pth:
Library:Arts&Crafts:Health Rms:Guest Suite:Conv Store:
ComputerCtr:
Floorplans (Published Rents as of 5/17/2019) (2)
Elevator:
0.0% Vacant (0 units vacant) as of 5/17/2019
FeaturesStandard: Dishwasher; Disposal; Microwave; Ceiling Fan; In Unit Laundry (Hook-
ups); Central A/C; HighCeilings; Grabbar; Emergency Response; Carpet
Select Units: Patio/Balcony
Optional($): --
Incentives:None
Security: Gated Entry
Unit Mix & Effective Rent (1)
Adjustments to Rent
Parking: Free Surface Parking
Comments62+. Long waitlist.15 60% AMI units have PBRA, All 50% AMI units have PBRA
Opened in 03/2012 & leased up in 1 month.
Beauty Salon:
Date %Vac 1BR $ 2BR $ 3BR $0.0%5/17/19 $934 $1,077 --0.8%12/30/15 $832 $943 --0.0%8/26/15 $823 $940 --0.8%3/28/14 $744 $834 --
Description BRs Bath Rent SqFt ProgramRent/SF#UnitsFeature1 1Mid Rise - Elevator $829 752 PBRA/ 50%$1.102--1 1Mid Rise - Elevator $829 752 LIHTC/ 60%$1.1016--1 1Mid Rise - Elevator $1,250 752 Market$1.666--2 2Mid Rise - Elevator $937 1,014 PBRA/ 50%$.925--2 2Mid Rise - Elevator $950 1,014 LIHTC/ 60%$.9421--2 2Mid Rise - Elevator $1,700 1,014 Market$1.688--2 1Mid Rise - Elevator $918 942 PBRA/ 50%$.9712--2 1Mid Rise - Elevator $950 942 LIHTC/ 60%$1.0138--2 1Mid Rise - Elevator $1,500 942 Market$1.5912--
© 2019 Real Property Research Group, Inc. GA089-018977Hearthside Brookleigh
(1) Effective Rent is Published Rent, net of utilities and concessions. (2) Published Rent is rent as quoted by management.
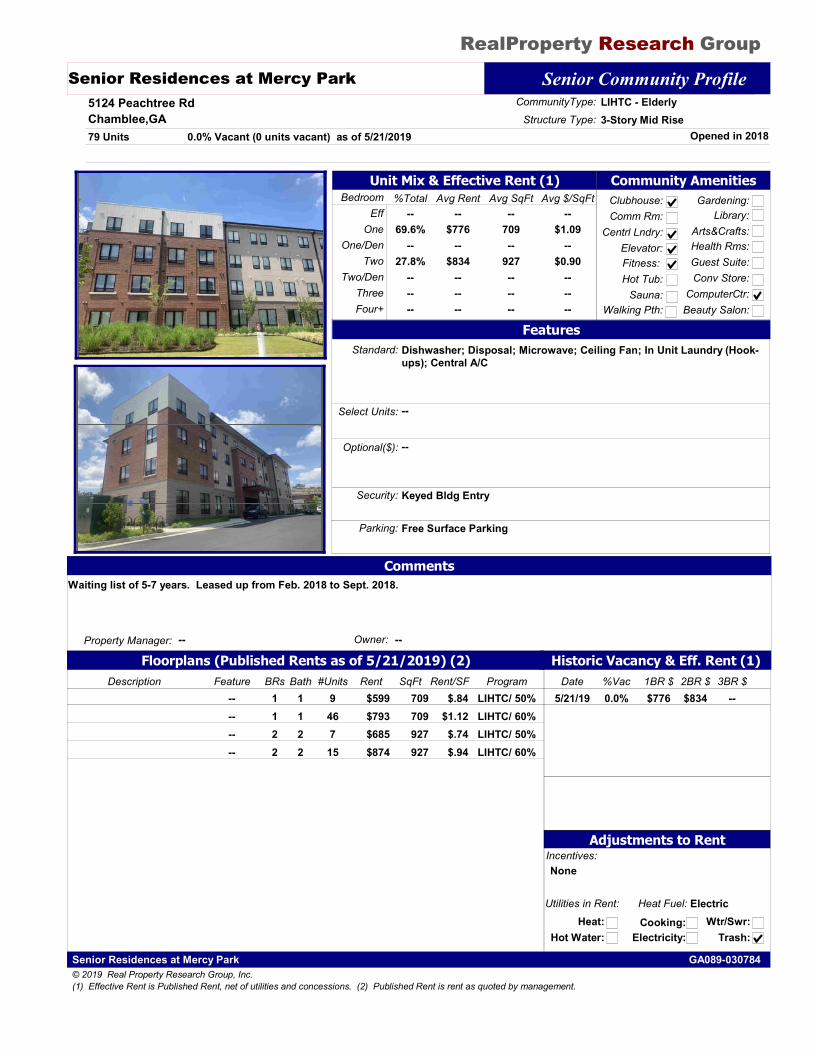
RealProperty Research Group
Senior Residences at Mercy Park Senior Community Profile5124 Peachtree RdChamblee,GA
Property Manager: --
Opened in 2018
CommunityType: LIHTC - Elderly
79 UnitsStructure Type: 3-Story Mid Rise
Owner: --
Historic Vacancy & Eff. Rent (1)
Bedroom Avg $/SqFtAvg SqFt%Total Avg RentEff
One
Two
ThreeFour+
One/Den
Two/Den
--$776
--$834
------
--709--
927------
--$1.09
--$0.90
------
--69.6%
--27.8%
------
Utilities in Rent:
Heat:Heat Fuel: Electric
Hot Water:Cooking:
Electricity:Wtr/Swr:
Trash:
Community AmenitiesClubhouse:Comm Rm:
Centrl Lndry:
Fitness: Hot Tub:
Sauna:
Gardening:
Walking Pth:
Library:Arts&Crafts:Health Rms:Guest Suite:Conv Store:
ComputerCtr:
Floorplans (Published Rents as of 5/21/2019) (2)
Elevator:
0.0% Vacant (0 units vacant) as of 5/21/2019
FeaturesStandard: Dishwasher; Disposal; Microwave; Ceiling Fan; In Unit Laundry (Hook-
ups); Central A/C
Select Units: --
Optional($): --
Incentives:None
Security: Keyed Bldg Entry
Unit Mix & Effective Rent (1)
Adjustments to Rent
Parking: Free Surface Parking
CommentsWaiting list of 5-7 years. Leased up from Feb. 2018 to Sept. 2018.
Beauty Salon:
Date %Vac 1BR $ 2BR $ 3BR $0.0%5/21/19 $776 $834 --
Description BRs Bath Rent SqFt ProgramRent/SF#UnitsFeature1 1 $599 709 LIHTC/ 50%$.849--1 1 $793 709 LIHTC/ 60%$1.1246--2 2 $685 927 LIHTC/ 50%$.747--2 2 $874 927 LIHTC/ 60%$.9415--
© 2019 Real Property Research Group, Inc. GA089-030784Senior Residences at Mercy Park
(1) Effective Rent is Published Rent, net of utilities and concessions. (2) Published Rent is rent as quoted by management.
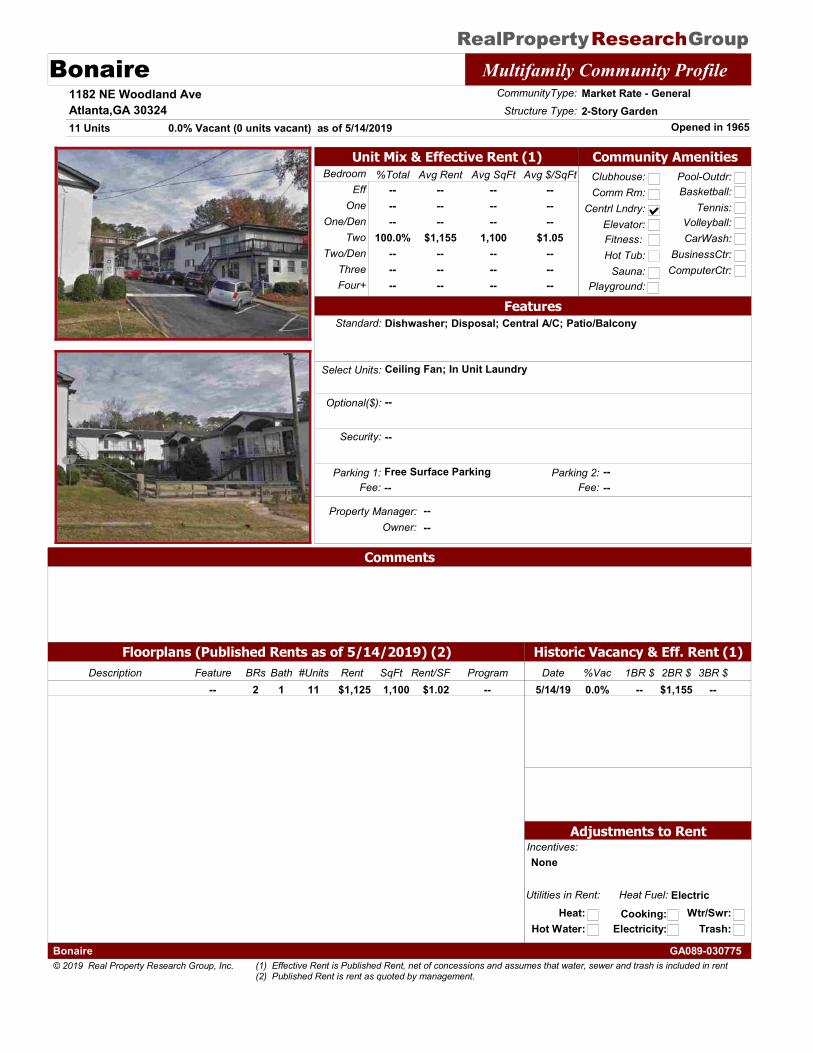
RealProperty Group Research Bonaire Multifamily Community Profile
1182 NE Woodland AveAtlanta,GA 30324
Property Manager: --
Opened in 1965
CommunityType: Market Rate - General
11 UnitsStructure Type: 2-Story Garden
Owner: --
Historic Vacancy & Eff. Rent (1)
Bedroom Avg $/SqFtAvg SqFt%Total Avg RentEff
One
Two
ThreeFour+
One/Den
Two/Den
------
$1,155------
------
1,100------
------
$1.05------
------
100.0%------
Utilities in Rent:
Heat:Heat Fuel: Electric
Hot Water:Cooking:
Electricity:Wtr/Swr:
Trash:
Community AmenitiesClubhouse:Comm Rm:
Centrl Lndry:
Fitness: Hot Tub:
Sauna:
Pool-Outdr:
Playground:
Basketball:Tennis:
Volleyball:CarWash:
BusinessCtr:ComputerCtr:
Floorplans (Published Rents as of 5/14/2019) (2)
Elevator:
0.0% Vacant (0 units vacant) as of 5/14/2019
FeaturesStandard: Dishwasher; Disposal; Central A/C; Patio/Balcony
Select Units: Ceiling Fan; In Unit Laundry
Optional($): --
Incentives:None
Security: --
Unit Mix & Effective Rent (1)
Adjustments to Rent
Parking 1: Free Surface Parking
Comments
Parking 2: --Fee: -- Fee: --
Date %Vac 1BR $ 2BR $ 3BR $0.0%5/14/19 -- $1,155 --
Description BRs Bath Rent SqFt ProgramRent/SF#UnitsFeature2 1 $1,125 1,100 --$1.0211--
© 2019 Real Property Research Group, Inc. GA089-030775Bonaire
(1) Effective Rent is Published Rent, net of concessions and assumes that water, sewer and trash is included in rent (2) Published Rent is rent as quoted by management.
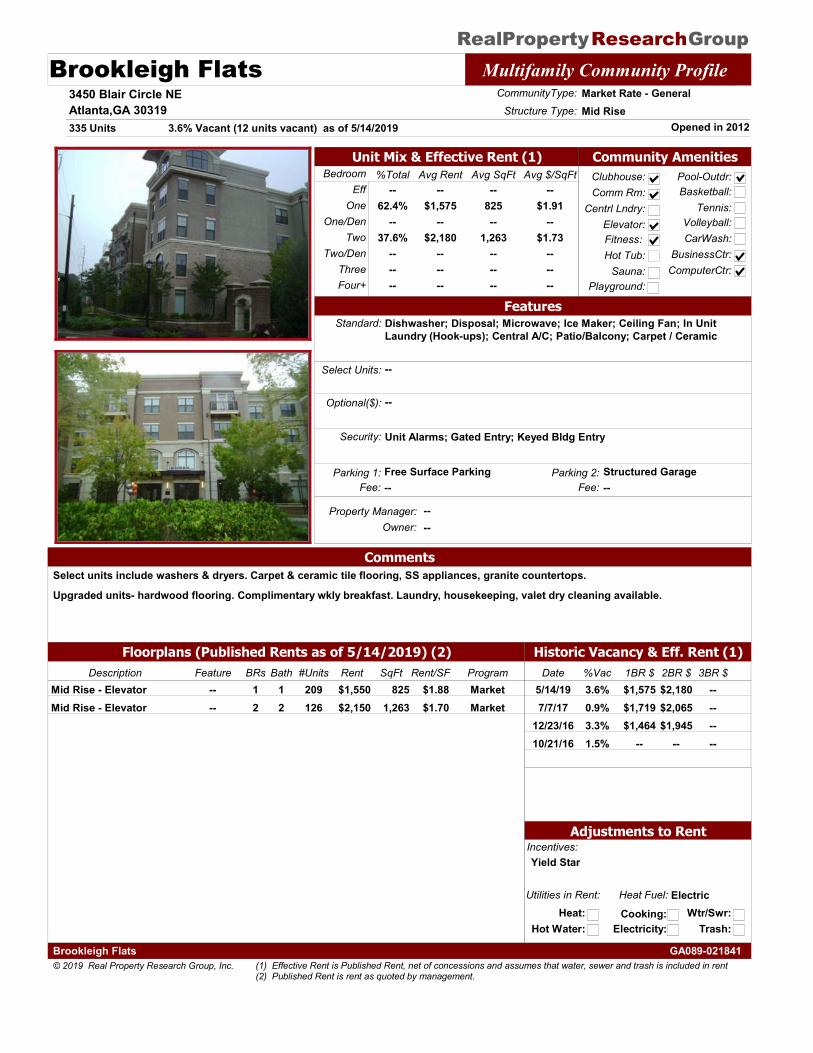
RealProperty Group Research Brookleigh Flats Multifamily Community Profile
3450 Blair Circle NEAtlanta,GA 30319
Property Manager: --
Opened in 2012
CommunityType: Market Rate - General
335 UnitsStructure Type: Mid Rise
Owner: --
Historic Vacancy & Eff. Rent (1)
Bedroom Avg $/SqFtAvg SqFt%Total Avg RentEff
One
Two
ThreeFour+
One/Den
Two/Den
--$1,575
--$2,180
------
--825--
1,263------
--$1.91
--$1.73
------
--62.4%
--37.6%
------
Utilities in Rent:
Heat:Heat Fuel: Electric
Hot Water:Cooking:
Electricity:Wtr/Swr:
Trash:
Community AmenitiesClubhouse:Comm Rm:
Centrl Lndry:
Fitness: Hot Tub:
Sauna:
Pool-Outdr:
Playground:
Basketball:Tennis:
Volleyball:CarWash:
BusinessCtr:ComputerCtr:
Floorplans (Published Rents as of 5/14/2019) (2)
Elevator:
3.6% Vacant (12 units vacant) as of 5/14/2019
FeaturesStandard: Dishwasher; Disposal; Microwave; Ice Maker; Ceiling Fan; In Unit
Laundry (Hook-ups); Central A/C; Patio/Balcony; Carpet / Ceramic
Select Units: --
Optional($): --
Incentives:Yield Star
Security: Unit Alarms; Gated Entry; Keyed Bldg Entry
Unit Mix & Effective Rent (1)
Adjustments to Rent
Parking 1: Free Surface Parking
CommentsSelect units include washers & dryers. Carpet & ceramic tile flooring, SS appliances, granite countertops.
Upgraded units- hardwood flooring. Complimentary wkly breakfast. Laundry, housekeeping, valet dry cleaning available.
Parking 2: Structured GarageFee: -- Fee: --
Date %Vac 1BR $ 2BR $ 3BR $3.6%5/14/19 $1,575 $2,180 --0.9%7/7/17 $1,719 $2,065 --3.3%12/23/16 $1,464 $1,945 --1.5%10/21/16 -- -- --
Description BRs Bath Rent SqFt ProgramRent/SF#UnitsFeature1 1Mid Rise - Elevator $1,550 825 Market$1.88209--2 2Mid Rise - Elevator $2,150 1,263 Market$1.70126--
© 2019 Real Property Research Group, Inc. GA089-021841Brookleigh Flats
(1) Effective Rent is Published Rent, net of concessions and assumes that water, sewer and trash is included in rent (2) Published Rent is rent as quoted by management.
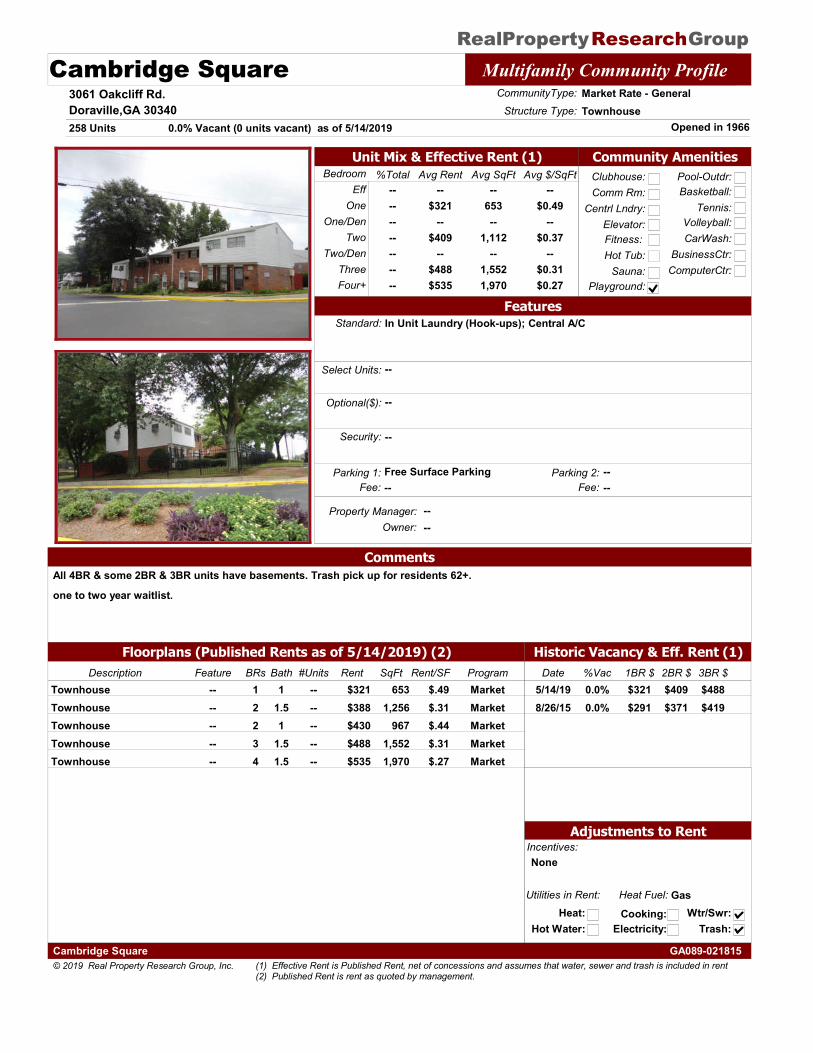
RealProperty Group Research Cambridge Square Multifamily Community Profile
3061 Oakcliff Rd.Doraville,GA 30340
Property Manager: --
Opened in 1966
CommunityType: Market Rate - General
258 UnitsStructure Type: Townhouse
Owner: --
Historic Vacancy & Eff. Rent (1)
Bedroom Avg $/SqFtAvg SqFt%Total Avg RentEff
One
Two
ThreeFour+
One/Den
Two/Den
--$321
--$409
--$488$535
--653--
1,112--
1,5521,970
--$0.49
--$0.37
--$0.31$0.27
--------------
Utilities in Rent:
Heat:Heat Fuel: Gas
Hot Water:Cooking:
Electricity:Wtr/Swr:
Trash:
Community AmenitiesClubhouse:Comm Rm:
Centrl Lndry:
Fitness: Hot Tub:
Sauna:
Pool-Outdr:
Playground:
Basketball:Tennis:
Volleyball:CarWash:
BusinessCtr:ComputerCtr:
Floorplans (Published Rents as of 5/14/2019) (2)
Elevator:
0.0% Vacant (0 units vacant) as of 5/14/2019
FeaturesStandard: In Unit Laundry (Hook-ups); Central A/C
Select Units: --
Optional($): --
Incentives:None
Security: --
Unit Mix & Effective Rent (1)
Adjustments to Rent
Parking 1: Free Surface Parking
CommentsAll 4BR & some 2BR & 3BR units have basements. Trash pick up for residents 62+.
one to two year waitlist.
Parking 2: --Fee: -- Fee: --
Date %Vac 1BR $ 2BR $ 3BR $0.0%5/14/19 $321 $409 $4880.0%8/26/15 $291 $371 $419
Description BRs Bath Rent SqFt ProgramRent/SF#UnitsFeature1 1Townhouse $321 653 Market$.49----2 1.5Townhouse $388 1,256 Market$.31----2 1Townhouse $430 967 Market$.44----3 1.5Townhouse $488 1,552 Market$.31----4 1.5Townhouse $535 1,970 Market$.27----
© 2019 Real Property Research Group, Inc. GA089-021815Cambridge Square
(1) Effective Rent is Published Rent, net of concessions and assumes that water, sewer and trash is included in rent (2) Published Rent is rent as quoted by management.
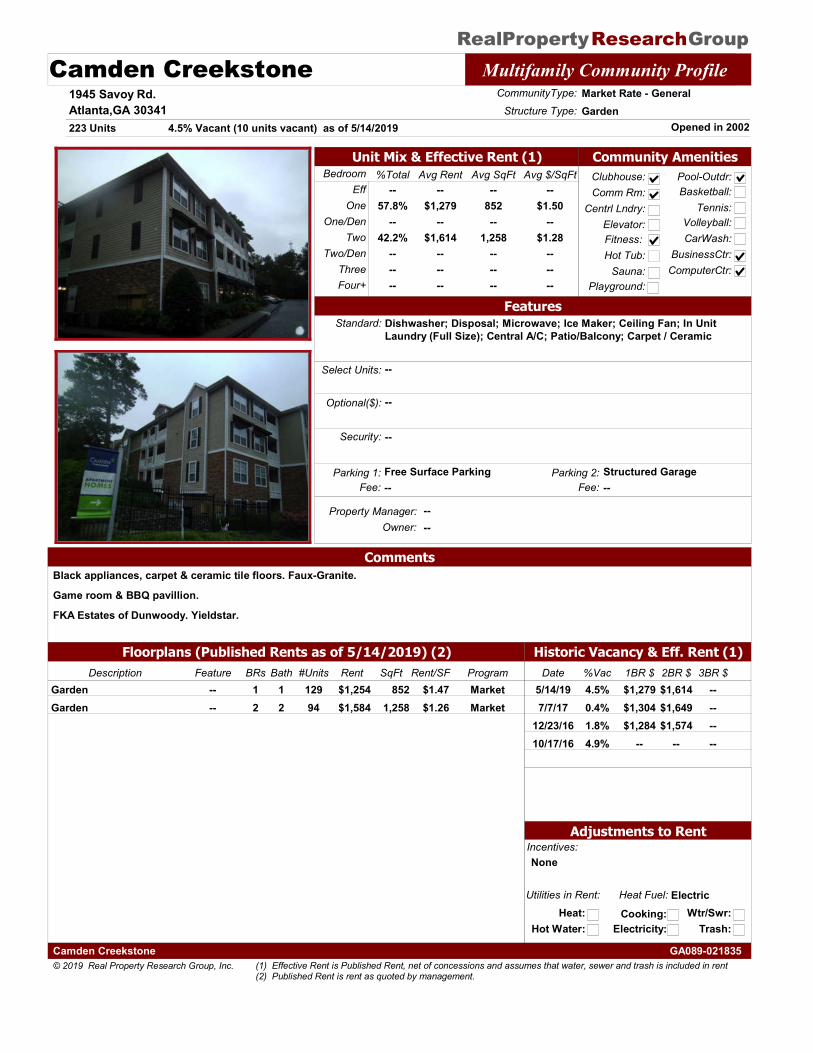
RealProperty Group Research Camden Creekstone Multifamily Community Profile
1945 Savoy Rd.Atlanta,GA 30341
Property Manager: --
Opened in 2002
CommunityType: Market Rate - General
223 UnitsStructure Type: Garden
Owner: --
Historic Vacancy & Eff. Rent (1)
Bedroom Avg $/SqFtAvg SqFt%Total Avg RentEff
One
Two
ThreeFour+
One/Den
Two/Den
--$1,279
--$1,614
------
--852--
1,258------
--$1.50
--$1.28
------
--57.8%
--42.2%
------
Utilities in Rent:
Heat:Heat Fuel: Electric
Hot Water:Cooking:
Electricity:Wtr/Swr:
Trash:
Community AmenitiesClubhouse:Comm Rm:
Centrl Lndry:
Fitness: Hot Tub:
Sauna:
Pool-Outdr:
Playground:
Basketball:Tennis:
Volleyball:CarWash:
BusinessCtr:ComputerCtr:
Floorplans (Published Rents as of 5/14/2019) (2)
Elevator:
4.5% Vacant (10 units vacant) as of 5/14/2019
FeaturesStandard: Dishwasher; Disposal; Microwave; Ice Maker; Ceiling Fan; In Unit
Laundry (Full Size); Central A/C; Patio/Balcony; Carpet / Ceramic
Select Units: --
Optional($): --
Incentives:None
Security: --
Unit Mix & Effective Rent (1)
Adjustments to Rent
Parking 1: Free Surface Parking
CommentsBlack appliances, carpet & ceramic tile floors. Faux-Granite.
Game room & BBQ pavillion.
FKA Estates of Dunwoody. Yieldstar.
Parking 2: Structured GarageFee: -- Fee: --
Date %Vac 1BR $ 2BR $ 3BR $4.5%5/14/19 $1,279 $1,614 --0.4%7/7/17 $1,304 $1,649 --1.8%12/23/16 $1,284 $1,574 --4.9%10/17/16 -- -- --
Description BRs Bath Rent SqFt ProgramRent/SF#UnitsFeature1 1Garden $1,254 852 Market$1.47129--2 2Garden $1,584 1,258 Market$1.2694--
© 2019 Real Property Research Group, Inc. GA089-021835Camden Creekstone
(1) Effective Rent is Published Rent, net of concessions and assumes that water, sewer and trash is included in rent (2) Published Rent is rent as quoted by management.
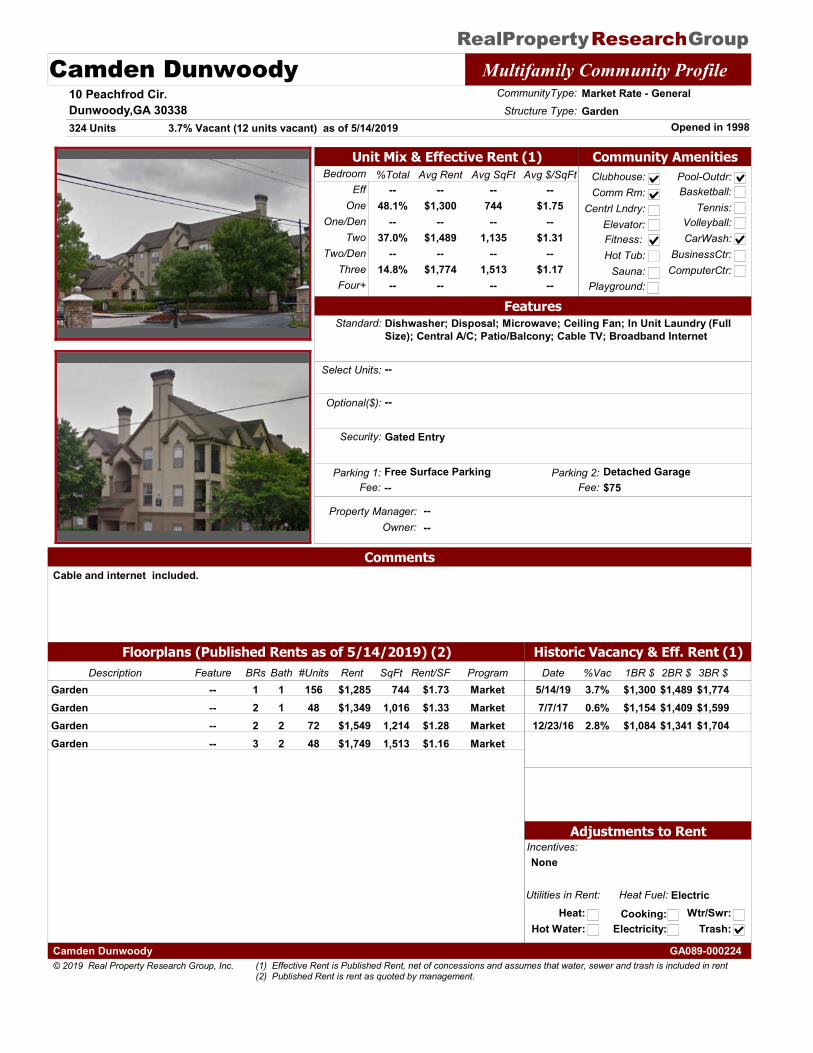
RealProperty Group Research Camden Dunwoody Multifamily Community Profile
10 Peachfrod Cir.Dunwoody,GA 30338
Property Manager: --
Opened in 1998
CommunityType: Market Rate - General
324 UnitsStructure Type: Garden
Owner: --
Historic Vacancy & Eff. Rent (1)
Bedroom Avg $/SqFtAvg SqFt%Total Avg RentEff
One
Two
ThreeFour+
One/Den
Two/Den
--$1,300
--$1,489
--$1,774
--
--744--
1,135--
1,513--
--$1.75
--$1.31
--$1.17
--
--48.1%
--37.0%
--14.8%
--
Utilities in Rent:
Heat:Heat Fuel: Electric
Hot Water:Cooking:
Electricity:Wtr/Swr:
Trash:
Community AmenitiesClubhouse:Comm Rm:
Centrl Lndry:
Fitness: Hot Tub:
Sauna:
Pool-Outdr:
Playground:
Basketball:Tennis:
Volleyball:CarWash:
BusinessCtr:ComputerCtr:
Floorplans (Published Rents as of 5/14/2019) (2)
Elevator:
3.7% Vacant (12 units vacant) as of 5/14/2019
FeaturesStandard: Dishwasher; Disposal; Microwave; Ceiling Fan; In Unit Laundry (Full
Size); Central A/C; Patio/Balcony; Cable TV; Broadband Internet
Select Units: --
Optional($): --
Incentives:None
Security: Gated Entry
Unit Mix & Effective Rent (1)
Adjustments to Rent
Parking 1: Free Surface Parking
CommentsCable and internet included.
Parking 2: Detached GarageFee: -- Fee: $75
Date %Vac 1BR $ 2BR $ 3BR $3.7%5/14/19 $1,300 $1,489 $1,7740.6%7/7/17 $1,154 $1,409 $1,5992.8%12/23/16 $1,084 $1,341 $1,704
Description BRs Bath Rent SqFt ProgramRent/SF#UnitsFeature1 1Garden $1,285 744 Market$1.73156--2 1Garden $1,349 1,016 Market$1.3348--2 2Garden $1,549 1,214 Market$1.2872--3 2Garden $1,749 1,513 Market$1.1648--
© 2019 Real Property Research Group, Inc. GA089-000224Camden Dunwoody
(1) Effective Rent is Published Rent, net of concessions and assumes that water, sewer and trash is included in rent (2) Published Rent is rent as quoted by management.
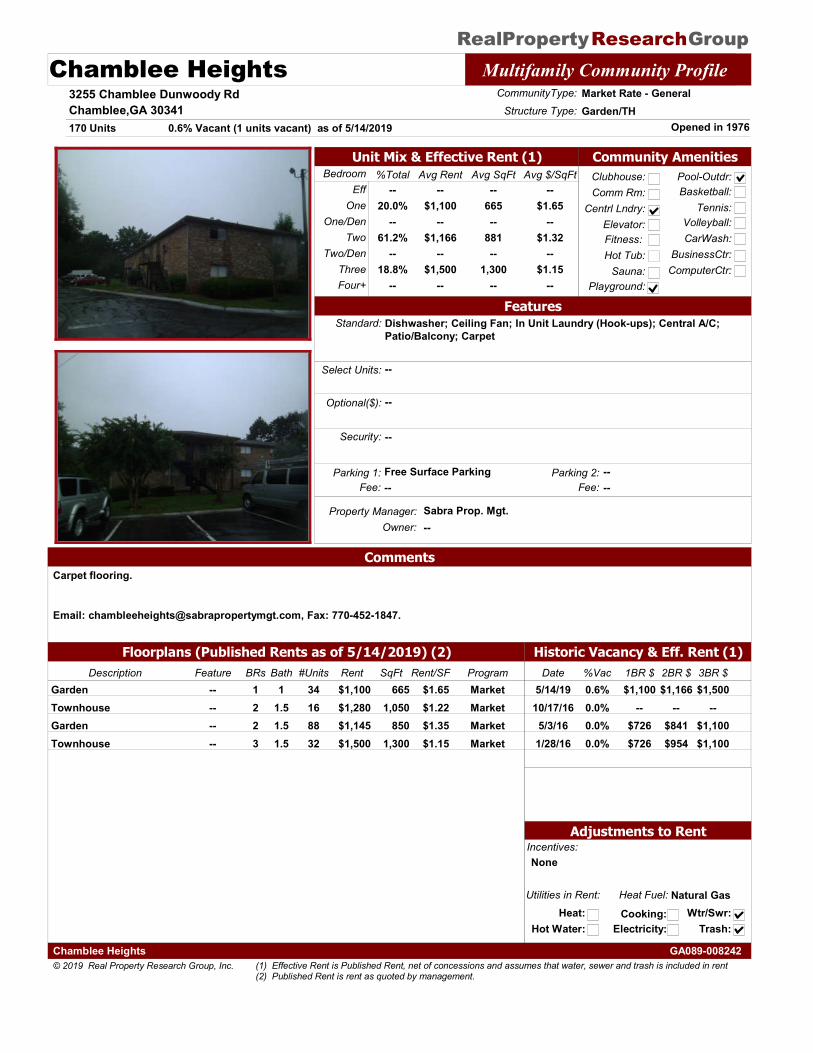
RealProperty Group Research Chamblee Heights Multifamily Community Profile
3255 Chamblee Dunwoody RdChamblee,GA 30341
Property Manager: Sabra Prop. Mgt.
Opened in 1976
CommunityType: Market Rate - General
170 UnitsStructure Type: Garden/TH
Owner: --
Historic Vacancy & Eff. Rent (1)
Bedroom Avg $/SqFtAvg SqFt%Total Avg RentEff
One
Two
ThreeFour+
One/Den
Two/Den
--$1,100
--$1,166
--$1,500
--
--665--
881--
1,300--
--$1.65
--$1.32
--$1.15
--
--20.0%
--61.2%
--18.8%
--
Utilities in Rent:
Heat:Heat Fuel: Natural Gas
Hot Water:Cooking:
Electricity:Wtr/Swr:
Trash:
Community AmenitiesClubhouse:Comm Rm:
Centrl Lndry:
Fitness: Hot Tub:
Sauna:
Pool-Outdr:
Playground:
Basketball:Tennis:
Volleyball:CarWash:
BusinessCtr:ComputerCtr:
Floorplans (Published Rents as of 5/14/2019) (2)
Elevator:
0.6% Vacant (1 units vacant) as of 5/14/2019
FeaturesStandard: Dishwasher; Ceiling Fan; In Unit Laundry (Hook-ups); Central A/C;
Patio/Balcony; Carpet
Select Units: --
Optional($): --
Incentives:None
Security: --
Unit Mix & Effective Rent (1)
Adjustments to Rent
Parking 1: Free Surface Parking
CommentsCarpet flooring.
Email: [email protected], Fax: 770-452-1847.
Parking 2: --Fee: -- Fee: --
Date %Vac 1BR $ 2BR $ 3BR $0.6%5/14/19 $1,100 $1,166 $1,5000.0%10/17/16 -- -- --0.0%5/3/16 $726 $841 $1,1000.0%1/28/16 $726 $954 $1,100
Description BRs Bath Rent SqFt ProgramRent/SF#UnitsFeature1 1Garden $1,100 665 Market$1.6534--2 1.5Townhouse $1,280 1,050 Market$1.2216--2 1.5Garden $1,145 850 Market$1.3588--3 1.5Townhouse $1,500 1,300 Market$1.1532--
© 2019 Real Property Research Group, Inc. GA089-008242Chamblee Heights
(1) Effective Rent is Published Rent, net of concessions and assumes that water, sewer and trash is included in rent (2) Published Rent is rent as quoted by management.
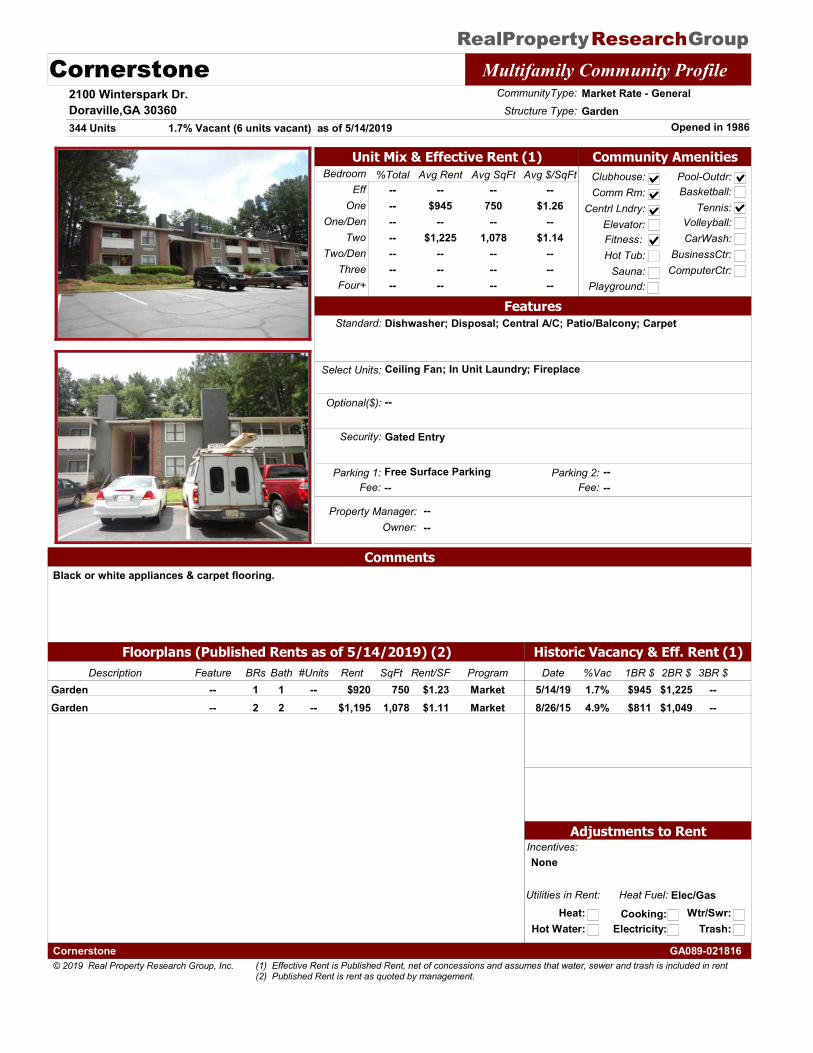
RealProperty Group Research Cornerstone Multifamily Community Profile
2100 Winterspark Dr.Doraville,GA 30360
Property Manager: --
Opened in 1986
CommunityType: Market Rate - General
344 UnitsStructure Type: Garden
Owner: --
Historic Vacancy & Eff. Rent (1)
Bedroom Avg $/SqFtAvg SqFt%Total Avg RentEff
One
Two
ThreeFour+
One/Den
Two/Den
--$945
--$1,225
------
--750--
1,078------
--$1.26
--$1.14
------
--------------
Utilities in Rent:
Heat:Heat Fuel: Elec/Gas
Hot Water:Cooking:
Electricity:Wtr/Swr:
Trash:
Community AmenitiesClubhouse:Comm Rm:
Centrl Lndry:
Fitness: Hot Tub:
Sauna:
Pool-Outdr:
Playground:
Basketball:Tennis:
Volleyball:CarWash:
BusinessCtr:ComputerCtr:
Floorplans (Published Rents as of 5/14/2019) (2)
Elevator:
1.7% Vacant (6 units vacant) as of 5/14/2019
FeaturesStandard: Dishwasher; Disposal; Central A/C; Patio/Balcony; Carpet
Select Units: Ceiling Fan; In Unit Laundry; Fireplace
Optional($): --
Incentives:None
Security: Gated Entry
Unit Mix & Effective Rent (1)
Adjustments to Rent
Parking 1: Free Surface Parking
CommentsBlack or white appliances & carpet flooring.
Parking 2: --Fee: -- Fee: --
Date %Vac 1BR $ 2BR $ 3BR $1.7%5/14/19 $945 $1,225 --4.9%8/26/15 $811 $1,049 --
Description BRs Bath Rent SqFt ProgramRent/SF#UnitsFeature1 1Garden $920 750 Market$1.23----2 2Garden $1,195 1,078 Market$1.11----
© 2019 Real Property Research Group, Inc. GA089-021816Cornerstone
(1) Effective Rent is Published Rent, net of concessions and assumes that water, sewer and trash is included in rent (2) Published Rent is rent as quoted by management.
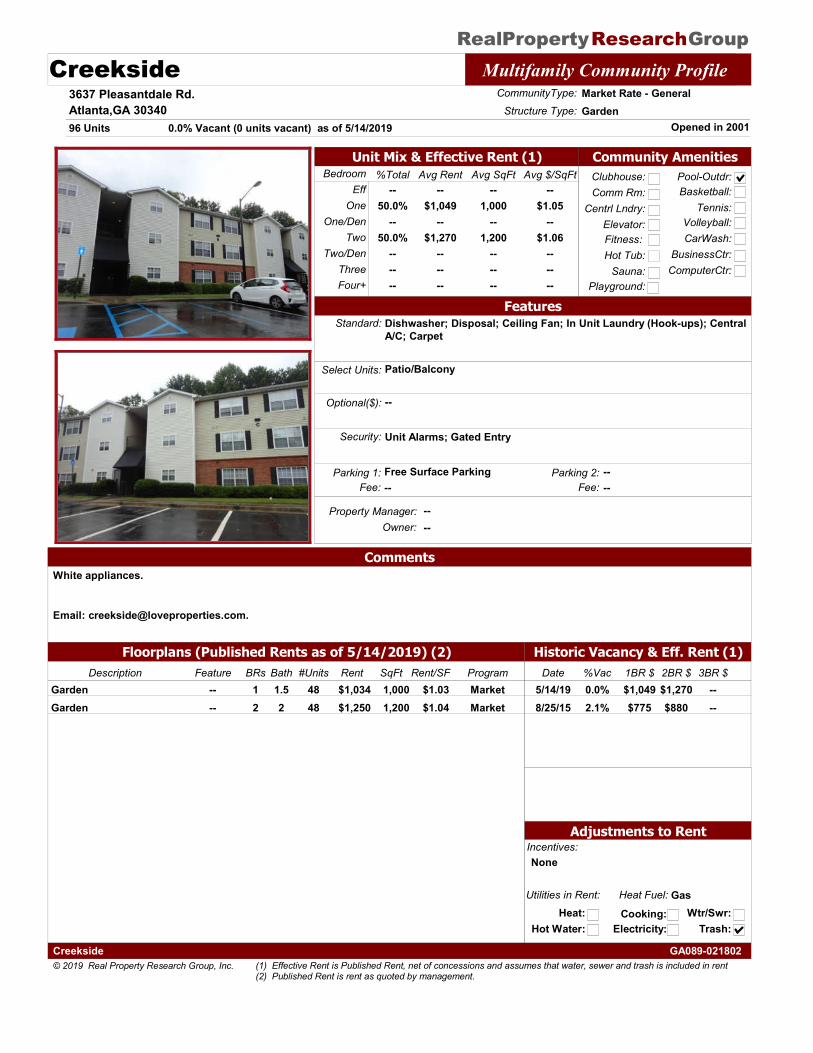
RealProperty Group Research Creekside Multifamily Community Profile
3637 Pleasantdale Rd.Atlanta,GA 30340
Property Manager: --
Opened in 2001
CommunityType: Market Rate - General
96 UnitsStructure Type: Garden
Owner: --
Historic Vacancy & Eff. Rent (1)
Bedroom Avg $/SqFtAvg SqFt%Total Avg RentEff
One
Two
ThreeFour+
One/Den
Two/Den
--$1,049
--$1,270
------
--1,000
--1,200
------
--$1.05
--$1.06
------
--50.0%
--50.0%
------
Utilities in Rent:
Heat:Heat Fuel: Gas
Hot Water:Cooking:
Electricity:Wtr/Swr:
Trash:
Community AmenitiesClubhouse:Comm Rm:
Centrl Lndry:
Fitness: Hot Tub:
Sauna:
Pool-Outdr:
Playground:
Basketball:Tennis:
Volleyball:CarWash:
BusinessCtr:ComputerCtr:
Floorplans (Published Rents as of 5/14/2019) (2)
Elevator:
0.0% Vacant (0 units vacant) as of 5/14/2019
FeaturesStandard: Dishwasher; Disposal; Ceiling Fan; In Unit Laundry (Hook-ups); Central
A/C; Carpet
Select Units: Patio/Balcony
Optional($): --
Incentives:None
Security: Unit Alarms; Gated Entry
Unit Mix & Effective Rent (1)
Adjustments to Rent
Parking 1: Free Surface Parking
CommentsWhite appliances.
Email: [email protected].
Parking 2: --Fee: -- Fee: --
Date %Vac 1BR $ 2BR $ 3BR $0.0%5/14/19 $1,049 $1,270 --2.1%8/25/15 $775 $880 --
Description BRs Bath Rent SqFt ProgramRent/SF#UnitsFeature1 1.5Garden $1,034 1,000 Market$1.0348--2 2Garden $1,250 1,200 Market$1.0448--
© 2019 Real Property Research Group, Inc. GA089-021802Creekside
(1) Effective Rent is Published Rent, net of concessions and assumes that water, sewer and trash is included in rent (2) Published Rent is rent as quoted by management.
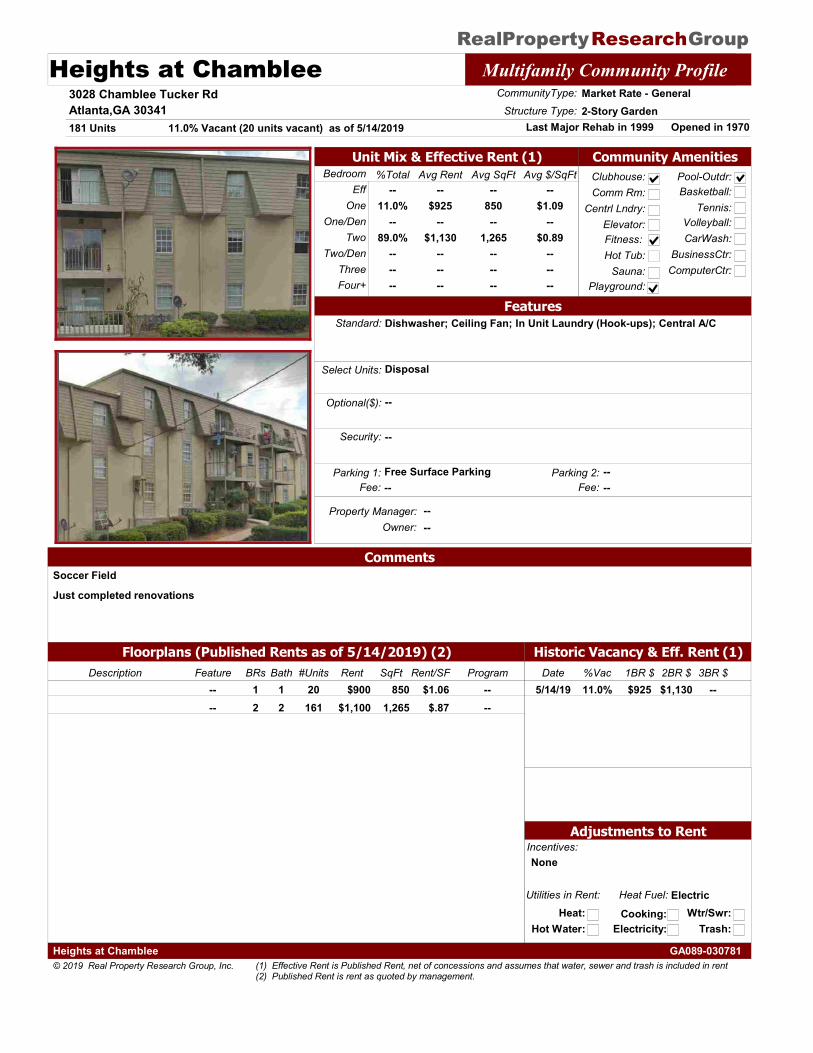
RealProperty Group Research Heights at Chamblee Multifamily Community Profile
3028 Chamblee Tucker RdAtlanta,GA 30341
Property Manager: --
Opened in 1970Last Major Rehab in 1999
CommunityType: Market Rate - General
181 UnitsStructure Type: 2-Story Garden
Owner: --
Historic Vacancy & Eff. Rent (1)
Bedroom Avg $/SqFtAvg SqFt%Total Avg RentEff
One
Two
ThreeFour+
One/Den
Two/Den
--$925
--$1,130
------
--850--
1,265------
--$1.09
--$0.89
------
--11.0%
--89.0%
------
Utilities in Rent:
Heat:Heat Fuel: Electric
Hot Water:Cooking:
Electricity:Wtr/Swr:
Trash:
Community AmenitiesClubhouse:Comm Rm:
Centrl Lndry:
Fitness: Hot Tub:
Sauna:
Pool-Outdr:
Playground:
Basketball:Tennis:
Volleyball:CarWash:
BusinessCtr:ComputerCtr:
Floorplans (Published Rents as of 5/14/2019) (2)
Elevator:
11.0% Vacant (20 units vacant) as of 5/14/2019
FeaturesStandard: Dishwasher; Ceiling Fan; In Unit Laundry (Hook-ups); Central A/C
Select Units: Disposal
Optional($): --
Incentives:None
Security: --
Unit Mix & Effective Rent (1)
Adjustments to Rent
Parking 1: Free Surface Parking
CommentsSoccer Field
Just completed renovations
Parking 2: --Fee: -- Fee: --
Date %Vac 1BR $ 2BR $ 3BR $11.0%5/14/19 $925 $1,130 --
Description BRs Bath Rent SqFt ProgramRent/SF#UnitsFeature1 1 $900 850 --$1.0620--2 2 $1,100 1,265 --$.87161--
© 2019 Real Property Research Group, Inc. GA089-030781Heights at Chamblee
(1) Effective Rent is Published Rent, net of concessions and assumes that water, sewer and trash is included in rent (2) Published Rent is rent as quoted by management.
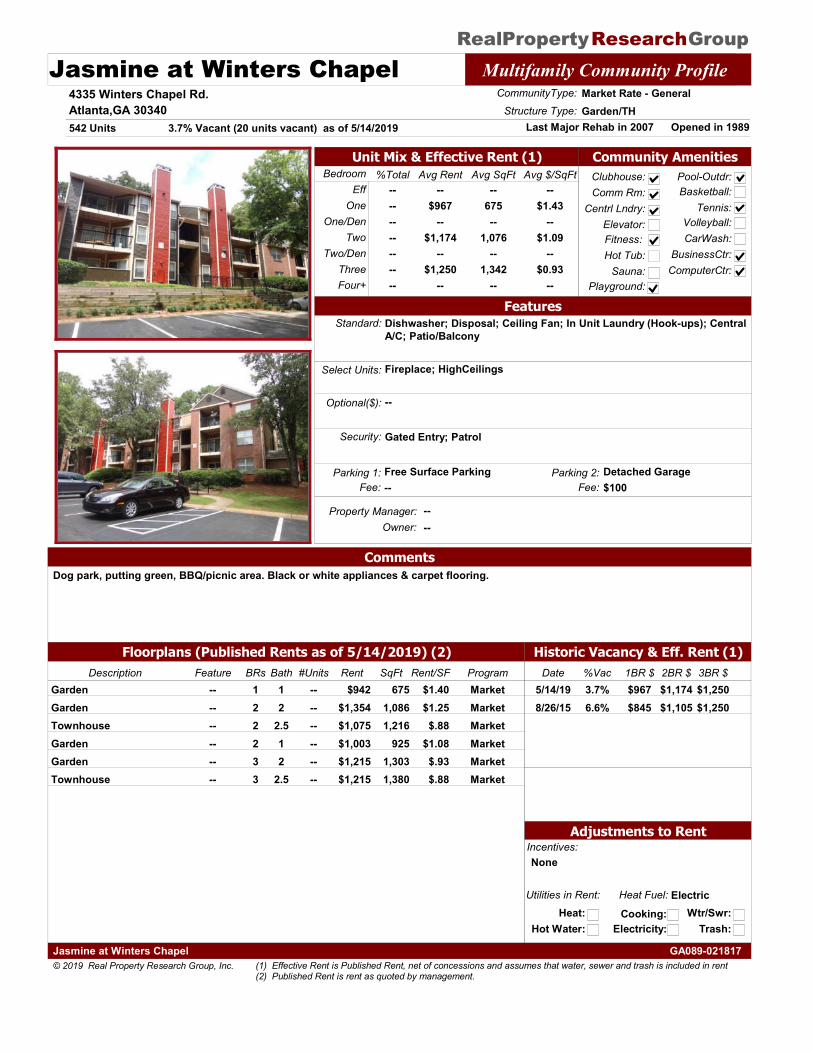
RealProperty Group Research Jasmine at Winters Chapel Multifamily Community Profile
4335 Winters Chapel Rd.Atlanta,GA 30340
Property Manager: --
Opened in 1989Last Major Rehab in 2007
CommunityType: Market Rate - General
542 UnitsStructure Type: Garden/TH
Owner: --
Historic Vacancy & Eff. Rent (1)
Bedroom Avg $/SqFtAvg SqFt%Total Avg RentEff
One
Two
ThreeFour+
One/Den
Two/Den
--$967
--$1,174
--$1,250
--
--675--
1,076--
1,342--
--$1.43
--$1.09
--$0.93
--
--------------
Utilities in Rent:
Heat:Heat Fuel: Electric
Hot Water:Cooking:
Electricity:Wtr/Swr:
Trash:
Community AmenitiesClubhouse:Comm Rm:
Centrl Lndry:
Fitness: Hot Tub:
Sauna:
Pool-Outdr:
Playground:
Basketball:Tennis:
Volleyball:CarWash:
BusinessCtr:ComputerCtr:
Floorplans (Published Rents as of 5/14/2019) (2)
Elevator:
3.7% Vacant (20 units vacant) as of 5/14/2019
FeaturesStandard: Dishwasher; Disposal; Ceiling Fan; In Unit Laundry (Hook-ups); Central
A/C; Patio/Balcony
Select Units: Fireplace; HighCeilings
Optional($): --
Incentives:None
Security: Gated Entry; Patrol
Unit Mix & Effective Rent (1)
Adjustments to Rent
Parking 1: Free Surface Parking
CommentsDog park, putting green, BBQ/picnic area. Black or white appliances & carpet flooring.
Parking 2: Detached GarageFee: -- Fee: $100
Date %Vac 1BR $ 2BR $ 3BR $3.7%5/14/19 $967 $1,174 $1,2506.6%8/26/15 $845 $1,105 $1,250
Description BRs Bath Rent SqFt ProgramRent/SF#UnitsFeature1 1Garden $942 675 Market$1.40----2 2Garden $1,354 1,086 Market$1.25----2 2.5Townhouse $1,075 1,216 Market$.88----2 1Garden $1,003 925 Market$1.08----3 2Garden $1,215 1,303 Market$.93----3 2.5Townhouse $1,215 1,380 Market$.88----
© 2019 Real Property Research Group, Inc. GA089-021817Jasmine at Winters Chapel
(1) Effective Rent is Published Rent, net of concessions and assumes that water, sewer and trash is included in rent (2) Published Rent is rent as quoted by management.
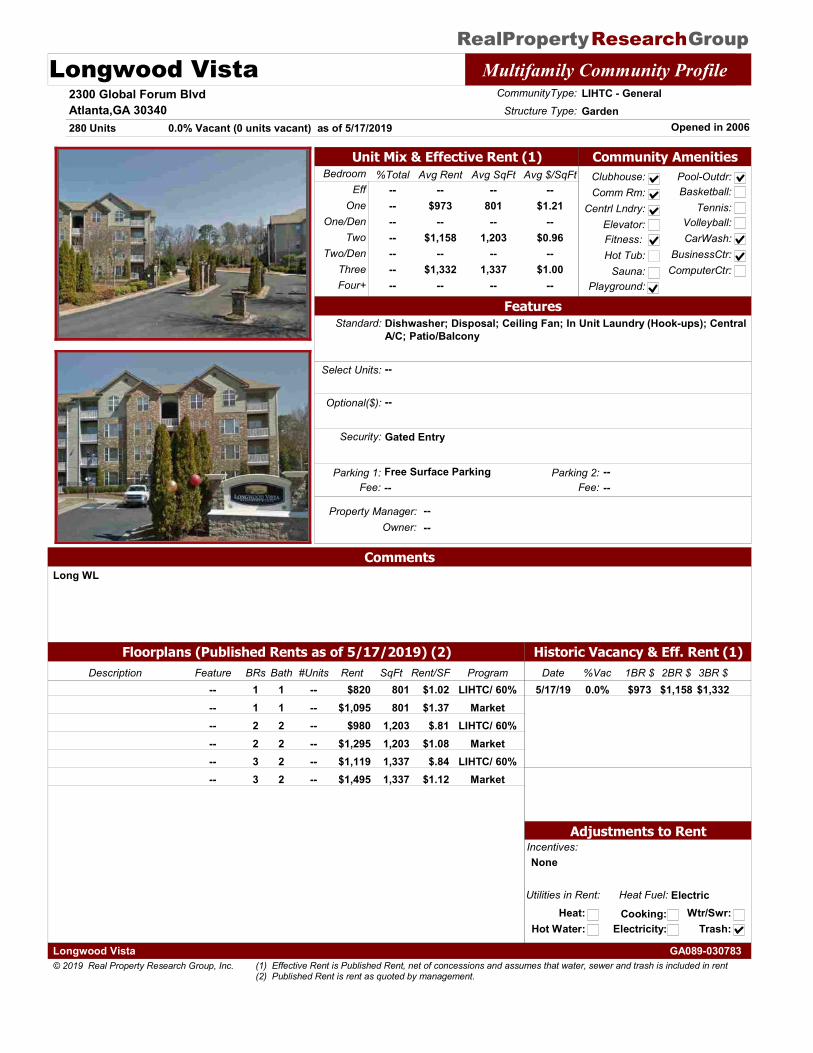
RealProperty Group Research Longwood Vista Multifamily Community Profile
2300 Global Forum BlvdAtlanta,GA 30340
Property Manager: --
Opened in 2006
CommunityType: LIHTC - General
280 UnitsStructure Type: Garden
Owner: --
Historic Vacancy & Eff. Rent (1)
Bedroom Avg $/SqFtAvg SqFt%Total Avg RentEff
One
Two
ThreeFour+
One/Den
Two/Den
--$973
--$1,158
--$1,332
--
--801--
1,203--
1,337--
--$1.21
--$0.96
--$1.00
--
--------------
Utilities in Rent:
Heat:Heat Fuel: Electric
Hot Water:Cooking:
Electricity:Wtr/Swr:
Trash:
Community AmenitiesClubhouse:Comm Rm:
Centrl Lndry:
Fitness: Hot Tub:
Sauna:
Pool-Outdr:
Playground:
Basketball:Tennis:
Volleyball:CarWash:
BusinessCtr:ComputerCtr:
Floorplans (Published Rents as of 5/17/2019) (2)
Elevator:
0.0% Vacant (0 units vacant) as of 5/17/2019
FeaturesStandard: Dishwasher; Disposal; Ceiling Fan; In Unit Laundry (Hook-ups); Central
A/C; Patio/Balcony
Select Units: --
Optional($): --
Incentives:None
Security: Gated Entry
Unit Mix & Effective Rent (1)
Adjustments to Rent
Parking 1: Free Surface Parking
CommentsLong WL
Parking 2: --Fee: -- Fee: --
Date %Vac 1BR $ 2BR $ 3BR $0.0%5/17/19 $973 $1,158 $1,332
Description BRs Bath Rent SqFt ProgramRent/SF#UnitsFeature1 1 $820 801 LIHTC/ 60%$1.02----1 1 $1,095 801 Market$1.37----2 2 $980 1,203 LIHTC/ 60%$.81----2 2 $1,295 1,203 Market$1.08----3 2 $1,119 1,337 LIHTC/ 60%$.84----3 2 $1,495 1,337 Market$1.12----
© 2019 Real Property Research Group, Inc. GA089-030783Longwood Vista
(1) Effective Rent is Published Rent, net of concessions and assumes that water, sewer and trash is included in rent (2) Published Rent is rent as quoted by management.
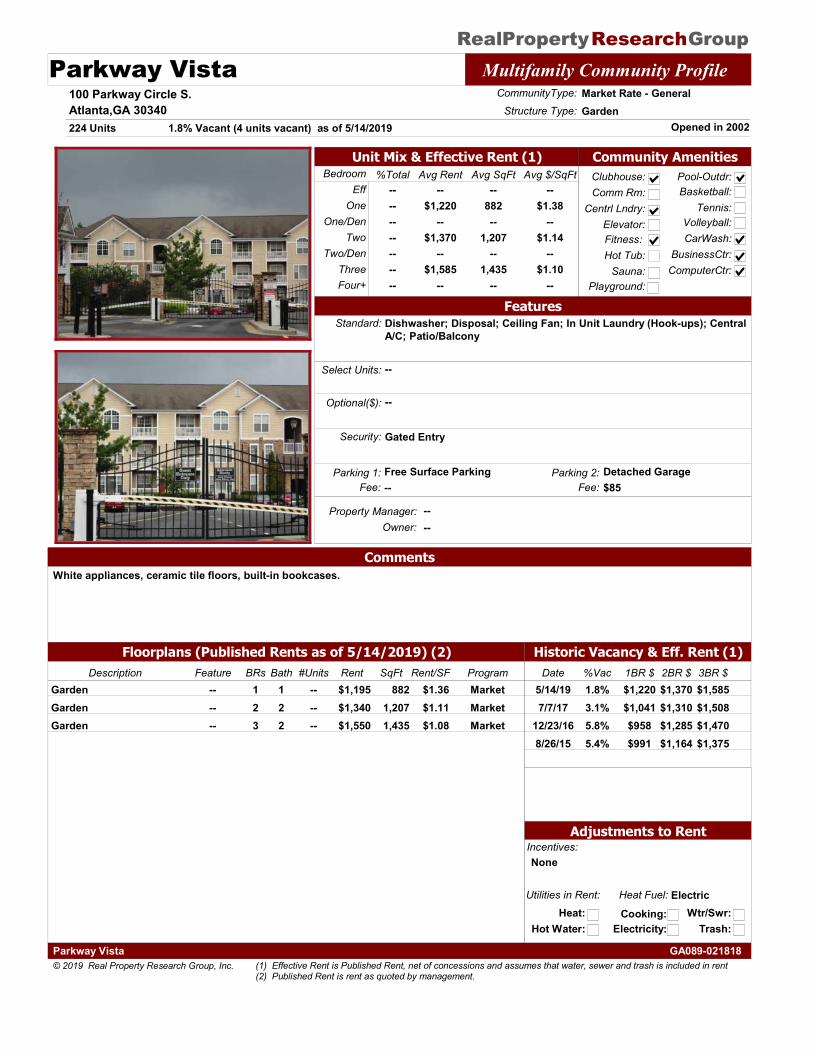
RealProperty Group Research Parkway Vista Multifamily Community Profile
100 Parkway Circle S.Atlanta,GA 30340
Property Manager: --
Opened in 2002
CommunityType: Market Rate - General
224 UnitsStructure Type: Garden
Owner: --
Historic Vacancy & Eff. Rent (1)
Bedroom Avg $/SqFtAvg SqFt%Total Avg RentEff
One
Two
ThreeFour+
One/Den
Two/Den
--$1,220
--$1,370
--$1,585
--
--882--
1,207--
1,435--
--$1.38
--$1.14
--$1.10
--
--------------
Utilities in Rent:
Heat:Heat Fuel: Electric
Hot Water:Cooking:
Electricity:Wtr/Swr:
Trash:
Community AmenitiesClubhouse:Comm Rm:
Centrl Lndry:
Fitness: Hot Tub:
Sauna:
Pool-Outdr:
Playground:
Basketball:Tennis:
Volleyball:CarWash:
BusinessCtr:ComputerCtr:
Floorplans (Published Rents as of 5/14/2019) (2)
Elevator:
1.8% Vacant (4 units vacant) as of 5/14/2019
FeaturesStandard: Dishwasher; Disposal; Ceiling Fan; In Unit Laundry (Hook-ups); Central
A/C; Patio/Balcony
Select Units: --
Optional($): --
Incentives:None
Security: Gated Entry
Unit Mix & Effective Rent (1)
Adjustments to Rent
Parking 1: Free Surface Parking
CommentsWhite appliances, ceramic tile floors, built-in bookcases.
Parking 2: Detached GarageFee: -- Fee: $85
Date %Vac 1BR $ 2BR $ 3BR $1.8%5/14/19 $1,220 $1,370 $1,5853.1%7/7/17 $1,041 $1,310 $1,5085.8%12/23/16 $958 $1,285 $1,4705.4%8/26/15 $991 $1,164 $1,375
Description BRs Bath Rent SqFt ProgramRent/SF#UnitsFeature1 1Garden $1,195 882 Market$1.36----2 2Garden $1,340 1,207 Market$1.11----3 2Garden $1,550 1,435 Market$1.08----
© 2019 Real Property Research Group, Inc. GA089-021818Parkway Vista
(1) Effective Rent is Published Rent, net of concessions and assumes that water, sewer and trash is included in rent (2) Published Rent is rent as quoted by management.
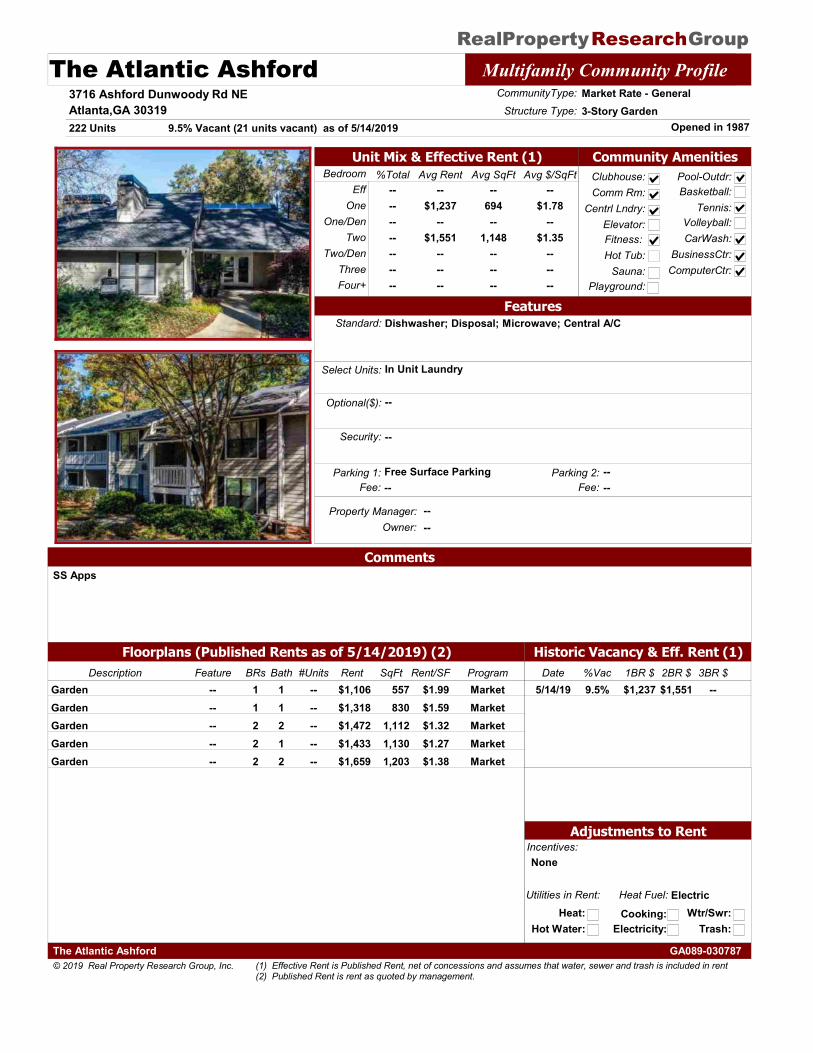
RealProperty Group Research The Atlantic Ashford Multifamily Community Profile
3716 Ashford Dunwoody Rd NEAtlanta,GA 30319
Property Manager: --
Opened in 1987
CommunityType: Market Rate - General
222 UnitsStructure Type: 3-Story Garden
Owner: --
Historic Vacancy & Eff. Rent (1)
Bedroom Avg $/SqFtAvg SqFt%Total Avg RentEff
One
Two
ThreeFour+
One/Den
Two/Den
--$1,237
--$1,551
------
--694--
1,148------
--$1.78
--$1.35
------
--------------
Utilities in Rent:
Heat:Heat Fuel: Electric
Hot Water:Cooking:
Electricity:Wtr/Swr:
Trash:
Community AmenitiesClubhouse:Comm Rm:
Centrl Lndry:
Fitness: Hot Tub:
Sauna:
Pool-Outdr:
Playground:
Basketball:Tennis:
Volleyball:CarWash:
BusinessCtr:ComputerCtr:
Floorplans (Published Rents as of 5/14/2019) (2)
Elevator:
9.5% Vacant (21 units vacant) as of 5/14/2019
FeaturesStandard: Dishwasher; Disposal; Microwave; Central A/C
Select Units: In Unit Laundry
Optional($): --
Incentives:None
Security: --
Unit Mix & Effective Rent (1)
Adjustments to Rent
Parking 1: Free Surface Parking
CommentsSS Apps
Parking 2: --Fee: -- Fee: --
Date %Vac 1BR $ 2BR $ 3BR $9.5%5/14/19 $1,237 $1,551 --
Description BRs Bath Rent SqFt ProgramRent/SF#UnitsFeature1 1Garden $1,106 557 Market$1.99----1 1Garden $1,318 830 Market$1.59----2 2Garden $1,472 1,112 Market$1.32----2 1Garden $1,433 1,130 Market$1.27----2 2Garden $1,659 1,203 Market$1.38----
© 2019 Real Property Research Group, Inc. GA089-030787The Atlantic Ashford
(1) Effective Rent is Published Rent, net of concessions and assumes that water, sewer and trash is included in rent (2) Published Rent is rent as quoted by management.
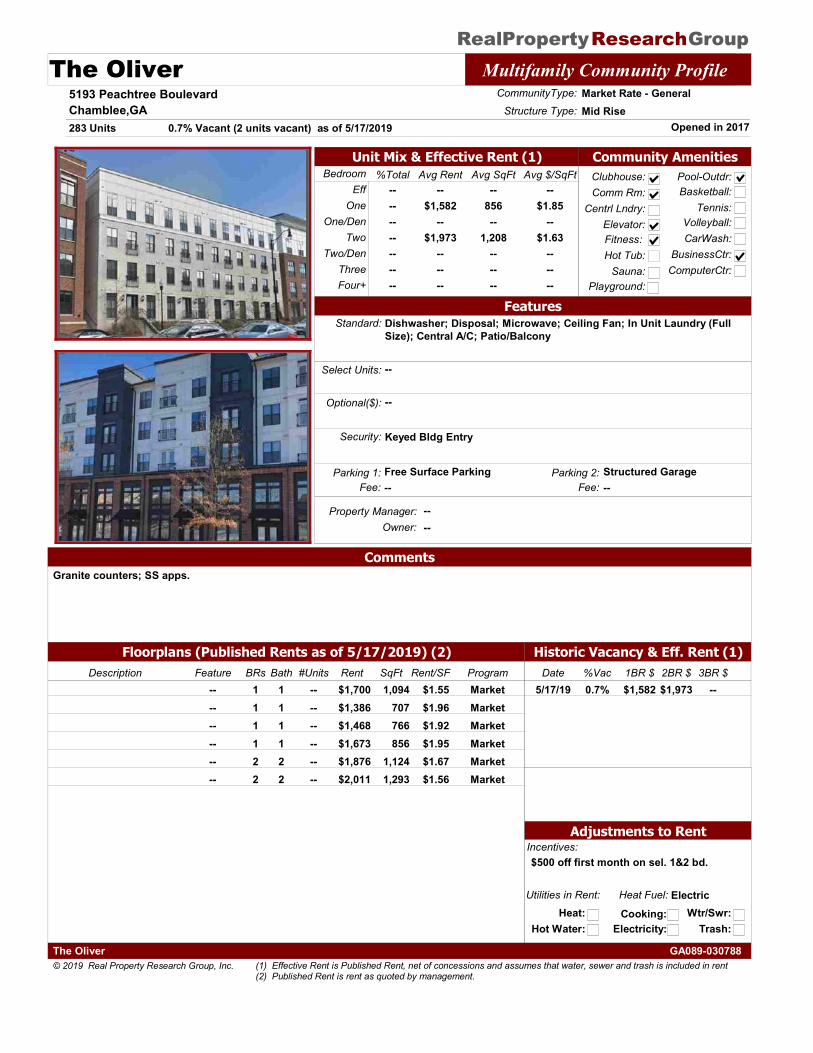
RealProperty Group Research The Oliver Multifamily Community Profile
5193 Peachtree BoulevardChamblee,GA
Property Manager: --
Opened in 2017
CommunityType: Market Rate - General
283 UnitsStructure Type: Mid Rise
Owner: --
Historic Vacancy & Eff. Rent (1)
Bedroom Avg $/SqFtAvg SqFt%Total Avg RentEff
One
Two
ThreeFour+
One/Den
Two/Den
--$1,582
--$1,973
------
--856--
1,208------
--$1.85
--$1.63
------
--------------
Utilities in Rent:
Heat:Heat Fuel: Electric
Hot Water:Cooking:
Electricity:Wtr/Swr:
Trash:
Community AmenitiesClubhouse:Comm Rm:
Centrl Lndry:
Fitness: Hot Tub:
Sauna:
Pool-Outdr:
Playground:
Basketball:Tennis:
Volleyball:CarWash:
BusinessCtr:ComputerCtr:
Floorplans (Published Rents as of 5/17/2019) (2)
Elevator:
0.7% Vacant (2 units vacant) as of 5/17/2019
FeaturesStandard: Dishwasher; Disposal; Microwave; Ceiling Fan; In Unit Laundry (Full
Size); Central A/C; Patio/Balcony
Select Units: --
Optional($): --
Incentives:$500 off first month on sel. 1&2 bd.
Security: Keyed Bldg Entry
Unit Mix & Effective Rent (1)
Adjustments to Rent
Parking 1: Free Surface Parking
CommentsGranite counters; SS apps.
Parking 2: Structured GarageFee: -- Fee: --
Date %Vac 1BR $ 2BR $ 3BR $0.7%5/17/19 $1,582 $1,973 --
Description BRs Bath Rent SqFt ProgramRent/SF#UnitsFeature1 1 $1,700 1,094 Market$1.55----1 1 $1,386 707 Market$1.96----1 1 $1,468 766 Market$1.92----1 1 $1,673 856 Market$1.95----2 2 $1,876 1,124 Market$1.67----2 2 $2,011 1,293 Market$1.56----
© 2019 Real Property Research Group, Inc. GA089-030788The Oliver
(1) Effective Rent is Published Rent, net of concessions and assumes that water, sewer and trash is included in rent (2) Published Rent is rent as quoted by management.
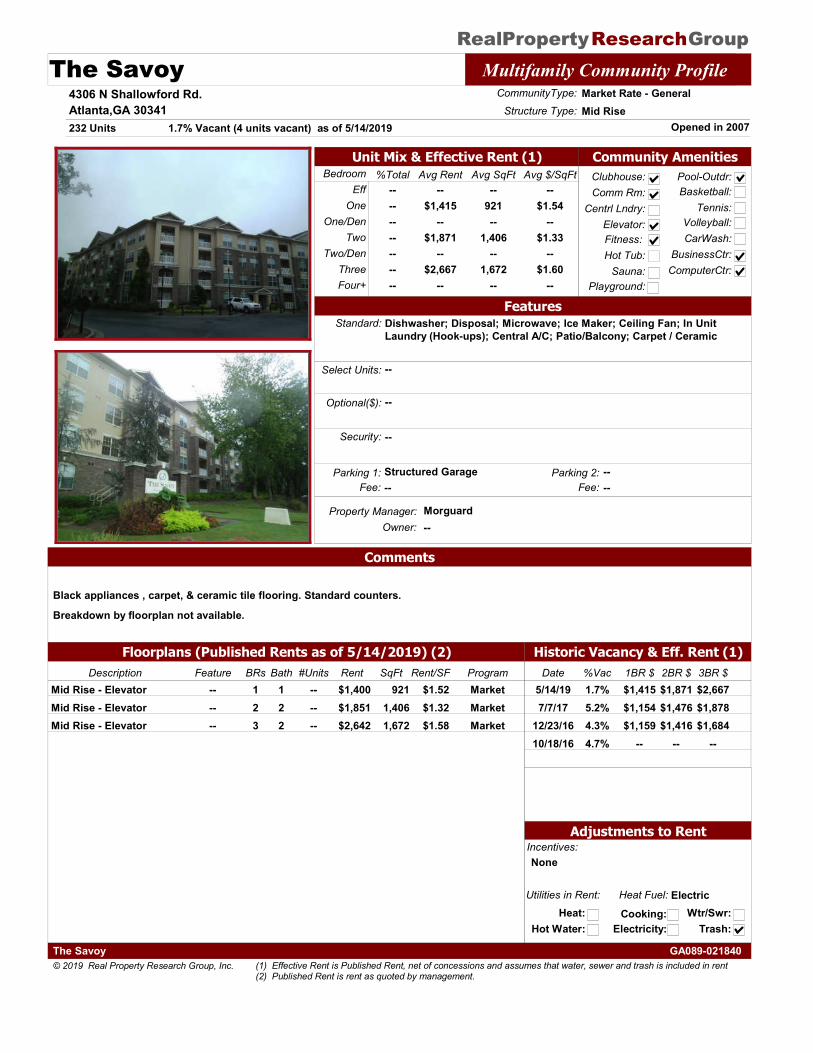
RealProperty Group Research The Savoy Multifamily Community Profile
4306 N Shallowford Rd.Atlanta,GA 30341
Property Manager: Morguard
Opened in 2007
CommunityType: Market Rate - General
232 UnitsStructure Type: Mid Rise
Owner: --
Historic Vacancy & Eff. Rent (1)
Bedroom Avg $/SqFtAvg SqFt%Total Avg RentEff
One
Two
ThreeFour+
One/Den
Two/Den
--$1,415
--$1,871
--$2,667
--
--921--
1,406--
1,672--
--$1.54
--$1.33
--$1.60
--
--------------
Utilities in Rent:
Heat:Heat Fuel: Electric
Hot Water:Cooking:
Electricity:Wtr/Swr:
Trash:
Community AmenitiesClubhouse:Comm Rm:
Centrl Lndry:
Fitness: Hot Tub:
Sauna:
Pool-Outdr:
Playground:
Basketball:Tennis:
Volleyball:CarWash:
BusinessCtr:ComputerCtr:
Floorplans (Published Rents as of 5/14/2019) (2)
Elevator:
1.7% Vacant (4 units vacant) as of 5/14/2019
FeaturesStandard: Dishwasher; Disposal; Microwave; Ice Maker; Ceiling Fan; In Unit
Laundry (Hook-ups); Central A/C; Patio/Balcony; Carpet / Ceramic
Select Units: --
Optional($): --
Incentives:None
Security: --
Unit Mix & Effective Rent (1)
Adjustments to Rent
Parking 1: Structured Garage
Comments
Black appliances , carpet, & ceramic tile flooring. Standard counters.
Breakdown by floorplan not available.
Parking 2: --Fee: -- Fee: --
Date %Vac 1BR $ 2BR $ 3BR $1.7%5/14/19 $1,415 $1,871 $2,6675.2%7/7/17 $1,154 $1,476 $1,8784.3%12/23/16 $1,159 $1,416 $1,6844.7%10/18/16 -- -- --
Description BRs Bath Rent SqFt ProgramRent/SF#UnitsFeature1 1Mid Rise - Elevator $1,400 921 Market$1.52----2 2Mid Rise - Elevator $1,851 1,406 Market$1.32----3 2Mid Rise - Elevator $2,642 1,672 Market$1.58----
© 2019 Real Property Research Group, Inc. GA089-021840The Savoy
(1) Effective Rent is Published Rent, net of concessions and assumes that water, sewer and trash is included in rent (2) Published Rent is rent as quoted by management.
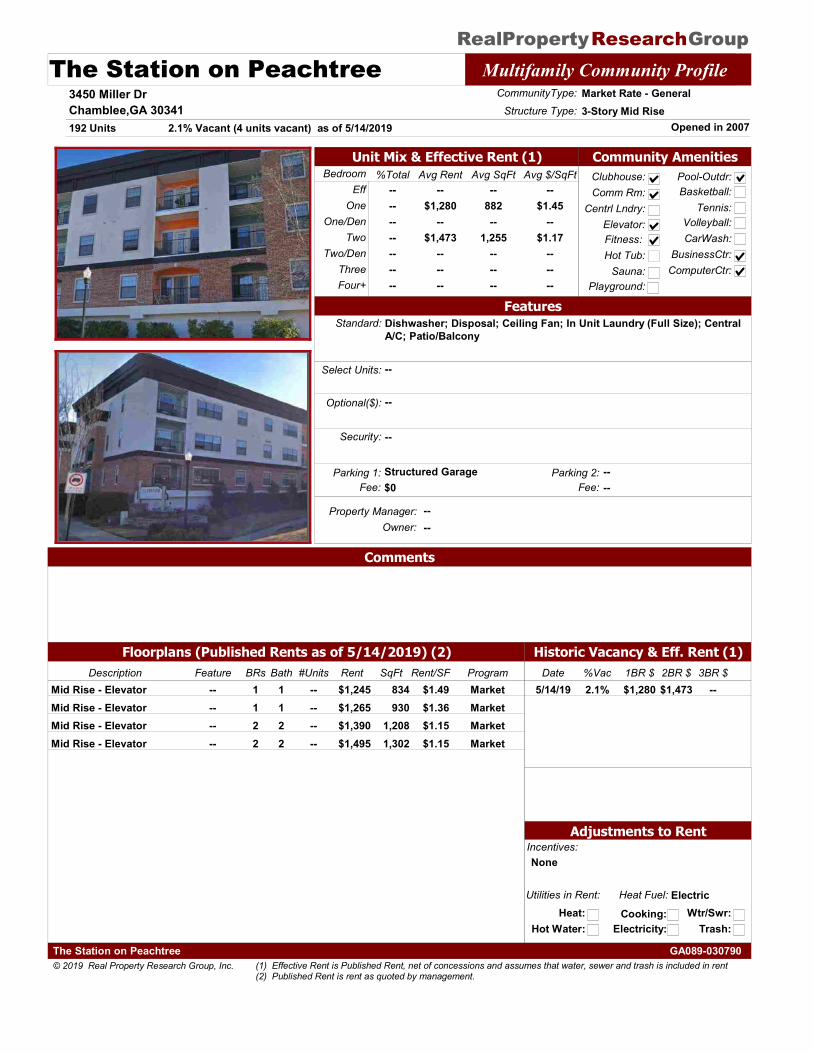
RealProperty Group Research The Station on Peachtree Multifamily Community Profile
3450 Miller DrChamblee,GA 30341
Property Manager: --
Opened in 2007
CommunityType: Market Rate - General
192 UnitsStructure Type: 3-Story Mid Rise
Owner: --
Historic Vacancy & Eff. Rent (1)
Bedroom Avg $/SqFtAvg SqFt%Total Avg RentEff
One
Two
ThreeFour+
One/Den
Two/Den
--$1,280
--$1,473
------
--882--
1,255------
--$1.45
--$1.17
------
--------------
Utilities in Rent:
Heat:Heat Fuel: Electric
Hot Water:Cooking:
Electricity:Wtr/Swr:
Trash:
Community AmenitiesClubhouse:Comm Rm:
Centrl Lndry:
Fitness: Hot Tub:
Sauna:
Pool-Outdr:
Playground:
Basketball:Tennis:
Volleyball:CarWash:
BusinessCtr:ComputerCtr:
Floorplans (Published Rents as of 5/14/2019) (2)
Elevator:
2.1% Vacant (4 units vacant) as of 5/14/2019
FeaturesStandard: Dishwasher; Disposal; Ceiling Fan; In Unit Laundry (Full Size); Central
A/C; Patio/Balcony
Select Units: --
Optional($): --
Incentives:None
Security: --
Unit Mix & Effective Rent (1)
Adjustments to Rent
Parking 1: Structured Garage
Comments
Parking 2: --Fee: $0 Fee: --
Date %Vac 1BR $ 2BR $ 3BR $2.1%5/14/19 $1,280 $1,473 --
Description BRs Bath Rent SqFt ProgramRent/SF#UnitsFeature1 1Mid Rise - Elevator $1,245 834 Market$1.49----1 1Mid Rise - Elevator $1,265 930 Market$1.36----2 2Mid Rise - Elevator $1,390 1,208 Market$1.15----2 2Mid Rise - Elevator $1,495 1,302 Market$1.15----
© 2019 Real Property Research Group, Inc. GA089-030790The Station on Peachtree
(1) Effective Rent is Published Rent, net of concessions and assumes that water, sewer and trash is included in rent (2) Published Rent is rent as quoted by management.
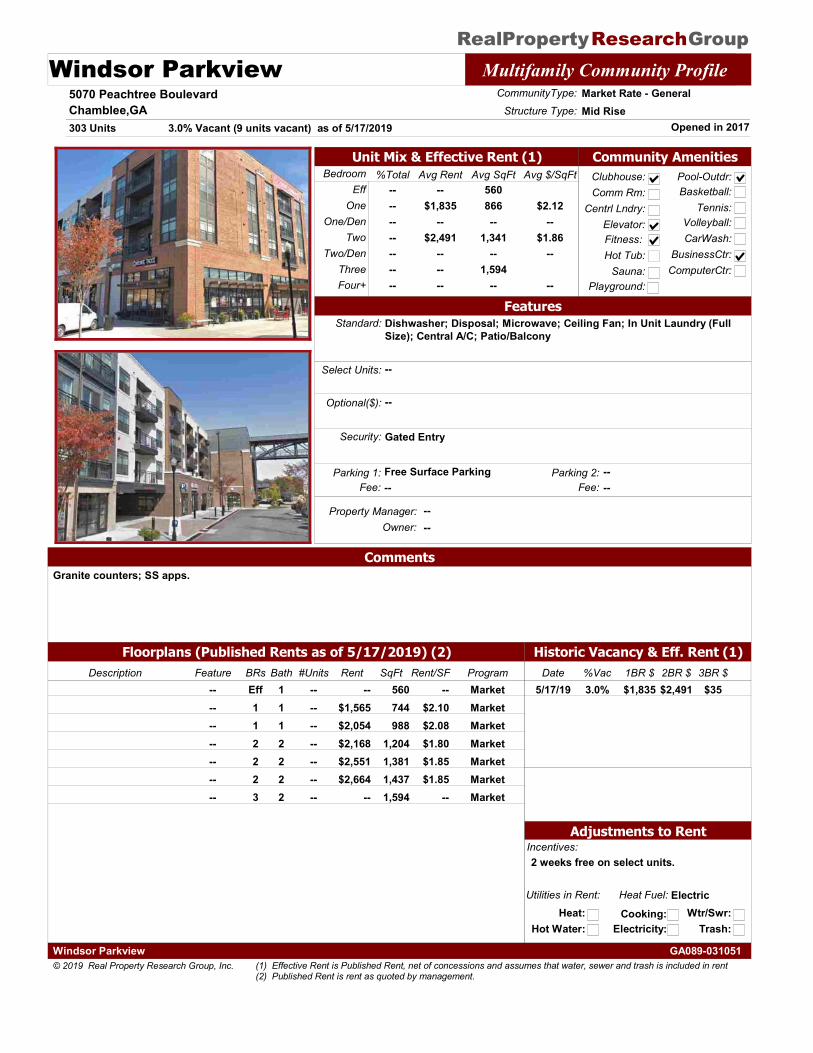
RealProperty Group Research Windsor Parkview Multifamily Community Profile
5070 Peachtree BoulevardChamblee,GA
Property Manager: --
Opened in 2017
CommunityType: Market Rate - General
303 UnitsStructure Type: Mid Rise
Owner: --
Historic Vacancy & Eff. Rent (1)
Bedroom Avg $/SqFtAvg SqFt%Total Avg RentEff
One
Two
ThreeFour+
One/Den
Two/Den
--$1,835
--$2,491
------
560866--
1,341--
1,594--
$2.12--
$1.86--
--
--------------
Utilities in Rent:
Heat:Heat Fuel: Electric
Hot Water:Cooking:
Electricity:Wtr/Swr:
Trash:
Community AmenitiesClubhouse:Comm Rm:
Centrl Lndry:
Fitness: Hot Tub:
Sauna:
Pool-Outdr:
Playground:
Basketball:Tennis:
Volleyball:CarWash:
BusinessCtr:ComputerCtr:
Floorplans (Published Rents as of 5/17/2019) (2)
Elevator:
3.0% Vacant (9 units vacant) as of 5/17/2019
FeaturesStandard: Dishwasher; Disposal; Microwave; Ceiling Fan; In Unit Laundry (Full
Size); Central A/C; Patio/Balcony
Select Units: --
Optional($): --
Incentives:2 weeks free on select units.
Security: Gated Entry
Unit Mix & Effective Rent (1)
Adjustments to Rent
Parking 1: Free Surface Parking
CommentsGranite counters; SS apps.
Parking 2: --Fee: -- Fee: --
Date %Vac 1BR $ 2BR $ 3BR $3.0%5/17/19 $1,835 $2,491 $35
Description BRs Bath Rent SqFt ProgramRent/SF#UnitsFeatureEff 1 -- 560 Market------1 1 $1,565 744 Market$2.10----1 1 $2,054 988 Market$2.08----2 2 $2,168 1,204 Market$1.80----2 2 $2,551 1,381 Market$1.85----2 2 $2,664 1,437 Market$1.85----3 2 -- 1,594 Market------
© 2019 Real Property Research Group, Inc. GA089-031051Windsor Parkview
(1) Effective Rent is Published Rent, net of concessions and assumes that water, sewer and trash is included in rent (2) Published Rent is rent as quoted by management.
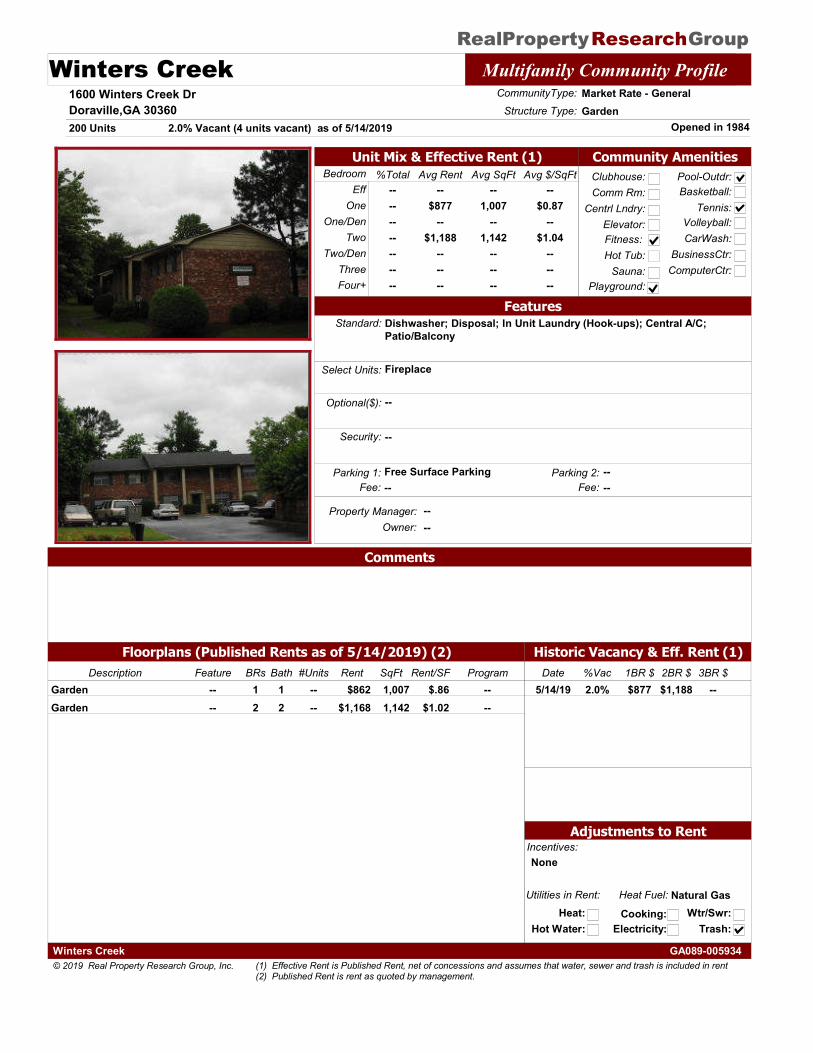
RealProperty Group Research Winters Creek Multifamily Community Profile
1600 Winters Creek DrDoraville,GA 30360
Property Manager: --
Opened in 1984
CommunityType: Market Rate - General
200 UnitsStructure Type: Garden
Owner: --
Historic Vacancy & Eff. Rent (1)
Bedroom Avg $/SqFtAvg SqFt%Total Avg RentEff
One
Two
ThreeFour+
One/Den
Two/Den
--$877
--$1,188
------
--1,007
--1,142
------
--$0.87
--$1.04
------
--------------
Utilities in Rent:
Heat:Heat Fuel: Natural Gas
Hot Water:Cooking:
Electricity:Wtr/Swr:
Trash:
Community AmenitiesClubhouse:Comm Rm:
Centrl Lndry:
Fitness: Hot Tub:
Sauna:
Pool-Outdr:
Playground:
Basketball:Tennis:
Volleyball:CarWash:
BusinessCtr:ComputerCtr:
Floorplans (Published Rents as of 5/14/2019) (2)
Elevator:
2.0% Vacant (4 units vacant) as of 5/14/2019
FeaturesStandard: Dishwasher; Disposal; In Unit Laundry (Hook-ups); Central A/C;
Patio/Balcony
Select Units: Fireplace
Optional($): --
Incentives:None
Security: --
Unit Mix & Effective Rent (1)
Adjustments to Rent
Parking 1: Free Surface Parking
Comments
Parking 2: --Fee: -- Fee: --
Date %Vac 1BR $ 2BR $ 3BR $2.0%5/14/19 $877 $1,188 --
Description BRs Bath Rent SqFt ProgramRent/SF#UnitsFeature1 1Garden $862 1,007 --$.86----2 2Garden $1,168 1,142 --$1.02----
© 2019 Real Property Research Group, Inc. GA089-005934Winters Creek
(1) Effective Rent is Published Rent, net of concessions and assumes that water, sewer and trash is included in rent (2) Published Rent is rent as quoted by management.
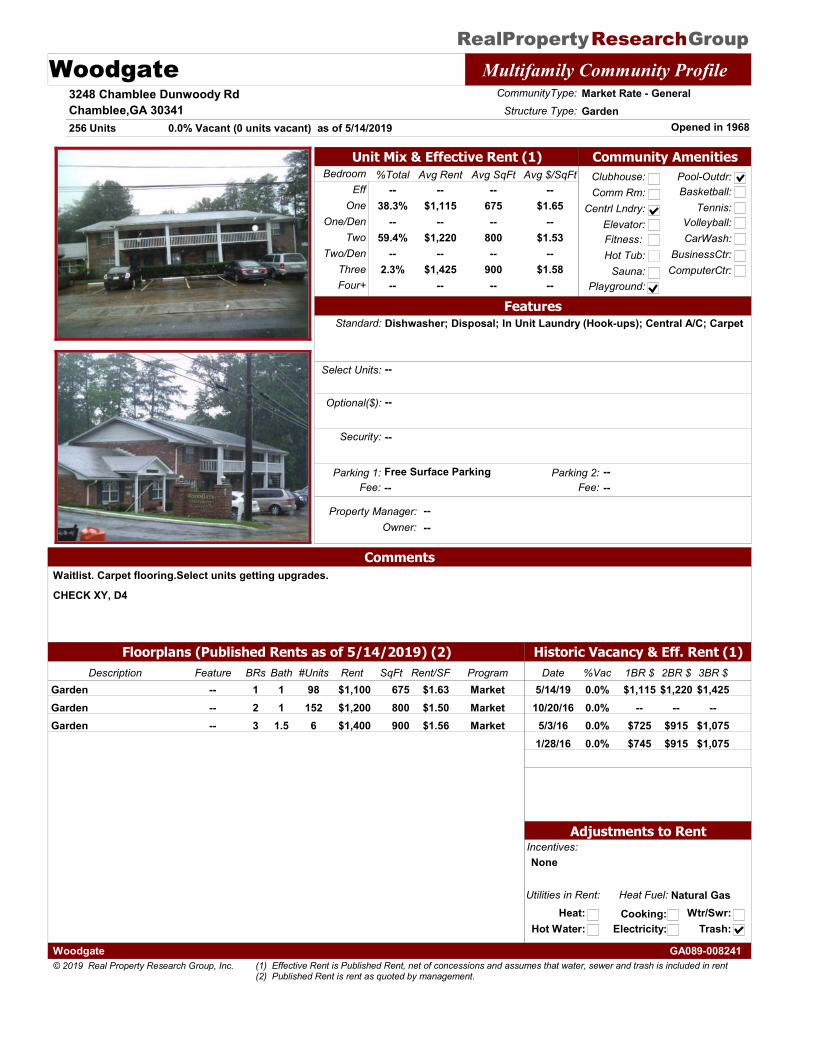
RealProperty Group Research Woodgate Multifamily Community Profile
3248 Chamblee Dunwoody RdChamblee,GA 30341
Property Manager: --
Opened in 1968
CommunityType: Market Rate - General
256 UnitsStructure Type: Garden
Owner: --
Historic Vacancy & Eff. Rent (1)
Bedroom Avg $/SqFtAvg SqFt%Total Avg RentEff
One
Two
ThreeFour+
One/Den
Two/Den
--$1,115
--$1,220
--$1,425
--
--675--
800--
900--
--$1.65
--$1.53
--$1.58
--
--38.3%
--59.4%
--2.3%
--
Utilities in Rent:
Heat:Heat Fuel: Natural Gas
Hot Water:Cooking:
Electricity:Wtr/Swr:
Trash:
Community AmenitiesClubhouse:Comm Rm:
Centrl Lndry:
Fitness: Hot Tub:
Sauna:
Pool-Outdr:
Playground:
Basketball:Tennis:
Volleyball:CarWash:
BusinessCtr:ComputerCtr:
Floorplans (Published Rents as of 5/14/2019) (2)
Elevator:
0.0% Vacant (0 units vacant) as of 5/14/2019
FeaturesStandard: Dishwasher; Disposal; In Unit Laundry (Hook-ups); Central A/C; Carpet
Select Units: --
Optional($): --
Incentives:None
Security: --
Unit Mix & Effective Rent (1)
Adjustments to Rent
Parking 1: Free Surface Parking
CommentsWaitlist. Carpet flooring.Select units getting upgrades.
CHECK XY, D4
Parking 2: --Fee: -- Fee: --
Date %Vac 1BR $ 2BR $ 3BR $0.0%5/14/19 $1,115 $1,220 $1,4250.0%10/20/16 -- -- --0.0%5/3/16 $725 $915 $1,0750.0%1/28/16 $745 $915 $1,075
Description BRs Bath Rent SqFt ProgramRent/SF#UnitsFeature1 1Garden $1,100 675 Market$1.6398--2 1Garden $1,200 800 Market$1.50152--3 1.5Garden $1,400 900 Market$1.566--
© 2019 Real Property Research Group, Inc. GA089-008241Woodgate
(1) Effective Rent is Published Rent, net of concessions and assumes that water, sewer and trash is included in rent (2) Published Rent is rent as quoted by management.
Related Documents