U.S. | 4Q | 2014

Welcome message from author
This document is posted to help you gain knowledge. Please leave a comment to let me know what you think about it! Share it to your friends and learn new things together.
Transcript

Venture Capital Report
U.S. | 4Q | 2014

Venture Capital Report The following report presents Dow Jones VentureSource’s quarterly findings for U.S. venture capital fundraising, investment, valuation, and liquidity. The included charts and graphs offer a comprehensive view of the trends currently affecting the venture capital market. Highlights for 4Q 2014 include: U.S. venture capital fundraising rose both in number of funds and amount invested; Venture capital investment into U.S. companies experienced a quarter-over-quarter increase;
Median pre-money valuation increased 30% from 3Q 2014 and more than doubled the 2013 value; Amounts raised through both Initial public offerings (IPOs) and mergers and acquisitions (M&As) experienced an increase from the previous quarter.
2
Venture Capital Report
U.S. VC Fundraising (2011 – 2014) Based on multiple closings
Venture Fundraising Increases in U.S. during 4Q 2014 85 funds garnered $8.1 billion in 4Q 2014, a 25% increase in the amount raised and also a 4% rise in number of funds from the prior quarter. Venture capital funds have raised a total of almost $33 billion across 332 funds in 2014, up 62% from the total amount raised in 2013 and 27% in number of funds. Tiger Global Private Investment Partners IX LP was the largest U.S. venture capital fund of 4Q 2014 raising $2.5 billion and accounting for 31% of the total amount raised during the quarter. Median U.S. fund size was $110 million in 2014.
FUNDRAISING
3
4Q'11 1Q'12 2Q'12 3Q'12 4Q'12 1Q'13 2Q'13 3Q'13 4Q'13 1Q'14 2Q'14 3Q'14 4Q'14 Amount Raised ($B) $7.23 $7.45 $6.57 $5.03 $3.07 $4.60 $6.69 $4.03 $5.03 $10.4 $7.98 $6.48 $8.13
Number of Funds 56 55 46 54 57 59 56 64 82 83 82 82 85
0
10
20
30
40
50
60
70
80
90
$0.00
$2.00
$4.00
$6.00
$8.00
$10.00
$12.00

Venture Capital Report Largest VC Funds Raised in 4Q 2014
Firm Name Fund Name Amount ($M) City State Offering Status Fund Type Fund Category Closing Type
Tiger Global Management LLC Tiger Global Private Investment Partners IX LP $2,500.00 New York NY Closed MulD-‐stage
venture capital
Venture Capital Final
Canaan Partners Canaan X LP $675.00 Menlo Park CA Open Early-‐stage venture capital
Venture Capital First
FormaDon8 Partners LLC FormaDon8 Partners Fund II LP $500.00 San Francisco CA Closed Early-‐stage venture
capital
Venture Capital Final
Polaris Partners Polaris Partners VII LP $465.00 Waltham MA Closed MulD-‐stage venture capital
Venture Capital Final
Vivo Capital Vivo Capital Fund VIII LP $427.65 Palo Alto CA Closed MulD-‐stage venture capital
Venture Capital Final
FUNDRAISING
4
Venture Capital Report
FINANCING
Equity Financings into U.S. – based, VC-backed Companies (2011 – 2014)
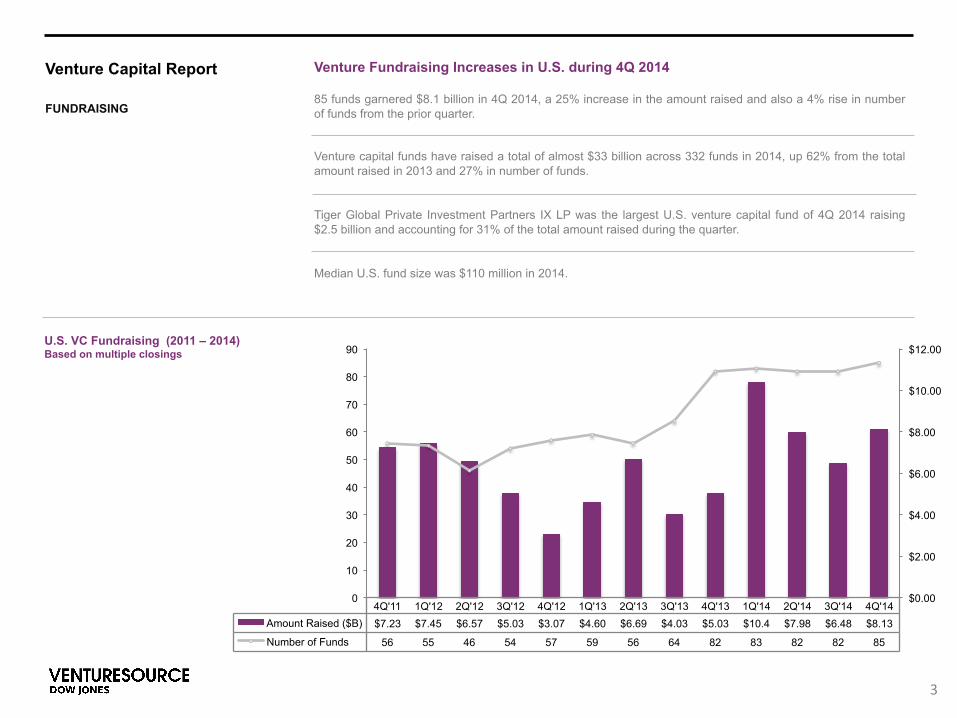
U.S. Venture Investment on the Rise in 4Q 2014 U.S.-based companies raised $13.8 billion from 814 venture capital deals in 4Q 2014, an increase in capital (24%) despite deal flow dropping 12% from the previous quarter. Compared to the same period in 2013, number of deals decreased 20%, while amount invested registered a 44% increase. In 2014, 3682 deals have been completed raising $52 billion, a respective 4% decrease and 47% increase on figures posted in 2013.
5
4Q'11 1Q'12 2Q'12 3Q'12 4Q'12 1Q'13 2Q'13 3Q'13 4Q'13 1Q'14 2Q'14 3Q'14 4Q'14 Amount Raised ($B) $8.19 $7.76 $9.62 $7.99 $9.27 $7.63 $8.73 $9.47 $9.64 $12.09 $15.00 $11.19 $13.84
Number of Deals 918 898 1018 937 932 913 953 958 1013 945 995 928 814
0
200
400
600
800
1000
1200
$0.00
$2.00
$4.00
$6.00
$8.00
$10.00
$12.00
$14.00
$16.00
Venture Capital Report
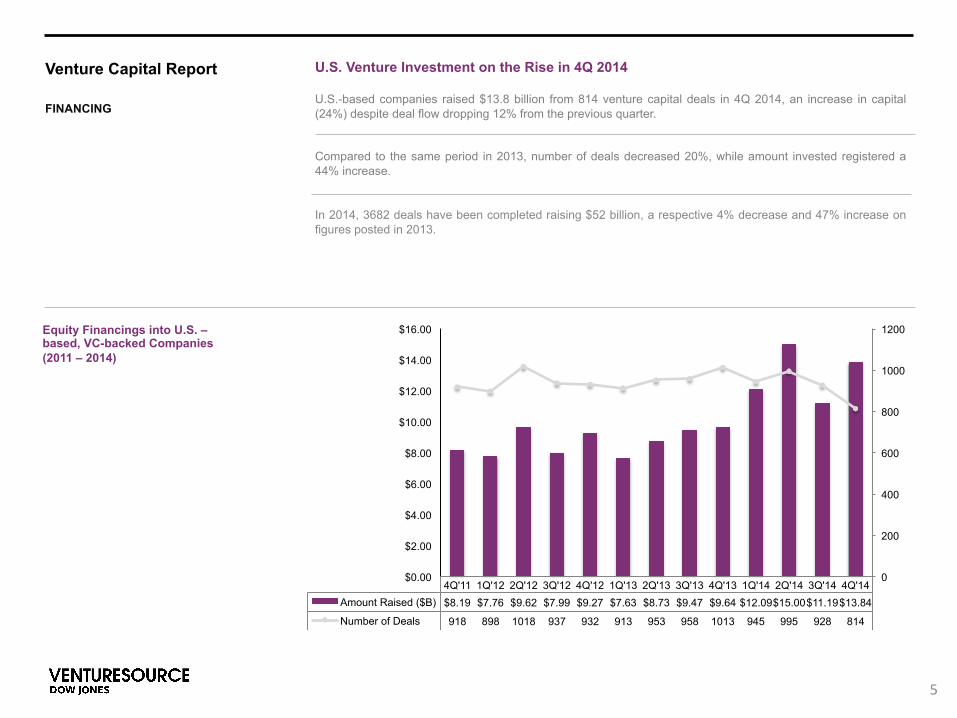
Equity Financings into U.S.–based, VC–backed Companies, by Round Class (Quarter over Quarter, 2011 – 2014) Number of Deals
FINANCING
6
4Q'11 1Q'12 2Q'12 3Q'12 4Q'12 1Q'13 2Q'13 3Q'13 4Q'13 1Q'14 2Q'14 3Q'14 4Q'14 Restart 11 11 14 11 18 7 7 8 10 8 8 6 6
Later 290 253 307 286 283 264 284 275 281 289 349 287 283
Second 150 142 181 146 160 146 203 197 210 184 218 194 166
First 319 309 354 325 313 340 308 332 368 318 329 340 292
Seed 104 138 121 122 108 121 120 108 91 102 55 67 40
0
100
200
300
400

Venture Capital Report
Equity Financings into U.S.–based, VC–backed Companies, by Round Class (Year over Year, 2004 – 2014 ) Number of Deals
FINANCING
7
2004 2005 2006 2007 2008 2009 2010 2011 2012 2013 2014 Restart 177 175 147 118 100 95 63 62 54 32 28
Later 789 826 902 952 937 965 1110 1144 1129 1104 1208
Second 492 487 593 601 628 643 628 630 629 756 762
First 723 863 911 1114 1091 788 970 1228 1301 1348 1279
Seed 105 106 168 215 207 181 267 447 489 440 264
0 100 200 300 400 500 600 700 800 900
1000 1100 1200 1300 1400 1500
Venture Capital Report
FINANCING
8
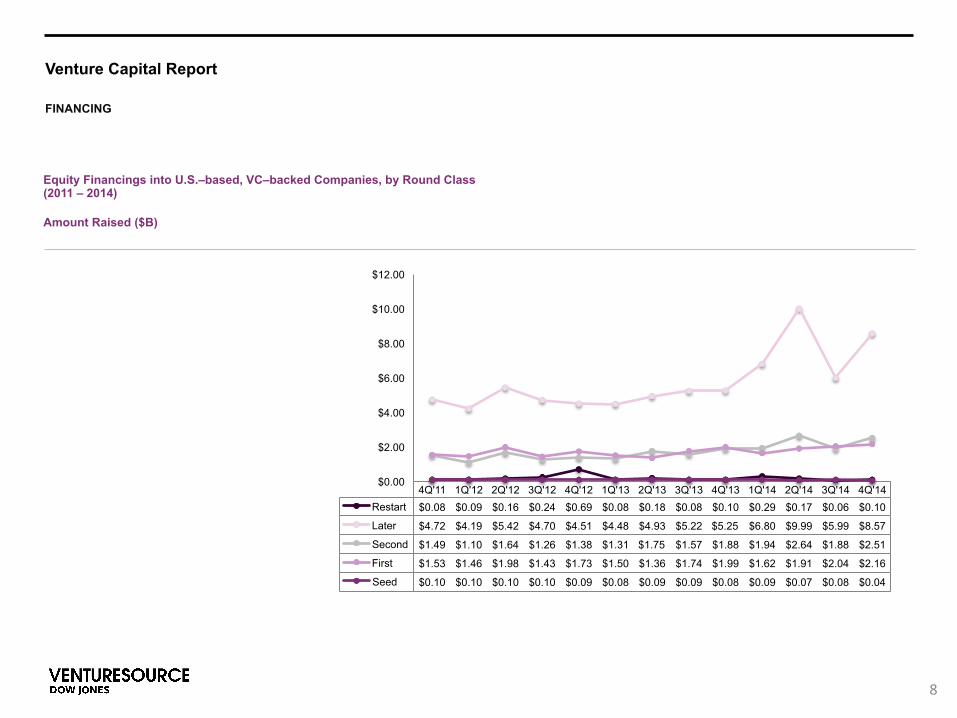
Equity Financings into U.S.–based, VC–backed Companies, by Round Class (2011 – 2014) Amount Raised ($B)
4Q'11 1Q'12 2Q'12 3Q'12 4Q'12 1Q'13 2Q'13 3Q'13 4Q'13 1Q'14 2Q'14 3Q'14 4Q'14 Restart $0.08 $0.09 $0.16 $0.24 $0.69 $0.08 $0.18 $0.08 $0.10 $0.29 $0.17 $0.06 $0.10
Later $4.72 $4.19 $5.42 $4.70 $4.51 $4.48 $4.93 $5.22 $5.25 $6.80 $9.99 $5.99 $8.57
Second $1.49 $1.10 $1.64 $1.26 $1.38 $1.31 $1.75 $1.57 $1.88 $1.94 $2.64 $1.88 $2.51
First $1.53 $1.46 $1.98 $1.43 $1.73 $1.50 $1.36 $1.74 $1.99 $1.62 $1.91 $2.04 $2.16
Seed $0.10 $0.10 $0.10 $0.10 $0.09 $0.08 $0.09 $0.09 $0.08 $0.09 $0.07 $0.08 $0.04
$0.00
$2.00
$4.00
$6.00
$8.00
$10.00
$12.00
Venture Capital Report
FINANCING
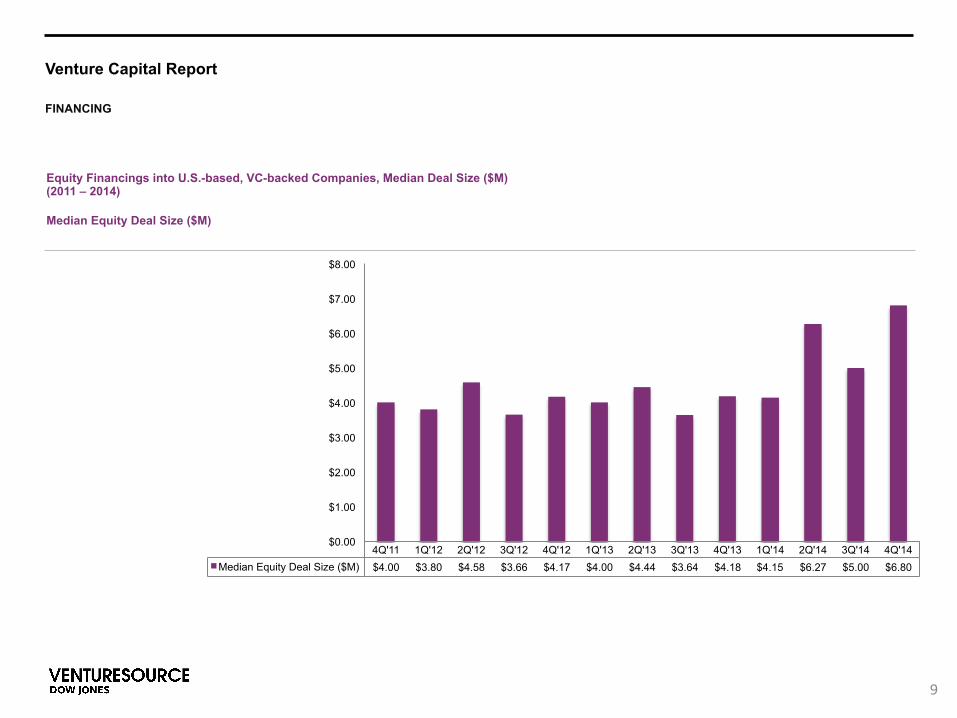
Equity Financings into U.S.-based, VC-backed Companies, Median Deal Size ($M) (2011 – 2014) Median Equity Deal Size ($M)
9
4Q'11 1Q'12 2Q'12 3Q'12 4Q'12 1Q'13 2Q'13 3Q'13 4Q'13 1Q'14 2Q'14 3Q'14 4Q'14 Median Equity Deal Size ($M) $4.00 $3.80 $4.58 $3.66 $4.17 $4.00 $4.44 $3.64 $4.18 $4.15 $6.27 $5.00 $6.80
$0.00
$1.00
$2.00
$3.00
$4.00
$5.00
$6.00
$7.00
$8.00
Venture Capital Report
23%
2%
27% 4%
18%
2%
24%
Business and Financial Services
Consumer Goods
Consumer Services
Energy & Utilities
Healthcare
Industrial Goods & Materials
Information Technology
206
25
159
13 143
23
245
Business and Financial Services
Consumer Goods
Consumer Services
Energy & Utilities
Healthcare
Industrial Goods & Materials
Information Technology
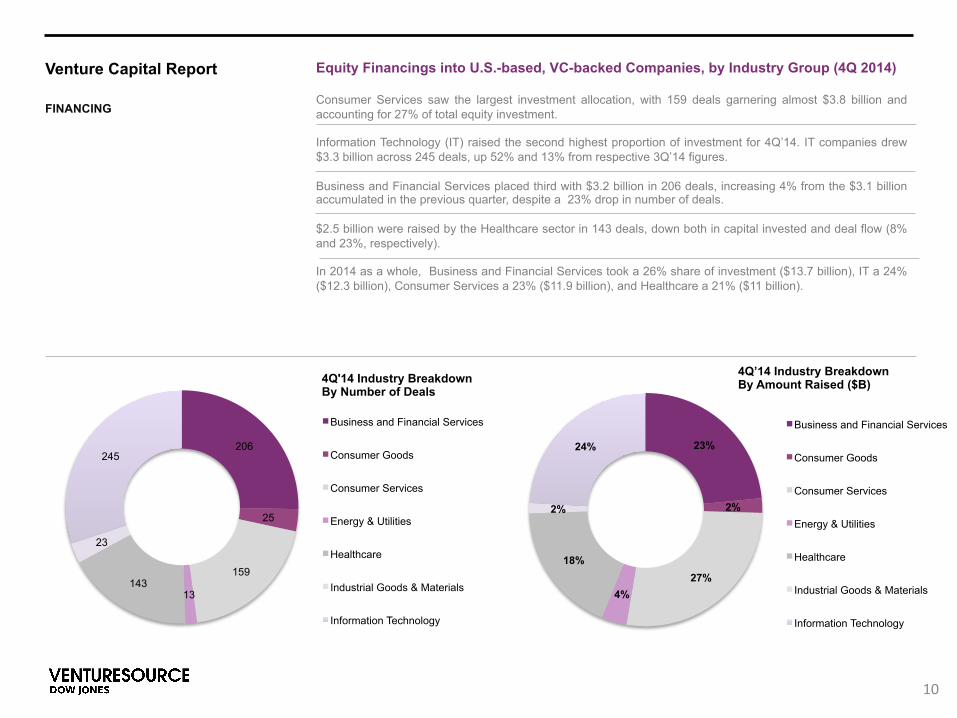
Equity Financings into U.S.-based, VC-backed Companies, by Industry Group (4Q 2014) Consumer Services saw the largest investment allocation, with 159 deals garnering almost $3.8 billion and accounting for 27% of total equity investment. Information Technology (IT) raised the second highest proportion of investment for 4Q’14. IT companies drew $3.3 billion across 245 deals, up 52% and 13% from respective 3Q’14 figures. Business and Financial Services placed third with $3.2 billion in 206 deals, increasing 4% from the $3.1 billion accumulated in the previous quarter, despite a 23% drop in number of deals. $2.5 billion were raised by the Healthcare sector in 143 deals, down both in capital invested and deal flow (8% and 23%, respectively). In 2014 as a whole, Business and Financial Services took a 26% share of investment ($13.7 billion), IT a 24% ($12.3 billion), Consumer Services a 23% ($11.9 billion), and Healthcare a 21% ($11 billion).
4Q'14 Industry Breakdown By Number of Deals
4Q’14 Industry Breakdown By Amount Raised ($B)
FINANCING
10

Venture Capital Report
26%
2%
23% 2%
21%
2%
24%
Business and Financial Services
Consumer Goods
Consumer Services
Energy & Utilities
Healthcare
Industrial Goods & Materials
Information Technology
991
135
700 58
731
91
966
Business and Financial Services
Consumer Goods
Consumer Services
Energy & Utilities
Healthcare
Industrial Goods & Materials
Information Technology
Equity Financings into U.S.-based, VC-backed Companies, by Industry Group (2014)
2014 Industry Breakdown By Number of Deals
2014 Industry Breakdown By Amount Raised ($B)
FINANCING
11

Venture Capital Report
Co. Name Loca@on Industry Group
Industry Segment Industry Code Brief Descrip@on Close Date Round Type Raised
($M) Round Investors (* denotes lead)
Uber Technologies
Inc.
San Francisco, CA
Consumer Services Travel and Leisure TransportaDon
Services
Provider of an on-‐demand transportaDon service
plaYorm. 12/4/2014 6th $1200.00
Lone Pine Capital, New Enterprise Associates Inc., Qatar Investment Authority, Valiant Capital Management
LP
Magic Leap Inc.
Dania Beach, FL
InformaDon Technology
Electronics and Computer Hardware
Displays Developer of an
augmented reality visual compuDng system.
10/21/2014 2nd $542.00
Andreessen Horowitz, Google Inc.*, Kleiner Perkins Caufield
& Byers, Kohlberg Kravis Roberts & Co. LP, Legendary Entertainment Inc., Obvious Ventures Management LLC,
Qualcomm Inc., Vulcan Capital
Snapchat Inc. Venice, CA Consumer Services
Consumer InformaDon Services
Email/Messaging Provider of an ephemeral
messaging mobile applicaDon.
12/31/2014 4th $485.63 Kleiner Perkins Caufield & Byers*, Yahoo!
WeWork Companies Inc. New York, NY
Business and Financial Services
Financial InsDtuDons and
Services Real Estate Provider of shared office
space. 12/15/2014 Later $355.00
Benchmark Capital, Goldman Sachs Group Inc.*, Harvard Management Co., JPMorgan Chase & Co., T. Rowe Price Group Inc.*, Wellington Management Co. LLP*
Sunnova Energy Corp. Houston, TX Energy and
UDliDes Renewable Energy Solar Energy Provider of residenDal solar services.
11/20/2014 First Round $250.00 Franklin Square Capital Partners*, Triangle Peak
Partners LP
Top 5 Deals into VC-backed Companies (4Q 2014)
FINANCING
12

Venture Capital Report
Most Active Investors for U.S.-based, VC-backed Companies (4Q 2014)
FINANCING
13
21 20
18 17
15
0
5
10
15
20
25
New Enterprise Associates Inc.
Khosla Ventures Andreessen Horowitz Kleiner Perkins Caufield & Byers
Sequoia Capital
Venture Capital Report
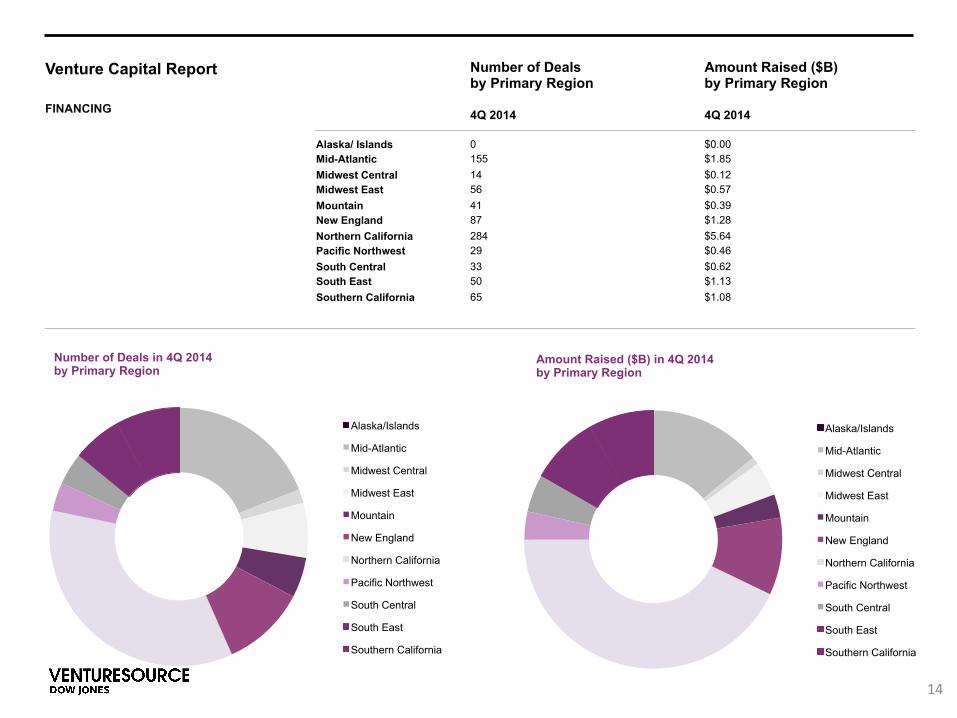
Amount Raised ($B) in 4Q 2014 by Primary Region
Number of Deals by Primary Region 4Q 2014 0 155 14 56 41 87 284 29 33 50 65
Alaska/ Islands Mid-Atlantic Midwest Central Midwest East Mountain New England Northern California Pacific Northwest South Central South East Southern California
Amount Raised ($B) by Primary Region 4Q 2014 $0.00 $1.85 $0.12 $0.57 $0.39 $1.28 $5.64 $0.46 $0.62 $1.13 $1.08
Alaska/Islands
Mid-Atlantic
Midwest Central
Midwest East
Mountain
New England
Northern California
Pacific Northwest
South Central
South East
Southern California
Number of Deals in 4Q 2014 by Primary Region
FINANCING
14
Alaska/Islands
Mid-Atlantic
Midwest Central
Midwest East
Mountain
New England
Northern California
Pacific Northwest
South Central
South East
Southern California

Venture Capital Report
$0.42
$0.08
$0.13
$0.40
$0.12
$0.16
$0.78
$0.33
$1.33
$1.11
$5.63
Chicago Metro
Dallas-Fort Worth
Austin Metro
Seattle Metro
Orange County
San Diego Metro
Los Angeles Metro
Potomac
New York Metro
Boston Metro
San Francisco Bay Area
Amount Raised ($B) by subregion
Subregion Breakout Amount Raised ($B)
Number of Deals by subregion 4Q 2014
Amount Raised ($B) by subregion 4Q 2014
Subregion Breakout Number of Deals
22
12
10
21
14
17
33
28
104
78
281
Chicago Metro
Dallas-Fort Worth
Austin Metro
Seattle Metro
Orange County
San Diego Metro
Los Angeles Metro
Potomac
New York Metro
Boston Metro
San Francisco Bay Area
Number of Deals by Subregion
FINANCING
15
San Francisco Bay Area 281 $5.63 Boston Metro 78 $1.11 New York Metro 104 $1.33 Potomac 28 $0.33 Los Angeles Metro 33 $0.78 San Diego Metro 17 $0.16 Orange County 14 $0.12 Seattle Metro 21 $0.40 Austin Metro 10 $0.13 Dallas-Fort Worth 12 $0.08 Chicago Metro 22 $0.42
Venture Capital Report
VALUATIONS
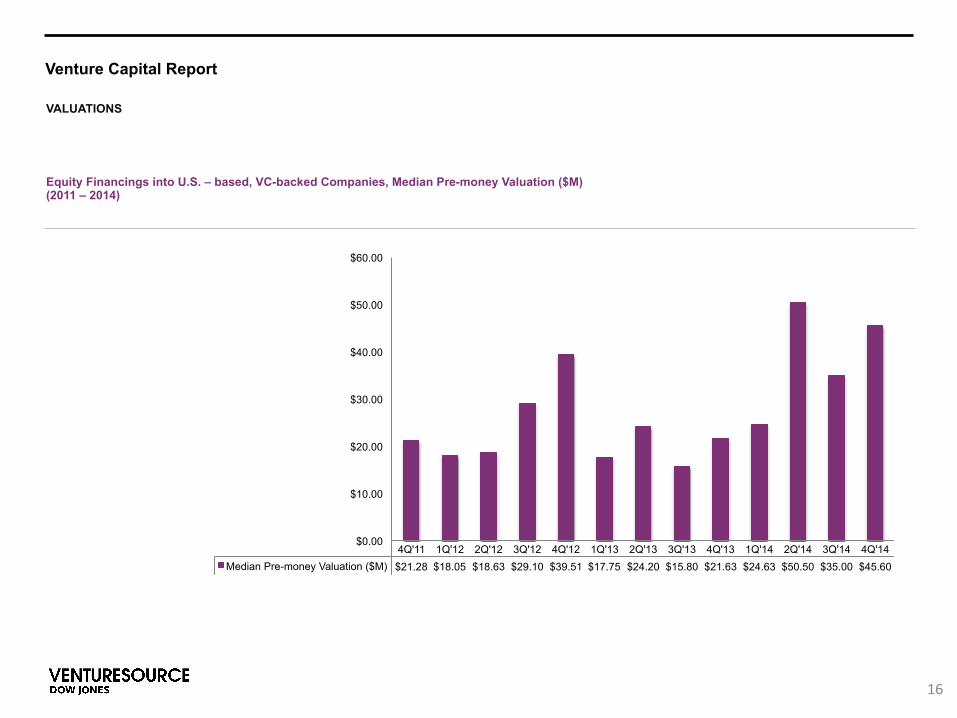
Equity Financings into U.S. – based, VC-backed Companies, Median Pre-money Valuation ($M) (2011 – 2014)
16
4Q'11 1Q'12 2Q'12 3Q'12 4Q'12 1Q'13 2Q'13 3Q'13 4Q'13 1Q'14 2Q'14 3Q'14 4Q'14 Median Pre-money Valuation ($M) $21.28 $18.05 $18.63 $29.10 $39.51 $17.75 $24.20 $15.80 $21.63 $24.63 $50.50 $35.00 $45.60
$0.00
$10.00
$20.00
$30.00
$40.00
$50.00
$60.00
Venture Capital Report
LIQUIDITY
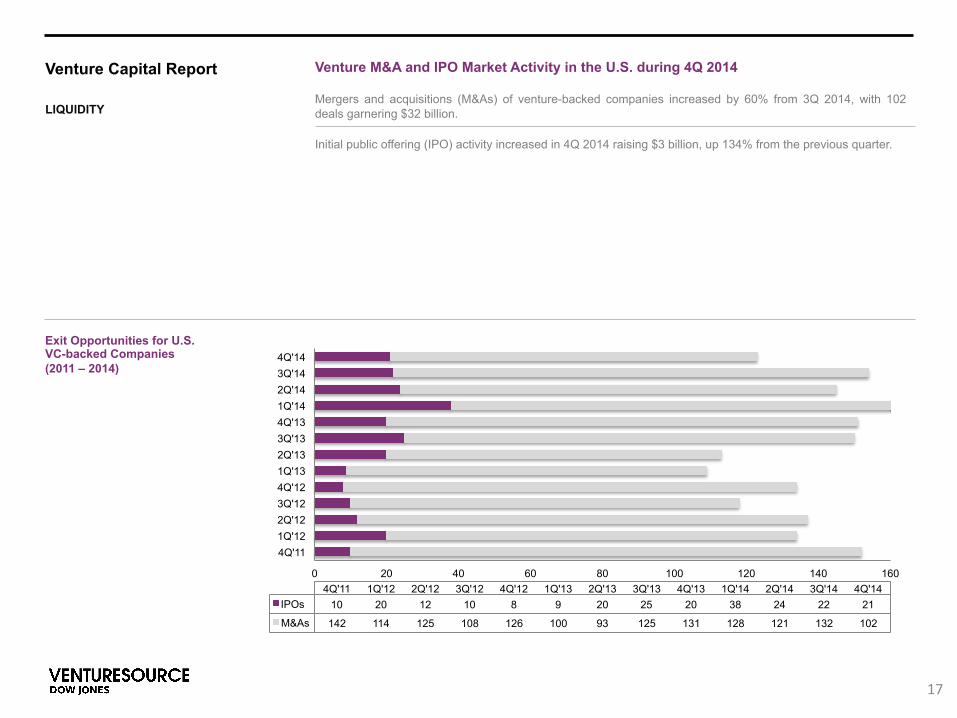
Exit Opportunities for U.S. VC-backed Companies (2011 – 2014)
Venture M&A and IPO Market Activity in the U.S. during 4Q 2014 Mergers and acquisitions (M&As) of venture-backed companies increased by 60% from 3Q 2014, with 102 deals garnering $32 billion. Initial public offering (IPO) activity increased in 4Q 2014 raising $3 billion, up 134% from the previous quarter.
17
0 20 40 60 80 100 120 140 160
4Q'11 1Q'12 2Q'12 3Q'12 4Q'12 1Q'13 2Q'13 3Q'13 4Q'13 1Q'14 2Q'14 3Q'14 4Q'14
4Q'11 1Q'12 2Q'12 3Q'12 4Q'12 1Q'13 2Q'13 3Q'13 4Q'13 1Q'14 2Q'14 3Q'14 4Q'14 IPOs 10 20 12 10 8 9 20 25 20 38 24 22 21
M&As 142 114 125 108 126 100 93 125 131 128 121 132 102

Venture Capital Report
U.S. VC-backed M&A Activity (2011 - 2014)
U.S. VC-backed M&As (2011-2014) 102 M&As raised $32 billion during 4Q 2014, a 60% increase in M&A valuations despite the number of deals decreasing 23% compared to the previous quarter, when 132 M&As garnered $20 billion. The largest M&A of the quarter was WhatsApp Inc., which was acquired by Facebook (NASDAQ: FB) for $19 billion. 483 M&As were completed for venture-backed companies in the U.S. during 2014, up 8% from the 449 completed during 2013 and 2% from the 473 seen during 2012.
LIQUIDITY
18
4Q'11 1Q'12 2Q'12 3Q'12 4Q'12 1Q'13 2Q'13 3Q'13 4Q'13 1Q'14 2Q'14 3Q'14 4Q'14 Amount Paid ($B) $9.66 $10.35 $11.77 $11.75 $8.49 $5.63 $9.15 $12.44 $14.09 $16.16 $11.15 $20.13 $32.31
Number of M&As 142 114 125 108 126 100 93 125 131 128 121 132 102
0
20
40
60
80
100
120
140
160
$0.00
$5.00
$10.00
$15.00
$20.00
$25.00
$30.00
$35.00
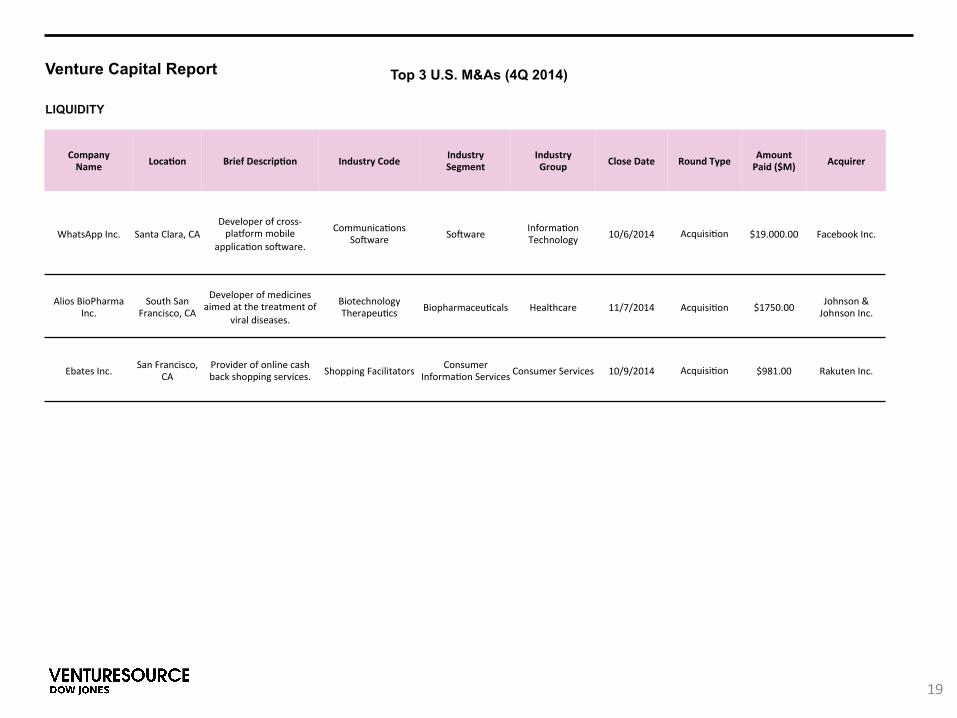
Venture Capital Report Top 3 U.S. M&As (4Q 2014)
Company Name Loca@on Brief Descrip@on Industry Code Industry
Segment Industry Group Close Date Round Type Amount
Paid ($M) Acquirer
WhatsApp Inc. Santa Clara, CA Developer of cross-‐plaYorm mobile
applicaDon soiware.
CommunicaDons Soiware Soiware InformaDon
Technology 10/6/2014 AcquisiDon $19.000.00 Facebook Inc.
Alios BioPharma Inc.
South San Francisco, CA
Developer of medicines aimed at the treatment of
viral diseases.
Biotechnology TherapeuDcs BiopharmaceuDcals Healthcare 11/7/2014 AcquisiDon $1750.00 Johnson &
Johnson Inc.
Ebates Inc. San Francisco, CA
Provider of online cash back shopping services. Shopping Facilitators Consumer
InformaDon Services Consumer Services 10/9/2014 AcquisiDon $981.00 Rakuten Inc.
LIQUIDITY
19

Venture Capital Report
U.S. VC-backed IPO Activity (2011 - 2014)
U.S. VC-backed IPOs (2011-2014) 21 venture-backed companies raised $3 billion through public offerings in 4Q 2014. Number of listings decreased by 5%, while capital raised more than doubled the amount from the previous quarter. The largest IPO of the quarter was LendingClub Corp. (NYSE: LC), which completed a $870 million IPO. 2014 saw the highest number of US VC-backed IPOs since 2000, when 210 were completed. During 2014,105 companies garnered a total of $9.2 billion, an increase of 42% and 12% from respective 2013 figures.
LIQUIDITY
20
4Q'11 1Q'12 2Q'12 3Q'12 4Q'12 1Q'13 2Q'13 3Q'13 4Q'13 1Q'14 2Q'14 3Q'14 4Q'14 Raised ($B) through IPO $2.37 $1.42 $7.75 $0.81 $1.22 $0.64 $1.80 $2.22 $3.55 $2.94 $1.96 $1.30 $3.04
Number of IPOs 10 20 12 10 8 9 20 25 20 38 24 22 21
0
5
10
15
20
25
30
35
40
$0.00
$1.00
$2.00
$3.00
$4.00
$5.00
$6.00
$7.00
$8.00
$9.00
Venture Capital Report
Company Name Loca@on Brief Descrip@on Industry Code Industry
Segment Industry Group Close Date Round
Type
Raised through IPO
($M) Exchange
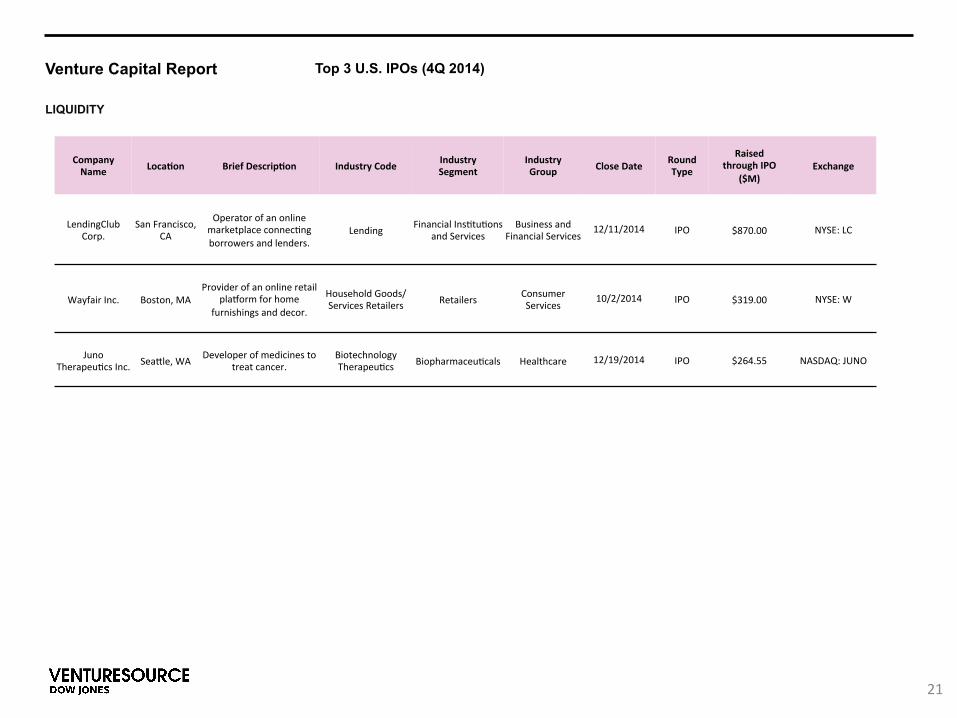
LendingClub Corp.
San Francisco, CA
Operator of an online marketplace connecDng borrowers and lenders.
Lending Financial InsDtuDons and Services
Business and Financial Services
12/11/2014 IPO $870.00 NYSE: LC
Wayfair Inc. Boston, MA Provider of an online retail
plaYorm for home furnishings and decor.
Household Goods/Services Retailers Retailers Consumer
Services 10/2/2014 IPO $319.00 NYSE: W
Juno TherapeuDcs Inc. Seakle, WA Developer of medicines to
treat cancer. Biotechnology TherapeuDcs BiopharmaceuDcals Healthcare 12/19/2014 IPO $264.55 NASDAQ: JUNO
Top 3 U.S. IPOs (4Q 2014)
LIQUIDITY
21

Venture Capital Report
ABOUT US
Dow Jones VentureSource helps venture capitalists, corporate development execu@ves, investment bankers and service providers find deal and partnership opportuni@es, perform comprehensive due diligence and examine trends in venture capital investment, fund-‐raising and liquidity. It provides accurate, comprehensive data on venture-‐backed companies – including their investors and execu@ves – in every region, industry and stage of development throughout the world. The investment figures included in this release are based on aggregate findings of Dow Jones' proprietary research and are contained in VentureSource. This data was collected through surveys of professional firms, interviews with company execu@ves, and from secondary sources. These venture capital sta@s@cs cover equity investments into early stage, innova@ve companies and do not include companies receiving funding solely from corporate, individual, and/or government investors. Figures contained throughout the report current at @me of editorial but are subject to change without no@ce. No statement herein is to be construed as a recommenda@on to buy or sell securi@es or to provide investment advice. About Dow Jones Dow Jones & Company is a global provider of news and business informaDon, delivering content to consumers and organizaDons via newspapers, Web sites, apps, video, newslekers, magazines, proprietary databases, conferences, and radio. Dow Jones has produced unrivaled quality content for 125 years and today has one of the world’s largest news-‐gathering operaDons with nearly 2,000 journalists in more than 80 bureaus, including The Wall Street Journal, America’s largest newspaper by paid circulaDon. Other premier brands include FacDva, Barron’s, MarketWatch, DJX, Dow Jones Risk & Compliance, Dow Jones Newswires, and Dow Jones VentureSource. Dow Jones publishes in 13 languages and distributes content in 28 languages, combining technology with news and data to support business decision making. The company pioneered the first successful paid online news site and its industry leading innovaDon enables it to serve customers wherever they may be, via the Web, mobile devices, Internet-‐connected televisions, and tablets. MEDIA CONTACT: Erin Maier 212.416.4874 [email protected]
22
Related Documents