Vending Nutrition Standards Nutrition Environment Measurement Survey-Vending Series Part 2 Speakers: Carol Voss, MEd, RDN, LDN Nutrition Coordinator Iowa Department of Public Health Teresa Smith, PhD, MS Postdoctoral Research Fellow Gretchen Swanson Center for Nutrition Facilitator: Vanessa Wielenga, MS, RD, LMNT Extension Program Coordinator-Healthy Retail University of Nebraska Lincoln Extension

Welcome message from author
This document is posted to help you gain knowledge. Please leave a comment to let me know what you think about it! Share it to your friends and learn new things together.
Transcript
Vending Nutrition StandardsNutrition Environment Measurement Survey-VendingSeries Part 2
Speakers: Carol Voss, MEd, RDN, LDN
Nutrition CoordinatorIowa Department of Public Health
Teresa Smith, PhD, MSPostdoctoral Research Fellow
Gretchen Swanson Center for Nutrition
Facilitator:Vanessa Wielenga, MS, RD, LMNT
Extension Program Coordinator-Healthy RetailUniversity of Nebraska Lincoln Extension
Objectives
• Participants will be able to understand what makes an item green, yellow, or red.
• Participants will be familiar with common snack items available in Nebraska and their nutrient profile.
• Participants' knowledge of the NEMS-V resources and tools will increase.

NUTRITION ENVIRONMENT MEASURES SURVEY –VENDING (NEMS -V)
Healthy Vending in the Work Place

Polling question #1
About what percentage of the choices in your snack machine would you consider “healthy”
0 - 10%
11 – 30%
31 – 50%
>50%

Nutrition Environment Measures Survey Vending - NEMS-V
Developed to assess workplace vending machines
Originally based on the Institute of Medicine’s Nutrition Standards for Foods in Schools with some modifications
Criteria has been updated to match Health and Sustainability Guidelines for Federal Concessions and Vending Operations (2012).
Intended to have an easy to use coding system: red, yellow and green
Voss, C, Klein, S, Glanz, K, Clawson, M. Nutrition Environment Measures Survey–
Vending: Development, Dissemination, and Reliability. Health Promotion Practice. 2012
13: 425

NEMS-V Coding
RED food and beverages are not as healthy and fall outside the Dietary Guidelines for Americans.
YELLOW food and beverages are healthy foods that meet the Dietary Guidelines, may provide a serving of fruit, vegetable, low-fat dairy or whole grain but does not meet the strictest sodium guidelines.
GREEN food and beverages are considered the healthiest, are consistent with the Dietary Guidelines for Americans, provide a serving of fruit, vegetable, low-fat dairy or whole grain and meet the strictest sodium guidelines.
NEMS-V Coding

Snack Criteria
≤ 200 calories per portion as packaged
No more than 35 percent of total calories from fat*
<10 percent of total calories from saturated fat*
zero trans fat
≤ 35 percent weight from total sugars
* Excludes nuts and seeds without added fats, oils or caloric sweeteners

Beverage Guidelines
Green Plain water without flavoring, additives, or carbonation
100% fruit or vegetable juice with less than or equal to 230 mg sodium per 8 oz. serving
Fat-free, 1% or 2 % unflavored milk
Yellow Flavored milk
Any other beverage with 40 calories or less per 8 oz. serving
Any beverage with between 230 mg and 400 mg sodium per 8 oz. serving
Red – whole milk; any beverage > 40 calories/8 oz. and > 400 mg sodium per 8 oz.
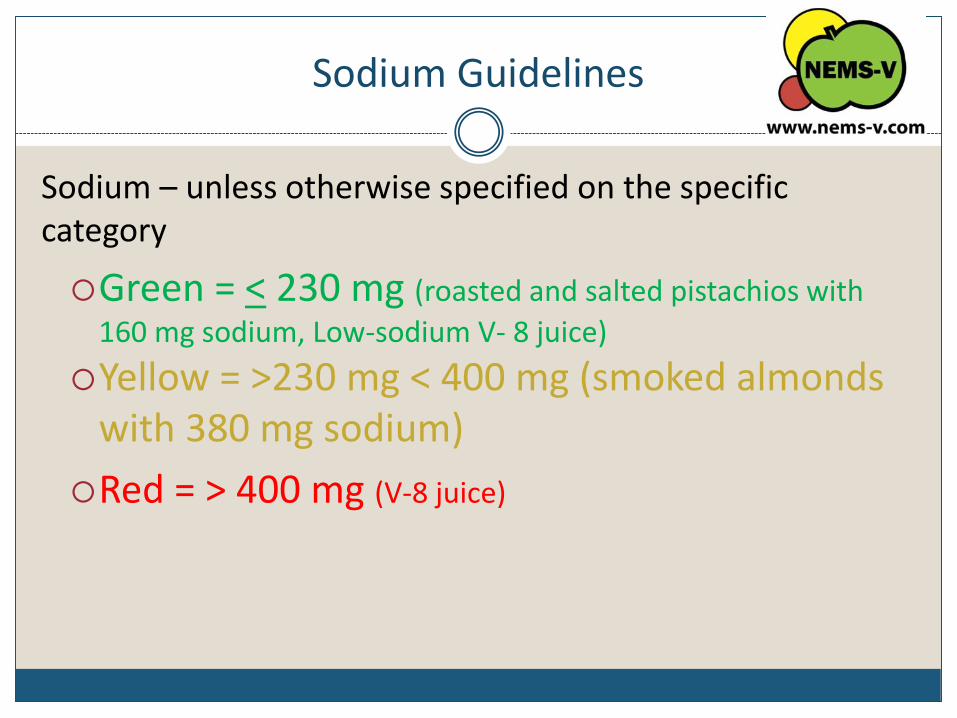
Sodium Guidelines
Sodium – unless otherwise specified on the specific category
Green = < 230 mg (roasted and salted pistachios with
160 mg sodium, Low-sodium V- 8 juice)
Yellow = >230 mg < 400 mg (smoked almonds with 380 mg sodium)
Red = > 400 mg (V-8 juice)

Sugar Guidelines
Green = 2%, 1% or fat-free yogurt with no added sweeteners; fat-free, 1% or 2 % unsweetened milk with < 13 gm sugar per 8 oz. serving
Yellow = 2%, 1% or fat-free yogurt with added sweeteners; fat-free, 1% or 2 % flavored milk with more than 13 gm sugar per 8 oz. serving and/or artificial sweeteners
Red = Regular yogurt; whole milk
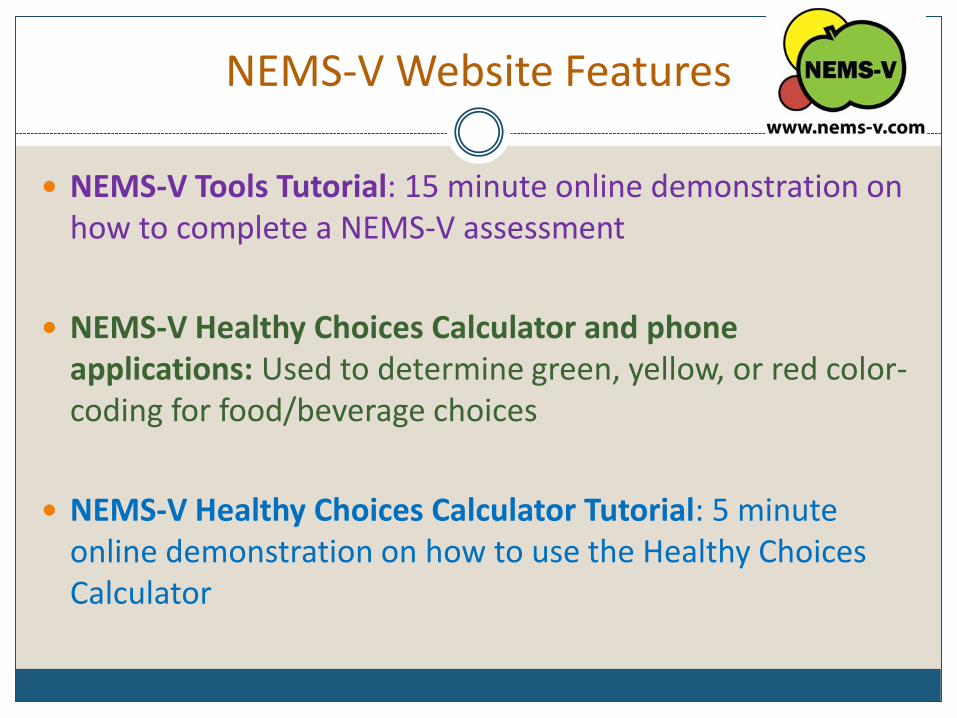
NEMS-V Website Features
NEMS-V Tools Tutorial: 15 minute online demonstration on how to complete a NEMS-V assessment
NEMS-V Healthy Choices Calculator and phone applications: Used to determine green, yellow, or red color-coding for food/beverage choices
NEMS-V Healthy Choices Calculator Tutorial: 5 minute online demonstration on how to use the Healthy Choices Calculator

www.nems-v.com – click on blue “Healthy Choices Calculator” button
Polling question # 2
Which of the following vending machines is more likely to have at least 50% green and yellow options at pre-assessment?
Snack
Beverage
Refrigerated
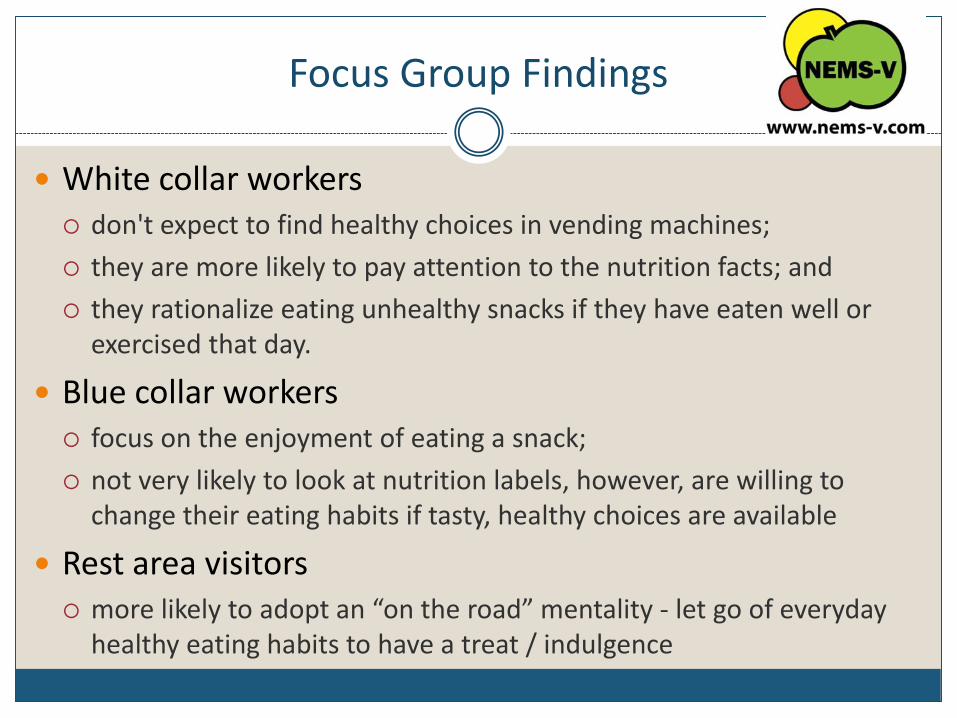
Focus Group Findings
White collar workers don't expect to find healthy choices in vending machines;
they are more likely to pay attention to the nutrition facts; and
they rationalize eating unhealthy snacks if they have eaten well or exercised that day.
Blue collar workers focus on the enjoyment of eating a snack;
not very likely to look at nutrition labels, however, are willing to change their eating habits if tasty, healthy choices are available
Rest area visitors more likely to adopt an “on the road” mentality - let go of everyday
healthy eating habits to have a treat / indulgence

Nearly 6 in 10 respondents thought message worked best to communicate the snack rating system clearly.
Respondents liked that it illustrated examples of foods, which made the color coding system very clear.
The main message was focused on encouraging people to choose better snacks at least some of the time.
Many noted they had never seen vending machines with healthy options stocked in them.
Message Selected

Nebraska’s message
Illustrated food examples
Encouraging people to choose healthy options in their “mix”

:
Resources for Worksites, Rest Areas, Parks
Worksite Promotional Signage (Blue Collar and White Collar)
•Table Tents
•Bathroom Signs
•Pledge Cards
•Snack Tracking Calendars
•Paystub Stuffers
•E-mail Messages
•Bi-monthly Newsletters - print-ready and editable

Resources (continued)
Vending machine clings, signs, banners and floor clings
Videos - worksite video (10 min.); vendor video (5 min.)
NEMS-V Report Card and Certificate
New beverage poster

http://www.nems-v.com/NEMS-VPromotionalIdeas.html

Iowa Healthy Vending Initiative
Ultimate Goal: Project will lead to having a policy in place for state facilities to provide a minimum of 25% of food and 50% of beverage choices in vending machines as healthy options (green or yellow) based on NEMS-V criteria
NEMS-V Recognition Levels Bronze (30% food or 55% beverage choices are yellow and green);
Silver (40% food or 65% beverage choices are yellow and green);
Gold (50% food or 75% beverage choices are yellow and green and no red foods are advertised).
Project will serve as a model for other businesses across the state.

Iowa’s Core Strategies
NEMS-V assessment
Worksite Vending Report Card
Worksite Wellness Committee
Vendor Communications
Employee Involvement
Social Marketing Campaign
Follow-up NEMS-V Assessment

Maintenance
Sustained worksite leadership
Vendor engagement
Worksite policy or resolution
Monitoring for compliance

Polling question #3
Do you purchase healthy options from your worksite vending machines?
Yes
No
No vending machines available
Contact Information
Carol Voss, Nutrition Coordinator
515-242-5566

1422 Grant
State and Local Public Health Actions to Prevent Obesity, Diabetes, and Heart Disease and Stroke: Grant DP14-1422
Component 1 - support environmental and system approaches to promote health, support and reinforce healthful behaviors, and build support for lifestyle improvements…
Strategy 1.1: Implement nutrition and beverage standards including sodium standards (i.e., food service guidelines for cafeterias and vending) in public institutions, worksites and other key locations such as hospitals

Year 1: Baseline AssessmentGathering and reporting baseline data across six Local Public Health Departments to identify current nutrition and beverage standards in cafeterias and vending in public institutions.

Direct Observations

Vending Results
• 104 Vending Machines across 29 locations
– 58 Beverage machines, 37 Snack machines, 2 Hot beverage, 5 Refrigerated machines
– 2,745 food or beverage items were assessed
• 75% foods/beverages were red (i.e., not consistent with the 2010 Dietary Guidelines for Americans)
• 17% foods/beverages were yellow (i.e., consistent with the 2010 Dietary Guidelines for Americans with some minor exceptions)
• 8% foods/beverages were green (i.e., consistent with the 2010 Dietary Guidelines for Americans)

Vending Results
• 15 machines received “awards” for meeting nutrition standards
– 9 received a rating of bronze (30% food or 55% beverage choices are yellow and green)
– 2 received a rating of silver (40% foods or 65% beverage choices are yellow and green)
– 4 received a rating of gold (50% food or 75% beverage choices are yellow and green)
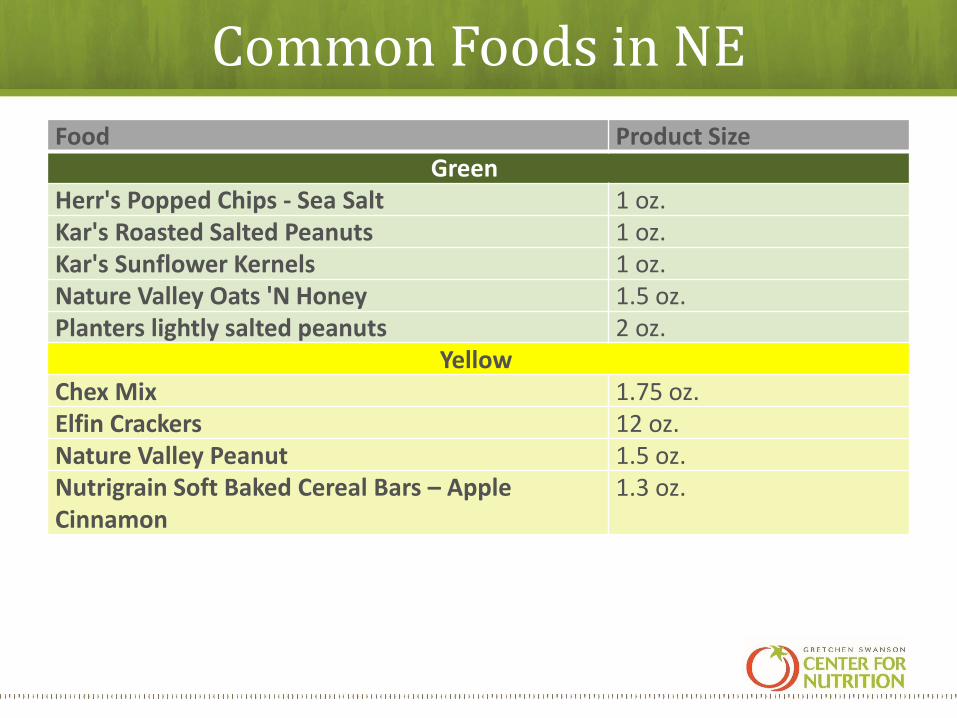
Common Foods in NE
Food Product SizeGreen
Herr's Popped Chips - Sea Salt 1 oz.Kar's Roasted Salted Peanuts 1 oz.Kar's Sunflower Kernels 1 oz.Nature Valley Oats 'N Honey 1.5 oz.Planters lightly salted peanuts 2 oz.
YellowChex Mix 1.75 oz.Elfin Crackers 12 oz.Nature Valley Peanut 1.5 oz.Nutrigrain Soft Baked Cereal Bars – Apple Cinnamon
1.3 oz.

Common Beverages in NE
Food Product SizeGreen
Tropicana 100% Apple Juice 10 oz. Yellow
Diet Coke 12 oz.Diet Mountain Dew 12 oz.Diet Pepsi 12 oz.Ocean Spray 100% Apple Juice 15.2 oz.Ocean Spray 100% Orange Juice 15.2 oz.
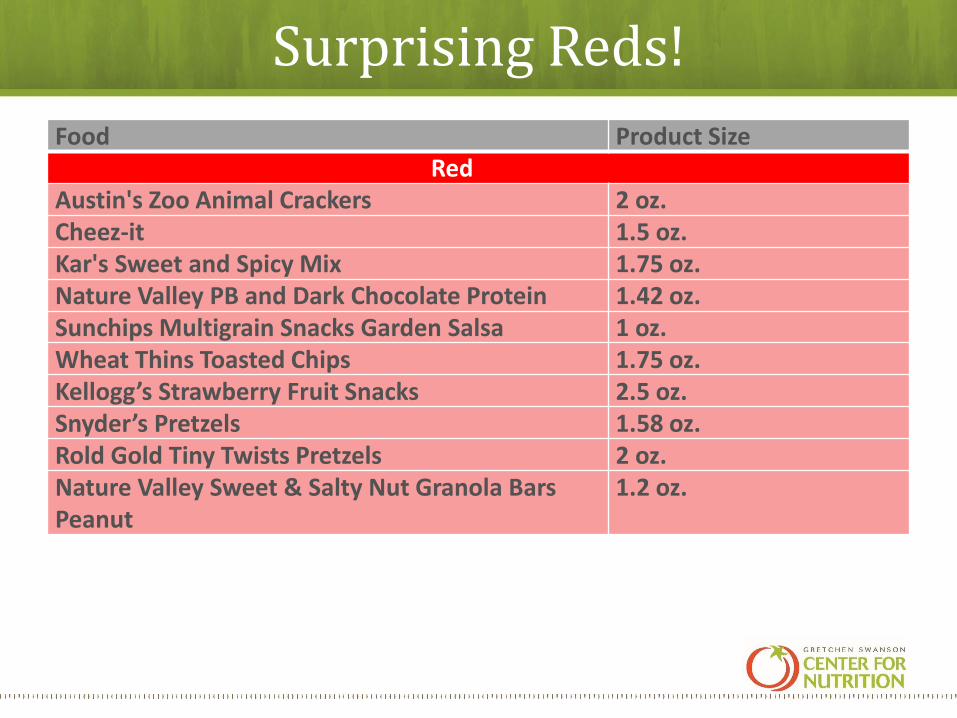
Surprising Reds!
Food Product SizeRed
Austin's Zoo Animal Crackers 2 oz.Cheez-it 1.5 oz.Kar's Sweet and Spicy Mix 1.75 oz.Nature Valley PB and Dark Chocolate Protein 1.42 oz. Sunchips Multigrain Snacks Garden Salsa 1 oz.Wheat Thins Toasted Chips 1.75 oz.Kellogg’s Strawberry Fruit Snacks 2.5 oz. Snyder’s Pretzels 1.58 oz.Rold Gold Tiny Twists Pretzels 2 oz.Nature Valley Sweet & Salty Nut Granola Bars Peanut
1.2 oz.
Policy Assessment Interviews
• Nutrition and Beverage Standards with regard to the vending machines:
• Also asked about institutional worksite policies and wellness-based support
• 4 institutions (3 hospitals and 1 courthouse) reported any type of nutrition standard currently in practice with regard to vending
Vending Behaviors
• n = 465 employees
• 58% disagreed or strongly disagreed that most food and beverage choices in the vending machines at work were healthy.
• 40% agreed or strongly agreed that that if there were a greater variety of healthful food and beverage choices, they would use these vending machines more often than they do currently

Questions
Teresa M Smith, PhD, MSPostdoctoral Research Fellow
Gretchen Swanson Center for Nutrition
8401 West Dodge Road
Omaha, NE 68114
Phone: 402-559-5500
www.centerfornutrition.org

Upcoming Webinars
• APRIL 1, 9:30 AM MT/10:30 AM CT (NO FOOLIN’!)
– VENDING PROMOTION AND EDUCATION OPPORTUNITIES

Upcoming Webinars
• April – WorkWell, Inc. will be coordinating a series on Breastfeeding supports
• May – WELLCOM, Physical Activity
– May 12, 9:30 am MT/10:30 am CT, SURGEON GENERAL'S NATIONAL CALL TO ACTION
– MAY 19, 9:30 am MT/10:30 am CT, "WALK IT GUIDE" - WALKABILITY STRATEGIES
– May 26, 9:30 am MT/10:30 am CT, SUCCESS AND BARRIERS TO WALKABILITY

Thank you!
Related Documents