Biomech Model Mechanobiol DOI 10.1007/s10237-012-0460-1 ORIGINAL PAPER Velocity profiles in the human ductus venosus: a numerical fluid structure interaction study Paul R. Leinan · Joris Degroote · Torvid Kiserud · Bjørn Skallerud · Jan Vierendeels · Leif R. Hellevik Received: 4 May 2012 / Accepted: 21 November 2012 © Springer-Verlag Berlin Heidelberg 2012 Abstract The veins distributing oxygenated blood from the placenta to the fetal body have been given much attention in clinical Doppler velocimetry studies, in particular the duc- tus venosus. The ductus venosus is embedded in the left liver lobe and connects the intra-abdominal portion of the umbil- ical vein (IUV) directly to the inferior vena cava, such that oxygenated blood can bypass the liver and flow directly to the fetal heart. In the current work, we have developed a mathe- matical model to assist the clinical assessment of volumetric flow rate at the inlet of the ductus venosus. With a robust estimate of the velocity profile shape coefficient (VC), the volumetric flow rate may be estimated as the product of the time-averaged cross-sectional area, the time-averaged cross- sectional maximum velocity and the VC. The time average quantities may be obtained from Doppler ultrasound mea- surements, whereas the VC may be estimated from numeri- cal simulations. The mathematical model employs a 3D fluid structure interaction model of the bifurcation formed by the IUV, the ductus venosus and the left portal vein. Further- more, the amniotic portion of the umbilical vein, the right liver lobe and the inferior vena cava were incorporated as P. R. Leinan (B )· B. Skallerud · L. R. Hellevik Biomechanics Division, Department of Structural Engineering, The Norwegian University of Science and Technology, 7491Trondheim, Norway e-mail: [email protected] J. Degroote · J. Vierendeels Department of Flow, Heat and Combustion Mechanics, Ghent University, 9000 Ghent, Belgium T. Kiserud Department of Clinical Medicine, University of Bergen, Bergen, Norway T. Kiserud Department of Obstetrics and Gynecology, Haukeland University Hospital, 5021 Bergen, Norway lumped model boundary conditions for the fluid structure interaction model. A hyperelastic material is used to model the structural response of the vessel walls, based on recently available experimental data for the human IUV and ductus venous. A parametric study was constructed to investigate the VC at the ductus venosus inlet, based on a reference case for a human fetus at 36 weeks of gestation. The VC was found to be 0.687 ± 0.023 (Mean ± SD of parametric case study), which confirms previous studies in the literature on the VC at the ductus venosus inlet. Additionally, CFD simulations with rigid walls were performed on a subsection of the para- metric case study, and only minor changes in the predicted VCs were observed compared to the FSI cases. In conclu- sion, the presented mathematical model is a promising tool for the assessment of ductus venosus Doppler velocimetry. Keywords Ductus venosus · Velocity profiles · Fluid structure interaction 1 Introduction The veins distributing oxygenated blood from the placenta to the fetal body have been given much attention in the lit- erature, especially in Doppler velocimetry studies (Kiserud et al. 2000, 2006; Bellotti et al. 2004; Matias and Montene- gro 2011). One of the most prominent is the ductus venosus (DV), which bypasses the right liver lobe delivering oxygen- rich blood directly to the inferior vena cava (IVC), and thus the heart (Kiserud 2005). The DV forms a bifurcation with the intra-abdominal umbilical vein (IUV) and the left por- tal vein (LPV). Furthermore, the LPV is connected to the right portal vein (RPV) and the main portal stem (PV), which delivers blood low on oxygen to the right liver lobe, from the lower fetal body. The LPV-RPV-PV junction is, therefore, 123

Welcome message from author
This document is posted to help you gain knowledge. Please leave a comment to let me know what you think about it! Share it to your friends and learn new things together.
Transcript
Biomech Model MechanobiolDOI 10.1007/s10237-012-0460-1
ORIGINAL PAPER
Velocity profiles in the human ductus venosus: a numerical fluidstructure interaction study
Paul R. Leinan · Joris Degroote · Torvid Kiserud ·Bjørn Skallerud · Jan Vierendeels · Leif R. Hellevik
Received: 4 May 2012 / Accepted: 21 November 2012© Springer-Verlag Berlin Heidelberg 2012
Abstract The veins distributing oxygenated blood fromthe placenta to the fetal body have been given much attentionin clinical Doppler velocimetry studies, in particular the duc-tus venosus. The ductus venosus is embedded in the left liverlobe and connects the intra-abdominal portion of the umbil-ical vein (IUV) directly to the inferior vena cava, such thatoxygenated blood can bypass the liver and flow directly to thefetal heart. In the current work, we have developed a mathe-matical model to assist the clinical assessment of volumetricflow rate at the inlet of the ductus venosus. With a robustestimate of the velocity profile shape coefficient (VC), thevolumetric flow rate may be estimated as the product of thetime-averaged cross-sectional area, the time-averaged cross-sectional maximum velocity and the VC. The time averagequantities may be obtained from Doppler ultrasound mea-surements, whereas the VC may be estimated from numeri-cal simulations. The mathematical model employs a 3D fluidstructure interaction model of the bifurcation formed by theIUV, the ductus venosus and the left portal vein. Further-more, the amniotic portion of the umbilical vein, the rightliver lobe and the inferior vena cava were incorporated as
P. R. Leinan (B)· B. Skallerud · L. R. HellevikBiomechanics Division, Department of Structural Engineering,The Norwegian University of Science and Technology,7491Trondheim, Norwaye-mail: [email protected]
J. Degroote · J. VierendeelsDepartment of Flow, Heat and Combustion Mechanics,Ghent University, 9000 Ghent, Belgium
T. KiserudDepartment of Clinical Medicine, University of Bergen, Bergen,Norway
T. KiserudDepartment of Obstetrics and Gynecology,Haukeland University Hospital, 5021 Bergen, Norway
lumped model boundary conditions for the fluid structureinteraction model. A hyperelastic material is used to modelthe structural response of the vessel walls, based on recentlyavailable experimental data for the human IUV and ductusvenous. A parametric study was constructed to investigatethe VC at the ductus venosus inlet, based on a reference casefor a human fetus at 36 weeks of gestation. The VC was foundto be 0.687 ± 0.023 (Mean±SD of parametric case study),which confirms previous studies in the literature on the VCat the ductus venosus inlet. Additionally, CFD simulationswith rigid walls were performed on a subsection of the para-metric case study, and only minor changes in the predictedVCs were observed compared to the FSI cases. In conclu-sion, the presented mathematical model is a promising toolfor the assessment of ductus venosus Doppler velocimetry.
Keywords Ductus venosus · Velocity profiles ·Fluid structure interaction
1 Introduction
The veins distributing oxygenated blood from the placentato the fetal body have been given much attention in the lit-erature, especially in Doppler velocimetry studies (Kiserudet al. 2000, 2006; Bellotti et al. 2004; Matias and Montene-gro 2011). One of the most prominent is the ductus venosus(DV), which bypasses the right liver lobe delivering oxygen-rich blood directly to the inferior vena cava (IVC), and thusthe heart (Kiserud 2005). The DV forms a bifurcation withthe intra-abdominal umbilical vein (IUV) and the left por-tal vein (LPV). Furthermore, the LPV is connected to theright portal vein (RPV) and the main portal stem (PV), whichdelivers blood low on oxygen to the right liver lobe, from thelower fetal body. The LPV-RPV-PV junction is, therefore,
123
P. R. Leinan et al.
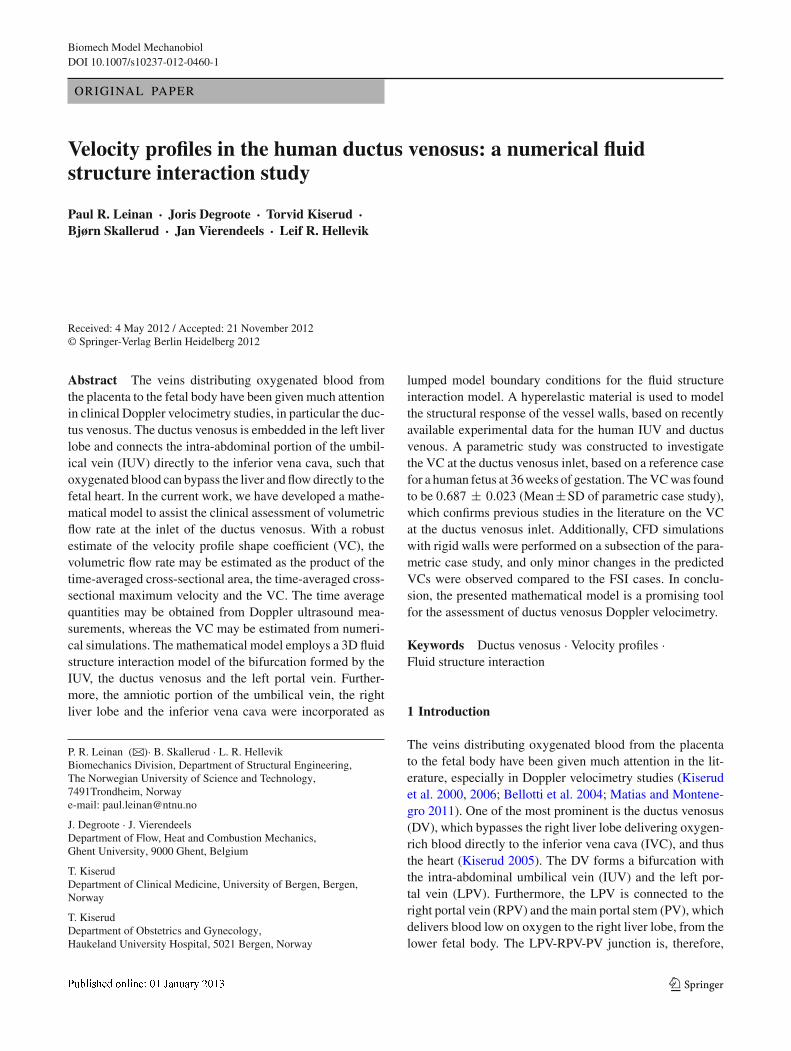
Fig. 1 Illustration of a typical pattern of venous blood supply of thefetal liver (left and right liver lobe) in normally growing fetus. DV ductusvenosus, LPV left portal vein, PV main stem of the portal vein, RPV rightportal vein, SP spine, ST stomach, IUV intra-abdominal umbilical vein.The view plane is seen in the superior direction, that is, toward theupper fetal body. Adapted from Kessler et al. (2011)
described as a watershed between oxygen-rich blood fromthe placenta and oxygen-poor blood from the intestine andspleen (Fig. 1) (Kiserud et al. 2003; Kessler et al. 2007b).
Information about the blood volumetric flow rate throughthe DV has been made possible from Doppler velocimetrycombined with detailed knowledge about the local hemo-dynamics (Pennati et al. 1998; Kiserud et al. 2000). Thevolumetric flow rate Q = Vmean A through a vessel can befound from the cross-sectional mean velocity Vmean and thecross-sectional area A of the vessel (see Sect. 2). Accuratemeasurements of the cross-sectional mean velocity are noteasily accessible through standard ultrasonography in a clini-cal setting (Kiserud et al. 1998). However, the cross-sectionalmean velocity can be estimated from Vmean = hVmax , whereVmax is the cross-sectional maximum velocity (e.g., from theDoppler tracing) and h indicates the shape of the local cross-sectional velocity profile (see Sect. 2). The velocity profileshape coefficient (VC), h, at the DV inlet has been investi-gated with CFD analysis by Pennati et al. (1998) and withultrasonography by Kiserud et al. (1998), reporting h = 0.68and h = 0.69, respectively. A VC of h = 1.0 and h = 0.5indicate a flat and parabolic velocity profile, respectively.Hence, the VC found by Pennati et al. (1998) and Kiserudet al. (1998) indicates a partially flat profile at the inlet of thehuman DV.
The degree of DV shunting has been investigated in severalstudies in the later stages of human fetal gestation (Kiserudet al. 2000, 2006; Kessler et al. 2011, 2008; Bellotti et al.2000, 2004). The blood flowing from the placenta throughthe UV and into the IUV first supplies the left liver lobethrough minor veins along the IUV. A portion of the bloodvolume is then shunted through the DV, while the remainingblood volume enters the LPV and the right liver lobe (Kessleret al. 2007b) (Fig. 1). Haugen et al. (2004) quantified the flowsplit between DV and the IUV immediately downstream ofthe DV to be 56 %, for normal human fetuses at 36 weeks ofgestation. The flow split between DV and the blood volumefrom the placenta is found to be 20–30 % in studies on humanfetuses (Bellotti et al. 2000; Kiserud et al. 2000; Tchirikovet al. 2006; Haugen et al. 2004), depending on factors such asgestational age. Kiserud et al. (2000) reported a shunt frac-tion of 32 % at 18 weeks gestation, a decrease to a minimumof 18 % at 31–34 weeks followed by an increase to 22 %at 40 weeks, in normal pregnancies. In a subsequent study,Kiserud et al. (2006) reported that the DV shunt fraction mayincrease significantly in umbilical circulatory compromise,such as intrauterine growth restriction (IUGR), especially forfetuses with an absent or reversed end-diastolic DV bloodvelocity. Several studies have shown that the DV shunt frac-tion may increase in the case of IUGR (Tchirikov et al. 1998;Kiserud et al. 2006; Bellotti et al. 2004), and in some cases,shunt fractions above 100 % have been reported (Bellotti et al.2004; Kiserud et al. 2006), suggesting that the blood from theLPV is drained into the DV, that is, a reversed flow directionin the LPV compared to the normal case (Fig. 1) (Kilavuzet al. 2003; Kessler et al. 2007b).
The distribution of oxygenated blood volume at the IUV-DV junction is of considerable physiological interest; how-ever, it is the recording of the DV blood velocity waveformthat has caught the highest clinical interest (Kiserud et al.1991). DV velocity waveform parameters are now in com-mon use for assessing and monitoring compromised preg-nancies. Recently, the magnitude and direction of the bloodvelocity in LPV has been added as another monitoring para-meter (Kessler et al. 2007b).
The velocity in the human DV is pulsatile in normal preg-nancies (Kiserud et al. 1992). The pulsations originate fromthe fetal heart and propagate from the right atrium, throughthe IVC and into the DV (Kiserud et al. 2003). The DV veloc-ity wave form in normal fetuses can be recognized from amaximum peak during ventricular systole and a second peakduring diastolic filling. An often sharp velocity reduction ispresent during atrial contraction, in some cases to the pointof flow reversal in the DV (Kiserud et al. 1994a; Hecher andCampbell 1996). DV flow reversal is abnormal in the laterstages of gestation, but may be found at an early gestationalage in normal fetuses (Maiz and Nicolaides 2010; Kiserudet al. 2003).
123
Velocity profiles in the human ductus venosus
Doppler velocimetry of the DV shunt is in widespreadclinical use, especially in the later stages of gestation. DVultrasonography can identify pathologies such as hypoxemia,acidosis, cardiac decompensation and placental compromiseand is a promising tool for timing the delivery of criticallyill fetuses (Kiserud 2005). Furthermore, DV velocimetryin early pregnancy can give indications on chromosomaldefects, specifically in the presence of abnormal and reversedflow during atrial contraction (Matias et al. 1998; Toyamaet al. 2004; Kiserud 2005; Maiz and Nicolaides 2010).
The interpretation of Doppler signals from the DV, andespecially estimating volumetric flow rate, is not straightfor-ward. The DV diameter is small and reported to be between0.5 and 2.0 mm (Kiserud et al. 2000). Furthermore, the trum-pet shape of the DV (Mavrides et al. 2002), combined withthe branching angle from the attachment point at the IUV,gives rise to complex hemodynamics and a non-symmetricvelocity profile (Pennati et al. 1998). Additionally, the ratiobetween the maximum and minimum diameter at the DVinlet during a cardiac cycle, characterized by the diameterpulse index (DPI) (see Eq. 9), was found to vary with a meanand median value of 0.21 and 0.05, respectively, in a study byAcharya and Kiserud (1999). Considering these factors, thequantification of the volumetric flow rate shunted through theDV is a challenge. These challenges add to the normal diffi-culties faced in volumetric flow rate estimation with Dopplerultrasound, such as beam angle, mean flow calculation andvessel area estimation (Hoskins 1990).
In this work, a numerical study is presented on thehemodynamics in the IUV, DV and LPV bifurcation. Theprimary aim of the study is to investigate velocity pro-files at the DV inlet region under normal conditions inthe later stages of gestation, aimed at volumetric flowrate assessment with Doppler velocimetry. The numer-ical model includes the IUV, DV and LPV and takesinto account the deformation of the vessels from thepressure and viscous forces of the blood flow throughfluid structure interaction (FSI). Lumped models for theUV, IVC and the right liver lobe (HeR) are includedboundary conditions for the FSI model. Additionally, CFDsimulations (with rigid walls) with the same boundaryconditions as the FSI simulations are included to inves-tigate the effect of the wall compliance. The secondaryaim of the study is to advance the development of numer-ical models of the fetal venous system, especially ofthe DV, LPV and IUV bifurcation, which can supple-ment previous models presented in the literature (Pennatiet al. 1998, 1996, 2003; Hellevik et al. 1998b, 2009).The developed FSI model has the potential for furtherinvestigation of the VC in DV, LPV and IUV bifur-cation during physiological and pathological conditions,and detailed case studies on, for example, DV dilata-tion (Bellotti et al. 1998), and wave transmission from
the fetal heart into the DV/IVU junction (Hellevik et al.2009).
2 Materials and methods
2.1 Flow parameters
The volumetric flow rate Q(t) passing a cross-section witharea A(t) at time t can be calculated from
Q(t) = Vmean(t) A(t), (1)
where Vmean(t) is the cross-sectional mean velocity definedby
Vmean(t) = 1
A(t)
∫
A(t)
[VA(t) · nA(t)] dA. (2)
where nA(t) ⊥ A(t) is the cross-sectional normal vector,and VA(t) = V(z, t) ∈ A(t) is the velocity vector in thecross-section, at a spatial location z = [x, y, z]T ∈ A(t).
Accurate measurements of the cross-sectional mean veloc-ity are not easily available through standard Doppler ultra-sound techniques (Kiserud et al. 1998). However, thecross-sectional mean velocity can be estimated from the max-imum velocity in the cross-section
Vmax(t) = max z ∈ A [VA(t) · nA(t)] (3)
combined with knowledge about the local cross-sectionalVC, h (t), giving
Vmean(t) = h (t) Vmax(t). (4)
The VC indicates the shape of the cross-sectional velocityprofile; however, different velocity profiles with the same hvalue exist. The VC for a parabolic velocity profile in fullydeveloped laminar pipe flow is h = 0.5, whereas h = 1.0corresponds to a completely flat velocity profile, that is, thecross-sectional mean velocity is equal to the cross-sectionalmaximum velocity.
In this work, we define an averaged VC, h, during thecardiac cycle, given by:
h ≡ Q
V max A, (5)
where the time-averaged volumetric flow rate Q, cross-sectional area A, and cross-sectional maximum velocityV max are calculated from
• = 1
T
∫
T
•(t)dt, (6)
and where T represents the period of one cardiac cycle.The time-averaged volumetric flow rate Q over one car-
diac cycle can now be estimated from Doppler ultrasound
123
P. R. Leinan et al.
as the product of the measured time-averaged maximumcross-sectional velocity, the measured time-averaged cross-sectional area and the averaged VC from Eq. 5, which isestimated in our simulations:
Q �simulations︷︸︸︷
h V max A︸ ︷︷ ︸measurements
. (7)
The pulsatility index for veins (PIV) during a cardiac cycleis defined as
PIV = max t∈ T [Vmax(t)] − min t∈ T [Vmax(t)]V max
, (8)
where max t∈ T [Vmax(t)] is the peak velocity during ventric-ular systole, and min t∈ T [Vmax(t)] is the minimum velocityduring atrial contraction (Hecher et al. 1994; Kiserud et al.1998). Furthermore, following Acharya and Kiserud (1999),we define the diameter pulse index (DPI)
DPI = max t∈ T [D(t)]min t∈ T [D(t)] − 1, (9)
where max t∈ T [D(t)] and min t∈ T [D(t)] are the maximumand minimum vessel diameters recorded during a cardiaccycle, and D(t) = 2
√A(t)/π .
2.2 Numerical model
A 3D FSI model of the IUV, DV and LPV bifurcation ispresented in this work, based on a fetus of 36 weeks of ges-tation (Haugen et al. 2004). The FSI problem is solved with
a partitioned strategy, with black box solvers for the fluid(Ansys, Fluent) and solid (Abaqus FEA). An in-house code(Tango) is used to implicitly couple the FSI problem withthe interface quasi-Newton (IQN) approach (Vierendeelset al. 2007; Degroote 2010). This code has been validated(Degroote et al. 2009) using a well-established FSI bench-mark (Turek and Hron 2006). Lumped models (0D) for theUV, HeR and IVC are included as boundary conditions forthe FSI problem.
2.2.1 Initial geometry
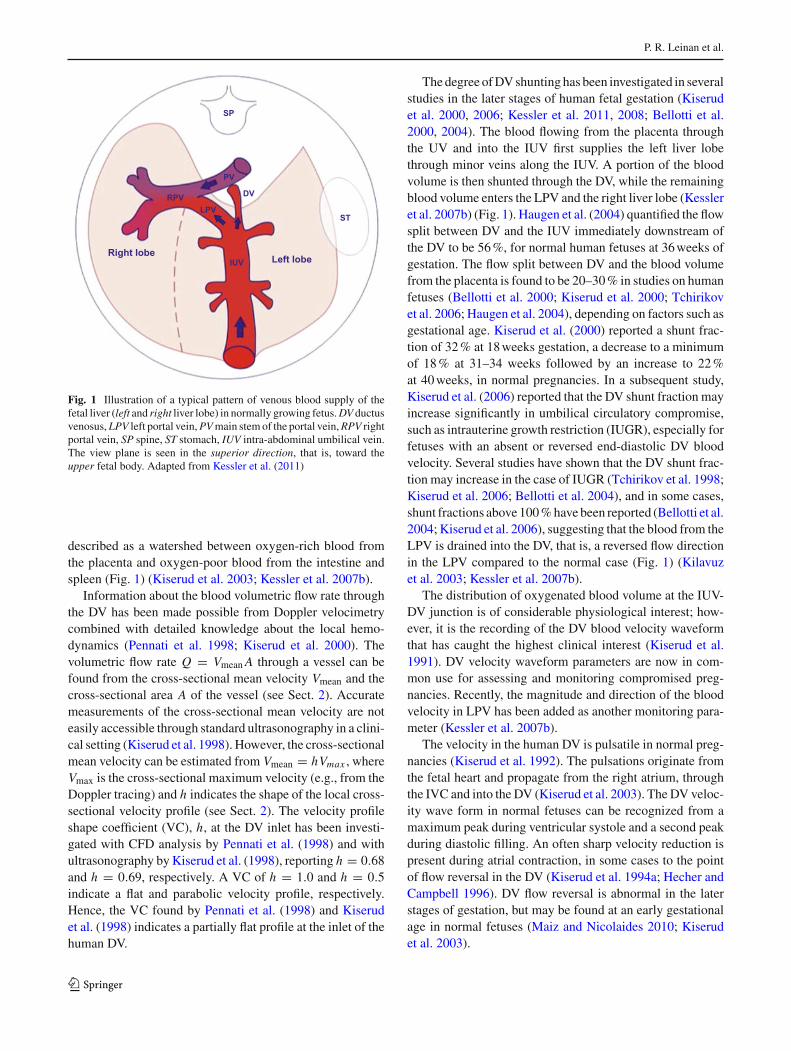
An overview of the initial geometry of the fluid domain ofthe IUV, DV and LPV bifurcation is shown in Fig. 2. TheIUV and LPV are modeled as straight tubes, connected to acurved section with a tract angle β0, IUV and a mean curva-ture radius R0 IUV. The DV is modeled as a conical-shapeddiverging tube from the DV isthmus, where the DV intersectsthe LPV-IUV with a branch angle of α0 DV. The shape of thebifurcation including the conical shape of the DV is based onthe histological studies presented by Mavrides et al. (2001,2002) and Kivilevitch et al. (2009). The minor (portal) veinsconnecting the IUV to the left liver lobe, as seen in Fig. 1,are neglected in the current study.
The diameter-to-wall thickness ratios (D/H ) are calcu-lated from the studies of Ailamazyan et al. (2003) andHaugen et al. (2004) giving initial wall thickness ratios equalto 11, 6, 18 and 11 for the LPV, DVisth, DVout and IUV,respectively.
Fig. 2 Fluid and lumped models: Overview of the fluid domain of theIUV, DV and LPV bifurcation in the initial and loaded state. Initial fluiddomain: Vessel lengths and angles for the initial geometry of the fluiddomain. Pressurized fluid domain: The loaded fluid domain at refer-ence flow and pressure, with lumped models for the UV, IVC and HeR.
The lumped models are connected to the 3D fluid domain at the sur-faces �IUV, �DV and �LPV. Note: The diameter DDVin is calculated asthe mean of three cross-sections in the DV inlet region, with an initialsample volume length of l0 SV = 2 mm (see Sect. 2.2.2)
123
Velocity profiles in the human ductus venosus
Table 1 Common parameters for the IUV, DV and LPV bifurcation, asseen in Fig. 2
L0 (mm) R0 (mm) β0 (deg)
LPV 7.5DV 12.5IUV 35.0 8.0 75
2.2.2 Parametric study
A parametric study including nine dynamic FSI simulationsof the IUV, DV and LPV bifurcation is constructed froma reference case, by variation of the branch angles α0 DV
and α0 IUV; the diameters of the IUV (DIUV), DV isthmus(DDVisth ) and outlet (DDVout ); and the amplitude of the pul-satile pressure waveform in the IVC, P0W,IVC(t). Geomet-rical parameters common for the all test cases are given inTable 1. The reference case is created with parameters fora normal fetus of 36 weeks of gestation, determined by in-vivo ultrasound data from the work of Haugen et al. (2004),Kiserud et al. (1994b) and Acharya and Kiserud (1999).
The parameters and parametric range included in the para-metric study are chosen to represent some of the physiolog-ical variation in the human IUV, DV and LPV bifurcation,which can influence the VC at the DV inlet, that is, the diam-eter of the DV and the IUV (from Haugen et al. 2004 andKiserud et al. 1994b); the angle of insertion between the DVand the IUV (from Beaudoin et al. 1998 and Pennati et al.1998); and the pulsation in the DV (from Kessler et al. 2006).
A sample volume is utilized while measuring the DV inletvelocities with Doppler ultrasound (Kiserud et al. 1998). Inthis numerical study, we, therefore, choose to middle themeasurements at the DV inlet over a region of 2 mm, whichcorresponds to a sample volume commonly used in Dopplervelocimetry in a clinical setting. This is achieved by tak-ing the mean of the measured quantities in the DV inlet
region over three cross-sections, as illustrated in Fig. 2, forthe diameter DDVin , with the initial sample volume lengthL0, SV = 2 mm. Similarly, velocities at the DV inlet regionV DVin are calculated as the mean of the velocities at the threecross-sections defined by DDVin .
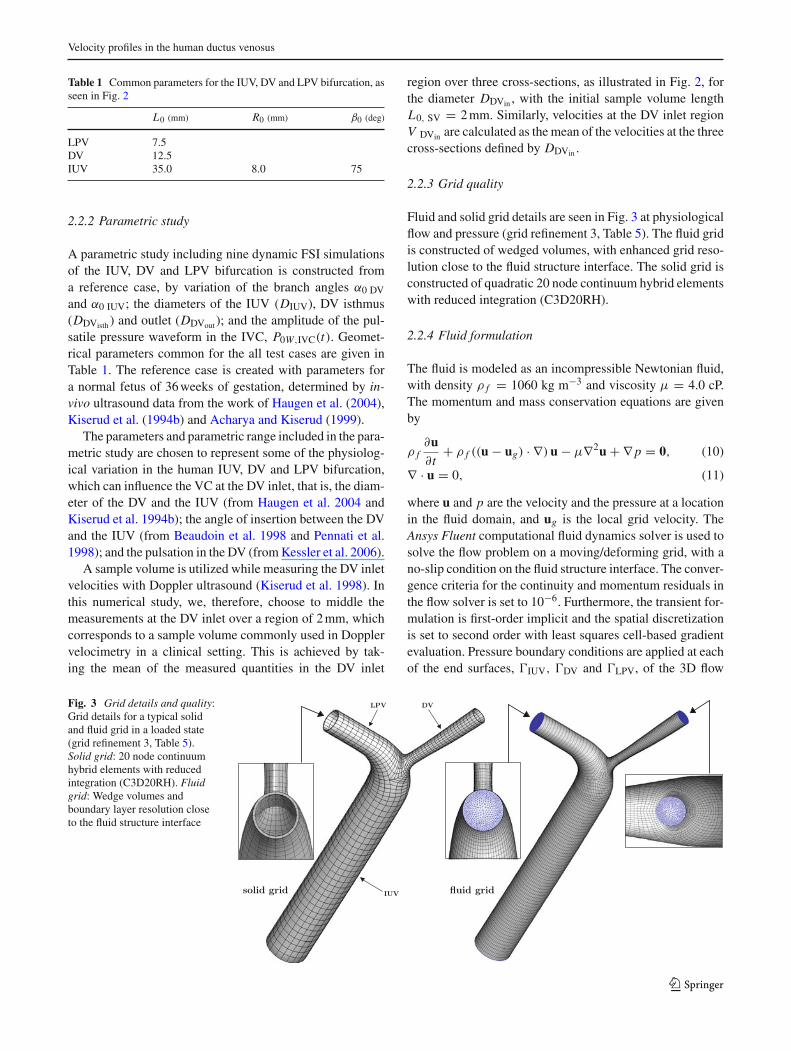
2.2.3 Grid quality
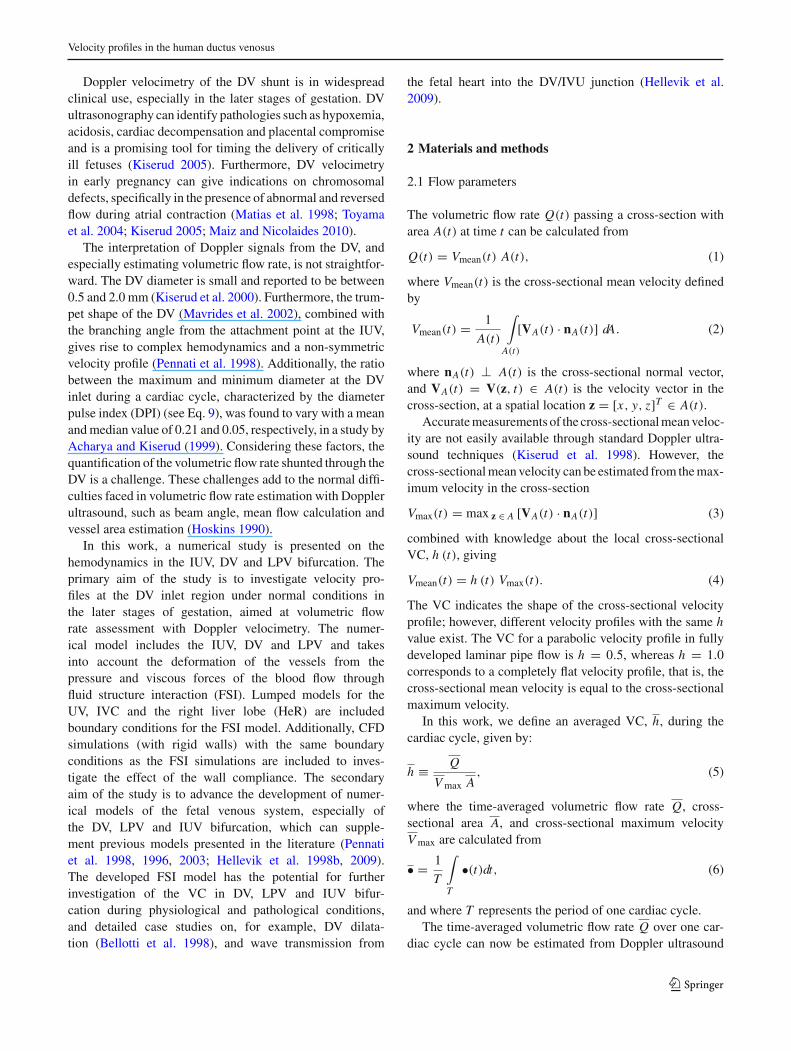
Fluid and solid grid details are seen in Fig. 3 at physiologicalflow and pressure (grid refinement 3, Table 5). The fluid gridis constructed of wedged volumes, with enhanced grid reso-lution close to the fluid structure interface. The solid grid isconstructed of quadratic 20 node continuum hybrid elementswith reduced integration (C3D20RH).
2.2.4 Fluid formulation
The fluid is modeled as an incompressible Newtonian fluid,with density ρ f = 1060 kg m−3 and viscosity μ = 4.0 cP.The momentum and mass conservation equations are givenby
ρ f∂u∂t
+ ρ f ((u − ug) · ∇) u − μ∇2u + ∇ p = 0, (10)
∇ · u = 0, (11)
where u and p are the velocity and the pressure at a locationin the fluid domain, and ug is the local grid velocity. TheAnsys Fluent computational fluid dynamics solver is used tosolve the flow problem on a moving/deforming grid, with ano-slip condition on the fluid structure interface. The conver-gence criteria for the continuity and momentum residuals inthe flow solver is set to 10−6. Furthermore, the transient for-mulation is first-order implicit and the spatial discretizationis set to second order with least squares cell-based gradientevaluation. Pressure boundary conditions are applied at eachof the end surfaces, �IUV, �DV and �LPV, of the 3D flow
Fig. 3 Grid details and quality:Grid details for a typical solidand fluid grid in a loaded state(grid refinement 3, Table 5).Solid grid: 20 node continuumhybrid elements with reducedintegration (C3D20RH). Fluidgrid: Wedge volumes andboundary layer resolution closeto the fluid structure interface
123
P. R. Leinan et al.
domain. The boundary pressures Pi (where i = {IUV,DV,LPV})are given by lumped models, see Sect. 2.2.6), and uniformlydistributed on each end surface (Fig. 2).
2.2.5 Structural formulation
Experimental data and models for the structural response ofIUV, DV and LPV veins are scarce in the literature (Helleviket al. 1998a); however, more is known about their structuralcomposition. The structural composition of the DV has beenstudied most extensively (Ailamazyan et al. 2003; Tchirikovet al. 2003; Meyer and Lind 1966; Mavrides et al. 2002), andlimited morphological descriptions can be found for fetalveins entering the liver (Tchirikov et al. 2003) and of theIUV (Martin and Tudor 1980). The veins are described assimilar to other venous tissues containing muscular, elastinand collagen fibers. The structural response of elastin andcollagenous tissue can be modeled with the hyperelasticstrain energy potential (Holzapfel et al. 2000) (neglectingviscoelastic effects)
�(C) = c1(I1 − 3) + k1
2k2(exp[k2 (I1 − 3)2] − 1) (12)
where I1 = tr(C) is first invariant of the right Cauchy–Greendeformation tensor C, and c1, k1, and k2 are material para-meters. The Neo-Hookean part of the strain energy poten-tial given by the material parameter c1 describes the elasticbehavior in the low pressure region. The stiffening effect inthe high pressure region caused by increasing recruitmentof collagen fibers is modeled with an exponential functionof I1, with material parameters k1 and k2. The anisotropicorientation of collagen fibers found in most vascular tissuesis neglected in the current study, and the exponential termin Eq. 12 models an isotropic distribution of collagen fibers(Gasser et al. 2006).
The structural problem is solved with the Abaqus FEAimplicit structural solver, giving the Cauchy stresses
σ = 2
JF
∂�
∂CFT , (13)
where J =det F>0 is the volume ratio and F the deformationgradient tensor.
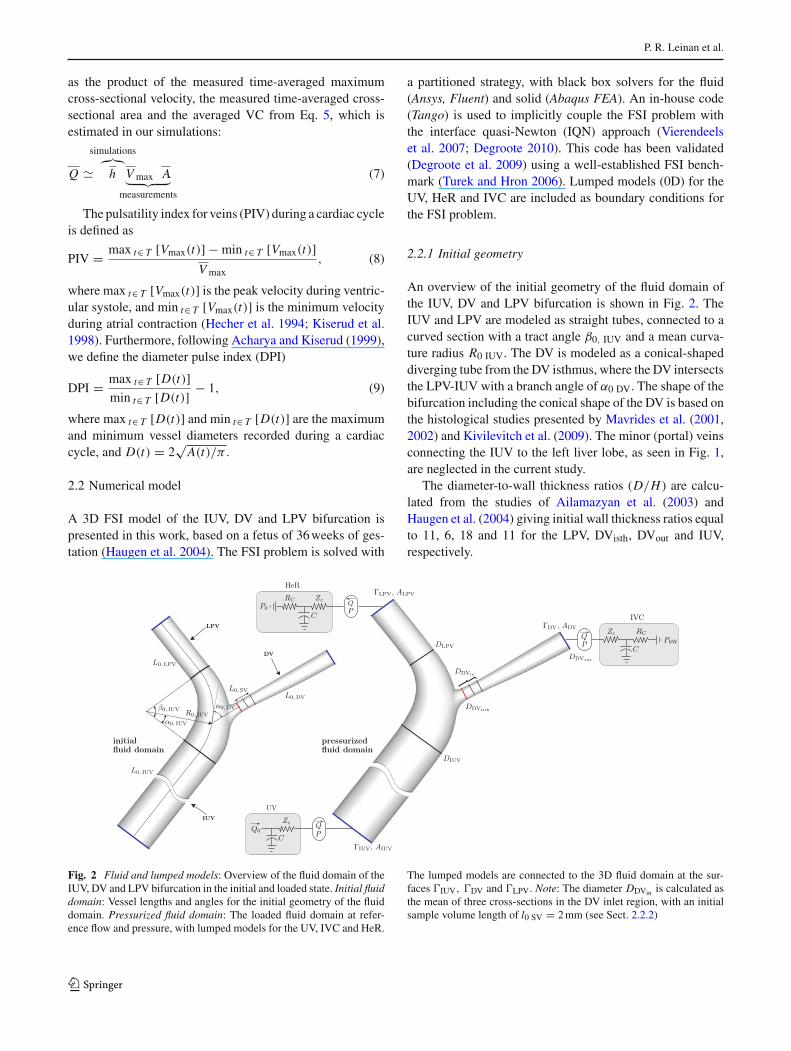
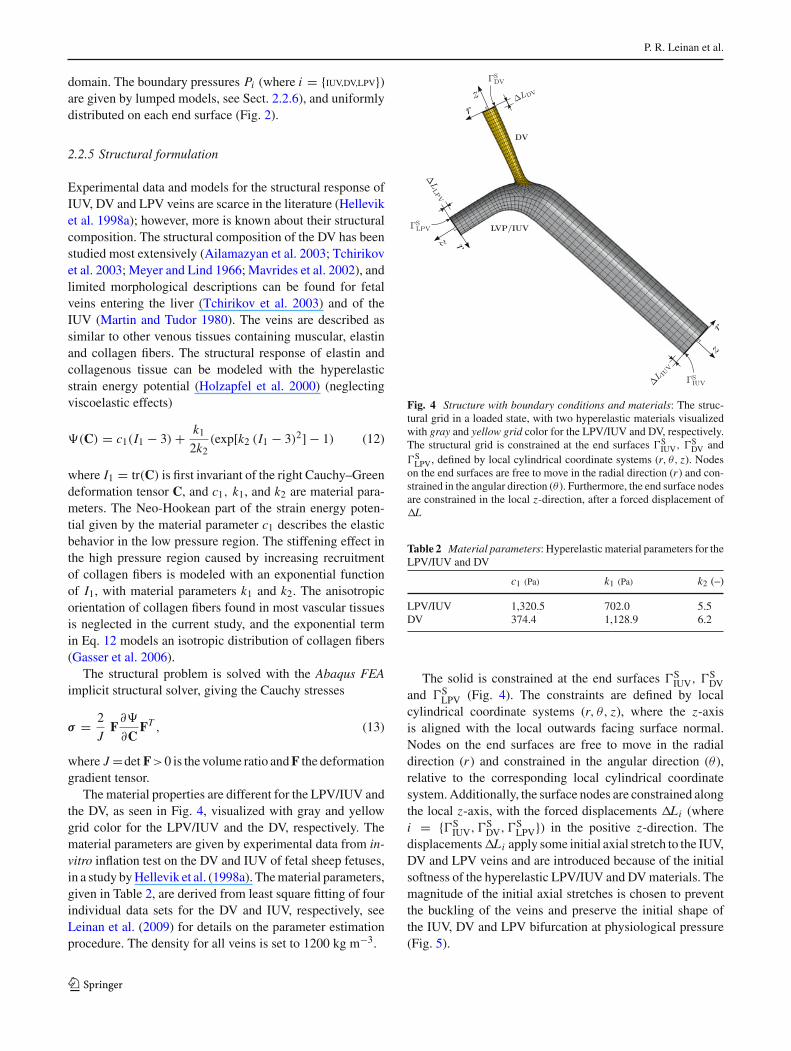
The material properties are different for the LPV/IUV andthe DV, as seen in Fig. 4, visualized with gray and yellowgrid color for the LPV/IUV and the DV, respectively. Thematerial parameters are given by experimental data from in-vitro inflation test on the DV and IUV of fetal sheep fetuses,in a study by Hellevik et al. (1998a). The material parameters,given in Table 2, are derived from least square fitting of fourindividual data sets for the DV and IUV, respectively, seeLeinan et al. (2009) for details on the parameter estimationprocedure. The density for all veins is set to 1200 kg m−3.
Fig. 4 Structure with boundary conditions and materials: The struc-tural grid in a loaded state, with two hyperelastic materials visualizedwith gray and yellow grid color for the LPV/IUV and DV, respectively.The structural grid is constrained at the end surfaces �S
IUV, �SDV and
�SLPV, defined by local cylindrical coordinate systems (r, θ, z). Nodes
on the end surfaces are free to move in the radial direction (r ) and con-strained in the angular direction (θ). Furthermore, the end surface nodesare constrained in the local z-direction, after a forced displacement ofL
Table 2 Material parameters: Hyperelastic material parameters for theLPV/IUV and DV
c1 (Pa) k1 (Pa) k2 (–)
LPV/IUV 1,320.5 702.0 5.5DV 374.4 1,128.9 6.2
The solid is constrained at the end surfaces �SIUV, �S
DVand �S
LPV (Fig. 4). The constraints are defined by localcylindrical coordinate systems (r, θ, z), where the z-axisis aligned with the local outwards facing surface normal.Nodes on the end surfaces are free to move in the radialdirection (r ) and constrained in the angular direction (θ ),relative to the corresponding local cylindrical coordinatesystem. Additionally, the surface nodes are constrained alongthe local z-axis, with the forced displacements Li (wherei = {�S
IUV, �SDV, �S
LPV}) in the positive z-direction. Thedisplacements Li apply some initial axial stretch to the IUV,DV and LPV veins and are introduced because of the initialsoftness of the hyperelastic LPV/IUV and DV materials. Themagnitude of the initial axial stretches is chosen to preventthe buckling of the veins and preserve the initial shape ofthe IUV, DV and LPV bifurcation at physiological pressure(Fig. 5).
123
Velocity profiles in the human ductus venosus
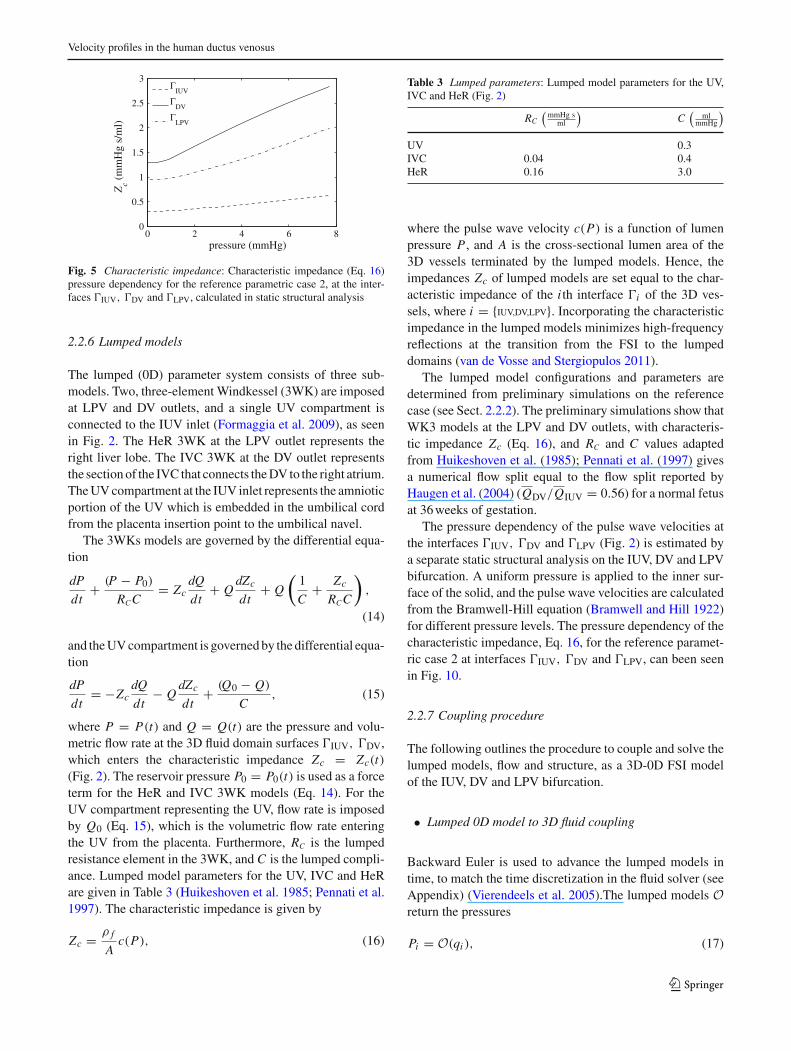
0 2 4 6 80
0.5
1
1.5
2
2.5
3
pressure (mmHg)
Zc (
mm
Hg
s/m
l)
ΓIUV
ΓDV
ΓLPV
Fig. 5 Characteristic impedance: Characteristic impedance (Eq. 16)pressure dependency for the reference parametric case 2, at the inter-faces �IUV, �DV and �LPV, calculated in static structural analysis
2.2.6 Lumped models
The lumped (0D) parameter system consists of three sub-models. Two, three-element Windkessel (3WK) are imposedat LPV and DV outlets, and a single UV compartment isconnected to the IUV inlet (Formaggia et al. 2009), as seenin Fig. 2. The HeR 3WK at the LPV outlet represents theright liver lobe. The IVC 3WK at the DV outlet representsthe section of the IVC that connects the DV to the right atrium.The UV compartment at the IUV inlet represents the amnioticportion of the UV which is embedded in the umbilical cordfrom the placenta insertion point to the umbilical navel.
The 3WKs models are governed by the differential equa-tion
dP
dt+ (P − P0)
RCC= Zc
dQ
dt+ Q
dZc
dt+ Q
(1
C+ Zc
RCC
),
(14)
and the UV compartment is governed by the differential equa-tion
dP
dt= −Zc
dQ
dt− Q
dZc
dt+ (Q0 − Q)
C, (15)
where P = P(t) and Q = Q(t) are the pressure and volu-metric flow rate at the 3D fluid domain surfaces �IUV, �DV,which enters the characteristic impedance Zc = Zc(t)(Fig. 2). The reservoir pressure P0 = P0(t) is used as a forceterm for the HeR and IVC 3WK models (Eq. 14). For theUV compartment representing the UV, flow rate is imposedby Q0 (Eq. 15), which is the volumetric flow rate enteringthe UV from the placenta. Furthermore, RC is the lumpedresistance element in the 3WK, and C is the lumped compli-ance. Lumped model parameters for the UV, IVC and HeRare given in Table 3 (Huikeshoven et al. 1985; Pennati et al.1997). The characteristic impedance is given by
Zc = ρ f
Ac(P), (16)
Table 3 Lumped parameters: Lumped model parameters for the UV,IVC and HeR (Fig. 2)
RC
(mmHg s
ml
)C
(ml
mmHg
)
UV 0.3IVC 0.04 0.4HeR 0.16 3.0
where the pulse wave velocity c(P) is a function of lumenpressure P , and A is the cross-sectional lumen area of the3D vessels terminated by the lumped models. Hence, theimpedances Zc of lumped models are set equal to the char-acteristic impedance of the i th interface �i of the 3D ves-sels, where i = {IUV,DV,LPV}. Incorporating the characteristicimpedance in the lumped models minimizes high-frequencyreflections at the transition from the FSI to the lumpeddomains (van de Vosse and Stergiopulos 2011).
The lumped model configurations and parameters aredetermined from preliminary simulations on the referencecase (see Sect. 2.2.2). The preliminary simulations show thatWK3 models at the LPV and DV outlets, with characteris-tic impedance Zc (Eq. 16), and RC and C values adaptedfrom Huikeshoven et al. (1985); Pennati et al. (1997) givesa numerical flow split equal to the flow split reported byHaugen et al. (2004) (QDV/QIUV = 0.56) for a normal fetusat 36 weeks of gestation.
The pressure dependency of the pulse wave velocities atthe interfaces �IUV, �DV and �LPV (Fig. 2) is estimated bya separate static structural analysis on the IUV, DV and LPVbifurcation. A uniform pressure is applied to the inner sur-face of the solid, and the pulse wave velocities are calculatedfrom the Bramwell-Hill equation (Bramwell and Hill 1922)for different pressure levels. The pressure dependency of thecharacteristic impedance, Eq. 16, for the reference paramet-ric case 2 at interfaces �IUV, �DV and �LPV, can been seenin Fig. 10.
2.2.7 Coupling procedure
The following outlines the procedure to couple and solve thelumped models, flow and structure, as a 3D-0D FSI modelof the IUV, DV and LPV bifurcation.
• Lumped 0D model to 3D fluid coupling
Backward Euler is used to advance the lumped models intime, to match the time discretization in the fluid solver (seeAppendix) (Vierendeels et al. 2005).The lumped models Oreturn the pressures
Pi = O(qi ), (17)
123
P. R. Leinan et al.
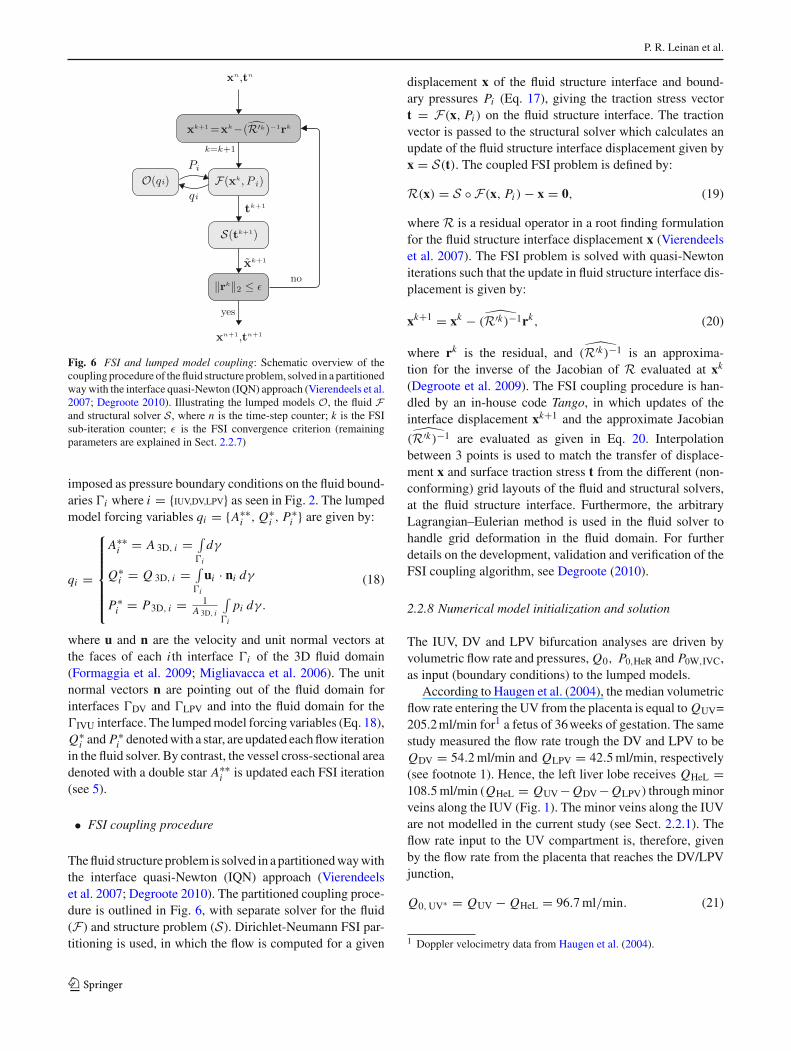
Fig. 6 FSI and lumped model coupling: Schematic overview of thecoupling procedure of the fluid structure problem, solved in a partitionedway with the interface quasi-Newton (IQN) approach (Vierendeels et al.2007; Degroote 2010). Illustrating the lumped models O, the fluid Fand structural solver S, where n is the time-step counter; k is the FSIsub-iteration counter; ε is the FSI convergence criterion (remainingparameters are explained in Sect. 2.2.7)
imposed as pressure boundary conditions on the fluid bound-aries �i where i = {IUV,DV,LPV} as seen in Fig. 2. The lumpedmodel forcing variables qi = {A∗∗
i , Q∗i , P∗
i } are given by:
qi =
⎧⎪⎪⎪⎪⎪⎨⎪⎪⎪⎪⎪⎩
A∗∗i = A 3D, i = ∫
�i
dγ
Q∗i = Q 3D, i = ∫
�i
ui · ni dγ
P∗i = P3D, i = 1
A 3D, i
∫�i
pi dγ.
(18)
where u and n are the velocity and unit normal vectors atthe faces of each i th interface �i of the 3D fluid domain(Formaggia et al. 2009; Migliavacca et al. 2006). The unitnormal vectors n are pointing out of the fluid domain forinterfaces �DV and �LPV and into the fluid domain for the�IVU interface. The lumped model forcing variables (Eq. 18),Q∗
i and P∗i denoted with a star, are updated each flow iteration
in the fluid solver. By contrast, the vessel cross-sectional areadenoted with a double star A∗∗
i is updated each FSI iteration(see 5).
• FSI coupling procedure
The fluid structure problem is solved in a partitioned way withthe interface quasi-Newton (IQN) approach (Vierendeelset al. 2007; Degroote 2010). The partitioned coupling proce-dure is outlined in Fig. 6, with separate solver for the fluid(F) and structure problem (S). Dirichlet-Neumann FSI par-titioning is used, in which the flow is computed for a given
displacement x of the fluid structure interface and bound-ary pressures Pi (Eq. 17), giving the traction stress vectort = F(x, Pi ) on the fluid structure interface. The tractionvector is passed to the structural solver which calculates anupdate of the fluid structure interface displacement given byx = S(t). The coupled FSI problem is defined by:
R(x) = S ◦ F(x, Pi ) − x = 0, (19)
where R is a residual operator in a root finding formulationfor the fluid structure interface displacement x (Vierendeelset al. 2007). The FSI problem is solved with quasi-Newtoniterations such that the update in fluid structure interface dis-placement is given by:
xk+1 = xk − ̂(R′k)−1rk, (20)
where rk is the residual, and ̂(R′k)−1 is an approxima-tion for the inverse of the Jacobian of R evaluated at xk
(Degroote et al. 2009). The FSI coupling procedure is han-dled by an in-house code Tango, in which updates of theinterface displacement xk+1 and the approximate Jacobian̂(R′k)−1 are evaluated as given in Eq. 20. Interpolation
between 3 points is used to match the transfer of displace-ment x and surface traction stress t from the different (non-conforming) grid layouts of the fluid and structural solvers,at the fluid structure interface. Furthermore, the arbitraryLagrangian–Eulerian method is used in the fluid solver tohandle grid deformation in the fluid domain. For furtherdetails on the development, validation and verification of theFSI coupling algorithm, see Degroote (2010).
2.2.8 Numerical model initialization and solution
The IUV, DV and LPV bifurcation analyses are driven byvolumetric flow rate and pressures, Q0, P0,HeR and P0W,IVC,as input (boundary conditions) to the lumped models.
According to Haugen et al. (2004), the median volumetricflow rate entering the UV from the placenta is equal to QUV=205.2 ml/min for1 a fetus of 36 weeks of gestation. The samestudy measured the flow rate trough the DV and LPV to beQDV = 54.2 ml/min and QLPV = 42.5 ml/min, respectively(see footnote 1). Hence, the left liver lobe receives QHeL =108.5 ml/min (QHeL = QUV − QDV − QLPV) through minorveins along the IUV (Fig. 1). The minor veins along the IUVare not modelled in the current study (see Sect. 2.2.1). Theflow rate input to the UV compartment is, therefore, givenby the flow rate from the placenta that reaches the DV/LPVjunction,
Q0, UV∗ = QUV − QHeL = 96.7 ml/min. (21)
1 Doppler velocimetry data from Haugen et al. (2004).
123
Velocity profiles in the human ductus venosus
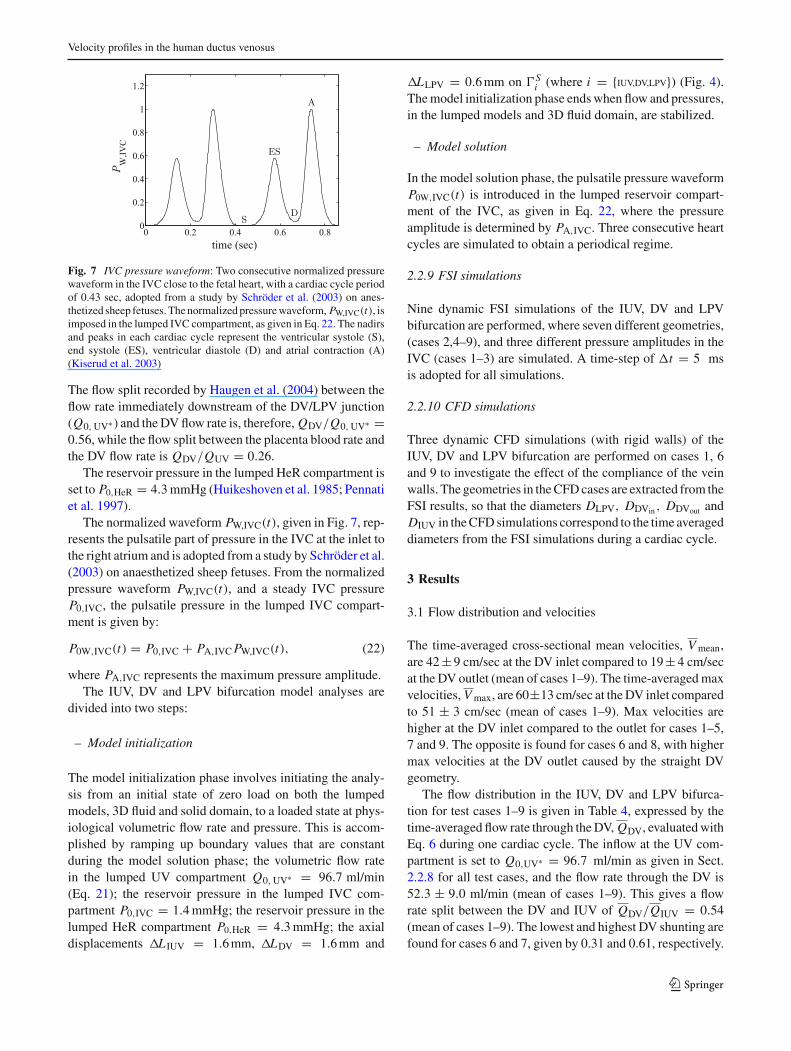
Fig. 7 IVC pressure waveform: Two consecutive normalized pressurewaveform in the IVC close to the fetal heart, with a cardiac cycle periodof 0.43 sec, adopted from a study by Schröder et al. (2003) on anes-thetized sheep fetuses. The normalized pressure waveform, PW,IVC(t), isimposed in the lumped IVC compartment, as given in Eq. 22. The nadirsand peaks in each cardiac cycle represent the ventricular systole (S),end systole (ES), ventricular diastole (D) and atrial contraction (A)(Kiserud et al. 2003)
The flow split recorded by Haugen et al. (2004) between theflow rate immediately downstream of the DV/LPV junction(Q0, UV∗ ) and the DV flow rate is, therefore, QDV/Q0, UV∗ =0.56, while the flow split between the placenta blood rate andthe DV flow rate is QDV/QUV = 0.26.
The reservoir pressure in the lumped HeR compartment isset to P0,HeR = 4.3 mmHg (Huikeshoven et al. 1985; Pennatiet al. 1997).
The normalized waveform PW,IVC(t), given in Fig. 7, rep-resents the pulsatile part of pressure in the IVC at the inlet tothe right atrium and is adopted from a study by Schröder et al.(2003) on anaesthetized sheep fetuses. From the normalizedpressure waveform PW,IVC(t), and a steady IVC pressureP0,IVC, the pulsatile pressure in the lumped IVC compart-ment is given by:
P0W,IVC(t) = P0,IVC + PA,IVC PW,IVC(t), (22)
where PA,IVC represents the maximum pressure amplitude.The IUV, DV and LPV bifurcation model analyses are
divided into two steps:
– Model initialization
The model initialization phase involves initiating the analy-sis from an initial state of zero load on both the lumpedmodels, 3D fluid and solid domain, to a loaded state at phys-iological volumetric flow rate and pressure. This is accom-plished by ramping up boundary values that are constantduring the model solution phase; the volumetric flow ratein the lumped UV compartment Q0, UV∗ = 96.7 ml/min(Eq. 21); the reservoir pressure in the lumped IVC com-partment P0,IVC = 1.4 mmHg; the reservoir pressure in thelumped HeR compartment P0,HeR = 4.3 mmHg; the axialdisplacements L IUV = 1.6 mm, LDV = 1.6 mm and
LLPV = 0.6 mm on �Si (where i = {IUV,DV,LPV}) (Fig. 4).
The model initialization phase ends when flow and pressures,in the lumped models and 3D fluid domain, are stabilized.
– Model solution
In the model solution phase, the pulsatile pressure waveformP0W,IVC(t) is introduced in the lumped reservoir compart-ment of the IVC, as given in Eq. 22, where the pressureamplitude is determined by PA,IVC. Three consecutive heartcycles are simulated to obtain a periodical regime.
2.2.9 FSI simulations
Nine dynamic FSI simulations of the IUV, DV and LPVbifurcation are performed, where seven different geometries,(cases 2,4–9), and three different pressure amplitudes in theIVC (cases 1–3) are simulated. A time-step of t = 5 msis adopted for all simulations.
2.2.10 CFD simulations
Three dynamic CFD simulations (with rigid walls) of theIUV, DV and LPV bifurcation are performed on cases 1, 6and 9 to investigate the effect of the compliance of the veinwalls. The geometries in the CFD cases are extracted from theFSI results, so that the diameters DLPV, DDVin , DDVout andDIUV in the CFD simulations correspond to the time averageddiameters from the FSI simulations during a cardiac cycle.
3 Results
3.1 Flow distribution and velocities
The time-averaged cross-sectional mean velocities, V mean,are 42 ± 9 cm/sec at the DV inlet compared to 19 ± 4 cm/secat the DV outlet (mean of cases 1–9). The time-averaged maxvelocities, V max, are 60±13 cm/sec at the DV inlet comparedto 51 ± 3 cm/sec (mean of cases 1–9). Max velocities arehigher at the DV inlet compared to the outlet for cases 1–5,7 and 9. The opposite is found for cases 6 and 8, with highermax velocities at the DV outlet caused by the straight DVgeometry.
The flow distribution in the IUV, DV and LPV bifurca-tion for test cases 1–9 is given in Table 4, expressed by thetime-averaged flow rate through the DV, QDV, evaluated withEq. 6 during one cardiac cycle. The inflow at the UV com-partment is set to Q0,UV∗ = 96.7 ml/min as given in Sect.2.2.8 for all test cases, and the flow rate through the DV is52.3 ± 9.0 ml/min (mean of cases 1–9). This gives a flowrate split between the DV and IUV of QDV/QIUV = 0.54(mean of cases 1–9). The lowest and highest DV shunting arefound for cases 6 and 7, given by 0.31 and 0.61, respectively.
123
P. R. Leinan et al.
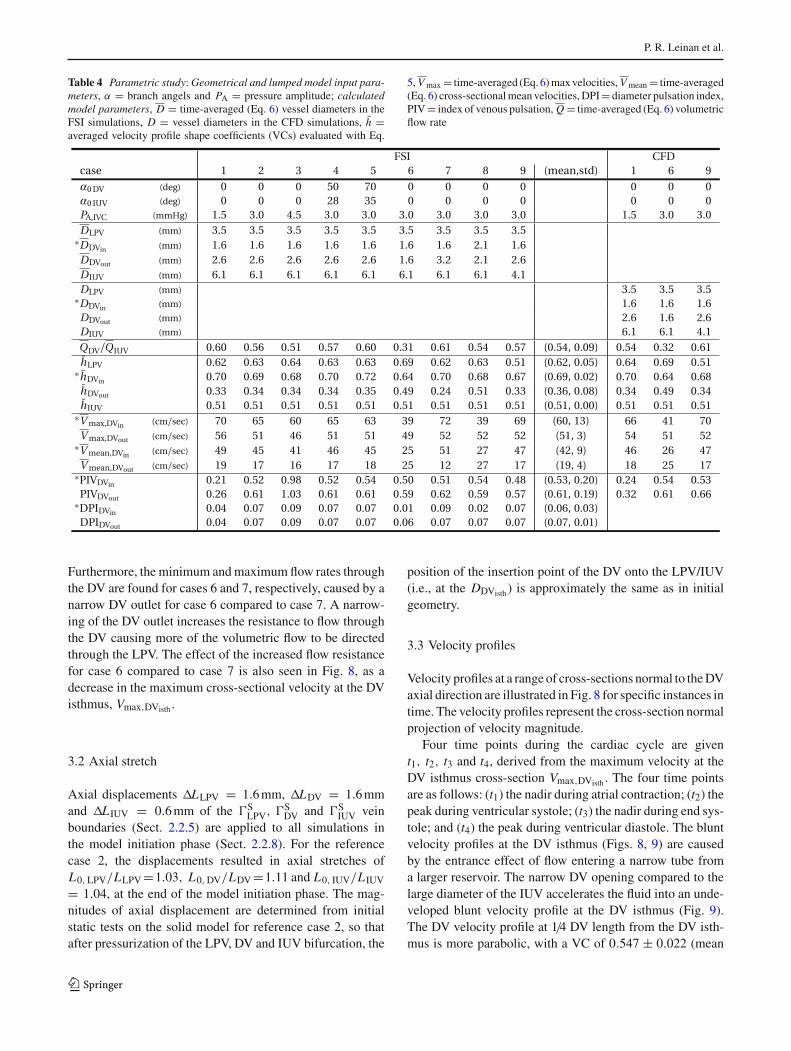
Table 4 Parametric study: Geometrical and lumped model input para-meters, α = branch angels and PA = pressure amplitude; calculatedmodel parameters, D = time-averaged (Eq. 6) vessel diameters in theFSI simulations, D = vessel diameters in the CFD simulations, h̄ =averaged velocity profile shape coefficients (VCs) evaluated with Eq.
5, V max = time-averaged (Eq. 6) max velocities, V mean = time-averaged(Eq. 6) cross-sectional mean velocities, DPI = diameter pulsation index,PIV = index of venous pulsation, Q = time-averaged (Eq. 6) volumetricflow rate
Furthermore, the minimum and maximum flow rates throughthe DV are found for cases 6 and 7, respectively, caused by anarrow DV outlet for case 6 compared to case 7. A narrow-ing of the DV outlet increases the resistance to flow throughthe DV causing more of the volumetric flow to be directedthrough the LPV. The effect of the increased flow resistancefor case 6 compared to case 7 is also seen in Fig. 8, as adecrease in the maximum cross-sectional velocity at the DVisthmus, Vmax,DVisth .
3.2 Axial stretch
Axial displacements LLPV = 1.6 mm, LDV = 1.6 mmand L IUV = 0.6 mm of the �S
LPV, �SDV and �S
IUV veinboundaries (Sect. 2.2.5) are applied to all simulations inthe model initiation phase (Sect. 2.2.8). For the referencecase 2, the displacements resulted in axial stretches ofL0, LPV/LLPV =1.03, L0, DV/LDV =1.11 and L0, IUV/L IUV
= 1.04, at the end of the model initiation phase. The mag-nitudes of axial displacement are determined from initialstatic tests on the solid model for reference case 2, so thatafter pressurization of the LPV, DV and IUV bifurcation, the
position of the insertion point of the DV onto the LPV/IUV(i.e., at the DDVisth ) is approximately the same as in initialgeometry.
3.3 Velocity profiles
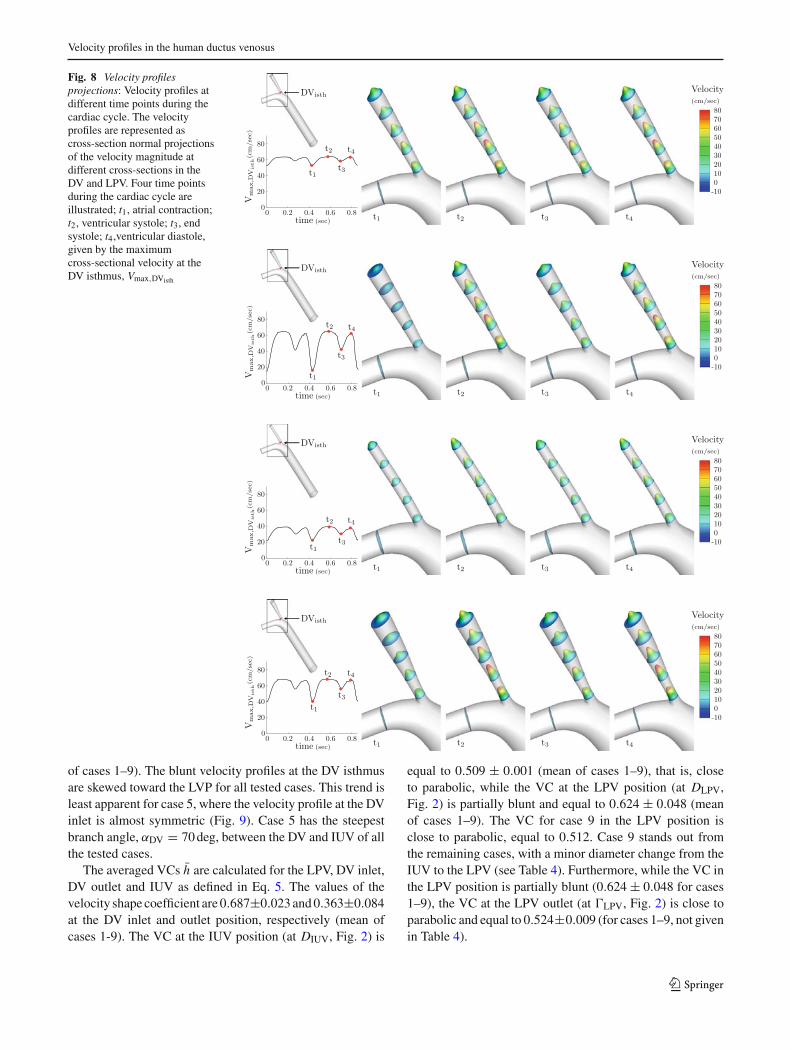
Velocity profiles at a range of cross-sections normal to the DVaxial direction are illustrated in Fig. 8 for specific instances intime. The velocity profiles represent the cross-section normalprojection of velocity magnitude.
Four time points during the cardiac cycle are givent1, t2, t3 and t4, derived from the maximum velocity at theDV isthmus cross-section Vmax,DVisth . The four time pointsare as follows: (t1) the nadir during atrial contraction; (t2) thepeak during ventricular systole; (t3) the nadir during end sys-tole; and (t4) the peak during ventricular diastole. The bluntvelocity profiles at the DV isthmus (Figs. 8, 9) are causedby the entrance effect of flow entering a narrow tube froma larger reservoir. The narrow DV opening compared to thelarge diameter of the IUV accelerates the fluid into an unde-veloped blunt velocity profile at the DV isthmus (Fig. 9).The DV velocity profile at 1/4 DV length from the DV isth-mus is more parabolic, with a VC of 0.547 ± 0.022 (mean
123
Velocity profiles in the human ductus venosus
Fig. 8 Velocity profilesprojections: Velocity profiles atdifferent time points during thecardiac cycle. The velocityprofiles are represented ascross-section normal projectionsof the velocity magnitude atdifferent cross-sections in theDV and LPV. Four time pointsduring the cardiac cycle areillustrated; t1, atrial contraction;t2, ventricular systole; t3, endsystole; t4,ventricular diastole,given by the maximumcross-sectional velocity at theDV isthmus, Vmax,DVisth
of cases 1–9). The blunt velocity profiles at the DV isthmusare skewed toward the LVP for all tested cases. This trend isleast apparent for case 5, where the velocity profile at the DVinlet is almost symmetric (Fig. 9). Case 5 has the steepestbranch angle, αDV = 70 deg, between the DV and IUV of allthe tested cases.
The averaged VCs h̄ are calculated for the LPV, DV inlet,DV outlet and IUV as defined in Eq. 5. The values of thevelocity shape coefficient are 0.687±0.023 and 0.363±0.084at the DV inlet and outlet position, respectively (mean ofcases 1-9). The VC at the IUV position (at DIUV, Fig. 2) is
equal to 0.509 ± 0.001 (mean of cases 1–9), that is, closeto parabolic, while the VC at the LPV position (at DLPV,Fig. 2) is partially blunt and equal to 0.624 ± 0.048 (meanof cases 1–9). The VC for case 9 in the LPV position isclose to parabolic, equal to 0.512. Case 9 stands out fromthe remaining cases, with a minor diameter change from theIUV to the LPV (see Table 4). Furthermore, while the VC inthe LPV position is partially blunt (0.624 ± 0.048 for cases1–9), the VC at the LPV outlet (at �LPV, Fig. 2) is close toparabolic and equal to 0.524±0.009 (for cases 1–9, not givenin Table 4).
123
P. R. Leinan et al.
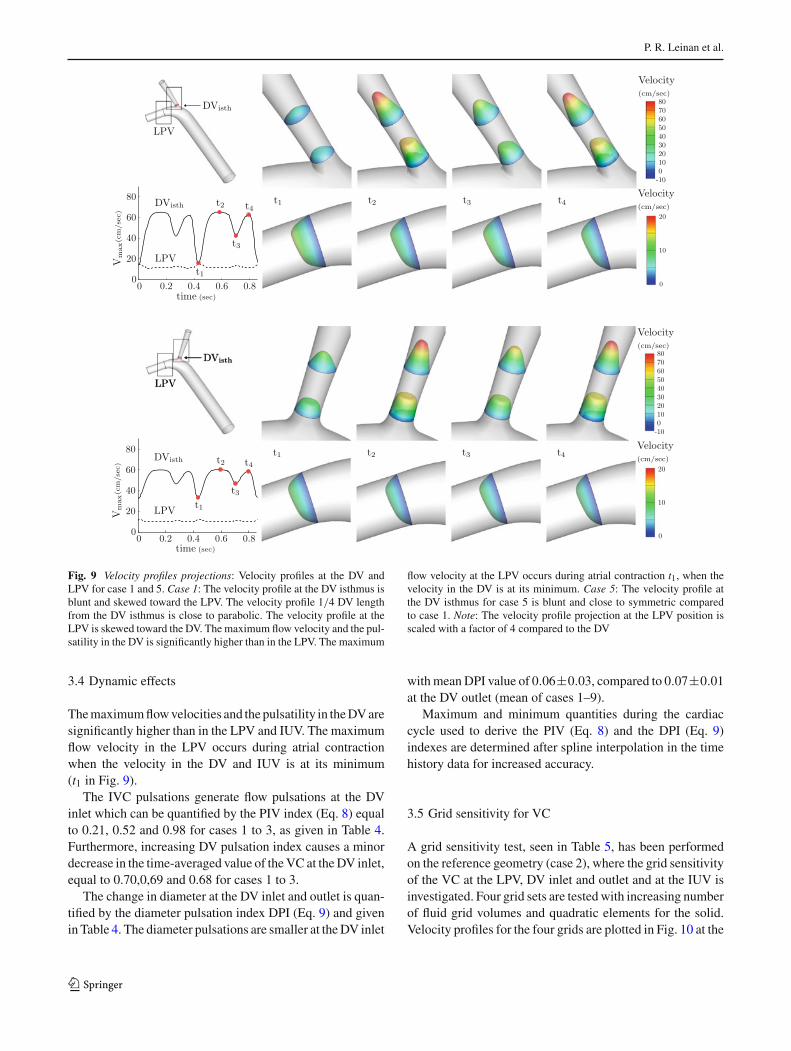
Fig. 9 Velocity profiles projections: Velocity profiles at the DV andLPV for case 1 and 5. Case 1: The velocity profile at the DV isthmus isblunt and skewed toward the LPV. The velocity profile 1/4 DV lengthfrom the DV isthmus is close to parabolic. The velocity profile at theLPV is skewed toward the DV. The maximum flow velocity and the pul-satility in the DV is significantly higher than in the LPV. The maximum
flow velocity at the LPV occurs during atrial contraction t1, when thevelocity in the DV is at its minimum. Case 5: The velocity profile atthe DV isthmus for case 5 is blunt and close to symmetric comparedto case 1. Note: The velocity profile projection at the LPV position isscaled with a factor of 4 compared to the DV
3.4 Dynamic effects
The maximum flow velocities and the pulsatility in the DV aresignificantly higher than in the LPV and IUV. The maximumflow velocity in the LPV occurs during atrial contractionwhen the velocity in the DV and IUV is at its minimum(t1 in Fig. 9).
The IVC pulsations generate flow pulsations at the DVinlet which can be quantified by the PIV index (Eq. 8) equalto 0.21, 0.52 and 0.98 for cases 1 to 3, as given in Table 4.Furthermore, increasing DV pulsation index causes a minordecrease in the time-averaged value of the VC at the DV inlet,equal to 0.70,0,69 and 0.68 for cases 1 to 3.
The change in diameter at the DV inlet and outlet is quan-tified by the diameter pulsation index DPI (Eq. 9) and givenin Table 4. The diameter pulsations are smaller at the DV inlet
with mean DPI value of 0.06±0.03, compared to 0.07±0.01at the DV outlet (mean of cases 1–9).
Maximum and minimum quantities during the cardiaccycle used to derive the PIV (Eq. 8) and the DPI (Eq. 9)indexes are determined after spline interpolation in the timehistory data for increased accuracy.
3.5 Grid sensitivity for VC
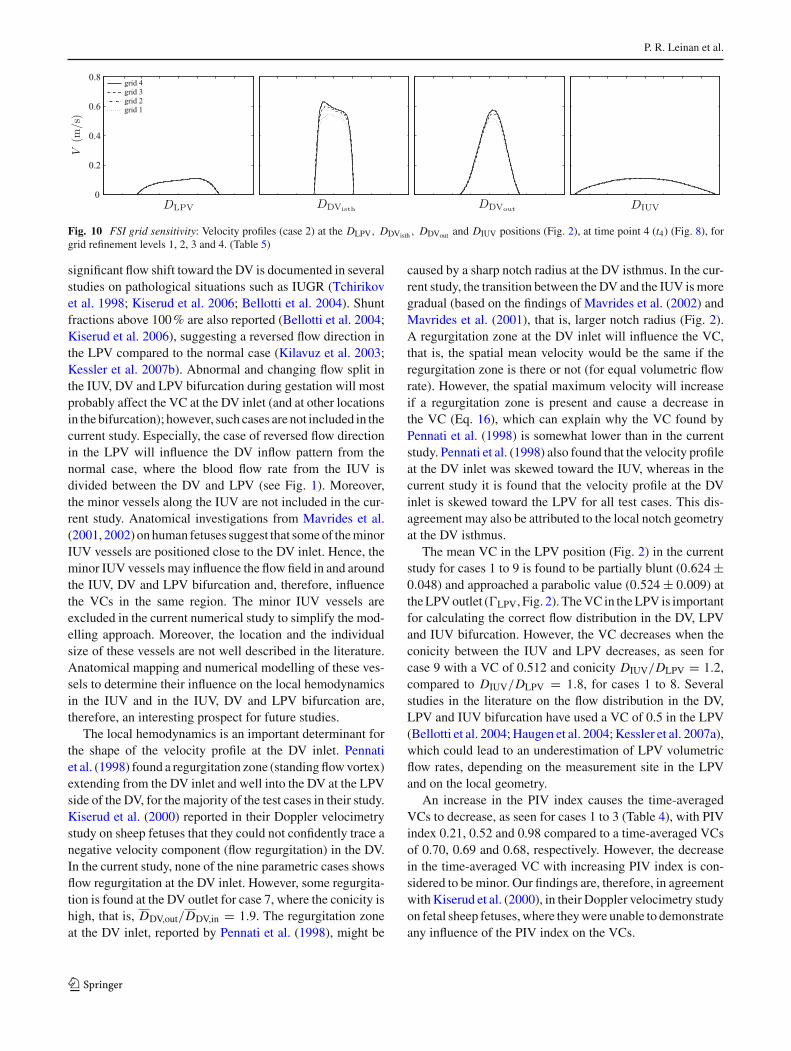
A grid sensitivity test, seen in Table 5, has been performedon the reference geometry (case 2), where the grid sensitivityof the VC at the LPV, DV inlet and outlet and at the IUV isinvestigated. Four grid sets are tested with increasing numberof fluid grid volumes and quadratic elements for the solid.Velocity profiles for the four grids are plotted in Fig. 10 at the
123
Velocity profiles in the human ductus venosus
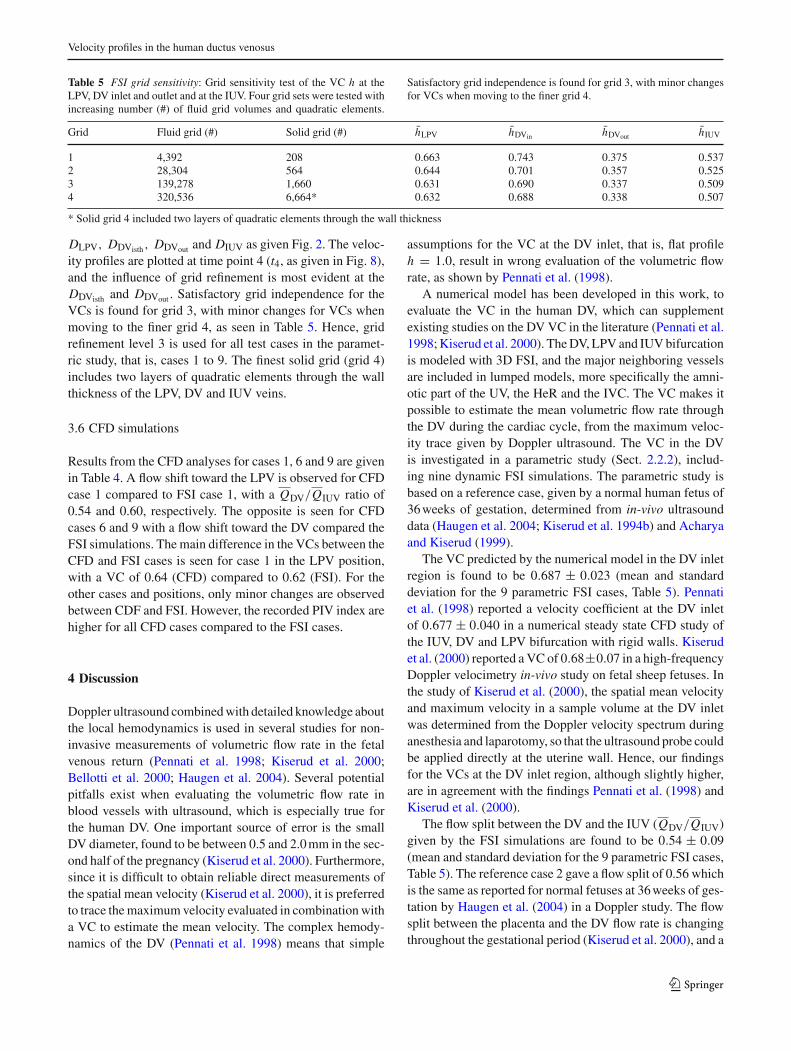
Table 5 FSI grid sensitivity: Grid sensitivity test of the VC h at theLPV, DV inlet and outlet and at the IUV. Four grid sets were tested withincreasing number (#) of fluid grid volumes and quadratic elements.
Satisfactory grid independence is found for grid 3, with minor changesfor VCs when moving to the finer grid 4.
Grid Fluid grid (#) Solid grid (#) h̄LPV h̄DVin h̄DVout h̄IUV
1 4,392 208 0.663 0.743 0.375 0.5372 28,304 564 0.644 0.701 0.357 0.5253 139,278 1,660 0.631 0.690 0.337 0.5094 320,536 6,664* 0.632 0.688 0.338 0.507
* Solid grid 4 included two layers of quadratic elements through the wall thickness
DLPV, DDVisth, DDVout and DIUV as given Fig. 2. The veloc-ity profiles are plotted at time point 4 (t4, as given in Fig. 8),and the influence of grid refinement is most evident at theDDVisth and DDVout . Satisfactory grid independence for theVCs is found for grid 3, with minor changes for VCs whenmoving to the finer grid 4, as seen in Table 5. Hence, gridrefinement level 3 is used for all test cases in the paramet-ric study, that is, cases 1 to 9. The finest solid grid (grid 4)includes two layers of quadratic elements through the wallthickness of the LPV, DV and IUV veins.
3.6 CFD simulations
Results from the CFD analyses for cases 1, 6 and 9 are givenin Table 4. A flow shift toward the LPV is observed for CFDcase 1 compared to FSI case 1, with a QDV/QIUV ratio of0.54 and 0.60, respectively. The opposite is seen for CFDcases 6 and 9 with a flow shift toward the DV compared theFSI simulations. The main difference in the VCs between theCFD and FSI cases is seen for case 1 in the LPV position,with a VC of 0.64 (CFD) compared to 0.62 (FSI). For theother cases and positions, only minor changes are observedbetween CDF and FSI. However, the recorded PIV index arehigher for all CFD cases compared to the FSI cases.
4 Discussion
Doppler ultrasound combined with detailed knowledge aboutthe local hemodynamics is used in several studies for non-invasive measurements of volumetric flow rate in the fetalvenous return (Pennati et al. 1998; Kiserud et al. 2000;Bellotti et al. 2000; Haugen et al. 2004). Several potentialpitfalls exist when evaluating the volumetric flow rate inblood vessels with ultrasound, which is especially true forthe human DV. One important source of error is the smallDV diameter, found to be between 0.5 and 2.0 mm in the sec-ond half of the pregnancy (Kiserud et al. 2000). Furthermore,since it is difficult to obtain reliable direct measurements ofthe spatial mean velocity (Kiserud et al. 2000), it is preferredto trace the maximum velocity evaluated in combination witha VC to estimate the mean velocity. The complex hemody-namics of the DV (Pennati et al. 1998) means that simple
assumptions for the VC at the DV inlet, that is, flat profileh = 1.0, result in wrong evaluation of the volumetric flowrate, as shown by Pennati et al. (1998).
A numerical model has been developed in this work, toevaluate the VC in the human DV, which can supplementexisting studies on the DV VC in the literature (Pennati et al.1998; Kiserud et al. 2000). The DV, LPV and IUV bifurcationis modeled with 3D FSI, and the major neighboring vesselsare included in lumped models, more specifically the amni-otic part of the UV, the HeR and the IVC. The VC makes itpossible to estimate the mean volumetric flow rate throughthe DV during the cardiac cycle, from the maximum veloc-ity trace given by Doppler ultrasound. The VC in the DVis investigated in a parametric study (Sect. 2.2.2), includ-ing nine dynamic FSI simulations. The parametric study isbased on a reference case, given by a normal human fetus of36 weeks of gestation, determined from in-vivo ultrasounddata (Haugen et al. 2004; Kiserud et al. 1994b) and Acharyaand Kiserud (1999).
The VC predicted by the numerical model in the DV inletregion is found to be 0.687 ± 0.023 (mean and standarddeviation for the 9 parametric FSI cases, Table 5). Pennatiet al. (1998) reported a velocity coefficient at the DV inletof 0.677 ± 0.040 in a numerical steady state CFD study ofthe IUV, DV and LPV bifurcation with rigid walls. Kiserudet al. (2000) reported a VC of 0.68±0.07 in a high-frequencyDoppler velocimetry in-vivo study on fetal sheep fetuses. Inthe study of Kiserud et al. (2000), the spatial mean velocityand maximum velocity in a sample volume at the DV inletwas determined from the Doppler velocity spectrum duringanesthesia and laparotomy, so that the ultrasound probe couldbe applied directly at the uterine wall. Hence, our findingsfor the VCs at the DV inlet region, although slightly higher,are in agreement with the findings Pennati et al. (1998) andKiserud et al. (2000).
The flow split between the DV and the IUV (QDV/QIUV)given by the FSI simulations are found to be 0.54 ± 0.09(mean and standard deviation for the 9 parametric FSI cases,Table 5). The reference case 2 gave a flow split of 0.56 whichis the same as reported for normal fetuses at 36 weeks of ges-tation by Haugen et al. (2004) in a Doppler study. The flowsplit between the placenta and the DV flow rate is changingthroughout the gestational period (Kiserud et al. 2000), and a
123
P. R. Leinan et al.
Fig. 10 FSI grid sensitivity: Velocity profiles (case 2) at the DLPV, DDVisth , DDVout and DIUV positions (Fig. 2), at time point 4 (t4) (Fig. 8), forgrid refinement levels 1, 2, 3 and 4. (Table 5)
significant flow shift toward the DV is documented in severalstudies on pathological situations such as IUGR (Tchirikovet al. 1998; Kiserud et al. 2006; Bellotti et al. 2004). Shuntfractions above 100 % are also reported (Bellotti et al. 2004;Kiserud et al. 2006), suggesting a reversed flow direction inthe LPV compared to the normal case (Kilavuz et al. 2003;Kessler et al. 2007b). Abnormal and changing flow split inthe IUV, DV and LPV bifurcation during gestation will mostprobably affect the VC at the DV inlet (and at other locationsin the bifurcation); however, such cases are not included in thecurrent study. Especially, the case of reversed flow directionin the LPV will influence the DV inflow pattern from thenormal case, where the blood flow rate from the IUV isdivided between the DV and LPV (see Fig. 1). Moreover,the minor vessels along the IUV are not included in the cur-rent study. Anatomical investigations from Mavrides et al.(2001, 2002) on human fetuses suggest that some of the minorIUV vessels are positioned close to the DV inlet. Hence, theminor IUV vessels may influence the flow field in and aroundthe IUV, DV and LPV bifurcation and, therefore, influencethe VCs in the same region. The minor IUV vessels areexcluded in the current numerical study to simplify the mod-elling approach. Moreover, the location and the individualsize of these vessels are not well described in the literature.Anatomical mapping and numerical modelling of these ves-sels to determine their influence on the local hemodynamicsin the IUV and in the IUV, DV and LPV bifurcation are,therefore, an interesting prospect for future studies.
The local hemodynamics is an important determinant forthe shape of the velocity profile at the DV inlet. Pennatiet al. (1998) found a regurgitation zone (standing flow vortex)extending from the DV inlet and well into the DV at the LPVside of the DV, for the majority of the test cases in their study.Kiserud et al. (2000) reported in their Doppler velocimetrystudy on sheep fetuses that they could not confidently trace anegative velocity component (flow regurgitation) in the DV.In the current study, none of the nine parametric cases showsflow regurgitation at the DV inlet. However, some regurgita-tion is found at the DV outlet for case 7, where the conicity ishigh, that is, DDV,out/DDV,in = 1.9. The regurgitation zoneat the DV inlet, reported by Pennati et al. (1998), might be
caused by a sharp notch radius at the DV isthmus. In the cur-rent study, the transition between the DV and the IUV is moregradual (based on the findings of Mavrides et al. (2002) andMavrides et al. (2001), that is, larger notch radius (Fig. 2).A regurgitation zone at the DV inlet will influence the VC,that is, the spatial mean velocity would be the same if theregurgitation zone is there or not (for equal volumetric flowrate). However, the spatial maximum velocity will increaseif a regurgitation zone is present and cause a decrease inthe VC (Eq. 16), which can explain why the VC found byPennati et al. (1998) is somewhat lower than in the currentstudy. Pennati et al. (1998) also found that the velocity profileat the DV inlet was skewed toward the IUV, whereas in thecurrent study it is found that the velocity profile at the DVinlet is skewed toward the LPV for all test cases. This dis-agreement may also be attributed to the local notch geometryat the DV isthmus.
The mean VC in the LPV position (Fig. 2) in the currentstudy for cases 1 to 9 is found to be partially blunt (0.624 ±0.048) and approached a parabolic value (0.524 ± 0.009) atthe LPV outlet (�LPV, Fig. 2). The VC in the LPV is importantfor calculating the correct flow distribution in the DV, LPVand IUV bifurcation. However, the VC decreases when theconicity between the IUV and LPV decreases, as seen forcase 9 with a VC of 0.512 and conicity DIUV/DLPV = 1.2,compared to DIUV/DLPV = 1.8, for cases 1 to 8. Severalstudies in the literature on the flow distribution in the DV,LPV and IUV bifurcation have used a VC of 0.5 in the LPV(Bellotti et al. 2004; Haugen et al. 2004; Kessler et al. 2007a),which could lead to an underestimation of LPV volumetricflow rates, depending on the measurement site in the LPVand on the local geometry.
An increase in the PIV index causes the time-averagedVCs to decrease, as seen for cases 1 to 3 (Table 4), with PIVindex 0.21, 0.52 and 0.98 compared to a time-averaged VCsof 0.70, 0.69 and 0.68, respectively. However, the decreasein the time-averaged VC with increasing PIV index is con-sidered to be minor. Our findings are, therefore, in agreementwith Kiserud et al. (2000), in their Doppler velocimetry studyon fetal sheep fetuses, where they were unable to demonstrateany influence of the PIV index on the VCs.
123
Velocity profiles in the human ductus venosus
The diameter pulsations are quantified by the diameterpulsation index DPI (Eq. 9), at the DV inlet and outlet(Table 4). The diameter pulsations are highest at the DV out-let with a mean value for cases 1 to 9 of 0.07±0.01, comparedto 0.06 ± 0.03 at the inlet. The magnitude of the diameterpulsations in the current numerical study at the DV inlet iscomparable to the diameter pulsations observed by Acharyaand Kiserud (1999) in a Doppler velocimetry study on humanfetuses, who reported a mean DPI of 0.21 and a medianDPI of 0.05, at the DV inlet for 20 fetuses (gestational age19–40 weeks). However, Acharya and Kiserud (1999)reported mean DPI of 0.40 and median DPI of 0.65 at theDV outlet, which is significantly higher than in the currentnumerical study.
CFD simulations of cases 1, 6 and 9 (Table 4) are includedin the current study with same boundary conditions as in therespective FSI cases, to investigate the effect of the com-pliance of the vein walls. A flow shift toward the LPV isobserved for CFD case 1 and toward the DV for cases 6and 9, compared to the FSI simulations as seen in Table 4.The resistance to flow during the cardiac cycle is constantwith respect to the vessel cross-sectional areas in the CFDsimulations, compared to the FSI simulations where the ves-sel areas change during the cardiac cycle due to changes inthe transmural pressure. Additionally, the rigid walls in theCFD simulations caused the PIV index magnitude to increasecompared to the FSI PIV index, as seen in Table 4. Onlyminor changes in the predicted VCs are observed betweenthe CFD and FSI simulations. The main difference is seenfor case 1 in the LPV position, with a CFD VC of 0.64 for thecompared to a FSI VC of 0.62. However, further investiga-tions are needed to determined whether FSI predicts differentVCs compared to CFD in the case of higher DPI index (i.e.,larger deformations caused by softer vein walls/high pres-sure variations). For example, Acharya and Kiserud (1999)reported DPI indexes of 0.21 and 0.40 at the DV inlet andoutlet, respectively, in an ultrasound study on human fetuses,which is notably higher seen in the current FSI simulations(Table 4). Additionally, the current numerical study did notinclude abnormal/diseased conditions such as reversed flowin the LPV and flow reversal in the DV during atrial contrac-tion, which may induce greater differences between CFD andFSI in terms of VCs.
The validity of the current simulations is linked by a num-ber of factors to be discussed in the following. Foremost,ultrasound studies of the human DV from the literature showthat significant variability exists with respect to blood flowand geometry, both with respect to gestational age and esti-mated fetal weight, and also between individuals for a spe-cific gestational age/fetal weight (Bellotti et al. 2000, 2004;Kiserud et al. 2000). The scope of the current study is aimedat numerical investigation of the VC at the DV inlet for nor-mal human fetuses in the later stages of gestation (around
36 weeks), and on the sensitivity in the predicted VCs for vari-ations of some important parameters, such as branch angleand vessel diameters, and on the pressure waveform in theIVC (see parametric study Sect. 2.2.2). Investigations intoVCs in the DV over a wider physiological and pathologi-cal range, for example, early pregnancy, are, therefore, leftto future studies. Secondly, the current model geometry rep-resents a simplified description of the LPV, DV and IUVbifurcation, for example, the minor vessel branches such asthe vessels along the IUV are excluded. A more detailed rep-resentation of the LPV, DV and IUV bifurcation includingminor vessels branches, especially along the IUV, and theireffect on the VC at the DV inlet is an interesting prospectfor future studies. Finally, the limited data available in theliterature for the compliance of the LPV, DV and IUV veinsand for the employed lumped models represent a challengefor the current modeling approach. Hence, further studieson these issues for human fetal conditions are called for toincrease the confidence for future modeling approaches inthe fetal venous return.
In conclusion, the numerical model of the DV, LPV andIUV bifurcation developed in this work using pulsatile flowand distensible vessel walls confirms previous studies basedon steady flow and rigid walls (Pennati et al. 1998), regardingthe VC at the DV inlet. The VC at the DV inlet is found tobe 0.687 ± 0.023, which is in agreement with the numericalfindings by Pennati et al. (1998) and Doppler velocimetrymeasurements by Kiserud et al. (2000). Compared to numer-ical models of the DV, LPV and IUV bifurcation in the liter-ature (Pennati et al. 1998; Hellevik et al. 1998b), the currentmodel takes into account the interaction between the veinsand blood flow (FSI) and includes lumped boundary models.Additionally, CFD simulations with rigid walls performedin the current study produced only minor differences in thepredicted VCs compared to the FSI simulations. Hence, ourresults indicate that wall compliance does not significantlyalter the VCs predictions in the LPV, DV and IUV bifurcation,and that rigid wall CFD simulations as performed by Pennatiet al. (1998) may be sufficient for predicting VCs for clinicalflow assessments in the DV. However, further model develop-ment and investigations on the impact of model input parame-ters are needed, to increase the confidence of velocity profilepredictions for Doppler ultrasound studies of the human DVover a wider physiological and pathological range.
5 Appendix
The following outlines the time discretization of the lumped0D models presented in Sect. 2.2.6 and the lumped model to3D fluid coupling as presented in Sect. 2.2.7.
The 3WK and ZcC lumped models are discretized in timewith a first-order implicit scheme and solved for the pressure
123
P. R. Leinan et al.
update Pn+1. The lumped model pressures P n+1i are updated
and imposed as pressure boundary conditions on the fluiddomain boundaries, �i (i = {IUV,DV,LPV}, Fig. 2), each flowiteration in the fluid solver.
In the following, the variables denoted with a star, thatis, P∗ and Q∗, are updated each flow iteration in the fluidsolver, whereas the vessel cross-sectional area denoted witha double star A∗∗ is updated each FSI iteration. The A∗∗, Q∗and P∗ variables are calculated from the end surface of thefluid domain boundaries, �i , connected to the lumped model,as given in Eq. 18.
• 3WK model
The 3WK model given in Eq. 14:
dP
dt+ (P − P0)
RCC= Zc
dQ
dt+ Q
dZc
dt+ Q
(1
C+ Zc
RCC
),
discretized with Backward Euler gives
Pn+1 =(
Pn + P̂ + P0t
τ
)/
(1 + t
τ
)(23)
τ = RCC
where P̂ is given by:
P̂ = Z∗c (Q∗ − Qn) + Q∗ (Z∗
c − Znc ) + Q∗
(1
C+ Z∗
c
τ
)t,
• UV compartment
The UV compartment given in Eq. 15:
d P
dt= −Zc
d Q
dt− Q
d Zc
dt+ (Q0 − Q)
C,
discretized with Backward Euler gives
Pn+1 = Pn + P̂ (24)
where P̂ is given by
P̂ = −Z∗c (Q∗ − Qn) − Q∗ (Z∗
c − Znc ) + (Q0 − Q∗)
Ct.
• Characteristic impedance Zc
The characteristic impedance Z∗c of the 3WK and UV com-
partment are evaluated as:
Z∗c = ρ f
A∗∗ c(P∗). (25)
where c(P∗) is the pulse wave velocity (see Sect. 2.2.5),and A∗∗ is the cross-sectional area of the terminating vesselconnected to the lumped models.
References
Acharya G, Kiserud T (1999) Pulsations of the ductus venosus bloodvelocity and diameter are more pronounced at the outlet than at theinlet. Eur J Obstet Gynecol Reprod Biol 84(2):149–154
Ailamazyan E, Kirillova O, Polyanin A, Kogan I (2003) Functionalmorphology of ductus venosus in human fetus. Neuroendocrinol Lett24(1/2):28–32
Beaudoin S, Bargy F, Mahieu D, Barbet P (1998) Anatomic study ofthe umbilical vein and ductus venosus in human fetuses: ultrasoundapplication in prenatal examination of left congenital diaphragmatichernia. Surg Radiol Anat 20(2):99–103
Bellotti M, Pennati G, Pardi G, Fumero R (1998) Dilatation of theductus venosus in human fetuses: ultrasonographic evidence andmathematical modeling. Am J Physiol Heart Circ Physiol 275(5):H1759
Bellotti M, Pennati G, De Gasperi C, Battaglia F, Ferrazzi E (2000) Roleof ductus venosus in distribution of umbilical blood flow in humanfetuses during second half of pregnancy. Am J Physiol Heart CircPhysiol 279(3):H1256
Bellotti M, Pennati G, Gasperi C, Bozzo M, Battaglia F, FerrazziE (2004) Simultaneous measurements of umbilical venous, fetalhepatic, and ductus venosus blood flow in growth-restricted humanfetuses. Am J Obstet Gynecol 190(5):1347–1358
Bramwell J, Hill A (1922) The velocity of the pulse wave in man. P RSoc London 93(652):298–306
Degroote J (2010) Development of algorithms for the partitioned simu-lation of strongly coupled fluid-structure interaction problems. PhDthesis, Ghent University
Degroote J, Bathe K, Vierendeels J (2009) Performance of a new par-titioned procedure versus a monolithic procedure in fluid-structureinteraction. Comput Struct 87(11–12):793–801
Formaggia L, Quarteroni A, Veneziani A (2009) Cardiovascular math-ematics: modeling and simulation of the circulatory system, vol 1.Springer, Berlin
Gasser T, Ogden R, Holzapfel G (2006) Hyperelastic modelling of arte-rial layers with distributed collagen fibre orientations. J Roy SocInterface 3(6):15–35
Haugen G, Kiserud T, Godfrey K, Crozier S, Hanson M (2004) Portaland umbilical venous blood supply to the liver in the human fetusnear term. Ultrasound Obstet Gynecol 24(6):599–605
Hecher K, Campbell S (1996) Characteristics of fetal venous blood flowunder normal circumstances and during fetal disease. UltrasoundObstet Gynecol 7(1):68–83
Hecher K, Campbell S, Snijders R, Nicolaides K (1994) Referenceranges for fetal venous and atrioventricular blood flow parameters.Ultrasound Obstet Gynecol 4(5):381–390
Hellevik L, Kiserud T, Irgens F, Stergiopulos N, Hanson M (1998a)Mechanical properties of the fetal ductus venosus and umbilical vein.Heart Vessel 13(4):175–180
Hellevik L, Kiserud T, Irgens F, Ytrehus T, Eik-Nes S (1998b)Simulation of pressure drop and energy dissipation for bloodflow in a human fetal bifurcation. J Biomech Eng 120(4):455–462
Hellevik L, Vierendeels J, Kiserud T, Stergiopulos N, Irgens F, Dick E,Riemslagh K, Verdonck P (2009) An assessment of ductus venosustapering and wave transmission from the fetal heart. Biomech ModelMechanobiol 8(6):509–517
Holzapfel G, Gasser T, Ogden R (2000) A new constitutive frameworkfor arterial wall mechanics and a comparative study of material mod-els. J Elast 61(1–3):1–48
Hoskins P (1990) Measurement of arterial blood flow by doppler ultra-sound. Clin Phys Physiol Meas 11:1
Huikeshoven F, Hope I, Power G, Gilbert R, Longo L (1985) Mathe-matical model of fetal circulation and oxygen delivery. Am J PhysiolRegul Integr Comp Physiol 249(2):R192
123
Velocity profiles in the human ductus venosus
Kessler J, Rasmussen S, Hanson M, Kiserud T (2006) Longitudinalreference ranges for ductus venosus flow velocities and waveformindices. Ultrasound Obstet Gynecol 28(7):890–898
Kessler J, Rasmussen S, Kiserud T (2007a) The fetal portal vein: normalblood flow development during the second half of human pregnancy.Ultrasound Obstet Gynecol 30(1):52–60
Kessler J, Rasmussen S, Kiserud T (2007b) The left portal vein as anindicator of watershed in the fetal circulation: development duringthe second half of pregnancy and a suggested method of evaluation.Ultrasound Obstet Gynecol 30(5):757–764
Kessler J, Rasmussen S, Godfrey K, Hanson M, Kiserud T (2008) Lon-gitudinal study of umbilical and portal venous blood flow to the fetalliver: low pregnancy weight gain is associated with preferential sup-ply to the fetal left liver lobe. Pediatr Res 63(3):315
Kessler J, Rasmussen S, Godfrey K, Hanson M, Kiserud T (2011)Venous liver blood flow and regulation of human fetal growth: evi-dence from macrosomic fetuses. Am J Obstet Gynecol 204:429.e1-7
Kilavuz Ö, Vetter K, Kiserud T, Vetter P (2003) The left portal vein is thewatershed of the fetal venous system. J Perinat Med 31(2):184–187
Kiserud T (2005) Physiology of the fetal circulation. In: Seminars infetal and neonatal medicine, Elsevier, vol 10, pp 493–503
Kiserud T, Eik-Nes S, Blaas H, Hellevik L (1991) Ultrasonographicvelocimetry of the fetal ductus venosus. Lancet 338(8780):1412–1414
Kiserud T, Eik-Nes S, Hellevik L, Blaas H (1992) Ductus venosus: alongitudinal doppler velocimetric study of the human fetus. J Matern-fetal Inves 2(1):5–11
Kiserud T, Eik-Nes S, Blaas H, Hellevik L, Simensen B (1994a) Ductusvenosus blood velocity and the umbilical circulation in theseriouslygrowth-retarded fetus. Ultrasound Obstet Gynecol 4(2):109–114
Kiserud T, Hellevik L, Eik-Nes S, Angelsen B, Blaas H (1994b) Esti-mation of the pressure gradient across the fetal ductus venosus basedon doppler velocimetry. Ultrasound Med Biol 20(3):225–232
Kiserud T, Hellevik L, Hanson M (1998) Blood velocity profile in theductus venosus inlet expressed by the mean/maximum velocity ratio.Ultrasound Med Biol 24(9):1301–1306
Kiserud T, Rasmussen S, Skulstad S (2000) Blood flow and the degreeof shunting through the ductus venosus in the human fetus. Am JObstet Gynecol 182(1):147–153
Kiserud T, Kilavuz Ö, Hellevik L (2003) Venous pulsation in the fetalleft portal branch: the effect of pulse and flow direction. UltrasoundObstet Gynecol 21(4):359–364
Kiserud T, Kessler J, Ebbing C, Rasmussen S (2006) Ductus veno-sus shunting in growth-restricted fetuses and the effect of umbili-cal circulatory compromise. Ultrasound Obstet Gynecol 28(2):143–149
Kivilevitch Z, Gindes L, Deutsch H, Achiron R (2009) In-utero eval-uation of the fetal umbilical-portal venous system: two-and three-dimensional ultrasonic study. Ultrasound Obstet Gynecol 34(6):634–642
Leinan P, Hellevik L, Victorien V, Kiserud T, Skallerud B (2009)On material modelling of the umbilical vein. In: MekIT’09, TapirAkademisk Forlag, pp 281–295
Maiz N, Nicolaides K (2010) Ductus venosus in the first trimester: con-tribution to screening of chromosomal, cardiac defects and mono-chorionic twin complications. Fetal Diagn Ther 28(2):65–71
Martin B, Tudor R (1980) The umbilical and paraumbilical veins ofman. J Anat 130(Pt 2):305
Matias A, Montenegro N (2011) Ductus venosus: a love story of 14years. Donald Sch Ultrasound Obstet Gynecol 5(2):00–00
Matias A, Gomes C, Flack N, Montenegro N, Nicolaides K (1998)Screening for chromosomal abnormalities at 10–14 weeks: the roleof ductus venosus blood flow. Ultrasound Obstet Gynecol 12(6):380–384
Mavrides E, Moscoso G, Carvalho J, Campbell S, Thilaganathan B(2001) The anatomy of the umbilical, portal and hepatic venous sys-tems in the human fetus at 14–19 weeks of gestation. UltrasoundObstet Gynecol 18(6):598–604
Mavrides E, Moscoso G, Carvalho J, Campbell S, Thilaganathan B(2002) The human ductus venosus between 13 and 17 weeks ofgestation: histological and morphometric studies. Ultrasound ObstetGynecol 19(1):39–46
Meyer W, Lind J (1966) The ductus venosus and the mechanism of itsclosure. Arch Dis Child 41(220):597
Migliavacca F, Balossino R, Pennati G, Dubini G, Hsia T, De Leval M,Bove E (2006) Multiscale modelling in biofluidynamics: applicationto reconstructive paediatric cardiac surgery. J Biomech 39(6):1010–1020
Pennati G, Redaelli A, Bellotti M, Ferrazzi E (1996) Computationalanalysis of the ductus venosus fluid dynamics based on doppler mea-surements. Ultrasound Med Biol 22(8):1017–1029
Pennati G, Bellotti M, Fumero R (1997) Mathematical modelling ofthe human foetal cardiovascular system based on doppler ultrasounddata. Med Eng Phys 19(4):327–335
Pennati G, Bellotti M, Ferrazzi E, Bozzo M, Pardi G, Fumero R (1998)Blood flow through the ductus venosus in human fetus: calculationusing doppler velocimetry and computational findings. UltrasoundMed Biol 24(4):477–487
Pennati G, Corno C, Costantino M, Bellotti M (2003) Umbilical flowdistribution to the liver and the ductus venosus in human fetusesduring gestation: an anatomy-based mathematical modeling. MedEng Phys 25(3):229–238
Schröder H, Tchirikov M, Rybakowski C (2003) Pressure pulses andflow velocities in central veins of the anesthetizedsheep fetus. Am JPhysiol Heart Circ Physiol 284(4):H1205–H1211
Tchirikov M, Rybakowski C, Hüneke B, Schröder H (1998) Blood flowthrough the ductus venosus in singleton and multifetal pregnanciesand in fetuses with intrauterine growth retardation. Am J ObstetGynecol 178(5):943–949
Tchirikov M, Kertschanska S, Schröder H (2003) Differential effectsof catecholamines on vascular rings from ductus venosus and intra-hepatic veins of fetal sheep. J Physiol 548(2):519–526
Tchirikov M, Schröder H, Hecher K (2006) Ductus venosus shunt-ing in the fetal venous circulation: regulatory mechanisms, diagnos-tic methods and medical importance. Ultrasound Obstet Gynecol27(4):452–461
Toyama J, Brizot M, Liao A, Lopes L, Nomura R, Saldanha F, Zugaib M(2004) Ductus venosus blood flow assessment at 11 to 14 weeks ofgestation and fetal outcome. Ultrasound Obstet Gynecol 23(4):341–345
Turek S, Hron J (2006) Proposal for numerical benchmarking of fluid-structure interaction between an elastic object and laminar incom-pressible flow. Fluid-Struct Interact 53:371–385
van de Vosse F, Stergiopulos N (2011) Pulse wave propagation in thearterial tree. Annu Rev Fluid Mech 43:467–499
Vierendeels J, Dumont K, Dick E, Verdonck P (2005) Analysis andstabilization of fluid-structure interaction algorithm for rigid-bodymotion. AIAA J 43(12):2549–2557
Vierendeels J, Lanoye L, Degroote J, Verdonck P (2007) Implicit cou-pling of partitioned fluid-structure interaction problems with reducedorder models. Comput Struct 85(11–14):970–976
123
Related Documents