Marine Geophysical Researches 22: 265–287, 2001. © 2002 Kluwer Academic Publishers. Printed in the Netherlands. 265 Velocity-Interface Structure of the Southwestern Ryukyu Subduction Zone from EW9509-1 OBS/MCS Data Tan K. Wang 1,∗ , Kirk McIntosh 2 , Yosio Nakamura 2 , Char-Shine Liu 3 and How-Wei Chen 4 1 Institute of Applied Geophysics, National Taiwan Ocean University, Keelung, Taiwan, ROC; 2 Institute for Geophysics, University of Texas, Austin, Texas, USA; 3 Institute of Oceanography, National Taiwan University, Taipei, Taiwan, ROC; 4 Institute of Applied Geophysics, National Chung Cheng University, Chiayi, Taiwan, ROC; ∗ Author for correspondence (Fax: 886-2-24625038; E-mail: [email protected]) Key words: OBS, crustal structure, subduction, ray, travel-time inversion Abstract A wide-angle seismic survey, combining ocean-bottom seismometers (OBS) and multi-channel seismic (MCS) profiling, was implemented in the southwestern Ryukyu subduction zone during August and September 1995. In this paper, we present the data analysis of eight OBSs and the corresponding MCS line along profile EW9509-1 from this experiment. Seismic data modeling includes identification of refracted and reflected arrivals, initial model building from velocity analysis of the MCS data, and simultaneous and layer-stripping inversions of the OBS and MCS arrivals. The velocity-interface structure constructed along profile EW9509-1 shows that the northward subduction of the Philippine Sea Plate has resulted in a northward thickening of the sediments of the Ryukyu Trench and the Yaeyama accretionary wedge north of the trench. The boundary between the subducting oceanic crust and the overriding continental crust (represented by a velocity contour of 6.75 km/s) and a sudden increase of the subducting angle (from 5 degrees to 25 degrees) are well imaged below the Nanao Basin. Furthermore, velocity undulation and interface variation are found within the upper crust of the Ryukyu Arc. Therefore, the strongest compression due to subduction and a break-off of the slab may have occurred and induced the high seismicity in the forearc region. Introduction Crustal structures imaged by ocean-bottom seismome- ter (OBS) data using air-gun sources generally fill gaps between shallow structures obtained from multi- channel seismic (MCS) profiles and deeper structures obtained using earthquake seismology in the marine environment. Several OBS surveys in the northeastern, middle and southwestern Ryukyu subduction zones were successfully implemented for imaging of the crustal structures in 1984, 1988 and 1985/1995, re- spectively (Figure 1). An OBS velocity model of 1984-2 (Iwasaki et al., 1990) shows that the subduct- ing angle changes from about 5 degrees to 10 degrees below the southeastern part of the sedimentary wedge in the northeastern Ryukyu subduction zone. It was also found that the continental crust at the collision front is deformed and dragged down by subduction of the oceanic crust. On the other hand, the subducting angle in an OBS velocity model of 1988-2A in the middle Ryukyu subduction zone is uniform and about 5 degrees (Kodaira et al., 1996). The first OBS survey in the southwestern subduction zone was conducted in 1985 by Hagen et al. (1988). Their results illus- trated the northward subduction of the PSP beneath the Ryukyu Arc but were not well constrained in the lower crust. Although OBS data acquired in the Ryukyu Arc have provided reliable P-wave velocity models of the crustal structures, the intra-crustal interfaces and the sedimentary structures could not be well imaged due to weak air-gun shots, insufficient trace spacing and a lack of combined MCS data in the experiments.

Welcome message from author
This document is posted to help you gain knowledge. Please leave a comment to let me know what you think about it! Share it to your friends and learn new things together.
Transcript

Marine Geophysical Researches 22: 265–287, 2001.© 2002 Kluwer Academic Publishers. Printed in the Netherlands.
265
Velocity-Interface Structure of the Southwestern Ryukyu SubductionZone from EW9509-1 OBS/MCS Data
Tan K. Wang1,∗, Kirk McIntosh2, Yosio Nakamura2, Char-Shine Liu3 and How-Wei Chen4
1Institute of Applied Geophysics, National Taiwan Ocean University, Keelung, Taiwan, ROC;2Institute for Geophysics, University of Texas, Austin, Texas, USA;3Institute of Oceanography, National Taiwan University, Taipei, Taiwan, ROC;4Institute of Applied Geophysics, National Chung Cheng University, Chiayi, Taiwan, ROC;∗Author for correspondence (Fax: 886-2-24625038; E-mail: [email protected])
Key words: OBS, crustal structure, subduction, ray, travel-time inversion
Abstract
A wide-angle seismic survey, combining ocean-bottom seismometers (OBS) and multi-channel seismic (MCS)profiling, was implemented in the southwestern Ryukyu subduction zone during August and September 1995. Inthis paper, we present the data analysis of eight OBSs and the corresponding MCS line along profile EW9509-1from this experiment. Seismic data modeling includes identification of refracted and reflected arrivals, initial modelbuilding from velocity analysis of the MCS data, and simultaneous and layer-stripping inversions of the OBSand MCS arrivals. The velocity-interface structure constructed along profile EW9509-1 shows that the northwardsubduction of the Philippine Sea Plate has resulted in a northward thickening of the sediments of the Ryukyu Trenchand the Yaeyama accretionary wedge north of the trench. The boundary between the subducting oceanic crust andthe overriding continental crust (represented by a velocity contour of 6.75 km/s) and a sudden increase of thesubducting angle (from 5 degrees to 25 degrees) are well imaged below the Nanao Basin. Furthermore, velocityundulation and interface variation are found within the upper crust of the Ryukyu Arc. Therefore, the strongestcompression due to subduction and a break-off of the slab may have occurred and induced the high seismicity inthe forearc region.
Introduction
Crustal structures imaged by ocean-bottom seismome-ter (OBS) data using air-gun sources generally fillgaps between shallow structures obtained from multi-channel seismic (MCS) profiles and deeper structuresobtained using earthquake seismology in the marineenvironment. Several OBS surveys in the northeastern,middle and southwestern Ryukyu subduction zoneswere successfully implemented for imaging of thecrustal structures in 1984, 1988 and 1985/1995, re-spectively (Figure 1). An OBS velocity model of1984-2 (Iwasaki et al., 1990) shows that the subduct-ing angle changes from about 5 degrees to 10 degreesbelow the southeastern part of the sedimentary wedgein the northeastern Ryukyu subduction zone. It was
also found that the continental crust at the collisionfront is deformed and dragged down by subduction ofthe oceanic crust. On the other hand, the subductingangle in an OBS velocity model of 1988-2A in themiddle Ryukyu subduction zone is uniform and about5 degrees (Kodaira et al., 1996). The first OBS surveyin the southwestern subduction zone was conductedin 1985 by Hagen et al. (1988). Their results illus-trated the northward subduction of the PSP beneath theRyukyu Arc but were not well constrained in the lowercrust. Although OBS data acquired in the Ryukyu Archave provided reliable P-wave velocity models of thecrustal structures, the intra-crustal interfaces and thesedimentary structures could not be well imaged dueto weak air-gun shots, insufficient trace spacing and alack of combined MCS data in the experiments.

266
Figure 1. OBS lines, teleseismically determined epicenters (CNSS catalogue), bathymetry and tectonic features in the Ryukyu subduction zone.Two OBS surveys of the southwestern Ryukyu Arc was conducted in 1985 and 1995 within the area inside the black frame, enlarged in theilluminated bathymetry (Liu et al., 1998) in the upper left corner. Other OBS experiments in the middle (Kodaira et al., 1996) and northeastern(Iwasaki et al., 1990) Ryukyu Arcs are denoted by the years, 1988 and 1984, respectively, in which they were conducted. The contour intervalof bathymetry is 500 m. In the inset, the OBS stations and the OBS/MCS lines are indicated by open circles and solid lines, respectively. Inparticular, only the EW9509-1 seismic line (thicker) with eight OBSs (open circles) is investigated in this study.

267
Using a large air-gun array and incorporating MCSdata, three profiles of the OBS data (EW9509-14,EW9509-16 and EW9509-23) were acquired in thesouthwestern Ryukyu subduction zone (Figure 1).An OBS velocity model of EW9509-14 (McIntoshand Nakamura, 1998) shows that the thickness ofthe Ryukyu Arc basement (velocity > 5 km/s) andthe subducting Philippine Sea Plate (PSP) belowthe Nanao Basin (intersection with EW9509-1) are10∼12 km and 8∼12 km, respectively. Results frommodeling the OBS data of profile EW9509-16 (Wangand Chiang, 1998) suggest that the thickness of theRyukyu Arc basement (5.5∼6.75 km/s) and the sub-ducting PSP crust (6.75∼7.75 km/s) are 10∼15 kmand 8∼12 km, respectively. An OBS velocity modelof EW9509-23 (Yang and Wang, 1998) off southeast-ern Taiwan shows that the thickness of the oceaniccrust (4.5∼7.75 km/s) southeast of OBS station 31is 5∼7 km. Northwest of OBS station 31, the crustthickens northwestward.
The previous results of OBS data modeling in theRyukyu subduction zone have lacked sufficient con-straints on the structural interfaces from the reflectedarrivals of seismic data. In this paper, we presenttravel-time modeling (Zelt, 1999) of an EW9509-1MCS/OBS profile parallel to the subduction direc-tion. This modeling approach includes identificationof refracted and reflected arrivals, velocity analysisof the MCS data, simultaneous inversion of MCS ar-rivals and the individual phase in the OBS data, andminimum parameterization of the model grids.
Tectonic Setting
Ryukyu subduction system
The Ryukyu trench-arc-backarc system in the north-west Pacific is one of the most active convergent mar-gins in the circum-Pacific belt. The Ryukyu Trench,with accumulated sediments and extending from Japanto Taiwan (Figure 1), is overlying the subducting PSP.The Ryukyu Arc is situated northwest of the trenchand over-thrusts the PSP. Further northwest, a sedi-mentary basin of the Okinawa Trough has been formedby back-arc spreading between the East China Seaand the Ryukyu Arc (Kimura, 1985). Volcanic activ-ity associated with the back-arc spreading has beenfound in the southern Okinawa Trough whereas ac-tive volcanoes in the Ryukyu Arc have occurred onlyin the northeastern part (Sibuet et al., 1987, 1998).
In addition to these trench-arc-backarc structures, ac-cretionary prism and forearc basins (Liu et al., 1997;Lallemand et al., 1999; Font et al., 2001) are lyingbetween the trench and the arc where northwestwardsubduction of the PSP has started beneath the EurasianPlate (EP).
The complexity of the southwestern Ryukyu sub-duction system investigated in this paper can be ob-served from the earthquake epicenters and the bathym-etry. The epicenters, indicated by solid circles inFigure 1, are derived from the CNSS (Council of theNational Seismic System) catalogue from 1963 on-wards for magnitudes greater than 5 and depths lessthan 40 km in the Ryukyu subduction zone. These epi-centers suggest that the most active subduction of theRyukyu trench-arc-backarc system for both oceanicand continental crusts (depth less than 40 km) is lo-cated underneath the southwestern Ryukyu Arc. Westof 123◦ E, the bathymetric trend of the Ryukyu arc-trench system gradually turns northward to a NW-SEdirection in close proximity to the Taiwan (Figure 1).Hence, the crustal structures in the southwestern partof the Ryukyu subduction zone are complex and dif-ferent from those of the northeastern and middleRyukyu Arcs (Iwasaki et al., 1990; Kodaira et al.,1996).
Southwestern Ryukyu subduction system
Since the southwestern Ryukyu subduction system isterminated by the arc-continent collision of the Tai-wan orogen between EP and PSP (Figure 1), tectonicstructures in this area have also been affected byoblique plate convergence (Lallemand et al., 1999),arc-continent collision of present-day Taiwan (Huanget al., 2000) and/or arc-arc collision of paleo-Taiwan(Sibuet and Hsu, 1997). Collision between the LuzonArc and the EP along the Coastal Range of Taiwanand collision between the Luzon Arc and the RyukyuArc below the forearc basins may have resulted indistinct bathymetries of the Hoping Basin, HsinchengRidge and Yaeyama Ridge (inset of Figure 1). Southof the Ryukyu arc-trench system, the Huatung Basinlies between the Luzon Arc and the Gagua Ridge.Through investigation of deep seismic profiles, theGagua Ridge was found to be northward subductingbeneath the Ryukyu forearc region (Schnürle et al.,1998a).
Earthquake epicenters in the southwestern Ryukyusubduction zone (the solid circles in the inset of Fig-ure 1) are distributed mainly in the southern Okinawa

268
Trough, the Nanao Basin, and the Coastal Range. Toexplain seismicity below the Nanao Basin, varioustypes of tectonic faulting have been proposed. Lalle-mand et al. (1997) suggested a tear fault below theforearc basins to explain the northward subduction andthe westward over-thrust of the PSP. Kao et al. (1998)proposed thrust faulting along the subducting interfacebased on an investigation of focal mechanisms beneaththe Nanao Basin. From bathymetry and seismic reflec-tion data, a right-lateral strike-slip fault developed ontop of the Yaeyama accretionary prism was inferredfrom slip-partition of the oblique convergence in thisarea (Lallemand et al., 1999). This strike-slip faultmay mark the southern boundary of the Ryukyu Arcbasement (Font et al., 2001).
In this paper, we present an analysis of a N-Strending seismic line, EW9509-1, in the southwesternRyukyu subduction system (Figure 1). The OBS/MCSdata were analyzed to investigate the following impor-tant tectonic issues in this region. The first goal is todetermine the crustal structures in order to understandthe velocity variation within the Yaeyama accretionarywedge, the southward extension of the Ryukyu Arcbasement, and the subduction boundary of the PSP andthe Ryukyu Arc underneath the Yaeyama accretionarywedge. Another goal is to investigate the impact ofplate convergence on earthquake faulting, e.g., reasonsfor the high seismicity below the Nanao Basin, as wellas the location, depth, length and dipping angle of theactive tectonic faulting.
OBS Data Acquisition and Processing
The MCS/OBS data used in this study were acquiredin August and September 1995 during a Republic ofChina and US cooperative experiment for imagingcrustal structures (Liu et al., 1997). In this experi-ment, 39 OBSs were deployed from the R/V OceanResearcher I and received signals with shot spacing ofabout 40∼80 m from an air-gun array of 183 l on theR/V Maurice Ewing.
The vertical component of geophone data fromeight OBSs and the data from corresponding MCSline of EW9509-1 are employed in this paper to con-struct the P-wave velocity model since the hydrophonedata in this experiment is generally similar but lesscoherent than the vertical component of geophonedata. From modeling two horizontal components ofgeophone data, Wang and Pan (2001) have also pre-sented the crustal Poisson’s ratio along EW9509-1.
The EW9509-1 OBS/MCS line, extended from northto south for more than 300 km, covers the south-ern Okinawa Trough, Ryukyu Arc, Nanao ForearcBasin, Yaeyama Accretionary Ridge, Ryukyu Trenchand Huatung Basin (inset of Figure 1). The veloc-ity model of EW9509-1, also constrained by threeother OBS profiles at their intersections, demonstrateshow the oceanic crust subducts underneath the conti-nental crust, and how the crustal structures relate toearthquake faulting.
Data processing prior to presentation and identi-fication of the OBS arrivals includes station reloca-tion, generation of formatted OBS data and signalenhancement. All components of the OBS data areconsidered to invert the location and the orientationof all stations. The incorporation of two horizontalcomponents for determining the station orientation canalso enhance the station relocation since water ar-rivals used in relocation come from a shooting linein 2D acquisition. Table 1 lists the longitude, lati-tude and depth of eight OBS stations along EW9509-1computed using OBSTOOL (Christeson, 1995). Theaverage errors of the location and the orientation forthe eight stations are about 20 m and 15 degrees, re-spectively. OBS data sampled at intervals of 4 msare subsequently formatted with a reduction velocityof 8 km/s and with a time span of 12 s. The maxi-mum offset (−84410∼161211 m) and the number oftraces (4019∼5724) recorded at the OBS stations (Ta-ble 1) vary from station to station because of irregularshot intervals of 10∼50 m caused by the strong andunsteady Kuroshio Current.
The strong previous shot noises in the OBS data(e.g., inclined noise bands with the same slope as thewater waves shown in Figure 2) are due to the shortshot interval of 20 s used for optimizing the MCSdata acquisition. These noises are reduced by liningup traces according to the previous shot time, and byf-k filtering (W. S. Holbrook and E. C. Reiter, unpub-lished manuscript, 1992). Other signal enhancements,including band-pass filtering (over the range of 3–15 Hz at far offsets and 10–30 Hz at near offsets),scaling of abnormal amplitudes, and trace mixing ofeight adjacent traces, are also applied to all the OBSdata using the seismic processing software SIOSEIS(Henkart, 2000).

269
Tabl
e1.
OB
Slo
catio
ns,m
axim
umof
fset
san
dnu
mbe
rof
trac
es.
OB
Sst
atio
nO
BS
13O
BS
12O
BS
11O
BS
10O
BS
9O
BS
8O
BS
6O
BS
5
Lon
gitu
de(E
)12
2.49
964
122.
5008
112
2.50
4612
2.50
385
122.
4999
212
2.50
158
122.
4993
812
2.50
127
Lat
itude
(N)
22.4
7208
22.8
0522
23.1
7222
23.3
9893
23.6
695
23.9
1581
24.2
9949
24.6
6324
Dep
th(m
)49
2352
6556
4345
4529
0036
4029
345
5
Max
.off
seta
(m)
−366
8016
1211
−735
7115
6629
−798
5614
3975
−766
6513
8467
−790
3812
5773
−844
1010
8628
−620
0294
710
−623
9054
391
No.
trac
es47
4256
1157
2357
1657
2457
1150
5440
19
a Neg
ativ
e/po
sitiv
eva
lues
indi
cate
the
offs
ets
toth
eso
uth/
nort
h
Phase Identification and Seismic Characteristics ofOBS Records
Once the best presentation of the OBS data is obtained,we carry out arrival selection and phase identification.We first select the strong refracted arrivals (mostlyfrom offsets less than 60 km) and clear reflectedarrivals (mostly from sedimentary reflectors and wide-angle reflections). Later and weak arrivals (e.g., thewhite lines shown in Figures 3 to 6) are then selectediteratively by superimposing the calculated arrivalsof the updated velocity-interface models on the OBSdata (Zelt, 1999). Selection of these later arrivals isdifficult because they are usually interfered with mul-tiples, converted shear waves and out-of-plane signals.However, dense traces of the OBS data (average traceinterval 40 m) and intensive efforts enable identifi-cation to be as complete as possible. In this study,most of the refracted and reflected arrivals from threesedimentary layers, three crustal layers and the uppermantle (Table 2) are identified by zooming into thelocal area with coherent signals and by using a trial-and-error approach. Uncertainty about these arrivalselections is generally related to the signal to noiseratio and the frequency content. At near offsets or ar-rivals from shallow structures, the uncertainty of theselections is generally low, about 20∼50 ms, becausethe dominant frequency of the clear signal is about25 Hz. However, at far offsets for deep levels when thedominant frequency is less than 10 Hz, the uncertaintyof the selections can exceed 100 ms. In the following,we shall present the vertical component of the OBSdata for both the entire section and its enlarged sec-tion. Trace amplitudes in the entire section of OBSdata are scaled by multiplying with the absolute offset(|X|), while those in the enlarged section are generallyadjusted for the sake of equal balancing among all thetraces. In the following, phase identification and theseismic characteristics of the OBS data are presentedfor each geological province along the profile fromsouth to north.
Huatung Basin
Reflected arrivals from the sedimentary interfaceswere clearly recorded at OBS stations 12 and 13 in theHuatung Basin (e.g., Ps1P, Ps2P and Ps3P at offsetsless than 10 km as shown in Figure 2). However, phaseidentification of the OBS arrivals from the sediment isnot straightforward and will be more fully explainedbased on results of MCS data in the next section.

270
Fig
ure
2.(a
)V
ertic
alco
mpo
nent
ofth
eO
BS
data
and
(b)
sele
cted
arri
vals
supe
rim
pose
don
the
OB
Sda
tafr
omst
atio
n12
inth
eH
uatu
ngB
asin
.

271
Fig
ure
3.(a
)V
ertic
alco
mpo
nent
ofth
eO
BS
data
and
(b)
sele
cted
arri
vals
supe
rim
pose
don
the
OB
Sda
tafr
omst
atio
n11
inth
eR
yuky
uT
renc
h.W
eak
arri
vals
(whi
telin
es)
are
not
used
inin
vers
ion
buta
reco
nsid
ered
tode
mon
stra
teth
era
yco
vera
gesh
own
inFi
gure
9.

272
Fig
ure
4.(a
)V
ertic
alco
mpo
nent
ofth
eO
BS
data
and
(b)
sele
cted
arri
vals
supe
rim
pose
don
the
OB
Sda
tafr
omst
atio
n9
onth
eno
rthe
rnY
aeya
ma
Rid
ge.
For
the
first
arri
vals
atth
eso
uthe
rnfa
r-of
fset
,the
uppe
r-m
antle
refr
actio
n(P
n)ca
nbe
obse
rved
,but
the
refr
actio
nth
roug
hth
ecr
usti
sw
eak.

273
Fig
ure
5.(a
)V
ertic
alco
mpo
nent
ofth
eO
BS
data
and
(b)
sele
cted
arri
vals
supe
rim
pose
don
the
OB
Sda
tafr
omst
atio
n8
inth
eN
anao
Bas
in.O
BS
data
ofth
isst
atio
nde
mon
stra
teth
atth
ehi
ghnu
mbe
rof
arri
val
pick
sm
aybe
due
toits
loca
tion
inth
ese
dim
enta
ryba
sin
and
abov
eth
eth
ick
uppe
rcr
ustw
here
rays
trav
elth
roug
hm
ore
read
ily.

274
Fig
ure
6.(a
)V
ertic
alco
mpo
nent
ofth
eO
BS
data
and
(b)
sele
cted
arri
vals
supe
rim
pose
don
the
OB
Sda
tafr
omst
atio
n6
onth
eto
pof
the
Ryu
kyu
Arc
slop
e.(c
)So
uthe
rnfa
r-of
fset
sect
ion
with
wea
kre
frac
ted
arri
val
thro
ugh
the
mid
dle
crus
t(Pg
2),a
nd(d
)no
rthe
rnfa
r-of
fset
sect
ion
with
the
refr
acte
dar
riva
lth
roug
hth
eup
per
man
tle(P
n).

275
Figure 6. Continued.
At offsets greater than 10 km in OBS data at sta-tion 12 (Figure 2), refractions through the crust (Pg2and Pg3), reflections from the Moho (PmP) and re-fractions through the upper mantle (Pn) provide goodconstraints for the velocity structure of the oceaniclithosphere below the Huatung Basin. In particular, therefractions from north of station 12 arrive much laterthan those from south of the station. This seems toindicate that the oceanic crust does not subduct untilto the north of the station. However, since the maxi-mum offset (70 km) of the identified arrivals (Figure 2)is much less than the corresponding maximum offsetof the complete dataset listed in Table 1 (156.629 kmfor OBS 12), the upper-mantle structure further to thenorth of OBS station 12 cannot be well imaged fromthis OBS data.
Ryukyu Trench
Reflections and refractions through the sediment havebeen clearly identified at near offsets of −20∼20 kmfrom OBS 11 (Figure 3) in the Ryukyu Trench. Otherarrivals, such as lower-crust refraction (Pg3), Mohoreflection (PmP) and upper-mantle refraction (Pn) atfar offsets, provide good constraints for the lower crustand the upper mantle beneath the trench. For exam-ple, a sudden decrease of the apparent velocity ofthe first arrivals (Pn) at 60 km south of OBS station11 may indicate the beginning of the PSP subductionalong EW9509-1. However, at offsets 35 km to 75 km,the OBS signals (white lines) are not strong enoughfor travel-time inversion. These weak signals will bediscussed below.

276
Table 2. Nomenclatures of refracted and reflectedphases.
Refractions Reflections
Upper sediment Ps1 Ps1P
Lower sediment Ps2 Ps2P
Compacted sediment Ps3 Ps3P
Accretionary wedge
Upper crust Pg1 Pc1P
Middle crust Pg2 Pc2P
Lower crust Pg3 PmP
Upper mantle Pn
Yaeyama Ridge
The characteristics of the OBS data from stations 9(Figure 4) and 10 located on the Yaeyama Ridge arequite different from those recorded by the OBS sta-tions located in the Huatung Basin (Figure 2) and inthe trench (Figure 3). First, early arrivals with lowapparent velocities, identified as refractions throughthe accretionary prism (Ps3), extend further away fromoffsets −35 km to 20 km (Figure 4). Reflected arrivalsfrom the base of the accretionary wedge (Ps3P) arealso observed as later arrivals behind Ps3. Due to thelong offset of these refracted and reflected arrivals, thestructure of the thick prism can be well constrained be-low this station. Second, the apparent velocities of thefirst arrivals (Pg2 and Pg3) at the northern offsets seemto be higher, which may imply either high velocities ordipping interfaces. On the other hand, for deep eventsat the southern far-offset of OBS 9, only upper-mantlerefraction (Pn) has been identified.
Forearc Basin
High apparent velocities of the earlier refracted ar-rivals from OBS data at station 8, extending fromthe southern offset of 35 km to the northern offset of90 km, are observed on Figure 5. Since this station waslocated in the Nanao Forearc Basin, major sedimen-tary reflections (Ps1P and Ps2P) are readily observed.Two deeper reflections (Pc2P), one from the top of thesubducting slab and the other from the intra-crustalinterface of the Ryukyu Arc, are readily identified atoffsets 10 km to 40 km in Figure 5. We also clearlyobserve PmP arrivals from the oceanic lithosphere atoffsets −50 km to −20 km and from the continentallithosphere at offsets 60 km to 110 km.
Ryukyu Arc
OBS data and associated seismic phases of station 6 onthe Ryukyu Arc slope are shown in Figures 6a and 6b.First and refracted arrivals are observed clearly at leastfrom the southern offset of 35 km to the northern offsetof 67.5 km. On the other hand, the refracted arrivalsthrough the middle crust (Pg2) and the upper mantle(Pn) shown in Figure 6b can be readily identified in theenlarged sections of Figures 6c and 6d, respectively.Other reflected arrivals from the intra-crustal inter-face (Pc2P) and the Moho (PmP) are also observed(Figure 6b). The small number of reflected arrivals ob-served at the near offsets and at the early travel-time ofthis OBS data may imply thin or vanishing sedimentson the Ryukyu Arc slope.
Layer-Stripping Inversion and Monte-CarloModeling
Instead of inverting all the parameters of a complicatedmodel as suggested by Zelt (1999), we apply the layer-stripping inversion to construct a velocity-interfacestructure of EW9509-1, progressing gradually fromthe sediment to the crust. The reason for not employ-ing simultaneous inversion of all the parameters is thedifficulty of constructing an initial model for the sub-ducting crust and of accommodating all the travel-timeselections in advance. Layer-stripping inversion elimi-nates these difficulties because we only work one layerat a time. In this study, parameterization of uniformand dense grids was first applied to obtain the ini-tial model, including the seafloor. Parameterization ofnon-uniform and sparse grids is subsequently achievedthrough modification of the initial model based onfurther inversion. Finally, when rays travel throughthe complex media such as pinch-out structures, theforward modeling is applied to correct the unrealisticresults from inversion.
Inversion of sedimentary structures
Since refractions and reflections from sedimentarylayers in the OBS data are concentrated only belowthe OBS stations, MCS data are required to better con-strain sedimentary structures of the Huatung Basin,the Nanao Basin and the southern Okinawa Troughalong EW9509-1. We first construct an initial model ofthe sedimentary layers based on the velocity analysisand the stacked section (e.g., Figure 7a) of the MCSdata (Schnürle et al., 1998a). Layer-stripping inversion

277
Figure 7. (a) Stacked MCS data along the southern portion of the EW9509-1 (in the Huatung Basin), (b) the calculated travel times (solid lines)superimposed on the stacked section and (c) the associated velocity-interface model developed in this study. The thick lines in (c) are reflectionpoints from OBS data modeling. Velocity contours of 2.25, 3 and 4.5 km/s in (c), which correspond to three sedimentary layers in the RyukyuTrench and the Huatung Basin, clearly match the reflecting signals in (a). Furthermore, PmP can be identified at least beginning at the TaitungCanyon and extending 15 km northward in (a).

278
(Zelt and Smith, 1992) of the sedimentary structures isthen applied.
Inversion starts with refracted arrivals through theupper sediment (Ps1) in the OBS data. The uppermostrefractions are employed to adjust the velocities withinthe layer (mainly the velocity of the upper part of thelayer) until the root-mean-square (RMS) travel-timeresidual of the refraction from each station convergesto its minimum level. The highest residual of the Ps1is 70 ms at the northern offset of OBS 8, but no Ps1arrival is picked from OBS 6 (Table 3). Inversion pro-gresses to reflected arrivals from the bottom of theupper sediment to constrain the depth of the velocityinterface. Two types of reflections, Ps1P arrivals fromthe OBS data and arrivals of normal incidence fromthe MCS data, are simultaneously used for inversion(Operto, 1996). In Table 3, the highest residual of thePs1P is 85 ms at the southern offset of OBS 13, but noPs1P arrival is observed from OBS 6 or the northernoffset of OBS 9. Similarly, inversion continues down-ward to other sedimentary layers. To avoid breakdownof the travel-time inversion (Zelt and Smith, 1992)due to the fine grids and the complexity of the model,we also manually adjust grids of the model to obtainthe minimum number of grids allowable based on thedensity of the rays. The highest travel-time residual inthe sedimentary layers is 92 ms for refractions throughthe accretionary wedge south of OBS station 9, asindicated by the bold values in Table 3.
Along the southern portion of EW9509-1, the cal-culated arrivals from the OBS model are found to beconsistent with the reflected signals in the stacked sec-tion (Figure 7b), and the reflection points of the OBSarrivals (the thick lines in Figure 7c) constrain the ve-locity interfaces of the model. This indicates that thebottoms of the upper, lower and compacted sedimentsin the Huatung Basin can be interpreted as velocitycontours of 2.25, 3 and 4.5 km/s, respectively. Figure 7also shows that the trench is about 60 km wide onEW9509-1. Furthermore, sedimentary interfaces areirregular south of the Taitung Canyon, while those inthe Ryukyu Trench are uniform.
Inversion of crustal structures
Initial model building of the crustal structures canbe accomplished through travel-time inversion of thefirst coherent arrivals (refraction) of the OBS data(generally known as transmission tomography). Inparticular, the dense velocity contours of the invertedmodel and the boundaries of different velocity gra-
dients can be regarded as interfaces of the velocitydiscontinuities for further refining the initial model.Similar to the gradual downward inversion of the sed-imentary structures, layer-stripping inversion of thecrustal structures and the upper mantle starts fromthe upper-crust refraction (Pg1) and proceeds to theupper-crust reflection (Pc1P), the mid-crust refraction(Pg2), the mid-crust reflection (Pc2P), the lower-crustrefraction (Pg3), the Moho reflection (PmP), and fi-nally the upper-mantle refraction (Pn), as indicated inTable 3. In this study, the refracted arrivals and thereflected arrivals are generally applied to constrain theP-wave velocity and the depth of the velocity interface,respectively.
Monte-Carlo modeling
Since travel-time inversion (Zelt and Smith, 1992)of complex structures usually provides unrealistic re-sults, diverges or even breaks down, a forward mod-eling is applied for fine-tuning the velocity-depth pa-rameters. Similar to the Monte-Carlo method, we testone parameter at a time within a reasonable range tominimize the travel-time residuals and to maximizethe ray coverage for correcting unrealistic parame-ters. The final results show that travel-time residualsgreater than 90 ms are distributed mainly in the mid-dle and lower crust (Pg2, Pg3 and PmP), as denotedby the bold values in Table 3. Except for the un-available picks of the reflected arrivals in the RyukyuArc basement (north of OBS station 9), the forwardmodeling also enables us to identify the refracted andreflected arrivals to be as complete as possible. There-fore, Table 3 demonstrates the accuracy of the velocityand the interface from RMS travel-time residuals ofrefracted and reflected arrivals throughout the entiremodel, respectively.
Depth of the Moho beneath the Huatung Basin isfound in the MCS data shown in Figures 7a and 7b,and the OBS velocity model shown in Figure 7c alongthe southern portion of EW9509-1. Deep reflections(PmP) are shown clearly at about 10 s TWT and atleast 15 km northward from the Taitung Canyon inFigures 7a and 7b. By considering refracted arrivalsfrom OBS stations 11, 12 and 13, most of the P-wavevelocity of the oceanic crust (contours in Figure 7c)can be imaged. Reflected arrivals in the OBS dataalso constrain most of the Moho depths and the intra-crustal interfaces (the thick lines in Figure 7c) beneaththe OBS stations. Due to the interference of strong
279
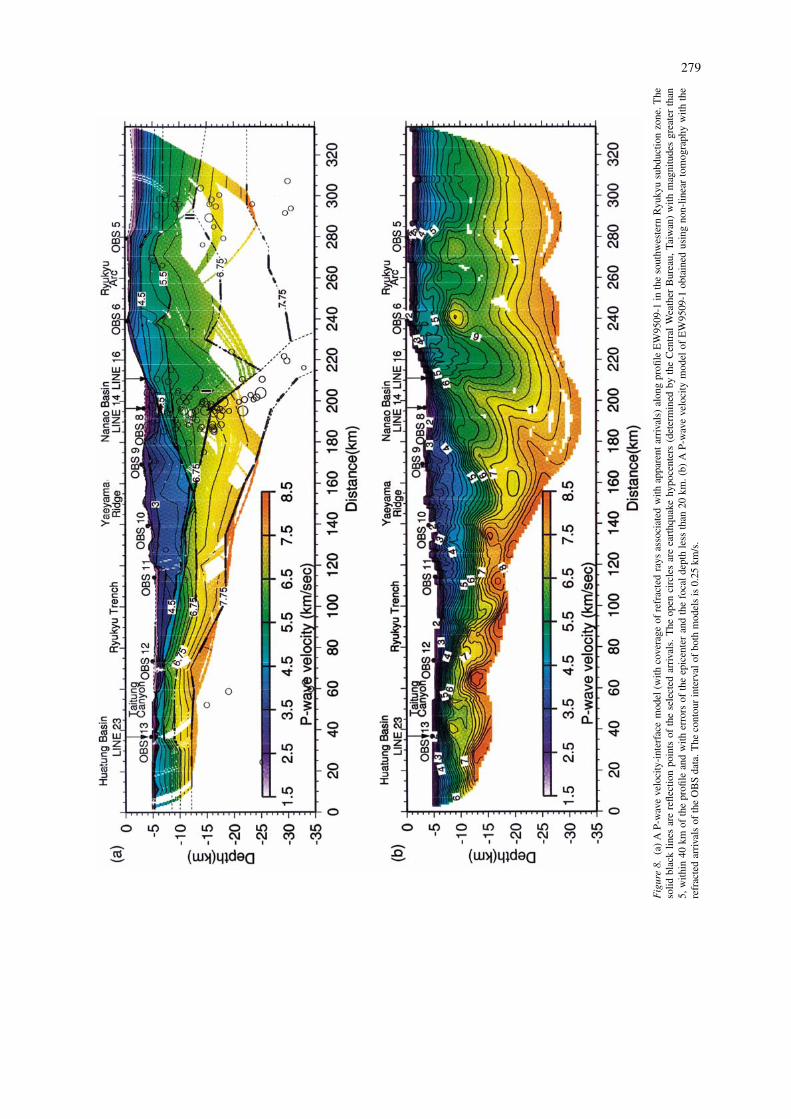
Fig
ure
8.(a
)A
P-w
ave
velo
city
-int
erfa
cem
odel
(with
cove
rage
ofre
frac
ted
rays
asso
ciat
edw
ithap
pare
ntar
riva
ls)
alon
gpr
ofile
EW
9509
-1in
the
sout
hwes
tern
Ryu
kyu
subd
uctio
nzo
ne.T
heso
lidbl
ack
lines
are
refle
ctio
npo
ints
ofth
ese
lect
edar
riva
ls.
The
open
circ
les
are
eart
hqua
kehy
poce
nter
s(d
eter
min
edby
the
Cen
tral
Wea
ther
Bur
eau,
Taiw
an)
with
mag
nitu
des
grea
ter
than
5,w
ithin
40km
ofth
epr
ofile
and
with
erro
rsof
the
epic
ente
ran
dth
efo
cal
dept
hle
ssth
an20
km.(
b)A
P-w
ave
velo
city
mod
elof
EW
9509
-1ob
tain
edus
ing
non-
linea
rto
mog
raph
yw
ithth
ere
frac
ted
arri
vals
ofth
eO
BS
data
.The
cont
our
inte
rval
ofbo
thm
odel
sis
0.25
km/s
.

280
Table 3. RMS travel-time residual (ms) for each individual phase and station.
OBS Station OBS 13 OBS 12 OBS 11 OBS 10 OBS 9 OBS 8 OBS 6 OBS 5
Location(km) 36.68 73.572 114.199 139.323 169.288 196.568 239.064 279.384
Offset
Phase S N S N S N S N S N S N S N S N
Ps1 50 19 37 65 67 56 44 19 14 64 32 70 X X 35 60
Ps1P 85 20 36 28 29 17 17 20 36 _ 51 38 X X 60 67
Ps2 _ _ _ _ 74 36 78 34 37 _ 45 48 30 45 X X
Ps2P _ _ 12 21 49 28 _ _ 38 52 33 34 29 10 X X
Ps3 _ _ _ _ 62 _ 55 90 92 72 62 27 62 52 72 69
Ps3P 50 _ 74 52 52 34 52 50 46 _ _ _ _ _ _ _
Pg1 84 _ _ 90 _ 50 58 _ 55 X 92 69 40 46 61 53
Pc1P 12 46 43 12 _ _ 34 18 51 15 42 40 _ _ _ _
Pg2 70 83 77 70 49 59 29 25 32 68 103 91 105 68 87 56
Pc2P _ 40 _ _ _ 28 56 25 57 45 29 67 _ _ 74 _
Pg3 44 39 63 94 86 102 47 68 31 55 _ _
∥∥∥∥
97 X 89 _ _
PmP 43 55 96 93 73 71 69 69 76 _ 74 106
∥∥∥∥
67 _ 68 _ _
Pn 19 55 62 87 158 88 72 _ 89 _ 76 X X 123 X X
‘||’ marks the boundary of the southern oceanic crust and the northern continental crust. The symbols ‘X’ and ‘_’ stand forunavailable picks due to pinch-out structures in the model and the weak signals in the OBS data, respectively.
multiples and scattering, MCS data along the northernportion of EW9509-1 are not presented in this paper.
Validity of the Velocity-Interface Model
Non-linear tomography and alternative models
A P-wave velocity-interface model generated throughlayer-stripping inversion and Monte-Carlo modelingof refracted and reflected arrivals is presented inFigure 8a. To validate the velocity-interface model,non-linear tomography using back-projection and reg-ularized inversion (Zelt and Barton, 1998) of the firstarrivals in the OBS data is applied to generate an al-ternative model (Figure 8b). The grid interval of thetomography is 0.5 km along the length and the depth ofthe model. The velocity contour of 4.5 km/s, indicat-ing the base of the Yaeyama accretionary prism and thetop of the Ryukyu Arc basement, in the tomographicresult agrees well with that in the velocity-interfacemodel. Similarly, the velocity contour of 6.75 km/ssouth of OBS 10 in the tomographic model (Fig-ure 8b) is consistent with an intra-crustal interfaceof the PSP in Figure 8a. Furthermore, the thicknessof the subducting slab and the overriding plate (P-wave velocities of 4.5∼7.75 km/s) in both models isalso very similar. However, the velocity contour of
6.75 km/s below the Nanao Basin in the tomographicmodel seems to be more undulated than that in thevelocity-interface model. To test this difference, aninitial model with an undulated interface below theNanao Basin is applied in layer-stripping inversion.The inversion result shows contradictory reflected ar-rivals from OBSs 6, 8, and 9 (reflection points in Fig-ure 8a) since non-linear tomography cannot constrainthe structural interfaces through the reflected arrivals.Therefore, we prefer the result of layer-stripping inver-sion and Monte-Carlo modeling, which provides bothreliable velocity and interface (Figure 8a).
Ray coverage
Since the weak arrivals (the white lines in Figures 3to 6) of the OBS data are identified by comparingwith the calculated arrivals from the velocity-interfacemodel, they are not used in inversion but are employedonly to demonstrate ray coverage. Furthermore, thefinal result (Figure 8a) is derived not only from in-version but also from forward modeling. Therefore,instead of using the resolution generated through in-version (Zelt and Smith, 1992), we present the raycoverage to validate the model. Refracted rays shownin Figure 9a cover most of the model at depths lessthan 25 km, but only a few rays travel through thelower crust and the upper mantle of the overlying plate
281
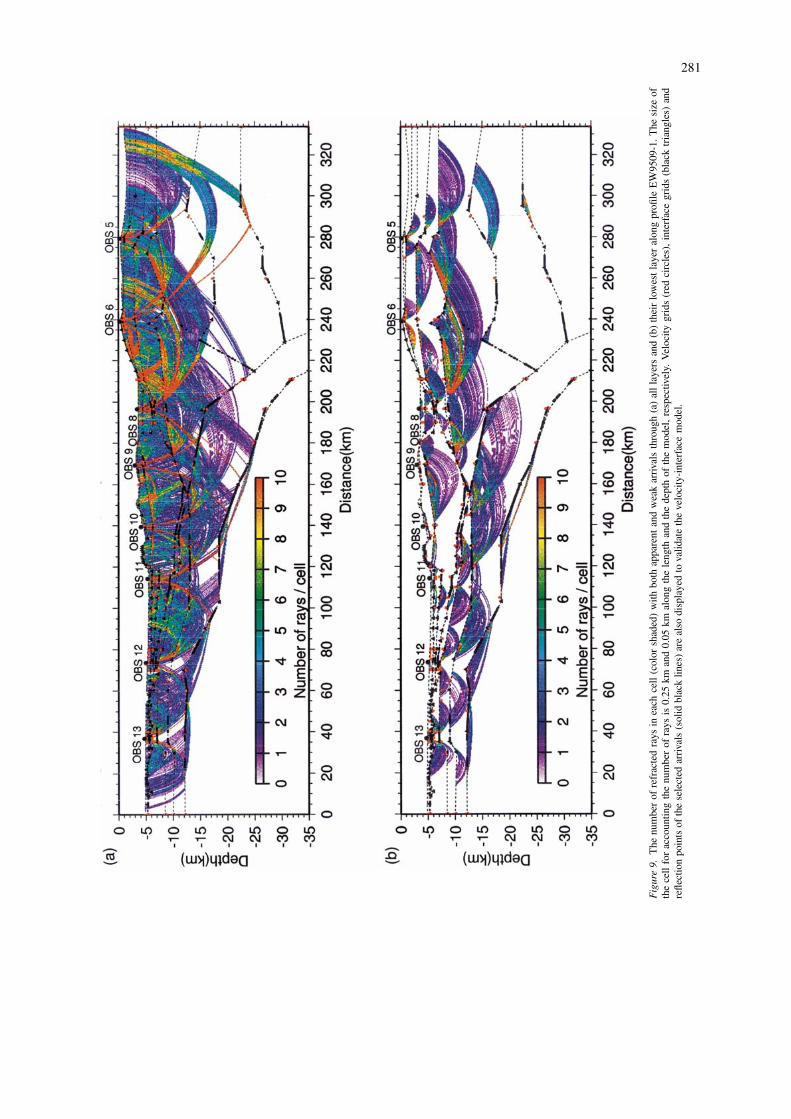
Fig
ure
9.T
henu
mbe
rof
refr
acte
dra
ysin
each
cell
(col
orsh
aded
)w
ithbo
thap
pare
ntan
dw
eak
arri
vals
thro
ugh
(a)
all
laye
rsan
d(b
)th
eir
low
est
laye
ral
ong
profi
leE
W95
09-1
.The
size
ofth
ece
llfo
rac
coun
ting
the
num
ber
ofra
ysis
0.25
kman
d0.
05km
alon
gth
ele
ngth
and
the
dept
hof
the
mod
el,
resp
ectiv
ely.
Vel
ocity
grid
s(r
edci
rcle
s),
inte
rfac
egr
ids
(bla
cktr
iang
les)
and
refle
ctio
npo
ints
ofth
ese
lect
edar
riva
ls(s
olid
blac
klin
es)
are
also
disp
laye
dto
valid
ate
the
velo
city
-int
erfa
cem
odel
.
282
(Pg3 and Pn from OBSs 5, 6 and 8). The velocitystructures of the sediment and the upper crust of theRyukyu Arc are resolved best because the number ofrefracted rays in each cell exceeds 10. In view of thereflection points (the solid black lines) shown in Fig-ure 9a, most of the interfaces of the velocity model arewell constrained except for the intra-crustal interfacesbeneath the Ryukyu Trench (Pc1P and Pc2P fromOBSs 11 and 12) and the sedimentary layers abovethe Ryukyu Arc basement (Ps1P, Ps2P and Ps3P fromOBSs 5 and 6). Moho is well imaged along EW9509-1 because there are sufficient coherent PmP and Pnarrivals as shown by the reflection points and refractedrays in Figure 9a, respectively.
The reason for displaying refracted rays throughtheir lowest layer (Figure 9b) is that only the velocitywithin the lowest layer can be inverted from refractedarrivals when the model parameters of the upper (orprevious) layers are fixed in the layer-stripping ap-proach. Hence, we use the refracted rays through thelowest layer to confirm the proper distribution of themodel parameters. The numbers of refracted rays ineach cell (Figure 9b) are generally consistent withthe velocity control points (the red circles) except forthe sedimentary layers, which have additional con-straints from the velocity analysis of the MCS data.The numbers of upper and lower velocity grids are,respectively, about 25 and 16 (or the average num-bers of upper and lower grids are two and three beloweach station, respectively) in the compacted sedimentand in the upper and middle crusts. Therefore, everyrefracted ray-group from each OBS station in theirlowest layer is generally constrained by a trapezoidalmodel of the velocity grids (Zelt and Smith, 1992).Similarly, the reflection points of the selected arrivals(the solid black lines in Figure 9b) generally matchthe interface grids (the black triangles) except for thesedimentary layers, which have additional constraintsfrom the reflected signals of the stacked MCS data.The maximum number of grids for an interface is 23(or the average number of interface grids is three be-low each station) at the bottom of the upper crust.Thus, every reflected ray-group from each OBS stationconstrains at most a straight segment of the inter-face. The proper distribution of the velocity gridsand the interface grids described above indicates theminimum-parameter model (Zelt, 1999) of this study.
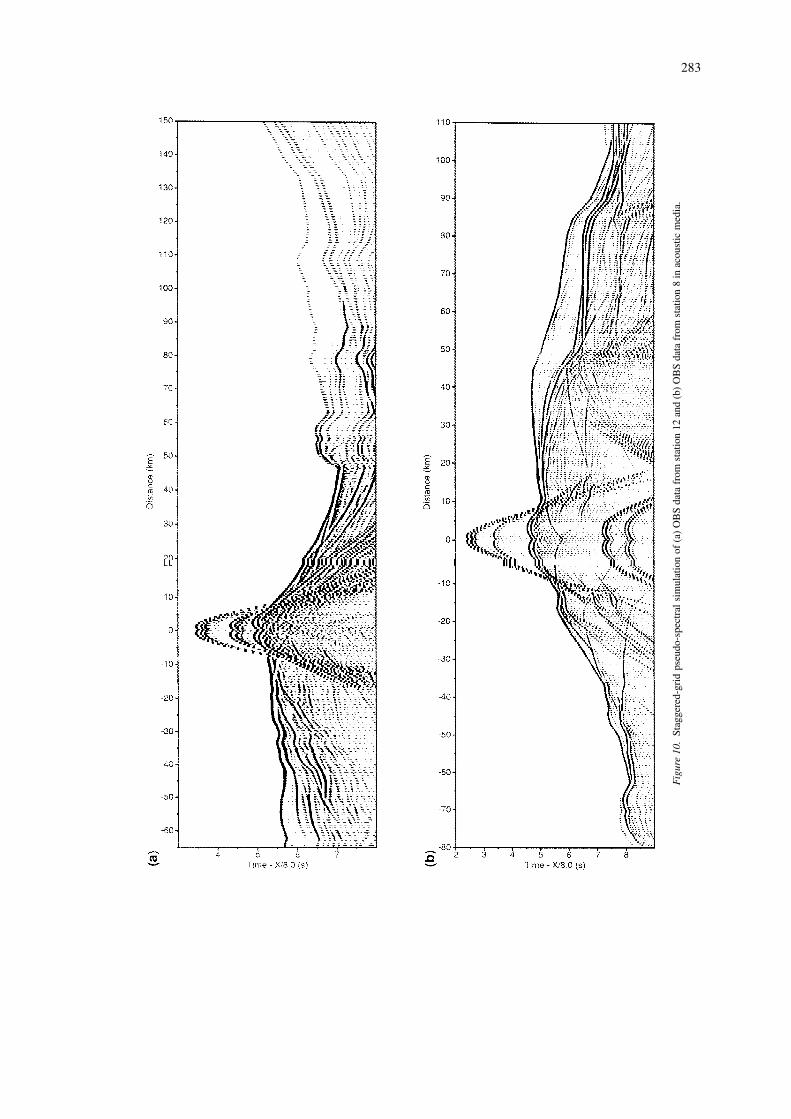
Synthetic seismograms
Synthetic seismograms obtained using staggered-gridpseudo-spectral simulation (Chen, 1996) of the OBSdata are also presented in Figure 10. These simulationsare limited to the acoustic approach because we wouldonly like to demonstrate the validity of the P-wave ve-locity model. The synthetic seismogram of OBS datafrom station 12 (Figure 10a) supports the strong am-plitude and the variation of the apparent velocity fromPn at offsets 40 km to 70 km, as well as the weakamplitude of the arrivals beyond 70 km north of thestation (Figure 2). The former can be attributed to theYaeyama accretionary wedge, and the latter may resultfrom the subducting slab. Furthermore, the similaritiesbetween the OBS data and the synthetic seismogramnot only are observed in the first arrivals, but also inthe later arrivals (PmP and other reflections at the nearoffsets shown in Figure 2 and Figure 10a). Similarly,the staggered-grid pseudo-spectral simulation of OBSdata from station 8 (Figure 10b) demonstrates the am-plitude variation of all first arrivals and of the laterarrivals south of OBS station 8. However, north of thestation, later events in the synthetic seismogram (Fig-ure 10b) are much clearer than those in the OBS data,except for the dipping events (Pc2P) at offsets 10 to40 km (Figure 5). The difference may be due to eitherinterference caused by reverberation and signal atten-uation in the OBS data, or inaccurate deep structures(perhaps the lower crust) north of OBS station 8.
Results and Discussions
We shall describe below the velocity-interface model(Figure 8a) and address its associated tectonic impli-cations, again from south to north.
Huatung Basin
The sedimentary layers in the Huatung Basin assuggested by the model along profile EW9509-1are composed of upper (1.51∼2.25 km/s), lower(2.25∼3 km/s) and compacted (3∼4.5 km/s) sedi-ments. South of the Taitung Canyon, the thickness ofthe upper and lower sediments are 0.2∼0.6 km andless than 0.25 km, respectively (Figure 7c). However,in the southernmost profile, the thickness of the com-pacted sediment varies from non-existence to 0.6 kmand the thickness of the upper crust (4.5∼5.5 km/s) areabout 3 km south of OBS station 13 to 1.5 km north ofit. The sediments to the north of the Taitung Canyon
283
Fig
ure
10.
Stag
gere
d-gr
idps
eudo
-spe
ctra
lsi
mul
atio
nof
(a)
OB
Sda
tafr
omst
atio
n12
and
(b)
OB
Sda
tafr
omst
atio
n8
inac
oust
icm
edia
.

284
are less disturbed. The upper and lower sediments inthe trench are 0.4∼0.6 km thick and from less than0.5 km thick northward to about 1.3 km thick, respec-tively. The thickness of the compacted sediment in theRyukyu Trench also increases from less than 0.5 kmbelow the Taitung Canyon to about 2 km at the southend of the prism. The northward increase of sedimentthickness in the trench reflects northward subductionof the PSP.
Yaeyama accretionary prism
North of the trench, a wedge-shape accretionary prism(3∼4.5 km/s) is developed (Figure 8a). The N-S ex-tent of the accretionary wedge is about 75 km (modeldistance of 120∼195 km) and its average thicknessis 4.5∼6.8 km. The base of the accretionary wedgereaches a depth of 11.9 km below the sea surface. Themaximum thickness of the accretionary wedge is alsosimilar to those in the middle (Kodaira et al., 1996)and northeastern (Iwasaki et al., 1990) Ryukyu sub-duction zones. The northern boundary of the wedge(or the backstop) starts beneath the Nanao Basin andextends southward at least 20 km with a dip of about10 degrees. Undulation of the velocity contours withinthe northern part of the prism implies deformationof the prism due to compression with the RyukyuArc basement (backstop) and strike-slip faulting dueto oblique convergence of the PSP (Lallemand et al.,1999).
Subducting slab of the PSP
North of about 160 km in the model distance in Fig-ure 8a where the accretionary prism is the thickest,P-wave velocities in the upper part of the PSP aregreater than 6.75 km/s. This may be attributed tothe direct contact of the Ryukyu Arc basement withthe PSP. Further northward below the Nanao Basinat distance of about 200 km in Figure 8a, the sub-ducting angle of the oceanic crust increases abruptlynorthward from about 5 degrees between the TaitungCanyon and the Nanao Basin to about 25 degrees tothe north. This important finding is fully confirmedfrom reflection points (black lines in Figure 8a) atthe top of the subducting crust and is also supportedby an earthquake swam (I in Figure 8a). Similarly,based on a one-to-one scale of the velocity-interfacemodel along EW9509-1 (Figure 11), the subductingangle of about 25 degrees beneath the northern partof the Nanao Basin is consistent with the majority
of the nodal planes of the earthquake focal mecha-nisms (Kao et al., 1998) in the southwestern Ryukyuforearc region. The rapid increase of the subductingangle is also similar to that in the Cascadia subduc-tion zone offshore northern California (Leitner et al.,1998), where the post-subduction deformation, thrustfaulting and crust shortening are prevailing from com-pression. Furthermore, at the bottom of the subductingslab, the depth of the Moho increases from 12.2 kmsouth of the Taitung Canyon to 27.4 km beneath theNanao Basin. The variation of the Moho leads to acrustal thickening (11 km) south of the Nanao Basinand a possible crustal thinning (7 km) north of theNanao Basin where constraints from refracted arrivalsthrough the lower crust are lacked. Therefore, wepropose that the increasing angle of subduction, thecrustal thickening and the possible crustal thinning areall attributed to the forearc compression and a possiblebreak-off of the subducting slab (Teng et al., 2000)below the Nanao Basin.
Ryukyu Arc basement
Undulation of the velocity contours within the up-per and middle crusts (4.5∼6.75 km/s) of the RyukyuArc shown in Figure 8a is well imaged by the denserefracted rays (Figure 9). Within the Ryukyu Arc base-ment and underneath the Ryukyu Arc slope, an intra-crustal interface (at a velocity contour of 6.75 km/s)is also well constrained by the reflected arrivals (in-dicated by the thick solid lines in Figure 12). Thisvelocity interface, with a length of about 16 km, dipssouthward with an angle of about 30 degrees and mayextend upward to the irregular interface (at a velocitycontour of 5.5 km/s) below OBS station 6. Beneaththe Ryukyu Arc basement, the depth of the Mohois northward decreasing from 30.6 km to 22.5 kmwithin a distance of 65 km. The undulation of thevelocity contours (4.5∼6.75 km/s), the variation ofthe intra-crustal interfaces (at velocity contours of 5.5and 6.75 km/s) and of the Moho depths within andbelow the Ryukyu Arc may have resulted from fore-arc compression between the prism and the arc to thesouth, and backarc extension of the southern OkinawaTrough to the north. Two swarms of earthquakes (Iand II in Figure 8a) beneath the Nanao Basin and be-tween the southern Okinawa Trough and the RyukyuArc are evidence of forearc compression and backarcextension, respectively. Active earthquakes and fore-arc compression beneath the Nanao Basin are also

285
Figure 11. Sedimentary and crustal structures (1:1 scale) of the P-wave velocity and the focal mechanisms (Kao et al., 1998) along profileEW9509-1 in the southwestern Ryukyu forearc region. Focal spheres are projected onto the seismic profile and their darkened quadrants showthe first motion of the compressional wave. Errors of the epicenter and the focal depth of these focal mechanisms are generally less than 5 km.
consistent with the predicted location of the tear fault(Lallemand et al., 1997).
We find similar velocity discontinuities in thisstudy and in those of the middle (Kodaira et al., 1996)and northeastern (Iwasaki et al., 1990) Ryukyu sub-duction zones. Due to the limited ray coverage in thevelocity-interface model, the lower crust and the uppermantle north of the Nanao Basin cannot be sufficientlyimaged. Therefore, we cannot examine the hypotheseson the slab break-off (Teng et al., 2000) or the slab tear(Lallemand et al., 1997) in the upper mantle north ofthe Nanao Basin.
Conclusions
OBS data and MCS images across the southwesternRyukyu subduction zone is presented in this paper.Layer-stripping inversion and Monte-Carlo modelingof refracted and reflected arrivals identified from theOBS/MCS data enables us to construct a velocity-interface model along profile EW9509-1. The finalresult is constructed based on the least travel-time
residual of the individual phase and the consistencyof the model grids and the number of rays. The for-mer approach leads to good accuracy of the model,and the latter results in parameterization of the non-uniform and sparse grids. Except for the sedimentarylayers above the Ryukyu Arc basement, all the upper(1.51∼2.25 km/s), lower (2.25∼3 km/s) and com-pacted (3.000∼4.50 kms/s) sediments along profileEW9509-1 are well imaged by the MCS and OBSdata. Intra-crustal interfaces are well constrained atvelocity contours of 5.5 km/s and 6.75 km/s, exceptbelow the Huatung Basin. Because there are sufficient,coherent PmP and Pn arrivals, Moho (7.75 km/s) iswell constrained throughout the entire model.
North of the Taitung Canyon, the northward sub-duction of the PSP has resulted in a northward in-crease of the sedimentary thickness in the trench anda wedge-shaped Yaeyama accretionary prism north ofthe trench. The strongest compression due to subduc-tion may have occurred below the Nanao Basin, assupported by earthquake hypocenters and focal mech-anisms, leading to a sudden increase in the angle

286
of the subduction (from 5 degrees to 25 degrees), asudden decrease in the thickness of the oceanic crust(from 11 km to 7 km) and a possible break-off of theslab beneath the Nanao Basin. The boundary betweenthe subducting PSP and the Ryukyu Arc basement isfound at a velocity contour of 6.75 km/s below theNanao Basin. This boundary starts at a depth of 1 kmbelow the thickest portion of the prism, continues to adepth of 13 km below the center of the Nanao Basin,and reaches a depth of 22 km below the toe of theRyukyu Arc slope with a total length of about 62 km.
Forearc compression between the prism and thearc can be observed from the velocity undulationwithin the northern portion of the prism, while bothforearc compression and backarc extension may haveresulted in the observed velocity undulation and in-terface variation within the upper crust of the RyukyuArc. Two swarms of earthquakes beneath the NanaoBasin and between the southern Okinawa Trough andthe Ryukyu Arc are evidence of forearc compressionand backarc extension, respectively.
The velocity-interface structures established inthis study reveal details of crustal deformation ofthis oblique subduction system in the southwesternRyukyu Arc. Our velocity-interface model can be usedin earthquake relocations and to provide additionalconstraints for determining focal mechanisms.
Acknowledgements
T. K. Wang would like to dedicate this work, his firstinternational publication at NTOU, to the Lord. Wethank S. Operto, G. L. Christeson and M. Wiederspahnfor their helps at installation and usage of OBSTOOL,RAYINV and RSTTI. Figures except seismic imagesare generated from GMT (Wessel and Smith, 1995).Encouragements for writing up this manuscript fromJ.-C. Sibuet and C. S. Wang are appreciated. Wethank two anonymous reviewers for their suggestionsto improve this manuscript. Continuous funding sup-ports from NSC 85-2611-M-019-003, NSC 86-2117-M-019-ODP, NSC 87-2611-M-002-A-016-ODP, NSC88-2611-M-019-014-ODP are acknowledged.
References
Chen, H. W., 1996, Staggered-grid pseudospectral viscoacousticwave field simulation in two-dimensional media, J. Acous. Soc.Amer. 100, 120–131.
Christeson, G. L., 1995, OBSTOOL: software for processing UTIGOBS data, University of Texas Institute for Geophysics, TechnicalReport, No. 134, pp. 27.
Font, Y., Liu, C. S., Schnurle, P., and Lallemand, S., 2001,Constraints on backstop geometry of the southwest Ryukyu sub-duction based on reflection seismic data, Tectonophysics 333,135–158.
Hagen, R. A., Duennebier, F. K., and Hsu, V., 1988, A seismicrefraction study of the crustal structure in the active seismic zoneeast of Taiwan, J. Geophys. Res. 93, 4785–4796.
Henkart, P., 2000, SIOSEIS Users’ Manual, Versions 2000.2,Scripps Institution of Oceanography, University of California.
Huang, C. Y., Yuan, P. B., Lin, C. W., Wang, T. K., and Chang, C. P.,2000, Geodynamic processes of Taiwan arc-continent collisionand comparison with analogs in Timor, Papua New Guinea, Uralsand Corsica, Tectonophysics 325, 1–21.
Iwasaki, T., Hirata, N., Kanazawa, T., Melles, J., Suyehiro, K.,Urabe, T., Moller, L., Makris, J., and Shimamura, H., 1990,Crustal and upper mantle structure in the Ryukyu Island Arcdeduced from deep seismic sounding, Geophys. J. Int. 102,631–651.
Kao, H., Shen, S. S. J., and Ma, K. F., 1998, Transition from obliquesubduction to collision: Earthquakes in the southernmost Ryukyuarc-Taiwan region, J. Geophys. Res. 103, 7,211–7,229.
Kimura, M., 1985, Back-arc rifting in the Okinawa Trough, Mar.Pet. Geol. 2, 222–240.
Kodaira, S., Iwasaki, T., Urabe, T., Kanazawa, T., Egloff, F., Makris,J., and Shimamura, H., 1996, Crustal structure across the middleRyukyu trench obtained from ocean bottom seismographic data,Tectonophysics 263, 39–60.
Lallemand, S. E., Liu, C. S., and Font, Y., 1997, A tear fault bound-ary between the Taiwan orogen and the Ryukyu subduction zone,Tectonophysic 274, 171–190.
Lallemand, S. E., Liu, C. S., Dominguez, S., Schnürle, P.,Malavieille, J., and the ACT Scientific Crew, 1999, Trench-parallel stretching and folding of forearc basins and lateralmigration of the accretionary wedge in the southern Ryukyus: Acase of strain partition caused by oblique convergence, Tectono-physics 18, 231–247.
Leitner, B., Trehu, A. M., and Godfrey, N. J., 1998, Crustal structureof the northwestern Vizcaino block and Gorda Escarpment, off-shore northern California, and implications for postsubductiondeformation of a paleoaccretionary margin, J. Geophys. Res. 103,23,795–23,812.
Liu, C. S., Schnürle, P., Lallemand, S. E., and Reed, D. L.,1997, TAICRUST and deep seismic imaging of western end ofRyukyu arc-trench system, In K. Fujioka ed., Deep Sea Researchin Subduction Zones, Spreading Centers and Backarc Basins,JAMSTEC J. Deep Sea Res., 39–45.
Liu, C. S., Liu, S. Y., Lallemand, S. E., Lundberg, N., and Reed,D. L., 1998, Digital elevation model offshore Taiwan and itstectonic implications, Terr. Atmo. Ocea. 9, 705–738.
McIntosh, K. D., and Nakamura, Y., 1998, Crustal structure beneaththe Nanao forearc basin from TAICRUST MCS/OBS Line 14,Terr. Atmo. Ocea. 9, 345–362.
Operto, S., 1996, RSTTI package: Ray Based Seismic Travel TimeInversion, University of Texas Institute for Geophysics, TechnicalReport, No. 148, pp. 36.
Schnürle, P., Liu, C. S., Lallemand, S. E., and Reed, D. L., 1998a,Structural insight into the south Ryukyu margin: Effects of thesubducting Gagua Ridge, Tectonophysics 288, 237–250.
Schnürle, P., Liu, C. S., Lallemand, S. E., and Reed, D. L., 1998b,Structural controls of the Taitung Canyon in the Huatung Basineast of Taiwan, Terr. Atmo. Ocea. 9, 453–472.

287
Sibuet, J. C., Letouzey, J., Barbier, F., Charvet, J., Foucher, J. P.,Hilde, T. W. C., Kimura, M., Chiao, L. Y., Marsset, B., Mullere,C., and Stephan, J. F., 1987, Back arc extension in the OkinawaTrough, J. Geophys. Res. 92, 14,041–14,063.
Sibuet, J. C., and Hsu, S. K., 1997, Geodynamics of the Taiwanarc-arc collision, Tectonophysics 274, 221–251.
Sibuet, J. C., Deffontaines, B., Hsu, S. K., Thareau, N., Le Formal,J. P., Liu, C. S., and the ACT party, 1998, Okinawa trough back-arc basin: Early tectonic and magmatic evolution, J. Geophys.Res. 103, 30,245–30,267.
Teng, L. S., Lee, C. T., Tsai, Y. B., and Hsiao, L. Y., 2000, Slabbreakoff as a mechanism for flipping of subduction polarity inTaiwan, Geology 28, 155–158.
Wang, T. K., and Chiang, C. H., 1998, Imaging of arc-arc collisionin the Ryukyu forearc region offshore Hualien from TAICRUSTOBS Line 16, Terr. Atmo. Ocea. 9, 329–344.
Wang, T. K., and Pan, C. H., 2001, Crustal Poisson’s ratio off easternTaiwan from OBS data modeling, Terr. Atmo. Ocea. (Suppl.),249–268.
Wessel, P., and Smith, W. H. F., 1995, New version of the genericmapping tools (GMT) version 3.0 released, Eos Trans. AGU 76,329.
Yang, Y. S., and Wang, T. K., 1998, Crustal velocity variation of thewestern Philippine Sea Plate from TAICRUST OBS/MCS Line23, Terr. Atmo. Ocea. 9, 379–393.
Zelt, C. A., 1999, Modelling strategies and model assessment forwide-angle seismic traveltime data, Geophys. J. Int. 139, 183–204.
Zelt, C. A., and Barton, P. J., 1998, Three-dimensional seismicrefraction tomography: A comparison of two methods appliedto data from the Faeroe Basin, J. Geophys. Res. 103, 7187–7210.
Zelt, C. A., and Smith, R. B., 1992, Seismic traveltime inversion for2-D crustal velocity structure, Geophys. J. Int. 108, 16–34.
Related Documents