Velocity field for crustal deformation in China derived from seismic moment tensor summation of earthquakes Changyuan Qin 1 , Constantinos Papazachos * , Eleftheria Papadimitriou Geophysical Laboratory, School of Geology, University of Thessaloniki, P.O. Box 352-1, Thessaloniki GR-54006, Greece Received 15 November 2001; accepted 10 July 2002 Abstract The intraplate motion is studied in the territory of China where about 150 polygonal seismic sources are considered and grouped on the basis of the available fault plane solutions, large known faults and level of seismic activity. Every polygon is divided into several triangles and velocities at the triangle vertices are determined from the available moment rate tensors by assuming a linear continuity of the velocity field within each triangle. The estimation of the moment rate tensor is partitioned in the unit-scaled moment tensor obtained by the available fault plane solutions of large event (M z 5.0) after 1900, which define the type of deformation and the scalar annual moment rate, obtained by the complete seismicity catalogue which defines the rate of seismic deformation. The results show that the convergence between India and Eurasia is about 50 mm/year with Eurasia fixed, while the eastern part of China moves eastwards at about 8 –10 mm/year. The motion direction changes gradually from northeastward around the Himalayan region to southeastward around the Red River fault and to southwestward around eastern Himalayan Syntaxis, which partially compensates the penetration of the Indian plate. A sharp change of the velocity gradient was found near the southeastern part of Tibet plateau, the Qilianshan region and Fuyun fault where large strain rates are released due to strong earthquakes there. The results are supported by recent horizontal GPS motion model and other independent evidence. The motion pattern between the Altun – Qilianshan – Longmenshan faults and the Himalayan fault in Qinghai– Tibet region strongly suggests that this area exhibits a more or less continuous deformation pattern rather than a rigid block behavior. D 2002 Published by Elsevier Science B.V. Keywords: China; Seismicity; Moment rate; Crustal deformation 1. Introduction Crustal deformation takes place not only at the plate boundaries, according to the hypothesis of plate tectonics, but also along broad intraplate zones (Madar- iaga, 1983; Peltzer, 1988). Displacement across faults is associated with great earthquakes, which represent the episodic slip at the brittle interface between plates. The total slip accumulated during large earth- quakes in a given segment of a fault corresponds very closely to the rate of relative motion between the plates determined by other non-seismological methods (Madariaga, 1983). Thus, earthquakes are due to the rapid release of strain energy that has been 0040-1951/02/$ - see front matter D 2002 Published by Elsevier Science B.V. PII:S0040-1951(02)00401-8 * Corresponding author. E-mail addresses: [email protected] (C. Qin), [email protected] (C. Papazachos). 1 Now at the School of Environmental Sciences, University of East Anglia, NR4 7TJ Norwich, UK. www.elsevier.com/locate/tecto Tectonophysics 359 (2002) 29– 46

Welcome message from author
This document is posted to help you gain knowledge. Please leave a comment to let me know what you think about it! Share it to your friends and learn new things together.
Transcript
Velocity field for crustal deformation in China derived from seismic
moment tensor summation of earthquakes
Changyuan Qin1, Constantinos Papazachos*, Eleftheria Papadimitriou
Geophysical Laboratory, School of Geology, University of Thessaloniki, P.O. Box 352-1, Thessaloniki GR-54006, Greece
Received 15 November 2001; accepted 10 July 2002
Abstract
The intraplate motion is studied in the territory of China where about 150 polygonal seismic sources are considered and
grouped on the basis of the available fault plane solutions, large known faults and level of seismic activity. Every polygon is
divided into several triangles and velocities at the triangle vertices are determined from the available moment rate tensors by
assuming a linear continuity of the velocity field within each triangle. The estimation of the moment rate tensor is partitioned in
the unit-scaled moment tensor obtained by the available fault plane solutions of large event (Mz 5.0) after 1900, which define
the type of deformation and the scalar annual moment rate, obtained by the complete seismicity catalogue which defines the rate
of seismic deformation. The results show that the convergence between India and Eurasia is about 50 mm/year with Eurasia
fixed, while the eastern part of China moves eastwards at about 8–10 mm/year. The motion direction changes gradually from
northeastward around the Himalayan region to southeastward around the Red River fault and to southwestward around eastern
Himalayan Syntaxis, which partially compensates the penetration of the Indian plate. A sharp change of the velocity gradient
was found near the southeastern part of Tibet plateau, the Qilianshan region and Fuyun fault where large strain rates are released
due to strong earthquakes there. The results are supported by recent horizontal GPS motion model and other independent
evidence. The motion pattern between the Altun–Qilianshan–Longmenshan faults and the Himalayan fault in Qinghai–Tibet
region strongly suggests that this area exhibits a more or less continuous deformation pattern rather than a rigid block behavior.
D 2002 Published by Elsevier Science B.V.
Keywords: China; Seismicity; Moment rate; Crustal deformation
1. Introduction
Crustal deformation takes place not only at the
plate boundaries, according to the hypothesis of plate
tectonics, but also along broad intraplate zones (Madar-
iaga, 1983; Peltzer, 1988). Displacement across faults
is associated with great earthquakes, which represent
the episodic slip at the brittle interface between
plates. The total slip accumulated during large earth-
quakes in a given segment of a fault corresponds
very closely to the rate of relative motion between
the plates determined by other non-seismological
methods (Madariaga, 1983). Thus, earthquakes are
due to the rapid release of strain energy that has been
0040-1951/02/$ - see front matter D 2002 Published by Elsevier Science B.V.
PII: S0040 -1951 (02 )00401 -8
* Corresponding author.
E-mail addresses: [email protected] (C. Qin),
[email protected] (C. Papazachos).1 Now at the School of Environmental Sciences, University of
East Anglia, NR4 7TJ Norwich, UK.
www.elsevier.com/locate/tecto
Tectonophysics 359 (2002) 29–46

concentrated in the vicinity of the fault zone by the
slow deformation of the lithosphere. Peltzer and
Saucier (1996) showed that long-term deformation
within continents is mostly localized into major
faults. Thus, the motion of quasi-rigid blocks of
the earth’s crust can be used to describe the corre-
sponding velocity field (Haines, 1982). The moment
tensors, which are related to the size of the corre-
sponding earthquakes, can be used to determine the
crustal deformation of a seismogenic volume (Kos-
trov, 1974; Jackson and McKenzie, 1988; Ward,
1998a,b).
The relationship between the seismic deformation
and the moment has been discussed in detail (Jackson
and McKenzie, 1988; Westaway, 1991, 1995; Savage
and Simpson, 1997). Haines (1982) proposed a
Fig. 1. The distribution of major faults zones within the broader China area. Small gray arrows indicate the local motion, as this is determined by
geological/tectonic field observations (Ma, 1987). The large labeled arrows indicate the average motion of the Indian, Pacific and Philippine
plates.
C. Qin et al. / Tectonophysics 359 (2002) 29–4630

method that allows to uniquely obtain the general
horizontal velocity field, where he showed that with a
generally variable strain field in which the rates of
horizontal shear strain are everywhere known, the
complete horizontal velocity field can be recovered
if one line remains unstrained. Therefore, the key to
obtaining the horizontal velocity field occurring
across and within zones of distributed deformation
lies in the ability to determine the spatial variation in
the strain rate field (Haines and Holt, 1993). Different
methods, based on these concepts, have been used to
model the motion of the earth’s crust (Holt et al.,
1991, 1995; Haines and Holt, 1993; Peltzer and
Saucier, 1996; England and Molnar, 1997a,b).
Crustal deformation in the mainland of China is
mainly due to the strong northeastward motion of the
Indian plate at southwest China (all the motions are
relative to ‘‘stable’’ Eurasia, unless otherwise speci-
fied), the westward subduction of Pacific plate beneath
East China and the northwestward impact of the
Philippine plate (Fig. 1) (Chen and Molnar, 1977;
Deng et al., 1994). Kinematic and dynamic processes
are mainly controlled by these plate motions (Ma,
1987; Xu and Deng, 1996; Qin et al., 1999a), which
are related to the formation of large faults and high
seismic activity. Because of the complexity of the joint
motions, different types of regional faults are found
that are more or less responsible for the local motion.
In the framework of the present work, about 150
polygonal seismic sources of 10 seismotectonic zones
are determined in the mainland of China and its
surrounding area based on the geological and seismo-
tectonic characteristics, the known fault plane solu-
tions and the seismic activity. Based on the moment
rate calculated from the maximum magnitude and the
parameters from magnitude–frequency relation, as
well as the moment tensor decomposition method
(Papazachos and Kiratzi, 1992), the velocity field
with respect to Eurasia is quantitatively determined
by the complete earthquake data set (Qin et al., 1999a)
and the regional focal mechanisms. The model stain
rate field is compared with the one directly obtained
from moment rate for the validation of the method.
Moreover, the velocity field with Eurasia fixed is
compared with the GPS’ one using the kinematic
model given by Zhang and Zhou (1998), which was
obtained from GPS measurements collected between
1994 and 1996.
2. Data and seismotectonic setting
In order to estimate the seismic deformation in the
study area, it is necessary to have a reliable seismicity
catalogue, as well as an adequate number of fault
plane solutions (see ‘‘Electronic Supplements’’ on the
journal’s homepage http://www.elsevier.com/locate/
tecto). The catalogue used for the purpose of the
present study is distributed by the China Seismolog-
ical Bureau (CSB) of P.R. China and covers the time
period from 1800 A.D. to 1995, containing earth-
quakes with equivalent moment–magnitudesMz 5.0.
This catalogue was checked in comparison with the
catalogues of Pacheco and Sykes (1992) and Abe
(1981), as well as with the ISC bulletins since 1966
and modified accordingly. The completeness of the
data used in the present study (Table 1) is the one
proposed by Qin et al. (1999a), which has been
defined studying the low-magnitude linearity cut-off
of the Gutenberg–Richter relation for data of different
time periods, as well as time behavior of the cumu-
lative number of the events (Qin et al., 1999a). The
catalogue was updated until the beginning of 2000
and extended in order to include northern India,
Mongolia and the southern part of Siberia (Fig. 2).
For the fault plane solutions only those with
magnitude Mz 5.0 were used, in order to have a
relative reliable data set, resulting in 735 fault plane
solutions of earthquakes which have occurred since
1900. Most of the data were determined using first
motions from long period recordings or from wave-
form modeling. A small part of the fault plane
solutions were derived from field observations and
aftershock sequences. In many case when more than
one fault plane solutions were available for the same
event, especially the large ones, the waveform model-
ing solution (e.g. Harvard CMT, etc.) was preferred.
Four main zones of similar faulting pattern can be
outlined by the fault plane solutions for the broader
China area (Fig. 3).
Table 1
Completeness information for the seismicity data used in the present
study
Magnitude Time interval
Mz 8.0 1800–2000
8.0>Mz 6.0 1900–2000
6.0>Mz 5.0 1950–2000
C. Qin et al. / Tectonophysics 359 (2002) 29–46 31

2.1. Thrust faulting zone around the Himalayans
The Himalayan front in southwest China is char-
acterized by compression and is undergoing rapid
uplift (Molnar and Lyon-Caen, 1989; Gao, 1996)
due to the intrusion of Indian plate, with fault planes
dipping northwards. Bouguer anomalies are increas-
ingly dominated by negative values as we move
northwards from India towards China, indicating that
the crust is thickening in this direction (Kearey and
Vine, 1990). The overall pattern of fault plane sol-
utions is compatible with the subduction of the Indian
plate in front of the Himalayan Frontal Thrust. The
continuous uplift of this zone accommodates part of
the material accretion by the intrusion (Molnar and
Lyon-Caen, 1989).
2.2. Thrust faulting zone in the northwestern part of
China and its surrounding areas
The northwest part of China is also supposed to
be controlled by thrust faulting. It extends from the
eastern boundary of Tarim basin, passing the Tien
Shan thrust fault, to the area out of China (Kazakh-
stan, etc.) (Avouac et al., 1993). This zone is
believed to be the place that absorbs most of the
‘‘rheological-type’’ of deformation caused by the
penetration of the Indian plate. England and Molnar
(1997a) have suggested that the continental litho-
sphere of Asia is more properly regarded as belong-
ing to the ‘‘fluid’’ portion of the solid earth than to
the relatively small fraction of Earth that behaves as
a rigid plate.
Fig. 2. Distribution of the epicenters of the complete catalogue used in the present study.
C. Qin et al. / Tectonophysics 359 (2002) 29–4632

2.3. Normal faulting zone along the Indus Tsangpo
Suture
A large normal faulting zone runs along the Indus
Tsangpo Suture. Almost all the T-axes of the fault
plane solutions have an east–west direction (Qin et
al., 2001). These normal faults are located at higher
altitude (>5000 m) and gradually change to strike–
slip faults with the decrease of altitude northwards
(Molnar and Lyon-Caen, 1989). Several possible
explanations have been presented about these normal
faults. England and Houseman (1988) explained the
formation of these normal faults as a result of thermal
activity.
2.4. Strike–slip faulting zone
Strike–slip motion is the main type of deformation
in the territory of China. Houseman and England
(1993), by employing rheological models, pointed
out that a large part of the indentation of the Indian
plate has been accommodated by eastward motion of
the lithosphere blocks of southeastern China. They
claimed that the total north–south shortening strain
caused by the Indian impact is partitioned between
crustal thickening and eastward displacement in the
ratio of 3:1 and 4:1. Molnar and Lyon-Caen (1989)
argued that about one-third of the indentation is
excluded eastwards out of the Tibet block. Recent
views favor a rheological model for the Asia rather
than the traditional rigid block approach (Molnar and
Gipson, 1996; England and Molnar, 1997a; Wen and
Anderson, 1997).
3. Method
The estimation of the velocity field was performed
in a two-step process. The first step concerns the
estimation of the strain-rate tensor following the
Fig. 3. The fault plane solutions distribution around the territory of China and its nearby regions.
C. Qin et al. / Tectonophysics 359 (2002) 29–46 33
method of Kostrov (1974), as this is modified by
Papazachos and Kiratzi (1992). In the second step, the
velocity field is quantitatively estimated from the
strain rate by means of a finite element method (Eng-
land and Molnar, 1997b). These two steps of the
applied method are described in detail in the following.
3.1. Estimation of strain rate tensor
The average strain rate of a seismogenic volume
for a non-simple shear region can be obtained through
the moment tensor summation technique (Kostrov,
1974):
eij ¼1
2lVs
XNn¼1
Mnij ¼
1
2lVsMij ð1Þ
where l is the shear modulus (for the present study
l = 3.3e� 11 dyn/cm2; Research Group of SSB,
1988); s the time interval spanned by the data; N
the number of earthquakes in the volume V (thickness
of the seismogenic volume is assumed to be 15 km),
Mijn the nth earthquake’s moment tensor element, and
Mij the sum of moment tensor in the seismogenic
volume V. The moment tensors can be easily esti-
mated from the focal mechanisms using the relations
of Aki and Richards (1980). It should be noted that
the coordinate system used was the East(x) –
North( y)–Up(z) system, which has been adopted
throughout the present study.
For a simple shear region Westaway (1991) modi-
fied the above formulae by giving a modified tensor
that reveals valid information about the deforming
region. Since the largest part of China is mostly
dominated by the strike slip with thrust/normal com-
ponents, we do not expect to have a pure simple shear
region, hence the application of relation (1) can be
considered as valid for the present paper.
To avoid problems in the application of relation (1)
in the cases when seismic faults intersect the boundary
of each studied seismogenic zone (Molnar, 1983), we
have separated the examined area in 10 seismogenic
zones (Fig. 4), which have been defined by Qin et al.
(2001). These zones follow the trend of major faults
and are relatively large in comparison with the fault
dimensions. On the other hand, it has been pointed out
that there is more information in the individual
moment tensors (i.e. motion) of earthquakes in a
deforming seismogenic volume than is described by
the sum of the moment tensors across the zone
(Jackson and McKenzie, 1988). It is therefore neces-
sary to split each deforming zone into smaller regions
of relatively homogeneous deformation, before esti-
mating the summed moment tensors. Therefore, more
than 150 polygonal seismic sources were defined on
the basis of geological and seismotectonic character-
istics as well as the seismic activity and available focal
mechanisms (Qin et al., 1999b, 2001), also shown in
Fig. 4. Each source has been further divided into
triangles for the application of the finite-element
method, later described.
For the application of Eq. (1) it is necessary that the
moment tensor data be complete during the time
interval s, otherwise the calculated strain rate will be
underestimated. However, this condition is rarely met,
especially for historical events. In general, the seismic-
ity data are complete over much larger time periods
than the fault plane solutions. To overcome this prob-
lem, we have applied the decomposition method pro-
posed by Papazachos and Kiratzi (1992) according to
which the annual moment rate tensor can be partitioned
in two independent quantities, namely the unit-scaled
moment tensor m and the scalar seismic moment rate
Mo. The unit-scaled moment tensor m, which describes
the ‘‘shape’’ of the deformation can be estimated from
all the reliable focal mechanism data and/or geological
data. On the other hand, the scalar seismicmoment rate,
M0, can be estimated from the complete seismicity data,
which are usually available for much larger time
periods. Following this approach, relation (1) can be
written as:
e ¼ 1
2lVsM0m ¼ 1
2lVM0m ð2Þ
The unit-scaled or ‘‘shape’’ tensor m can be estimated
from all the focal mechanisms available for the studied
region, regardless of their completeness, using equa-
tion:
mij ¼
Xn
MnijX
n
Mn0
ð3Þ
whereMijn is the ijth component of the moment tensor of
the nth focal mechanism and M0n is its corresponding
C. Qin et al. / Tectonophysics 359 (2002) 29–4634

scalar moment. When more than one fault plane sol-
utions are available in a region the bigger earthquakes
have larger weight (larger M0) than that of the small
ones for the calculation of the representative ‘‘shape’’
tensor,m, as can be seen from Eq. (3). This reflects their
larger significance for regional tectonics but is also
convenient as larger earthquakes usually have more
reliable fault plane solutions than the smaller ones.
For the scalar seismic moment rate M0, it was
calculated from the complete seismic data set follow-
ing the formulation suggested by Molnar (1979),
which employs the following equation:
M0 ¼ a1�b M
1�b0;max
a ¼ 10ða�bdcÞ; b ¼ �b
c
ð4Þ
where a and b are the parameters of the Gutenberg–
Richter relation, c and d are the coefficients of the
empirical moment–magnitude relation taken equal to
1.5 and 16.1, respectively, in the present study (Kana-
mori, 1977; Ekstrom and Dziewonski, 1988) and
M0,max is the moment released by the maximum
earthquake in the examined area. Since Eq. (4) is
based on an integration of the released moment
through the Gutenberg–Richter relation, the contribu-
tion of smaller magnitude events (M < 5.0) is indi-
rectly taken into account in the estimation of the total
deformation. The contribution of such events can be
quite significant and is often equal to the contribution
of large magnitude events (e.g. Ambraseys and Jack-
son, 1997). However, since the relation between the
slip-sense of small- and large-magnitude events is still
not well understood, the application of Eq. (4) should
Fig. 4. Division of the study area into 10 main seismotectonic zones (thick solid lines) and 147 polygons (dashed lines) inside the mainland of
China, on the basis of seismotectonic information, fault plane solutions and seismicity level of the broader China mainland. The less active dot-
dashed zones outside the China mainland have been defined only by seismicity level and the available fault plane solutions.
C. Qin et al. / Tectonophysics 359 (2002) 29–46 35

be limited to small areas (sources) of more or less
homogeneous seismicity and faulting pattern, such as
the ones defined in the present study.
Since the seismicity catalogue had different com-
pleteness for various time periods (see Table 1), we
have used the ‘‘mean value method’’ (Milne and
Fig. 5. The horizontal velocity field obtained for the studied area. The results are determined by fixing the two points shown by the solid
triangles. The dashed ellipses give the one-sigma velocity errors. A and B present the corresponding motion patterns with southeastern China
and India plate fixed, as respectively denoted by fixed points (solid triangles).
C. Qin et al. / Tectonophysics 359 (2002) 29–4636
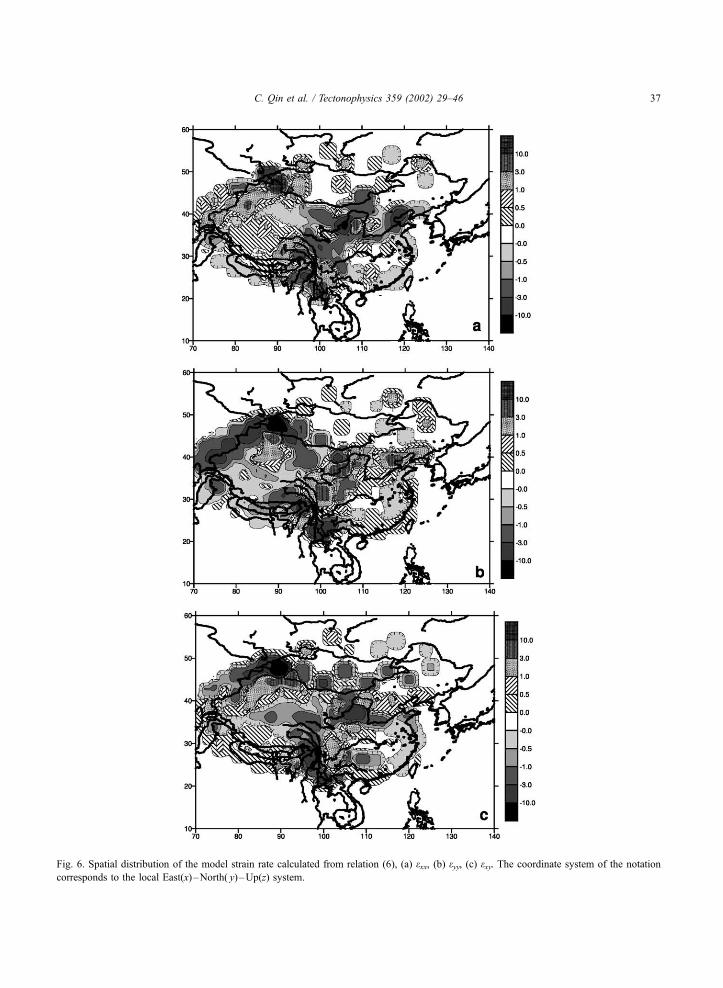
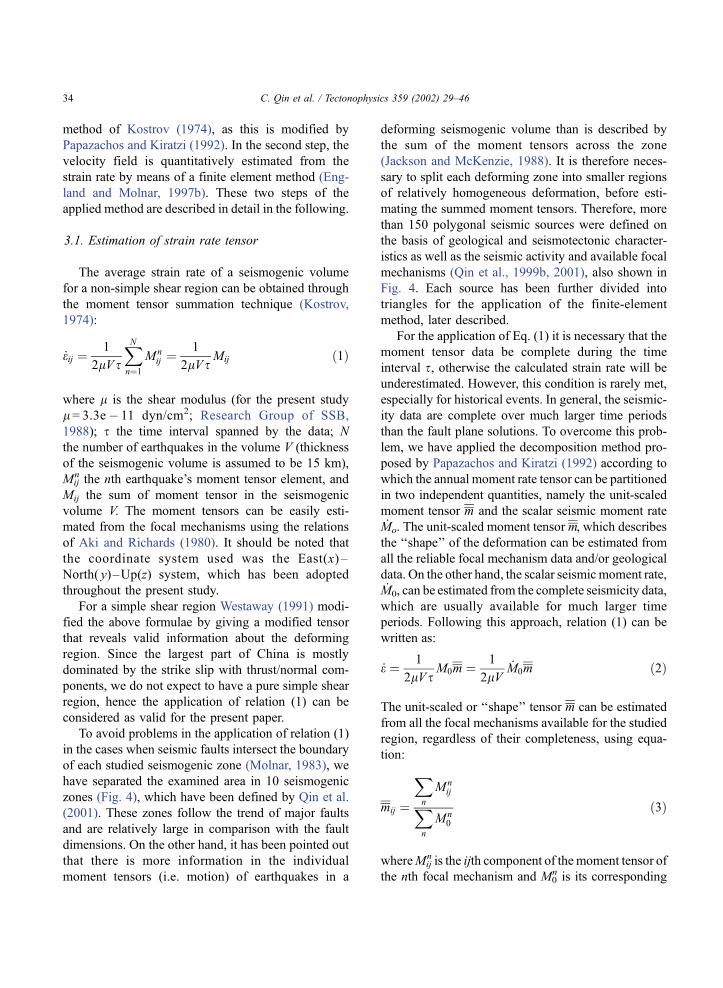
Fig. 6. Spatial distribution of the model strain rate calculated from relation (6), (a) exx, (b) eyy, (c) exy. The coordinate system of the notation
corresponds to the local East(x) –North( y) –Up(z) system.
C. Qin et al. / Tectonophysics 359 (2002) 29–46 37

Fig. 7. Spatial distribution of the observed strain rate obtained from relation (2), (a) exx, (b) eyy, (c) exy .
C. Qin et al. / Tectonophysics 359 (2002) 29–4638
Davenport, 1969), which allows the estimation of a
and b values with quite high accuracy over a long time
period. The b value, a relatively stable parameter in
comparison with the a value (Qin et al., 1999a), is
widely believed to be closely related to the tectonics
(Mogi, 1967) and the stress field (Scholz, 1968; Wyss,
1973). Therefore, the b value was calculated for each
of 10 different zones (Fig. 4), whereas the a value, a
rapidly changing spatially parameter, which depends
on the level of seismic activity (Rundle, 1989; Tur-
cotte, 1989, 1992; Pacheco et al., 1992), was deter-
mined for each triangle. By substituting the maximum
moment M0,max, and the a and b value into relation
(4), the scalar moment rate can be obtained for each
triangle.
3.2. Inversion of the velocity field
As previously mentioned, every polygonal seismic
source was separated into several triangles so the
finite element method could be applied, as this was
described by England and Molnar (1997b). In order to
obtain the velocities at the vertices of every triangle,
linear deformation inside each triangle was assumed.
If the horizontal velocities at three vertices are (ui, vi),
(uj, vj) and (uk, vk) and the corresponding coordinates
are (xi, yi), (xj, yj) and (xk, yk), then the velocity (u, v)
at any point (x, y) inside the triangle can be estimated
using the following interpolation functions (England
and Molnar, 1997b):
u ¼ Niui þ Njuj þ Nkuk
v ¼ Nivi þ Njvj þ Nkvk ð5Þ
where
Nl ¼1
2Dðal þ blxþ clyÞ ðl ¼ i; j; kÞ
ai ¼ xjyk � xkyj
bi ¼ yj � yk
� ði; j and k change counterclockwise in
circular permutationÞ
ci ¼ xk � xj
and D is the area of the triangle. The horizontal
components of the strain rate at any point (x, y) inside
Fig. 8. Spatial distribution of the scalar strain rate AeA for the study area.
C. Qin et al. / Tectonophysics 359 (2002) 29–46 39
the triangle can also be obtained by the derivatives of
Eq. (5):
e11 ¼Bu
Bx¼ 1
2Dðbiui þ bjuj þ bkukÞ
e22 ¼Bv
By¼ 1
2Dðcivi þ cjvj þ ckvkÞ
e12 ¼1
2
Bu
Byþ Bv
Bx
� �¼ 1
4Dðciui þ bivi þ cjuj þ bjvj
þ ckuk þ bkvkÞ ð6Þ
For every triangle, three observations are available
from the data, which represent the left-hand side of
Eq. (6). In the case of m triangles and n nodes, the
observation equation can be written in the matrix
form:
AX ¼ B ð7Þ
B ¼ ½bj�T ¼ ½e111; e122; e112; . . . ; em12�T ;X ¼ ½xj�T
¼ ½u1; v1; . . . un; vn�T
A ¼ ½aij�
¼
b1 0 b2 0 b3 0 :
0 c1 0 c2 0 c3 :
12c1
12b1
12c2
12b2
12c3
12b3 :
: :
: :
: :
266666666666666664
3777777777777777753m�2n
Eq. (7) is the final linear system to be solved for
the determination of (ui, vi), which cannot be solved
directly as matrix A has a zero determinant. This ill-
conditioning reflects the fact that the velocity is a
relative vector, which changes depending on the
definition of a reference point. Hence, it is neces-
sary to fix some points of the finite-element grid
(triangle nodes) in order to define such a reference
frame. England and Molnar (1997b) showed that at
least two points must be chosen as fixed in order to
solve this linear system (non-singular A). In order
to study the possible existence of singularities or ill-
conditioning of the matrix A, we have employed the
Singular Value Decomposition (SVD) method
(Lanczos, 1960; Press et al., 1992) for the solution
of Eq. (7):
A ¼ UWVT ð8Þ
where U and V are orthogonal matrices and W
contains the singular values of A. The horizontal
velocities can be estimated by:
X ¼ VW�1UTB ð9Þ
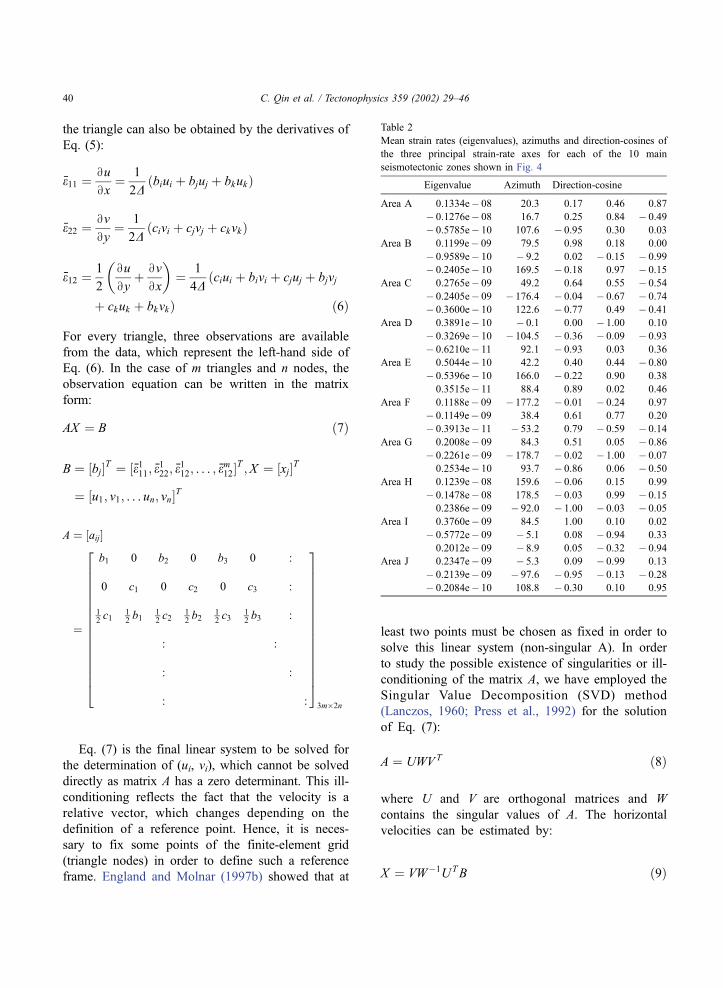
Table 2
Mean strain rates (eigenvalues), azimuths and direction-cosines of
the three principal strain-rate axes for each of the 10 main
seismotectonic zones shown in Fig. 4
Eigenvalue Azimuth Direction-cosine
Area A 0.1334e� 08 20.3 0.17 0.46 0.87
� 0.1276e� 08 16.7 0.25 0.84 � 0.49
� 0.5785e� 10 107.6 � 0.95 0.30 0.03
Area B 0.1199e� 09 79.5 0.98 0.18 0.00
� 0.9589e� 10 � 9.2 0.02 � 0.15 � 0.99
� 0.2405e� 10 169.5 � 0.18 0.97 � 0.15
Area C 0.2765e� 09 49.2 0.64 0.55 � 0.54
� 0.2405e� 09 � 176.4 � 0.04 � 0.67 � 0.74
� 0.3600e� 10 122.6 � 0.77 0.49 � 0.41
Area D 0.3891e� 10 � 0.1 0.00 � 1.00 0.10
� 0.3269e� 10 � 104.5 � 0.36 � 0.09 � 0.93
� 0.6210e� 11 92.1 � 0.93 0.03 0.36
Area E 0.5044e� 10 42.2 0.40 0.44 � 0.80
� 0.5396e� 10 166.0 � 0.22 0.90 0.38
0.3515e� 11 88.4 0.89 0.02 0.46
Area F 0.1188e� 09 � 177.2 � 0.01 � 0.24 0.97
� 0.1149e� 09 38.4 0.61 0.77 0.20
� 0.3913e� 11 � 53.2 0.79 � 0.59 � 0.14
Area G 0.2008e� 09 84.3 0.51 0.05 � 0.86
� 0.2261e� 09 � 178.7 � 0.02 � 1.00 � 0.07
0.2534e� 10 93.7 � 0.86 0.06 � 0.50
Area H 0.1239e� 08 159.6 � 0.06 0.15 0.99
� 0.1478e� 08 178.5 � 0.03 0.99 � 0.15
0.2386e� 09 � 92.0 � 1.00 � 0.03 � 0.05
Area I 0.3760e� 09 84.5 1.00 0.10 0.02
� 0.5772e� 09 � 5.1 0.08 � 0.94 0.33
0.2012e� 09 � 8.9 0.05 � 0.32 � 0.94
Area J 0.2347e� 09 � 5.3 0.09 � 0.99 0.13
� 0.2139e� 09 � 97.6 � 0.95 � 0.13 � 0.28
� 0.2084e� 10 108.8 � 0.30 0.10 0.95
C. Qin et al. / Tectonophysics 359 (2002) 29–4640
In order to estimate the error ellipses of the velocity
vectors (u, v) it is necessary to compute the
covariance matrix of the solution, Cx. which can
be obtained by:
Cx ¼ VW�2VTr2b ð10Þ
where rb the fitting error, estimated by the misfit of
Eq. (7) as rb=[S(aijXj� bj)2]1/2, which quantitatively
describes how well the obtained velocity field
describes the estimated (through Eq. (2)) strain-rate
data.
It is well known that the local vorticity (rotation
rate) cannot by directly obtained from the moment
tensor summation, as eij (derived from Mij) contains
only the symmetrical part of the velocity gradient
tensor (e.g. Jackson and McKenzie, 1988). How-
ever, following the main idea of Haines (1982),
we can indirectly obtain the vorticity from the
interpolated velocity field, V, using the following
equation:
j� VAz ¼1
2
Bv
Bx� Bu
By
� �
¼ 1
4Dðbivi � ciui þ bjvj � cjuj
þ bkvk � ckukÞ ð11Þ
where v and u are the velocities obtained from Eq.
(7).
4. Calculation of velocity model
In order to proceed with the estimation of the
velocity model, the reference frame has to be chosen.
Since the northern part of the Eurasian plate is tradi-
tionally considered as ‘‘stable’’, exhibiting little seis-
micity (Jackson and McKenzie, 1984, 1988; Holt et
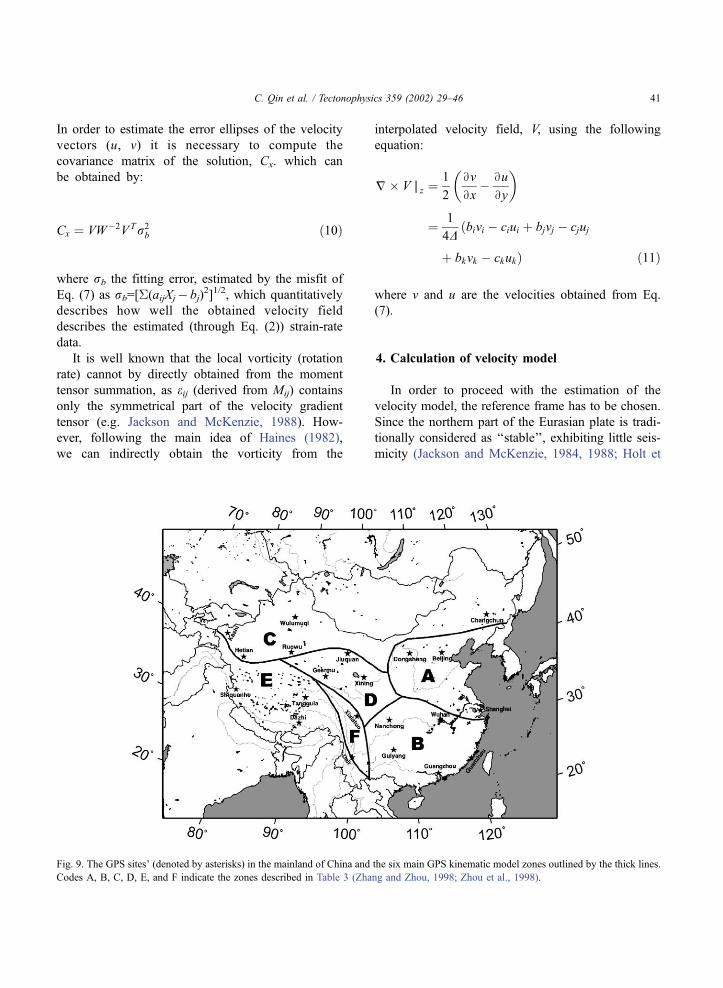
Fig. 9. The GPS sites’ (denoted by asterisks) in the mainland of China and the six main GPS kinematic model zones outlined by the thick lines.
Codes A, B, C, D, E, and F indicate the zones described in Table 3 (Zhang and Zhou, 1998; Zhou et al., 1998).
C. Qin et al. / Tectonophysics 359 (2002) 29–46 41

al., 1995; Peltzer and Saucier, 1996; England and
Molnar, 1997b; Zhang and Zhou, 1998) the fixed
points were chosen to lie in this area, hence the velocity
field computed here is considered as relative to stable
Eurasia. We should point out that triangles/sources for
which no seismicity data were available were consid-
ered as zero-strain areas, which have no contribution to
the calculations except for acting only as a frame that
connects nearby sources and ‘‘transfers’’ the velocity
field across its borders, without changing it. The same
approach was adopted for the few cases when no fault
plane solutions were available, as these corresponded
to very-low seismicity triangles/sources, which could
also be considered as zero-strain areas.
Fig. 10. The GPS velocity field, as it was obtained on the same nodes which are used for the seismic velocity field.
Table 3
Euler vectors of the kinematic model with respect to the Changchun station in northeast China (Zhang and Zhou, 1998; Zhou et al., 1998)
Region Latitude Longitude � 0.001 (W) xx xy xz
year� 1
(rad� 10� 9 year� 1)
A 50j32V36W 107j40V59W 1.441 � 1.266 3.971 5.604
B � 2j35V59W � 63j55V49W 1.197 2.547 � 5.206 � 0.261
C � 14j23V14W � 80j37V57W 1.470 1.123 � 6.807 � 1.780
D 30j48V34W 60j54V51W 0.915 1.856 � 3.337 2.262
E 65j17V01W 44j35V24W 1.626 2.361 2.327 7.154
F 20j40V45W � 80j39V11W 5.764 3.799 � 25.890 � 9.811
The coordinate system used corresponds to the East(x) –North( y) –Up(z) system.
C. Qin et al. / Tectonophysics 359 (2002) 29–4642

The finally obtained horizontal velocity field rela-
tive to the Eurasian plate is plotted in Fig. 5, where the
two fixed reference points are also shown. The posi-
tion of these fixed points on stable Eurasia was chosen
to be in the vicinity of the Changchun GPS station, in
order to facilitate the comparison of the obtained
results with the GPS data later presented. In order to
verify the efficiency and stability of the inversion, we
have compared the model strain rate (Fig. 6), which
was obtained from the right-hand side of relation (6)
using the finally determined velocity, with the
observed strain rate (left-hand side of Eq. (6)) deter-
mined from Eq. (2) (Fig. 7). In general, the comparison
shows that the modeled strain rate is in very good
agreement with the estimated strain rate data. It should
be noted that in order to avoid numerical instabilities
double precision accuracy was adopted in all calcu-
lations. The spatial distribution of the estimated scalar
strain rate was calculated from the scalar seismic
moment rate (Eq. (4)) and is also presented in Fig. 8.
Furthermore, in order to exhibit the average character-
istics of the stress field, the principal strain rates and
their azimuths for the 10 main seismotectonic zones
(Fig. 4) were also calculated and are given in Table 2.
In order to evaluate the reliability of the determined
horizontal velocity field, we have compared the
obtained results with existing GPS data. For this
comparison, the most recent GPS kinematic model
for the area of mainland of China was used, which
was based on the observations made at 21 GPS stations
throughout the main territory of China in the time
period between 1994 and 1996 (Zhang and Zhou,
1998; Zhou et al., 1998). The location of the GPS
observation sites as well as the regions of the GPS
model are presented in Fig. 9, whereas the main model
parameters are given in Table 3. On the basis of this
GPS model, we have calculated the ‘‘expected’’ GPS
velocities on every node of our zonation grid in the
mainland of China and the final results are presented in
Fig. 10. Finally, the rotational component of the veloc-
ity field was also estimated and is given in Fig. 11.
5. Discussion
The general motion pattern obtained with respect
to the Eurasian plate complies with previous results
(Holt et al., 1995; Westaway, 1995; Molnar and
Fig. 11. Rotation rates calculated for the study area using relation (11). All value are reduced to degrees/million-year. Positive values correspond
to counterclockwise rotations, whereas negative values to clockwise.
C. Qin et al. / Tectonophysics 359 (2002) 29–46 43

Gipson, 1996; Peltzer and Saucier, 1996; Larson et al.,
1999), with the most recent GPS model (Fig. 10) of
Zhang and Zhou (1998) and Zhou et al. (1998) and
with the results presented by field observations of the
geologic survey of China (velocity arrows in China
mainland shown in Fig. 1).
The results obtained with Eurasia fixed (Fig. 5)
suggest that about the 50 mm/year of the conver-
gence is expressed seismically as shortening across
the Himalaya, which is in a very good agreement
with the results of previous works (Molnar and Deng,
1984; Armijo et al., 1986; Molnar and Lyon-Caen,
1989). Global plate motion models (Demets et al.,
1990, 1994), which predict that approximately 50
mm/year of northward directed convergence is taken
up between India and Eurasia, in agreement with
Westaway (1995) who suggests that the collision
zone between India and Eurasian plate (f 2500
km) has a convergence rate of 50 mm/year. It has
been suggested that the thickening of the plateau and
the eastward lateral-transport of material will accom-
modate India’s penetration (Molnar and Gipson,
1996).
In southeastern boundary of Qiangzhang plateau,
the velocity field rotates clockwise at a velocity of
25–30 mm/year, which is compatible with Westa-
way’s (1995) estimate near the Xianshuihe region.
The velocity ‘‘flow’’ follows the Xianshuihe fault, the
Jinshajiang suture and the Red River and is then split
into two branches: one maintains a clockwise rotating
pattern in the southeast part of Tibet to compensate
the Indian penetration (Holt et al., 1991) and the other
has an counterclockwise rotation in the southeastern
part of China. Westaway (1995) suggests that flow of
lower crust from India to Tibet is causing its crustal
thickening, and flow from Tibet to Yunnan is carrying
the upper crust eastward, causing the extension of
Tibet and the associated strike–slip faulting. This
pattern is in a very good agreement with the results
obtained in the present study. Finally, in the region of
western border of China, the velocity is more or less
constant, with India’s convergence ranging from about
30 up to 50 mm/year.
If we divide the western China (longitude < 110j)into threemain parts, namely thewestern (Long. < 80j),middle (80j <Long. < 100j) and eastern (Long.>100j)part, we can see that the western part moves domi-
nantly northward from Kashi towards the western Tien
Shan region. In the middle part, the motion gradually
shows a smaller northward component while the east-
ward component increases from south to north. The
motion pattern near the northern boundary of China
shows the clockwise rotation component (Fig. 5). The
eastern part, however, has the most complicated
motion pattern. The sudden reduction of the eastward
motion to its eastern margin supports the treatments of
the continental lithosphere as a thin viscous sheet
whose strength is governed primarily by power law
creep in the upper mantle (Molnar and Gipson, 1996;
England and Molnar, 1997a). The Longmenshan thrust
fault (Fig. 1) in eastern boundary of the Tibet plateau
plays a complicated role in the motion pattern, as it
hampers the eastward motion and forces the litho-
sphere to move in both directions parallel to the fault
(Fig. 5). The velocity reduces to about 8 mm/year in
Shanghai, east of China, which is in a reasonable
agreement with VLBI results (Molnar and Gipson,
1996) and GPS results (Zhang and Zhou, 1998; Zhou
et al., 1998; Larson et al., 1999). Generally, the present
result is compatible with Zhang and Zhou’s (1998)
results (Fig. 10). The GPS motion pattern (Zhang and
Zhou, 1998; Zhou et al., 1998) near the Xianshuihe
and the Red River region is quite similar with the
results obtained in the present study, although impor-
tant differences exist in the detailed motion pattern
between the two studies. The GPS results seem to
overestimate the velocity in the eastern part of China
(e.g. Shanghai f 18 mm/year) and underestimate the
convergence of the India plate (about 36 mm/year),
probably due to the sparse station coverage and the
short observation time (2 or 3 years).
Comparing the motion pattern (Fig. 5) with the
scalar strain rate (Fig. 8), it is evident that the large
gradient of the velocity (i.e. the sudden change of the
motion direction) are in a good agreement with sharp
changes of the strain rate, i.e. the strong earthquakes,
as expected since strain is the velocity gradient. For
example, the 1950 Assam earthquake (M = 8.6) in the
eastern Himalaya Syntaxis, the 1931 Fuyun earth-
quake (M = 7.7) around northern Tien Shan, and sev-
eral strong events along the Qilianshan fault (1920
Haiyuan earthquake, M = 8.4; 1927 Gulang earth-
quake, M = 7.7; 1932 Changma earthquake M = 7.5)
dominate the strain rate released in their region.
The rotation results show that most of the western
part of China is dominated by clockwise rotation (Figs.
C. Qin et al. / Tectonophysics 359 (2002) 29–4644

5 and 11). Recent GPS results for the Xianshuihe
region also showed that it’s clockwise at about 10
mm/year (Chen et al., 2000), whereas Xu and Deng
(1996), using geological data, suggest that the Xian-
shuihe and Kunlun faults have a clockwise rotation rate
of 9–12j/ma during the Holocene, which is compatible
with the present result. The southeastern part of Ordos
block is rotating counterclockwise at < 5j/ma, which is
in a good agreement with the paleomagnetic results of
1.3–6.3j (Xu et al., 1994). The region along the
western border of China, however, is mostly controlled
by the counterclockwise rotation (Fig. 11), which was
also confirmed by England and Molnar (1997b). The
rotation pattern near the southeast Tibet plateau along
the Red River is rather complicated, where its western
part shows a clockwise pattern, which forms a ‘‘vor-
tex’’ and its eastern part moves counterclockwise. The
combination of these motion patterns allows the partial
accommodation of the material ‘‘pushed-in’’ by the
India plate.
Acknowledgements
We would like to express our sincere appreciation
to B.C. Papazachos for his useful suggestions and
kind help and to G.F. Karakaisis for checking the
draft. We would also like to thank R. Westaway and
R. Fu for their comments and suggestions, which
significantly helped to improve the quality of the
paper. Our gratitude is also extended to Jin Xuesheng
of Seismological Bureau of Hebei Province, SSB,
China for providing some of the data. This work is
partially supported by the project of the Gen. Sectr.
Res. and Techn. of Greece under the contract EPAN-
M.4.3_2013555. Some of the figures were made using
the GMT software (Wessel and Smith, 1995).
References
Abe, K., 1981. Magnitudes of large earthquakes from 1904 to 1980.
Phys. Earth Planet. Inter. 27, 72–93.
Aki, K., Richards, P.G., 1980. Quantitative Seismology Theory and
Methods. Freeman, New York.
Ambraseys, N.N., Jackson, J.A., 1997. Seismicity and strain in the
gulf of Corinth (Greece) since 1694. J. Earth Eng. 1, 433–474.
Armijo, R., Tapponnier, P., Mercier, J.L., Tonglin, H., 1986. Qua-
ternary extension in southern Tibet. J. Geophys. Res. 91,
13803–13872.
Avouac, J.P., Tapponier, P., Bai, M., You, H., Wang, G., 1993.
Active thrusting and folding along the northern Tien Shan and
late cenozoic rotation of Tarim relative to Dzungaria and Ka-
zakhstan. J. Geophys. Res. 98, 6755–6804.
Chen, W.-P., Molnar, P., 1977. Seismic moments of major earth-
quakes and the average rate of slip in central Asia. J. Geophys.
Res. 82, 2945–2969.
Chen, Z., Burchfiel, B.C., Liu, Y., King, R.W., Royden, L.H., Tang,
W., Wang, E., Zhao, J., Zhang, X., 2000. Global Positioning
System measurements from eastern Tibet and their implications
for India/Eurasia intercontinental deformation. J. Geophys. Res.
105, 16215–16227.
Demets, C., Gordon, R.G., Argus, D.F., Stein, S., 1990. Current
plate motions. Geophys. J. Int. 101, 425–478.
Demets, C., Gordon, R.G., Argus, D.F., Stein, S., 1994. Effect of
recent revisions to the geomagnetic reversal time scale on
estimates of current plate motions. Geophys. Res. Lett. 21,
2191–2194.
Deng, Q., Xu, X., Yu, G., 1994. Characteristics of regionalization of
active faults in China and their genesis. Act. Fault Res. China
1–14 (in Chinese).
Ekstrom, G., Dziewonski, A., 1988. A very broad band analysis of
the Michoacan, Mexico, earthquake of September 19, 1985.
Geophys. Res. Lett. 13, 605–608.
England, P., Houseman, G., 1988. The mechanics of the Tibetan
plateau. Philos. Trans. R. Soc. London, Ser. A 326, 301–320.
England, P., Molnar, P., 1997a. Active deformation of Asia: from
kinematics to dynamics. Science 278, 647–650.
England, P., Molnar, P., 1997b. The field of crustal velocity in Asia
calculated from Quaternary rates of slip on faults. Geophys. J.
Int. 130, 551–582.
Gao, M., 1996. A study on recent geodynamics at the southeastern
margin of the Qinghai–Xizhang (Tibet) plateau. Seismol. Geol.
18, 129–142 (in Chinese).
Haines, A.J., 1982. Calculating velocity fields across plate bounda-
ries from observed shear rates. Geophys. J. R. Astron. Soc. 68,
203–209.
Haines, A.J., Holt, W.E., 1993. A procedure for obtaining the com-
plete horizontal motions within zones of distributed deformation
from the inversion of strain rate data. J. Geophys. Res. 98,
12057–12082.
Holt, W.E., Ni, J.F., Wallace, T.C., Haines, A.J., 1991. The active
tectonics of the Eastern Himalayan Syntaxis and surrounding
regions. J. Geophys. Res. 96, 14595–14632.
Holt, W.E., Li, M., Haines, A.J., 1995. Earthquake strain rates and
instantaneous relative motions within central and eastern Asia.
Geophys. J. Int. 122, 569–593.
Houseman, G., England, P., 1993. Crustal thicking versus lateral
expulsion in the Indian–Asian continent collision. J. Geophys.
Res. 98, 12233–12249.
Jackson, J., McKenzie, D., 1984. Active tectonics of the Alpine
Himalayan Belt between western Turkey and Pakistan. Geo-
phys. J. R. Astron. Soc. 77, 185–264.
Jackson, J., McKenzie, D., 1988. The relationship between plate
motions and seismic moment tensors, and the rates of active
deformation in the Mediterranean and Middle East. Geophys. J.
93, 45–73.
C. Qin et al. / Tectonophysics 359 (2002) 29–46 45
Kanamori, H., 1977. The energy release in great earthquakes. J.
Geophys. Res. 82, 2981–2987.
Kearey, P., Vine, F.J., 1990. Global Tectonics. Blackwell, Oxford.
Kostrov, V.V., 1974. Seismic moment and energy of earthquakes
and seismic flow of rock. Izv. Acad. Sci. USSR Phys. Solid
Earth 1, 23–44.
Lanczos, C., 1960. Linear Differential Operators. Van Nostrand,
New York, p. 546.
Larson, K.M., Burgmann, R., Bilham, R., Freymueller, J.T., 1999.
Kinematics of the India–Eurasia collision zone from GPS mea-
surements. J. Geophys. Res. 104, 1077–1093.
Ma, X., 1987. An Introduction to the Lithospheric Dynamics in
China, Introduction of Dynamic Map of China. Geological
Press, Beijing, in Chinese.
Madariaga, R., 1983. Earthquake source theory: a review. Proceed-
ings of the International School of Physics, Course LXXXV,
pp. 1–44.
Milne, W.G., Davenport, A.G., 1969. Determination of earthquakes
risk in Canada. Bull. Seismol. Soc. Am. 59, 729–754.
Mogi, K., 1967. Regional variations in magnitude– frequency rela-
tion of earthquake. Bull. Earthquake Res. Inst. 45, 313–325.
Molnar, P., 1979. Earthquake recurrence intervals and plate tecto-
nics. Bull. Seismol. Soc. Am. 69, 115–133.
Molnar, P., 1983. Average regional strain due to slip on numerous
faults of different orientations. J. Geophys. Res. 88, 6430–6432.
Molnar, P., Deng, Q., 1984. Faulting associated with large earth-
quakes and the average rate of deformation in Central and East-
ern Asia. J. Geophys. Res. 89, 6203–6227.
Molnar, P., Gipson, J.M., 1996. A bound on the rheology of con-
tinental lithosphere using very long baseline interferometry: the
velocity of south China with respect to Eurasia. J. Geophys.
Res. 101, 545–553.
Molnar, P., Lyon-Caen, H., 1989. Fault plane solutions of earth-
quakes and active tectonics of the Tibetan plateau and its mar-
gins. Geophys. J. Int. 99, 123–153.
Pacheco, J.F., Sykes, L.R., 1992. Seismic moment catalog of large
shallow earthquakes, 1900 to 1989. Bull. Seismol. Soc. Am. 82,
1306–1349.
Pacheco, J.F., Scholz, C.H., Sykes, L.R., 1992. Changes in fre-
quency–size relationship from small to large earthquakes. Na-
ture 355, 71–73.
Papazachos, C.B., Kiratzi, A.A., 1992. A formulation for reliable
estimation of active crustal deformation and its application to
central Greece. Geophys. J. Int. 111, 424–432.
Peltzer, G., 1988. Centrifuged experiments of continental scale tec-
tonics in Asia. Geological Kinematics and Dynamics. Bull.
Geol. Inst. Univ. Uppsala, vol. 14, pp. 115–128.
Peltzer, G., Saucier, F., 1996. Present-day kinematics of Asia derived
from geologic fault rates. J. Geophy. Res. 101, 27943–27956.
Press, W.H., Teukolsky, S.A., Vetterling, W.T., Flannery, B.P.,
1992. Numerical Recipes in Fortran: The Art of Scientific Com-
puting. Cambridge Univ. Press, New York, 963 pp.
Qin, C.Y., Papadimitriou, E.E., Papazachos, B.C., Karakaisis, G.F.,
1999a. Spatial distribution of time independent seismicity of
China. Pure Appl. Geophys. 154, 101–119.
Qin, C.Y., Papadimitriou, E.E., Papazachos, B.C., Karakaisis, G.F.,
1999b. On the validity of the regional time and magnitude pre-
dictable model in China. Ann. Geofis. 42 (5).
Qin, C.Y., Papadimitriou, E.E., Papazachos, B.C., Karakaisis, G.F.,
2001. Time-dependent seismicity and long-term prediction in
China. J. Asian Earth Sci. 19, 97–128.
Research Group of SSB, 1988. Active Fault System Around Ordos
Massif Seismological Press, Beijing, China, in Chinese.
Rundle, J.B., 1989. Derivation of the complete Gutenberg–Richter
magnitude–frequency relation using the principle of scale in-
variance. J. Geophys. Res. 94, 12337–12342.
Savage, J.C., Simpson, R.W., 1997. Surface strain accumulation
and the seismic moment tensor. Bull. Seismol. Soc. Am. 87,
1345–1353.
Scholz, C.H., 1968. The frequency magnitude relation of micro-
fracturing in rock and its relation to earthquakes. Bull. Seismol.
Soc. Am. 58, 399–415.
Turcotte, D.L., 1989. A fractal approach to probabilistic seismic
hazard assessment. Tectonophysics 167, 171–177.
Turcotte, D.L., 1992. Fractals and Chaos in Geology and Geophy-
sics. Cambridge Univ. Press, New York, pp. 35–50.
Ward, S.N., 1998a. On the consistency of earthquake moment rates,
geological fault data, and space geodetic strain: the United
States. Geophys. J. Int. 134, 172–186.
Ward, S.N., 1998b. On the consistency of earthquake moment rates
and space geodetic strain rates: Europe. Geophys. J. Int. 135,
1011–1018.
Wen, L.X., Anderson, D.L., 1997. Present-day plate motion con-
straint on mantle rheology and convection. J. Geophys. Res.
102, 24639–24653.
Wessel, P., Smith, W.H.F., 1995. The Generic Mapping Tools
(GMT) software.
Westaway, R., 1991. Discussion of and correction to: deformation
of the NE basin and Range Province: the response of the litho-
sphere to the Yellowston plume. Geophys. J. Int. 104, 647–659.
Westaway, R., 1995. Crustal volume balance during the India–
Eurasia collision and altitude of the Tibetan plateau: a working
hypothesis. J. Geophys. Res. 100, 15173–15194.
Wyss, M., 1973. Towards a physical understanding of the earth-
quake frequency distribution. Geophys. J. R. Astron. Soc. 31,
341–359.
Xu, X., Deng, Q., 1996. Nonlinear characteristics of paleoseismi-
city in China. J. Geophys. Res. 101, 6209–6231.
Xu, X., Chen, G., Xu, M., Sun, Y., Han, Z., 1994. Rotation model
and dynamics of blocks in the North China and its adjacent
areas. Earth Sci. J. China Univ. Geosci. 19, 129–138 (in
Chinese with English abstract).
Zhang, Y.G., Zhou, S.Y., 1998. Study on current kinematic model of
intraplate rigid blocks. Crustal Deform. Earthquake 18, 8–13
(in Chinese).
Zhou, S.Y., Zhang, Y.G., Ding, G.Y., Wu, Y., Qin, X.J., Shi, S.Y.,
Wang, Q., Yiu, X.Z., Qiao, X.J., Shuai, P., Deng, G.J., 1998.
The plate motion model of Chinese mainland based on the GPS
data. Acta Seismol. Sin. 20, 347–355 (in Chinese).
C. Qin et al. / Tectonophysics 359 (2002) 29–4646
Related Documents