VEHICLE SAFETY RATINGS ESTIMATED FROM COMBINED AUSTRALIAN AND NEW ZEALAND REAL CRASH DATA PILOT STUDY: STAGE 5 by Stuart Newstead Amanda Delaney and Linda Watson Report No. 203 May 2003 ACCIDENT RESEARCH CENTRE

Welcome message from author
This document is posted to help you gain knowledge. Please leave a comment to let me know what you think about it! Share it to your friends and learn new things together.
Transcript
VEHICLE SAFETY RATINGS ESTIMATED FROM COMBINED AUSTRALIAN AND NEW ZEALAND
REAL CRASH DATA PILOT STUDY: STAGE 5
by
Stuart Newstead Amanda Delaney
and Linda Watson
Report No. 203 May 2003
ACCIDENT RESEARCH CENTRE
ii MONASH UNIVERSITY ACCIDENT RESEARCH CENTRE
Project Sponsored By
Australian Crashworthiness Ratings Project Sponsored By
VEHICLE SAFETY RATINGS ESTIMATED FROM AUSTRALIAN AND NZ REAL CRASH DATA iii
MONASH UNIVERSITY ACCIDENT RESEARCH CENTRE REPORT DOCUMENTATION PAGE
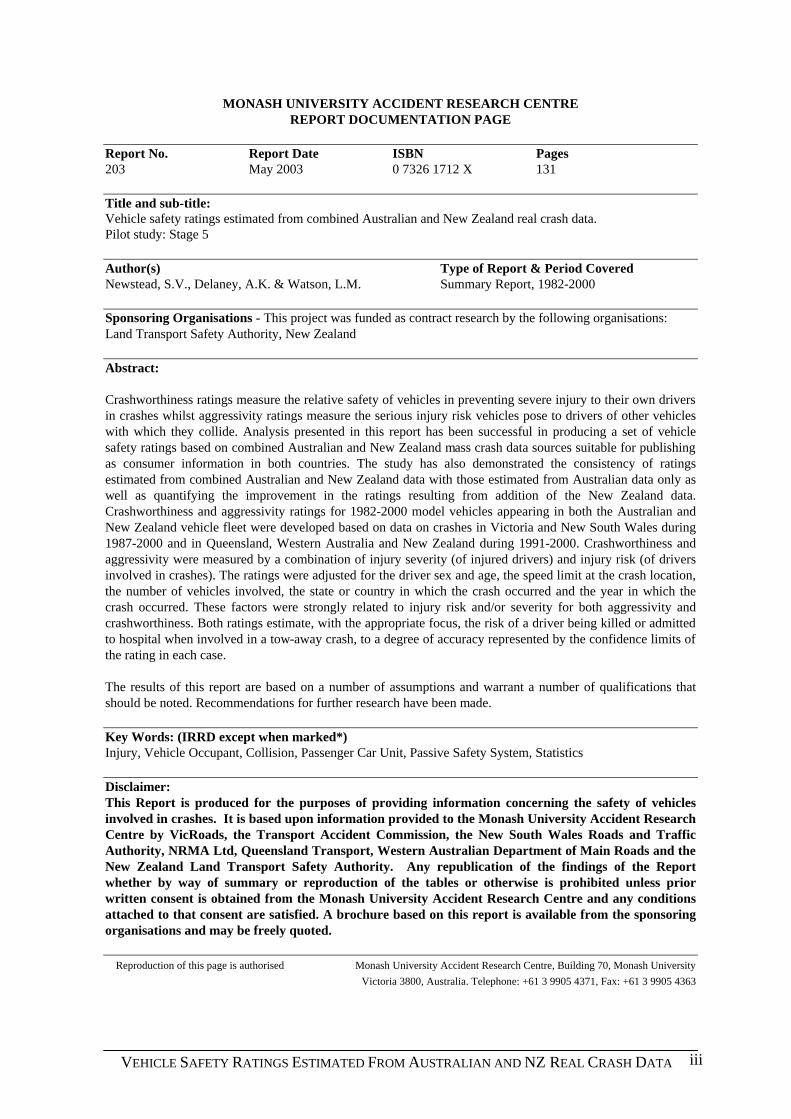
Report No. Report Date ISBN Pages 203 May 2003 0 7326 1712 X 131 Title and sub-title: Vehicle safety ratings estimated from combined Australian and New Zealand real crash data. Pilot study: Stage 5 Author(s) Type of Report & Period Covered Newstead, S.V., Delaney, A.K. & Watson, L.M. Summary Report, 1982-2000 Sponsoring Organisations - This project was funded as contract research by the following organisations: Land Transport Safety Authority, New Zealand Abstract: Crashworthiness ratings measure the relative safety of vehicles in preventing severe injury to their own drivers in crashes whilst aggressivity ratings measure the serious injury risk vehicles pose to drivers of other vehicles with which they collide. Analysis presented in this report has been successful in producing a set of vehicle safety ratings based on combined Australian and New Zealand mass crash data sources suitable for publishing as consumer information in both countries. The study has also demonstrated the consistency of ratings estimated from combined Australian and New Zealand data with those estimated from Australian data only as well as quantifying the improvement in the ratings resulting from addition of the New Zealand data. Crashworthiness and aggressivity ratings for 1982-2000 model vehicles appearing in both the Australian and New Zealand vehicle fleet were developed based on data on crashes in Victoria and New South Wales during 1987-2000 and in Queensland, Western Australia and New Zealand during 1991-2000. Crashworthiness and aggressivity were measured by a combination of injury severity (of injured drivers) and injury risk (of drivers involved in crashes). The ratings were adjusted for the driver sex and age, the speed limit at the crash location, the number of vehicles involved, the state or country in which the crash occurred and the year in which the crash occurred. These factors were strongly related to injury risk and/or severity for both aggressivity and crashworthiness. Both ratings estimate, with the appropriate focus, the risk of a driver being killed or admitted to hospital when involved in a tow-away crash, to a degree of accuracy represented by the confidence limits of the rating in each case. The results of this report are based on a number of assumptions and warrant a number of qualifications that should be noted. Recommendations for further research have been made. Key Words: (IRRD except when marked*) Injury, Vehicle Occupant, Collision, Passenger Car Unit, Passive Safety System, Statistics Disclaimer: This Report is produced for the purposes of providing information concerning the safety of vehicles involved in crashes. It is based upon information provided to the Monash University Accident Research Centre by VicRoads, the Transport Accident Commission, the New South Wales Roads and Traffic Authority, NRMA Ltd, Queensland Transport, Western Australian Department of Main Roads and the New Zealand Land Transport Safety Authority. Any republication of the findings of the Report whether by way of summary or reproduction of the tables or otherwise is prohibited unless prior written consent is obtained from the Monash University Accident Research Centre and any conditions attached to that consent are satisfied. A brochure based on this report is available from the sponsoring organisations and may be freely quoted.
Reproduction of this page is authorised Monash University Accident Research Centre, Building 70, Monash University
Victoria 3800, Australia. Telephone: +61 3 9905 4371, Fax: +61 3 9905 4363
iv MONASH UNIVERSITY ACCIDENT RESEARCH CENTRE
EXECUTIVE SUMMARY Stages 1 to 4 of the New Zealand vehicle safety ratings pilot study, completed previously, established the availability and suitability of New Zealand crash and registration data sources for estimating vehicle safety ratings using combined Australian and New Zealand crash data. They also confirmed the sufficient compatibility of the Australian and New Zealand vehicle fleets ensuring ratings based on the combined data will be of use to the New Zealand vehicle consumer population. Analysis presented in this report has been successful in realising the final stage of the pilot study in producing a set of vehicle safety ratings based on combined Australian and New Zealand mass crash data sources suitable for publishing as consumer information in both countries. The study has also demonstrated the consistency of ratings estimated from combined Australian and New Zealand data with those estimated from Australian data only as well as quantifying the improvement in the ratings resulting from the addition of New Zealand data. The safety ratings calculated for 1982 to 2000 year of manufacture vehicles in the Australian and New Zealand passenger fleets cover both crashworthiness and aggressivity. Crashworthiness ratings measure the relative safety of vehicles in preventing severe injuries to their own drivers in crashes whilst aggressivity ratings measure the serious injury risk vehicles pose to drivers of other vehicles with which they collide. Both crashworthiness and aggressivity were measured as a product of injury severity (of injured drivers) and injury risk (of drivers involved in crashes). Crashworthiness injury severity was based on 217,502 drivers injured in crashes in Victoria during 1987-2000, in New South Wales during 1987-1998 and in Queensland, Western Australia and New Zealand during 1991-2000. Crashworthiness injury risk was based on 1,216,862 drivers involved in crashes in New South Wales during 1987-2000 and Western Australia and Queensland during 1991-2000 where a vehicle was towed away. Aggressivity injury risk was based on 585,397 drivers involved in crashes between two vehicles in New South Wales and Queensland and Western Australia where a vehicle was towed away. Aggressivity injury severity was based on 108,355 drivers injured in two-car crashes in Victoria during 1987-2000, in New South Wales during 1987-1998 and in Queensland, Western Australia and New Zealand during 1991-2000. The crashworthiness and aggressivity ratings were adjusted for the driver sex and age, the speed limit at the crash location, the year in which the crash occurred and the state or country in which the crash occurred. Crashworthiness ratings were also adjusted for the number of vehicles involved in the crash. These factors were found to be strongly associated with injury risk and injury severity. Adjustments were made with the aim of measuring the effects of vehicle factors alone, uncontaminated by other factors available in the data that affected crash severity and injury susceptibility. Addition of the New Zealand crash data to that used to calculate the Australian ratings has enabled the crashworthiness ratings to be obtained for 223 different vehicle models manufactured between 1982 and 2000. This is an increase of 10 vehicle models over the number rated using Australian data alone. The rating scores estimate the risk of a driver being killed or admitted to hospital when involved in a tow-away crash, to a degree of accuracy represented by the confidence limits of the rating in each case. The estimates and their associated confidence limits are sufficiently sensitive that they are able to identify 103 models of passenger cars, four-wheel drive vehicles, passenger vans and light commercial
VEHICLE SAFETY RATINGS ESTIMATED FROM AUSTRALIAN AND NZ REAL CRASH DATA v
vehicles that have superior or inferior crashworthiness characteristics compared with the average vehicle. This compares to only 95 vehicle models based on Australian data only. Further more, addition of the New Zealand crash data has reduced the average confidence limit width of the crashworthiness injury severity estimates by 8 percent and the average coefficient of variation (the ratio of ratings estimate the the width of the 95% confidence limit) by 7 percent. Addition of the New Zealand crash data also resulted in estimates of vehicle aggressivity ratings towards drivers of other passenger vehicles for individual makes and models with both broader coverage and higher accuracy than obtained using Australian data alone. The aggressivity ratings measure the risk of serious injury a vehicle poses to drivers of other cars with which it impacts in crashes of tow-away or greater severity. Aggressivity ratings calculated from combined Australian and New Zealand data covered 164 models of passenger vehicles (passenger cars, four-wheel drive vehicles, passenger vans and light commercial vehicles) manufactured between the years 1982-2000. This is an increase of 12 vehicle models over the ratings estimated using Australian data only. The estimates and their associated confidence limits are sufficiently sensitive that they are able to identify 58 models of passenger cars, four-wheel drive vehicles, passenger vans and light commercial vehicles that have superior or inferior aggressivity characteristics compared with the average vehicle. This represents an increase of 10 vehicle models over the ratings estimated using only Australian data. Addition of the New Zealand data to compute vehicle aggressivity ratings resulted in a average decrease of 7 percent and 10 percent in the aggressivity injury severity confidence limit widths and coefficient of variation respectively. Estimated vehicle aggressivity towards drivers of other vehicles was found to have a proportional relationship with vehicle mass. It was also found to have little or no relationship with ratings of vehicle crashworthiness, demonstrating the independence of the two complementary measures. Recommendations for further vehicle safety research using the assembled New Zealand crash data were made.
vi MONASH UNIVERSITY ACCIDENT RESEARCH CENTRE
ACKNOWLEDGMENTS A project as large and complex as this could not have been carried out without the help and support of a number of people. Associated with supply and preparation of the Australian crash data and participation in the Australian vehicle safety ratings project, the authors particularly wish to acknowledge: • Mr David Attwood of the Transport Accident Commission (TAC) for the provision of
TAC claims data • Mr Geoff Elston of VicRoads Business Services Division for the provision of data from
Victorian Police crash reports • Mr Geoff Murray and Mr Wesley Soet of the Department of Main Roads Western
Australia for the provision of data from Western Australia Police crash reports • Mr Geoff Meers, Mr Wayne Dale and Mr Scott Boyle of Queensland Transport for the
provision of data from Queensland Police crash reports and the Queensland vehicle registration system
• Mr Tony Kursius of Queensland Transport for assistance with facilitating the provision
of data from the Queensland vehicle registration system • Dr Graham Brisbane, Mr David Harkness and Ms Samantha Yee of the New South
Wales Roads and Traffic Authority (RTA) for their support of the project and the release of data from NSW Police crash reports
• Mr Jack Haley, Mr Owen Johnstone and Dr Tasha Prabhakar of NRMA for their support
for the project and for providing procedures to determine the models of vehicles crashing in NSW, Victoria and Queensland.
• Ms Maria Pappas of NRMA who developed and applied the procedures to determine the
models of vehicles recorded on NSW and Victoria Police crash reports • Mr Michael Adams and Mr Robert Ramsay of the NSW RTA who prepared and
provided data files from NSW Police crash reports and gave helpful advice on limitations in the NSW crash data.
• Mr John Goldsworthy of the Australian Transport Safety Bureau for his support of the
project as well as valuable assistance in providing detail comments on the project report. • Mr Mike Upton of the RACWA for his support for the project and assistance with
facilitating the supply of Western Australian crash data • Dr Gray Scott and Mr Ross McArthur of VicRoads for their support of the project • Mr Michael Case and Mr Julian Del Beato of the RACV for their support of the project
and for advice on substantive changes in designs of specific models over the years

VEHICLE SAFETY RATINGS ESTIMATED FROM AUSTRALIAN AND NZ REAL CRASH DATA vii
• Associate Professor Caroline Finch, Mr Tri Minh Le, Mr Michael Skalova and Ms Chau
My Le, all formerly of MUARC, for the development of the analysis methods in earlier years that formed the basis of the methods used in this report.
• Dr Alan Miller, formerly of the CSIRO Division of Mathematics and Statistics for
suggesting analysis methods used in this report to improve the sensitivity of the results and to determine the confidence limits of the estimates.
• Officers of the Victorian, NSW, Western Australian and Queensland Police Forces and
of the Transport Accident Commission who diligently recorded the information on crashes and injuries which formed the basis of this report.
Associated with preparation of the New Zealand crash data and participation in the New Zealand vehicle safety ratings pilot study, the authors particularly wish to acknowledge: • Dr Barbara Bibby of the LTSA for her enthusiastic support of the project and
management of the project contract.
• Mr Stuart Badger of the LTSA for supply of the New Zealand crash data and advice on its use in the project.
• Mrs Carol Hewitt of the New Zealand Land Transport Safety Authority for supply of the New Zealand vehicle registration data and advice on its use in the project.
• Mr Stuart Worden of the LTSA and Mr Tijs Robinson, a former contractor to the LTSA, for their advice on specifications and sources of information on New Zealand vehicle models.
• Mr Eugene Girardin for advice on the New Zealand used import vehicle market and the handling of these vehicles by the LTSA.
Particular acknowledgement is made of Professor Max Cameron of the Monash University Accident Research Centre for his work in pioneering the estimation of vehicle safety ratings from mass crash data in Australia and his ongoing input to and support of projects like this.
viii MONASH UNIVERSITY ACCIDENT RESEARCH CENTRE
CONTENTS Page No.
1. INTRODUCTION AND PROJECT HISTORY.................................................................................. 1
1.1 CRASHWORTHINESS RATINGS............................................................................................................... 1 1.2 AGGRESSIVITY RATINGS....................................................................................................................... 2 1.3 PRELIMINARY VEHICLE SAFETY RATINGS RESEARCH IN NEW ZEALAND.............................................. 4 1.4 AIMS OF PILOT STUDY STAGE 5............................................................................................................ 6
2. CRASH DATA........................................................................................................................................ 6
2.1 AUSTRALIAN CRASH DATA .................................................................................................................. 6 2.2 NEW ZEALAND CRASH AND REGISTRATION DATA ............................................................................... 7
2.2.1 Crash Data................................................................................................................................. 7 2.2.2 Registration Data....................................................................................................................... 8 2.2.3 Merging the Crash and Registration Data................................................................................. 9
2.3 COMBINED AUSTRALIAN AND NEW ZEALAND DATA.......................................................................... 10
3. MODELS OF VEHICLES .................................................................................................................. 11
3.1 AUSTRALIAN CRASH DATA ................................................................................................................ 11 3.2 NEW ZEALAND CRASH DATA ............................................................................................................. 13
3.2.1 New Vehicle Model Decoding and Clustering ......................................................................... 14 3.2.2 Used Imported Vehicle Model Decoding and Clustering ........................................................ 15 3.2.3 Final Decoded Data................................................................................................................. 16
4. ANALYSIS............................................................................................................................................ 16
4.1 OVERVIEW OF ANALYSIS METHODS: CRASHWORTHINESS.................................................................. 16 4.1.1 Logistic Models for Each Component...................................................................................... 18 4.1.2 Combining the Injury Risk and Injury Severity Components ................................................... 20 4.1.3 Pooled Car Models .................................................................................................................. 21 4.1.4 Market Group Analyses ........................................................................................................... 22 4.1.5 Trends in the Rating Criteria ................................................................................................... 22
TOTAL INJURED......................................................................................................................................... 23
KILLED OR SERIOUSLY INJURED ........................................................................................................ 24
INJURED........................................................................................................................................................ 24
KILLED OR SERIOUSLY INJURED ........................................................................................................ 24
INJURED........................................................................................................................................................ 24
KILLED OR SERIOUSLY INJURED ........................................................................................................ 24
4.2 OVERVIEW OF THE ANALYSIS METHODS: AGGRESSIVITY................................................................... 24 4.2.1 Logistic Models, Confidence Limits and Assessment of Aggressivity of Specific Vehicle Models and Market Groups ................................................................................................................................ 25
5. RESULTS.............................................................................................................................................. 27
5.1 VEHICLE CRASHWORTHINESS RATINGS .............................................................................................. 27 5.1.1 Injury Risk................................................................................................................................ 27 5.1.2 Injury Severity.......................................................................................................................... 28 5.1.3 Crashworthiness Ratings ......................................................................................................... 29 5.1.4 Comparisons with the All Model Average Rating.................................................................... 29 5.1.6 Comparison of Crashworthiness Ratings with and Without New Zealand Data ..................... 32
5.2 AGGRESSIVITY TOWARDS OTHER CAR DRIVERS ................................................................................ 35 5.2.1 Analysis by Market Groups...................................................................................................... 36 5.2.2 Statistically Significant Makes and Models ............................................................................. 37 5.2.3 Relationships Between Aggressivity and Crashworthiness...................................................... 39
VEHICLE SAFETY RATINGS ESTIMATED FROM AUSTRALIAN AND NZ REAL CRASH DATA ix
5.2.4 Discussion on Aggressivity Ratings ......................................................................................... 39 5.2.5 Comparison of Aggressivity Ratings with and Without New Zealand Data............................. 41
5.3 PRESENTATION OF CRASHWORTHINESS AND AGGRESSIVITY RATINGS FOR CONSUMER INFORMATION43
6. CONCLUSIONS...................................................................................................................................44
7. FURTHER RESEARCH RECOMMENDED....................................................................................45
7.1 INTEGRATION OF AUSTRALIAN AND NEW ZEALAND CRASHWORTHINESS AND AGGRESSIVITY RATINGS
SYSTEMS...................................................................................................................................................... 45 7.2 INVESTIGATION OF TECHNIQUES TO RATE VEHICLE MODELS ONLY SOLD IN NEW ZEALAND............. 46 7.3 MONITORING TRENDS IN SAFETY OF THE NEW ZEALAND VEHICLE FLEET ......................................... 46 7.4 CRASH RISK RATINGS FOR NEW ZEALAND VEHICLES......................................................................... 47
8. ASSUMPTIONS AND QUALIFICATIONS......................................................................................48
8.1 ASSUMPTIONS..................................................................................................................................... 48 8.2 QUALIFICATIONS................................................................................................................................. 48
9. REFERENCES .....................................................................................................................................49
APPENDICES
APPENDIX 1. Makes and models of cars involved in Victorian and NSW crashes during
1987-2000 and Western Australia and Queensland Crashes during 1991-2000
APPENDIX 2. Logistic regression estimates of injury risk by model and market group APPENDIX 3. Logistic regression estimates of injury severity by model and market group APPENDIX 4. Crashworthiness ratings of 1982-2000 models of cars involved in crashes
during 1987-2000 APPENDIX 5. Aggressivity injury risk aggressivity injury severity and ratings of vehicle
aggressivity (with 95% and 90% confidence limits), towards other vehicle drivers
APPENDIX 6 Presentation of crashworthiness and aggressivity ratings for consumer information

VEHICLE SAFETY RATINGS ESTIMATED FROM AUSTRALIAN AND NZ REAL CRASH DATA 1
VEHICLE SAFETY RATINGS ESTIMATED FROM COMBINED AUSTRALIAN AND NEW ZEALAND REAL CRASH DATA
PILOT STUDY: STAGE 5
1. INTRODUCTION AND PROJECT HISTORY For over a decade, the Monash University Accident Research Centre (MUARC) has been involved in a program of research examining issues relating to vehicle safety in Australia through the analysis of mass crash data. Data on which the research is based comes from reports compiled by Police in various states across Australia, augmented by data on injury compensation claims resulting from transportation crashes compiled by the Victorian Transport Accident Commission (TAC). Work in the area initially commenced as two separate projects undertaken independently by different research groups. In response to recommendations in a report by the Victorian Parliamentary Social Development Committee (SDC 1990) on its inquiry into vehicle occupant protection, MUARC commenced a project in 1990 to develop consumer advice on vehicle safety performance from mass accident data. Independently in 1990, the NSW Roads and Traffic Authority (RTA) and the NRMA set out on a joint project to develop a ‘car safety rating’ system based on Police records of crash and injury involvement. The objective was to use vehicle crash records and injury data to develop ratings for the relative safety of vehicles. The NRMA and RTA entered into discussions with the CSIRO to conduct the necessary analysis, and by early 1991 had produced a relative ranking of vehicles. In mid 1991, the NSW and Victorian groups became aware of each others activities and, following discussions, agreed to proceed jointly rather than have two competing vehicle safety rating systems: one based on Victorian data and the other on NSW data. Later, the NSW RTA and NRMA agreed that MUARC should undertake the analysis of the joint NSW and Victorian data sets. The NSW RTA and NRMA performed preliminary work on the NSW database to, as far as possible, provide a clean set of data with accurately inscribed models for each vehicle. The data were then handed over to MUARC for analysis.
1.1 Crashworthiness Ratings Initially, development of vehicle safety ratings focussed on vehicle crashworthiness. Crashworthiness ratings rate the relative safety of vehicles by examining injury outcomes to drivers in real crashes. The crashworthiness rating of a vehicle is a measure of the risk of serious injury to a driver of that vehicle when it is involved in a crash. This risk is estimated from large numbers of records of injury to drivers of that vehicle type involved in real crashes on the road. In 1994, MUARC produced vehicle crashworthiness ratings based on crash data from Victoria and New South Wales during 1987-92 (Cameron et al, 1994a,b). These ratings updated an earlier MUARC set produced by Cameron et al (1992b). Crashworthiness was measured in two components: 1. Rate of injury for drivers involved in tow-away crashes (injury risk) 2. Rate of serious injury (death or hospital admission) for injured drivers (injury severity).
MONASH UNIVERSITY ACCIDENT RESEARCH CENTRE 2
Multiplying these two rates together formed the crashworthiness rating. This is a measure of the risk of serious injury for drivers involved in crashes. Measuring crashworthiness in two components reflecting risk and severity of injury was first developed by Folksam Insurance, which publishes the well-known Swedish ratings (Gustafsson et al 1989). The results of these ratings are summarised in Cameron et al (1994a) with a full technical description of the analysis methods appearing in Cameron et al (1994b). These ratings use an analysis method that was developed to maximise the reliability and sensitivity of the results from the available data. In addition to the speed zone and driver sex, the method of analysis adjusts for the effects of driver age and the number of vehicles involved, producing results with all those factors taken into account. Subsequent to the ratings of Cameron et al (1994a,b), five further updated sets of crashworthiness ratings were produced during 1996, 1997, 1998, 1999, 2000, 2003 (Newstead et al 1996, Newstead et al 1997, Newstead et al 1998, Newstead et al 1999, Newstead et al 2000, Newstead et al 2003). These covered vehicles manufactured over the period 1982-94, 1982-95, 1982-96, 1982-97 and 1982-98 respectively, and crashing during 1987-94, 1987-95, 1987-96, 1987-97, 1987-98 and 1987-2000 respectively, incorporating some enhancements to the methods of statistical analysis. The 1999 and 2000 ratings incorporated police reported crash data from Queensland whilst the 2003 ratings incorporated data from Western Australia. Previously only crash data from New South Wales and Victoria had been used. The crashworthiness ratings covered individual models of sedans, station wagons, four wheel drives, passenger vans and light commercial vehicles and were given as estimates of risk of severe injury for each model along with 90% and 95% confidence limits on each estimate. For each update, the rating figures were widely distributed in the form of a "Used Car Safety Ratings" brochure.
1.2 Aggressivity Ratings When crashworthiness ratings were first presented internationally, at the 1992 IRCOBI Conference in Italy (Cameron et al 1992a), the authors were encouraged to expand the analysis to measure the risk of injury that each individual model represents to other road users, in addition to the occupants of the subject model. It was suggested that MUARC were in a unique position to consider this issue since its ratings were based on tow-away crashes. A reviewer’s comments on the paper presenting the first update of the ratings, to the 1995 IRCOBI Conference in Switzerland, emphasised the same issue. The reviewer wrote, “partner protection and collision compatibility are very important for overall road safety and they can no longer be omitted in the discussion about ‘car safety’”. He recommended that this “shortcoming” should be addressed in the introduction and conclusion of the paper, and this was done in the published version (Cameron et al 1995). Together, these international reactions to MUARC’s work in this area indicated that the crashworthiness ratings should be extended to add a measure of the “aggressivity” of individual car models when they crash. Aggressivity ratings measure the risk of injury that a vehicle poses to occupants of other vehicles it impacts, and to other unprotected road users such as pedestrians, bicyclists and motorcyclists. The addition of aggressivity ratings represents further consumer advice, which purchasers of cars could take into account when choosing a specific model.
VEHICLE SAFETY RATINGS ESTIMATED FROM AUSTRALIAN AND NZ REAL CRASH DATA 3
Cameron, Newstead and Le (1998) completed an initial study that reviewed methods of rating vehicle aggressivity developed internationally, such as those by Broughton (1994, 1996) and Hollowell and Gabler (1996). Concepts from this review were then taken to develop a methodology for rating the aggressivity of Australian passenger vehicles making appropriate uses of the real crash data available in Australia. The methods developed were then successfully applied to estimate aggressivity ratings for a selection of Australian passenger vehicles that had accumulated sufficient real crash history. The original study of Cameron et al (1998) investigated the feasibility and methods of providing aggressivity ratings for Australian passenger vehicles in terms of the threat that each subject model represented to: 1. Occupants of other cars colliding with the subject model cars, and 2. Pedestrians, bicyclists and motorcyclists (if possible, separately) impacted by the subject
model cars. Although Cameron et al (1998) considered the second type of aggressivity rating, ratings of this type are problematic. In general, crashes involving pedestrians, bicyclists and motorcyclists are seldom reported to the Police unless someone is killed or injured (usually the unprotected road user). This means that an estimate of the risk of injury cannot be calculated for the unprotected road users for inclusion in the second type of aggressivity rating. Consequently, the measure of aggressivity towards unprotected road users, described by Cameron et al (1998), is a measure of injury severity only (ie the risk of serious injury given some injury was sustained). As such, this aggressivity measure is less able to discriminate between the performances of individual vehicle models as it is based on relatively small quantities of data. These problems made the measure of aggressivity towards unprotected road users of limited practical value and it has not been further considered after the initial work. This problem described in estimating aggressivity for unprotected road users did not occur for measuring aggressivity towards drivers of other cars, for whom the available data allowed estimates of both the risk of injury and of their injury severity in a manner analogous to the crashworthiness rating described above. As in Europe and the United States, the aggressivity rating towards drivers of other vehicles (Cameron et al, 1998) considered in this study has been based on two-car crashes between light vehicles (ie. heavy vehicle collisions have been excluded). The NSW, Western Australia and Queensland data on two-car crashes used in this study covers all Police reported crashes where at least one vehicle was towed or a pre-defined minimum damage level was attained. Consequently, the number of crashes in which neither driver was injured was available, at least so far as tow-away crashes are concerned. The measure of the aggressivity risk of injury (RO) of the other drivers colliding with the subject model, unadjusted for any other factors, is defined as:
Injury risk of other drivers = RO = proportion of drivers involved in crashes of tow away or greater severity who were injured
The injury severity of other drivers could be measured in a number of ways from the information on injury recorded on NSW, Western Australia and Queensland Police reports and TAC claims (viz. killed; admitted to hospital; or injury requiring medical treatment). The measure of aggressivity injury severity (SO), used here is:
MONASH UNIVERSITY ACCIDENT RESEARCH CENTRE 4
Injury severity of other drivers = SO = proportion of injured drivers who were killed or admitted to hospital. Based on the definition of RO and SO above, an aggressivity measure for each subject car model was then calculated as:
Aggressivity to other car occupants = AO = RO x SO. This measures the risk of the driver of other cars being killed or admitted to hospital when involved in collisions with the subject model cars. Before this aggressivity measure was calculated, consideration was given to taking into account likely differences between the crash circumstances of the subject car models, which may result in a distorted view of its aggressivity only partly related to the characteristics of the subject cars. Factors available in the data to consider such differences include: • speed limit at the crash location • subject vehicle driver age (younger drivers may be driving at relatively fast speeds not fully
represented by the speed limit) • subject vehicle driver sex (male drivers may be driving at relatively fast speeds or more
aggressively) • other car occupant age (older occupants are more susceptible to injury) • other car occupant sex (female occupants are more susceptible to injury, but males appear to
be associated with relatively high injury severity levels) Logistic regression techniques have been used to adjust RO and SO, separately, for any major differences that emerge between models of the subject cars regarding these factors. The adjusted RO and SO have been multiplied together for each subject car model to provide the final measure of aggressivity, AO. Cameron et al (1998) also considered adjusting the aggressivity ratings for the injury outcome of the drivers of the focus model vehicles, hence providing an indication of the crash severity. This was found to make little difference to the relative aggressivity ratings between vehicle models and has not been further considered here. Cameron et al (1998) also considered using the injury outcome of the most severely injured occupant of the vehicle colliding with the focus vehicle model in estimating the aggressivity index. Again, little difference was found in the estimated aggressivity ratings when considering all vehicle occupants than when considering drivers only so this method was not pursued here.
1.3 Preliminary Vehicle Safety Ratings Research in New Zealand In order to assess the viability of producing vehicle safety ratings for New Zealand (NZ), the LTSA undertook a feasibility study that examined all aspects necessary to produce the ratings relevant to New Zealand motorists and ideally including New Zealand crash data in the analysis. Thomas Voyce (Voyce, 2000) and Tijs Robinson (Robinson, 2000a, 2000b) carried out the two study parts. MUARC completed a review of the LTSA feasibility study (Newstead, 2000) that made recommendations on the future directions of the project to produce crashworthiness ratings based on analysis of real crash data for New Zealand vehicles. One of the key recommendations
VEHICLE SAFETY RATINGS ESTIMATED FROM AUSTRALIAN AND NZ REAL CRASH DATA 5
from the review of the feasibility study was to undertake a pilot study of the processes required to produce crashworthiness ratings for NZ passenger vehicles based on combined Australian and NZ crash data. The LTSA subsequently engaged MUARC to undertake the first four stages of a proposed 5-stage feasibility study. A brief description of each of the four previously completed pilot study stages completed and reported in detail in Newstead (2002) is as follows. Stage 1: Obtain a sample of merged crash and registration data.
The LTSA feasibility study showed all required data fields for producing vehicle safety ratings based on NZ data are present in the crash data in Crash Analysis System (CAS) and in the Transport Registry Centre (TRC) held registration data. There was a need to demonstrate the practical ability to merge the crash and registration data, and to be able to check the content and completeness of each of the required variables. The first stage of the pilot study demonstrated the ability to merge data with the required variables for a sample of crashed NZ vehicles. This component of the pilot study built on the work of Tijs Robinson. It enhanced the merged crash and registration files assembled for his first study with the additional data fields needed from CAS to check the content and consistency of a sample of the total data required for vehicle safety rating computation.
Stage 2: Obtain a snapshot of the NZ vehicle register.
In discussions with the LTSA and TRC there was some speculation as to the quality of the information in the make, model and year of manufacture fields of the registration data. The second phase of the pilot study obtained a snapshot at a point in time of the relevant fields for all passenger vehicles in the NZ vehicle register. Data was then assessed for quality, particularly in the vehicle make and model fields. The range of vehicles with valid VIN/ chassis numbers has been assessed, as was the year of manufacture fields, particularly for second hand imported vehicles. Work carried out in this phase again built on the work reported in Voyce (2000) and Robinson (2000a,b). The outcomes of this process were important in stage three of the pilot study.
Stage 3: Establishment and automation of NZ vehicle model decoding procedures.
Much of the vehicle clustering analysis completed in the LTSA feasibility study was carried out by hand. To use NZ data on a large scale for computation of vehicle safety ratings with regular updates, a mechanism of automatically decoding vehicle makes and models in the crash data and appropriately clustering these for analysis needed to be established. The third stage of the pilot study examined means to achieve automation of this task. Aspects examined included the use of the Australian VIN decoding procedures on NZ data and the use of the existing make and model registration fields for model identification.
Stage 4: Establish ongoing review of NZ model clustering:
As in the Australian crashworthiness study, ongoing monitoring of the vehicle fleet, particularly new vehicle model releases, is necessary to ensure defined vehicle clusters remain relevant and to identify new clusters to be formed. The work of Robinson (2000b) for the LTSA formed a sound basis on which to build an ongoing clustering methodology. This stage of the pilot study investigated the resources and methodologies necessary to achieve ongoing updates of the
MONASH UNIVERSITY ACCIDENT RESEARCH CENTRE 6
clustering methodology with a view to the need to produce ongoing updates of the New Zealand vehicle safety ratings.
1.4 Aims of Pilot Study Stage 5 Stages 1 to 4 of the New Zealand vehicle safety ratings pilot study has established the availability and suitability of New Zealand crash and registration data sources for estimating vehicle safety ratings using combined Australian and New Zealand crash data. They also confirmed the sufficient compatibility of the Australian and New Zealand vehicle fleets to ensure ratings based on the combined data will be of use to the New Zealand vehicle consumer population. Finally, the initial study stages established techniques for initial and ongoing vehicle model identification and clustering. The aim of the final stage of the pilot study was to develop and implement analysis methodology to compute the initial set of crashworthiness ratings for New Zealand passenger vehicles based on combined Australian and New Zealand real crash data. As such, this final stage aimed to produce a set of ratings for New Zealand passenger vehicles that could be published for consumer information. Preparation of the crash and registration data for this final stage, along with model identification and clustering utilised the techniques developed in Stages 1 to 4 of the pilot study. The study also aimed to demonstrate the consistency of ratings estimated from combined Australian and New Zealand data with those estimated from Australian data only through rigorous checking and comparison of ratings estimated with and without New Zealand data.
2. CRASH DATA Producing wide covering and accurate vehicle safety ratings for New Zealand passenger vehicles requires use of Australian crash data for vehicles appearing in both the Australian and New Zealand fleets. This was determined in the MUARC review of the original LTSA crashworthiness feasibility study (Newstead, 2000). The Australian crash data used for the New Zealand ratings estimated here is that used to produce the Australian vehicle safety ratings described in Newstead et al (2003). A brief overview of the Australian data is given here. As this study is primarily concerned with the addition of the New Zealand crash data to the Australian crash data to estimate ratings for New Zealand, a detailed description of the New Zealand crash and registration data follows.
2.1 Australian Crash Data The Australian crash data used in this study, along with its preparation for use in estimating vehicle safety ratings, is described in detail in Newstead et al (2003). Data in the Australian study (Newstead et al, 2002) was obtained from the states of Victoria, NSW, Western Australia and Queensland and covered vehicles manufactured over the period 1982-2000 and crashing during the years 1987-2000 in Victoria and New South Wales and 1991 to 2000 in Queensland and Western Australia. The data used for estimation of vehicle crashworthiness and aggressivity ratings covered drivers of passenger or light commercial vehicles involved in a crash required to be reported to Police in one of the four states. In Queensland, New South Wales and Western Australia, crashes are required to be reported to police when one or more vehicles are towed from the scene or when some minimum damage threshold is exceeded. In Victoria, crashes must be reported to police only when someone involved in the crash is injured. Injury severity of
VEHICLE SAFETY RATINGS ESTIMATED FROM AUSTRALIAN AND NZ REAL CRASH DATA 7
drivers in crashes in Victoria occurring from 1987 to 1998 were verified by matching the police crash records with Transport Accident Commission (TAC) injury compensation claims data. The TAC is the sole traffic accident injury insurer in Victoria. When the data on the injured drivers from the four states was combined for analysis, it covered 237,927 drivers of 1982-2000 model vehicles who were injured in crashes in Victoria or NSW during 1987-2000 or in Western Australia or Queensland during 1991-2000. Of these 217,502 had a valid injury severity code, with 20,425 drivers injured in crashes in NSW during 1999 and 2000 excluded because of missing injury severity. Information on the 217,502 injured drivers was used to assess the injury severity of the injured drivers of the different makes and models of vehicle when computing crashworthiness ratings. Information on 1,216,862 drivers involved in tow-away crashes in NSW during 1987-2000 or Western Australia and Queensland during 1991-2000 was available in the combined data. This was used to assess the injury rate of drivers of the different makes and models for computing crashworthiness ratings. The combined data for estimation of vehicle aggressivity ratings covered 86,244 drivers of vehicles colliding with 1982-2000 model vehicles who were injured in two car crashes in Victoria or NSW during 1987-2000 or in Western Australia and Queensland during 1991-2000. Excluding the 8,147 injured drivers from NSW during 1999 and 2000 without a valid injury severity code left 78,097 cases for analysis. This information was used to assess the injury severity of the injured drivers colliding with the different makes and models of vehicles when computing aggressivity ratings. The aggressivity injury risk component was estimated from information on the 585,397 drivers involved in two-car tow-away crashes in NSW during 1987-2000 or Western Australia and Queensland during 1991-2000.
2.2 New Zealand Crash and Registration Data Two sources of data from New Zealand were used in the calculation of vehicle crashworthiness and aggressivity ratings. The first data source provided was a crash file showing the registration, vehicle, driver and various crash characteristics for all police reported crashes in New Zealand for the years 1991 to 2000. The second data source was registration data giving details of all crash involved vehicles on the NZ register in each year from 1991 to 2000. Extracts from both data sources supplied for estimation of vehicle safety ratings are described below. After processing, these data were added to existing Australian data to produce ratings based on Australian and New Zealand real crash experience. 2.2.1 Crash Data NZ has an established database of reported injury crashes covering crashes over many years. Amongst many other things, this data is used to produce the annual publication summarising injury crashes in NZ (LTSA, 1998, for example). The crash data are stored in the Crash Analysis System (CAS) database managed by the LTSA and covers both injury and non-injury crashes. Whilst non-injury crashes are available from CAS, the reporting coverage of non-injury crashes in NZ is not as clear. The problem is that it is not mandatory for a non-injury crash to be reported to the Police so the number, nature and degree of vehicle damage, if any, are not known. Because of this, and because of problems with vehicle model identification documented by Voyce (2000), only injury crash data from New Zealand was useful for estimating vehicle safety ratings.
MONASH UNIVERSITY ACCIDENT RESEARCH CENTRE 8
To facilitate the use of NZ crash data in computing vehicle crashworthiness ratings, it was necessary to include a number of key variables in the crash data supplied. Because the NZ data must be finally integrated with the Australian data for analysis, it was important to match the data fields and levels within the data fields from the NZ data as closely as possible to those in the Australian data used to compute crashworthiness ratings. Extensive assessment of the content and compatibility of the New Zealand crash data in relation to that available from Australia is given in Newstead (2002). That study found the New Zealand injury crash data to be suitable for estimation of vehicle safety ratings in combination with the Australian data. The minimum key variables required in the New Zealand data to ensure compatibility with the Australian data, from those assessed in Newstead (2000), along with their coding levels were as follows.
• Year of crash (1991, 1992, …, 2000) • Speed limit at crash location (<80km/h, >=80km/h) • Number of vehicles involved (1, more than 1) • Level of urbanisation of crash location (urban, rural) • Driver age (<=25 years, 26-59 years, >=60 years) • Driver gender (male, female) • Injury level of driver (killed, hospitalised, other injury, not injured)
Data in CAS are stored as a relational database, comprising a series of linked tables with each covering a different theme related to a crash. The LTSA supplied details of the data fields available in the CAS system through a data dictionary of the database. Data from three tables, crash, person and vehicle, covered all the required data filed listed above. Linking data in the tables together was achieved using the crash identification number (crash_id), traffic unit identifier (ltsa_role) and person identifier (pers_id) fields. Complete extracts of each data table for the years 1991 to 2000, without personal identifier information, were supplied for analysis. From these, it was possible to select the required data for analysis from the supplied tables. In total, 206,960 units were recorded in the crash file during this period. It is noted that each unit in the file did not necessarily represent a vehicle that could be rated. A unit also included a motorcycle, bicyclist, pedestrian or heavy vehicle. 2.2.2 Registration Data Information from the vehicle register on vehicle make, model and year of manufacture were vital to enhance the crash data for estimation of vehicle crashworthiness ratings. The New Zealand Transport Registry Centre (TRC) held the required data. Data was requested covering all vehicles appearing in the 1991-2000 New Zealand crash data with current or historical (archived) registration records. Registration records for vehicles appearing in the crash data were selected based on registration plate number. Variables required from the registration database were selected based on information from the Pre-registration Procedures Manual supplied by TRC with reference to information required for accurate vehicle model decoding. Variables requested were as follows (with reference to the Pre-Registration Procedures Manual section where available).
• Vehicle registration number (plate number) • Vehicle Identification Number (VIN) (4-A-1) • Vehicle Type (4-A-3)
VEHICLE SAFETY RATINGS ESTIMATED FROM AUSTRALIAN AND NZ REAL CRASH DATA 9
• Registration Indicator (4-A-5) • Date of first Registration anywhere • De-registration date • Date of First NZ Registration (4-A-6) • Country of Previous Registration (4-A-7) • Make (4-A-8) • Model (4-A-8) • Sub-model Name (4-A-8) • Industry Model Code (4-A-8) • Year of manufacture (4-A-8) • Body Type (4-A-9) • Country of Origin (4-A-10) • Assembly Type (4-A-10) • CC Rating (4-A-10)
Of the variables requested, a number were key for identifying and clustering model details for vehicles appearing in the New Zealand crash data. These were vehicle type, VIN, year of manufacture, registration number, the date of first registration, the date of first New Zealand registration and whether the vehicle was sold new in New Zealand, was a used import or re-registered. One difficulty in retrieving vehicle registration information details for crashed vehicles based on only the registration plate number arose for registration plates that had been used on more than one vehicle model over time. It was not possible for the TRC to find the registration record that was current for a plate number just before the time the vehicle crashed. Instead, all records for the plate number of a crashed vehicle were retrieved from the registration system and archive. Where multiple records for a single plate number were provided, the most appropriate match based on the date of the crash and the date of first registration on the vehicle in New Zealand needed to be established. The process for doing so is described below. In some cases a registration record could not be found for a crashed vehicle. This was most likely because either the registration plate details had been recorded incorrectly in the crash data or the vehicle was not registered. For the 206,960 units involved in crashes in the data supplied for 1991 to 2000, 156,953 registration records were extracted by the TRC from the New Zealand vehicle register. The total number of registration records is less than the number of units because registration records for some vehicle could not be identified as well as because some units were pedestrians and bicycles that, of course, are not registered. 2.2.3 Merging the Crash and Registration Data In order to merge the Australian and New Zealand data for use in the analysis, the New Zealand registration and crash files had to be matched to provide full vehicle and crash information for each crash involved unit. This required the vehicle details obtained from the registration files to be matched with the crash files based on the registration number. This process raises some unique difficulties. First, in some instances the same vehicle may have crashed more than once between 1991 and 2000 causing multiple records for the same vehicle to appear in the registration file. Selecting those cases where the date of first NZ registration, vehicle make,
MONASH UNIVERSITY ACCIDENT RESEARCH CENTRE 10
model and registration details were identical identified these cases. Multiple entries were then deleted from the registration file. Second, it was possible that the same registration number may be associated with more than one vehicle over time. If any of these vehicles were involved in a crash during the relevant period, all vehicles on the NZ register between 1991 and 2000 with the relevant registration numbers appeared as unique entries in the registration data file. In cases of multiple entries with the same registration number, it was necessary to identify which of the vehicles on the registration file best matched the vehicle involved in the crash as shown in the crash file. To address this issue, additional entries for crashes with multiple matching registration file entries were created and the registration data was merged onto the crash file. Where the date of first NZ registration was after the date of the crash, the entry was removed. Remaining multiple records were sorted by the date of first New Zealand registration. The vehicle with the registration date falling closest in time to the crash date but prior to it was selected and the remaining multiple entries removed. Finally, in cases where the registration number was unknown or incomplete the crash and registration data could not be matched. At the completion of the matching process, 157,976 entries remained in the merged file containing the relevant variables from both the crash and registration files. This process of matching used here is an enhancement of that described in Newstead (2002) for matching New Zealand crash and registration data. After merging of the crash and registration data, vehicle model details were decoded using the process described below following which two final selection criteria were imposed. First, only vehicles manufactured after 1981 were to be included in the analysis. This led to the exclusion of 42,326 entries. Second it was necessary to exclude all entries not coded as cars, station wagons, vans, utilities or taxis. This further reduced the number of entries by 11,013. The final number of vehicles of appropriate type and year of manufacture was 104,637. Of the drivers of these vehicles 53,584 were not injured or had unknown injury status, whilst the remaining 51,053 were injured to some degree. The injury details of the 51,053 injured drivers were used for estimation of the crashworthiness injury severity measure in conjunction with the Australian data. Records on the uninjured drivers in the New Zealand injury crash data could not be used in the calculation of the injury risk component of the crashworthiness ratings. This was because non-injury crashes in New Zealand, and hence uninjured drivers from these crashes, were not suitable for use in the analysis and therefore records on all uninjured drivers in all crashes in New Zealand were incomplete. A subset of the New Zealand data described above and used for estimation of crashworthiness injury severity formed the basis of the data used in the calculation of the aggressivity ratings. For calculation of aggressivity ratings, only vehicles involved in two vehicle crashes were included. Within the New Zealand data this reduced the number of available vehicles from 104,637 to 53,674. Of the drivers of vehicles colliding with the 53,674 vehicles identified, 30,238 were injured whilst 23,436 were uninjured. Information on the injury level of the 30,238 injured drivers was used in conjunction with the Australian data to estimate the injury severity component of the aggressivity ratings.
2.3 Combined Australian and New Zealand Data The combined data on injured drivers from Australia and New Zealand covered 268,555 drivers of 1982-2000 model vehicles who were injured in crashes in Victoria or NSW during 1987-2000
VEHICLE SAFETY RATINGS ESTIMATED FROM AUSTRALIAN AND NZ REAL CRASH DATA 11
or in Western Australia, Queensland or New Zealand during 1991-2000 with a valid injury severity code. Information on the 268,555 injured drivers was used to assess the injury severity of the injured drivers of the different makes and models when computing crashworthiness ratings. Information on 1,216,862 drivers involved in tow-away crashes in NSW during 1987-2000 or Western Australia and Queensland during 1991-2000 was available in the Australian data. This was used to assess the injury risk of drivers of the different makes and models of vehicle for computing crashworthiness ratings. The combined Australian and New Zealand data for estimation of vehicle aggressivity ratings covered 108,355 drivers with a valid injury severity code. These drivers were in vehicles colliding with 1982-2000 model vehicles and were injured in two car crashes in Victoria or NSW during 1987-2000 or in Western Australia, Queensland or New Zealand during 1991-2000. This information was used to assess the injury severity of the injured drivers colliding with the different makes and models when computing aggressivity ratings. The aggressivity injury risk component was estimated from information on the 585,397 drivers involved in two-car tow-away crashes in Australia during 1987-2000.
3. MODELS OF VEHICLES
3.1 Australian Crash Data A procedure developed by the NRMA located the crashed vehicles in NSW vehicle registration records after matching by registration number and vehicle make. The Vehicle Identification Number (VIN) or chassis number obtained from the register was decoded to determine the models of light passenger vehicles. The decoding identified some light truck and unusual commercial models that were not considered further. Of the vehicles manufactured during 1982-2000, all but around 4% had their model identified. Further details are given by Pappas (1993). The same VIN decoding procedure was used to identify vehicle models in the Queensland data, achieving a similar level of decoding accuracy to NSW. The Victorian vehicle register provided the make and year of manufacture of the crashed vehicle but not the model. Models were initially derived for cars manufactured during 1982-88 using logic developed and supplied by the Royal Automobile Club of Victoria (RACV) based on the make, year and power-mass units. Power-mass units (PMU) are the sum of RAC horsepower units (PU) and the vehicle mass in units of 50kg (MU). Refined logic was developed by MUARC based on make, year, PMU, PU, MU and body type, and extended to cover 1989-93 models. The MUARC logic was applied to the combined Victorian data in conjunction with the RACV logic to derive passenger car models for the model years 1982-93. For vehicles crashing in the years 1994 to 2000, where available, the Victorian vehicle register provided the VIN of each crashed vehicle along with the information described above. VINs are recorded on the Victorian vehicle register for most vehicles from 1989 year of manufacture onwards. Where a VIN was available for a vehicle appearing in the 1994 to 2000 crash data, the model information was decoded from the VIN using the methods of Pappas (1993). Where the VIN was not available, the RACV and MUARC logic, described above, was used to obtain model details. Attempts were made to obtain VINs from the Western Australian vehicle register, managed by the WA Department of Transport, for vehicles appearing in the Western Australian crash data.
MONASH UNIVERSITY ACCIDENT RESEARCH CENTRE 12
Due to an upgrade of the WA registration data system, however, VINs could not be obtained for this update of the vehicle safety ratings although it is possible they may become available for future updates. This meant the VIN decoding system used on data from the other three states to identify vehicle model details could not be used for WA. Detailed vehicle make and model information along with year of manufacture have been merged onto the WA crash data by Main Roads WA as part of a regular interrogation of the WA vehicle register. The make and model codes proved to be of sufficient detail to be used, along with the year of manufacture, to assign vehicle model groupings to vehicles crashed in WA consistent with the vehicle model groupings that are derived from the VIN decoding system. Only a small number of vehicles, typically in model change over years, could not be accurately assigned a sufficiently accurate model code for use in the study. RACV, NRMA and the Australian Transport Safety Bureau (ATSB, formerly FORS) provided advice on the particular models that had experienced substantial changes in design (and hence potential crashworthiness) during model years 1982-2000 and in which years the design was relatively constant. This resulted in certain models being split into ranges of years of manufacture. Where the new model was introduced near the beginning or end of a year (up to two months either way), this process was relatively straightforward (accepting a small mis-classification in some circumstances). However, when the model changed near the middle of the year, the model for that year was kept separate and potentially treated as a "mixed" model (eg. the Daihatsu Charade 1987 models). Where exact model decoding was possible from the VIN, without using year of vehicle manufacture, this was used. VicRoads previously provided advice on vehicle models that could be combined with each other (sometimes only for specific years) because they were essentially the same design or construction but registered as having different manufacturers. This information was used in the analysis to combine some models, otherwise one or both members of each such pair of models would have been excluded and a crashworthiness rating would not have been produced (Section 4.1.3). Model sharing in the automotive industry has declined in recent years alleviating this as an ongoing problem to a large degree. As in previous crashworthiness ratings, models were excluded with fewer than 20 injured drivers and/or fewer than 100 involved drivers appearing in the crash data. The same selection criteria were also used for aggressivity ratings except exclusion was based on the number of injured drivers in the vehicles colliding with the focus vehicle model. These selection criteria were used to ensure stability in fitting the logistic regression models along with suitably small confidence limits on the estimated crashworthiness ratings. For the purpose of publication, the models were also categorised in market groups as follows:
• Passenger cars and station wagons: Large Medium Small Sports Luxury
• Four-wheel drive vehicles • Passenger vans • Commercial vehicles (less than 3500 kg GVM)
VEHICLE SAFETY RATINGS ESTIMATED FROM AUSTRALIAN AND NZ REAL CRASH DATA 13
It should be noted that some of the vehicle models identified in the Victorian, NSW, Western Australia and Queensland crash data have optional safety equipment, such as air bags, which could significantly alter the crashworthiness rating of the vehicle model when fitted. Notable examples in local manufacture include the Holden Commodore VR/VS, Toyota Camry 1993-97 and Mitsubishi Magna TR/TS, and TE/TF/TH, all of which have optional air bag fitment. It is, however, generally not possible to identify which particular vehicles of a model series do and do not have such optional safety equipment installed using the model decoding procedures described above. Consequently, for those vehicle models with optional safety equipment, the estimated crashworthiness rating represents an average of the safety performance for vehicles with and without the optional safety equipment weighted by the number of each in the crash data.
3.2 New Zealand Crash Data In order to integrate the New Zealand crash data with the Australian data for analysis, it was necessary to identify and classify the make and model type of each crash-involved vehicle in a way consistent with that carried out for the Australian data. A process of decoding vehicle model information in the New Zealand crash data was established and applied in Newstead (2002). The procedure developed is described here but broadly follows the principles outlined above for the Australian data. Identifying vehicle models and establishing appropriate clustering relied on the use of external resources giving details of vehicle model release dates and specifications. A summary of the key resources used for the New Zealand model decoding process is as follows. • IDENTICAR. The principal resource on vehicle model specifications and release dates has
been Identicar published by GCL in NZ. Identicar has model run dates and limited information on specifications for all new and used imported passenger vehicles and light commercial vehicles available for sale in NZ. It has either photographs or sketches of each vehicle model covered along with details on the manufacturers’ chassis code that are broadly consistent with the industry model codes and chassis codes held on the NZ vehicle register. Information in the publication covers the period of vehicle manufacture from 1982 onwards which is the focus of the ratings system. It is recognised that the information presented in Identicar is not always completely accurate, particularly with respect to items of detail such as the manufacturer’s chassis code and detailed specifications of the vehicle. However, despite the noted problems, it was considered that the information presented is of sufficient detail and accuracy for the publication to be used as an ongoing primary resource for vehicle model identification and clustering in the production of NZ crashworthiness ratings.
• POLK AUTOSPEC. Polk AutoSpec has proved a valuable resource in identifying new vehicle releases in the Australian market for use in producing the Australian vehicle crashworthiness ratings. It has highly detailed information on vehicle release dates, original specifications and specification changes. It also has detailed photographs of each vehicle model released. For a number of years, Polk also published an AutoSpec covering the NZ new vehicle market that represented a valuable source of information on NZ new vehicle releases. In the NZ crashworthiness feasibility study, the AutoSpec publication was a valuable source of information on new vehicle releases in NZ with the photographs and specifications allowing accurate comparison of vehicle model lines with those from
MONASH UNIVERSITY ACCIDENT RESEARCH CENTRE 14
Australia thought to be similar. It was hoped AutoSpec could continue to be used as a primary resource for identification and clustering of new NZ vehicles in the process of producing crashworthiness ratings. Unfortunately, Polk are no longer producing the AutoSpec publication for NZ, a decision based on economic grounds perhaps reflecting the minority of total NZ vehicle sales that new vehicles now represent. Consequently, this resource was only useful for this research for the historical coverage of the publication whilst it was being produced.
• REDBOOK. A valuable source of on-line information on vehicle specifications and release dates is Red Book. The Red Book web site for Australia (www.redbook.com.au) covers an extremely wide range of vehicles currently existing in the Australian fleet. Detail is given on each model variant including a sketch of the vehicle for visual identification and a brief summary of specifications. Information in Red Book is useful in the safety ratings projects for determining build dates of vehicle model series, and broad specification of different model variants. It is the most valuable source of information available for vehicles manufactured pre 1990. Red Book also has a web site specific to the NZ vehicle market (www.redbook.co.nz). It includes most of the range information on the Australian Red Book site apart from the sketches of vehicle models useful for visual identification. Importantly, it covers not only vehicles sold new in NZ but also a wide range of second hand imported vehicles, particularly the most popular models. The lack of pictures or sketches of vehicle models on the NZ Red Book site was offset through the use of other NZ automotive web sites such as Auto (www.auto.co.nz) to access pictures of vehicles. On line sources such as Red Book NZ provided the next most important source of ongoing vehicle identification and clustering information after Identicar.
As noted, the New Zealand vehicle fleet is comprised fundamentally of two different types of vehicles. They are those sold new in New Zealand and used vehicles imported into New Zealand primarily from Japan. Because of differences in availability and quality of information in the registration data between new and used import vehicles, a different strategy for decoding model information for new and used import vehicle was used. As in the Australian data, the final aim of the model decoding process is to assign a model code (‘modelh’) to each crashed vehicle in the New Zealand data code dependent on the make, model and year of manufacture of the vehicle. A vehicle safety rating is then calculated for each vehicle set defined by a ‘modleh’ code with sufficient real crash experience. A full list of the ‘modelh’ codes and associated vehicle details is provided in Appendix 1. The process for assigning the ‘modelh’ code for both new and used import vehicles in the New Zealand crash data follows. 3.2.1 New Vehicle Model Decoding and Clustering The model decoding and clustering procedure used for passenger vehicles sold new in NZ is as follows. 1) Vehicles with a valid ISO standard 17 character VIN number were identified in the merged
crash and registration data. The make, year of manufacture and VIN for these vehicles was then run through the VIN decoder developed for decoding vehicle model information in the Australian crashworthiness system. VINs beginning with a 7 (the world manufacturer code character for NZ) were identified and excluded from this process as the Australian VIN decoder does not contain the necessary data to be able to identify vehicle model details for
VEHICLE SAFETY RATINGS ESTIMATED FROM AUSTRALIAN AND NZ REAL CRASH DATA 15
vehicles with a NZ assigned VIN. The result of the VIN decoding process, where successful, was a direct clustering of each vehicle into one of the clusters defined for the Australian crashworthiness ratings study. Vehicles that had no cluster assigned after the VIN decoding process were identified for further processing. Of the 157,976 unit entries matched with registration data, 9,418 had recorded vehicle identification numbers (VINs) not beginning with a 7. These entries were extracted and assigned a code according to their VIN. Of these, 2,956 entries did not decode properly and were added back to the remaining uncoded data.
2) Vehicles without an ISO standard VIN, those with ISO standard VINs issued in NZ (beginning with a 7) and those that failed the VIN decoding process were identified for the next processing phase. A total of 93,493 crashed vehicles that were sold new in New Zealand had vehicle model details identified in this way.
a) Basic vehicle make and model details were identified from the vehicle make and model codes held on the vehicle register. These are equivalent to the make and model information contained in the NZ assigned ISO VIN were applicable and were found to be consistent with that in the crash data in comparisons made in Newstead (2002).
b) Using "Identicar" and Polk "AutoSpec" to identify vehicle specifications and major model series changes, a process of clustering was developed. Definition of clusters used the vehicle make and model codes along with the vehicle year of manufacture. A translation table was developed that converted the vehicle make, model and year of manufacture combinations present in the crash data to the Australian equivalent model clusters. Development of the translation table was essentially carried out manually through necessity. One of the key difficulties encountered that necessitated manual development of the translation table was the numerous variations of the vehicle model codes in the registration data for the same vehicle. For example "Applause L" and "Applause X" for two different trim variants of the same Daihatsu vehicle (ideally the suffixes X and L should have been in the sub-model code field with only Applause in the model code). The model cluster translation table will need to be updated every time new data is added to the system, in a similar way in which the Australian VIN decoder is updated to reflect new model releases.
c) In some cases, a broader range of body types and specifications of some NZ vehicle models was available than in Australia. Some of the different body types and specifications were likely to have differences significant enough to alter the crashworthiness of the vehicle. Identification of variants within a model range with body types and specification dissimilar enough to have likely different crashworthiness to the equivalent Australian model was made using the body type, industry model code and chassis number data fields. Vehicle model variants identified with incompatible specifications or body types were excluded from the defined comparable Australian data clusters.
3.2.2 Used Imported Vehicle Model Decoding and Clustering Identification of vehicle make and model details and appropriate clusters for the used imported NZ vehicles, was carried out using an identical process to that in section 2 of the process used for new vehicles above (Section 3.2.1). This process was also used for vehicles identified in the registration records as re-registered or unknown. 58,021 vehicles in the matched crash and registration data were identified as used, re-registered or unknown. New car process (1) was not
MONASH UNIVERSITY ACCIDENT RESEARCH CENTRE 16
available for the used imports as almost none of these vehicles had a valid ISO VIN assigned in any country apart from NZ. The available source of information on vehicle model specifications were the "Identicar" publication that has a whole section devoted to the used Japanese imported vehicles, including great detail on the associated industry model codes for each vehicle, and the on-line sources “Redbook” and “Auto”. Use of the industry model code and or chassis number (which generally contains the industry model code) proved useful for the second hand imported vehicles in some instances. 3.2.3 Final Decoded Data The three sources of decoded data (VIN decoded, new and used decoded entries) were then merged together to enable the final selection of vehicles for use in the analysis. Where insufficient information was available for the ‘modelh’ code to be determined from any of the processes described above, the ‘modleh’ code was assigned a value of ‘Z’. Two final selection criteria were imposed. First, only vehicles manufactured after 1981 were to be included in the analysis. This led to the exclusion of 42,326 entries. Second, where no ‘modelh’ code had been assigned or a modelh code of ‘Z’ was assigned, it was necessary to exclude all entries not coded as cars, station wagons, vans, utes or taxis. This further reduced the number of entries by 11,013. The final file for use in the analysis contained 104,637 vehicles crashed in New Zealand with valid model details identified.
4. ANALYSIS
4.1 Overview of Analysis Methods: Crashworthiness
The crashworthiness rating (C) is a measure of the risk of serious injury to a driver of a car when it is involved in a crash. It is defined to be the product of two probabilities (Cameron et al, 1992): i) the probability that a driver involved in a crash is injured (injury risk), denoted by R; and ii) the probability that an injured driver is hospitalised or killed (injury severity), denoted by
S. That is
C R S= × .
Folksam Insurance, who publishes the well-known Swedish ratings, first measured crashworthiness in this way (Gustafsson et al, 1989). In the present report, each of the two components of the crashworthiness rating was obtained by logistic regression modelling techniques. Such techniques are able to simultaneously adjust for the effect of a number of factors (such as driver age and sex, number of vehicles involved, etc.) on probabilities such as the injury risk and injury severity.
VEHICLE SAFETY RATINGS ESTIMATED FROM AUSTRALIAN AND NZ REAL CRASH DATA 17
The Logistic Model
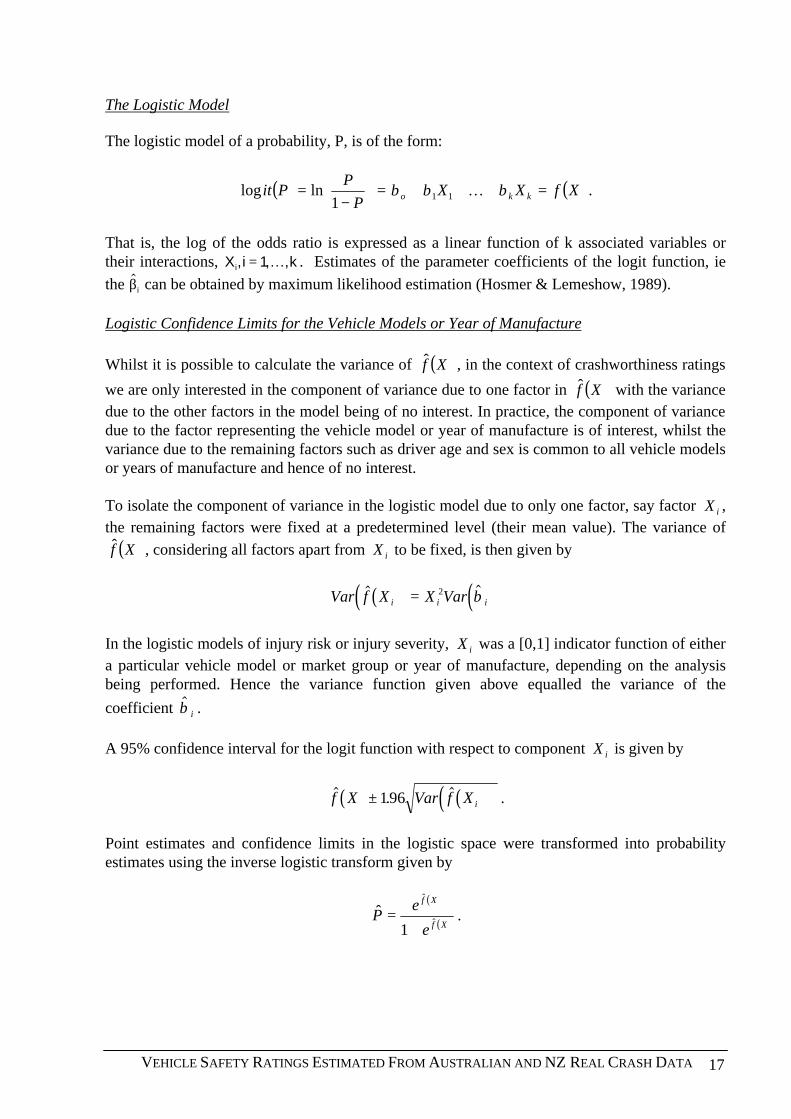
The logistic model of a probability, P, is of the form:
( ) ( )XfXXP
PPit kko =+++=
−= βββ K111
lnlog .
That is, the log of the odds ratio is expressed as a linear function of k associated variables or their interactions, X i ki, , ,= 1K . Estimates of the parameter coefficients of the logit function, ie the $βi can be obtained by maximum likelihood estimation (Hosmer & Lemeshow, 1989).
Logistic Confidence Limits for the Vehicle Models or Year of Manufacture Whilst it is possible to calculate the variance of ( )Xf̂ , in the context of crashworthiness ratings
we are only interested in the component of variance due to one factor in ( )Xf̂ with the variance due to the other factors in the model being of no interest. In practice, the component of variance due to the factor representing the vehicle model or year of manufacture is of interest, whilst the variance due to the remaining factors such as driver age and sex is common to all vehicle models or years of manufacture and hence of no interest. To isolate the component of variance in the logistic model due to only one factor, say factor X i , the remaining factors were fixed at a predetermined level (their mean value). The variance of
( )Xf̂ , considering all factors apart from X i to be fixed, is then given by
( )( ) ( )Var f X X Vari i i$ $= 2 β
In the logistic models of injury risk or injury severity, X i was a [0,1] indicator function of either a particular vehicle model or market group or year of manufacture, depending on the analysis being performed. Hence the variance function given above equalled the variance of the
coefficient $β i . A 95% confidence interval for the logit function with respect to component X i is given by
( ) ( )( )$ . $f X Var f X i± 196 .
Point estimates and confidence limits in the logistic space were transformed into probability estimates using the inverse logistic transform given by
( )
( )Xf
Xf
e
eP ˆ
ˆ
1ˆ
+= .
MONASH UNIVERSITY ACCIDENT RESEARCH CENTRE 18
4.1.1 Logistic Models for Each Component
Obtaining the Covariate Models
Before adjusted crashworthiness ratings could be obtained it was necessary to consider logistic models of each of the crashworthiness components separately to identify possible factors, other than vehicle design, that might have influenced the crash outcomes in terms of driver injury severity. A stepwise procedure was used to identify which factors had an important influence. This was done without considering the type of car or year of manufacture in the model, as the aim was to determine which other factors were most likely to have had an influence across a broad spectrum of crashes. Furthermore, the car model variable had to be excluded from the logistic modelling process at this stage because of analysis convergence problems when the car model was competing against the other factors in the stepwise procedure. It was also not considered appropriate to interact vehicle model with other factors in the logistic model as this would imply that relative vehicle crashworthiness varied between models depending on the crash circumstance and occupant characteristics. Logistic models were obtained separately for injury risk and injury severity because it was likely that the various factors would have different levels of influence on these two probabilities. The factors considered during this stage of the analysis for both injury risk and injury severity were: • sex: driver sex (male, female) • age: driver age (≤25 years; 26-59 years; ≥60 years) • speedzone: speed limit at the crash location (≤75 km/h; ≥80 km/h) • nveh: the number of vehicles involved (one vehicle; >1 vehicle) • state: state or country of crash (Victoria, NSW, Queensland, Western Australia
or New Zealand) • year: year of crash (1987, 1988, … ,2000) These variables were chosen for consideration because they were part of the Victorian, Queensland, New South Wales, Western Australia and New Zealand databases. Other variables were only available from one source and their inclusion would have drastically reduced the number of cases that could have been included in the analysis. State or country of crash was a necessary inclusion in the logistic model because each state or country in the analysis has different proportions of crashes at each severity level in their reported data. Factors tha may result in different proportions of crashes at each severity level between jurisdictions include different levels of driver compliance with safety related laws such as seat belt wearing, speed limits or blood alcohol limits or differences in general levels of safety in the road infrastructure. Including the state factor in the covariate model is necessary to adjust for rating bias towards those vehicle models that are sold and driven more in one state or country than another. Inclusion of a year of crash indicator and its interaction with jurisdiction in the model is necessary to adjust for the different trends in crash severity noted between each of the states or countries (see section 4.1.5 below).
VEHICLE SAFETY RATINGS ESTIMATED FROM AUSTRALIAN AND NZ REAL CRASH DATA 19
All data was analysed using the Logistic Regression procedure of the SAS statistical package (SAS, 1989). Estimates of the coefficients of the logit function, $ , , ,βi i k= 1K , together with their associated standard errors, were obtained by maximum likelihood estimation. In the modelling process, design variables for the various factors were chosen in such a way that the estimated coefficients represented deviations of each of the variable levels from the mean. Each factor in the model, including year of crash, was treated as categorical to allow maximum flexibility in the relationship between each and the outcome measure. For both injury risk and injury severity, a stepwise procedure was used to identify which factors and their interactions made a significant contribution to these probabilities. All possible first and higher order interactions were considered between all factors in the model. A hierarchical structure was imposed so that interaction between two variables was included in the model only when the corresponding main effects were also included. The resultant logistic regression models were referred to as the "covariate" models or equations. The average value of the injury risk or injury severity was obtained directly from the outcome variable of interest averaging across all cases in the analysis.
Assessing Car Model or Year of Manufacture Differences
Injury risk and injury severity for individual cars were estimated after adding a variable representing car model or year of manufacture to the respective logistic "covariate" models. That is, the car model or year of manufacture variable was included in the logistic model along with those factors and their interactions that were found to be statistically significantly related to the outcome variable in the stepwise modelling procedure and the model re-estimated in a single step process. Coefficients for individual car models or years of manufacture were computed to represent deviations of that car or year from the average. As mentioned earlier, this was to avoid non-convergence problems in the analysis when car model or year of manufacture was allowed to compete with the other factors in the stepwise selection process. It was important to ensure that the logistic model adequately described the data and did not yield individual car model coefficients that were imprecise or unstable. For this reason, individual car models with small frequencies were pooled with similar car models in the rare cases where this was appropriate (see Section 4.1.3) or, more typically, they were excluded from the analysis. Car models were excluded if, after pooling models, there were either: i) less than 100 involved drivers; or ii) less than 20 injured drivers. Some further model exclusions were made for vehicle model classifications that had no practical interpretation. This included models in a particular year where there was a change from one series to the next and year of manufacture was necessary to determine the series break (such as Mitsubishi Pajero 1991). It also included some groups of highly aggregated models that would be of no intrinsic interest to consumers using the ratings (such as Jeep Others or Mazda Commercials). After exclusion, the regression analyses were performed on 263 individual car models (or pooled similar models). A list of all vehicle models considered, with those with sufficient data for analysis indicated, is given in Appendix 1. The variable representing car model was therefore
MONASH UNIVERSITY ACCIDENT RESEARCH CENTRE 20
categorical with 263 nominal levels. The choice of the design for the logistic model allowed the injury risk and injury severity estimates for each individual car model to be compared with the overall (average) rating for all cars. No such criteria were necessary for the year of manufacture analysis. For each car model or year of manufacture, a 95% confidence interval for the logit functions of injury risk and injury severity was obtained after first adjusting for the average value in the data and then allowing for the deviation from average for that particular car model. Estimates of injury risk and injury severity were obtained by de-transforming the logit functions as described above. A 95% confidence interval was determined after adjusting for the average values of the significant factors and their interactions. The precision of the estimates of injury risk and injury severity is measured by the width of these 95% confidence intervals. Assessing Market Group Averages
A similar approach to that for individual car models was used to assess car market group averages. A variable with 8 nominal levels representing the different market groups (large, medium, small, luxury, sports, 4-wheel drive, passenger vans and commercial vehicles with GVM < 3500 kg) was added to each of the "covariate" models. Deviations of each market group from the average were also assessed. Ninety-five percent confidence intervals for the estimates of both injury severity and injury risk were also obtained for each of the market groups.
4.1.2 Combining the Injury Risk and Injury Severity Components
The final combined ratings of vehicle crashworthiness are given by:
Crashworthiness Rating = Injury risk x Injury severity. For a given model of car or year of manufacture, j, the crashworthiness rating, C j , was therefore calculated as:
C R Sj j j= × where
Rj denotes the injury risk for car model or year of manufacture j, and Sj denotes the injury severity for car model or year of manufacture j.
Noting the form of the logistic inverse transformation in section 4.1 above, we have
Re
eS
e
ej j
j
j
j
j=
+=
+
α β
α β
1 1,
where α j and β j are the values of the logistic regression function ( )Xf̂ for injury risk and
injury severity respectively for vehicle model or year of manufacture j. Taking the natural log of the crashworthiness rating and using asymptotic statistical theory, the asymptotic variance of the log of the crashworthiness rating is
VEHICLE SAFETY RATINGS ESTIMATED FROM AUSTRALIAN AND NZ REAL CRASH DATA 21
22 )1(
)(
)1(
)()(log
jj e
Var
e
VarCVar jj
je βα
βα
++
+≈
where the variances of α j and β j are as given in section 4.1 and the estimates of α j and β j
are considered independent. The 95% confidence interval for the natural log of the crashworthiness rating is then
( )log ( ) . log ( )e j e jC Var C± ⋅196 .
The 95% confidence limit for the crashworthiness rating is obtained by taking the exponent of the confidence limit of the logged crashworthiness rating shown above. Because each of the two estimated crashworthiness components have been adjusted for the effect of other factors by logistic regression prior to their incorporation into the combined ratings, the resultant crashworthiness rating is also adjusted for the influence of these factors. It should be noted that the confidence interval for the combined rate reflects the variability in the car model only and not the variability in the other factors included in the logistic models. The same procedure was used to obtain crashworthiness ratings of each distinct market group and for each year of vehicle manufacture.
4.1.3 Pooled Car Models
Vehicle model sharing amongst manufacturers retailing in the Australian market has been relatively common. Because shared models are generally identical, particularly with respect to safety performance, it is possible to pool such models for safety rating, allowing a more precise estimate of the safety of models for which data is pooled rather than considering each separately. There are also some Ford Falcon models that expert advice has indicated did not change significantly from one series to the next that can also be pooled for the same reasons as the shared models. Both the pooled models and Falcon models combined are indicated in Table 2. Table 2: Pooled Models of Cars Ford Laser 82-89 with Mazda 323 / Familia 82-88 Ford Laser 99-00 with Mazda 323 99-00 Ford Telstar 83-87 with Mazda 626 / MX6 / Capella 83-86 Ford Telstar 88-91 with Mazda 626 / MX6 / Capella 88-91 Ford Telstar 92-97 with Mazda 626 / MX6 / Capella / Cronos 92-97 Ford Falcon EA with Ford Falcon EB Series I Ford Falcon ED with Ford Falcon EB Series II Ford Corsair 89-92 with Nissan Pintara / Bluebird 89-92 Holden Commodore VR/VS with Toyota Lexcen 93-97 Holden Commodore VN-VP with Toyota Lexcen 89-93 Holden Nova 89-92 with Toyota Corolla 88-92 Holden Nova 93-96 with Toyota Corolla 93-97 Holden Astra 84-86 with Nissan Pulsar / Langley 83-86
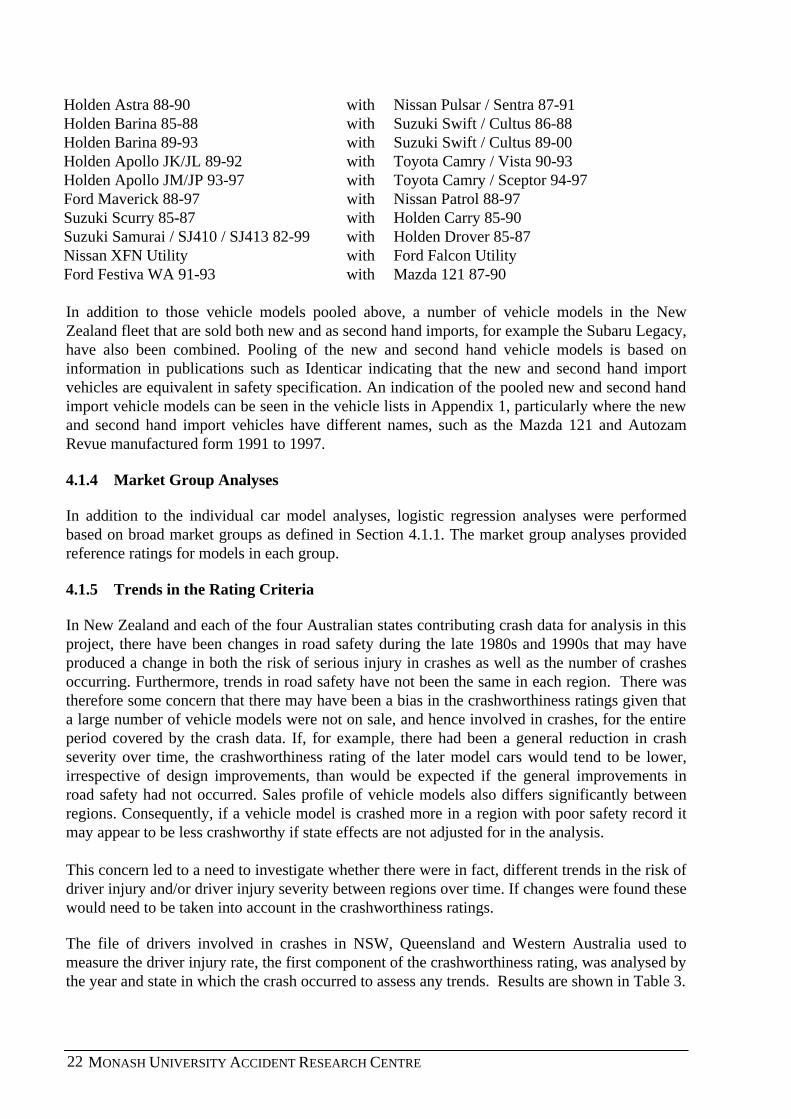
MONASH UNIVERSITY ACCIDENT RESEARCH CENTRE 22
Holden Astra 88-90 with Nissan Pulsar / Sentra 87-91 Holden Barina 85-88 with Suzuki Swift / Cultus 86-88 Holden Barina 89-93 with Suzuki Swift / Cultus 89-00 Holden Apollo JK/JL 89-92 with Toyota Camry / Vista 90-93 Holden Apollo JM/JP 93-97 with Toyota Camry / Sceptor 94-97 Ford Maverick 88-97 with Nissan Patrol 88-97 Suzuki Scurry 85-87 with Holden Carry 85-90 Suzuki Samurai / SJ410 / SJ413 82-99 with Holden Drover 85-87 Nissan XFN Utility with Ford Falcon Utility Ford Festiva WA 91-93 with Mazda 121 87-90 In addition to those vehicle models pooled above, a number of vehicle models in the New Zealand fleet that are sold both new and as second hand imports, for example the Subaru Legacy, have also been combined. Pooling of the new and second hand vehicle models is based on information in publications such as Identicar indicating that the new and second hand import vehicles are equivalent in safety specification. An indication of the pooled new and second hand import vehicle models can be seen in the vehicle lists in Appendix 1, particularly where the new and second hand import vehicles have different names, such as the Mazda 121 and Autozam Revue manufactured form 1991 to 1997.
4.1.4 Market Group Analyses
In addition to the individual car model analyses, logistic regression analyses were performed based on broad market groups as defined in Section 4.1.1. The market group analyses provided reference ratings for models in each group.
4.1.5 Trends in the Rating Criteria
In New Zealand and each of the four Australian states contributing crash data for analysis in this project, there have been changes in road safety during the late 1980s and 1990s that may have produced a change in both the risk of serious injury in crashes as well as the number of crashes occurring. Furthermore, trends in road safety have not been the same in each region. There was therefore some concern that there may have been a bias in the crashworthiness ratings given that a large number of vehicle models were not on sale, and hence involved in crashes, for the entire period covered by the crash data. If, for example, there had been a general reduction in crash severity over time, the crashworthiness rating of the later model cars would tend to be lower, irrespective of design improvements, than would be expected if the general improvements in road safety had not occurred. Sales profile of vehicle models also differs significantly between regions. Consequently, if a vehicle model is crashed more in a region with poor safety record it may appear to be less crashworthy if state effects are not adjusted for in the analysis. This concern led to a need to investigate whether there were in fact, different trends in the risk of driver injury and/or driver injury severity between regions over time. If changes were found these would need to be taken into account in the crashworthiness ratings.
The file of drivers involved in crashes in NSW, Queensland and Western Australia used to measure the driver injury rate, the first component of the crashworthiness rating, was analysed by the year and state in which the crash occurred to assess any trends. Results are shown in Table 3.
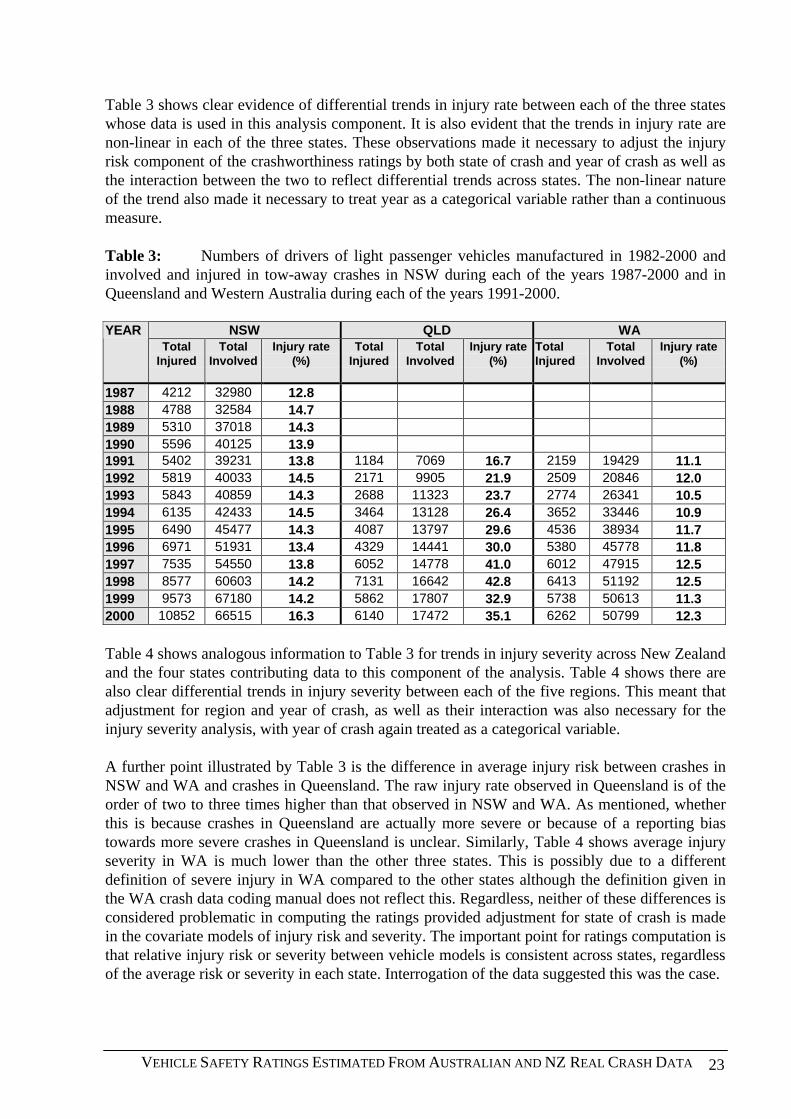
VEHICLE SAFETY RATINGS ESTIMATED FROM AUSTRALIAN AND NZ REAL CRASH DATA 23
Table 3 shows clear evidence of differential trends in injury rate between each of the three states whose data is used in this analysis component. It is also evident that the trends in injury rate are non-linear in each of the three states. These observations made it necessary to adjust the injury risk component of the crashworthiness ratings by both state of crash and year of crash as well as the interaction between the two to reflect differential trends across states. The non-linear nature of the trend also made it necessary to treat year as a categorical variable rather than a continuous measure. Table 3: Numbers of drivers of light passenger vehicles manufactured in 1982-2000 and involved and injured in tow-away crashes in NSW during each of the years 1987-2000 and in Queensland and Western Australia during each of the years 1991-2000.
NSW QLD WA YEAR Total
Injured Total
Involved Injury rate
(%) Total
Injured Total
Involved Injury rate
(%) Total Injured
Total Involved
Injury rate (%)
1987 4212 32980 12.8 1988 4788 32584 14.7 1989 5310 37018 14.3 1990 5596 40125 13.9 1991 5402 39231 13.8 1184 7069 16.7 2159 19429 11.1 1992 5819 40033 14.5 2171 9905 21.9 2509 20846 12.0 1993 5843 40859 14.3 2688 11323 23.7 2774 26341 10.5 1994 6135 42433 14.5 3464 13128 26.4 3652 33446 10.9 1995 6490 45477 14.3 4087 13797 29.6 4536 38934 11.7 1996 6971 51931 13.4 4329 14441 30.0 5380 45778 11.8 1997 7535 54550 13.8 6052 14778 41.0 6012 47915 12.5 1998 8577 60603 14.2 7131 16642 42.8 6413 51192 12.5 1999 9573 67180 14.2 5862 17807 32.9 5738 50613 11.3 2000 10852 66515 16.3 6140 17472 35.1 6262 50799 12.3
Table 4 shows analogous information to Table 3 for trends in injury severity across New Zealand and the four states contributing data to this component of the analysis. Table 4 shows there are also clear differential trends in injury severity between each of the five regions. This meant that adjustment for region and year of crash, as well as their interaction was also necessary for the injury severity analysis, with year of crash again treated as a categorical variable. A further point illustrated by Table 3 is the difference in average injury risk between crashes in NSW and WA and crashes in Queensland. The raw injury rate observed in Queensland is of the order of two to three times higher than that observed in NSW and WA. As mentioned, whether this is because crashes in Queensland are actually more severe or because of a reporting bias towards more severe crashes in Queensland is unclear. Similarly, Table 4 shows average injury severity in WA is much lower than the other three states. This is possibly due to a different definition of severe injury in WA compared to the other states although the definition given in the WA crash data coding manual does not reflect this. Regardless, neither of these differences is considered problematic in computing the ratings provided adjustment for state of crash is made in the covariate models of injury risk and severity. The important point for ratings computation is that relative injury risk or severity between vehicle models is consistent across states, regardless of the average risk or severity in each state. Interrogation of the data suggested this was the case.
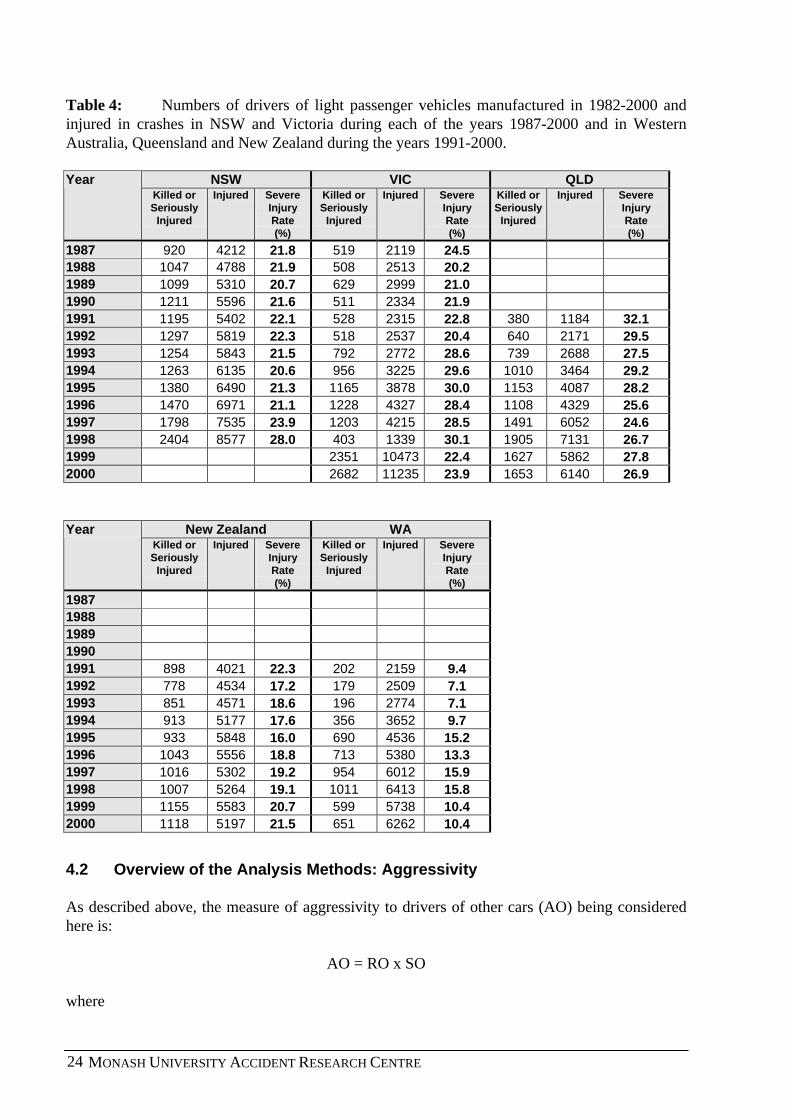
MONASH UNIVERSITY ACCIDENT RESEARCH CENTRE 24
Table 4: Numbers of drivers of light passenger vehicles manufactured in 1982-2000 and injured in crashes in NSW and Victoria during each of the years 1987-2000 and in Western Australia, Queensland and New Zealand during the years 1991-2000.
NSW VIC QLD Year Killed or Seriously
Injured
Injured Severe Injury Rate (%)
Killed or Seriously
Injured
Injured Severe Injury Rate (%)
Killed or Seriously
Injured
Injured Severe Injury Rate (%)
1987 920 4212 21.8 519 2119 24.5 1988 1047 4788 21.9 508 2513 20.2 1989 1099 5310 20.7 629 2999 21.0 1990 1211 5596 21.6 511 2334 21.9 1991 1195 5402 22.1 528 2315 22.8 380 1184 32.1 1992 1297 5819 22.3 518 2537 20.4 640 2171 29.5 1993 1254 5843 21.5 792 2772 28.6 739 2688 27.5 1994 1263 6135 20.6 956 3225 29.6 1010 3464 29.2 1995 1380 6490 21.3 1165 3878 30.0 1153 4087 28.2 1996 1470 6971 21.1 1228 4327 28.4 1108 4329 25.6 1997 1798 7535 23.9 1203 4215 28.5 1491 6052 24.6 1998 2404 8577 28.0 403 1339 30.1 1905 7131 26.7 1999 2351 10473 22.4 1627 5862 27.8 2000 2682 11235 23.9 1653 6140 26.9
New Zealand WA Year Killed or Seriously
Injured
Injured Severe Injury Rate (%)
Killed or Seriously
Injured
Injured Severe Injury Rate (%)
1987 1988 1989 1990 1991 898 4021 22.3 202 2159 9.4 1992 778 4534 17.2 179 2509 7.1 1993 851 4571 18.6 196 2774 7.1 1994 913 5177 17.6 356 3652 9.7 1995 933 5848 16.0 690 4536 15.2 1996 1043 5556 18.8 713 5380 13.3 1997 1016 5302 19.2 954 6012 15.9 1998 1007 5264 19.1 1011 6413 15.8 1999 1155 5583 20.7 599 5738 10.4 2000 1118 5197 21.5 651 6262 10.4
4.2 Overview of the Analysis Methods: Aggressivity As described above, the measure of aggressivity to drivers of other cars (AO) being considered here is:
AO = RO x SO where
VEHICLE SAFETY RATINGS ESTIMATED FROM AUSTRALIAN AND NZ REAL CRASH DATA 25
RO = Injury risk of other drivers that is, the probability that the other driver sustains some injury given their vehicle is involved in a crash of tow-away severity or greater with the subject vehicle type, and
SO = Injury severity of other drivers where SO is the probability that the other driver is killed or seriously injured given they sustain some injury in the crash where their vehicle is impacted by a vehicle of the subject vehicle type. The subject vehicle, described by its make and model or market group, is the specific type of vehicle whose aggressivity is being measured in terms of its threat of injury to the driver of the other vehicle with which it impacts. Each of the two components of the aggressivity rating, RO and SO, were obtained by logistic regression modelling techniques. In the same manner as for the crashworthiness ratings, such techniques are able to simultaneously adjust for the effect of a number of factors, which will be discussed below, on the aggressivity injury risk and injury severity probabilities. 4.2.1 Logistic Models, Confidence Limits and Assessment of Aggressivity of Specific
Vehicle Models and Market Groups
A logistic model of the same form used for estimation of vehicle crashworthiness ratings was used for estimation of vehicle aggressivity ratings. The key difference in the logistic models for vehicle aggressivity was that the response variables being modelled were not the injury risk or injury severity of the driver of the focus vehicle, as for crashworthiness. Rather, the injury risk and injury severity of the driver of the other vehicle with which the focus vehicle model collided were modelled as the response variables. Given the similarity of the structure of the aggressivity injury risk, RO, and injury severity, SO, with their crashworthiness parallels, the method of computing confidence limits on each RO and SO was the same as given for the corresponding crashworthiness measures above. Before adjusted aggressivity ratings could be obtained it was necessary to consider logistic models of each of the aggressivity components, RO or SO separately, to identify possible factors, other than vehicle design, that might have influenced injury outcome to the other driver. As for crashworthiness rating estimation, a stepwise procedure was used to identify which factors had an important influence. This was done without considering the type of car (make/model or market group) in the model, as the aim was to determine which other factors were most likely to have an influence across a broad spectrum of crashes. Logistic models were obtained separately for injury risk, RO, and injury severity, SO, because it was likely that the various factors would have different levels of influence on these two component probabilities of the aggressivity measure. The factors considered in the covariate models for both aggressivity injury risk and injury severity were
• speedzone : speed limit at the crash location ( <80km/h, >= 80 km/h) • agefcd : age of driver of subject car (<=25 years, 26-59 years, >=60 years) • sexfcd : sex of driver of subject car
MONASH UNIVERSITY ACCIDENT RESEARCH CENTRE 26
• ageoo : other car driver age (<=25 years, 26-59 years, >=60 years) • sexoo : other car driver sex (male, female) • state : state or country in which the vehicle crashed (VIC, NSW, WA, QLD, NZ) • year : year in which the vehicle crashed (1987, ..,2000)
These variables were chosen for consideration because they were available in each of the New South Wales, Victorian, Western Australia, Queensland and New Zealand crash databases. Logistic regressions were again carried out using the Logistic Regression procedure of the SAS statistical package (SAS, 1989) using maximum likelihood estimation, the marginal method for forming design variables and a hierarchical structure considering all possible interactions in a stepwise procedure. Aggressivity injury risk and injury severity for individual vehicle models was estimated after adding a variable representing the subject car model to the respective logistic "covariate" models. The car model variable was forced into the logistic equation and individual car model coefficients were computed to represent deviations of that car from the average. In a similar manner to the calculation of crashworthiness ratings, car models were excluded for the calculation of the aggressivity ratings if there were less than 100 vehicles with which they had crashed or there were less than 20 injured drivers in other vehicles with which they had crashed. After exclusion, the regression analyses were performed on 212 individual car models for calculation of aggressivity ratings. The variable representing car model was therefore categorical with 212 nominal levels. The choice of the design for the logistic model allowed the injury risk and injury severity estimates for each individual car model to be compared with the overall (average) rating for all cars. For each car model in each aggressivity measure, a 95% confidence interval for the logit functions of aggressivity injury risk, and injury severity was obtained after first adjusting for the average value of the "covariate" model and then allowing for the deviation from average for that particular car model. Estimates of injury risk and injury severity were obtained by the reverse logistic transform. A 95% confidence interval was determined after adjusting for the average values of the significant factors and their interactions. Aggressivity by 8 broad market groups, as defined for crashworthiness ratings, was also computed along with 95% confidence limits.
The final combined aggressivity ratings for occupants of other vehicles are given by:
AO = RO x SO For a given model of focus car, j, the aggressivity rating, AO j , was therefore calculated as:
AO RO SOj j j= ×
where RO j denotes the aggressivity injury risk for car model j and SO j denotes the aggressivity
injury severity for car model j. Computation of the variance and hence confidence limits on the quantity AO are carried out in the same way as for the crashworthiness measure, C.
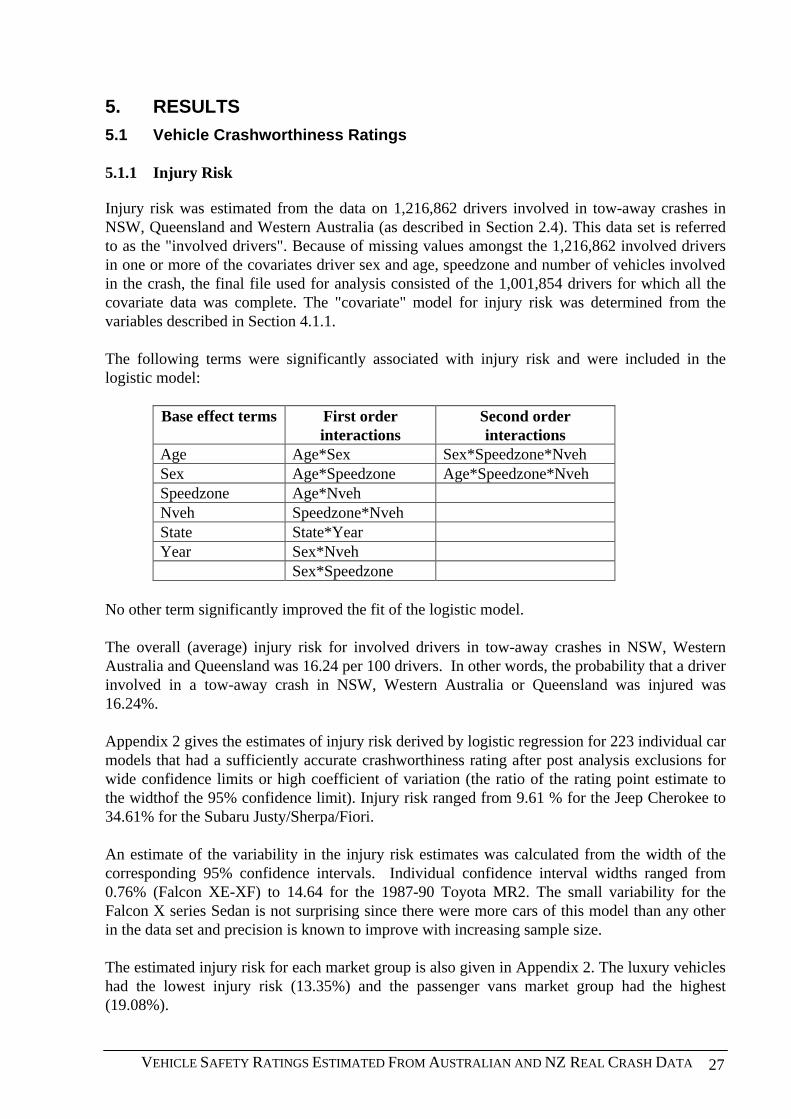
VEHICLE SAFETY RATINGS ESTIMATED FROM AUSTRALIAN AND NZ REAL CRASH DATA 27
5. RESULTS
5.1 Vehicle Crashworthiness Ratings 5.1.1 Injury Risk Injury risk was estimated from the data on 1,216,862 drivers involved in tow-away crashes in NSW, Queensland and Western Australia (as described in Section 2.4). This data set is referred to as the "involved drivers". Because of missing values amongst the 1,216,862 involved drivers in one or more of the covariates driver sex and age, speedzone and number of vehicles involved in the crash, the final file used for analysis consisted of the 1,001,854 drivers for which all the covariate data was complete. The "covariate" model for injury risk was determined from the variables described in Section 4.1.1. The following terms were significantly associated with injury risk and were included in the logistic model:
Base effect terms First order
interactions Second order interactions
Age Age*Sex Sex*Speedzone*Nveh Sex Age*Speedzone Age*Speedzone*Nveh Speedzone Age*Nveh Nveh Speedzone*Nveh State State*Year Year Sex*Nveh Sex*Speedzone
No other term significantly improved the fit of the logistic model. The overall (average) injury risk for involved drivers in tow-away crashes in NSW, Western Australia and Queensland was 16.24 per 100 drivers. In other words, the probability that a driver involved in a tow-away crash in NSW, Western Australia or Queensland was injured was 16.24%. Appendix 2 gives the estimates of injury risk derived by logistic regression for 223 individual car models that had a sufficiently accurate crashworthiness rating after post analysis exclusions for wide confidence limits or high coefficient of variation (the ratio of the rating point estimate to the widthof the 95% confidence limit). Injury risk ranged from 9.61 % for the Jeep Cherokee to 34.61% for the Subaru Justy/Sherpa/Fiori. An estimate of the variability in the injury risk estimates was calculated from the width of the corresponding 95% confidence intervals. Individual confidence interval widths ranged from 0.76% (Falcon XE-XF) to 14.64 for the 1987-90 Toyota MR2. The small variability for the Falcon X series Sedan is not surprising since there were more cars of this model than any other in the data set and precision is known to improve with increasing sample size. The estimated injury risk for each market group is also given in Appendix 2. The luxury vehicles had the lowest injury risk (13.35%) and the passenger vans market group had the highest (19.08%).
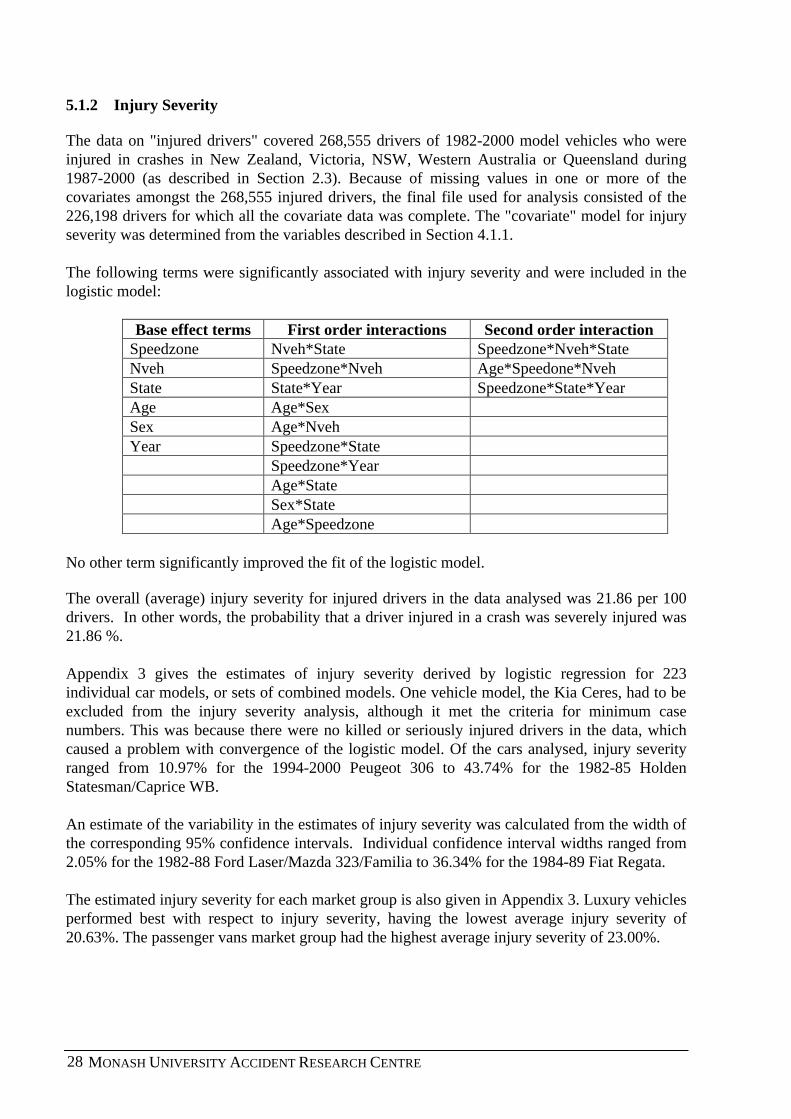
MONASH UNIVERSITY ACCIDENT RESEARCH CENTRE 28
5.1.2 Injury Severity The data on "injured drivers" covered 268,555 drivers of 1982-2000 model vehicles who were injured in crashes in New Zealand, Victoria, NSW, Western Australia or Queensland during 1987-2000 (as described in Section 2.3). Because of missing values in one or more of the covariates amongst the 268,555 injured drivers, the final file used for analysis consisted of the 226,198 drivers for which all the covariate data was complete. The "covariate" model for injury severity was determined from the variables described in Section 4.1.1. The following terms were significantly associated with injury severity and were included in the logistic model:
Base effect terms First order interactions Second order interaction Speedzone Nveh*State Speedzone*Nveh*State Nveh Speedzone*Nveh Age*Speedone*Nveh State State*Year Speedzone*State*Year Age Age*Sex Sex Age*Nveh Year Speedzone*State Speedzone*Year Age*State Sex*State Age*Speedzone
No other term significantly improved the fit of the logistic model. The overall (average) injury severity for injured drivers in the data analysed was 21.86 per 100 drivers. In other words, the probability that a driver injured in a crash was severely injured was 21.86 %. Appendix 3 gives the estimates of injury severity derived by logistic regression for 223 individual car models, or sets of combined models. One vehicle model, the Kia Ceres, had to be excluded from the injury severity analysis, although it met the criteria for minimum case numbers. This was because there were no killed or seriously injured drivers in the data, which caused a problem with convergence of the logistic model. Of the cars analysed, injury severity ranged from 10.97% for the 1994-2000 Peugeot 306 to 43.74% for the 1982-85 Holden Statesman/Caprice WB. An estimate of the variability in the estimates of injury severity was calculated from the width of the corresponding 95% confidence intervals. Individual confidence interval widths ranged from 2.05% for the 1982-88 Ford Laser/Mazda 323/Familia to 36.34% for the 1984-89 Fiat Regata. The estimated injury severity for each market group is also given in Appendix 3. Luxury vehicles performed best with respect to injury severity, having the lowest average injury severity of 20.63%. The passenger vans market group had the highest average injury severity of 23.00%.
VEHICLE SAFETY RATINGS ESTIMATED FROM AUSTRALIAN AND NZ REAL CRASH DATA 29
5.1.3 Crashworthiness Ratings
The crashworthiness ratings for each car model and market group were obtained by multiplying the individual injury risk and injury severity estimates. Because each of the two components had been adjusted for the confounding factors, the resultant crashworthiness rating was also adjusted for the influence of these factors. Crashworthiness ratings were obtained for each individual model and market group after adjusting for the confounding factors. Appendix 4 gives the crashworthiness ratings and the associated 95% confidence intervals for each of the 223 car models included in the analyses. Appendix 4 also gives the crashworthiness ratings with 90% confidence limits for each of the 223 vehicle models. Each rating is expressed as a percentage, representing the number of drivers killed or admitted to hospital per 100 drivers involved in a tow-away crash. Overall ratings for the market groups are also given. Each crashworthiness rating is an estimate of the true risk of a driver being killed or admitted to hospital in a tow-away crash and, as such, each estimate has a level of uncertainty about it. This uncertainty is indicated by the confidence limits in Appendix 4. There is 95% probability that the confidence interval will cover the true risk of serious injury (death or hospital admission) to the driver of the particular model of vehicle. The ratings in Appendix 4 exclude those models where: • the width of the confidence interval exceeded 7, or • the ratio of the confidence interval width to the rating score exceeded 1.6 (this criterion was
also necessary because smaller confidence intervals tended to occur for the lower rating scores, but the confidence intervals were relatively wide in proportionate terms). This exclusion criterion is more stringent than that used by Cameron et al (1994a,b) reflecting the greater accuracy afforded in the current ratings as a result of larger quantities of data.
5.1.4 Comparisons with the All Model Average Rating Based on the average injury risk and injury severity values in the data used to compute the ratings estimate, the average crashworthiness of all vehicles appearing in the data was 3.55% (3.55 serious driver injuries per 100 crash involvements). Computing the all model average in this way gives more weight to vehicles with greater representation in the crash data. Another way of computing the all model average rating is to simply take an un-weighted numerical average of the 223 vehicles with a sufficiently accurate crashworthiness rating to be published. This method gives equal weight to each vehicle in the average. For the 223 vehicles rated in this study, the un-weighted numerical average crashworthiness is 3.85 (3.85 serious driver injuries per 100 crash involvements). Ultimately the point against which ratings for individual vehicles are compared is arbitrary, whether it is either of the averages described above or some other point. For the purpose of comparing the crashworthiness ratings to an average value in this study, the un-weighted numerical average (3.85) was used. This was chosen as it gave better distribution of the vehicles into the five rating categories used for presentation of the ratings for consumer information (see Section 5.3). Any other comparison value could be used with equal legitimacy.
MONASH UNIVERSITY ACCIDENT RESEARCH CENTRE 30
Confidence limits were used to judge whether the true risk of death or hospitalisation for a driver of a specific model car involved in a tow-away crash is really different from the defined average for all models, ie. 3.85 per 100 involved drivers. An upper limit below the average is indicative of superior crashworthiness, whereas a lower limit above the average suggests inferior crashworthiness. Other models also have crashworthiness ratings at the low or high end of the scale, but their confidence limits overlap the all model average. Although such models may also have superior or inferior crashworthiness characteristics, the database did not contain sufficient numbers of these models for the data to represent scientific evidence that this is the case. In terms of statistical significance, it should be noted that classifying vehicles as having inferior or superior crashworthiness compared to the defined average means only that vehicle models with ‘superior’ crashworthiness have statistically significantly better crashworthiness than vehicles in the defined ‘inferior’ group. It is possible that vehicles within the inferior and superior crashworthiness categories also had statistically significant differences in crashworthiness. This could be assessed by examining overlap in the statistical confidence limits for any pair wise comparison of two vehicles. One of the main points in defining groups of vehicles with inferior and superior crashworthiness is to show that the analysis can differentiate with statistical precision crashworthiness between groups of vehicles within the rated vehicle population. Fifty-seven models had ratings representing evidence of superior crashworthiness because their upper confidence limits were less than the average rating. Twelve of these were large cars, sixteen were luxury models, eight were classified as medium cars, ten were four-wheel drives, six were commercial vehicles, 3 were small cars and there was one passenger van and one sports car. The specific models were (in order of estimated risk of serious driver injury in a crash, from lowest to highest):
• Saab 9000 (1986-98) • Peugeot 306 (1994-2000) • Toyota Corolla (1998-2000) • Land Rover Discovery (1991-2000) • Honda Integra (1993-2000) • Honda Legend (1986-95) • Jeep Cherokee (1982-2000) • Volvo 700/900 Series (1984-92) • Volkswagen Caravelle / Transporter (1988-2000) • Range Rover (1982-94) • Ford Falcon AU (1998-2000) • Holden Astra TR (1996-98) • Volvo 850/S70/V70/C70 (1992-2000) • Ford Mondeo (1995-2000) • Mercedes Benz E-Class W124 (1986-95) • BMW 5 Series (1982-88) • Toyota RAV4 (1994-2000) • Nissan Patrol / Ford Maverick (1988-97) • Mercedes Benz C-Class W202 (1995-2000) • BMW 5 Series (1989-95) • Honda Accord (1991-93)
VEHICLE SAFETY RATINGS ESTIMATED FROM AUSTRALIAN AND NZ REAL CRASH DATA 31
• Toyota Cressida / Mark II (1989-92) • Holden / Opel Vectra (1997-2000) • Peugeot 505 (1982-93) • Volvo 200 Series (1982-93) • Mitsubishi Pajero (1992-99) • Honda Accord (1986-90) • Ford Fairlane N & LTD D (1988-95) • Ford Falcon Ute (1996-99) • BMW 3 Series (1992-98) • Nissan Bluebird (1992-97) • Holden Jackaroo / Isuzu Bighorn (1982-91) • Holden Commodore VT/VX (1997-2000) • Mitsubishi Verada KR/KS / Magna TR/TS (1991-96) • Nissan Patrol (1982-87) • Nissan Navara (1992-98) • Toyota Previa / Estima (1991-99) • Holden Commodore VR/VS / Toyota Lexcen (1993-97) • Ford Falcon EF/EL (1994-98) • Toyota Landcruiser (1990-97) • Ford Fairlane N & LTD D (1996-2000) • Holden Rodeo (1996-98) • Ford Falcon EB Series II / Falcon ED (Apr 1992-94) • BMW 3 Series (1982-91) • Ford Falcon Panel Van (1982-95) • Ford Falcon EA / Falcon EB Series I (1988-Mar 92) • Subaru Legacy (1989-94) • Ford Telstar / Mazda 626 / Capella /MX6 (1988-92) • Mitsubishi Magna TE/TF/TH/TJ / Verada KE/KF/KH/KJ (1996-2000) • Holden Apollo JM / JP / Toyota Camry / Sceptor (1994-97) • Ford Telstar / Mazda 626 / Capella / MX6 / Cronos (1992-97) • Ford Falcon Ute / Nissan XFN Ute (1982-95 / 1988-90) • Holden Commodore VN/VP / Toyota Lexcen (1989-93 / 1989-93) • Ford Falcon XE/XF (1982-88) • Toyota 4Runner / Hilux (1990-97) • Mitsubishi Magna TM/TN/TP (1985-90) • Holden Apollo JK / JL / Toyota Camry / Vista (1990-93)
Forty-six models had ratings representing evidence of inferior crashworthiness because their lower confidence limits were greater than the average rating. Twenty-seven were small cars, seven were light commercial vehicles, three were passenger vans, three were medium cars, four were sports cars and two were four-wheel drives. The specific models were (in order of estimated risk of serious driver injury in a crash, from highest to lowest):
• Holden Scurry / Suzuki Carry (1982-2000) • Subaru 700 / Rex (1989-92) • Suzuki Mighty Boy (1985-88) • Daihatsu Mira (1990-98) • Suzuki Alto (1982-84) • Toyota MR2 (1985-89)
MONASH UNIVERSITY ACCIDENT RESEARCH CENTRE 32
• Nissan NX/NX-R (1993-95) • Daihatsu Handivan (1982-90) • Honda City (1984-89) • Daihatsu Charade (1982-87) • Holden Barina / Suzuki Swift / Cultus (1986-88) • Mitsubishi Starwagon / L300 (1983-86) • Nissan Exa (1983-86) • Subaru Brumby (1982-92) • Daihatsu Rocky / Rugger (1985-98) • Holden WFR Van (1992-98) • Honda Civic / Ballade / Shuttle (1986-88) • Honda CRX (1987-91) • Nissan Micra (1993-95) • Daihatsu Charade (1988-93) • Daihatsu Charade (1993-2000) • Ford Festiva WA / Mazda 121 (1987-94) • Hyundai Excel (1986-90) • Ford Festiva WD/WD/WH/WF (1994-2000) • Mitsubishi Cordia (1983-87) • Holden Astra / Nissan Pulsar / Langley (1983-86) • Mitsubishi Colt / Mirage (1982-88) • Holden Gemini RB (1986-89) • Toyota Hiace / Liteace (1982-86) • Suzuki Samurai / SJ410 / SJ413 (1982-1999) • Holden WB Series (1982-84) • Toyota Tarago (1985-90) • Holden Barina / Suzuki Swift (1989-2000) • Ford Laser / Mazda 323 / Familia (1982-89) • Hyundai Excel (1990-95) • Mitsubishi / Delica Starwagon (1987-93) • Honda Civic / Shuttle (1989-92) • Holden Camira (1982-89) • Holden Barina SB (1995-2000) • Holden / Isuzu Gemini (1982-84) • Nissan Bluebird (1983-88) • Toyota Corolla (1982-84) • Hyundai Accent (1995-2000) • Holden Astra / Nissan Sentra / Pulsar (1987-91) • Toyota Corolla (1986-88) • Subaru Omega / Leone / 4WD Wagon (1988-93)
5.1.6 Comparison of Crashworthiness Ratings with and Without New Zealand Data A key assessment required in adding new data sources to those previously existing to estimate vehicle safety ratings is how the additional data affects the estimated ratings. Ideally, addition of new data in estimating the ratings will not alter rating point estimates beyond the bounds of statistical confidence, but serve only to reduce confidence limit width. Any significant movement in the point estimates of vehicle safety would suggest either an incompatibility in the new crash data with the existing data or that the safety performance of particular vehicles in the New
VEHICLE SAFETY RATINGS ESTIMATED FROM AUSTRALIAN AND NZ REAL CRASH DATA 33
Zealand fleet is different to that of the same models in the Australian fleet. As well as assessing consistency, it is to also of interest to assess the benefits to the rating system of adding New Zealand data in terms of vehicle model coverage and average rating accuracy. To assess the impact of adding the New Zealand crash data to the vehicle safety ratings system, the ratings estimated with combined Australian and New Zealand crash data have been compared with those estimated from Australian data only for those vehicle models with ratings estimated from each data set. A number of aspects have been examined. These include the number of vehicle models with reliable ratings, the effect on the average confidence limit width and coefficient of variation and subsequently the number of vehicle models with ratings statistically significantly different from average. Comparison of coverage of the crashworthiness ratings based on Australian data only and Australian and New Zealand data shows addition of the New Zealand data allows ten additional vehicle models to have a reliable crashworthiness rating estimated. The New Zealand data increases the crashworthiness rating coverage from 213 to 223 vehicle models. The ten additional vehicle models rated are as follows. • Daihatsu Terios (1997-2000) • Audi A4 (1995-2000) • Mazda 626 (1998-2000) • Daihatsu Sirion (2000) • Fiat Regata (1984-88) • Ford Laser / Mazda 323 (1999-2000) • Peugeot 306 (1993-2000) • Mazda RX7 (1986-91) • Honda Integra (1993-2000) • Toyota MR2 (1985-89) As the New Zealand data is only used in estimation of the injury severity component of the crashworthiness rating, comparison of consistency and accuracy of the crashworthiness ratings with and without the New Zealand data is confined to the severity measure from here on. Figure 1 shows the crashworthiness rating injury severity measure computed with Australian data only plotted against that computed with both Australian and New Zealand data. It shows a high degree of consistency in the severity index calculated with and without the New Zealand data. This is indicated by the high degree of clustering of the data in Figure 1 about the 45-degree line of perfect ratings concordance shown on Figure 1. The correlation between the injury severity index calculated with and without New Zealand data was 0.95, further illustrating the high degree of consistency in the ratings.
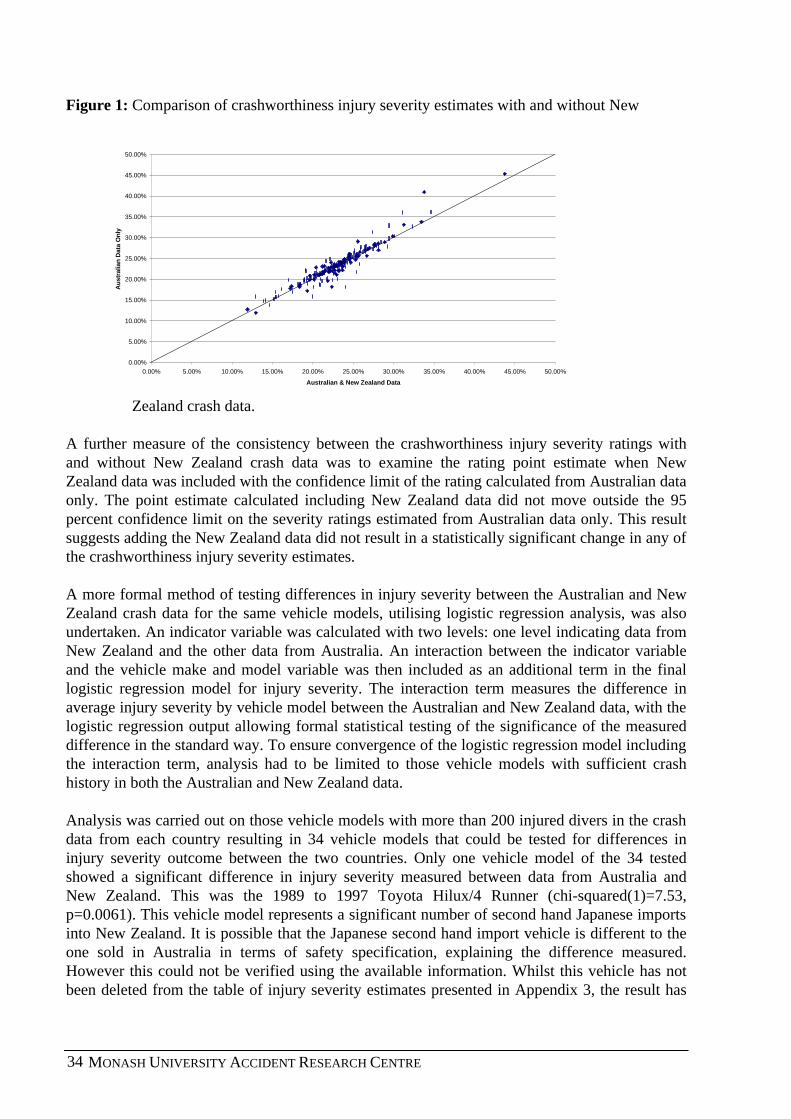
MONASH UNIVERSITY ACCIDENT RESEARCH CENTRE 34
Figure 1: Comparison of crashworthiness injury severity estimates with and without New
Zealand crash data.
A further measure of the consistency between the crashworthiness injury severity ratings with and without New Zealand crash data was to examine the rating point estimate when New Zealand data was included with the confidence limit of the rating calculated from Australian data only. The point estimate calculated including New Zealand data did not move outside the 95 percent confidence limit on the severity ratings estimated from Australian data only. This result suggests adding the New Zealand data did not result in a statistically significant change in any of the crashworthiness injury severity estimates. A more formal method of testing differences in injury severity between the Australian and New Zealand crash data for the same vehicle models, utilising logistic regression analysis, was also undertaken. An indicator variable was calculated with two levels: one level indicating data from New Zealand and the other data from Australia. An interaction between the indicator variable and the vehicle make and model variable was then included as an additional term in the final logistic regression model for injury severity. The interaction term measures the difference in average injury severity by vehicle model between the Australian and New Zealand data, with the logistic regression output allowing formal statistical testing of the significance of the measured difference in the standard way. To ensure convergence of the logistic regression model including the interaction term, analysis had to be limited to those vehicle models with sufficient crash history in both the Australian and New Zealand data. Analysis was carried out on those vehicle models with more than 200 injured divers in the crash data from each country resulting in 34 vehicle models that could be tested for differences in injury severity outcome between the two countries. Only one vehicle model of the 34 tested showed a significant difference in injury severity measured between data from Australia and New Zealand. This was the 1989 to 1997 Toyota Hilux/4 Runner (chi-squared(1)=7.53, p=0.0061). This vehicle model represents a significant number of second hand Japanese imports into New Zealand. It is possible that the Japanese second hand import vehicle is different to the one sold in Australia in terms of safety specification, explaining the difference measured. However this could not be verified using the available information. Whilst this vehicle has not been deleted from the table of injury severity estimates presented in Appendix 3, the result has
0.00%
5.00%
10.00%
15.00%
20.00%
25.00%
30.00%
35.00%
40.00%
45.00%
50.00%
0.00% 5.00% 10.00% 15.00% 20.00% 25.00% 30.00% 35.00% 40.00% 45.00% 50.00%
Australian & New Zealand Data
Au
stra
lian
Dat
a O
nly
VEHICLE SAFETY RATINGS ESTIMATED FROM AUSTRALIAN AND NZ REAL CRASH DATA 35
been flagged to indicate the New Zealand model may have a different safety performance to the Australian model. Two measures of the increase in accuracy of the injury severity component of the crashworthiness ratings, after addition of the New Zealand crash data, were examined. They are the narrowing of the average confidence limit width and the reduction in the average coefficient of variation on the ratings. The coefficient of variation is defined as the confidence limit width divided by the rating point estimate and represents a scale independent measure of rating accuracy. Addition of the New Zealand crash data to the ratings system resulted in a reduction in average crashworthiness injury severity confidence limit width from 12.8 to 11.7 deaths or serious injuries per 100 injured drivers, a reduction of 8 percent. Similarly, the average coefficient of variation in the severity index reduced from .57 to .53, a reduction of 7 percent. As observed, both the average confidence limit width and coefficient of variation on the crashworthiness severity index reduced when New Zealand crash data was added. There was also increased model coverage resulting from addition of the New Zealand crash data. Consequently, it was expected that the number of vehicle models with crashworthiness ratings statistically significantly different from average would increase. This was the case with 57 and 46 vehicle models having a crashworthiness rating statistically significantly better (numerically lower) and worse (numerically higher) respectively than the overall average. This compares with 51 and 44 vehicle models respectively in the crashworthiness ratings based on Australian data only.
5.2 Aggressivity Towards Other Car Drivers Using the methods described above, logistic regression models of the injury risk and injury severity of the subject driver (ie. the driver of the “other” vehicle) were built separately as functions of both vehicle model and market group of the vehicle colliding with the vehicle of the focus driver. Variations in the other factors listed in Section 4.2.1 were adjusted in the model by including them as predictors of the injury risk or injury severity of the focus driver, along with the subject vehicle model or market group. The logistic regression models of the injury risk of focus drivers showed a number of factors to statistically significantly predict injury risk. These were year of crash, along with the interactions between focus driver age and state, focus driver sex and state, speedzone and state, state and year of crash and focus driver age, sex and state. In addition, the make and model of the subject vehicle was also a statistically significant predictor of focus driver injury risk when added to the logistic model. This indicated that there is differential performance between vehicle models in terms of their aggressivity towards drivers of other vehicles so far as injury risk is concerned. In the same manner, when vehicle market group was substituted for vehicle model in the logistic regression equation, it was also a significant predictor of focus driver injury risk. The average aggressivity injury risk in the data was 14.65%. The logistic regression models of the injury severity of focus drivers showed a number of factors to be statistically significant. They were focus driver age, sex, state, speedzone and year, along with the interactions between focus driver age and state, state and year of crash, speed zone and state, focus driver sex and state and focus driver age and sex. The model of the subject vehicle was also a statistically significant predictor of injury severity, as was the vehicle market group when substituted for vehicle model in the logistic regression equation. The average aggressivity injury severity in the data was 16.81%.
MONASH UNIVERSITY ACCIDENT RESEARCH CENTRE 36
Final estimates of vehicle aggressivity towards the drivers of other vehicles were obtained by multiplying the estimated injury risk and injury severity components, described above, for each vehicle. Confidence limits on each of the estimated aggressivity ratings were calculated using the methods described in Section 4.2.1 above. The average aggressivity rating in the data, used for comparisons against aggressivity of individual vehicle models was 2.46%. Accurate aggressivity ratings were obtained for 165 of the 212 different vehicle models that satisfied the inclusion criteria described above. Of the 212 vehicle models satisfying the inclusion criteria for analysis described above, 47 vehicle models were excluded from presentation because of the criteria described immediately below. The estimated aggressivity ratings and their injury risk and injury severity components for individual vehicle models are given in Appendix 5 along with 95% confidence limits on the estimated aggressivity ratings. The ratings in Appendix 5 exclude those models where: • the width of the confidence interval exceeded 7, or • the ratio of the confidence interval width to the rating score exceeded 1.6 (this criterion was
also necessary because smaller confidence intervals tended to occur for the lower rating scores, but the confidence intervals were relatively wide in proportionate terms).
• But not those satisfying the above criteria where the aggressivity rating confidence interval
did not overlap the average aggressivity value (only one vehicle model fell into this category and had an aggressivity rating statistically significantly worse than the overall average).
These exclusion criteria, apart from the third one, are the same as that used in calculating crashworthiness ratings to ensure a minimum level of accuracy in the published aggressivity ratings. The third criterion was introduced as it allowed identification of vehicle models with aggressivity significantly worse than average, even though the confidence limits may be wide. It was considered to be worth identifying such vehicles. 5.2.1 Analysis by Market Groups Table 6 summarises the estimated injury risk, injury severity and aggressivity ratings by the 8 broad market groups along with the estimated confidence limits on the aggressivity ratings. The estimated aggressivity rating is the expected number of vehicle drivers killed or seriously injured per 100 involved in two-car tow-away collisions where their vehicle impacts with one of the designated models or market groups. Table 6 shows four-wheel-drive vehicles to be the most aggressive towards drivers of other vehicles, with an average of 3.42 drivers being killed or seriously injured for every 100 tow-away crashes with a four-wheel-drive. Similarly, Table 6 shows small cars to be the least aggressive towards drivers of other vehicles, with an average aggressivity rating of 1.86.
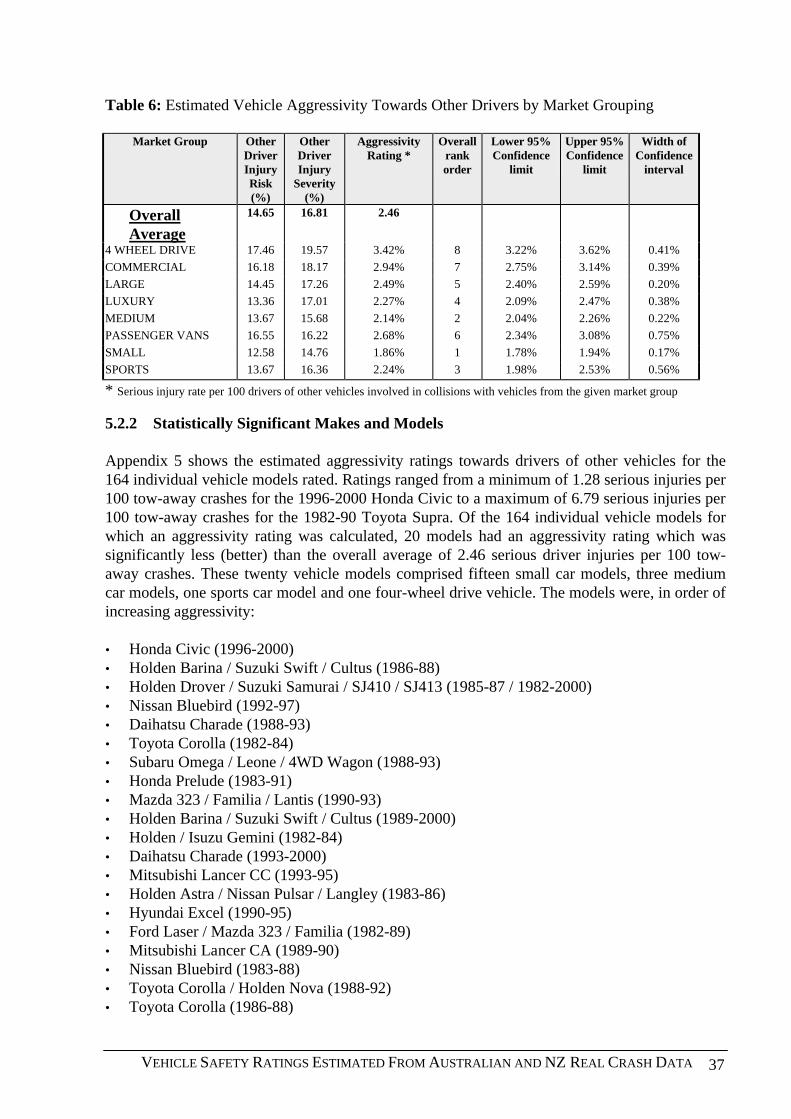
VEHICLE SAFETY RATINGS ESTIMATED FROM AUSTRALIAN AND NZ REAL CRASH DATA 37
Table 6: Estimated Vehicle Aggressivity Towards Other Drivers by Market Grouping
Market Group Other Driver Injury Risk (%)
Other Driver Injury
Severity (%)
Aggressivity Rating *
Overall rank order
Lower 95% Confidence
limit
Upper 95% Confidence
limit
Width of Confidence
interval
Overall Average
14.65 16.81 2.46
4 WHEEL DRIVE 17.46 19.57 3.42% 8 3.22% 3.62% 0.41%
COMMERCIAL 16.18 18.17 2.94% 7 2.75% 3.14% 0.39%
LARGE 14.45 17.26 2.49% 5 2.40% 2.59% 0.20%
LUXURY 13.36 17.01 2.27% 4 2.09% 2.47% 0.38%
MEDIUM 13.67 15.68 2.14% 2 2.04% 2.26% 0.22%
PASSENGER VANS 16.55 16.22 2.68% 6 2.34% 3.08% 0.75%
SMALL 12.58 14.76 1.86% 1 1.78% 1.94% 0.17%
SPORTS 13.67 16.36 2.24% 3 1.98% 2.53% 0.56%
* Serious injury rate per 100 drivers of other vehicles involved in collisions with vehicles from the given market group
5.2.2 Statistically Significant Makes and Models Appendix 5 shows the estimated aggressivity ratings towards drivers of other vehicles for the 164 individual vehicle models rated. Ratings ranged from a minimum of 1.28 serious injuries per 100 tow-away crashes for the 1996-2000 Honda Civic to a maximum of 6.79 serious injuries per 100 tow-away crashes for the 1982-90 Toyota Supra. Of the 164 individual vehicle models for which an aggressivity rating was calculated, 20 models had an aggressivity rating which was significantly less (better) than the overall average of 2.46 serious driver injuries per 100 tow-away crashes. These twenty vehicle models comprised fifteen small car models, three medium car models, one sports car model and one four-wheel drive vehicle. The models were, in order of increasing aggressivity: • Honda Civic (1996-2000) • Holden Barina / Suzuki Swift / Cultus (1986-88) • Holden Drover / Suzuki Samurai / SJ410 / SJ413 (1985-87 / 1982-2000) • Nissan Bluebird (1992-97) • Daihatsu Charade (1988-93) • Toyota Corolla (1982-84) • Subaru Omega / Leone / 4WD Wagon (1988-93) • Honda Prelude (1983-91) • Mazda 323 / Familia / Lantis (1990-93) • Holden Barina / Suzuki Swift / Cultus (1989-2000) • Holden / Isuzu Gemini (1982-84) • Daihatsu Charade (1993-2000) • Mitsubishi Lancer CC (1993-95) • Holden Astra / Nissan Pulsar / Langley (1983-86) • Hyundai Excel (1990-95) • Ford Laser / Mazda 323 / Familia (1982-89) • Mitsubishi Lancer CA (1989-90) • Nissan Bluebird (1983-88) • Toyota Corolla / Holden Nova (1988-92) • Toyota Corolla (1986-88)
MONASH UNIVERSITY ACCIDENT RESEARCH CENTRE 38
Similarly 38 models had an aggressivity rating which was significantly greater (worse) than the overall average of 2.46 serious driver injuries per 100 tow away crashes. These thirty-eight vehicle models comprised five large car models, fourteen four-wheel drives models, ten commercial vehicle models, one medium car model, one passenger van model, two small car models, three sports car models and two luxury car models. The models were, in order of decreasing aggressivity:
• Nissan NX/NX-R (1993-95) • Toyota Supra (1986-92) • Ford F-Series (1982-92) • Nissan Patrol (1999-2000) • Nissan Pathfinder / Terrano (1996-2000) • Nissan Exa (1983-86) • Toyota Landcruiser (1982-89) • Volkswagon Caravelle / Transporter (1997-2000) • Toyota Landcruiser (1990-97) • Land Rover Range Rover (1982-94) • Toyota Landcruiser (1998-2000) • Nissan Patrol (1982-87) • Isuzu Pickup (1984-88) • Holden Jackaroo / Isuzu Bighorn (1982-91) • Holden Rodeo / Isuzu Pickup (1989-95) • Volvo 850/S70/V70/C70 (1993-2000) • Nissan Patrol / Ford Maverick (1988-98) • Mitsubishi Pajero (1984-91) • Toyota 4Runner / Hilux (1982-85) • Ford Falcon Ute (1994-99) • Toyota Hiace / Liteace (1987-92) • Mitsubishi Pajero (1992-99) • Toyota Crown / Cressida / Mark II (1982-85) • Mitsubishi Starwagon / L300 (1983-86) • Holden Commodore Ute VR/VS (1994-2000) • Ford Falcon EB Series II / Falcon ED Apr (1992-94) • Ford Laser (1995-97) • Toyota Hiace / Liteace (1982-86) • Mitsubishi Cordia (1983-87) • Ford Falcon Ute / Nissan XFN Ute (1985-93) • Toyota 4Runner / Hilux (1990-97) • Toyota 4Runner/Hilux (1985-89) • Toyota Hiace / Liteace (1990-2000) • Ford Falcon EA / Falcon EB Series I(1988-Mar 92) • Nissan Bluebird (1989-92) • Ford Falcon XE/XF (1982-88) • Holden Commodore VB-VL (1982-88) • Ford Falcon EF/EL (1994-98)
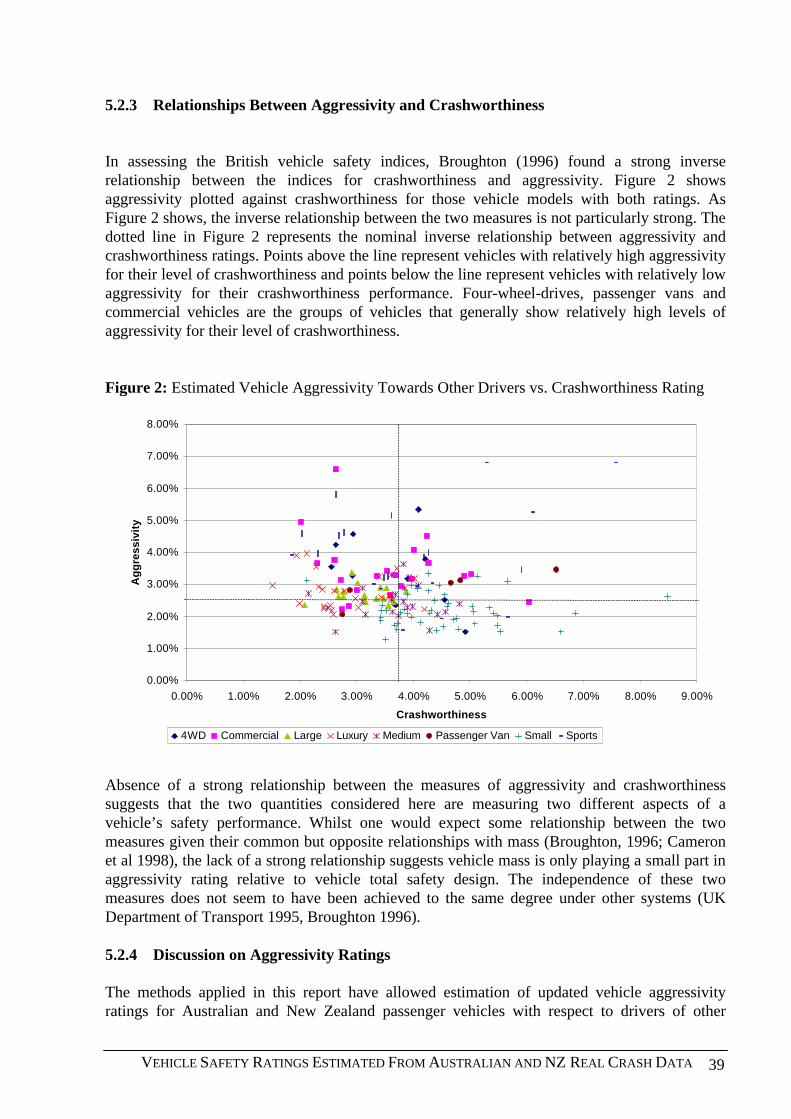
VEHICLE SAFETY RATINGS ESTIMATED FROM AUSTRALIAN AND NZ REAL CRASH DATA 39
5.2.3 Relationships Between Aggressivity and Crashworthiness In assessing the British vehicle safety indices, Broughton (1996) found a strong inverse relationship between the indices for crashworthiness and aggressivity. Figure 2 shows aggressivity plotted against crashworthiness for those vehicle models with both ratings. As Figure 2 shows, the inverse relationship between the two measures is not particularly strong. The dotted line in Figure 2 represents the nominal inverse relationship between aggressivity and crashworthiness ratings. Points above the line represent vehicles with relatively high aggressivity for their level of crashworthiness and points below the line represent vehicles with relatively low aggressivity for their crashworthiness performance. Four-wheel-drives, passenger vans and commercial vehicles are the groups of vehicles that generally show relatively high levels of aggressivity for their level of crashworthiness. Figure 2: Estimated Vehicle Aggressivity Towards Other Drivers vs. Crashworthiness Rating
0.00%
1.00%
2.00%
3.00%
4.00%
5.00%
6.00%
7.00%
8.00%
0.00% 1.00% 2.00% 3.00% 4.00% 5.00% 6.00% 7.00% 8.00% 9.00%
Crashworthiness
Ag
gre
ssiv
ity
4WD Commercial Large Luxury Medium Passenger Van Small Sports
Absence of a strong relationship between the measures of aggressivity and crashworthiness suggests that the two quantities considered here are measuring two different aspects of a vehicle’s safety performance. Whilst one would expect some relationship between the two measures given their common but opposite relationships with mass (Broughton, 1996; Cameron et al 1998), the lack of a strong relationship suggests vehicle mass is only playing a small part in aggressivity rating relative to vehicle total safety design. The independence of these two measures does not seem to have been achieved to the same degree under other systems (UK Department of Transport 1995, Broughton 1996). 5.2.4 Discussion on Aggressivity Ratings The methods applied in this report have allowed estimation of updated vehicle aggressivity ratings for Australian and New Zealand passenger vehicles with respect to drivers of other
MONASH UNIVERSITY ACCIDENT RESEARCH CENTRE 40
vehicles based on crash data from both countries. Aggressivity is an important measure as, in conjunction with crashworthiness ratings, it enables assessment of the total safety of the vehicle fleet from the perspective of the vehicle protecting not only its own occupants in a crash but also the occupants of other vehicles with which it may collide. Whilst similar in concept to the aggressivity ratings developed overseas, the ratings estimated here appear to be superior in a number of areas. One of the major advantages of the aggressivity ratings developed here, particularly in comparison to those described in Broughton (1994, 1996) is their apparent independence from the crashworthiness ratings. A high level of inverse correlation between crashworthiness and aggressivity ratings would diminish the additional information on safety provided by the aggressivity measure. The aggressivity ratings developed here, however, appear to provide largely independent information on vehicle safety. The reason for the independence of the two measures found in this study is possibly linked to the availability of non-injury crash data due to the tow-away crash reporting criteria in NSW, Western Australia and Queensland. Non-injury crash data allows the estimation of the injury risk components of crashworthiness and aggressivity, a measure not available from the data on injury crashes only, as used by Broughton (1994, 1996). Detailed examination of the crashworthiness and aggressivity analysis results here shows the injury risk measure to be a more powerful discriminator of relative vehicle safety than the injury severity measure based on injury crash data alone. A slight drawback aggressivity ratings have in comparison to the crashworthiness ratings is that they cover fewer individual vehicle models. Aggressivity ratings estimated here cover only 165 vehicle models, whilst crashworthiness ratings based on the same data cover 223 individual vehicle models. The reason for the reduced model coverage in comparison to crashworthiness ratings stems from the fact that the aggressivity ratings, for reasons described above, are calculated from subsets of the total data used for crashworthiness calculation, namely crashes between two passenger vehicles. To a certain degree, smaller quantities of data also compromise the precision of the aggressivity measures resulting in fewer vehicles that can be differentiated as better or worse than the overall average in comparison to crashworthiness ratings. In comparison to the crashworthiness ratings where 103 of the 223 vehicle models rated (46%) were significantly better or worse than average, of the 164 vehicle models with an aggressivity rating, only 58 (35%) had a rating significantly better or worse than average. This is a substantial improvement over the original ratings for Australian vehicles of Cameron et al (1998) where only 11 of the 56 vehicles rated for aggressivity towards other drivers (20%) had a rating significantly better or worse than average. It also improves on the ratings of Newstead et al (2000) where only 23 of the 96 vehicles rated for aggressivity towards other drivers (24%) had a rating significantly better or worse than average. As with crashworthiness ratings, there is an ongoing need for further updates of the aggressivity ratings with additional years’ data, as it becomes available. This will enable a greater number of individual vehicle models to be covered with increased accuracy of estimation, thus allowing greater differentiation of safety performance between vehicle models. Updates of aggressivity ratings can parallel those of crashworthiness ratings that are estimated from the same data.
This report has considered only the measure of aggressivity towards drivers of other vehicles. Whilst a measure of aggressivity towards unprotected road users has been developed and estimated in previous work, it was not used here because it was based only on an injury severity index that was felt not to offer sufficient discrimination between the performances of different
VEHICLE SAFETY RATINGS ESTIMATED FROM AUSTRALIAN AND NZ REAL CRASH DATA 41
vehicle models. It may be possible to develop an aggressivity severity index that estimates simultaneously the combined aggressivity of a vehicle towards both unprotected road users and the drivers of other vehicles. Combined with the aggressivity injury risk measure for drivers of other vehicles only, this would give a single aggressivity measure for a vehicle towards both drivers of other vehicles and unprotected road users. Further research is planned to develop this combined measure of aggressivity towards all other road users.
5.2.5 Comparison of Aggressivity Ratings with and Without New Zealand Data As was carried out for the crashworthiness ratings above, the benefits of including New Zealand crash data for estimation of vehicle aggressivity ratings in terms of vehicle model coverage and ratings accuracy has been assessed. As before, rating accuracy has been measured in terms of average confidence limit width and average coefficient of variation. Comparison of coverage of the aggressivity ratings based on Australian data only and Australian and New Zealand data shows addition of the New Zealand data allows ten additional vehicle models to have a reliable aggressivity rating estimated. The New Zealand data increases the crashworthiness rating coverage from 152 to 164 vehicle models. This coverage increase is a result of thirteen extra vehicle models being rated whilst one vehicle model was removed because the coefficient of variation no longer met the defined criteria for acceptable accuracy. It should be noted that the coefficient of variation for a vehicle model would not necessarily decrease with the addition of extra crash data because it is a function of the point estimate of the severity index, which may increase. In contrast, the confidence limit width will almost always decrease with the addition of crash data. The thirteen additional vehicle models rated are as follows. • Daihatsu Rocky / Rugger (1985-98) • Holden Jackaroo / Isuzu Bighorn (1992-98) • Lada Niva (1984-99) • BMW 5 series (1989-95) • Jaguar XJ6 (1987-94) • Mercedes Benz C-Class W202 (1994-2000) • Nissan Maxima (1991-94) • Saab 9000 (1986-98) • Mitsubishi Chariot / Spacewagon (1985-91) • Nissan Stanza (1982-83) • Nissan Silvia (1984-86) • Nissan Bluebird (1992-97) • Subaru 700 / Rex (1989-92) The vehicle model that no longer met the accuracy criteria was as follows. • Jeep Cherokee (1996-00) For the same reasons as given when comparing accuracy of the crashworthiness ratings, comparison of consistency and accuracy of the aggressivity ratings with and without the New Zealand data is confined to the severity measure from here on. Figure 3 shows the aggressivity
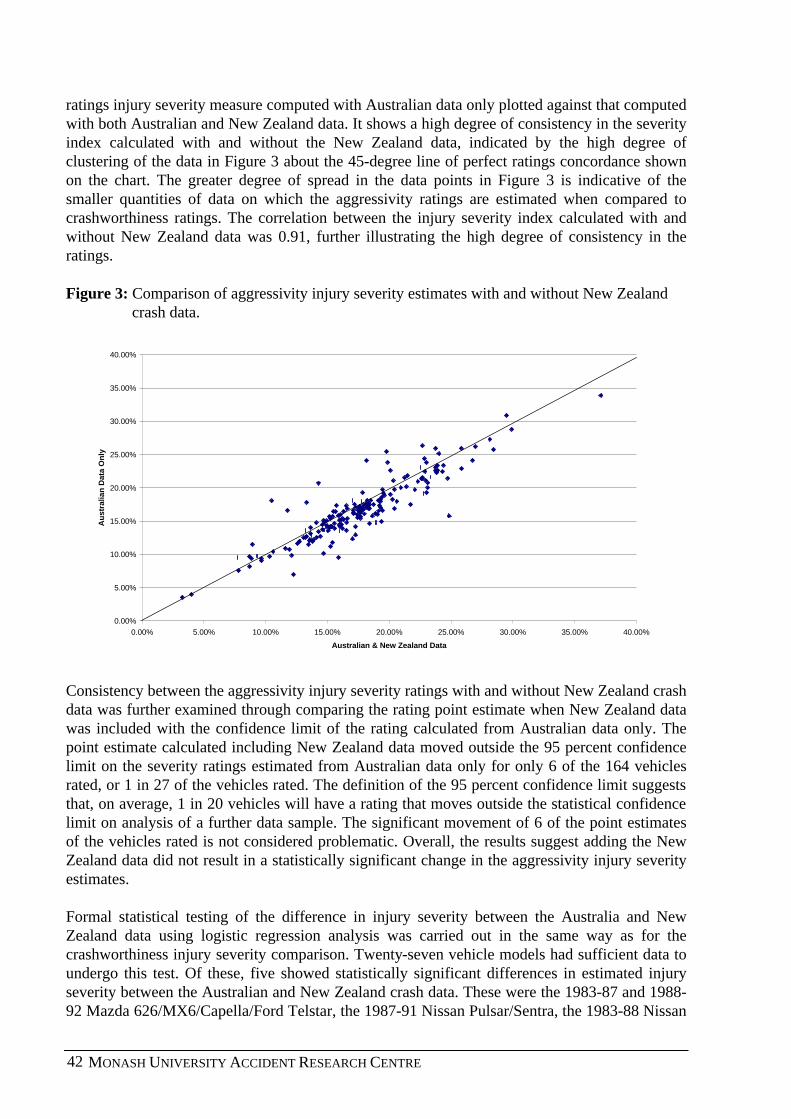
MONASH UNIVERSITY ACCIDENT RESEARCH CENTRE 42
ratings injury severity measure computed with Australian data only plotted against that computed with both Australian and New Zealand data. It shows a high degree of consistency in the severity index calculated with and without the New Zealand data, indicated by the high degree of clustering of the data in Figure 3 about the 45-degree line of perfect ratings concordance shown on the chart. The greater degree of spread in the data points in Figure 3 is indicative of the smaller quantities of data on which the aggressivity ratings are estimated when compared to crashworthiness ratings. The correlation between the injury severity index calculated with and without New Zealand data was 0.91, further illustrating the high degree of consistency in the ratings. Figure 3: Comparison of aggressivity injury severity estimates with and without New Zealand
crash data.
Consistency between the aggressivity injury severity ratings with and without New Zealand crash data was further examined through comparing the rating point estimate when New Zealand data was included with the confidence limit of the rating calculated from Australian data only. The point estimate calculated including New Zealand data moved outside the 95 percent confidence limit on the severity ratings estimated from Australian data only for only 6 of the 164 vehicles rated, or 1 in 27 of the vehicles rated. The definition of the 95 percent confidence limit suggests that, on average, 1 in 20 vehicles will have a rating that moves outside the statistical confidence limit on analysis of a further data sample. The significant movement of 6 of the point estimates of the vehicles rated is not considered problematic. Overall, the results suggest adding the New Zealand data did not result in a statistically significant change in the aggressivity injury severity estimates. Formal statistical testing of the difference in injury severity between the Australia and New Zealand data using logistic regression analysis was carried out in the same way as for the crashworthiness injury severity comparison. Twenty-seven vehicle models had sufficient data to undergo this test. Of these, five showed statistically significant differences in estimated injury severity between the Australian and New Zealand crash data. These were the 1983-87 and 1988-92 Mazda 626/MX6/Capella/Ford Telstar, the 1987-91 Nissan Pulsar/Sentra, the 1983-88 Nissan
0.00%
5.00%
10.00%
15.00%
20.00%
25.00%
30.00%
35.00%
40.00%
0.00% 5.00% 10.00% 15.00% 20.00% 25.00% 30.00% 35.00% 40.00%
Australian & New Zealand Data
Au
stra
lian
Dat
a O
nly
VEHICLE SAFETY RATINGS ESTIMATED FROM AUSTRALIAN AND NZ REAL CRASH DATA 43
Bluebird and the 1988-92 Toyota Corolla. All of these vehicles are again imported to New Zealand second hand from Japan in large numbers with the Japanese specification vehicle possibly being different to the Australian specification vehicle. It is interesting to note that none of these five vehicles showed a significant difference in crashworthiness injury severity between the two countries even though they were all assessed. This suggests that the differences between the Japanese and Australian specification vehicles are external and hence only affect aggressivity rather than crashworthiness or, more likely, that the result is a statistical aberration due to the smaller quantities of data from which aggressivity is estimated. Again, these vehicle models have been flagged in the aggressivity injury severity ratings presented in Appendix 5 as possibly having different safety performance in New Zealand compared to Australia. Measures of the increase in accuracy of the injury severity component of the aggressivity ratings upon addition of the New Zealand crash data are again the narrowing of the average confidence limit width and the reduction in the average coefficient of variation on the ratings. Addition of the New Zealand crash data to the ratings system resulted in a reduction in average aggressivity injury severity confidence limit width from 15.8 to 14.7 deaths or serious injuries per 100 injured drivers, a reduction of 7 percent. Similarly, the average coefficient of variation in the severity index reduced from 1.0 to .90, a reduction of 10 percent. Including New Zealand data in the analysis, 20 and 38 vehicle models had an aggressivity rating statistically significantly better (numerically lower) and worse (numerically higher) respectively than the overall average. This compares with 22 and 26 vehicle models respectively in the aggressivity ratings based on Australian data only.
5.3 Presentation of Crashworthiness and Aggressivity Ratings for Consumer Information
Discussion in the previous work of Cameron et al (1998) noted, for simplicity of presentation and interpretation, particularly in the area of consumer safety advice, effort needed to be made to find a method of simultaneously using the information on vehicle crashworthiness and aggressivity. Possible solutions discussed included development of a single measure of total vehicle safety or, alternatively, development of some other cohesive method of summary presentation that reflects overall vehicle safety. In Newstead et al (2000), a method of presentation of the estimated crashworthiness ratings for Australian vehicles was devised that is similar in philosophy to the presentation method devised by Folksam Insurance for presentation of Swedish ratings. The method takes into account both the rating point estimate and confidence limits, but removes the emphasis from the point estimate. An identical approach to presenting ratings has been taken here. Rated vehicles have been classified into five categories based on the range in which the confidence limits on the estimated ratings lie. The five categories are defined as follows. • At least 20% safer than average: if the upper confidence limit on the estimated rating is less
than 0.8 times the average crashworthiness rating for the vehicle fleet. • At least safer than average: if the upper confidence limit on the estimated rating is less than
the average crashworthiness rating for the vehicle fleet. • Average: if the confidence interval on the estimated rating overlaps the average
crashworthiness rating for the vehicle fleet. • At least less safe than average: if the lower confidence limit on the estimated rating is greater
than the average crashworthiness rating for the vehicle fleet.
MONASH UNIVERSITY ACCIDENT RESEARCH CENTRE 44
• At least 20% less safe than average: if the lower confidence limit on the estimated rating is greater than 1.2 times the average crashworthiness rating for the vehicle fleet.
Presentation of the estimated crashworthiness ratings in this way is shown in Appendix 6. This presentation style has the advantage that it combines information about both the rating point estimate and confidence limit to classify the safety performance of the vehicle. This method of presentation takes the potential emphasis of the consumer off comparison of only the point estimate ratings, an emphasis that can be potentially misleading from the point of view of statistical confidence. Rather, the presentation method categorises vehicles according to the statistical significance of the difference of their estimated safety rating from defined points. Colour coding of the categories would typically be used with green depicting the safest category through blue, yellow and brown to red depicting the least safe category. 90% two-sided confidence limits have been used to categorise the crashworthiness ratings in Appendix 6. These are equivalent to 95% one-sided confidence limits if a directional hypothesis of crashworthiness greater or less than the average is being assumed. A single column at the right of the table in Appendix 6 summarises the aggressivity ratings for each vehicle. In a manner similar to the classification of crashworthiness ratings, the estimated aggressivity ratings have been classified into five categories with each represented by a symbol in the final column of the table. These are: • xx: Much more aggressive than average – if the lower confidence limit on the estimated
rating is less than 0.8 times the average aggressivity rating for the vehicle fleet. • x: More aggressive than average - if the lower confidence limit on the estimated aggressivity
rating is greater than the average aggressivity rating for the vehicle fleet. • o: Average - if the confidence interval on the estimated rating overlaps the average
aggressivity rating for the vehicle fleet. • ü: Less aggressive than average - if the upper confidence limit on the estimated rating is less
than the average aggressivity rating for the vehicle fleet. • üü: At least 20% less aggressive than average – if the upper confidence limit on the
estimated rating is greater than 1.2 times the average aggressivity rating for the vehicle fleet. Some vehicle models in Appendix 6 have no symbol in the aggressivity rating column. These vehicles have been involved in an insufficient number of two-car crashes to have an aggressivity rating estimated for them. Assignment of vehicle aggressivity ratings to categories in Appendix 6 is based on the 90% two-sided (95% one-sided) confidence limits on the ratings to be consistent with the assignment of crashworthiness ratings to categories.
6. CONCLUSIONS Stages 1 to 4 of the New Zealand vehicle safety ratings pilot study established the availability and suitability of New Zealand crash and registration data sources for estimating vehicle safety ratings using combined Australian and New Zealand crash data. They also confirmed the sufficient compatibility of the Australian and New Zealand vehicle fleets ensuring ratings based on the combined data will be of use to the New Zealand vehicle consumer population. Analysis presented in this report has been successful in realising the final stage of the pilot study in producing a set of vehicle safety ratings for New Zealand passenger vehicles based on combined Australian and New Zealand mass crash data sources suitable for publishing as consumer information. The study also demonstrated the consistency of ratings estimated from combined
VEHICLE SAFETY RATINGS ESTIMATED FROM AUSTRALIAN AND NZ REAL CRASH DATA 45
Australian and New Zealand data with those estimated from Australian data only as well as quantifying the improvement in the ratings resulting from addition of the New Zealand data. Addition of the New Zealand crash data to that used to calculate the Australian ratings has enabled the crashworthiness ratings to be obtained for 223 different vehicle models manufactured between 1982 and 2000. This is an increase of 10 vehicle models over the number rated using Australian data alone. The rating scores estimate the risk of a driver being killed or admitted to hospital when involved in a tow-away crash, to a degree of accuracy represented by the confidence limits of the rating in each case. The estimates and their associated confidence limits are sufficiently sensitive that they are able to identify 103 models of passenger cars, four-wheel drive vehicles, passenger vans and light commercial vehicles that have superior or inferior crashworthiness characteristics compared with the average vehicle. This compares to only 95 vehicle models based on Australian data only. Further more, addition of the New Zealand crash data has reduced the average confidence limit width of the crashworthiness injury severity estimates by 8 percent and the average coefficient of variation by 7 percent. Addition of the New Zealand crash data also resulted in estimates of vehicle aggressivity ratings towards drivers of other passenger vehicles for individual makes and models with both broader coverage and higher accuracy than obtained using Australian data alone. The aggressivity ratings measure the risk of serious injury a vehicle poses to drivers of other cars with which it impacts in crashes of tow-away or greater severity. Aggressivity ratings calculated from combined Australian and New Zealand data covered 164 models of passenger vehicles (passenger cars, four-wheel drive vehicles, passenger vans and light commercial vehicles) manufactured between the years 1982-2000. This is an increase of 12 vehicle models from those covered using Australian data only. The estimates and their associated confidence limits are sufficiently sensitive that they are able to identify 58 models of passenger cars, four-wheel drive vehicles, passenger vans and light commercial vehicles that have superior or inferior aggressivity characteristics compared with the average vehicle. This is an increase of 10 vehicle models over the ratings using only Australian data. Addition of the New Zealand data to compute vehicle aggressivity ratings resulted in a average decrease of 7 percent and 10 percent in the aggressivity injury severity confidence limit widths and coefficient of variation respectively. Estimated vehicle aggressivity towards drivers of other vehicles was found to have a proportional relationship with vehicle mass. It was also found to have little or no relationship with ratings of vehicle crashworthiness, demonstrating the independence of the two complementary measures. Recommendations for further vehicle safety research using the assembled New Zealand crash data follow.
7. FURTHER RESEARCH RECOMMENDED
7.1 Integration of Australian and New Zealand Crashworthiness and Aggressivity Ratings Systems
The focus of the research presented in this report has been to develop a vehicle safety ratings system for New Zealand Passenger vehicles as an adjunct to the main Australian system. The successful completion of the pilot study has established the suitability of the New Zealand data
MONASH UNIVERSITY ACCIDENT RESEARCH CENTRE 46
for computing vehicle safety ratings in conjunction with the Australian. Importantly, it has also established the high degree of compatibility between ratings with and without the New Zealand crash data. These results confirm that vehicle models rated in the system have the same safety performance in the forms sold in Australia and New Zealand, a point assumed in pooling the crash data for each model rated in the system. It also confirms that crash data in New Zealand is representing the same levels of injury outcome in crashes involving these vehicle models as represented in the Australian data. As a consequence of the above, it is recommended that the current Australian vehicle safety ratings system be extended with the regular addition of New Zealand crash data to establish a single Australian and New Zealand vehicle safety ratings system. Ratings from the combined system would be published simultaneously in both countries, albeit with appropriate vehicle model naming for each country. The sponsors of the Australian vehicle safety ratings project have indicated their support of a combined Australian and New Zealand system with the LTSA joining the five Australian sponsor organisations as an equal funding partner in the project. Annual updates in line with the current Australian system are recommended to ensure the most accurate and up to date ratings are available for consumers.
7.2 Investigation of Techniques to Rate Vehicle Models Only Sold in New Zealand
Use of the Australian ratings system and associated crash data was necessary in producing a vehicle safety ratings system for the New Zealand passenger fleet that had high coverage and reasonable precision. This was noted and accepted by the LTSA in the initial review by MUARC into the LTSA feasibility study of producing vehicle safety ratings for New Zealand. A key draw back with this approach was that a number of popular vehicle models in the New Zealand fleet not found in the Australian fleet could not be rated. Such vehicle models include the Nissan Primera and later model Toyota Coronas. As part of its recent involvement in the European Commission funded SARAC projects, MUARC has developed methods for rating vehicle safety from injury only crash data, such as available in New Zealand. The new methods produce ratings that are consistent with ratings obtained from injury and non-injury crash data as used in this report. These methods would not be suitable for developing a vehicle safety ratings system based on New Zealand data alone because of the lack of sufficient crash data in New Zealand. However, the new methods may be useful in obtaining ratings for the currently unrated key New Zealand vehicle models. It is recommended that use of the new ratings method based on injury only crash data is investigated to obtain ratings for the key New Zealand vehicle models currently not rated. Success would enhance the credibility and usefulness of the New Zealand ratings system for New Zealand vehicle consumers. Whilst the method of estimating the ratings for these vehicle models is clear, it may be necessary to develop a means of scaling the ratings produced from the injury only methodology with those produced in the main system.
7.3 Monitoring Trends In Safety of the New Zealand Vehicle Fleet A useful extension of the Australian crashworthiness and aggressivity ratings project has been an analysis of trends in crashworthiness of the Australian vehicle fleet by year of vehicle manufacture. The latest update of results of this analysis has quantified gains in the
VEHICLE SAFETY RATINGS ESTIMATED FROM AUSTRALIAN AND NZ REAL CRASH DATA 47
crashworthiness of the Australian vehicle fleet from 1964 to 2000, relating the gains to the introduction of a number of Australian design rules concerned with vehicle safety and the introduction of vehicle safety consumer advice programs. One subtlety in interpreting the results of the Australian crashworthiness by year of manufacture analysis is that, to a large degree, they reflect the composition of the vehicle fleet being analysed in terms of mix of vehicles. Consequently, the results obtained from analysis of the Australian fleet may have little relevance to what has taken place in the New Zealand fleet. This is particularly likely given the New Zealand fleet has quite a different mix of vehicles to the Australian fleet in terms of vehicle size. The high proportion of used Japanese imports in the New Zealand fleet may also have a bearing on safety trends in the New Zealand fleet. Whilst it is not possible to estimate vehicle safety ratings for individual vehicle models using only New Zealand injury crash data, analysis of crashworthiness trends by year of manufacture should be feasible. The ability to investigate trends in vehicle crashworthiness by year of manufacture using only New Zealand data would rely on the use of the new analysis methods for injury only crash data developed by MUARC for use in vehicle safety ratings as part of the EC funded SARAC projects. It is recommended that analysis of trends in vehicle crashworthiness in the New Zealand fleet based on New Zealand crash data is undertaken. Analysis could focus on the fleet as a whole as well as the fleet broken down into vehicles sold new in New Zealand and second hand imported vehicles. Analysis of the second hand imported vehicles could also be carried out by year of first registration in New Zealand, the date when the introduction of the vehicle into the New Zealand fleet would have an influence on fleet safety in New Zealand. This latter analysis would be particularly useful in the longer term in quantifying the benefits of the recently introduced mandatory compliance with frontal impact standards required for all second hand vehicle imports into New Zealand.
7.4 Crash Risk Ratings for New Zealand Vehicles One area of vehicle safety rating that has been poorly investigated in the past is that of rating primary vehicle safety or crash risk associated with particular vehicle model types. The ratings presented in this report give the risk of injury given crash involvement but do not reflect the risk of crashing per unit of exposure on the road. One of the primary reasons crash risk ratings have not successfully been undertaken in the past is due to a lack of suitable exposure data. Some research has developed crash risk ratings using years of registration or insurance as an exposure measure. This is, however, considered a flawed approach, particularly when considering an analysis by vehicle model. This is because it does not take into account some vehicle models being driven more than others due to differences in the primary use of the vehicle. For example a commercial vehicle used for deliveries in country areas in comparison to a small car primarily used for private commuting in urban areas. Data collected as part of the annual New Zealand Warrant of Fitness (WoF) tests and held by the Transport Registry Centre may provide the necessary exposure data to enable the successful computation of vehicle crash risk ratings by make and model of vehicle. Analysis would capitalise on the vehicle model decoding and clustering methods as well as the crash and registration matching procedures developed as part of the study and presented in this report. It is
MONASH UNIVERSITY ACCIDENT RESEARCH CENTRE 48
recommended a pilot study is undertaken to investigate the feasibility of and issues related to producing crash risk ratings for New Zealand passenger vehicles.
8. ASSUMPTIONS AND QUALIFICATIONS The results and conclusions presented in this report are based on a number of assumptions and warrant a number of qualifications that the reader should note. These are listed in the following sections.
8.1 Assumptions It has been assumed that: • TAC claims records and, New Zealand, Victorian, NSW, Western Australian and
Queensland Police crash reports accurately recorded driver injury, hospitalisation and death. • There was no bias in the merging of TAC claims and Victorian Police crash reports related to
the model of car and factors affecting the severity of the crash. • Crashed vehicle registration numbers were recorded accurately on Police crash reports and
that they correctly identified the crashed vehicles in the Victorian, NSW and Queensland vehicle registers.
• The adjustments for driver sex, age, speed zone, the number of vehicles involved and the
state and year in which the crash occurred crash removed the influences of the other main factors available in the data that affected crash severity and injury susceptibility.
• The form of the logistic models used to relate injury risk and injury severity with the
available factors influencing these outcomes (including the car models) was correct. • Information contained in the Police crash records allowed accurate matching of both vehicles
involved in crashes between two passenger cars for the purpose of calculating aggressivity ratings.
• The injury risk component of both the crashworthiness and aggressiviy ratings, calculated
only from Australian crash data, is representative of injury risk in rated vehicle models in the New Zealand vehicle fleet.
8.2 Qualifications The results and conclusions warrant at least the following qualifications: • Only driver crash involvements and injuries have been considered. Passengers occupying the
same model cars may have had different injury outcomes. However, in the vast majority of cases, the driver is the most seriously injured occupant in a crashed vehicle. This is often because the driver is the sole vehicle occupant but also because the dirver has the largest number of potential contact sources including the steering wheel. Noting this, both the crashworthiness and aggressivity ratings presented here can be considered to apply to the
VEHICLE SAFETY RATINGS ESTIMATED FROM AUSTRALIAN AND NZ REAL CRASH DATA 49
most severe injury outcome in the vehicle. Assessment of average injury outcome across all occupants of the vehicle may produce different ratings although it would be difficult to calculate this measure, as uninjured vehicle occupants are typically not reliably recorded in police crash data.
• Some models with the same name through the 1982-2000 years of manufacture may have
varied substantially in their construction and mass. Although there should be few such models in these updated results, the rating score calculated for these models may give a misleading impression and should be interpreted with caution.
• Other factors not collected in the data (eg. crash speed) may differ between the models and
may affect the results. However, earlier analysis has suggested that the different rating scores are predominantly due to vehicle factors alone (Cameron et al 1992).
9. REFERENCES Broughton, J. (1994) The theoretical basis for comparing the accident record of car models, Project Report 70, Safety and Environment Resource Centre, Transport Research Laboratory, Crowthorne, Berkshire, U.K. Broughton, J. (1996) The theoretical basis for comparing the accident record of car models Accident Analysis and Prevention, Vol. 28, No. 1, pp. 89-99. Cameron, M. H. (1987) The effectiveness of Australian Design Rules aimed at occupant protection, Proceedings, seminar on Structural Crashworthiness and Property Damage Accidents, Department of Civil Engineering, Monash University, Melbourne, Australia. Cameron, M.H., Mach, T., Neiger, D., Graham, A., Ramsay, R., Pappas, M. & Haley, J. (1992a) Vehicle Crashworthiness Ratings in Australia, Proceedings, International Conference on the Biomechanics of Impacts, Verona, Italy, pp. 105-119. Cameron, M.H., Mach, T. & Neiger, D. (1992b) Vehicle Crashworthiness Ratings: Victoria 1983-90 and NSW 1989-90 Crashes - Summary Report, Report No. 28, Monash University Accident Research Centre, Melbourne, Australia. Cameron, M.H., Finch, C.F. & Le, T. (1994a) Vehicle Crashworthiness Ratings: Victoria and NSW Crashes During 1987-92 - Summary Report Report No. 55, Monash University Accident Research Centre, Melbourne, Australia. Cameron, M.H., Finch, C.F. & Le, T. (1994b) Vehicle Crashworthiness Ratings: Victoria and NSW Crashes During 1987-92 - Technical Report Report No. 58, Monash University Accident Research Centre, Melbourne, Australia. Cameron, M.H., Newstead, S.V., Le, T. & Finch, C. (1994c) Relationship between vehicle crashworthiness and year of manufacture Report No. 94/6 Royal Automobile Club of Victoria Ltd, Melbourne, Australia.
MONASH UNIVERSITY ACCIDENT RESEARCH CENTRE 50
Cameron, M.H., Finch, C., Newstead, S., Le, T., Graham, A., Griffiths, M., Pappas, M. & Haley, J. (1995) ‘Measuring Crashworthiness: Make/Model Ratings and the Influence of Australian Design Rules for Motor Vehicle Safety’ Proceedings, International Conference on the Biomechanics of Impacts Brunnen, Switzerland, pp. 297-310. Cameron, M.H., Newstead, S.V. & Skalova, M. (1996) ‘The development of vehicle crashworthiness ratings in Australia’ Paper 96-S9-O-14, Proceedings 15th International Technical Conference on the Enhanced Safety of Vehicles, Melbourne, Australia. Cameron, M.H., Newstead, S.V. & Le, C.M. (1998) Rating the aggressivity of Australian passenger vehicles towards other vehicle occupants and unprotected road users Proceedings, International IRCOBI Conference on the Biomechanics of Impact, Gothenborg, Sweden. Department Of Transport (1995) Cars: Make and Model: The Risk of Driver Injury and Car Accident Rates in Great Britain: 1993 Transport Statistics Report. London: Her Majesty's Stationery Office. Green, P. (1990) Victorian Road Accident Database: Frequency Tables for Accident Data Fields: 1988 Accident Studies Section, VicRoads, Melbourne, Australia. Gustafsson, H., Hagg, A., Krafft, M., Kullgren, A., Malmstedt, B., Nygren, A. & Tingvall, C. (1989) Folksam Car Model Safety Rating 1989-90, Folksam, Stockholm, Sweden. Hollowell, W.T. & Gabler, H.C. (1996) NHTSA’s Vehicle Aggressivity and Compatibility Research Program Proceedings, Fifteenth International Technical Conference on the Enhanced Safety of Vehicles, Melbourne, Australia. Hosmer, D.W. & Lemeshow, S. (1989) Applied Logistic Regression Wiley, New York. LTSA (1998) Motor Accidents in New Zealand 1998 Land Transport Safety Authority, Wellington, New Zealand. Newstead, S., Cameron, M. & Skalova, M. (1996) Vehicle Crashworthiness Ratings: Victoria and NSW Crashes During 1987-94, Report No. 92, Monash University Accident Research Centre, Melbourne, Australia. Newstead, S., Cameron, M. & Le, C.M. (1997) Vehicle Crashworthiness Ratings and Crashworthiness by Year of Manufacture: Victoria and NSW crashes during 1987-95, Report No. 107, Monash University Accident Research Centre, Melbourne, Australia. Newstead, S., Cameron, M. & Le, C.M. (1998) Vehicle Crashworthiness Ratings and Crashworthiness by Year of Manufacture: Victoria and NSW crashes during 1987-96, Report No. 128, Monash University Accident Research Centre, Melbourne, Australia. Newstead, S., Cameron, M.H. & Le, C.M. (1999) Vehicle Crashworthiness Ratings and Crashworthiness by Year of Manufacture: Victoria and NSW Crashes During 1987-97, Queensland Crashes During 1991-96 Report No. 150, Monash University Accident Research Centre, Melbourne, Australia.
VEHICLE SAFETY RATINGS ESTIMATED FROM AUSTRALIAN AND NZ REAL CRASH DATA 51
Newstead, S., Cameron, M.H. & Le, C.M. (2000) Vehicle Crashworthiness Ratings and Crashworthiness by Year of Manufacture: Victoria and NSW Crashes During 1987-98 Queensland Crashes During 1991-98 Report No. 171, Monash University Accident Research Centre, Melbourne, Australia. Newstead, S. (2000). Review of the New Zealand Land Transport Safety Authority feasibility study into producing crashworthiness ratings for New Zealand vehicles. Report to the New Zealand Land Transport Safety Authority, Monash University Accident Research Centre, Melbourne, Australia. Newstead, S. & Cameron, M. (2001) Trends in Australian vehicle crashworthiness by year of vehicle manufacture within vehicle market groups Proceedings of the 2001 IRCOBI Conference, Isle of Man, UK. Newstead, S. (2002) New Zealand vehicle crashworthiness ratings pilot study: Stages 1 to 4 Report to the New Zealand Land Transport Safety Authority, Monash University Accident Research Centre, Melbourne, Australia. Newstead, S., Cameron, M, Watson, L. & Delaney, A. (2003) Vehicle Crashworthiness Ratings and Crashworthiness by Year of Manufacture: Victoria and NSW Crashes During 1987-2000 Queensland and Western Australia Crashes During 1991-2000 Report No. 196, Monash University Accident Research Centre, Melbourne, Australia. Pappas, M. (1993) NSW Vehicle Occupant Protection Ratings Documentation, Report to NRMA Ltd. and Road Safety Bureau, Roads and Traffic Authority, Sydney, NSW. Road Safety Council of Western Australia (2001) Reported road crashes in Western Australia, 2000 Road Safety Council of Western Australia, Office of Road Safety, Perth, Australia. Robinson, T. (2000a) Vehicle crashworthiness feasibility study. Clustering guide and methodology Land Transport Safety Authority, Wellington, New Zealand. Robinson, T. (2000b) Assessment of the fit between the New Zealand fleet and MUARC classes Land Transport Safety Authority, Wellington, New Zealand. SAS Inc. (1989) SAS STAT Users Guide, Version 6, Fourth Edition, Volume 2 Carey, NC: SAS Institute. Social Development Committee (1990) Inquiry into Vehicle Occupant Protection Parliament of Victoria, Melbourne, Australia. TRC (2000) New Zealand Motor Vehicle Registration Statistics 2000 Transport Registry Centre, Land Transport Safety Authority, Palmerston North, New Zealand. Voyce, T. (2000) Crashworthiness study - data entry Land Transport Safety Authority, Wellington, New Zealand.

MONASH UNIVERSITY ACCIDENT RESEARCH CENTRE 52
APPENDIX 1
MAKES AND MODELS OF CARS INVOLVED IN VICTORIAN AND NSW CRASHES DURING 1987-2000
AND NEW ZEALAND, WESTERN AUSTRALIA AND QUEENSLAND CRASHES
DURING 1991-2000

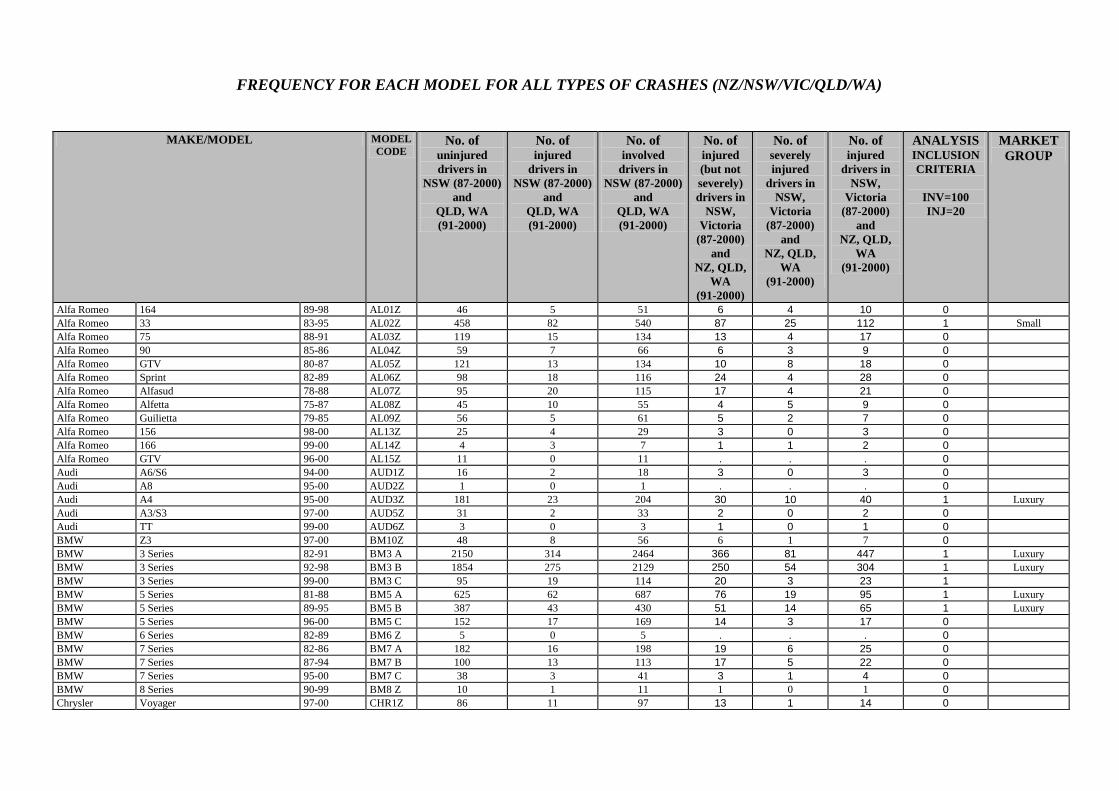
FREQUENCY FOR EACH MODEL FOR ALL TYPES OF CRASHES (NZ/NSW/VIC/QLD/WA)
MAKE/MODEL MODEL CODE
No. of uninjured drivers in
NSW (87-2000) and
QLD, WA (91-2000)
No. of injured
drivers in NSW (87-2000)
and QLD, WA (91-2000)
No. of involved
drivers in NSW (87-2000)
and QLD, WA (91-2000)
No. of injured (but not severely) drivers in
NSW, Victoria
(87-2000) and
NZ, QLD, WA
(91-2000)
No. of severely injured
drivers in NSW,
Victoria (87-2000)
and NZ, QLD,
WA (91-2000)
No. of injured
drivers in NSW,
Victoria (87-2000)
and NZ, QLD,
WA (91-2000)
ANALYSIS INCLUSION CRITERIA
INV=100 INJ=20
MARKET GROUP
Alfa Romeo 164 89-98 AL01Z 46 5 51 6 4 10 0 Alfa Romeo 33 83-95 AL02Z 458 82 540 87 25 112 1 Small Alfa Romeo 75 88-91 AL03Z 119 15 134 13 4 17 0 Alfa Romeo 90 85-86 AL04Z 59 7 66 6 3 9 0 Alfa Romeo GTV 80-87 AL05Z 121 13 134 10 8 18 0 Alfa Romeo Sprint 82-89 AL06Z 98 18 116 24 4 28 0 Alfa Romeo Alfasud 78-88 AL07Z 95 20 115 17 4 21 0 Alfa Romeo Alfetta 75-87 AL08Z 45 10 55 4 5 9 0 Alfa Romeo Guilietta 79-85 AL09Z 56 5 61 5 2 7 0 Alfa Romeo 156 98-00 AL13Z 25 4 29 3 0 3 0 Alfa Romeo 166 99-00 AL14Z 4 3 7 1 1 2 0 Alfa Romeo GTV 96-00 AL15Z 11 0 11 . . . 0 Audi A6/S6 94-00 AUD1Z 16 2 18 3 0 3 0 Audi A8 95-00 AUD2Z 1 0 1 . . . 0 Audi A4 95-00 AUD3Z 181 23 204 30 10 40 1 Luxury Audi A3/S3 97-00 AUD5Z 31 2 33 2 0 2 0 Audi TT 99-00 AUD6Z 3 0 3 1 0 1 0 BMW Z3 97-00 BM10Z 48 8 56 6 1 7 0 BMW 3 Series 82-91 BM3 A 2150 314 2464 366 81 447 1 Luxury BMW 3 Series 92-98 BM3 B 1854 275 2129 250 54 304 1 Luxury BMW 3 Series 99-00 BM3 C 95 19 114 20 3 23 1 BMW 5 Series 81-88 BM5 A 625 62 687 76 19 95 1 Luxury BMW 5 Series 89-95 BM5 B 387 43 430 51 14 65 1 Luxury BMW 5 Series 96-00 BM5 C 152 17 169 14 3 17 0 BMW 6 Series 82-89 BM6 Z 5 0 5 . . . 0 BMW 7 Series 82-86 BM7 A 182 16 198 19 6 25 0 BMW 7 Series 87-94 BM7 B 100 13 113 17 5 22 0 BMW 7 Series 95-00 BM7 C 38 3 41 3 1 4 0 BMW 8 Series 90-99 BM8 Z 10 1 11 1 0 1 0 Chrysler Voyager 97-00 CHR1Z 86 11 97 13 1 14 0
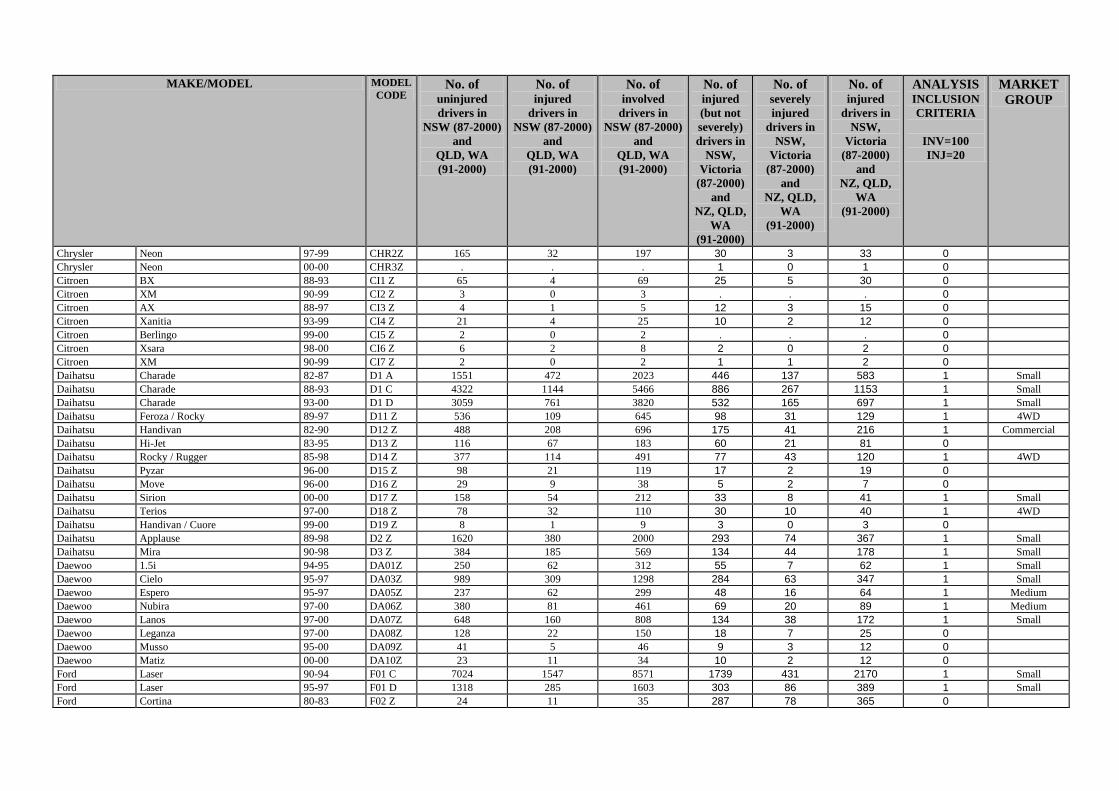
MAKE/MODEL MODEL CODE
No. of uninjured drivers in
NSW (87-2000) and
QLD, WA (91-2000)
No. of injured
drivers in NSW (87-2000)
and QLD, WA (91-2000)
No. of involved
drivers in NSW (87-2000)
and QLD, WA (91-2000)
No. of injured (but not severely) drivers in
NSW, Victoria
(87-2000) and
NZ, QLD, WA
(91-2000)
No. of severely injured
drivers in NSW,
Victoria (87-2000)
and NZ, QLD,
WA (91-2000)
No. of injured
drivers in NSW,
Victoria (87-2000)
and NZ, QLD,
WA (91-2000)
ANALYSIS INCLUSION CRITERIA
INV=100 INJ=20
MARKET GROUP
Chrysler Neon 97-99 CHR2Z 165 32 197 30 3 33 0 Chrysler Neon 00-00 CHR3Z . . . 1 0 1 0 Citroen BX 88-93 CI1 Z 65 4 69 25 5 30 0 Citroen XM 90-99 CI2 Z 3 0 3 . . . 0 Citroen AX 88-97 CI3 Z 4 1 5 12 3 15 0 Citroen Xanitia 93-99 CI4 Z 21 4 25 10 2 12 0 Citroen Berlingo 99-00 CI5 Z 2 0 2 . . . 0 Citroen Xsara 98-00 CI6 Z 6 2 8 2 0 2 0 Citroen XM 90-99 CI7 Z 2 0 2 1 1 2 0 Daihatsu Charade 82-87 D1 A 1551 472 2023 446 137 583 1 Small Daihatsu Charade 88-93 D1 C 4322 1144 5466 886 267 1153 1 Small Daihatsu Charade 93-00 D1 D 3059 761 3820 532 165 697 1 Small Daihatsu Feroza / Rocky 89-97 D11 Z 536 109 645 98 31 129 1 4WD Daihatsu Handivan 82-90 D12 Z 488 208 696 175 41 216 1 Commercial Daihatsu Hi-Jet 83-95 D13 Z 116 67 183 60 21 81 0 Daihatsu Rocky / Rugger 85-98 D14 Z 377 114 491 77 43 120 1 4WD Daihatsu Pyzar 96-00 D15 Z 98 21 119 17 2 19 0 Daihatsu Move 96-00 D16 Z 29 9 38 5 2 7 0 Daihatsu Sirion 00-00 D17 Z 158 54 212 33 8 41 1 Small Daihatsu Terios 97-00 D18 Z 78 32 110 30 10 40 1 4WD Daihatsu Handivan / Cuore 99-00 D19 Z 8 1 9 3 0 3 0 Daihatsu Applause 89-98 D2 Z 1620 380 2000 293 74 367 1 Small Daihatsu Mira 90-98 D3 Z 384 185 569 134 44 178 1 Small Daewoo 1.5i 94-95 DA01Z 250 62 312 55 7 62 1 Small Daewoo Cielo 95-97 DA03Z 989 309 1298 284 63 347 1 Small Daewoo Espero 95-97 DA05Z 237 62 299 48 16 64 1 Medium Daewoo Nubira 97-00 DA06Z 380 81 461 69 20 89 1 Medium Daewoo Lanos 97-00 DA07Z 648 160 808 134 38 172 1 Small Daewoo Leganza 97-00 DA08Z 128 22 150 18 7 25 0 Daewoo Musso 95-00 DA09Z 41 5 46 9 3 12 0 Daewoo Matiz 00-00 DA10Z 23 11 34 10 2 12 0 Ford Laser 90-94 F01 C 7024 1547 8571 1739 431 2170 1 Small Ford Laser 95-97 F01 D 1318 285 1603 303 86 389 1 Small Ford Cortina 80-83 F02 Z 24 11 35 287 78 365 0
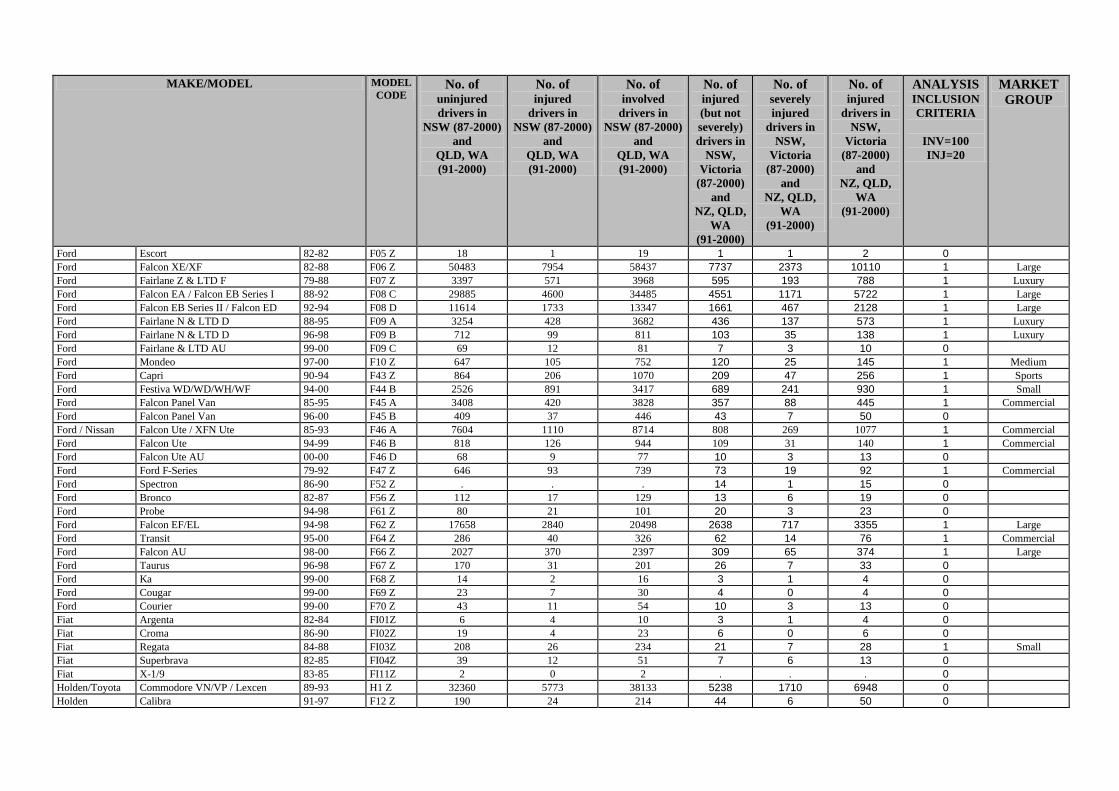
MAKE/MODEL MODEL CODE
No. of uninjured drivers in
NSW (87-2000) and
QLD, WA (91-2000)
No. of injured
drivers in NSW (87-2000)
and QLD, WA (91-2000)
No. of involved
drivers in NSW (87-2000)
and QLD, WA (91-2000)
No. of injured (but not severely) drivers in
NSW, Victoria
(87-2000) and
NZ, QLD, WA
(91-2000)
No. of severely injured
drivers in NSW,
Victoria (87-2000)
and NZ, QLD,
WA (91-2000)
No. of injured
drivers in NSW,
Victoria (87-2000)
and NZ, QLD,
WA (91-2000)
ANALYSIS INCLUSION CRITERIA
INV=100 INJ=20
MARKET GROUP
Ford Escort 82-82 F05 Z 18 1 19 1 1 2 0 Ford Falcon XE/XF 82-88 F06 Z 50483 7954 58437 7737 2373 10110 1 Large Ford Fairlane Z & LTD F 79-88 F07 Z 3397 571 3968 595 193 788 1 Luxury Ford Falcon EA / Falcon EB Series I 88-92 F08 C 29885 4600 34485 4551 1171 5722 1 Large Ford Falcon EB Series II / Falcon ED 92-94 F08 D 11614 1733 13347 1661 467 2128 1 Large Ford Fairlane N & LTD D 88-95 F09 A 3254 428 3682 436 137 573 1 Luxury Ford Fairlane N & LTD D 96-98 F09 B 712 99 811 103 35 138 1 Luxury Ford Fairlane & LTD AU 99-00 F09 C 69 12 81 7 3 10 0 Ford Mondeo 97-00 F10 Z 647 105 752 120 25 145 1 Medium Ford Capri 90-94 F43 Z 864 206 1070 209 47 256 1 Sports Ford Festiva WD/WD/WH/WF 94-00 F44 B 2526 891 3417 689 241 930 1 Small Ford Falcon Panel Van 85-95 F45 A 3408 420 3828 357 88 445 1 Commercial Ford Falcon Panel Van 96-00 F45 B 409 37 446 43 7 50 0 Ford / Nissan Falcon Ute / XFN Ute 85-93 F46 A 7604 1110 8714 808 269 1077 1 Commercial Ford Falcon Ute 94-99 F46 B 818 126 944 109 31 140 1 Commercial Ford Falcon Ute AU 00-00 F46 D 68 9 77 10 3 13 0 Ford Ford F-Series 79-92 F47 Z 646 93 739 73 19 92 1 Commercial Ford Spectron 86-90 F52 Z . . . 14 1 15 0 Ford Bronco 82-87 F56 Z 112 17 129 13 6 19 0 Ford Probe 94-98 F61 Z 80 21 101 20 3 23 0 Ford Falcon EF/EL 94-98 F62 Z 17658 2840 20498 2638 717 3355 1 Large Ford Transit 95-00 F64 Z 286 40 326 62 14 76 1 Commercial Ford Falcon AU 98-00 F66 Z 2027 370 2397 309 65 374 1 Large Ford Taurus 96-98 F67 Z 170 31 201 26 7 33 0 Ford Ka 99-00 F68 Z 14 2 16 3 1 4 0 Ford Cougar 99-00 F69 Z 23 7 30 4 0 4 0 Ford Courier 99-00 F70 Z 43 11 54 10 3 13 0 Fiat Argenta 82-84 FI01Z 6 4 10 3 1 4 0 Fiat Croma 86-90 FI02Z 19 4 23 6 0 6 0 Fiat Regata 84-88 FI03Z 208 26 234 21 7 28 1 Small Fiat Superbrava 82-85 FI04Z 39 12 51 7 6 13 0 Fiat X-1/9 83-85 FI11Z 2 0 2 . . . 0 Holden/Toyota Commodore VN/VP / Lexcen 89-93 H1 Z 32360 5773 38133 5238 1710 6948 0 Holden Calibra 91-97 F12 Z 190 24 214 44 6 50 0
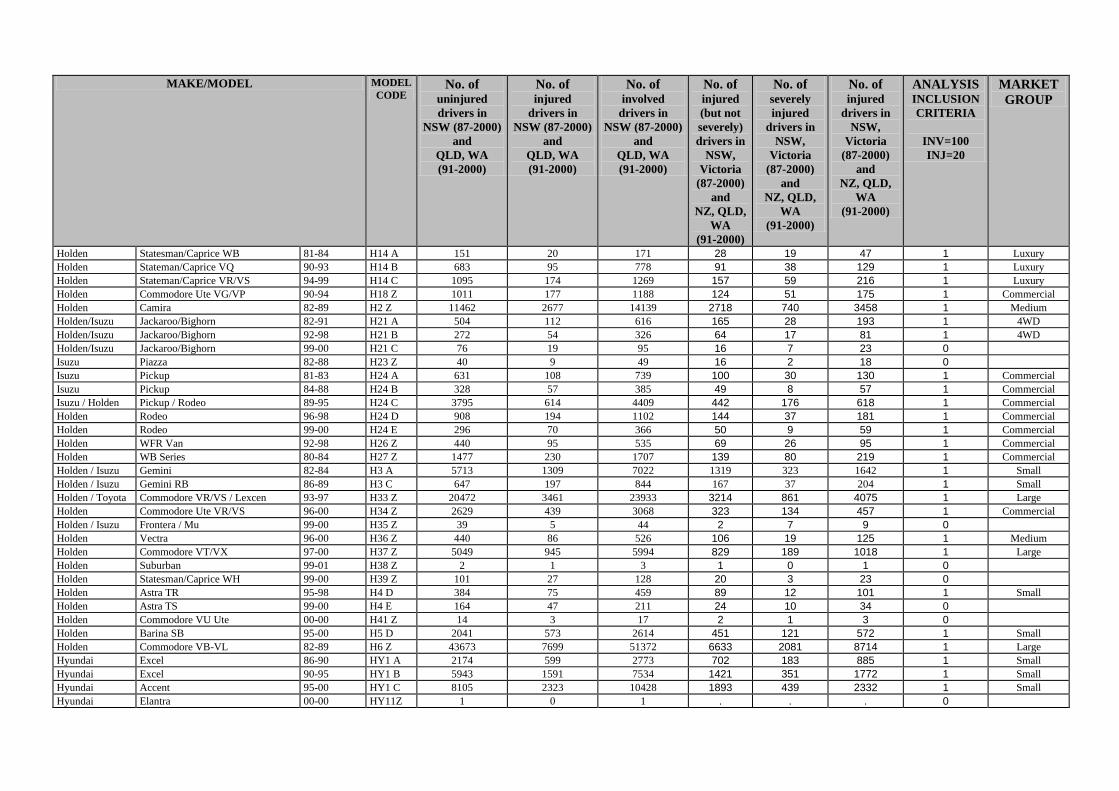
MAKE/MODEL MODEL CODE
No. of uninjured drivers in
NSW (87-2000) and
QLD, WA (91-2000)
No. of injured
drivers in NSW (87-2000)
and QLD, WA (91-2000)
No. of involved
drivers in NSW (87-2000)
and QLD, WA (91-2000)
No. of injured (but not severely) drivers in
NSW, Victoria
(87-2000) and
NZ, QLD, WA
(91-2000)
No. of severely injured
drivers in NSW,
Victoria (87-2000)
and NZ, QLD,
WA (91-2000)
No. of injured
drivers in NSW,
Victoria (87-2000)
and NZ, QLD,
WA (91-2000)
ANALYSIS INCLUSION CRITERIA
INV=100 INJ=20
MARKET GROUP
Holden Statesman/Caprice WB 81-84 H14 A 151 20 171 28 19 47 1 Luxury Holden Stateman/Caprice VQ 90-93 H14 B 683 95 778 91 38 129 1 Luxury Holden Stateman/Caprice VR/VS 94-99 H14 C 1095 174 1269 157 59 216 1 Luxury Holden Commodore Ute VG/VP 90-94 H18 Z 1011 177 1188 124 51 175 1 Commercial Holden Camira 82-89 H2 Z 11462 2677 14139 2718 740 3458 1 Medium Holden/Isuzu Jackaroo/Bighorn 82-91 H21 A 504 112 616 165 28 193 1 4WD Holden/Isuzu Jackaroo/Bighorn 92-98 H21 B 272 54 326 64 17 81 1 4WD Holden/Isuzu Jackaroo/Bighorn 99-00 H21 C 76 19 95 16 7 23 0 Isuzu Piazza 82-88 H23 Z 40 9 49 16 2 18 0 Isuzu Pickup 81-83 H24 A 631 108 739 100 30 130 1 Commercial Isuzu Pickup 84-88 H24 B 328 57 385 49 8 57 1 Commercial Isuzu / Holden Pickup / Rodeo 89-95 H24 C 3795 614 4409 442 176 618 1 Commercial Holden Rodeo 96-98 H24 D 908 194 1102 144 37 181 1 Commercial Holden Rodeo 99-00 H24 E 296 70 366 50 9 59 1 Commercial Holden WFR Van 92-98 H26 Z 440 95 535 69 26 95 1 Commercial Holden WB Series 80-84 H27 Z 1477 230 1707 139 80 219 1 Commercial Holden / Isuzu Gemini 82-84 H3 A 5713 1309 7022 1319 323 1642 1 Small Holden / Isuzu Gemini RB 86-89 H3 C 647 197 844 167 37 204 1 Small Holden / Toyota Commodore VR/VS / Lexcen 93-97 H33 Z 20472 3461 23933 3214 861 4075 1 Large Holden Commodore Ute VR/VS 96-00 H34 Z 2629 439 3068 323 134 457 1 Commercial Holden / Isuzu Frontera / Mu 99-00 H35 Z 39 5 44 2 7 9 0 Holden Vectra 96-00 H36 Z 440 86 526 106 19 125 1 Medium Holden Commodore VT/VX 97-00 H37 Z 5049 945 5994 829 189 1018 1 Large Holden Suburban 99-01 H38 Z 2 1 3 1 0 1 0 Holden Statesman/Caprice WH 99-00 H39 Z 101 27 128 20 3 23 0 Holden Astra TR 95-98 H4 D 384 75 459 89 12 101 1 Small Holden Astra TS 99-00 H4 E 164 47 211 24 10 34 0 Holden Commodore VU Ute 00-00 H41 Z 14 3 17 2 1 3 0 Holden Barina SB 95-00 H5 D 2041 573 2614 451 121 572 1 Small Holden Commodore VB-VL 82-89 H6 Z 43673 7699 51372 6633 2081 8714 1 Large Hyundai Excel 86-90 HY1 A 2174 599 2773 702 183 885 1 Small Hyundai Excel 90-95 HY1 B 5943 1591 7534 1421 351 1772 1 Small Hyundai Accent 95-00 HY1 C 8105 2323 10428 1893 439 2332 1 Small Hyundai Elantra 00-00 HY11Z 1 0 1 . . . 0
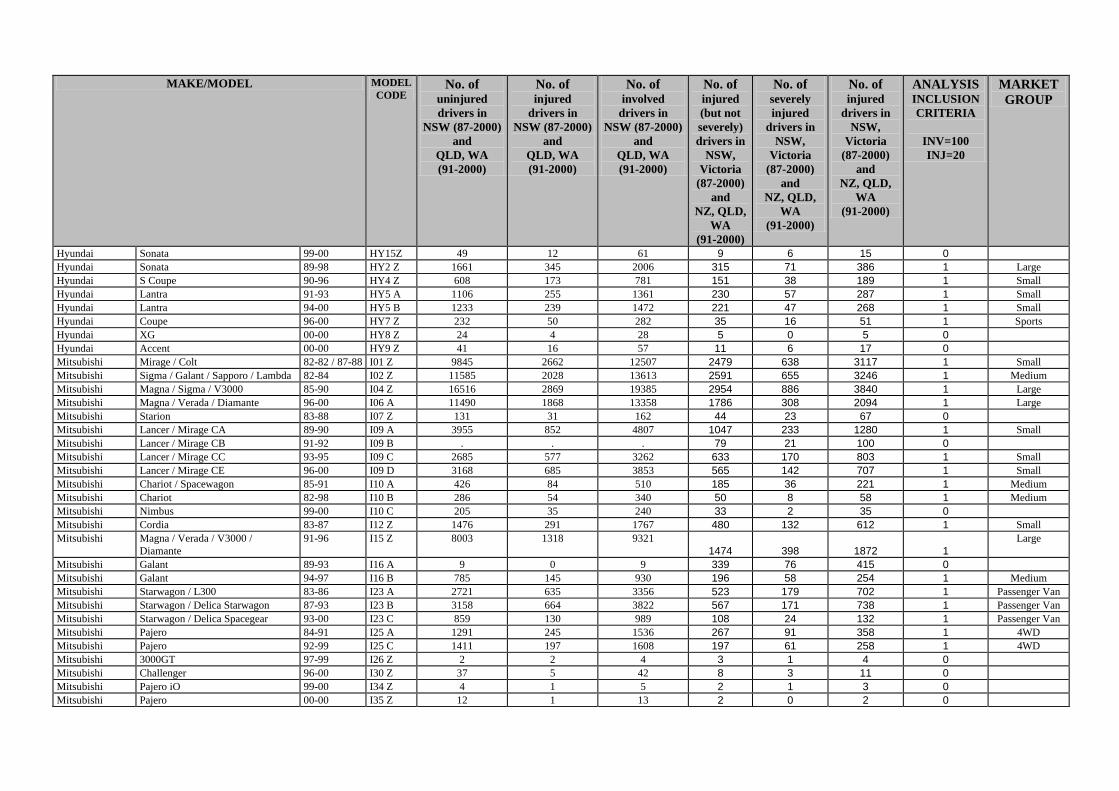
MAKE/MODEL MODEL CODE
No. of uninjured drivers in
NSW (87-2000) and
QLD, WA (91-2000)
No. of injured
drivers in NSW (87-2000)
and QLD, WA (91-2000)
No. of involved
drivers in NSW (87-2000)
and QLD, WA (91-2000)
No. of injured (but not severely) drivers in
NSW, Victoria
(87-2000) and
NZ, QLD, WA
(91-2000)
No. of severely injured
drivers in NSW,
Victoria (87-2000)
and NZ, QLD,
WA (91-2000)
No. of injured
drivers in NSW,
Victoria (87-2000)
and NZ, QLD,
WA (91-2000)
ANALYSIS INCLUSION CRITERIA
INV=100 INJ=20
MARKET GROUP
Hyundai Sonata 99-00 HY15Z 49 12 61 9 6 15 0 Hyundai Sonata 89-98 HY2 Z 1661 345 2006 315 71 386 1 Large Hyundai S Coupe 90-96 HY4 Z 608 173 781 151 38 189 1 Small Hyundai Lantra 91-93 HY5 A 1106 255 1361 230 57 287 1 Small Hyundai Lantra 94-00 HY5 B 1233 239 1472 221 47 268 1 Small Hyundai Coupe 96-00 HY7 Z 232 50 282 35 16 51 1 Sports Hyundai XG 00-00 HY8 Z 24 4 28 5 0 5 0 Hyundai Accent 00-00 HY9 Z 41 16 57 11 6 17 0 Mitsubishi Mirage / Colt 82-82 / 87-88 I01 Z 9845 2662 12507 2479 638 3117 1 Small Mitsubishi Sigma / Galant / Sapporo / Lambda 82-84 I02 Z 11585 2028 13613 2591 655 3246 1 Medium Mitsubishi Magna / Sigma / V3000 85-90 I04 Z 16516 2869 19385 2954 886 3840 1 Large Mitsubishi Magna / Verada / Diamante 96-00 I06 A 11490 1868 13358 1786 308 2094 1 Large Mitsubishi Starion 83-88 I07 Z 131 31 162 44 23 67 0 Mitsubishi Lancer / Mirage CA 89-90 I09 A 3955 852 4807 1047 233 1280 1 Small Mitsubishi Lancer / Mirage CB 91-92 I09 B . . . 79 21 100 0 Mitsubishi Lancer / Mirage CC 93-95 I09 C 2685 577 3262 633 170 803 1 Small Mitsubishi Lancer / Mirage CE 96-00 I09 D 3168 685 3853 565 142 707 1 Small Mitsubishi Chariot / Spacewagon 85-91 I10 A 426 84 510 185 36 221 1 Medium Mitsubishi Chariot 82-98 I10 B 286 54 340 50 8 58 1 Medium Mitsubishi Nimbus 99-00 I10 C 205 35 240 33 2 35 0 Mitsubishi Cordia 83-87 I12 Z 1476 291 1767 480 132 612 1 Small Mitsubishi Magna / Verada / V3000 /
Diamante 91-96 I15 Z 8003 1318 9321
1474 398 1872 1 Large
Mitsubishi Galant 89-93 I16 A 9 0 9 339 76 415 0 Mitsubishi Galant 94-97 I16 B 785 145 930 196 58 254 1 Medium Mitsubishi Starwagon / L300 83-86 I23 A 2721 635 3356 523 179 702 1 Passenger Van Mitsubishi Starwagon / Delica Starwagon 87-93 I23 B 3158 664 3822 567 171 738 1 Passenger Van Mitsubishi Starwagon / Delica Spacegear 93-00 I23 C 859 130 989 108 24 132 1 Passenger Van Mitsubishi Pajero 84-91 I25 A 1291 245 1536 267 91 358 1 4WD Mitsubishi Pajero 92-99 I25 C 1411 197 1608 197 61 258 1 4WD Mitsubishi 3000GT 97-99 I26 Z 2 2 4 3 1 4 0 Mitsubishi Challenger 96-00 I30 Z 37 5 42 8 3 11 0 Mitsubishi Pajero iO 99-00 I34 Z 4 1 5 2 1 3 0 Mitsubishi Pajero 00-00 I35 Z 12 1 13 2 0 2 0
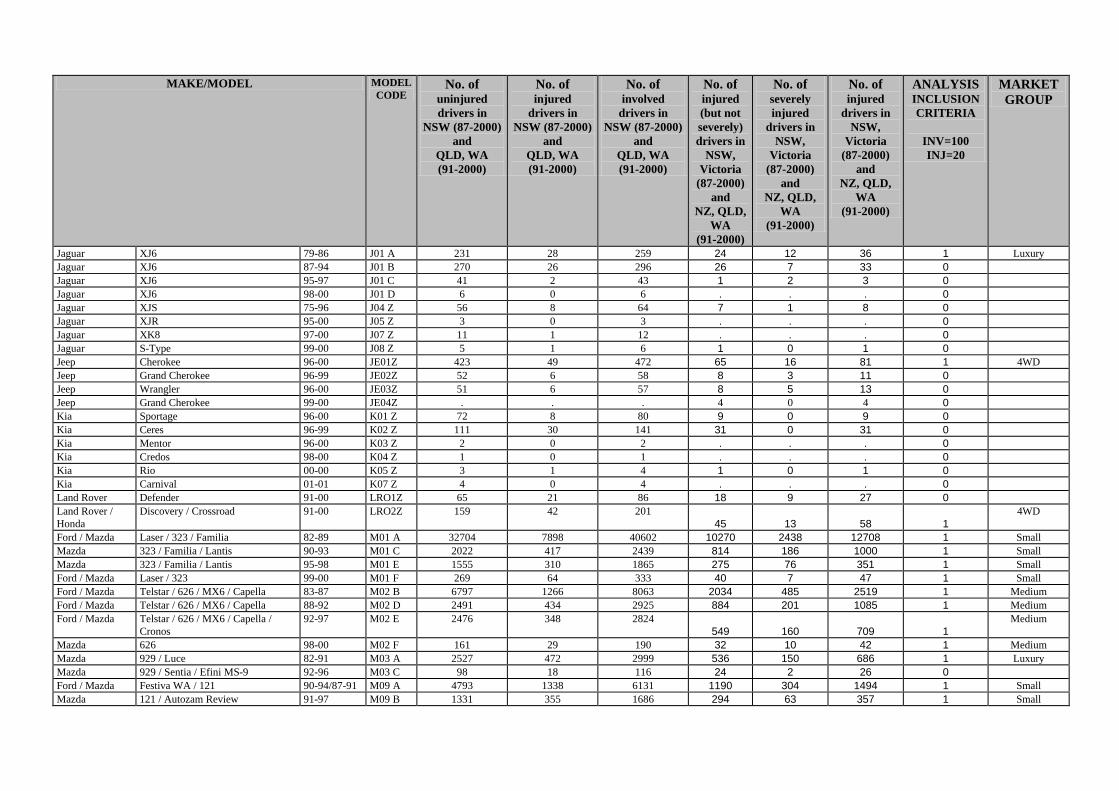
MAKE/MODEL MODEL CODE
No. of uninjured drivers in
NSW (87-2000) and
QLD, WA (91-2000)
No. of injured
drivers in NSW (87-2000)
and QLD, WA (91-2000)
No. of involved
drivers in NSW (87-2000)
and QLD, WA (91-2000)
No. of injured (but not severely) drivers in
NSW, Victoria
(87-2000) and
NZ, QLD, WA
(91-2000)
No. of severely injured
drivers in NSW,
Victoria (87-2000)
and NZ, QLD,
WA (91-2000)
No. of injured
drivers in NSW,
Victoria (87-2000)
and NZ, QLD,
WA (91-2000)
ANALYSIS INCLUSION CRITERIA
INV=100 INJ=20
MARKET GROUP
Jaguar XJ6 79-86 J01 A 231 28 259 24 12 36 1 Luxury Jaguar XJ6 87-94 J01 B 270 26 296 26 7 33 0 Jaguar XJ6 95-97 J01 C 41 2 43 1 2 3 0 Jaguar XJ6 98-00 J01 D 6 0 6 . . . 0 Jaguar XJS 75-96 J04 Z 56 8 64 7 1 8 0 Jaguar XJR 95-00 J05 Z 3 0 3 . . . 0 Jaguar XK8 97-00 J07 Z 11 1 12 . . . 0 Jaguar S-Type 99-00 J08 Z 5 1 6 1 0 1 0 Jeep Cherokee 96-00 JE01Z 423 49 472 65 16 81 1 4WD Jeep Grand Cherokee 96-99 JE02Z 52 6 58 8 3 11 0 Jeep Wrangler 96-00 JE03Z 51 6 57 8 5 13 0 Jeep Grand Cherokee 99-00 JE04Z . . . 4 0 4 0 Kia Sportage 96-00 K01 Z 72 8 80 9 0 9 0 Kia Ceres 96-99 K02 Z 111 30 141 31 0 31 0 Kia Mentor 96-00 K03 Z 2 0 2 . . . 0 Kia Credos 98-00 K04 Z 1 0 1 . . . 0 Kia Rio 00-00 K05 Z 3 1 4 1 0 1 0 Kia Carnival 01-01 K07 Z 4 0 4 . . . 0 Land Rover Defender 91-00 LRO1Z 65 21 86 18 9 27 0 Land Rover / Honda
Discovery / Crossroad 91-00 LRO2Z 159 42 201 45 13 58 1
4WD
Ford / Mazda Laser / 323 / Familia 82-89 M01 A 32704 7898 40602 10270 2438 12708 1 Small Mazda 323 / Familia / Lantis 90-93 M01 C 2022 417 2439 814 186 1000 1 Small Mazda 323 / Familia / Lantis 95-98 M01 E 1555 310 1865 275 76 351 1 Small Ford / Mazda Laser / 323 99-00 M01 F 269 64 333 40 7 47 1 Small Ford / Mazda Telstar / 626 / MX6 / Capella 83-87 M02 B 6797 1266 8063 2034 485 2519 1 Medium Ford / Mazda Telstar / 626 / MX6 / Capella 88-92 M02 D 2491 434 2925 884 201 1085 1 Medium Ford / Mazda Telstar / 626 / MX6 / Capella /
Cronos 92-97 M02 E 2476 348 2824
549 160 709 1 Medium
Mazda 626 98-00 M02 F 161 29 190 32 10 42 1 Medium Mazda 929 / Luce 82-91 M03 A 2527 472 2999 536 150 686 1 Luxury Mazda 929 / Sentia / Efini MS-9 92-96 M03 C 98 18 116 24 2 26 0 Ford / Mazda Festiva WA / 121 90-94/87-91 M09 A 4793 1338 6131 1190 304 1494 1 Small Mazda 121 / Autozam Review 91-97 M09 B 1331 355 1686 294 63 357 1 Small
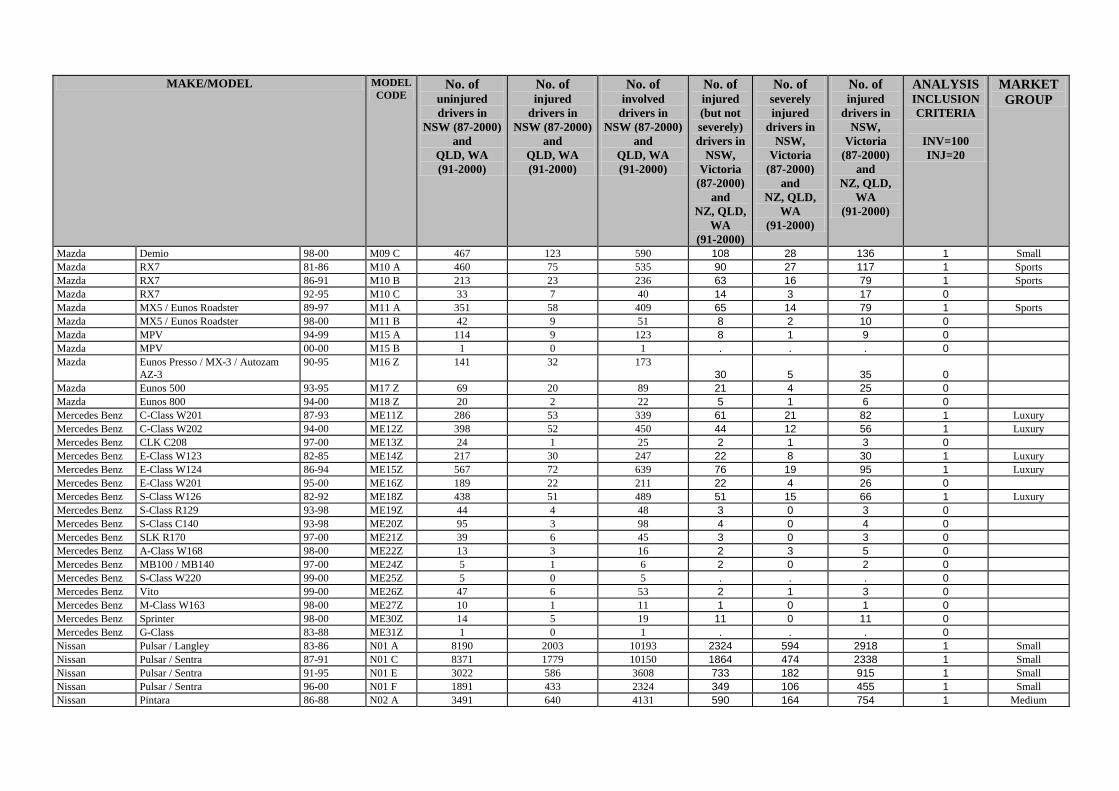
MAKE/MODEL MODEL CODE
No. of uninjured drivers in
NSW (87-2000) and
QLD, WA (91-2000)
No. of injured
drivers in NSW (87-2000)
and QLD, WA (91-2000)
No. of involved
drivers in NSW (87-2000)
and QLD, WA (91-2000)
No. of injured (but not severely) drivers in
NSW, Victoria
(87-2000) and
NZ, QLD, WA
(91-2000)
No. of severely injured
drivers in NSW,
Victoria (87-2000)
and NZ, QLD,
WA (91-2000)
No. of injured
drivers in NSW,
Victoria (87-2000)
and NZ, QLD,
WA (91-2000)
ANALYSIS INCLUSION CRITERIA
INV=100 INJ=20
MARKET GROUP
Mazda Demio 98-00 M09 C 467 123 590 108 28 136 1 Small Mazda RX7 81-86 M10 A 460 75 535 90 27 117 1 Sports Mazda RX7 86-91 M10 B 213 23 236 63 16 79 1 Sports Mazda RX7 92-95 M10 C 33 7 40 14 3 17 0 Mazda MX5 / Eunos Roadster 89-97 M11 A 351 58 409 65 14 79 1 Sports Mazda MX5 / Eunos Roadster 98-00 M11 B 42 9 51 8 2 10 0 Mazda MPV 94-99 M15 A 114 9 123 8 1 9 0 Mazda MPV 00-00 M15 B 1 0 1 . . . 0 Mazda Eunos Presso / MX-3 / Autozam
AZ-3 90-95 M16 Z 141 32 173
30 5 35 0
Mazda Eunos 500 93-95 M17 Z 69 20 89 21 4 25 0 Mazda Eunos 800 94-00 M18 Z 20 2 22 5 1 6 0 Mercedes Benz C-Class W201 87-93 ME11Z 286 53 339 61 21 82 1 Luxury Mercedes Benz C-Class W202 94-00 ME12Z 398 52 450 44 12 56 1 Luxury Mercedes Benz CLK C208 97-00 ME13Z 24 1 25 2 1 3 0 Mercedes Benz E-Class W123 82-85 ME14Z 217 30 247 22 8 30 1 Luxury Mercedes Benz E-Class W124 86-94 ME15Z 567 72 639 76 19 95 1 Luxury Mercedes Benz E-Class W201 95-00 ME16Z 189 22 211 22 4 26 0 Mercedes Benz S-Class W126 82-92 ME18Z 438 51 489 51 15 66 1 Luxury Mercedes Benz S-Class R129 93-98 ME19Z 44 4 48 3 0 3 0 Mercedes Benz S-Class C140 93-98 ME20Z 95 3 98 4 0 4 0 Mercedes Benz SLK R170 97-00 ME21Z 39 6 45 3 0 3 0 Mercedes Benz A-Class W168 98-00 ME22Z 13 3 16 2 3 5 0 Mercedes Benz MB100 / MB140 97-00 ME24Z 5 1 6 2 0 2 0 Mercedes Benz S-Class W220 99-00 ME25Z 5 0 5 . . . 0 Mercedes Benz Vito 99-00 ME26Z 47 6 53 2 1 3 0 Mercedes Benz M-Class W163 98-00 ME27Z 10 1 11 1 0 1 0 Mercedes Benz Sprinter 98-00 ME30Z 14 5 19 11 0 11 0 Mercedes Benz G-Class 83-88 ME31Z 1 0 1 . . . 0 Nissan Pulsar / Langley 83-86 N01 A 8190 2003 10193 2324 594 2918 1 Small Nissan Pulsar / Sentra 87-91 N01 C 8371 1779 10150 1864 474 2338 1 Small Nissan Pulsar / Sentra 91-95 N01 E 3022 586 3608 733 182 915 1 Small Nissan Pulsar / Sentra 96-00 N01 F 1891 433 2324 349 106 455 1 Small Nissan Pintara 86-88 N02 A 3491 640 4131 590 164 754 1 Medium
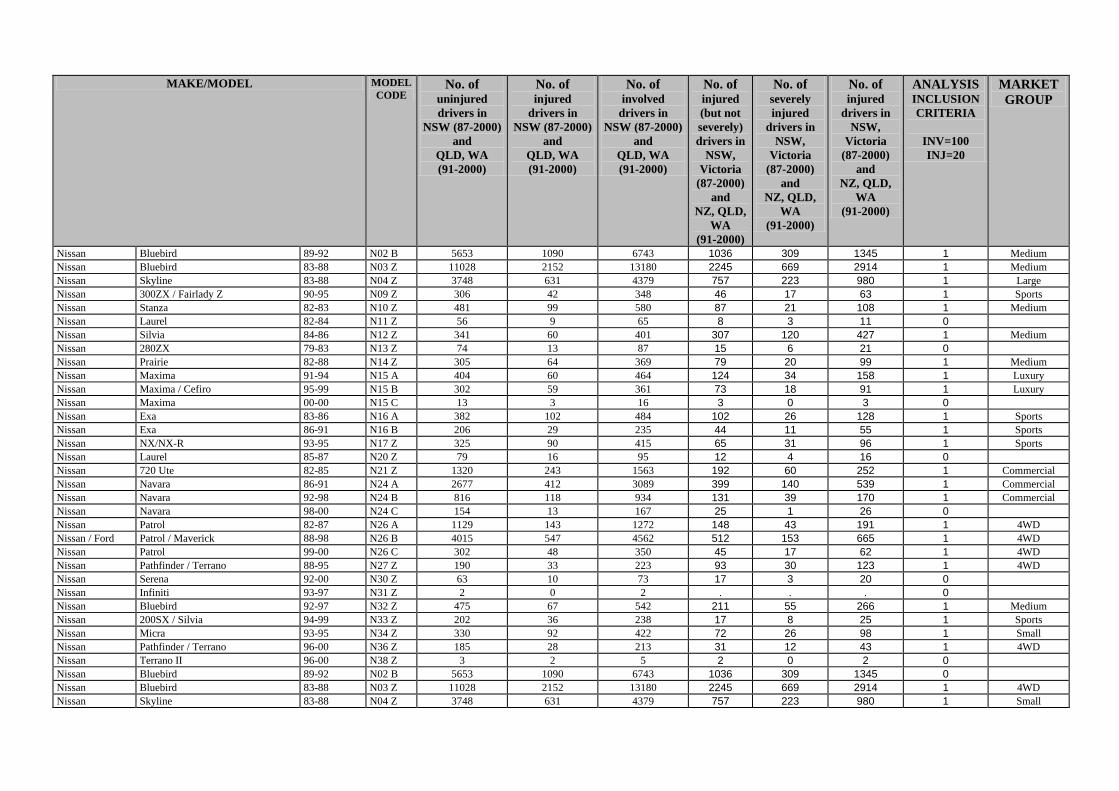
MAKE/MODEL MODEL CODE
No. of uninjured drivers in
NSW (87-2000) and
QLD, WA (91-2000)
No. of injured
drivers in NSW (87-2000)
and QLD, WA (91-2000)
No. of involved
drivers in NSW (87-2000)
and QLD, WA (91-2000)
No. of injured (but not severely) drivers in
NSW, Victoria
(87-2000) and
NZ, QLD, WA
(91-2000)
No. of severely injured
drivers in NSW,
Victoria (87-2000)
and NZ, QLD,
WA (91-2000)
No. of injured
drivers in NSW,
Victoria (87-2000)
and NZ, QLD,
WA (91-2000)
ANALYSIS INCLUSION CRITERIA
INV=100 INJ=20
MARKET GROUP
Nissan Bluebird 89-92 N02 B 5653 1090 6743 1036 309 1345 1 Medium Nissan Bluebird 83-88 N03 Z 11028 2152 13180 2245 669 2914 1 Medium Nissan Skyline 83-88 N04 Z 3748 631 4379 757 223 980 1 Large Nissan 300ZX / Fairlady Z 90-95 N09 Z 306 42 348 46 17 63 1 Sports Nissan Stanza 82-83 N10 Z 481 99 580 87 21 108 1 Medium Nissan Laurel 82-84 N11 Z 56 9 65 8 3 11 0 Nissan Silvia 84-86 N12 Z 341 60 401 307 120 427 1 Medium Nissan 280ZX 79-83 N13 Z 74 13 87 15 6 21 0 Nissan Prairie 82-88 N14 Z 305 64 369 79 20 99 1 Medium Nissan Maxima 91-94 N15 A 404 60 464 124 34 158 1 Luxury Nissan Maxima / Cefiro 95-99 N15 B 302 59 361 73 18 91 1 Luxury Nissan Maxima 00-00 N15 C 13 3 16 3 0 3 0 Nissan Exa 83-86 N16 A 382 102 484 102 26 128 1 Sports Nissan Exa 86-91 N16 B 206 29 235 44 11 55 1 Sports Nissan NX/NX-R 93-95 N17 Z 325 90 415 65 31 96 1 Sports Nissan Laurel 85-87 N20 Z 79 16 95 12 4 16 0 Nissan 720 Ute 82-85 N21 Z 1320 243 1563 192 60 252 1 Commercial Nissan Navara 86-91 N24 A 2677 412 3089 399 140 539 1 Commercial Nissan Navara 92-98 N24 B 816 118 934 131 39 170 1 Commercial Nissan Navara 98-00 N24 C 154 13 167 25 1 26 0 Nissan Patrol 82-87 N26 A 1129 143 1272 148 43 191 1 4WD Nissan / Ford Patrol / Maverick 88-98 N26 B 4015 547 4562 512 153 665 1 4WD Nissan Patrol 99-00 N26 C 302 48 350 45 17 62 1 4WD Nissan Pathfinder / Terrano 88-95 N27 Z 190 33 223 93 30 123 1 4WD Nissan Serena 92-00 N30 Z 63 10 73 17 3 20 0 Nissan Infiniti 93-97 N31 Z 2 0 2 . . . 0 Nissan Bluebird 92-97 N32 Z 475 67 542 211 55 266 1 Medium Nissan 200SX / Silvia 94-99 N33 Z 202 36 238 17 8 25 1 Sports Nissan Micra 93-95 N34 Z 330 92 422 72 26 98 1 Small Nissan Pathfinder / Terrano 96-00 N36 Z 185 28 213 31 12 43 1 4WD Nissan Terrano II 96-00 N38 Z 3 2 5 2 0 2 0 Nissan Bluebird 89-92 N02 B 5653 1090 6743 1036 309 1345 0 Nissan Bluebird 83-88 N03 Z 11028 2152 13180 2245 669 2914 1 4WD Nissan Skyline 83-88 N04 Z 3748 631 4379 757 223 980 1 Small
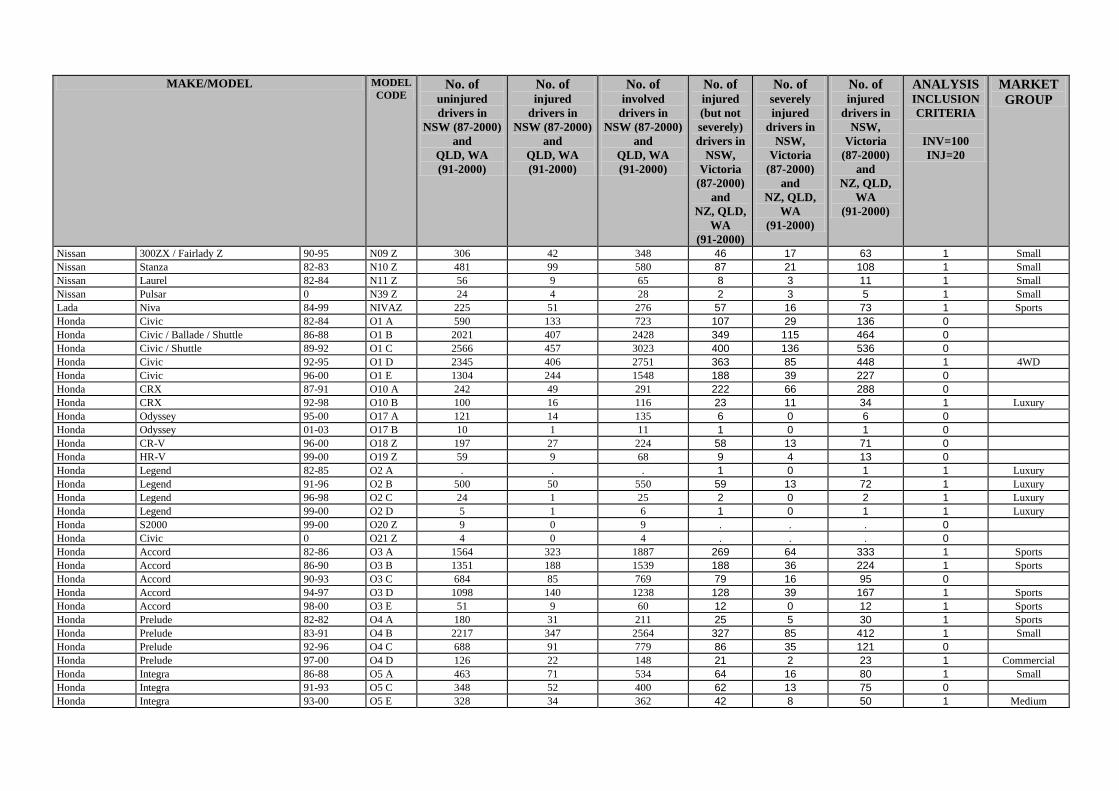
MAKE/MODEL MODEL CODE
No. of uninjured drivers in
NSW (87-2000) and
QLD, WA (91-2000)
No. of injured
drivers in NSW (87-2000)
and QLD, WA (91-2000)
No. of involved
drivers in NSW (87-2000)
and QLD, WA (91-2000)
No. of injured (but not severely) drivers in
NSW, Victoria
(87-2000) and
NZ, QLD, WA
(91-2000)
No. of severely injured
drivers in NSW,
Victoria (87-2000)
and NZ, QLD,
WA (91-2000)
No. of injured
drivers in NSW,
Victoria (87-2000)
and NZ, QLD,
WA (91-2000)
ANALYSIS INCLUSION CRITERIA
INV=100 INJ=20
MARKET GROUP
Nissan 300ZX / Fairlady Z 90-95 N09 Z 306 42 348 46 17 63 1 Small Nissan Stanza 82-83 N10 Z 481 99 580 87 21 108 1 Small Nissan Laurel 82-84 N11 Z 56 9 65 8 3 11 1 Small Nissan Pulsar 0 N39 Z 24 4 28 2 3 5 1 Small Lada Niva 84-99 NIVAZ 225 51 276 57 16 73 1 Sports Honda Civic 82-84 O1 A 590 133 723 107 29 136 0 Honda Civic / Ballade / Shuttle 86-88 O1 B 2021 407 2428 349 115 464 0 Honda Civic / Shuttle 89-92 O1 C 2566 457 3023 400 136 536 0 Honda Civic 92-95 O1 D 2345 406 2751 363 85 448 1 4WD Honda Civic 96-00 O1 E 1304 244 1548 188 39 227 0 Honda CRX 87-91 O10 A 242 49 291 222 66 288 0 Honda CRX 92-98 O10 B 100 16 116 23 11 34 1 Luxury Honda Odyssey 95-00 O17 A 121 14 135 6 0 6 0 Honda Odyssey 01-03 O17 B 10 1 11 1 0 1 0 Honda CR-V 96-00 O18 Z 197 27 224 58 13 71 0 Honda HR-V 99-00 O19 Z 59 9 68 9 4 13 0 Honda Legend 82-85 O2 A . . . 1 0 1 1 Luxury Honda Legend 91-96 O2 B 500 50 550 59 13 72 1 Luxury Honda Legend 96-98 O2 C 24 1 25 2 0 2 1 Luxury Honda Legend 99-00 O2 D 5 1 6 1 0 1 1 Luxury Honda S2000 99-00 O20 Z 9 0 9 . . . 0 Honda Civic 0 O21 Z 4 0 4 . . . 0 Honda Accord 82-86 O3 A 1564 323 1887 269 64 333 1 Sports Honda Accord 86-90 O3 B 1351 188 1539 188 36 224 1 Sports Honda Accord 90-93 O3 C 684 85 769 79 16 95 0 Honda Accord 94-97 O3 D 1098 140 1238 128 39 167 1 Sports Honda Accord 98-00 O3 E 51 9 60 12 0 12 1 Sports Honda Prelude 82-82 O4 A 180 31 211 25 5 30 1 Sports Honda Prelude 83-91 O4 B 2217 347 2564 327 85 412 1 Small Honda Prelude 92-96 O4 C 688 91 779 86 35 121 0 Honda Prelude 97-00 O4 D 126 22 148 21 2 23 1 Commercial Honda Integra 86-88 O5 A 463 71 534 64 16 80 1 Small Honda Integra 91-93 O5 C 348 52 400 62 13 75 0 Honda Integra 93-00 O5 E 328 34 362 42 8 50 1 Medium
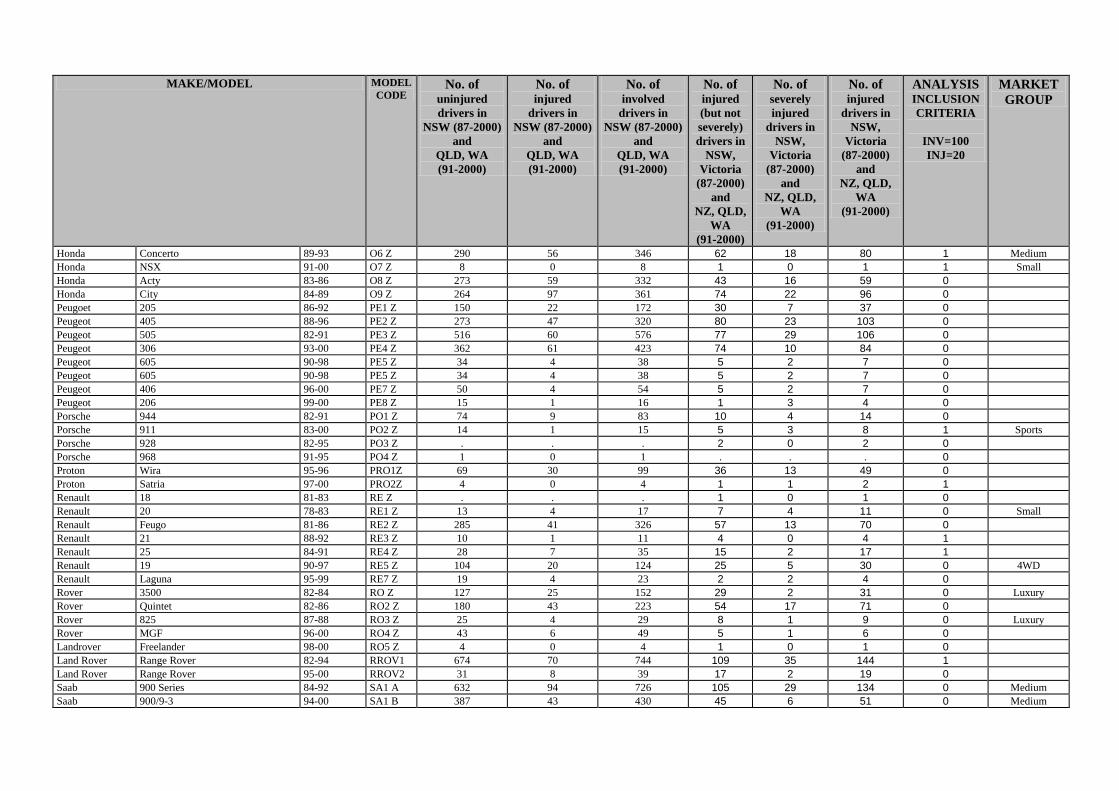
MAKE/MODEL MODEL CODE
No. of uninjured drivers in
NSW (87-2000) and
QLD, WA (91-2000)
No. of injured
drivers in NSW (87-2000)
and QLD, WA (91-2000)
No. of involved
drivers in NSW (87-2000)
and QLD, WA (91-2000)
No. of injured (but not severely) drivers in
NSW, Victoria
(87-2000) and
NZ, QLD, WA
(91-2000)
No. of severely injured
drivers in NSW,
Victoria (87-2000)
and NZ, QLD,
WA (91-2000)
No. of injured
drivers in NSW,
Victoria (87-2000)
and NZ, QLD,
WA (91-2000)
ANALYSIS INCLUSION CRITERIA
INV=100 INJ=20
MARKET GROUP
Honda Concerto 89-93 O6 Z 290 56 346 62 18 80 1 Medium Honda NSX 91-00 O7 Z 8 0 8 1 0 1 1 Small Honda Acty 83-86 O8 Z 273 59 332 43 16 59 0 Honda City 84-89 O9 Z 264 97 361 74 22 96 0 Peugoet 205 86-92 PE1 Z 150 22 172 30 7 37 0 Peugeot 405 88-96 PE2 Z 273 47 320 80 23 103 0 Peugeot 505 82-91 PE3 Z 516 60 576 77 29 106 0 Peugeot 306 93-00 PE4 Z 362 61 423 74 10 84 0 Peugeot 605 90-98 PE5 Z 34 4 38 5 2 7 0 Peugeot 605 90-98 PE5 Z 34 4 38 5 2 7 0 Peugeot 406 96-00 PE7 Z 50 4 54 5 2 7 0 Peugeot 206 99-00 PE8 Z 15 1 16 1 3 4 0 Porsche 944 82-91 PO1 Z 74 9 83 10 4 14 0 Porsche 911 83-00 PO2 Z 14 1 15 5 3 8 1 Sports Porsche 928 82-95 PO3 Z . . . 2 0 2 0 Porsche 968 91-95 PO4 Z 1 0 1 . . . 0 Proton Wira 95-96 PRO1Z 69 30 99 36 13 49 0 Proton Satria 97-00 PRO2Z 4 0 4 1 1 2 1 Renault 18 81-83 RE Z . . . 1 0 1 0 Renault 20 78-83 RE1 Z 13 4 17 7 4 11 0 Small Renault Feugo 81-86 RE2 Z 285 41 326 57 13 70 0 Renault 21 88-92 RE3 Z 10 1 11 4 0 4 1 Renault 25 84-91 RE4 Z 28 7 35 15 2 17 1 Renault 19 90-97 RE5 Z 104 20 124 25 5 30 0 4WD Renault Laguna 95-99 RE7 Z 19 4 23 2 2 4 0 Rover 3500 82-84 RO Z 127 25 152 29 2 31 0 Luxury Rover Quintet 82-86 RO2 Z 180 43 223 54 17 71 0 Rover 825 87-88 RO3 Z 25 4 29 8 1 9 0 Luxury Rover MGF 96-00 RO4 Z 43 6 49 5 1 6 0 Landrover Freelander 98-00 RO5 Z 4 0 4 1 0 1 0 Land Rover Range Rover 82-94 RROV1 674 70 744 109 35 144 1 Land Rover Range Rover 95-00 RROV2 31 8 39 17 2 19 0 Saab 900 Series 84-92 SA1 A 632 94 726 105 29 134 0 Medium Saab 900/9-3 94-00 SA1 B 387 43 430 45 6 51 0 Medium
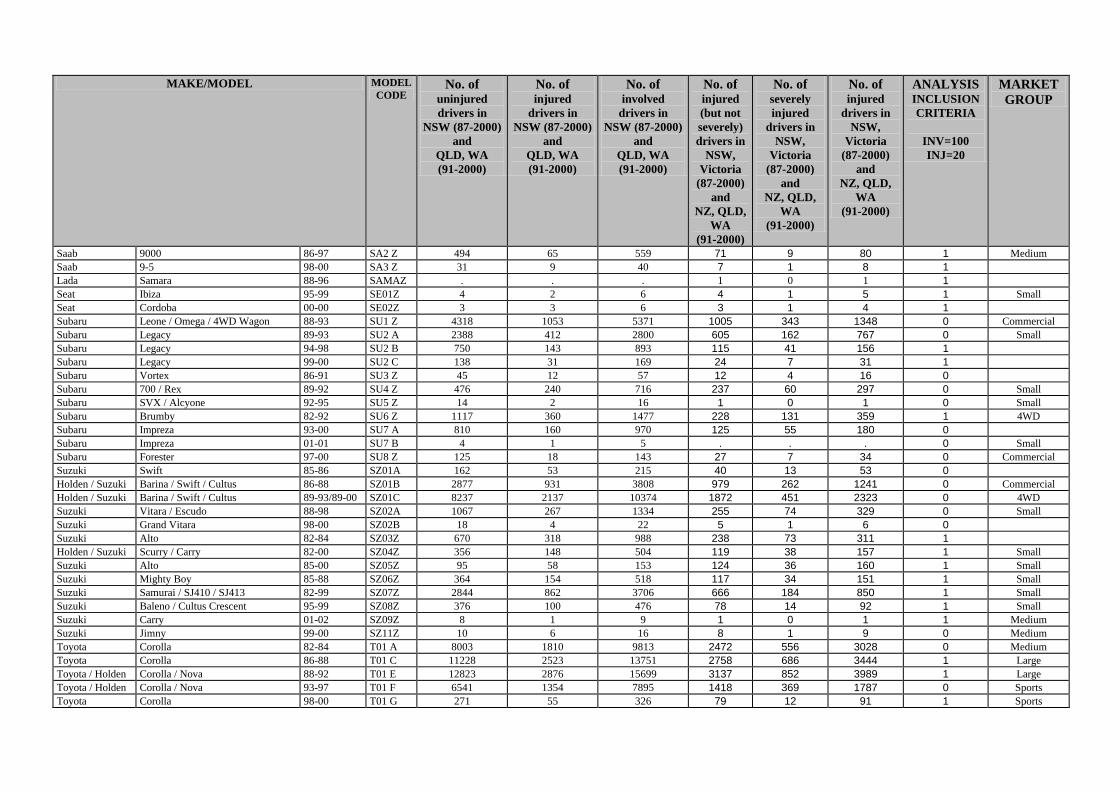
MAKE/MODEL MODEL CODE
No. of uninjured drivers in
NSW (87-2000) and
QLD, WA (91-2000)
No. of injured
drivers in NSW (87-2000)
and QLD, WA (91-2000)
No. of involved
drivers in NSW (87-2000)
and QLD, WA (91-2000)
No. of injured (but not severely) drivers in
NSW, Victoria
(87-2000) and
NZ, QLD, WA
(91-2000)
No. of severely injured
drivers in NSW,
Victoria (87-2000)
and NZ, QLD,
WA (91-2000)
No. of injured
drivers in NSW,
Victoria (87-2000)
and NZ, QLD,
WA (91-2000)
ANALYSIS INCLUSION CRITERIA
INV=100 INJ=20
MARKET GROUP
Saab 9000 86-97 SA2 Z 494 65 559 71 9 80 1 Medium Saab 9-5 98-00 SA3 Z 31 9 40 7 1 8 1 Lada Samara 88-96 SAMAZ . . . 1 0 1 1 Seat Ibiza 95-99 SE01Z 4 2 6 4 1 5 1 Small Seat Cordoba 00-00 SE02Z 3 3 6 3 1 4 1 Subaru Leone / Omega / 4WD Wagon 88-93 SU1 Z 4318 1053 5371 1005 343 1348 0 Commercial Subaru Legacy 89-93 SU2 A 2388 412 2800 605 162 767 0 Small Subaru Legacy 94-98 SU2 B 750 143 893 115 41 156 1 Subaru Legacy 99-00 SU2 C 138 31 169 24 7 31 1 Subaru Vortex 86-91 SU3 Z 45 12 57 12 4 16 0 Subaru 700 / Rex 89-92 SU4 Z 476 240 716 237 60 297 0 Small Subaru SVX / Alcyone 92-95 SU5 Z 14 2 16 1 0 1 0 Small Subaru Brumby 82-92 SU6 Z 1117 360 1477 228 131 359 1 4WD Subaru Impreza 93-00 SU7 A 810 160 970 125 55 180 0 Subaru Impreza 01-01 SU7 B 4 1 5 . . . 0 Small Subaru Forester 97-00 SU8 Z 125 18 143 27 7 34 0 Commercial Suzuki Swift 85-86 SZ01A 162 53 215 40 13 53 0 Holden / Suzuki Barina / Swift / Cultus 86-88 SZ01B 2877 931 3808 979 262 1241 0 Commercial Holden / Suzuki Barina / Swift / Cultus 89-93/89-00 SZ01C 8237 2137 10374 1872 451 2323 0 4WD Suzuki Vitara / Escudo 88-98 SZ02A 1067 267 1334 255 74 329 0 Small Suzuki Grand Vitara 98-00 SZ02B 18 4 22 5 1 6 0 Suzuki Alto 82-84 SZ03Z 670 318 988 238 73 311 1 Holden / Suzuki Scurry / Carry 82-00 SZ04Z 356 148 504 119 38 157 1 Small Suzuki Alto 85-00 SZ05Z 95 58 153 124 36 160 1 Small Suzuki Mighty Boy 85-88 SZ06Z 364 154 518 117 34 151 1 Small Suzuki Samurai / SJ410 / SJ413 82-99 SZ07Z 2844 862 3706 666 184 850 1 Small Suzuki Baleno / Cultus Crescent 95-99 SZ08Z 376 100 476 78 14 92 1 Small Suzuki Carry 01-02 SZ09Z 8 1 9 1 0 1 1 Medium Suzuki Jimny 99-00 SZ11Z 10 6 16 8 1 9 0 Medium Toyota Corolla 82-84 T01 A 8003 1810 9813 2472 556 3028 0 Medium Toyota Corolla 86-88 T01 C 11228 2523 13751 2758 686 3444 1 Large Toyota / Holden Corolla / Nova 88-92 T01 E 12823 2876 15699 3137 852 3989 1 Large Toyota / Holden Corolla / Nova 93-97 T01 F 6541 1354 7895 1418 369 1787 0 Sports Toyota Corolla 98-00 T01 G 271 55 326 79 12 91 1 Sports
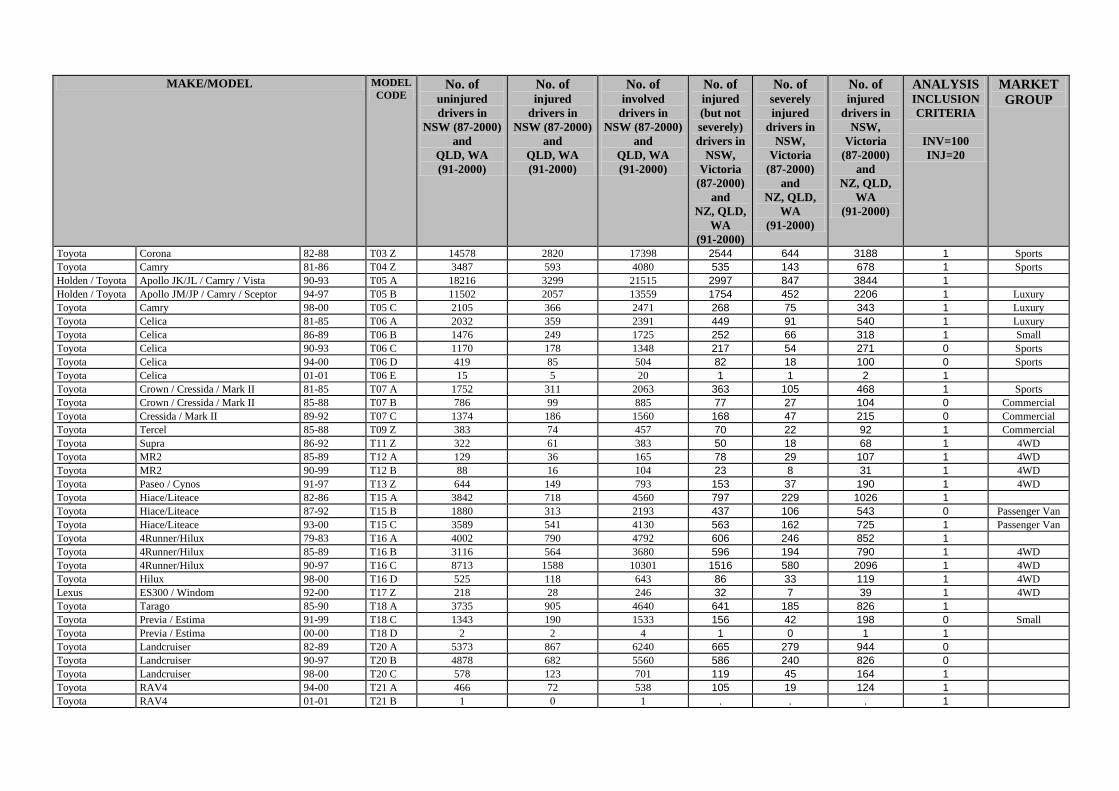
MAKE/MODEL MODEL CODE
No. of uninjured drivers in
NSW (87-2000) and
QLD, WA (91-2000)
No. of injured
drivers in NSW (87-2000)
and QLD, WA (91-2000)
No. of involved
drivers in NSW (87-2000)
and QLD, WA (91-2000)
No. of injured (but not severely) drivers in
NSW, Victoria
(87-2000) and
NZ, QLD, WA
(91-2000)
No. of severely injured
drivers in NSW,
Victoria (87-2000)
and NZ, QLD,
WA (91-2000)
No. of injured
drivers in NSW,
Victoria (87-2000)
and NZ, QLD,
WA (91-2000)
ANALYSIS INCLUSION CRITERIA
INV=100 INJ=20
MARKET GROUP
Toyota Corona 82-88 T03 Z 14578 2820 17398 2544 644 3188 1 Sports Toyota Camry 81-86 T04 Z 3487 593 4080 535 143 678 1 Sports Holden / Toyota Apollo JK/JL / Camry / Vista 90-93 T05 A 18216 3299 21515 2997 847 3844 1 Holden / Toyota Apollo JM/JP / Camry / Sceptor 94-97 T05 B 11502 2057 13559 1754 452 2206 1 Luxury Toyota Camry 98-00 T05 C 2105 366 2471 268 75 343 1 Luxury Toyota Celica 81-85 T06 A 2032 359 2391 449 91 540 1 Luxury Toyota Celica 86-89 T06 B 1476 249 1725 252 66 318 1 Small Toyota Celica 90-93 T06 C 1170 178 1348 217 54 271 0 Sports Toyota Celica 94-00 T06 D 419 85 504 82 18 100 0 Sports Toyota Celica 01-01 T06 E 15 5 20 1 1 2 1 Toyota Crown / Cressida / Mark II 81-85 T07 A 1752 311 2063 363 105 468 1 Sports Toyota Crown / Cressida / Mark II 85-88 T07 B 786 99 885 77 27 104 0 Commercial Toyota Cressida / Mark II 89-92 T07 C 1374 186 1560 168 47 215 0 Commercial Toyota Tercel 85-88 T09 Z 383 74 457 70 22 92 1 Commercial Toyota Supra 86-92 T11 Z 322 61 383 50 18 68 1 4WD Toyota MR2 85-89 T12 A 129 36 165 78 29 107 1 4WD Toyota MR2 90-99 T12 B 88 16 104 23 8 31 1 4WD Toyota Paseo / Cynos 91-97 T13 Z 644 149 793 153 37 190 1 4WD Toyota Hiace/Liteace 82-86 T15 A 3842 718 4560 797 229 1026 1 Toyota Hiace/Liteace 87-92 T15 B 1880 313 2193 437 106 543 0 Passenger Van Toyota Hiace/Liteace 93-00 T15 C 3589 541 4130 563 162 725 1 Passenger Van Toyota 4Runner/Hilux 79-83 T16 A 4002 790 4792 606 246 852 1 Toyota 4Runner/Hilux 85-89 T16 B 3116 564 3680 596 194 790 1 4WD Toyota 4Runner/Hilux 90-97 T16 C 8713 1588 10301 1516 580 2096 1 4WD Toyota Hilux 98-00 T16 D 525 118 643 86 33 119 1 4WD Lexus ES300 / Windom 92-00 T17 Z 218 28 246 32 7 39 1 4WD Toyota Tarago 85-90 T18 A 3735 905 4640 641 185 826 1 Toyota Previa / Estima 91-99 T18 C 1343 190 1533 156 42 198 0 Small Toyota Previa / Estima 00-00 T18 D 2 2 4 1 0 1 1 Toyota Landcruiser 82-89 T20 A 5373 867 6240 665 279 944 0 Toyota Landcruiser 90-97 T20 B 4878 682 5560 586 240 826 0 Toyota Landcruiser 98-00 T20 C 578 123 701 119 45 164 1 Toyota RAV4 94-00 T21 A 466 72 538 105 19 124 1 Toyota RAV4 01-01 T21 B 1 0 1 . . . 1
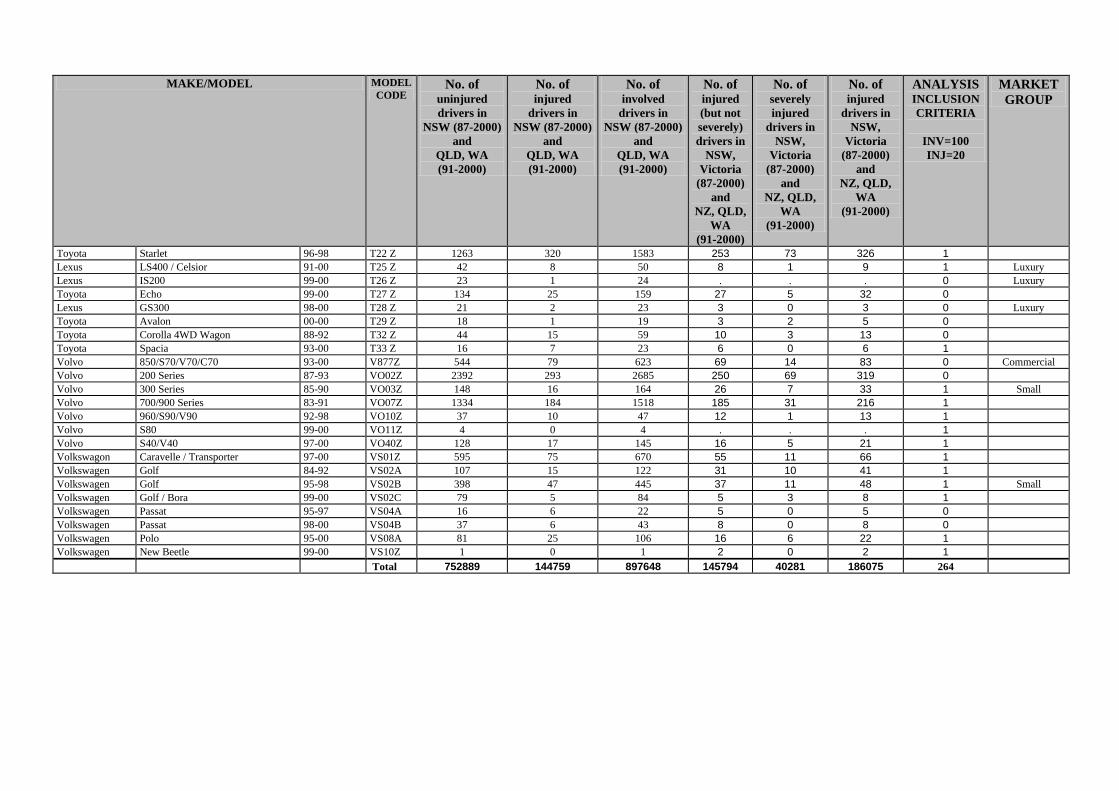
MAKE/MODEL MODEL CODE
No. of uninjured drivers in
NSW (87-2000) and
QLD, WA (91-2000)
No. of injured
drivers in NSW (87-2000)
and QLD, WA (91-2000)
No. of involved
drivers in NSW (87-2000)
and QLD, WA (91-2000)
No. of injured (but not severely) drivers in
NSW, Victoria
(87-2000) and
NZ, QLD, WA
(91-2000)
No. of severely injured
drivers in NSW,
Victoria (87-2000)
and NZ, QLD,
WA (91-2000)
No. of injured
drivers in NSW,
Victoria (87-2000)
and NZ, QLD,
WA (91-2000)
ANALYSIS INCLUSION CRITERIA
INV=100 INJ=20
MARKET GROUP
Toyota Starlet 96-98 T22 Z 1263 320 1583 253 73 326 1 Lexus LS400 / Celsior 91-00 T25 Z 42 8 50 8 1 9 1 Luxury Lexus IS200 99-00 T26 Z 23 1 24 . . . 0 Luxury Toyota Echo 99-00 T27 Z 134 25 159 27 5 32 0 Lexus GS300 98-00 T28 Z 21 2 23 3 0 3 0 Luxury Toyota Avalon 00-00 T29 Z 18 1 19 3 2 5 0 Toyota Corolla 4WD Wagon 88-92 T32 Z 44 15 59 10 3 13 0 Toyota Spacia 93-00 T33 Z 16 7 23 6 0 6 1 Volvo 850/S70/V70/C70 93-00 V877Z 544 79 623 69 14 83 0 Commercial Volvo 200 Series 87-93 VO02Z 2392 293 2685 250 69 319 0 Volvo 300 Series 85-90 VO03Z 148 16 164 26 7 33 1 Small Volvo 700/900 Series 83-91 VO07Z 1334 184 1518 185 31 216 1 Volvo 960/S90/V90 92-98 VO10Z 37 10 47 12 1 13 1 Volvo S80 99-00 VO11Z 4 0 4 . . . 1 Volvo S40/V40 97-00 VO40Z 128 17 145 16 5 21 1 Volkswagon Caravelle / Transporter 97-00 VS01Z 595 75 670 55 11 66 1 Volkswagen Golf 84-92 VS02A 107 15 122 31 10 41 1 Volkswagen Golf 95-98 VS02B 398 47 445 37 11 48 1 Small Volkswagen Golf / Bora 99-00 VS02C 79 5 84 5 3 8 1 Volkswagen Passat 95-97 VS04A 16 6 22 5 0 5 0 Volkswagen Passat 98-00 VS04B 37 6 43 8 0 8 0 Volkswagen Polo 95-00 VS08A 81 25 106 16 6 22 1 Volkswagen New Beetle 99-00 VS10Z 1 0 1 2 0 2 1 Total 752889 144759 897648 145794 40281 186075 264

APPENDIX 2
LOGISTIC REGRESSION ESTIMATES OF INJURY RISK BY MODEL AND MARKET GROUP

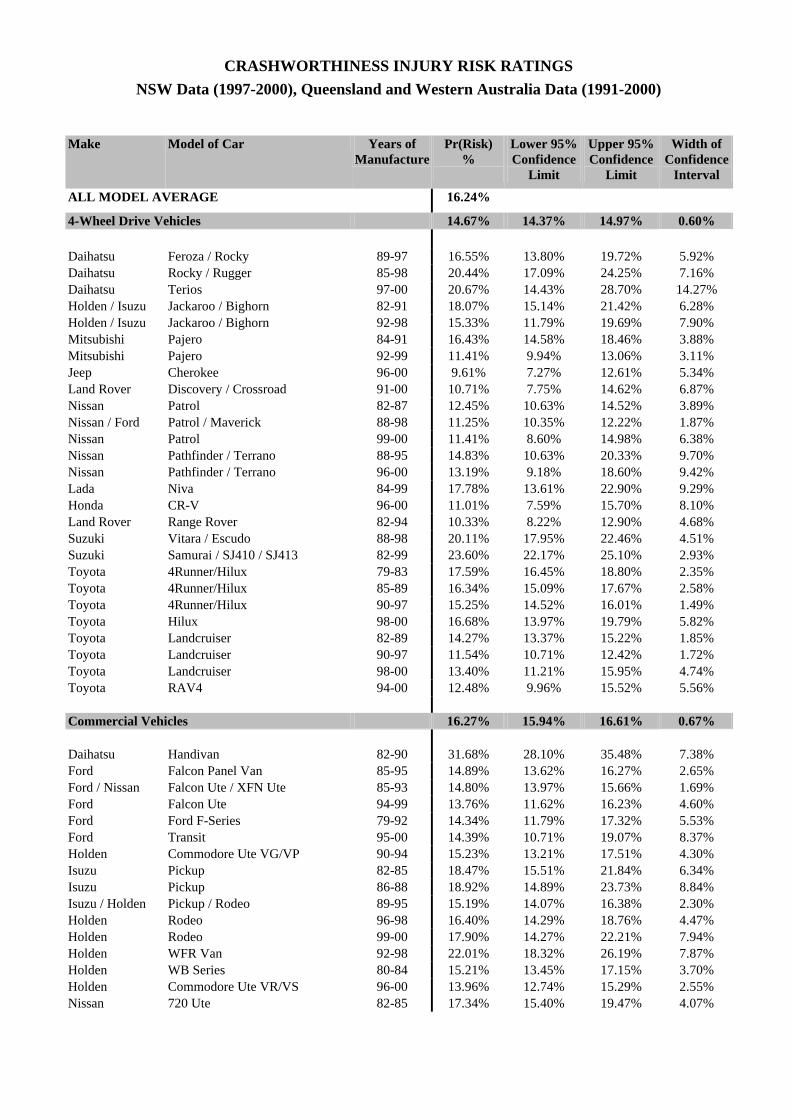
CRASHWORTHINESS INJURY RISK RATINGS
NSW Data (1997-2000), Queensland and Western Australia Data (1991-2000)
Make Model of Car Years of Manufacture
Pr(Risk) %
Lower 95% Confidence
Limit
Upper 95% Confidence
Limit
Width of Confidence
Interval
ALL MODEL AVERAGE 16.24%
4-Wheel Drive Vehicles 14.67% 14.37% 14.97% 0.60%
Daihatsu Feroza / Rocky 89-97 16.55% 13.80% 19.72% 5.92% Daihatsu Rocky / Rugger 85-98 20.44% 17.09% 24.25% 7.16% Daihatsu Terios 97-00 20.67% 14.43% 28.70% 14.27% Holden / Isuzu Jackaroo / Bighorn 82-91 18.07% 15.14% 21.42% 6.28% Holden / Isuzu Jackaroo / Bighorn 92-98 15.33% 11.79% 19.69% 7.90% Mitsubishi Pajero 84-91 16.43% 14.58% 18.46% 3.88% Mitsubishi Pajero 92-99 11.41% 9.94% 13.06% 3.11% Jeep Cherokee 96-00 9.61% 7.27% 12.61% 5.34% Land Rover Discovery / Crossroad 91-00 10.71% 7.75% 14.62% 6.87% Nissan Patrol 82-87 12.45% 10.63% 14.52% 3.89% Nissan / Ford Patrol / Maverick 88-98 11.25% 10.35% 12.22% 1.87% Nissan Patrol 99-00 11.41% 8.60% 14.98% 6.38% Nissan Pathfinder / Terrano 88-95 14.83% 10.63% 20.33% 9.70% Nissan Pathfinder / Terrano 96-00 13.19% 9.18% 18.60% 9.42% Lada Niva 84-99 17.78% 13.61% 22.90% 9.29% Honda CR-V 96-00 11.01% 7.59% 15.70% 8.10% Land Rover Range Rover 82-94 10.33% 8.22% 12.90% 4.68% Suzuki Vitara / Escudo 88-98 20.11% 17.95% 22.46% 4.51% Suzuki Samurai / SJ410 / SJ413 82-99 23.60% 22.17% 25.10% 2.93% Toyota 4Runner/Hilux 79-83 17.59% 16.45% 18.80% 2.35% Toyota 4Runner/Hilux 85-89 16.34% 15.09% 17.67% 2.58% Toyota 4Runner/Hilux 90-97 15.25% 14.52% 16.01% 1.49% Toyota Hilux 98-00 16.68% 13.97% 19.79% 5.82% Toyota Landcruiser 82-89 14.27% 13.37% 15.22% 1.85% Toyota Landcruiser 90-97 11.54% 10.71% 12.42% 1.72% Toyota Landcruiser 98-00 13.40% 11.21% 15.95% 4.74% Toyota RAV4 94-00 12.48% 9.96% 15.52% 5.56% Commercial Vehicles 16.27% 15.94% 16.61% 0.67% Daihatsu Handivan 82-90 31.68% 28.10% 35.48% 7.38% Ford Falcon Panel Van 85-95 14.89% 13.62% 16.27% 2.65% Ford / Nissan Falcon Ute / XFN Ute 85-93 14.80% 13.97% 15.66% 1.69% Ford Falcon Ute 94-99 13.76% 11.62% 16.23% 4.60% Ford Ford F-Series 79-92 14.34% 11.79% 17.32% 5.53% Ford Transit 95-00 14.39% 10.71% 19.07% 8.37% Holden Commodore Ute VG/VP 90-94 15.23% 13.21% 17.51% 4.30% Isuzu Pickup 82-85 18.47% 15.51% 21.84% 6.34% Isuzu Pickup 86-88 18.92% 14.89% 23.73% 8.84% Isuzu / Holden Pickup / Rodeo 89-95 15.19% 14.07% 16.38% 2.30% Holden Rodeo 96-98 16.40% 14.29% 18.76% 4.47% Holden Rodeo 99-00 17.90% 14.27% 22.21% 7.94% Holden WFR Van 92-98 22.01% 18.32% 26.19% 7.87% Holden WB Series 80-84 15.21% 13.45% 17.15% 3.70% Holden Commodore Ute VR/VS 96-00 13.96% 12.74% 15.29% 2.55% Nissan 720 Ute 82-85 17.34% 15.40% 19.47% 4.07%
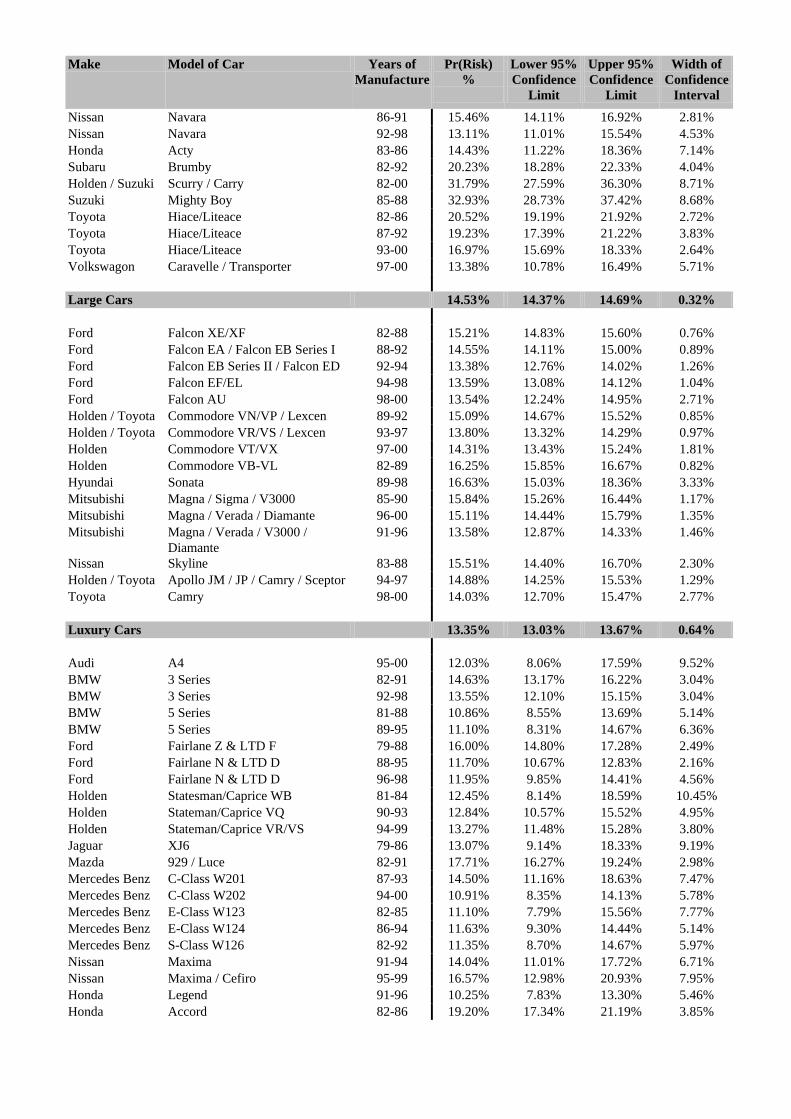
Make Model of Car Years of Manufacture
Pr(Risk) %
Lower 95% Confidence
Limit
Upper 95% Confidence
Limit
Width of Confidence
Interval
Nissan Navara 86-91 15.46% 14.11% 16.92% 2.81% Nissan Navara 92-98 13.11% 11.01% 15.54% 4.53% Honda Acty 83-86 14.43% 11.22% 18.36% 7.14% Subaru Brumby 82-92 20.23% 18.28% 22.33% 4.04% Holden / Suzuki Scurry / Carry 82-00 31.79% 27.59% 36.30% 8.71% Suzuki Mighty Boy 85-88 32.93% 28.73% 37.42% 8.68% Toyota Hiace/Liteace 82-86 20.52% 19.19% 21.92% 2.72% Toyota Hiace/Liteace 87-92 19.23% 17.39% 21.22% 3.83% Toyota Hiace/Liteace 93-00 16.97% 15.69% 18.33% 2.64% Volkswagon Caravelle / Transporter 97-00 13.38% 10.78% 16.49% 5.71%
Large Cars 14.53% 14.37% 14.69% 0.32% Ford Falcon XE/XF 82-88 15.21% 14.83% 15.60% 0.76% Ford Falcon EA / Falcon EB Series I 88-92 14.55% 14.11% 15.00% 0.89% Ford Falcon EB Series II / Falcon ED 92-94 13.38% 12.76% 14.02% 1.26% Ford Falcon EF/EL 94-98 13.59% 13.08% 14.12% 1.04% Ford Falcon AU 98-00 13.54% 12.24% 14.95% 2.71% Holden / Toyota Commodore VN/VP / Lexcen 89-92 15.09% 14.67% 15.52% 0.85% Holden / Toyota Commodore VR/VS / Lexcen 93-97 13.80% 13.32% 14.29% 0.97% Holden Commodore VT/VX 97-00 14.31% 13.43% 15.24% 1.81% Holden Commodore VB-VL 82-89 16.25% 15.85% 16.67% 0.82% Hyundai Sonata 89-98 16.63% 15.03% 18.36% 3.33% Mitsubishi Magna / Sigma / V3000 85-90 15.84% 15.26% 16.44% 1.17% Mitsubishi Magna / Verada / Diamante 96-00 15.11% 14.44% 15.79% 1.35% Mitsubishi Magna / Verada / V3000 /
Diamante 91-96 13.58% 12.87% 14.33% 1.46%
Nissan Skyline 83-88 15.51% 14.40% 16.70% 2.30% Holden / Toyota Apollo JM / JP / Camry / Sceptor 94-97 14.88% 14.25% 15.53% 1.29% Toyota Camry 98-00 14.03% 12.70% 15.47% 2.77% Luxury Cars 13.35% 13.03% 13.67% 0.64% Audi A4 95-00 12.03% 8.06% 17.59% 9.52% BMW 3 Series 82-91 14.63% 13.17% 16.22% 3.04% BMW 3 Series 92-98 13.55% 12.10% 15.15% 3.04% BMW 5 Series 81-88 10.86% 8.55% 13.69% 5.14% BMW 5 Series 89-95 11.10% 8.31% 14.67% 6.36% Ford Fairlane Z & LTD F 79-88 16.00% 14.80% 17.28% 2.49% Ford Fairlane N & LTD D 88-95 11.70% 10.67% 12.83% 2.16% Ford Fairlane N & LTD D 96-98 11.95% 9.85% 14.41% 4.56% Holden Statesman/Caprice WB 81-84 12.45% 8.14% 18.59% 10.45% Holden Stateman/Caprice VQ 90-93 12.84% 10.57% 15.52% 4.95% Holden Stateman/Caprice VR/VS 94-99 13.27% 11.48% 15.28% 3.80% Jaguar XJ6 79-86 13.07% 9.14% 18.33% 9.19% Mazda 929 / Luce 82-91 17.71% 16.27% 19.24% 2.98% Mercedes Benz C-Class W201 87-93 14.50% 11.16% 18.63% 7.47% Mercedes Benz C-Class W202 94-00 10.91% 8.35% 14.13% 5.78% Mercedes Benz E-Class W123 82-85 11.10% 7.79% 15.56% 7.77% Mercedes Benz E-Class W124 86-94 11.63% 9.30% 14.44% 5.14% Mercedes Benz S-Class W126 82-92 11.35% 8.70% 14.67% 5.97% Nissan Maxima 91-94 14.04% 11.01% 17.72% 6.71% Nissan Maxima / Cefiro 95-99 16.57% 12.98% 20.93% 7.95% Honda Legend 91-96 10.25% 7.83% 13.30% 5.46% Honda Accord 82-86 19.20% 17.34% 21.19% 3.85%
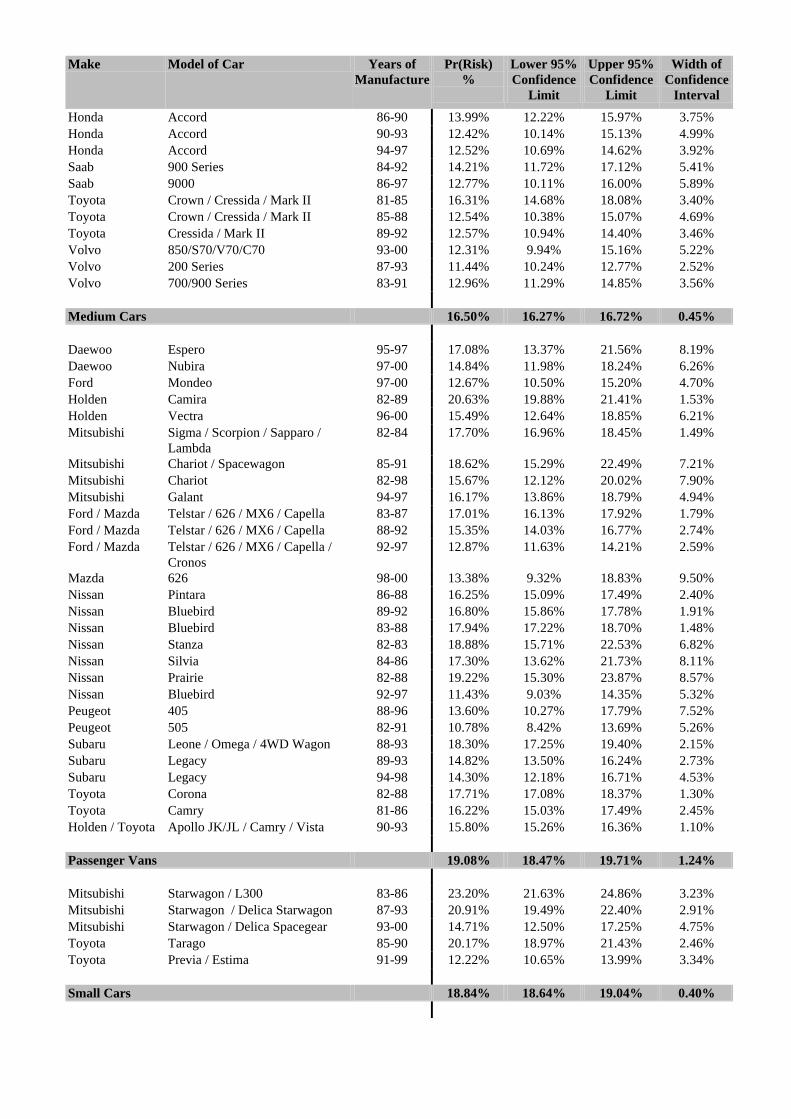
Make Model of Car Years of Manufacture
Pr(Risk) %
Lower 95% Confidence
Limit
Upper 95% Confidence
Limit
Width of Confidence
Interval
Honda Accord 86-90 13.99% 12.22% 15.97% 3.75% Honda Accord 90-93 12.42% 10.14% 15.13% 4.99% Honda Accord 94-97 12.52% 10.69% 14.62% 3.92% Saab 900 Series 84-92 14.21% 11.72% 17.12% 5.41% Saab 9000 86-97 12.77% 10.11% 16.00% 5.89% Toyota Crown / Cressida / Mark II 81-85 16.31% 14.68% 18.08% 3.40% Toyota Crown / Cressida / Mark II 85-88 12.54% 10.38% 15.07% 4.69% Toyota Cressida / Mark II 89-92 12.57% 10.94% 14.40% 3.46% Volvo 850/S70/V70/C70 93-00 12.31% 9.94% 15.16% 5.22% Volvo 200 Series 87-93 11.44% 10.24% 12.77% 2.52% Volvo 700/900 Series 83-91 12.96% 11.29% 14.85% 3.56% Medium Cars 16.50% 16.27% 16.72% 0.45% Daewoo Espero 95-97 17.08% 13.37% 21.56% 8.19% Daewoo Nubira 97-00 14.84% 11.98% 18.24% 6.26% Ford Mondeo 97-00 12.67% 10.50% 15.20% 4.70% Holden Camira 82-89 20.63% 19.88% 21.41% 1.53% Holden Vectra 96-00 15.49% 12.64% 18.85% 6.21% Mitsubishi Sigma / Scorpion / Sapparo /
Lambda 82-84 17.70% 16.96% 18.45% 1.49%
Mitsubishi Chariot / Spacewagon 85-91 18.62% 15.29% 22.49% 7.21% Mitsubishi Chariot 82-98 15.67% 12.12% 20.02% 7.90% Mitsubishi Galant 94-97 16.17% 13.86% 18.79% 4.94% Ford / Mazda Telstar / 626 / MX6 / Capella 83-87 17.01% 16.13% 17.92% 1.79% Ford / Mazda Telstar / 626 / MX6 / Capella 88-92 15.35% 14.03% 16.77% 2.74% Ford / Mazda Telstar / 626 / MX6 / Capella /
Cronos 92-97 12.87% 11.63% 14.21% 2.59%
Mazda 626 98-00 13.38% 9.32% 18.83% 9.50% Nissan Pintara 86-88 16.25% 15.09% 17.49% 2.40% Nissan Bluebird 89-92 16.80% 15.86% 17.78% 1.91% Nissan Bluebird 83-88 17.94% 17.22% 18.70% 1.48% Nissan Stanza 82-83 18.88% 15.71% 22.53% 6.82% Nissan Silvia 84-86 17.30% 13.62% 21.73% 8.11% Nissan Prairie 82-88 19.22% 15.30% 23.87% 8.57% Nissan Bluebird 92-97 11.43% 9.03% 14.35% 5.32% Peugeot 405 88-96 13.60% 10.27% 17.79% 7.52% Peugeot 505 82-91 10.78% 8.42% 13.69% 5.26% Subaru Leone / Omega / 4WD Wagon 88-93 18.30% 17.25% 19.40% 2.15% Subaru Legacy 89-93 14.82% 13.50% 16.24% 2.73% Subaru Legacy 94-98 14.30% 12.18% 16.71% 4.53% Toyota Corona 82-88 17.71% 17.08% 18.37% 1.30% Toyota Camry 81-86 16.22% 15.03% 17.49% 2.45% Holden / Toyota Apollo JK/JL / Camry / Vista 90-93 15.80% 15.26% 16.36% 1.10% Passenger Vans 19.08% 18.47% 19.71% 1.24% Mitsubishi Starwagon / L300 83-86 23.20% 21.63% 24.86% 3.23% Mitsubishi Starwagon / Delica Starwagon 87-93 20.91% 19.49% 22.40% 2.91% Mitsubishi Starwagon / Delica Spacegear 93-00 14.71% 12.50% 17.25% 4.75% Toyota Tarago 85-90 20.17% 18.97% 21.43% 2.46% Toyota Previa / Estima 91-99 12.22% 10.65% 13.99% 3.34%
Small Cars 18.84% 18.64% 19.04% 0.40%
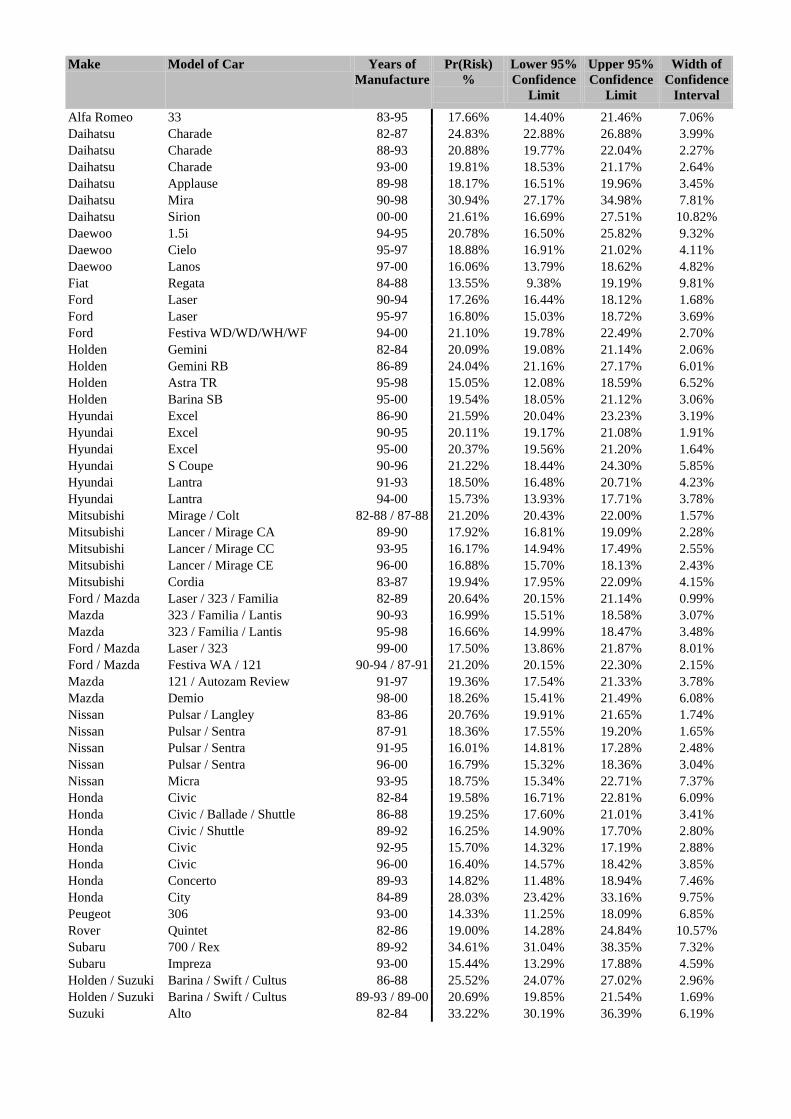
Make Model of Car Years of Manufacture
Pr(Risk) %
Lower 95% Confidence
Limit
Upper 95% Confidence
Limit
Width of Confidence
Interval
Alfa Romeo 33 83-95 17.66% 14.40% 21.46% 7.06% Daihatsu Charade 82-87 24.83% 22.88% 26.88% 3.99% Daihatsu Charade 88-93 20.88% 19.77% 22.04% 2.27% Daihatsu Charade 93-00 19.81% 18.53% 21.17% 2.64% Daihatsu Applause 89-98 18.17% 16.51% 19.96% 3.45% Daihatsu Mira 90-98 30.94% 27.17% 34.98% 7.81% Daihatsu Sirion 00-00 21.61% 16.69% 27.51% 10.82% Daewoo 1.5i 94-95 20.78% 16.50% 25.82% 9.32% Daewoo Cielo 95-97 18.88% 16.91% 21.02% 4.11% Daewoo Lanos 97-00 16.06% 13.79% 18.62% 4.82% Fiat Regata 84-88 13.55% 9.38% 19.19% 9.81% Ford Laser 90-94 17.26% 16.44% 18.12% 1.68% Ford Laser 95-97 16.80% 15.03% 18.72% 3.69% Ford Festiva WD/WD/WH/WF 94-00 21.10% 19.78% 22.49% 2.70% Holden Gemini 82-84 20.09% 19.08% 21.14% 2.06% Holden Gemini RB 86-89 24.04% 21.16% 27.17% 6.01% Holden Astra TR 95-98 15.05% 12.08% 18.59% 6.52% Holden Barina SB 95-00 19.54% 18.05% 21.12% 3.06% Hyundai Excel 86-90 21.59% 20.04% 23.23% 3.19% Hyundai Excel 90-95 20.11% 19.17% 21.08% 1.91% Hyundai Excel 95-00 20.37% 19.56% 21.20% 1.64% Hyundai S Coupe 90-96 21.22% 18.44% 24.30% 5.85% Hyundai Lantra 91-93 18.50% 16.48% 20.71% 4.23% Hyundai Lantra 94-00 15.73% 13.93% 17.71% 3.78% Mitsubishi Mirage / Colt 82-88 / 87-88 21.20% 20.43% 22.00% 1.57% Mitsubishi Lancer / Mirage CA 89-90 17.92% 16.81% 19.09% 2.28% Mitsubishi Lancer / Mirage CC 93-95 16.17% 14.94% 17.49% 2.55% Mitsubishi Lancer / Mirage CE 96-00 16.88% 15.70% 18.13% 2.43% Mitsubishi Cordia 83-87 19.94% 17.95% 22.09% 4.15% Ford / Mazda Laser / 323 / Familia 82-89 20.64% 20.15% 21.14% 0.99% Mazda 323 / Familia / Lantis 90-93 16.99% 15.51% 18.58% 3.07% Mazda 323 / Familia / Lantis 95-98 16.66% 14.99% 18.47% 3.48% Ford / Mazda Laser / 323 99-00 17.50% 13.86% 21.87% 8.01% Ford / Mazda Festiva WA / 121 90-94 / 87-91 21.20% 20.15% 22.30% 2.15% Mazda 121 / Autozam Review 91-97 19.36% 17.54% 21.33% 3.78% Mazda Demio 98-00 18.26% 15.41% 21.49% 6.08% Nissan Pulsar / Langley 83-86 20.76% 19.91% 21.65% 1.74% Nissan Pulsar / Sentra 87-91 18.36% 17.55% 19.20% 1.65% Nissan Pulsar / Sentra 91-95 16.01% 14.81% 17.28% 2.48% Nissan Pulsar / Sentra 96-00 16.79% 15.32% 18.36% 3.04% Nissan Micra 93-95 18.75% 15.34% 22.71% 7.37% Honda Civic 82-84 19.58% 16.71% 22.81% 6.09% Honda Civic / Ballade / Shuttle 86-88 19.25% 17.60% 21.01% 3.41% Honda Civic / Shuttle 89-92 16.25% 14.90% 17.70% 2.80% Honda Civic 92-95 15.70% 14.32% 17.19% 2.88% Honda Civic 96-00 16.40% 14.57% 18.42% 3.85% Honda Concerto 89-93 14.82% 11.48% 18.94% 7.46% Honda City 84-89 28.03% 23.42% 33.16% 9.75% Peugeot 306 93-00 14.33% 11.25% 18.09% 6.85% Rover Quintet 82-86 19.00% 14.28% 24.84% 10.57% Subaru 700 / Rex 89-92 34.61% 31.04% 38.35% 7.32% Subaru Impreza 93-00 15.44% 13.29% 17.88% 4.59% Holden / Suzuki Barina / Swift / Cultus 86-88 25.52% 24.07% 27.02% 2.96% Holden / Suzuki Barina / Swift / Cultus 89-93 / 89-00 20.69% 19.85% 21.54% 1.69% Suzuki Alto 82-84 33.22% 30.19% 36.39% 6.19%
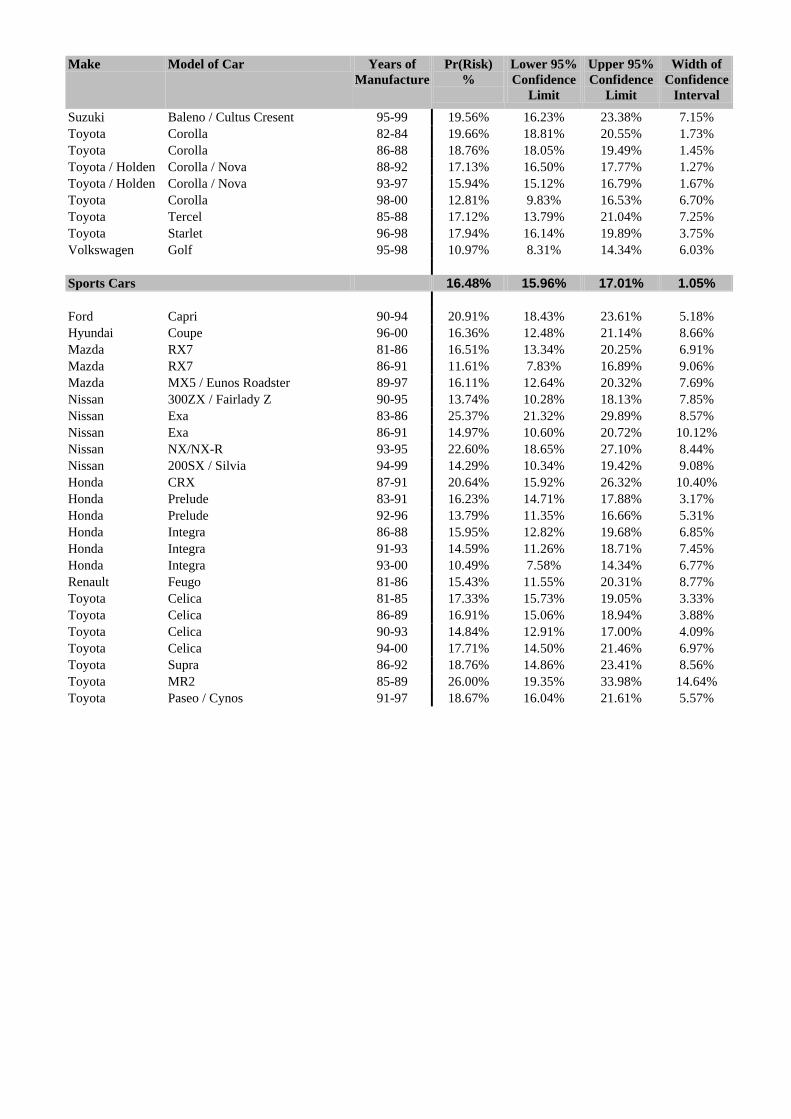
Make Model of Car Years of Manufacture
Pr(Risk) %
Lower 95% Confidence
Limit
Upper 95% Confidence
Limit
Width of Confidence
Interval
Suzuki Baleno / Cultus Cresent 95-99 19.56% 16.23% 23.38% 7.15% Toyota Corolla 82-84 19.66% 18.81% 20.55% 1.73% Toyota Corolla 86-88 18.76% 18.05% 19.49% 1.45% Toyota / Holden Corolla / Nova 88-92 17.13% 16.50% 17.77% 1.27% Toyota / Holden Corolla / Nova 93-97 15.94% 15.12% 16.79% 1.67% Toyota Corolla 98-00 12.81% 9.83% 16.53% 6.70% Toyota Tercel 85-88 17.12% 13.79% 21.04% 7.25% Toyota Starlet 96-98 17.94% 16.14% 19.89% 3.75% Volkswagen Golf 95-98 10.97% 8.31% 14.34% 6.03%
Sports Cars 16.48% 15.96% 17.01% 1.05% Ford Capri 90-94 20.91% 18.43% 23.61% 5.18% Hyundai Coupe 96-00 16.36% 12.48% 21.14% 8.66% Mazda RX7 81-86 16.51% 13.34% 20.25% 6.91% Mazda RX7 86-91 11.61% 7.83% 16.89% 9.06% Mazda MX5 / Eunos Roadster 89-97 16.11% 12.64% 20.32% 7.69% Nissan 300ZX / Fairlady Z 90-95 13.74% 10.28% 18.13% 7.85% Nissan Exa 83-86 25.37% 21.32% 29.89% 8.57% Nissan Exa 86-91 14.97% 10.60% 20.72% 10.12% Nissan NX/NX-R 93-95 22.60% 18.65% 27.10% 8.44% Nissan 200SX / Silvia 94-99 14.29% 10.34% 19.42% 9.08% Honda CRX 87-91 20.64% 15.92% 26.32% 10.40% Honda Prelude 83-91 16.23% 14.71% 17.88% 3.17% Honda Prelude 92-96 13.79% 11.35% 16.66% 5.31% Honda Integra 86-88 15.95% 12.82% 19.68% 6.85% Honda Integra 91-93 14.59% 11.26% 18.71% 7.45% Honda Integra 93-00 10.49% 7.58% 14.34% 6.77% Renault Feugo 81-86 15.43% 11.55% 20.31% 8.77% Toyota Celica 81-85 17.33% 15.73% 19.05% 3.33% Toyota Celica 86-89 16.91% 15.06% 18.94% 3.88% Toyota Celica 90-93 14.84% 12.91% 17.00% 4.09% Toyota Celica 94-00 17.71% 14.50% 21.46% 6.97% Toyota Supra 86-92 18.76% 14.86% 23.41% 8.56% Toyota MR2 85-89 26.00% 19.35% 33.98% 14.64% Toyota Paseo / Cynos 91-97 18.67% 16.04% 21.61% 5.57%

APPENDIX 3
LOGISTIC REGRESSION ESTIMATES OF INJURY SEVERITY BY MODEL AND MARKET GROUP
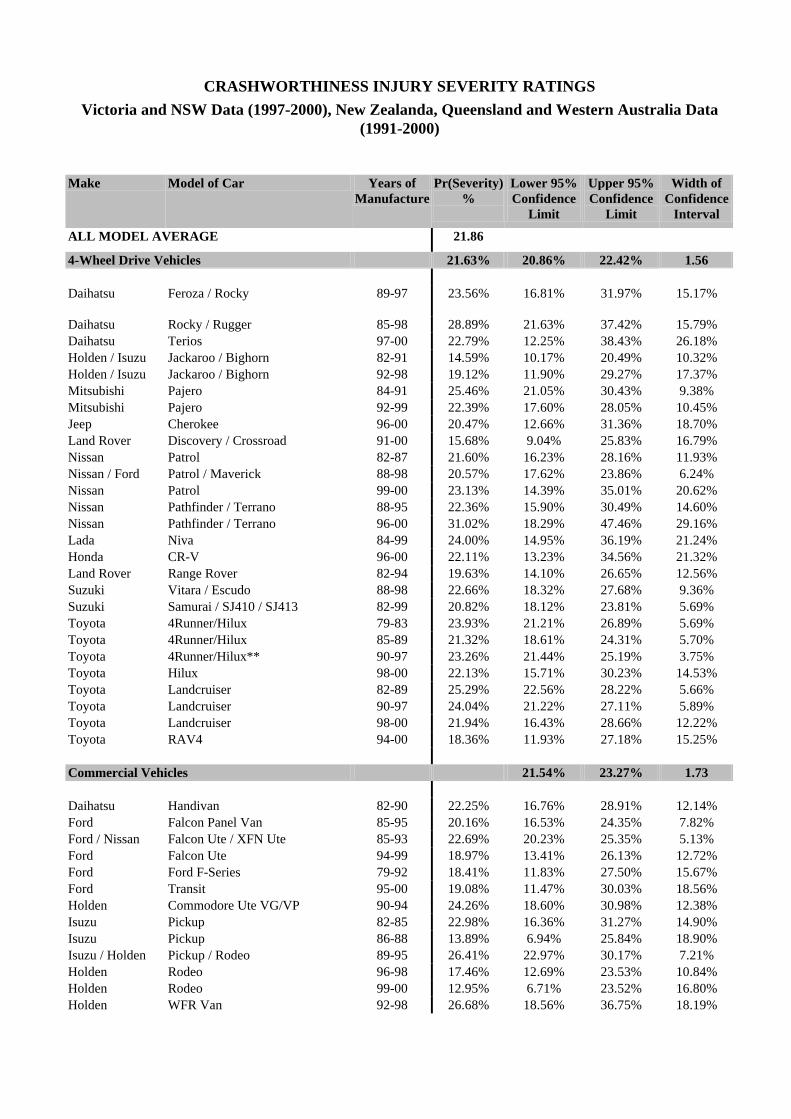
CRASHWORTHINESS INJURY SEVERITY RATINGS
Victoria and NSW Data (1997-2000), New Zealanda, Queensland and Western Australia Data (1991-2000)
Make Model of Car Years of Manufacture
Pr(Severity) %
Lower 95% Confidence
Limit
Upper 95% Confidence
Limit
Width of Confidence
Interval
ALL MODEL AVERAGE 21.86
4-Wheel Drive Vehicles 21.63% 20.86% 22.42% 1.56 Daihatsu Feroza / Rocky 89-97 23.56%
16.81% 31.97% 15.17%
Daihatsu Rocky / Rugger 85-98 28.89% 21.63% 37.42% 15.79% Daihatsu Terios 97-00 22.79% 12.25% 38.43% 26.18% Holden / Isuzu Jackaroo / Bighorn 82-91 14.59% 10.17% 20.49% 10.32% Holden / Isuzu Jackaroo / Bighorn 92-98 19.12% 11.90% 29.27% 17.37% Mitsubishi Pajero 84-91 25.46% 21.05% 30.43% 9.38% Mitsubishi Pajero 92-99 22.39% 17.60% 28.05% 10.45% Jeep Cherokee 96-00 20.47% 12.66% 31.36% 18.70% Land Rover Discovery / Crossroad 91-00 15.68% 9.04% 25.83% 16.79% Nissan Patrol 82-87 21.60% 16.23% 28.16% 11.93% Nissan / Ford Patrol / Maverick 88-98 20.57% 17.62% 23.86% 6.24% Nissan Patrol 99-00 23.13% 14.39% 35.01% 20.62% Nissan Pathfinder / Terrano 88-95 22.36% 15.90% 30.49% 14.60% Nissan Pathfinder / Terrano 96-00 31.02% 18.29% 47.46% 29.16% Lada Niva 84-99 24.00% 14.95% 36.19% 21.24% Honda CR-V 96-00 22.11% 13.23% 34.56% 21.32% Land Rover Range Rover 82-94 19.63% 14.10% 26.65% 12.56% Suzuki Vitara / Escudo 88-98 22.66% 18.32% 27.68% 9.36% Suzuki Samurai / SJ410 / SJ413 82-99 20.82% 18.12% 23.81% 5.69% Toyota 4Runner/Hilux 79-83 23.93% 21.21% 26.89% 5.69% Toyota 4Runner/Hilux 85-89 21.32% 18.61% 24.31% 5.70% Toyota 4Runner/Hilux** 90-97 23.26% 21.44% 25.19% 3.75% Toyota Hilux 98-00 22.13% 15.71% 30.23% 14.53% Toyota Landcruiser 82-89 25.29% 22.56% 28.22% 5.66% Toyota Landcruiser 90-97 24.04% 21.22% 27.11% 5.89% Toyota Landcruiser 98-00 21.94% 16.43% 28.66% 12.22% Toyota RAV4 94-00 18.36% 11.93% 27.18% 15.25% Commercial Vehicles 21.54% 23.27% 1.73 Daihatsu Handivan 82-90 22.25% 16.76% 28.91% 12.14% Ford Falcon Panel Van 85-95 20.16% 16.53% 24.35% 7.82% Ford / Nissan Falcon Ute / XFN Ute 85-93 22.69% 20.23% 25.35% 5.13% Ford Falcon Ute 94-99 18.97% 13.41% 26.13% 12.72% Ford Ford F-Series 79-92 18.41% 11.83% 27.50% 15.67% Ford Transit 95-00 19.08% 11.47% 30.03% 18.56% Holden Commodore Ute VG/VP 90-94 24.26% 18.60% 30.98% 12.38% Isuzu Pickup 82-85 22.98% 16.36% 31.27% 14.90% Isuzu Pickup 86-88 13.89% 6.94% 25.84% 18.90% Isuzu / Holden Pickup / Rodeo 89-95 26.41% 22.97% 30.17% 7.21% Holden Rodeo 96-98 17.46% 12.69% 23.53% 10.84% Holden Rodeo 99-00 12.95% 6.71% 23.52% 16.80% Holden WFR Van 92-98 26.68% 18.56% 36.75% 18.19%
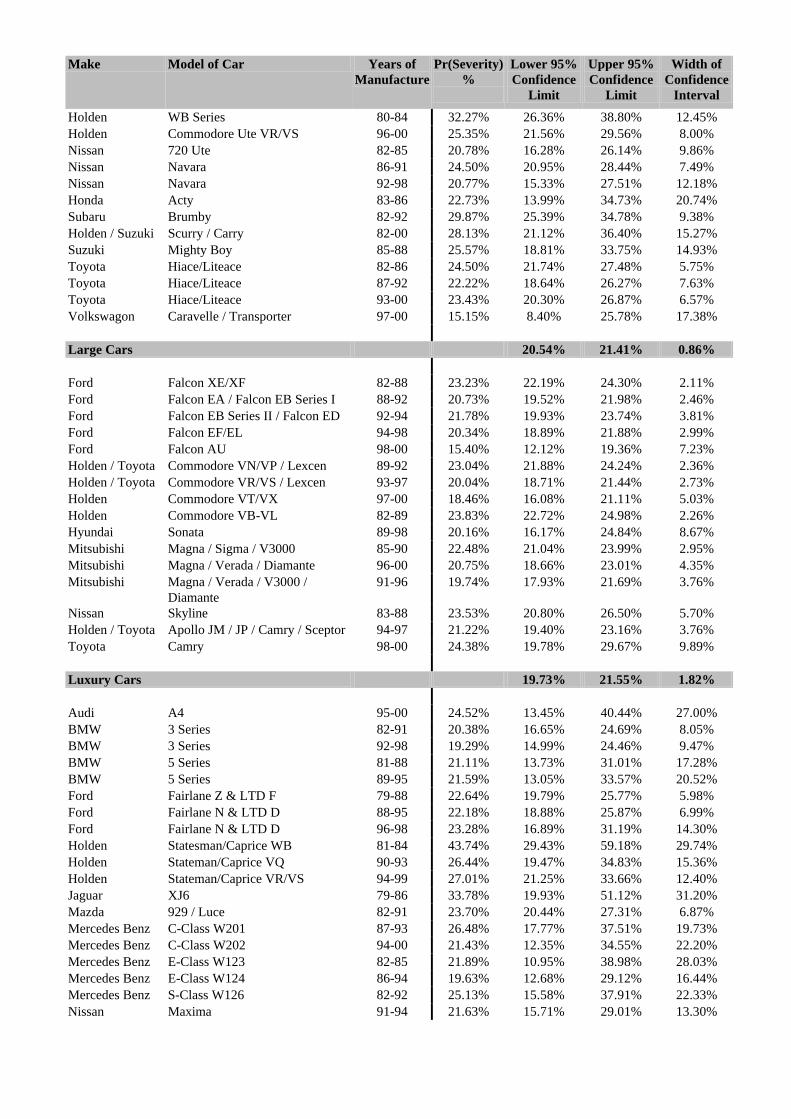
Make Model of Car Years of Manufacture
Pr(Severity) %
Lower 95% Confidence
Limit
Upper 95% Confidence
Limit
Width of Confidence
Interval
Holden WB Series 80-84 32.27% 26.36% 38.80% 12.45% Holden Commodore Ute VR/VS 96-00 25.35% 21.56% 29.56% 8.00% Nissan 720 Ute 82-85 20.78% 16.28% 26.14% 9.86% Nissan Navara 86-91 24.50% 20.95% 28.44% 7.49% Nissan Navara 92-98 20.77% 15.33% 27.51% 12.18% Honda Acty 83-86 22.73% 13.99% 34.73% 20.74% Subaru Brumby 82-92 29.87% 25.39% 34.78% 9.38% Holden / Suzuki Scurry / Carry 82-00 28.13% 21.12% 36.40% 15.27% Suzuki Mighty Boy 85-88 25.57% 18.81% 33.75% 14.93% Toyota Hiace/Liteace 82-86 24.50% 21.74% 27.48% 5.75% Toyota Hiace/Liteace 87-92 22.22% 18.64% 26.27% 7.63% Toyota Hiace/Liteace 93-00 23.43% 20.30% 26.87% 6.57% Volkswagon Caravelle / Transporter 97-00 15.15% 8.40% 25.78% 17.38%
Large Cars 20.54% 21.41% 0.86% Ford Falcon XE/XF 82-88 23.23% 22.19% 24.30% 2.11% Ford Falcon EA / Falcon EB Series I 88-92 20.73% 19.52% 21.98% 2.46% Ford Falcon EB Series II / Falcon ED 92-94 21.78% 19.93% 23.74% 3.81% Ford Falcon EF/EL 94-98 20.34% 18.89% 21.88% 2.99% Ford Falcon AU 98-00 15.40% 12.12% 19.36% 7.23% Holden / Toyota Commodore VN/VP / Lexcen 89-92 23.04% 21.88% 24.24% 2.36% Holden / Toyota Commodore VR/VS / Lexcen 93-97 20.04% 18.71% 21.44% 2.73% Holden Commodore VT/VX 97-00 18.46% 16.08% 21.11% 5.03% Holden Commodore VB-VL 82-89 23.83% 22.72% 24.98% 2.26% Hyundai Sonata 89-98 20.16% 16.17% 24.84% 8.67% Mitsubishi Magna / Sigma / V3000 85-90 22.48% 21.04% 23.99% 2.95% Mitsubishi Magna / Verada / Diamante 96-00 20.75% 18.66% 23.01% 4.35% Mitsubishi Magna / Verada / V3000 /
Diamante 91-96 19.74% 17.93% 21.69% 3.76%
Nissan Skyline 83-88 23.53% 20.80% 26.50% 5.70% Holden / Toyota Apollo JM / JP / Camry / Sceptor 94-97 21.22% 19.40% 23.16% 3.76% Toyota Camry 98-00 24.38% 19.78% 29.67% 9.89% Luxury Cars 19.73% 21.55% 1.82% Audi A4 95-00 24.52% 13.45% 40.44% 27.00% BMW 3 Series 82-91 20.38% 16.65% 24.69% 8.05% BMW 3 Series 92-98 19.29% 14.99% 24.46% 9.47% BMW 5 Series 81-88 21.11% 13.73% 31.01% 17.28% BMW 5 Series 89-95 21.59% 13.05% 33.57% 20.52% Ford Fairlane Z & LTD F 79-88 22.64% 19.79% 25.77% 5.98% Ford Fairlane N & LTD D 88-95 22.18% 18.88% 25.87% 6.99% Ford Fairlane N & LTD D 96-98 23.28% 16.89% 31.19% 14.30% Holden Statesman/Caprice WB 81-84 43.74% 29.43% 59.18% 29.74% Holden Stateman/Caprice VQ 90-93 26.44% 19.47% 34.83% 15.36% Holden Stateman/Caprice VR/VS 94-99 27.01% 21.25% 33.66% 12.40% Jaguar XJ6 79-86 33.78% 19.93% 51.12% 31.20% Mazda 929 / Luce 82-91 23.70% 20.44% 27.31% 6.87% Mercedes Benz C-Class W201 87-93 26.48% 17.77% 37.51% 19.73% Mercedes Benz C-Class W202 94-00 21.43% 12.35% 34.55% 22.20% Mercedes Benz E-Class W123 82-85 21.89% 10.95% 38.98% 28.03% Mercedes Benz E-Class W124 86-94 19.63% 12.68% 29.12% 16.44% Mercedes Benz S-Class W126 82-92 25.13% 15.58% 37.91% 22.33% Nissan Maxima 91-94 21.63% 15.71% 29.01% 13.30%
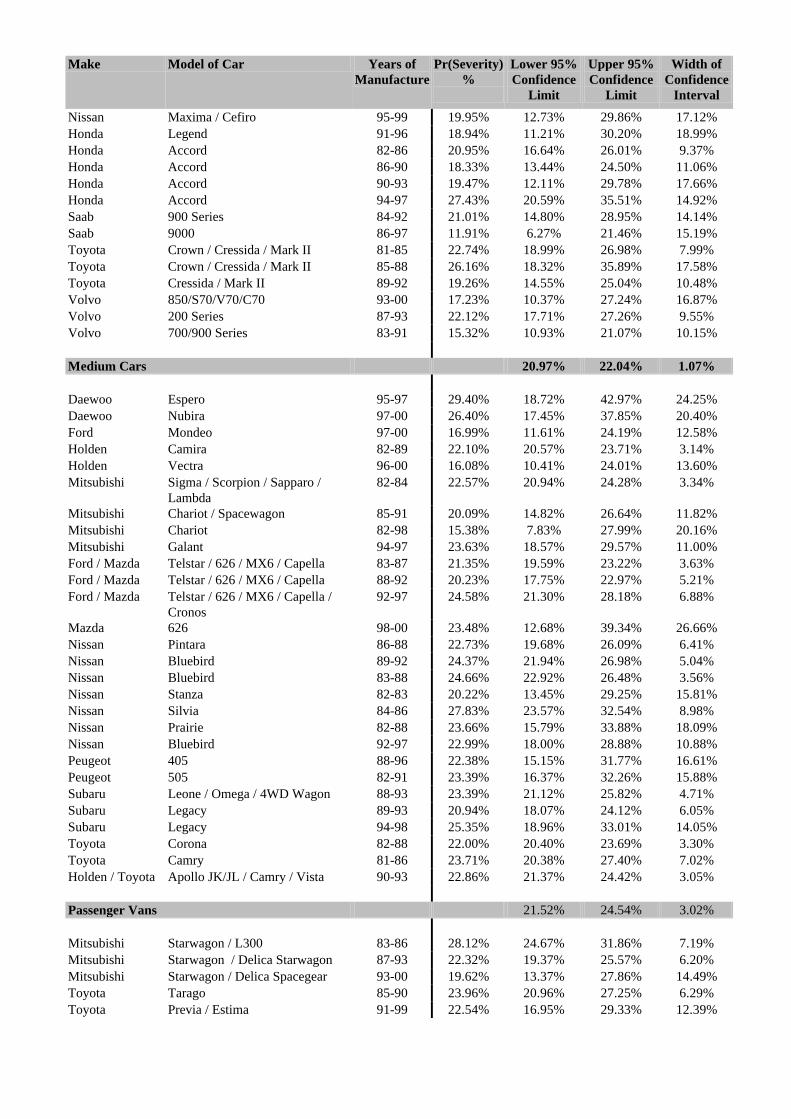
Make Model of Car Years of Manufacture
Pr(Severity) %
Lower 95% Confidence
Limit
Upper 95% Confidence
Limit
Width of Confidence
Interval
Nissan Maxima / Cefiro 95-99 19.95% 12.73% 29.86% 17.12% Honda Legend 91-96 18.94% 11.21% 30.20% 18.99% Honda Accord 82-86 20.95% 16.64% 26.01% 9.37% Honda Accord 86-90 18.33% 13.44% 24.50% 11.06% Honda Accord 90-93 19.47% 12.11% 29.78% 17.66% Honda Accord 94-97 27.43% 20.59% 35.51% 14.92% Saab 900 Series 84-92 21.01% 14.80% 28.95% 14.14% Saab 9000 86-97 11.91% 6.27% 21.46% 15.19% Toyota Crown / Cressida / Mark II 81-85 22.74% 18.99% 26.98% 7.99% Toyota Crown / Cressida / Mark II 85-88 26.16% 18.32% 35.89% 17.58% Toyota Cressida / Mark II 89-92 19.26% 14.55% 25.04% 10.48% Volvo 850/S70/V70/C70 93-00 17.23% 10.37% 27.24% 16.87% Volvo 200 Series 87-93 22.12% 17.71% 27.26% 9.55% Volvo 700/900 Series 83-91 15.32% 10.93% 21.07% 10.15% Medium Cars 20.97% 22.04% 1.07% Daewoo Espero 95-97 29.40% 18.72% 42.97% 24.25% Daewoo Nubira 97-00 26.40% 17.45% 37.85% 20.40% Ford Mondeo 97-00 16.99% 11.61% 24.19% 12.58% Holden Camira 82-89 22.10% 20.57% 23.71% 3.14% Holden Vectra 96-00 16.08% 10.41% 24.01% 13.60% Mitsubishi Sigma / Scorpion / Sapparo /
Lambda 82-84 22.57% 20.94% 24.28% 3.34%
Mitsubishi Chariot / Spacewagon 85-91 20.09% 14.82% 26.64% 11.82% Mitsubishi Chariot 82-98 15.38% 7.83% 27.99% 20.16% Mitsubishi Galant 94-97 23.63% 18.57% 29.57% 11.00% Ford / Mazda Telstar / 626 / MX6 / Capella 83-87 21.35% 19.59% 23.22% 3.63% Ford / Mazda Telstar / 626 / MX6 / Capella 88-92 20.23% 17.75% 22.97% 5.21% Ford / Mazda Telstar / 626 / MX6 / Capella /
Cronos 92-97 24.58% 21.30% 28.18% 6.88%
Mazda 626 98-00 23.48% 12.68% 39.34% 26.66% Nissan Pintara 86-88 22.73% 19.68% 26.09% 6.41% Nissan Bluebird 89-92 24.37% 21.94% 26.98% 5.04% Nissan Bluebird 83-88 24.66% 22.92% 26.48% 3.56% Nissan Stanza 82-83 20.22% 13.45% 29.25% 15.81% Nissan Silvia 84-86 27.83% 23.57% 32.54% 8.98% Nissan Prairie 82-88 23.66% 15.79% 33.88% 18.09% Nissan Bluebird 92-97 22.99% 18.00% 28.88% 10.88% Peugeot 405 88-96 22.38% 15.15% 31.77% 16.61% Peugeot 505 82-91 23.39% 16.37% 32.26% 15.88% Subaru Leone / Omega / 4WD Wagon 88-93 23.39% 21.12% 25.82% 4.71% Subaru Legacy 89-93 20.94% 18.07% 24.12% 6.05% Subaru Legacy 94-98 25.35% 18.96% 33.01% 14.05% Toyota Corona 82-88 22.00% 20.40% 23.69% 3.30% Toyota Camry 81-86 23.71% 20.38% 27.40% 7.02% Holden / Toyota Apollo JK/JL / Camry / Vista 90-93 22.86% 21.37% 24.42% 3.05% Passenger Vans 21.52% 24.54% 3.02% Mitsubishi Starwagon / L300 83-86 28.12% 24.67% 31.86% 7.19% Mitsubishi Starwagon / Delica Starwagon 87-93 22.32% 19.37% 25.57% 6.20% Mitsubishi Starwagon / Delica Spacegear 93-00 19.62% 13.37% 27.86% 14.49% Toyota Tarago 85-90 23.96% 20.96% 27.25% 6.29% Toyota Previa / Estima 91-99 22.54% 16.95% 29.33% 12.39%
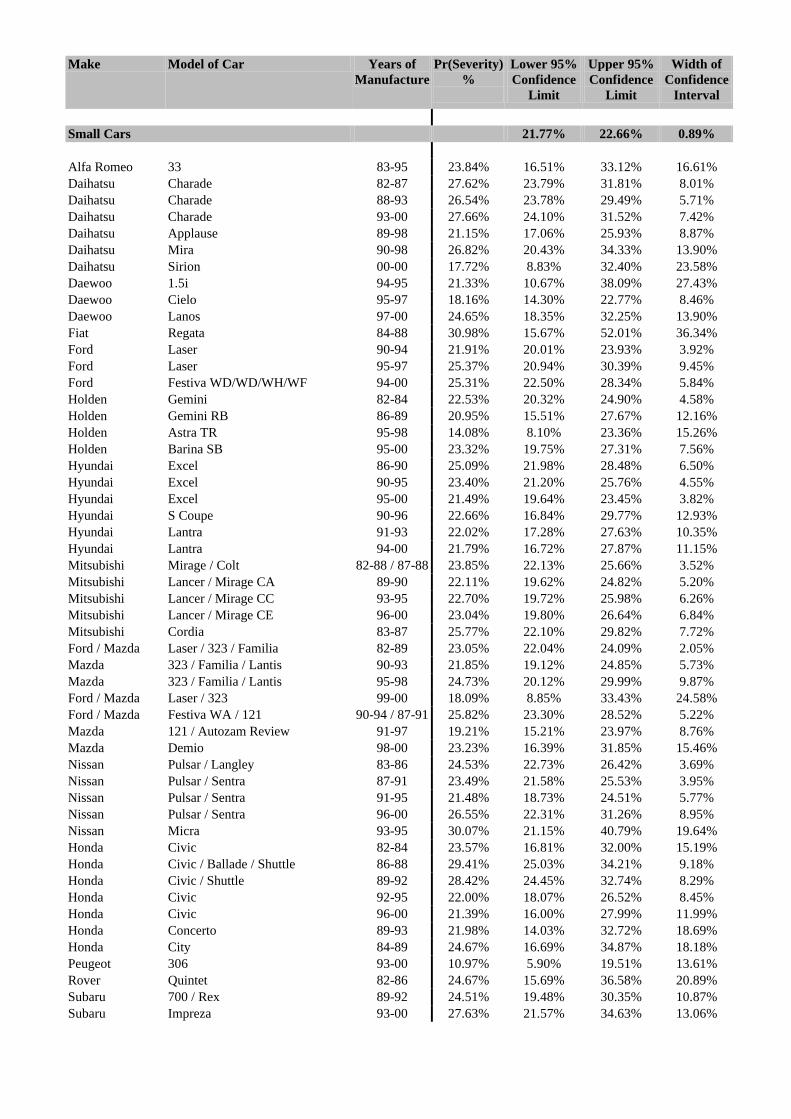
Make Model of Car Years of Manufacture
Pr(Severity) %
Lower 95% Confidence
Limit
Upper 95% Confidence
Limit
Width of Confidence
Interval
Small Cars 21.77% 22.66% 0.89% Alfa Romeo 33 83-95 23.84% 16.51% 33.12% 16.61% Daihatsu Charade 82-87 27.62% 23.79% 31.81% 8.01% Daihatsu Charade 88-93 26.54% 23.78% 29.49% 5.71% Daihatsu Charade 93-00 27.66% 24.10% 31.52% 7.42% Daihatsu Applause 89-98 21.15% 17.06% 25.93% 8.87% Daihatsu Mira 90-98 26.82% 20.43% 34.33% 13.90% Daihatsu Sirion 00-00 17.72% 8.83% 32.40% 23.58% Daewoo 1.5i 94-95 21.33% 10.67% 38.09% 27.43% Daewoo Cielo 95-97 18.16% 14.30% 22.77% 8.46% Daewoo Lanos 97-00 24.65% 18.35% 32.25% 13.90% Fiat Regata 84-88 30.98% 15.67% 52.01% 36.34% Ford Laser 90-94 21.91% 20.01% 23.93% 3.92% Ford Laser 95-97 25.37% 20.94% 30.39% 9.45% Ford Festiva WD/WD/WH/WF 94-00 25.31% 22.50% 28.34% 5.84% Holden Gemini 82-84 22.53% 20.32% 24.90% 4.58% Holden Gemini RB 86-89 20.95% 15.51% 27.67% 12.16% Holden Astra TR 95-98 14.08% 8.10% 23.36% 15.26% Holden Barina SB 95-00 23.32% 19.75% 27.31% 7.56% Hyundai Excel 86-90 25.09% 21.98% 28.48% 6.50% Hyundai Excel 90-95 23.40% 21.20% 25.76% 4.55% Hyundai Excel 95-00 21.49% 19.64% 23.45% 3.82% Hyundai S Coupe 90-96 22.66% 16.84% 29.77% 12.93% Hyundai Lantra 91-93 22.02% 17.28% 27.63% 10.35% Hyundai Lantra 94-00 21.79% 16.72% 27.87% 11.15% Mitsubishi Mirage / Colt 82-88 / 87-88 23.85% 22.13% 25.66% 3.52% Mitsubishi Lancer / Mirage CA 89-90 22.11% 19.62% 24.82% 5.20% Mitsubishi Lancer / Mirage CC 93-95 22.70% 19.72% 25.98% 6.26% Mitsubishi Lancer / Mirage CE 96-00 23.04% 19.80% 26.64% 6.84% Mitsubishi Cordia 83-87 25.77% 22.10% 29.82% 7.72% Ford / Mazda Laser / 323 / Familia 82-89 23.05% 22.04% 24.09% 2.05% Mazda 323 / Familia / Lantis 90-93 21.85% 19.12% 24.85% 5.73% Mazda 323 / Familia / Lantis 95-98 24.73% 20.12% 29.99% 9.87% Ford / Mazda Laser / 323 99-00 18.09% 8.85% 33.43% 24.58% Ford / Mazda Festiva WA / 121 90-94 / 87-91 25.82% 23.30% 28.52% 5.22% Mazda 121 / Autozam Review 91-97 19.21% 15.21% 23.97% 8.76% Mazda Demio 98-00 23.23% 16.39% 31.85% 15.46% Nissan Pulsar / Langley 83-86 24.53% 22.73% 26.42% 3.69% Nissan Pulsar / Sentra 87-91 23.49% 21.58% 25.53% 3.95% Nissan Pulsar / Sentra 91-95 21.48% 18.73% 24.51% 5.77% Nissan Pulsar / Sentra 96-00 26.55% 22.31% 31.26% 8.95% Nissan Micra 93-95 30.07% 21.15% 40.79% 19.64% Honda Civic 82-84 23.57% 16.81% 32.00% 15.19% Honda Civic / Ballade / Shuttle 86-88 29.41% 25.03% 34.21% 9.18% Honda Civic / Shuttle 89-92 28.42% 24.45% 32.74% 8.29% Honda Civic 92-95 22.00% 18.07% 26.52% 8.45% Honda Civic 96-00 21.39% 16.00% 27.99% 11.99% Honda Concerto 89-93 21.98% 14.03% 32.72% 18.69% Honda City 84-89 24.67% 16.69% 34.87% 18.18% Peugeot 306 93-00 10.97% 5.90% 19.51% 13.61% Rover Quintet 82-86 24.67% 15.69% 36.58% 20.89% Subaru 700 / Rex 89-92 24.51% 19.48% 30.35% 10.87% Subaru Impreza 93-00 27.63% 21.57% 34.63% 13.06%
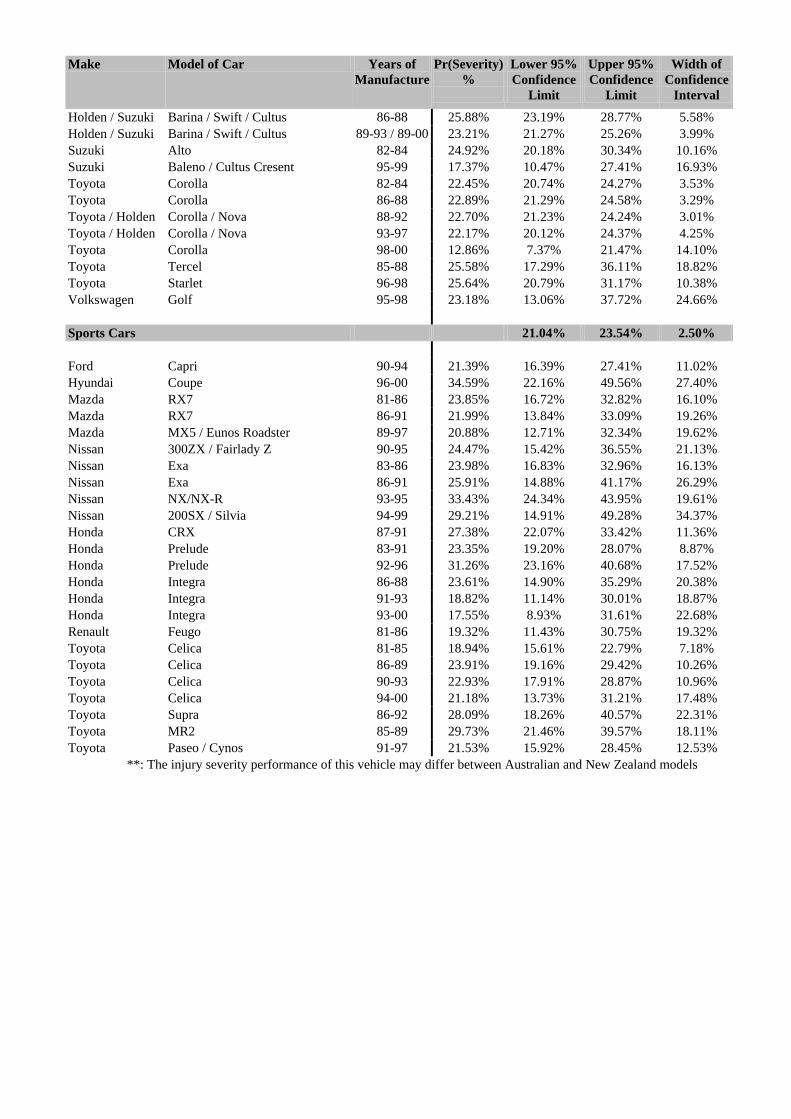
Make Model of Car Years of Manufacture
Pr(Severity) %
Lower 95% Confidence
Limit
Upper 95% Confidence
Limit
Width of Confidence
Interval
Holden / Suzuki Barina / Swift / Cultus 86-88 25.88% 23.19% 28.77% 5.58% Holden / Suzuki Barina / Swift / Cultus 89-93 / 89-00 23.21% 21.27% 25.26% 3.99% Suzuki Alto 82-84 24.92% 20.18% 30.34% 10.16% Suzuki Baleno / Cultus Cresent 95-99 17.37% 10.47% 27.41% 16.93% Toyota Corolla 82-84 22.45% 20.74% 24.27% 3.53% Toyota Corolla 86-88 22.89% 21.29% 24.58% 3.29% Toyota / Holden Corolla / Nova 88-92 22.70% 21.23% 24.24% 3.01% Toyota / Holden Corolla / Nova 93-97 22.17% 20.12% 24.37% 4.25% Toyota Corolla 98-00 12.86% 7.37% 21.47% 14.10% Toyota Tercel 85-88 25.58% 17.29% 36.11% 18.82% Toyota Starlet 96-98 25.64% 20.79% 31.17% 10.38% Volkswagen Golf 95-98 23.18% 13.06% 37.72% 24.66%
Sports Cars 21.04% 23.54% 2.50% Ford Capri 90-94 21.39% 16.39% 27.41% 11.02% Hyundai Coupe 96-00 34.59% 22.16% 49.56% 27.40% Mazda RX7 81-86 23.85% 16.72% 32.82% 16.10% Mazda RX7 86-91 21.99% 13.84% 33.09% 19.26% Mazda MX5 / Eunos Roadster 89-97 20.88% 12.71% 32.34% 19.62% Nissan 300ZX / Fairlady Z 90-95 24.47% 15.42% 36.55% 21.13% Nissan Exa 83-86 23.98% 16.83% 32.96% 16.13% Nissan Exa 86-91 25.91% 14.88% 41.17% 26.29% Nissan NX/NX-R 93-95 33.43% 24.34% 43.95% 19.61% Nissan 200SX / Silvia 94-99 29.21% 14.91% 49.28% 34.37% Honda CRX 87-91 27.38% 22.07% 33.42% 11.36% Honda Prelude 83-91 23.35% 19.20% 28.07% 8.87% Honda Prelude 92-96 31.26% 23.16% 40.68% 17.52% Honda Integra 86-88 23.61% 14.90% 35.29% 20.38% Honda Integra 91-93 18.82% 11.14% 30.01% 18.87% Honda Integra 93-00 17.55% 8.93% 31.61% 22.68% Renault Feugo 81-86 19.32% 11.43% 30.75% 19.32% Toyota Celica 81-85 18.94% 15.61% 22.79% 7.18% Toyota Celica 86-89 23.91% 19.16% 29.42% 10.26% Toyota Celica 90-93 22.93% 17.91% 28.87% 10.96% Toyota Celica 94-00 21.18% 13.73% 31.21% 17.48% Toyota Supra 86-92 28.09% 18.26% 40.57% 22.31% Toyota MR2 85-89 29.73% 21.46% 39.57% 18.11% Toyota Paseo / Cynos 91-97 21.53% 15.92% 28.45% 12.53%
**: The injury severity performance of this vehicle may differ between Australian and New Zealand models
APPENDIX 4
CRASHWORTHINESS RATINGS OF 1982-2000 MODELS OF CARS INVOLVED IN
CRASHES DURING 1987-2000 with
(1) 95 % CONFIDENCE LIMITS (2) 90 % CONFIDENCE LIMITS

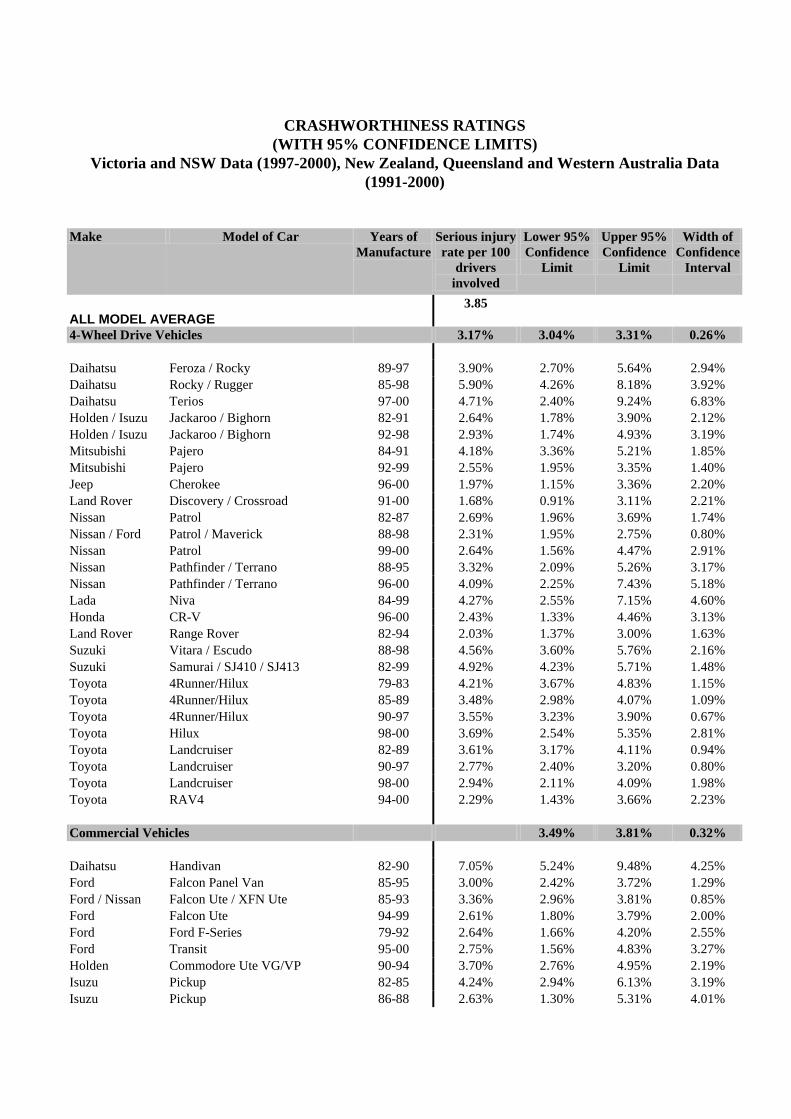
CRASHWORTHINESS RATINGS (WITH 95% CONFIDENCE LIMITS)
Victoria and NSW Data (1997-2000), New Zealand, Queensland and Western Australia Data (1991-2000)
Make Model of Car Years of Manufacture
Serious injury rate per 100
drivers involved
Lower 95% Confidence
Limit
Upper 95% Confidence
Limit
Width of Confidence
Interval
ALL MODEL AVERAGE 3.85
4-Wheel Drive Vehicles 3.17% 3.04% 3.31% 0.26% Daihatsu Feroza / Rocky 89-97 3.90% 2.70% 5.64% 2.94% Daihatsu Rocky / Rugger 85-98 5.90% 4.26% 8.18% 3.92% Daihatsu Terios 97-00 4.71% 2.40% 9.24% 6.83% Holden / Isuzu Jackaroo / Bighorn 82-91 2.64% 1.78% 3.90% 2.12% Holden / Isuzu Jackaroo / Bighorn 92-98 2.93% 1.74% 4.93% 3.19% Mitsubishi Pajero 84-91 4.18% 3.36% 5.21% 1.85% Mitsubishi Pajero 92-99 2.55% 1.95% 3.35% 1.40% Jeep Cherokee 96-00 1.97% 1.15% 3.36% 2.20% Land Rover Discovery / Crossroad 91-00 1.68% 0.91% 3.11% 2.21% Nissan Patrol 82-87 2.69% 1.96% 3.69% 1.74% Nissan / Ford Patrol / Maverick 88-98 2.31% 1.95% 2.75% 0.80% Nissan Patrol 99-00 2.64% 1.56% 4.47% 2.91% Nissan Pathfinder / Terrano 88-95 3.32% 2.09% 5.26% 3.17% Nissan Pathfinder / Terrano 96-00 4.09% 2.25% 7.43% 5.18% Lada Niva 84-99 4.27% 2.55% 7.15% 4.60% Honda CR-V 96-00 2.43% 1.33% 4.46% 3.13% Land Rover Range Rover 82-94 2.03% 1.37% 3.00% 1.63% Suzuki Vitara / Escudo 88-98 4.56% 3.60% 5.76% 2.16% Suzuki Samurai / SJ410 / SJ413 82-99 4.92% 4.23% 5.71% 1.48% Toyota 4Runner/Hilux 79-83 4.21% 3.67% 4.83% 1.15% Toyota 4Runner/Hilux 85-89 3.48% 2.98% 4.07% 1.09% Toyota 4Runner/Hilux 90-97 3.55% 3.23% 3.90% 0.67% Toyota Hilux 98-00 3.69% 2.54% 5.35% 2.81% Toyota Landcruiser 82-89 3.61% 3.17% 4.11% 0.94% Toyota Landcruiser 90-97 2.77% 2.40% 3.20% 0.80% Toyota Landcruiser 98-00 2.94% 2.11% 4.09% 1.98% Toyota RAV4 94-00 2.29% 1.43% 3.66% 2.23% Commercial Vehicles 3.49% 3.81% 0.32% Daihatsu Handivan 82-90 7.05% 5.24% 9.48% 4.25% Ford Falcon Panel Van 85-95 3.00% 2.42% 3.72% 1.29% Ford / Nissan Falcon Ute / XFN Ute 85-93 3.36% 2.96% 3.81% 0.85% Ford Falcon Ute 94-99 2.61% 1.80% 3.79% 2.00% Ford Ford F-Series 79-92 2.64% 1.66% 4.20% 2.55% Ford Transit 95-00 2.75% 1.56% 4.83% 3.27% Holden Commodore Ute VG/VP 90-94 3.70% 2.76% 4.95% 2.19% Isuzu Pickup 82-85 4.24% 2.94% 6.13% 3.19% Isuzu Pickup 86-88 2.63% 1.30% 5.31% 4.01%
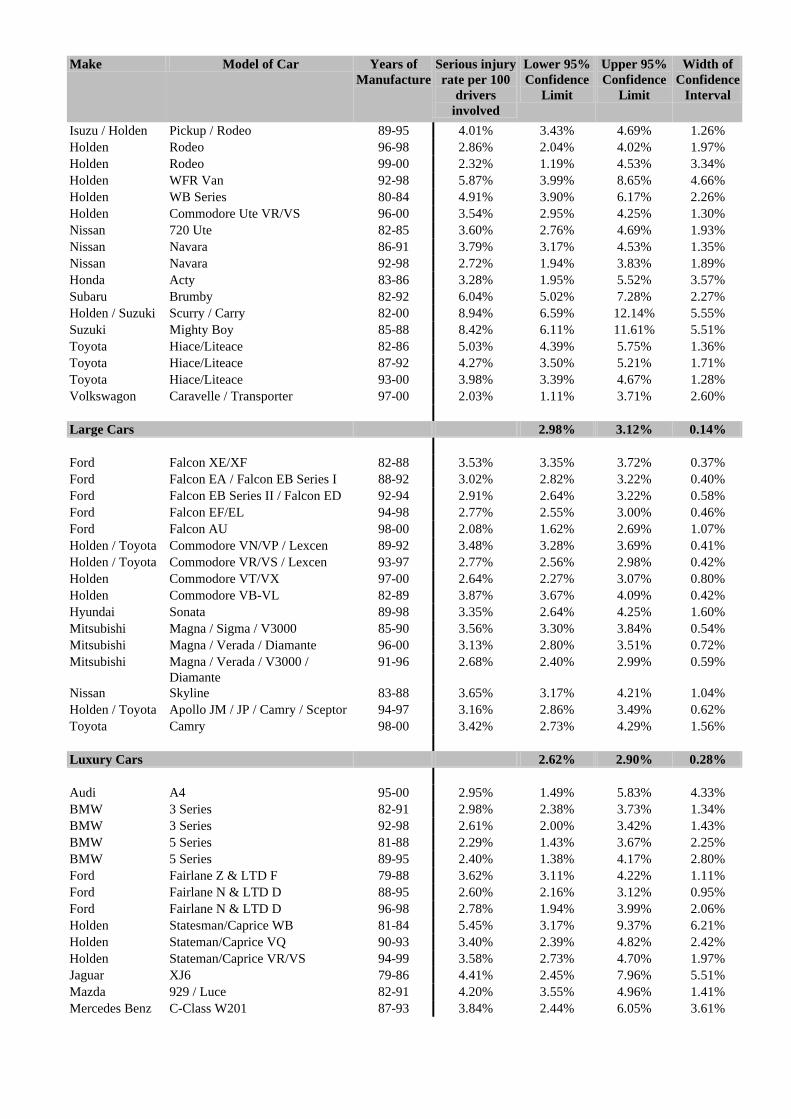
Make Model of Car Years of Manufacture
Serious injury rate per 100
drivers involved
Lower 95% Confidence
Limit
Upper 95% Confidence
Limit
Width of Confidence
Interval
Isuzu / Holden Pickup / Rodeo 89-95 4.01% 3.43% 4.69% 1.26% Holden Rodeo 96-98 2.86% 2.04% 4.02% 1.97% Holden Rodeo 99-00 2.32% 1.19% 4.53% 3.34% Holden WFR Van 92-98 5.87% 3.99% 8.65% 4.66% Holden WB Series 80-84 4.91% 3.90% 6.17% 2.26% Holden Commodore Ute VR/VS 96-00 3.54% 2.95% 4.25% 1.30% Nissan 720 Ute 82-85 3.60% 2.76% 4.69% 1.93% Nissan Navara 86-91 3.79% 3.17% 4.53% 1.35% Nissan Navara 92-98 2.72% 1.94% 3.83% 1.89% Honda Acty 83-86 3.28% 1.95% 5.52% 3.57% Subaru Brumby 82-92 6.04% 5.02% 7.28% 2.27% Holden / Suzuki Scurry / Carry 82-00 8.94% 6.59% 12.14% 5.55% Suzuki Mighty Boy 85-88 8.42% 6.11% 11.61% 5.51% Toyota Hiace/Liteace 82-86 5.03% 4.39% 5.75% 1.36% Toyota Hiace/Liteace 87-92 4.27% 3.50% 5.21% 1.71% Toyota Hiace/Liteace 93-00 3.98% 3.39% 4.67% 1.28% Volkswagon Caravelle / Transporter 97-00 2.03% 1.11% 3.71% 2.60%
Large Cars 2.98% 3.12% 0.14% Ford Falcon XE/XF 82-88 3.53% 3.35% 3.72% 0.37% Ford Falcon EA / Falcon EB Series I 88-92 3.02% 2.82% 3.22% 0.40% Ford Falcon EB Series II / Falcon ED 92-94 2.91% 2.64% 3.22% 0.58% Ford Falcon EF/EL 94-98 2.77% 2.55% 3.00% 0.46% Ford Falcon AU 98-00 2.08% 1.62% 2.69% 1.07% Holden / Toyota Commodore VN/VP / Lexcen 89-92 3.48% 3.28% 3.69% 0.41% Holden / Toyota Commodore VR/VS / Lexcen 93-97 2.77% 2.56% 2.98% 0.42% Holden Commodore VT/VX 97-00 2.64% 2.27% 3.07% 0.80% Holden Commodore VB-VL 82-89 3.87% 3.67% 4.09% 0.42% Hyundai Sonata 89-98 3.35% 2.64% 4.25% 1.60% Mitsubishi Magna / Sigma / V3000 85-90 3.56% 3.30% 3.84% 0.54% Mitsubishi Magna / Verada / Diamante 96-00 3.13% 2.80% 3.51% 0.72% Mitsubishi Magna / Verada / V3000 /
Diamante 91-96 2.68% 2.40% 2.99% 0.59%
Nissan Skyline 83-88 3.65% 3.17% 4.21% 1.04% Holden / Toyota Apollo JM / JP / Camry / Sceptor 94-97 3.16% 2.86% 3.49% 0.62% Toyota Camry 98-00 3.42% 2.73% 4.29% 1.56% Luxury Cars 2.62% 2.90% 0.28% Audi A4 95-00 2.95% 1.49% 5.83% 4.33% BMW 3 Series 82-91 2.98% 2.38% 3.73% 1.34% BMW 3 Series 92-98 2.61% 2.00% 3.42% 1.43% BMW 5 Series 81-88 2.29% 1.43% 3.67% 2.25% BMW 5 Series 89-95 2.40% 1.38% 4.17% 2.80% Ford Fairlane Z & LTD F 79-88 3.62% 3.11% 4.22% 1.11% Ford Fairlane N & LTD D 88-95 2.60% 2.16% 3.12% 0.95% Ford Fairlane N & LTD D 96-98 2.78% 1.94% 3.99% 2.06% Holden Statesman/Caprice WB 81-84 5.45% 3.17% 9.37% 6.21% Holden Stateman/Caprice VQ 90-93 3.40% 2.39% 4.82% 2.42% Holden Stateman/Caprice VR/VS 94-99 3.58% 2.73% 4.70% 1.97% Jaguar XJ6 79-86 4.41% 2.45% 7.96% 5.51% Mazda 929 / Luce 82-91 4.20% 3.55% 4.96% 1.41% Mercedes Benz C-Class W201 87-93 3.84% 2.44% 6.05% 3.61%
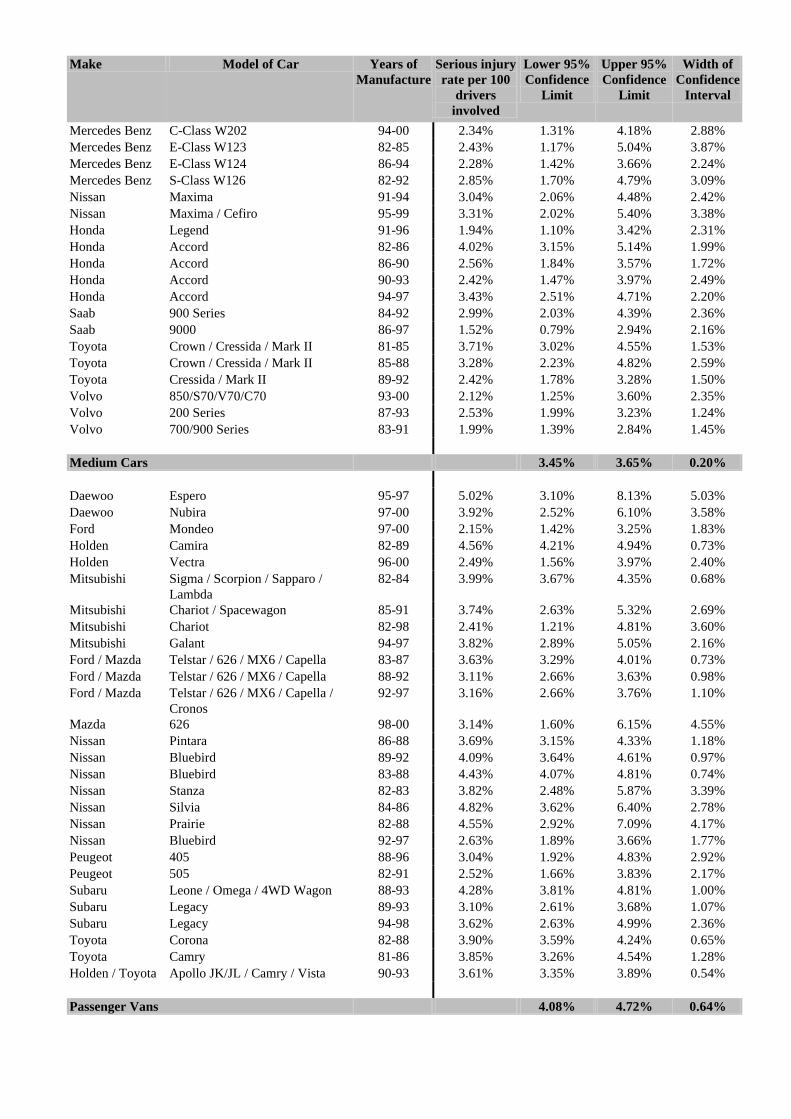
Make Model of Car Years of Manufacture
Serious injury rate per 100
drivers involved
Lower 95% Confidence
Limit
Upper 95% Confidence
Limit
Width of Confidence
Interval
Mercedes Benz C-Class W202 94-00 2.34% 1.31% 4.18% 2.88% Mercedes Benz E-Class W123 82-85 2.43% 1.17% 5.04% 3.87% Mercedes Benz E-Class W124 86-94 2.28% 1.42% 3.66% 2.24% Mercedes Benz S-Class W126 82-92 2.85% 1.70% 4.79% 3.09% Nissan Maxima 91-94 3.04% 2.06% 4.48% 2.42% Nissan Maxima / Cefiro 95-99 3.31% 2.02% 5.40% 3.38% Honda Legend 91-96 1.94% 1.10% 3.42% 2.31% Honda Accord 82-86 4.02% 3.15% 5.14% 1.99% Honda Accord 86-90 2.56% 1.84% 3.57% 1.72% Honda Accord 90-93 2.42% 1.47% 3.97% 2.49% Honda Accord 94-97 3.43% 2.51% 4.71% 2.20% Saab 900 Series 84-92 2.99% 2.03% 4.39% 2.36% Saab 9000 86-97 1.52% 0.79% 2.94% 2.16% Toyota Crown / Cressida / Mark II 81-85 3.71% 3.02% 4.55% 1.53% Toyota Crown / Cressida / Mark II 85-88 3.28% 2.23% 4.82% 2.59% Toyota Cressida / Mark II 89-92 2.42% 1.78% 3.28% 1.50% Volvo 850/S70/V70/C70 93-00 2.12% 1.25% 3.60% 2.35% Volvo 200 Series 87-93 2.53% 1.99% 3.23% 1.24% Volvo 700/900 Series 83-91 1.99% 1.39% 2.84% 1.45% Medium Cars 3.45% 3.65% 0.20% Daewoo Espero 95-97 5.02% 3.10% 8.13% 5.03% Daewoo Nubira 97-00 3.92% 2.52% 6.10% 3.58% Ford Mondeo 97-00 2.15% 1.42% 3.25% 1.83% Holden Camira 82-89 4.56% 4.21% 4.94% 0.73% Holden Vectra 96-00 2.49% 1.56% 3.97% 2.40% Mitsubishi Sigma / Scorpion / Sapparo /
Lambda 82-84 3.99% 3.67% 4.35% 0.68%
Mitsubishi Chariot / Spacewagon 85-91 3.74% 2.63% 5.32% 2.69% Mitsubishi Chariot 82-98 2.41% 1.21% 4.81% 3.60% Mitsubishi Galant 94-97 3.82% 2.89% 5.05% 2.16% Ford / Mazda Telstar / 626 / MX6 / Capella 83-87 3.63% 3.29% 4.01% 0.73% Ford / Mazda Telstar / 626 / MX6 / Capella 88-92 3.11% 2.66% 3.63% 0.98% Ford / Mazda Telstar / 626 / MX6 / Capella /
Cronos 92-97 3.16% 2.66% 3.76% 1.10%
Mazda 626 98-00 3.14% 1.60% 6.15% 4.55% Nissan Pintara 86-88 3.69% 3.15% 4.33% 1.18% Nissan Bluebird 89-92 4.09% 3.64% 4.61% 0.97% Nissan Bluebird 83-88 4.43% 4.07% 4.81% 0.74% Nissan Stanza 82-83 3.82% 2.48% 5.87% 3.39% Nissan Silvia 84-86 4.82% 3.62% 6.40% 2.78% Nissan Prairie 82-88 4.55% 2.92% 7.09% 4.17% Nissan Bluebird 92-97 2.63% 1.89% 3.66% 1.77% Peugeot 405 88-96 3.04% 1.92% 4.83% 2.92% Peugeot 505 82-91 2.52% 1.66% 3.83% 2.17% Subaru Leone / Omega / 4WD Wagon 88-93 4.28% 3.81% 4.81% 1.00% Subaru Legacy 89-93 3.10% 2.61% 3.68% 1.07% Subaru Legacy 94-98 3.62% 2.63% 4.99% 2.36% Toyota Corona 82-88 3.90% 3.59% 4.24% 0.65% Toyota Camry 81-86 3.85% 3.26% 4.54% 1.28% Holden / Toyota Apollo JK/JL / Camry / Vista 90-93 3.61% 3.35% 3.89% 0.54% Passenger Vans 4.08% 4.72% 0.64%
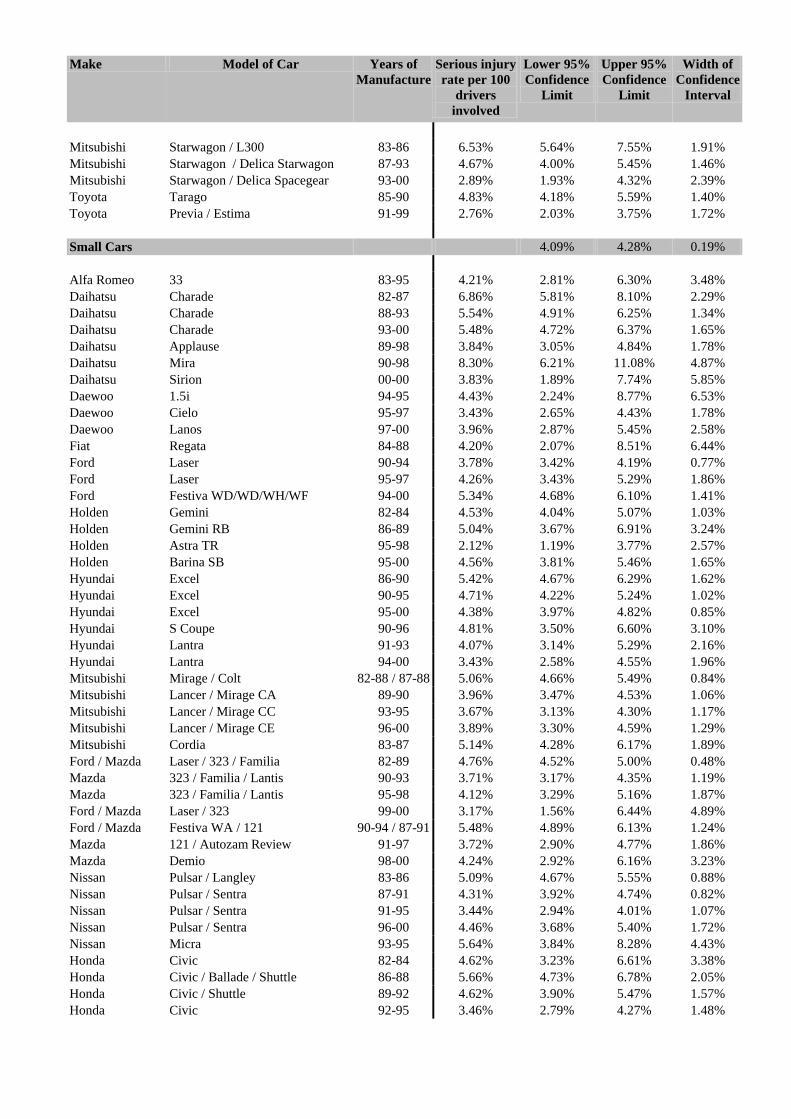
Make Model of Car Years of Manufacture
Serious injury rate per 100
drivers involved
Lower 95% Confidence
Limit
Upper 95% Confidence
Limit
Width of Confidence
Interval
Mitsubishi Starwagon / L300 83-86 6.53% 5.64% 7.55% 1.91% Mitsubishi Starwagon / Delica Starwagon 87-93 4.67% 4.00% 5.45% 1.46% Mitsubishi Starwagon / Delica Spacegear 93-00 2.89% 1.93% 4.32% 2.39% Toyota Tarago 85-90 4.83% 4.18% 5.59% 1.40% Toyota Previa / Estima 91-99 2.76% 2.03% 3.75% 1.72%
Small Cars 4.09% 4.28% 0.19% Alfa Romeo 33 83-95 4.21% 2.81% 6.30% 3.48% Daihatsu Charade 82-87 6.86% 5.81% 8.10% 2.29% Daihatsu Charade 88-93 5.54% 4.91% 6.25% 1.34% Daihatsu Charade 93-00 5.48% 4.72% 6.37% 1.65% Daihatsu Applause 89-98 3.84% 3.05% 4.84% 1.78% Daihatsu Mira 90-98 8.30% 6.21% 11.08% 4.87% Daihatsu Sirion 00-00 3.83% 1.89% 7.74% 5.85% Daewoo 1.5i 94-95 4.43% 2.24% 8.77% 6.53% Daewoo Cielo 95-97 3.43% 2.65% 4.43% 1.78% Daewoo Lanos 97-00 3.96% 2.87% 5.45% 2.58% Fiat Regata 84-88 4.20% 2.07% 8.51% 6.44% Ford Laser 90-94 3.78% 3.42% 4.19% 0.77% Ford Laser 95-97 4.26% 3.43% 5.29% 1.86% Ford Festiva WD/WD/WH/WF 94-00 5.34% 4.68% 6.10% 1.41% Holden Gemini 82-84 4.53% 4.04% 5.07% 1.03% Holden Gemini RB 86-89 5.04% 3.67% 6.91% 3.24% Holden Astra TR 95-98 2.12% 1.19% 3.77% 2.57% Holden Barina SB 95-00 4.56% 3.81% 5.46% 1.65% Hyundai Excel 86-90 5.42% 4.67% 6.29% 1.62% Hyundai Excel 90-95 4.71% 4.22% 5.24% 1.02% Hyundai Excel 95-00 4.38% 3.97% 4.82% 0.85% Hyundai S Coupe 90-96 4.81% 3.50% 6.60% 3.10% Hyundai Lantra 91-93 4.07% 3.14% 5.29% 2.16% Hyundai Lantra 94-00 3.43% 2.58% 4.55% 1.96% Mitsubishi Mirage / Colt 82-88 / 87-88 5.06% 4.66% 5.49% 0.84% Mitsubishi Lancer / Mirage CA 89-90 3.96% 3.47% 4.53% 1.06% Mitsubishi Lancer / Mirage CC 93-95 3.67% 3.13% 4.30% 1.17% Mitsubishi Lancer / Mirage CE 96-00 3.89% 3.30% 4.59% 1.29% Mitsubishi Cordia 83-87 5.14% 4.28% 6.17% 1.89% Ford / Mazda Laser / 323 / Familia 82-89 4.76% 4.52% 5.00% 0.48% Mazda 323 / Familia / Lantis 90-93 3.71% 3.17% 4.35% 1.19% Mazda 323 / Familia / Lantis 95-98 4.12% 3.29% 5.16% 1.87% Ford / Mazda Laser / 323 99-00 3.17% 1.56% 6.44% 4.89% Ford / Mazda Festiva WA / 121 90-94 / 87-91 5.48% 4.89% 6.13% 1.24% Mazda 121 / Autozam Review 91-97 3.72% 2.90% 4.77% 1.86% Mazda Demio 98-00 4.24% 2.92% 6.16% 3.23% Nissan Pulsar / Langley 83-86 5.09% 4.67% 5.55% 0.88% Nissan Pulsar / Sentra 87-91 4.31% 3.92% 4.74% 0.82% Nissan Pulsar / Sentra 91-95 3.44% 2.94% 4.01% 1.07% Nissan Pulsar / Sentra 96-00 4.46% 3.68% 5.40% 1.72% Nissan Micra 93-95 5.64% 3.84% 8.28% 4.43% Honda Civic 82-84 4.62% 3.23% 6.61% 3.38% Honda Civic / Ballade / Shuttle 86-88 5.66% 4.73% 6.78% 2.05% Honda Civic / Shuttle 89-92 4.62% 3.90% 5.47% 1.57% Honda Civic 92-95 3.46% 2.79% 4.27% 1.48%
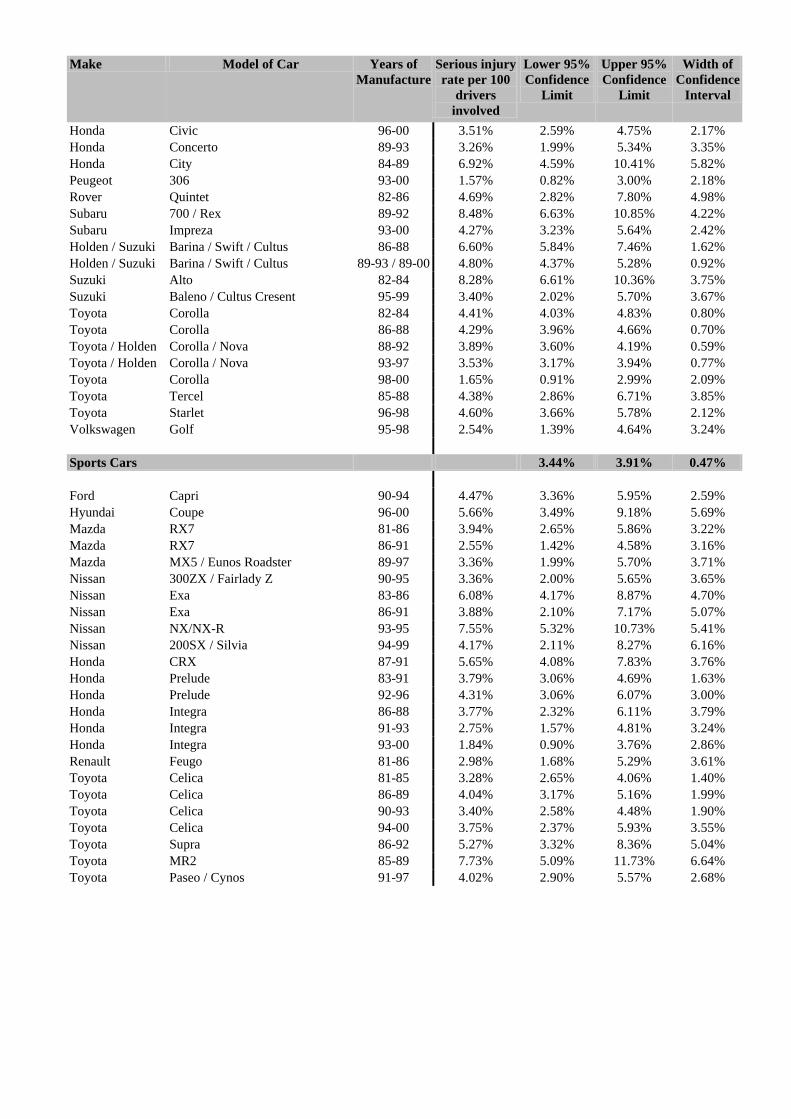
Make Model of Car Years of Manufacture
Serious injury rate per 100
drivers involved
Lower 95% Confidence
Limit
Upper 95% Confidence
Limit
Width of Confidence
Interval
Honda Civic 96-00 3.51% 2.59% 4.75% 2.17% Honda Concerto 89-93 3.26% 1.99% 5.34% 3.35% Honda City 84-89 6.92% 4.59% 10.41% 5.82% Peugeot 306 93-00 1.57% 0.82% 3.00% 2.18% Rover Quintet 82-86 4.69% 2.82% 7.80% 4.98% Subaru 700 / Rex 89-92 8.48% 6.63% 10.85% 4.22% Subaru Impreza 93-00 4.27% 3.23% 5.64% 2.42% Holden / Suzuki Barina / Swift / Cultus 86-88 6.60% 5.84% 7.46% 1.62% Holden / Suzuki Barina / Swift / Cultus 89-93 / 89-00 4.80% 4.37% 5.28% 0.92% Suzuki Alto 82-84 8.28% 6.61% 10.36% 3.75% Suzuki Baleno / Cultus Cresent 95-99 3.40% 2.02% 5.70% 3.67% Toyota Corolla 82-84 4.41% 4.03% 4.83% 0.80% Toyota Corolla 86-88 4.29% 3.96% 4.66% 0.70% Toyota / Holden Corolla / Nova 88-92 3.89% 3.60% 4.19% 0.59% Toyota / Holden Corolla / Nova 93-97 3.53% 3.17% 3.94% 0.77% Toyota Corolla 98-00 1.65% 0.91% 2.99% 2.09% Toyota Tercel 85-88 4.38% 2.86% 6.71% 3.85% Toyota Starlet 96-98 4.60% 3.66% 5.78% 2.12% Volkswagen Golf 95-98 2.54% 1.39% 4.64% 3.24%
Sports Cars 3.44% 3.91% 0.47% Ford Capri 90-94 4.47% 3.36% 5.95% 2.59% Hyundai Coupe 96-00 5.66% 3.49% 9.18% 5.69% Mazda RX7 81-86 3.94% 2.65% 5.86% 3.22% Mazda RX7 86-91 2.55% 1.42% 4.58% 3.16% Mazda MX5 / Eunos Roadster 89-97 3.36% 1.99% 5.70% 3.71% Nissan 300ZX / Fairlady Z 90-95 3.36% 2.00% 5.65% 3.65% Nissan Exa 83-86 6.08% 4.17% 8.87% 4.70% Nissan Exa 86-91 3.88% 2.10% 7.17% 5.07% Nissan NX/NX-R 93-95 7.55% 5.32% 10.73% 5.41% Nissan 200SX / Silvia 94-99 4.17% 2.11% 8.27% 6.16% Honda CRX 87-91 5.65% 4.08% 7.83% 3.76% Honda Prelude 83-91 3.79% 3.06% 4.69% 1.63% Honda Prelude 92-96 4.31% 3.06% 6.07% 3.00% Honda Integra 86-88 3.77% 2.32% 6.11% 3.79% Honda Integra 91-93 2.75% 1.57% 4.81% 3.24% Honda Integra 93-00 1.84% 0.90% 3.76% 2.86% Renault Feugo 81-86 2.98% 1.68% 5.29% 3.61% Toyota Celica 81-85 3.28% 2.65% 4.06% 1.40% Toyota Celica 86-89 4.04% 3.17% 5.16% 1.99% Toyota Celica 90-93 3.40% 2.58% 4.48% 1.90% Toyota Celica 94-00 3.75% 2.37% 5.93% 3.55% Toyota Supra 86-92 5.27% 3.32% 8.36% 5.04% Toyota MR2 85-89 7.73% 5.09% 11.73% 6.64% Toyota Paseo / Cynos 91-97 4.02% 2.90% 5.57% 2.68%
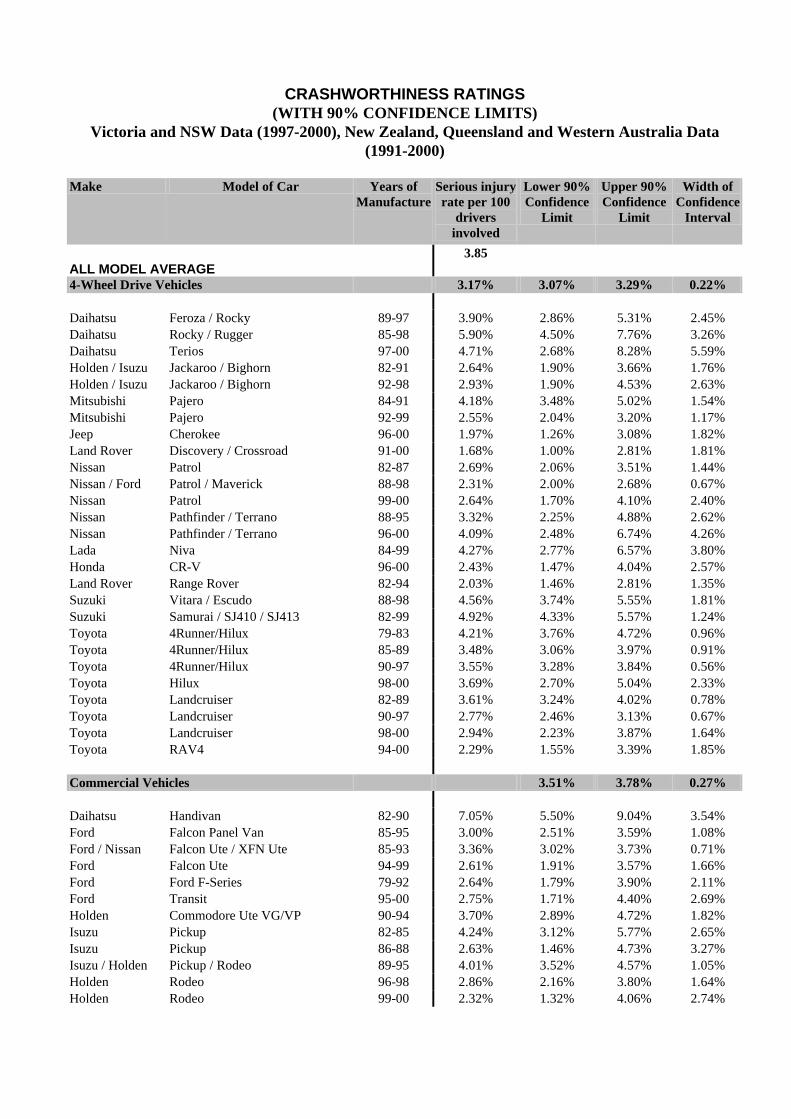
CRASHWORTHINESS RATINGS (WITH 90% CONFIDENCE LIMITS)
Victoria and NSW Data (1997-2000), New Zealand, Queensland and Western Australia Data (1991-2000)
Make Model of Car Years of
Manufacture Serious injury rate per 100
drivers involved
Lower 90% Confidence
Limit
Upper 90% Confidence
Limit
Width of Confidence
Interval
ALL MODEL AVERAGE 3.85
4-Wheel Drive Vehicles 3.17% 3.07% 3.29% 0.22% Daihatsu Feroza / Rocky 89-97 3.90% 2.86% 5.31% 2.45% Daihatsu Rocky / Rugger 85-98 5.90% 4.50% 7.76% 3.26% Daihatsu Terios 97-00 4.71% 2.68% 8.28% 5.59% Holden / Isuzu Jackaroo / Bighorn 82-91 2.64% 1.90% 3.66% 1.76% Holden / Isuzu Jackaroo / Bighorn 92-98 2.93% 1.90% 4.53% 2.63% Mitsubishi Pajero 84-91 4.18% 3.48% 5.02% 1.54% Mitsubishi Pajero 92-99 2.55% 2.04% 3.20% 1.17% Jeep Cherokee 96-00 1.97% 1.26% 3.08% 1.82% Land Rover Discovery / Crossroad 91-00 1.68% 1.00% 2.81% 1.81% Nissan Patrol 82-87 2.69% 2.06% 3.51% 1.44% Nissan / Ford Patrol / Maverick 88-98 2.31% 2.00% 2.68% 0.67% Nissan Patrol 99-00 2.64% 1.70% 4.10% 2.40% Nissan Pathfinder / Terrano 88-95 3.32% 2.25% 4.88% 2.62% Nissan Pathfinder / Terrano 96-00 4.09% 2.48% 6.74% 4.26% Lada Niva 84-99 4.27% 2.77% 6.57% 3.80% Honda CR-V 96-00 2.43% 1.47% 4.04% 2.57% Land Rover Range Rover 82-94 2.03% 1.46% 2.81% 1.35% Suzuki Vitara / Escudo 88-98 4.56% 3.74% 5.55% 1.81% Suzuki Samurai / SJ410 / SJ413 82-99 4.92% 4.33% 5.57% 1.24% Toyota 4Runner/Hilux 79-83 4.21% 3.76% 4.72% 0.96% Toyota 4Runner/Hilux 85-89 3.48% 3.06% 3.97% 0.91% Toyota 4Runner/Hilux 90-97 3.55% 3.28% 3.84% 0.56% Toyota Hilux 98-00 3.69% 2.70% 5.04% 2.33% Toyota Landcruiser 82-89 3.61% 3.24% 4.02% 0.78% Toyota Landcruiser 90-97 2.77% 2.46% 3.13% 0.67% Toyota Landcruiser 98-00 2.94% 2.23% 3.87% 1.64% Toyota RAV4 94-00 2.29% 1.55% 3.39% 1.85% Commercial Vehicles 3.51% 3.78% 0.27% Daihatsu Handivan 82-90 7.05% 5.50% 9.04% 3.54% Ford Falcon Panel Van 85-95 3.00% 2.51% 3.59% 1.08% Ford / Nissan Falcon Ute / XFN Ute 85-93 3.36% 3.02% 3.73% 0.71% Ford Falcon Ute 94-99 2.61% 1.91% 3.57% 1.66% Ford Ford F-Series 79-92 2.64% 1.79% 3.90% 2.11% Ford Transit 95-00 2.75% 1.71% 4.40% 2.69% Holden Commodore Ute VG/VP 90-94 3.70% 2.89% 4.72% 1.82% Isuzu Pickup 82-85 4.24% 3.12% 5.77% 2.65% Isuzu Pickup 86-88 2.63% 1.46% 4.73% 3.27% Isuzu / Holden Pickup / Rodeo 89-95 4.01% 3.52% 4.57% 1.05% Holden Rodeo 96-98 2.86% 2.16% 3.80% 1.64% Holden Rodeo 99-00 2.32% 1.32% 4.06% 2.74%
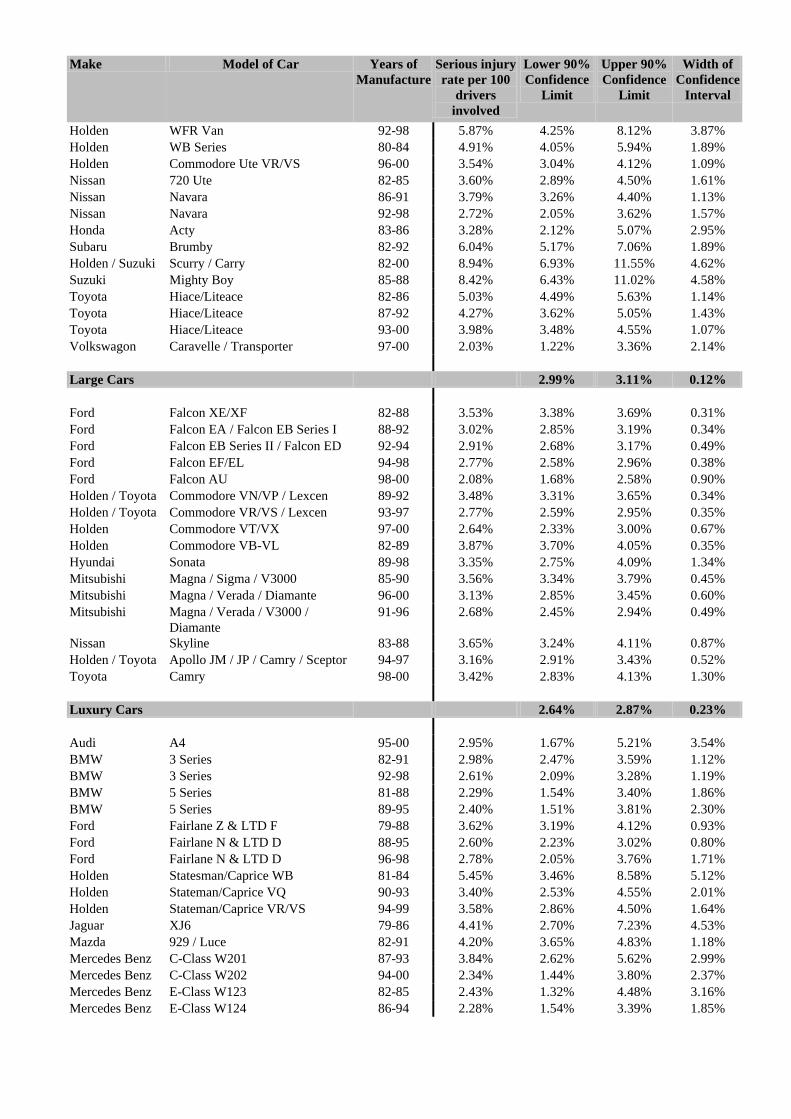
Make Model of Car Years of Manufacture
Serious injury rate per 100
drivers involved
Lower 90% Confidence
Limit
Upper 90% Confidence
Limit
Width of Confidence
Interval
Holden WFR Van 92-98 5.87% 4.25% 8.12% 3.87% Holden WB Series 80-84 4.91% 4.05% 5.94% 1.89% Holden Commodore Ute VR/VS 96-00 3.54% 3.04% 4.12% 1.09% Nissan 720 Ute 82-85 3.60% 2.89% 4.50% 1.61% Nissan Navara 86-91 3.79% 3.26% 4.40% 1.13% Nissan Navara 92-98 2.72% 2.05% 3.62% 1.57% Honda Acty 83-86 3.28% 2.12% 5.07% 2.95% Subaru Brumby 82-92 6.04% 5.17% 7.06% 1.89% Holden / Suzuki Scurry / Carry 82-00 8.94% 6.93% 11.55% 4.62% Suzuki Mighty Boy 85-88 8.42% 6.43% 11.02% 4.58% Toyota Hiace/Liteace 82-86 5.03% 4.49% 5.63% 1.14% Toyota Hiace/Liteace 87-92 4.27% 3.62% 5.05% 1.43% Toyota Hiace/Liteace 93-00 3.98% 3.48% 4.55% 1.07% Volkswagon Caravelle / Transporter 97-00 2.03% 1.22% 3.36% 2.14%
Large Cars 2.99% 3.11% 0.12% Ford Falcon XE/XF 82-88 3.53% 3.38% 3.69% 0.31% Ford Falcon EA / Falcon EB Series I 88-92 3.02% 2.85% 3.19% 0.34% Ford Falcon EB Series II / Falcon ED 92-94 2.91% 2.68% 3.17% 0.49% Ford Falcon EF/EL 94-98 2.77% 2.58% 2.96% 0.38% Ford Falcon AU 98-00 2.08% 1.68% 2.58% 0.90% Holden / Toyota Commodore VN/VP / Lexcen 89-92 3.48% 3.31% 3.65% 0.34% Holden / Toyota Commodore VR/VS / Lexcen 93-97 2.77% 2.59% 2.95% 0.35% Holden Commodore VT/VX 97-00 2.64% 2.33% 3.00% 0.67% Holden Commodore VB-VL 82-89 3.87% 3.70% 4.05% 0.35% Hyundai Sonata 89-98 3.35% 2.75% 4.09% 1.34% Mitsubishi Magna / Sigma / V3000 85-90 3.56% 3.34% 3.79% 0.45% Mitsubishi Magna / Verada / Diamante 96-00 3.13% 2.85% 3.45% 0.60% Mitsubishi Magna / Verada / V3000 /
Diamante 91-96 2.68% 2.45% 2.94% 0.49%
Nissan Skyline 83-88 3.65% 3.24% 4.11% 0.87% Holden / Toyota Apollo JM / JP / Camry / Sceptor 94-97 3.16% 2.91% 3.43% 0.52% Toyota Camry 98-00 3.42% 2.83% 4.13% 1.30% Luxury Cars 2.64% 2.87% 0.23% Audi A4 95-00 2.95% 1.67% 5.21% 3.54% BMW 3 Series 82-91 2.98% 2.47% 3.59% 1.12% BMW 3 Series 92-98 2.61% 2.09% 3.28% 1.19% BMW 5 Series 81-88 2.29% 1.54% 3.40% 1.86% BMW 5 Series 89-95 2.40% 1.51% 3.81% 2.30% Ford Fairlane Z & LTD F 79-88 3.62% 3.19% 4.12% 0.93% Ford Fairlane N & LTD D 88-95 2.60% 2.23% 3.02% 0.80% Ford Fairlane N & LTD D 96-98 2.78% 2.05% 3.76% 1.71% Holden Statesman/Caprice WB 81-84 5.45% 3.46% 8.58% 5.12% Holden Stateman/Caprice VQ 90-93 3.40% 2.53% 4.55% 2.01% Holden Stateman/Caprice VR/VS 94-99 3.58% 2.86% 4.50% 1.64% Jaguar XJ6 79-86 4.41% 2.70% 7.23% 4.53% Mazda 929 / Luce 82-91 4.20% 3.65% 4.83% 1.18% Mercedes Benz C-Class W201 87-93 3.84% 2.62% 5.62% 2.99% Mercedes Benz C-Class W202 94-00 2.34% 1.44% 3.80% 2.37% Mercedes Benz E-Class W123 82-85 2.43% 1.32% 4.48% 3.16% Mercedes Benz E-Class W124 86-94 2.28% 1.54% 3.39% 1.85%
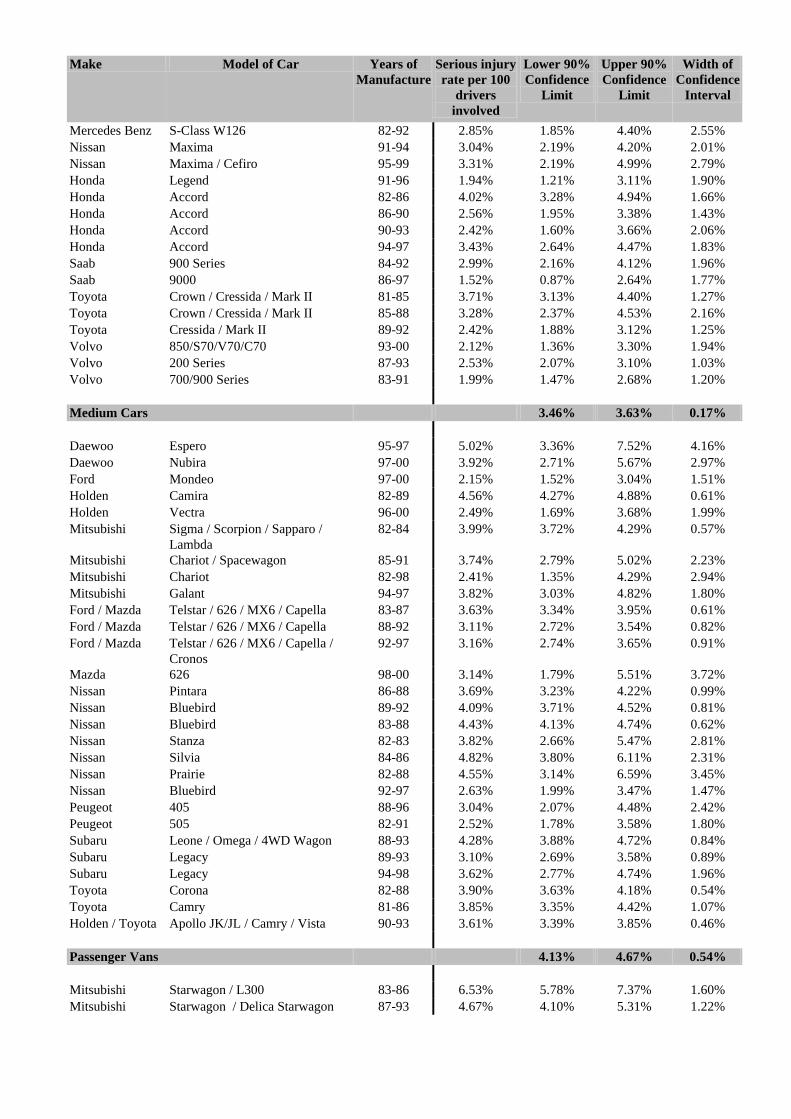
Make Model of Car Years of Manufacture
Serious injury rate per 100
drivers involved
Lower 90% Confidence
Limit
Upper 90% Confidence
Limit
Width of Confidence
Interval
Mercedes Benz S-Class W126 82-92 2.85% 1.85% 4.40% 2.55% Nissan Maxima 91-94 3.04% 2.19% 4.20% 2.01% Nissan Maxima / Cefiro 95-99 3.31% 2.19% 4.99% 2.79% Honda Legend 91-96 1.94% 1.21% 3.11% 1.90% Honda Accord 82-86 4.02% 3.28% 4.94% 1.66% Honda Accord 86-90 2.56% 1.95% 3.38% 1.43% Honda Accord 90-93 2.42% 1.60% 3.66% 2.06% Honda Accord 94-97 3.43% 2.64% 4.47% 1.83% Saab 900 Series 84-92 2.99% 2.16% 4.12% 1.96% Saab 9000 86-97 1.52% 0.87% 2.64% 1.77% Toyota Crown / Cressida / Mark II 81-85 3.71% 3.13% 4.40% 1.27% Toyota Crown / Cressida / Mark II 85-88 3.28% 2.37% 4.53% 2.16% Toyota Cressida / Mark II 89-92 2.42% 1.88% 3.12% 1.25% Volvo 850/S70/V70/C70 93-00 2.12% 1.36% 3.30% 1.94% Volvo 200 Series 87-93 2.53% 2.07% 3.10% 1.03% Volvo 700/900 Series 83-91 1.99% 1.47% 2.68% 1.20% Medium Cars 3.46% 3.63% 0.17% Daewoo Espero 95-97 5.02% 3.36% 7.52% 4.16% Daewoo Nubira 97-00 3.92% 2.71% 5.67% 2.97% Ford Mondeo 97-00 2.15% 1.52% 3.04% 1.51% Holden Camira 82-89 4.56% 4.27% 4.88% 0.61% Holden Vectra 96-00 2.49% 1.69% 3.68% 1.99% Mitsubishi Sigma / Scorpion / Sapparo /
Lambda 82-84 3.99% 3.72% 4.29% 0.57%
Mitsubishi Chariot / Spacewagon 85-91 3.74% 2.79% 5.02% 2.23% Mitsubishi Chariot 82-98 2.41% 1.35% 4.29% 2.94% Mitsubishi Galant 94-97 3.82% 3.03% 4.82% 1.80% Ford / Mazda Telstar / 626 / MX6 / Capella 83-87 3.63% 3.34% 3.95% 0.61% Ford / Mazda Telstar / 626 / MX6 / Capella 88-92 3.11% 2.72% 3.54% 0.82% Ford / Mazda Telstar / 626 / MX6 / Capella /
Cronos 92-97 3.16% 2.74% 3.65% 0.91%
Mazda 626 98-00 3.14% 1.79% 5.51% 3.72% Nissan Pintara 86-88 3.69% 3.23% 4.22% 0.99% Nissan Bluebird 89-92 4.09% 3.71% 4.52% 0.81% Nissan Bluebird 83-88 4.43% 4.13% 4.74% 0.62% Nissan Stanza 82-83 3.82% 2.66% 5.47% 2.81% Nissan Silvia 84-86 4.82% 3.80% 6.11% 2.31% Nissan Prairie 82-88 4.55% 3.14% 6.59% 3.45% Nissan Bluebird 92-97 2.63% 1.99% 3.47% 1.47% Peugeot 405 88-96 3.04% 2.07% 4.48% 2.42% Peugeot 505 82-91 2.52% 1.78% 3.58% 1.80% Subaru Leone / Omega / 4WD Wagon 88-93 4.28% 3.88% 4.72% 0.84% Subaru Legacy 89-93 3.10% 2.69% 3.58% 0.89% Subaru Legacy 94-98 3.62% 2.77% 4.74% 1.96% Toyota Corona 82-88 3.90% 3.63% 4.18% 0.54% Toyota Camry 81-86 3.85% 3.35% 4.42% 1.07% Holden / Toyota Apollo JK/JL / Camry / Vista 90-93 3.61% 3.39% 3.85% 0.46% Passenger Vans 4.13% 4.67% 0.54% Mitsubishi Starwagon / L300 83-86 6.53% 5.78% 7.37% 1.60% Mitsubishi Starwagon / Delica Starwagon 87-93 4.67% 4.10% 5.31% 1.22%
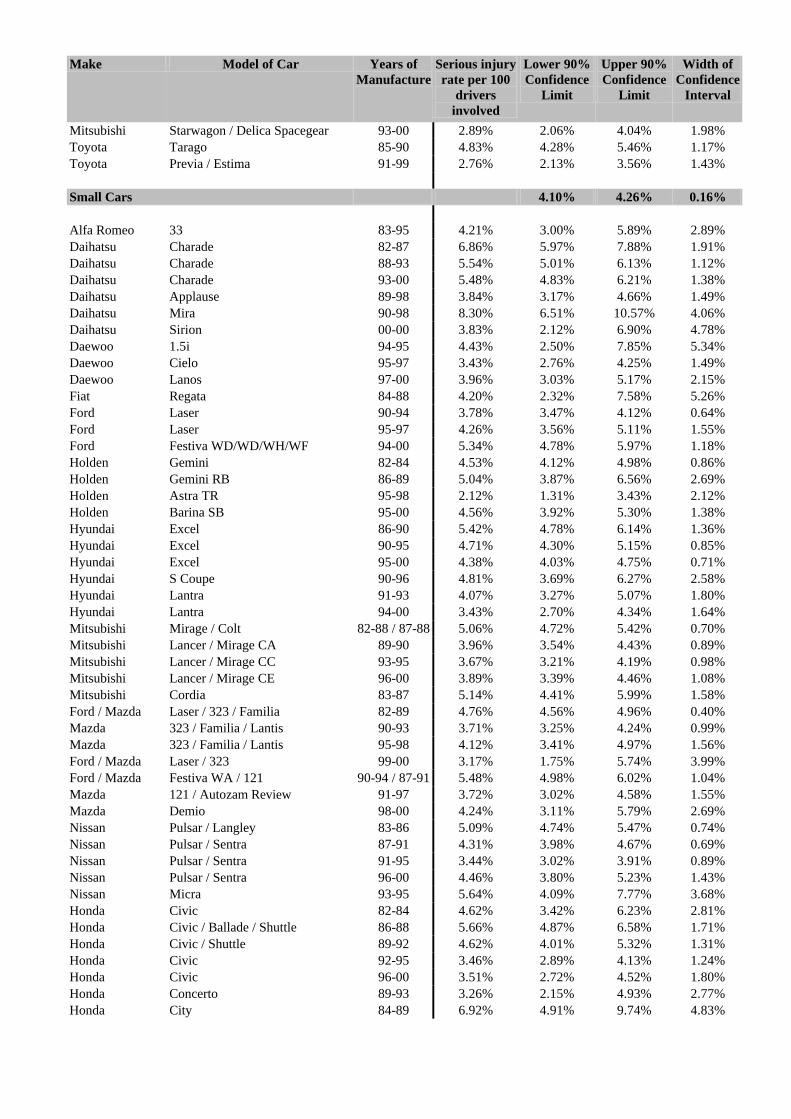
Make Model of Car Years of Manufacture
Serious injury rate per 100
drivers involved
Lower 90% Confidence
Limit
Upper 90% Confidence
Limit
Width of Confidence
Interval
Mitsubishi Starwagon / Delica Spacegear 93-00 2.89% 2.06% 4.04% 1.98% Toyota Tarago 85-90 4.83% 4.28% 5.46% 1.17% Toyota Previa / Estima 91-99 2.76% 2.13% 3.56% 1.43%
Small Cars 4.10% 4.26% 0.16% Alfa Romeo 33 83-95 4.21% 3.00% 5.89% 2.89% Daihatsu Charade 82-87 6.86% 5.97% 7.88% 1.91% Daihatsu Charade 88-93 5.54% 5.01% 6.13% 1.12% Daihatsu Charade 93-00 5.48% 4.83% 6.21% 1.38% Daihatsu Applause 89-98 3.84% 3.17% 4.66% 1.49% Daihatsu Mira 90-98 8.30% 6.51% 10.57% 4.06% Daihatsu Sirion 00-00 3.83% 2.12% 6.90% 4.78% Daewoo 1.5i 94-95 4.43% 2.50% 7.85% 5.34% Daewoo Cielo 95-97 3.43% 2.76% 4.25% 1.49% Daewoo Lanos 97-00 3.96% 3.03% 5.17% 2.15% Fiat Regata 84-88 4.20% 2.32% 7.58% 5.26% Ford Laser 90-94 3.78% 3.47% 4.12% 0.64% Ford Laser 95-97 4.26% 3.56% 5.11% 1.55% Ford Festiva WD/WD/WH/WF 94-00 5.34% 4.78% 5.97% 1.18% Holden Gemini 82-84 4.53% 4.12% 4.98% 0.86% Holden Gemini RB 86-89 5.04% 3.87% 6.56% 2.69% Holden Astra TR 95-98 2.12% 1.31% 3.43% 2.12% Holden Barina SB 95-00 4.56% 3.92% 5.30% 1.38% Hyundai Excel 86-90 5.42% 4.78% 6.14% 1.36% Hyundai Excel 90-95 4.71% 4.30% 5.15% 0.85% Hyundai Excel 95-00 4.38% 4.03% 4.75% 0.71% Hyundai S Coupe 90-96 4.81% 3.69% 6.27% 2.58% Hyundai Lantra 91-93 4.07% 3.27% 5.07% 1.80% Hyundai Lantra 94-00 3.43% 2.70% 4.34% 1.64% Mitsubishi Mirage / Colt 82-88 / 87-88 5.06% 4.72% 5.42% 0.70% Mitsubishi Lancer / Mirage CA 89-90 3.96% 3.54% 4.43% 0.89% Mitsubishi Lancer / Mirage CC 93-95 3.67% 3.21% 4.19% 0.98% Mitsubishi Lancer / Mirage CE 96-00 3.89% 3.39% 4.46% 1.08% Mitsubishi Cordia 83-87 5.14% 4.41% 5.99% 1.58% Ford / Mazda Laser / 323 / Familia 82-89 4.76% 4.56% 4.96% 0.40% Mazda 323 / Familia / Lantis 90-93 3.71% 3.25% 4.24% 0.99% Mazda 323 / Familia / Lantis 95-98 4.12% 3.41% 4.97% 1.56% Ford / Mazda Laser / 323 99-00 3.17% 1.75% 5.74% 3.99% Ford / Mazda Festiva WA / 121 90-94 / 87-91 5.48% 4.98% 6.02% 1.04% Mazda 121 / Autozam Review 91-97 3.72% 3.02% 4.58% 1.55% Mazda Demio 98-00 4.24% 3.11% 5.79% 2.69% Nissan Pulsar / Langley 83-86 5.09% 4.74% 5.47% 0.74% Nissan Pulsar / Sentra 87-91 4.31% 3.98% 4.67% 0.69% Nissan Pulsar / Sentra 91-95 3.44% 3.02% 3.91% 0.89% Nissan Pulsar / Sentra 96-00 4.46% 3.80% 5.23% 1.43% Nissan Micra 93-95 5.64% 4.09% 7.77% 3.68% Honda Civic 82-84 4.62% 3.42% 6.23% 2.81% Honda Civic / Ballade / Shuttle 86-88 5.66% 4.87% 6.58% 1.71% Honda Civic / Shuttle 89-92 4.62% 4.01% 5.32% 1.31% Honda Civic 92-95 3.46% 2.89% 4.13% 1.24% Honda Civic 96-00 3.51% 2.72% 4.52% 1.80% Honda Concerto 89-93 3.26% 2.15% 4.93% 2.77% Honda City 84-89 6.92% 4.91% 9.74% 4.83%
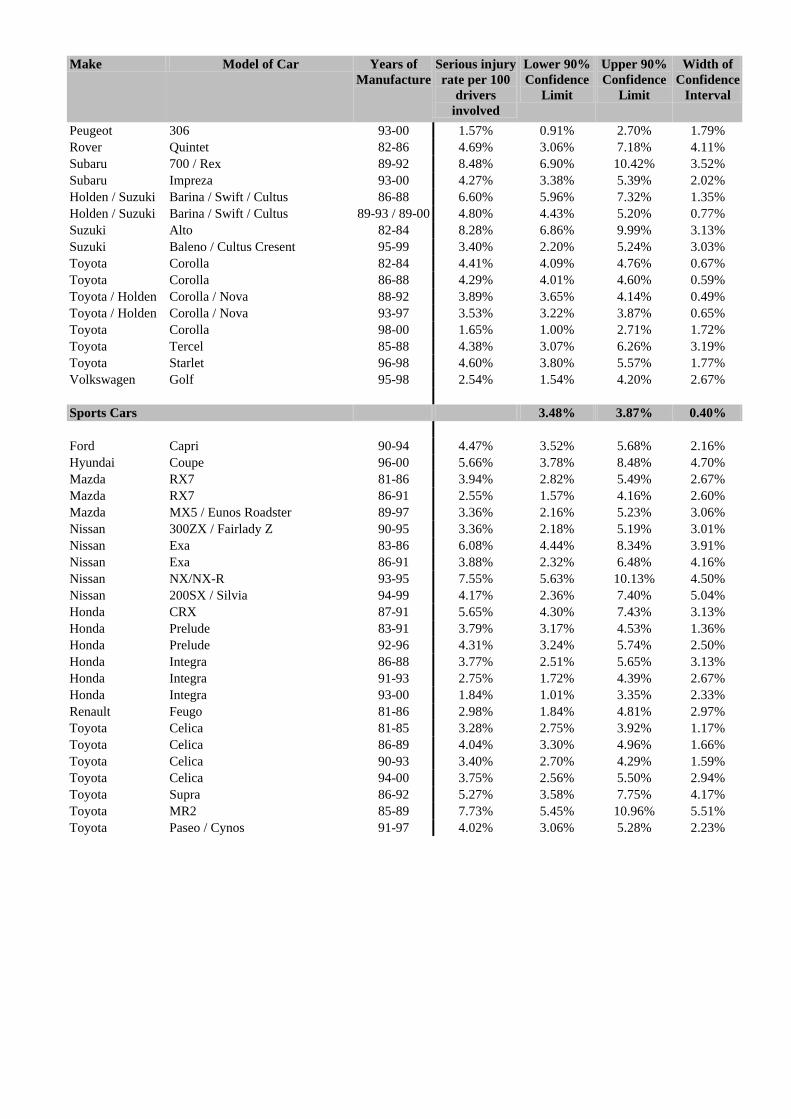
Make Model of Car Years of Manufacture
Serious injury rate per 100
drivers involved
Lower 90% Confidence
Limit
Upper 90% Confidence
Limit
Width of Confidence
Interval
Peugeot 306 93-00 1.57% 0.91% 2.70% 1.79% Rover Quintet 82-86 4.69% 3.06% 7.18% 4.11% Subaru 700 / Rex 89-92 8.48% 6.90% 10.42% 3.52% Subaru Impreza 93-00 4.27% 3.38% 5.39% 2.02% Holden / Suzuki Barina / Swift / Cultus 86-88 6.60% 5.96% 7.32% 1.35% Holden / Suzuki Barina / Swift / Cultus 89-93 / 89-00 4.80% 4.43% 5.20% 0.77% Suzuki Alto 82-84 8.28% 6.86% 9.99% 3.13% Suzuki Baleno / Cultus Cresent 95-99 3.40% 2.20% 5.24% 3.03% Toyota Corolla 82-84 4.41% 4.09% 4.76% 0.67% Toyota Corolla 86-88 4.29% 4.01% 4.60% 0.59% Toyota / Holden Corolla / Nova 88-92 3.89% 3.65% 4.14% 0.49% Toyota / Holden Corolla / Nova 93-97 3.53% 3.22% 3.87% 0.65% Toyota Corolla 98-00 1.65% 1.00% 2.71% 1.72% Toyota Tercel 85-88 4.38% 3.07% 6.26% 3.19% Toyota Starlet 96-98 4.60% 3.80% 5.57% 1.77% Volkswagen Golf 95-98 2.54% 1.54% 4.20% 2.67%
Sports Cars 3.48% 3.87% 0.40% Ford Capri 90-94 4.47% 3.52% 5.68% 2.16% Hyundai Coupe 96-00 5.66% 3.78% 8.48% 4.70% Mazda RX7 81-86 3.94% 2.82% 5.49% 2.67% Mazda RX7 86-91 2.55% 1.57% 4.16% 2.60% Mazda MX5 / Eunos Roadster 89-97 3.36% 2.16% 5.23% 3.06% Nissan 300ZX / Fairlady Z 90-95 3.36% 2.18% 5.19% 3.01% Nissan Exa 83-86 6.08% 4.44% 8.34% 3.91% Nissan Exa 86-91 3.88% 2.32% 6.48% 4.16% Nissan NX/NX-R 93-95 7.55% 5.63% 10.13% 4.50% Nissan 200SX / Silvia 94-99 4.17% 2.36% 7.40% 5.04% Honda CRX 87-91 5.65% 4.30% 7.43% 3.13% Honda Prelude 83-91 3.79% 3.17% 4.53% 1.36% Honda Prelude 92-96 4.31% 3.24% 5.74% 2.50% Honda Integra 86-88 3.77% 2.51% 5.65% 3.13% Honda Integra 91-93 2.75% 1.72% 4.39% 2.67% Honda Integra 93-00 1.84% 1.01% 3.35% 2.33% Renault Feugo 81-86 2.98% 1.84% 4.81% 2.97% Toyota Celica 81-85 3.28% 2.75% 3.92% 1.17% Toyota Celica 86-89 4.04% 3.30% 4.96% 1.66% Toyota Celica 90-93 3.40% 2.70% 4.29% 1.59% Toyota Celica 94-00 3.75% 2.56% 5.50% 2.94% Toyota Supra 86-92 5.27% 3.58% 7.75% 4.17% Toyota MR2 85-89 7.73% 5.45% 10.96% 5.51% Toyota Paseo / Cynos 91-97 4.02% 3.06% 5.28% 2.23%
APPENDIX 5
AGGRESSIVITY INJURY RISK AGGRESSIVITY INJURY SEVERITY AND RATINGS OF VEHICLE AGGRESSIVITY
(with 95% and 90% CONFIDENCE LIMITS), TOWARDS OTHER VEHICLE DRIVERS

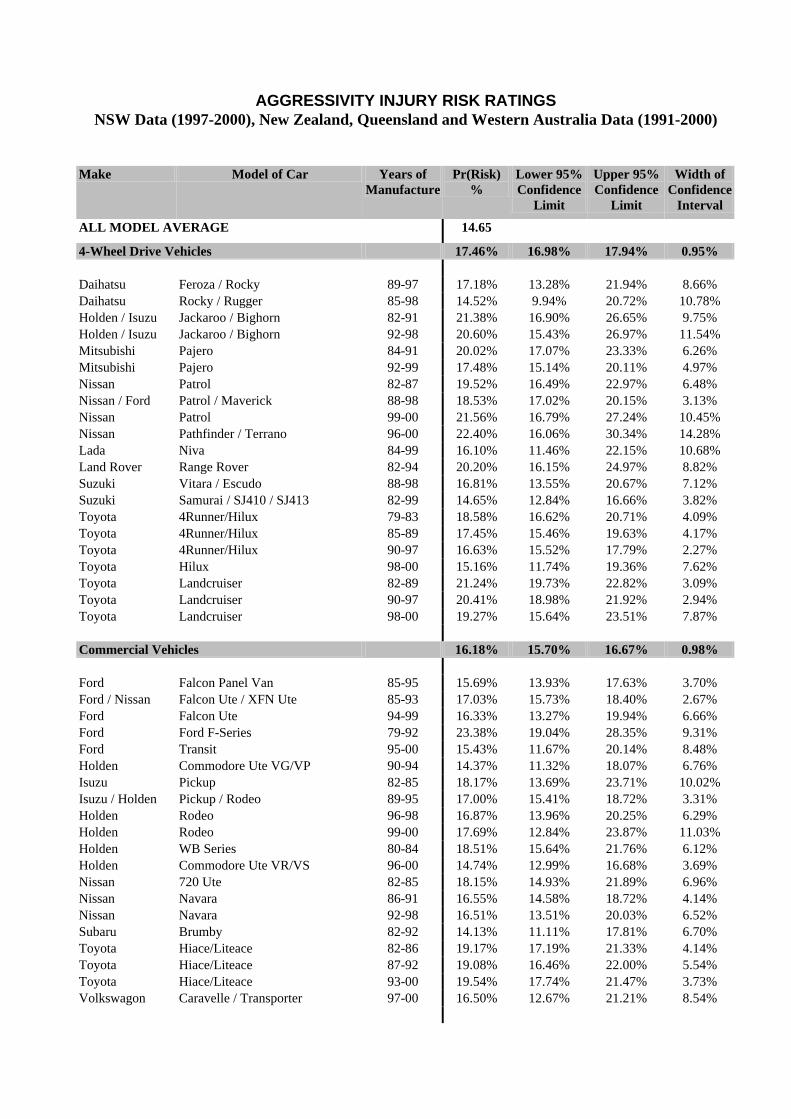
AGGRESSIVITY INJURY RISK RATINGS NSW Data (1997-2000), New Zealand, Queensland and Western Australia Data (1991-2000)
Make Model of Car Years of Manufacture
Pr(Risk) %
Lower 95% Confidence
Limit
Upper 95% Confidence
Limit
Width of Confidence
Interval
ALL MODEL AVERAGE 14.65
4-Wheel Drive Vehicles 17.46% 16.98% 17.94% 0.95% Daihatsu Feroza / Rocky 89-97 17.18% 13.28% 21.94% 8.66% Daihatsu Rocky / Rugger 85-98 14.52% 9.94% 20.72% 10.78% Holden / Isuzu Jackaroo / Bighorn 82-91 21.38% 16.90% 26.65% 9.75% Holden / Isuzu Jackaroo / Bighorn 92-98 20.60% 15.43% 26.97% 11.54% Mitsubishi Pajero 84-91 20.02% 17.07% 23.33% 6.26% Mitsubishi Pajero 92-99 17.48% 15.14% 20.11% 4.97% Nissan Patrol 82-87 19.52% 16.49% 22.97% 6.48% Nissan / Ford Patrol / Maverick 88-98 18.53% 17.02% 20.15% 3.13% Nissan Patrol 99-00 21.56% 16.79% 27.24% 10.45% Nissan Pathfinder / Terrano 96-00 22.40% 16.06% 30.34% 14.28% Lada Niva 84-99 16.10% 11.46% 22.15% 10.68% Land Rover Range Rover 82-94 20.20% 16.15% 24.97% 8.82% Suzuki Vitara / Escudo 88-98 16.81% 13.55% 20.67% 7.12% Suzuki Samurai / SJ410 / SJ413 82-99 14.65% 12.84% 16.66% 3.82% Toyota 4Runner/Hilux 79-83 18.58% 16.62% 20.71% 4.09% Toyota 4Runner/Hilux 85-89 17.45% 15.46% 19.63% 4.17% Toyota 4Runner/Hilux 90-97 16.63% 15.52% 17.79% 2.27% Toyota Hilux 98-00 15.16% 11.74% 19.36% 7.62% Toyota Landcruiser 82-89 21.24% 19.73% 22.82% 3.09% Toyota Landcruiser 90-97 20.41% 18.98% 21.92% 2.94% Toyota Landcruiser 98-00 19.27% 15.64% 23.51% 7.87%
Commercial Vehicles 16.18% 15.70% 16.67% 0.98% Ford Falcon Panel Van 85-95 15.69% 13.93% 17.63% 3.70% Ford / Nissan Falcon Ute / XFN Ute 85-93 17.03% 15.73% 18.40% 2.67% Ford Falcon Ute 94-99 16.33% 13.27% 19.94% 6.66% Ford Ford F-Series 79-92 23.38% 19.04% 28.35% 9.31% Ford Transit 95-00 15.43% 11.67% 20.14% 8.48% Holden Commodore Ute VG/VP 90-94 14.37% 11.32% 18.07% 6.76% Isuzu Pickup 82-85 18.17% 13.69% 23.71% 10.02% Isuzu / Holden Pickup / Rodeo 89-95 17.00% 15.41% 18.72% 3.31% Holden Rodeo 96-98 16.87% 13.96% 20.25% 6.29% Holden Rodeo 99-00 17.69% 12.84% 23.87% 11.03% Holden WB Series 80-84 18.51% 15.64% 21.76% 6.12% Holden Commodore Ute VR/VS 96-00 14.74% 12.99% 16.68% 3.69% Nissan 720 Ute 82-85 18.15% 14.93% 21.89% 6.96% Nissan Navara 86-91 16.55% 14.58% 18.72% 4.14% Nissan Navara 92-98 16.51% 13.51% 20.03% 6.52% Subaru Brumby 82-92 14.13% 11.11% 17.81% 6.70% Toyota Hiace/Liteace 82-86 19.17% 17.19% 21.33% 4.14% Toyota Hiace/Liteace 87-92 19.08% 16.46% 22.00% 5.54% Toyota Hiace/Liteace 93-00 19.54% 17.74% 21.47% 3.73% Volkswagon Caravelle / Transporter 97-00 16.50% 12.67% 21.21% 8.54%
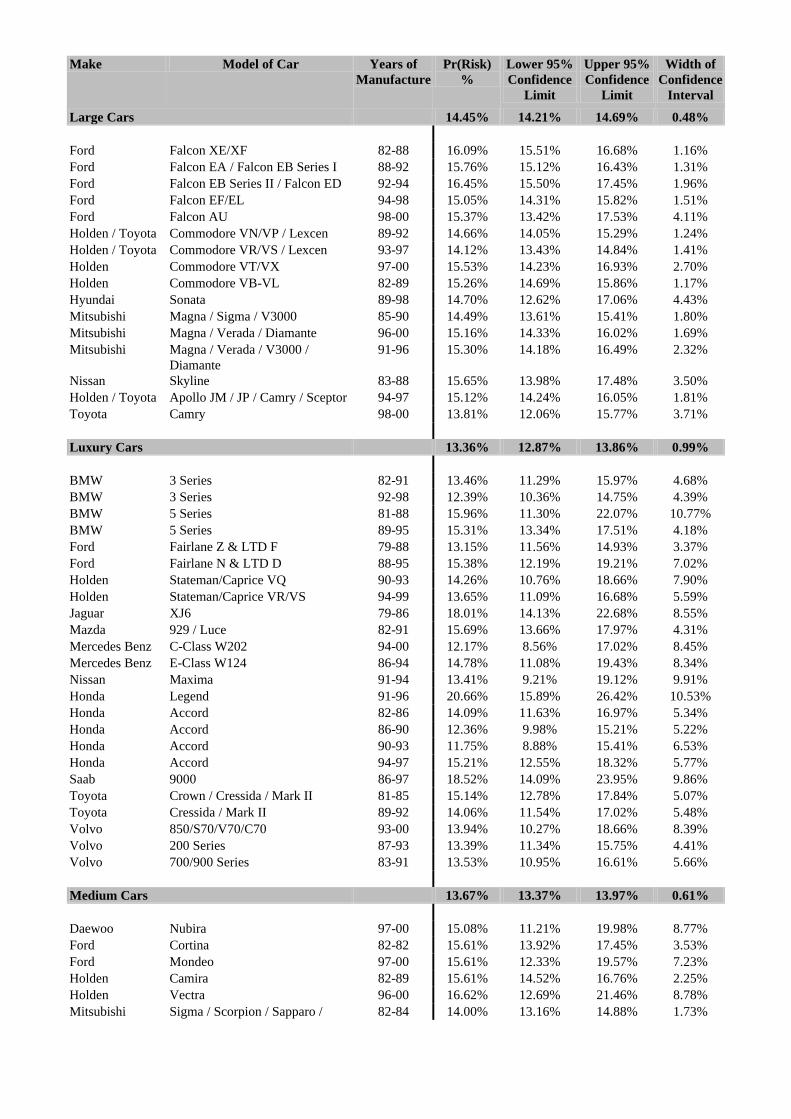
Make Model of Car Years of Manufacture
Pr(Risk) %
Lower 95% Confidence
Limit
Upper 95% Confidence
Limit
Width of Confidence
Interval
Large Cars 14.45% 14.21% 14.69% 0.48% Ford Falcon XE/XF 82-88 16.09% 15.51% 16.68% 1.16% Ford Falcon EA / Falcon EB Series I 88-92 15.76% 15.12% 16.43% 1.31% Ford Falcon EB Series II / Falcon ED 92-94 16.45% 15.50% 17.45% 1.96% Ford Falcon EF/EL 94-98 15.05% 14.31% 15.82% 1.51% Ford Falcon AU 98-00 15.37% 13.42% 17.53% 4.11% Holden / Toyota Commodore VN/VP / Lexcen 89-92 14.66% 14.05% 15.29% 1.24% Holden / Toyota Commodore VR/VS / Lexcen 93-97 14.12% 13.43% 14.84% 1.41% Holden Commodore VT/VX 97-00 15.53% 14.23% 16.93% 2.70% Holden Commodore VB-VL 82-89 15.26% 14.69% 15.86% 1.17% Hyundai Sonata 89-98 14.70% 12.62% 17.06% 4.43% Mitsubishi Magna / Sigma / V3000 85-90 14.49% 13.61% 15.41% 1.80% Mitsubishi Magna / Verada / Diamante 96-00 15.16% 14.33% 16.02% 1.69% Mitsubishi Magna / Verada / V3000 /
Diamante 91-96 15.30% 14.18% 16.49% 2.32%
Nissan Skyline 83-88 15.65% 13.98% 17.48% 3.50% Holden / Toyota Apollo JM / JP / Camry / Sceptor 94-97 15.12% 14.24% 16.05% 1.81% Toyota Camry 98-00 13.81% 12.06% 15.77% 3.71%
Luxury Cars 13.36% 12.87% 13.86% 0.99% BMW 3 Series 82-91 13.46% 11.29% 15.97% 4.68% BMW 3 Series 92-98 12.39% 10.36% 14.75% 4.39% BMW 5 Series 81-88 15.96% 11.30% 22.07% 10.77% BMW 5 Series 89-95 15.31% 13.34% 17.51% 4.18% Ford Fairlane Z & LTD F 79-88 13.15% 11.56% 14.93% 3.37% Ford Fairlane N & LTD D 88-95 15.38% 12.19% 19.21% 7.02% Holden Stateman/Caprice VQ 90-93 14.26% 10.76% 18.66% 7.90% Holden Stateman/Caprice VR/VS 94-99 13.65% 11.09% 16.68% 5.59% Jaguar XJ6 79-86 18.01% 14.13% 22.68% 8.55% Mazda 929 / Luce 82-91 15.69% 13.66% 17.97% 4.31% Mercedes Benz C-Class W202 94-00 12.17% 8.56% 17.02% 8.45% Mercedes Benz E-Class W124 86-94 14.78% 11.08% 19.43% 8.34% Nissan Maxima 91-94 13.41% 9.21% 19.12% 9.91% Honda Legend 91-96 20.66% 15.89% 26.42% 10.53% Honda Accord 82-86 14.09% 11.63% 16.97% 5.34% Honda Accord 86-90 12.36% 9.98% 15.21% 5.22% Honda Accord 90-93 11.75% 8.88% 15.41% 6.53% Honda Accord 94-97 15.21% 12.55% 18.32% 5.77% Saab 9000 86-97 18.52% 14.09% 23.95% 9.86% Toyota Crown / Cressida / Mark II 81-85 15.14% 12.78% 17.84% 5.07% Toyota Cressida / Mark II 89-92 14.06% 11.54% 17.02% 5.48% Volvo 850/S70/V70/C70 93-00 13.94% 10.27% 18.66% 8.39% Volvo 200 Series 87-93 13.39% 11.34% 15.75% 4.41% Volvo 700/900 Series 83-91 13.53% 10.95% 16.61% 5.66% Medium Cars 13.67% 13.37% 13.97% 0.61% Daewoo Nubira 97-00 15.08% 11.21% 19.98% 8.77% Ford Cortina 82-82 15.61% 13.92% 17.45% 3.53% Ford Mondeo 97-00 15.61% 12.33% 19.57% 7.23% Holden Camira 82-89 15.61% 14.52% 16.76% 2.25% Holden Vectra 96-00 16.62% 12.69% 21.46% 8.78% Mitsubishi Sigma / Scorpion / Sapparo /
Lambda 82-84 14.00% 13.16% 14.88% 1.73%
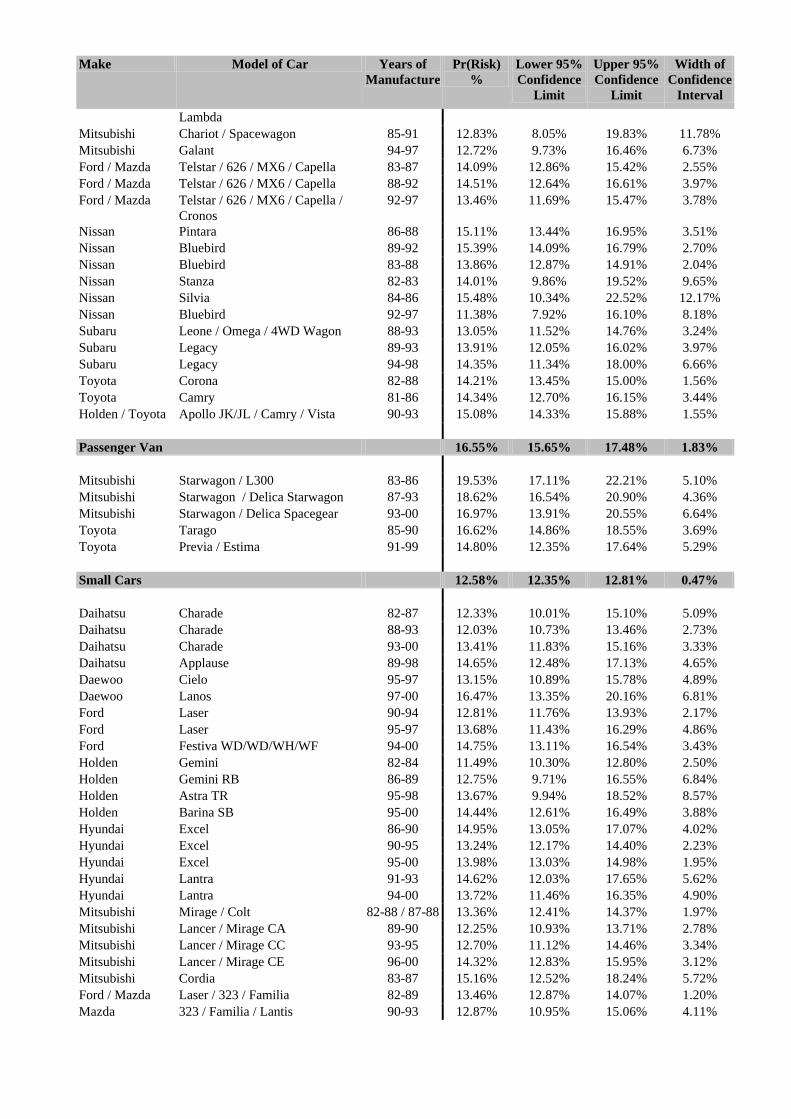
Make Model of Car Years of Manufacture
Pr(Risk) %
Lower 95% Confidence
Limit
Upper 95% Confidence
Limit
Width of Confidence
Interval
Lambda Mitsubishi Chariot / Spacewagon 85-91 12.83% 8.05% 19.83% 11.78% Mitsubishi Galant 94-97 12.72% 9.73% 16.46% 6.73% Ford / Mazda Telstar / 626 / MX6 / Capella 83-87 14.09% 12.86% 15.42% 2.55% Ford / Mazda Telstar / 626 / MX6 / Capella 88-92 14.51% 12.64% 16.61% 3.97% Ford / Mazda Telstar / 626 / MX6 / Capella /
Cronos 92-97 13.46% 11.69% 15.47% 3.78%
Nissan Pintara 86-88 15.11% 13.44% 16.95% 3.51% Nissan Bluebird 89-92 15.39% 14.09% 16.79% 2.70% Nissan Bluebird 83-88 13.86% 12.87% 14.91% 2.04% Nissan Stanza 82-83 14.01% 9.86% 19.52% 9.65% Nissan Silvia 84-86 15.48% 10.34% 22.52% 12.17% Nissan Bluebird 92-97 11.38% 7.92% 16.10% 8.18% Subaru Leone / Omega / 4WD Wagon 88-93 13.05% 11.52% 14.76% 3.24% Subaru Legacy 89-93 13.91% 12.05% 16.02% 3.97% Subaru Legacy 94-98 14.35% 11.34% 18.00% 6.66% Toyota Corona 82-88 14.21% 13.45% 15.00% 1.56% Toyota Camry 81-86 14.34% 12.70% 16.15% 3.44% Holden / Toyota Apollo JK/JL / Camry / Vista 90-93 15.08% 14.33% 15.88% 1.55% Passenger Van 16.55% 15.65% 17.48% 1.83% Mitsubishi Starwagon / L300 83-86 19.53% 17.11% 22.21% 5.10% Mitsubishi Starwagon / Delica Starwagon 87-93 18.62% 16.54% 20.90% 4.36% Mitsubishi Starwagon / Delica Spacegear 93-00 16.97% 13.91% 20.55% 6.64% Toyota Tarago 85-90 16.62% 14.86% 18.55% 3.69% Toyota Previa / Estima 91-99 14.80% 12.35% 17.64% 5.29%
Small Cars 12.58% 12.35% 12.81% 0.47% Daihatsu Charade 82-87 12.33% 10.01% 15.10% 5.09% Daihatsu Charade 88-93 12.03% 10.73% 13.46% 2.73% Daihatsu Charade 93-00 13.41% 11.83% 15.16% 3.33% Daihatsu Applause 89-98 14.65% 12.48% 17.13% 4.65% Daewoo Cielo 95-97 13.15% 10.89% 15.78% 4.89% Daewoo Lanos 97-00 16.47% 13.35% 20.16% 6.81% Ford Laser 90-94 12.81% 11.76% 13.93% 2.17% Ford Laser 95-97 13.68% 11.43% 16.29% 4.86% Ford Festiva WD/WD/WH/WF 94-00 14.75% 13.11% 16.54% 3.43% Holden Gemini 82-84 11.49% 10.30% 12.80% 2.50% Holden Gemini RB 86-89 12.75% 9.71% 16.55% 6.84% Holden Astra TR 95-98 13.67% 9.94% 18.52% 8.57% Holden Barina SB 95-00 14.44% 12.61% 16.49% 3.88% Hyundai Excel 86-90 14.95% 13.05% 17.07% 4.02% Hyundai Excel 90-95 13.24% 12.17% 14.40% 2.23% Hyundai Excel 95-00 13.98% 13.03% 14.98% 1.95% Hyundai Lantra 91-93 14.62% 12.03% 17.65% 5.62% Hyundai Lantra 94-00 13.72% 11.46% 16.35% 4.90% Mitsubishi Mirage / Colt 82-88 / 87-88 13.36% 12.41% 14.37% 1.97% Mitsubishi Lancer / Mirage CA 89-90 12.25% 10.93% 13.71% 2.78% Mitsubishi Lancer / Mirage CC 93-95 12.70% 11.12% 14.46% 3.34% Mitsubishi Lancer / Mirage CE 96-00 14.32% 12.83% 15.95% 3.12% Mitsubishi Cordia 83-87 15.16% 12.52% 18.24% 5.72% Ford / Mazda Laser / 323 / Familia 82-89 13.46% 12.87% 14.07% 1.20% Mazda 323 / Familia / Lantis 90-93 12.87% 10.95% 15.06% 4.11%
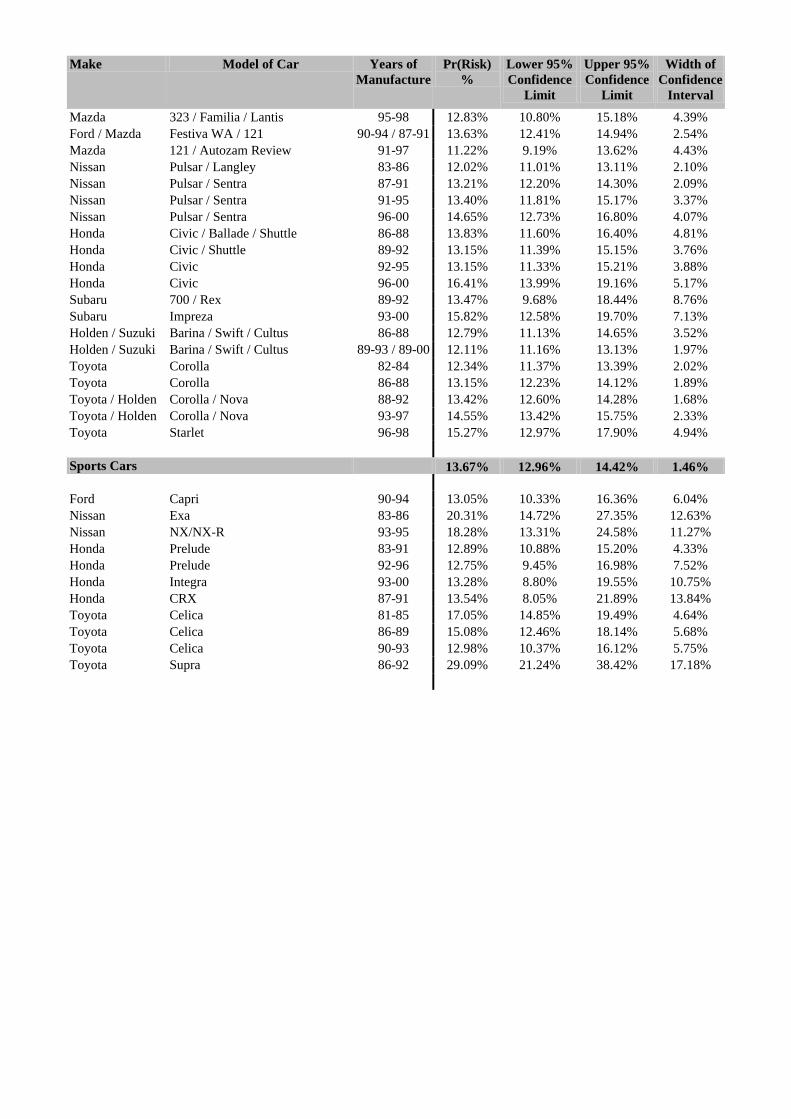
Make Model of Car Years of Manufacture
Pr(Risk) %
Lower 95% Confidence
Limit
Upper 95% Confidence
Limit
Width of Confidence
Interval
Mazda 323 / Familia / Lantis 95-98 12.83% 10.80% 15.18% 4.39% Ford / Mazda Festiva WA / 121 90-94 / 87-91 13.63% 12.41% 14.94% 2.54% Mazda 121 / Autozam Review 91-97 11.22% 9.19% 13.62% 4.43% Nissan Pulsar / Langley 83-86 12.02% 11.01% 13.11% 2.10% Nissan Pulsar / Sentra 87-91 13.21% 12.20% 14.30% 2.09% Nissan Pulsar / Sentra 91-95 13.40% 11.81% 15.17% 3.37% Nissan Pulsar / Sentra 96-00 14.65% 12.73% 16.80% 4.07% Honda Civic / Ballade / Shuttle 86-88 13.83% 11.60% 16.40% 4.81% Honda Civic / Shuttle 89-92 13.15% 11.39% 15.15% 3.76% Honda Civic 92-95 13.15% 11.33% 15.21% 3.88% Honda Civic 96-00 16.41% 13.99% 19.16% 5.17% Subaru 700 / Rex 89-92 13.47% 9.68% 18.44% 8.76% Subaru Impreza 93-00 15.82% 12.58% 19.70% 7.13% Holden / Suzuki Barina / Swift / Cultus 86-88 12.79% 11.13% 14.65% 3.52% Holden / Suzuki Barina / Swift / Cultus 89-93 / 89-00 12.11% 11.16% 13.13% 1.97% Toyota Corolla 82-84 12.34% 11.37% 13.39% 2.02% Toyota Corolla 86-88 13.15% 12.23% 14.12% 1.89% Toyota / Holden Corolla / Nova 88-92 13.42% 12.60% 14.28% 1.68% Toyota / Holden Corolla / Nova 93-97 14.55% 13.42% 15.75% 2.33% Toyota Starlet 96-98 15.27% 12.97% 17.90% 4.94%
Sports Cars 13.67% 12.96% 14.42% 1.46% Ford Capri 90-94 13.05% 10.33% 16.36% 6.04% Nissan Exa 83-86 20.31% 14.72% 27.35% 12.63% Nissan NX/NX-R 93-95 18.28% 13.31% 24.58% 11.27% Honda Prelude 83-91 12.89% 10.88% 15.20% 4.33% Honda Prelude 92-96 12.75% 9.45% 16.98% 7.52% Honda Integra 93-00 13.28% 8.80% 19.55% 10.75% Honda CRX 87-91 13.54% 8.05% 21.89% 13.84% Toyota Celica 81-85 17.05% 14.85% 19.49% 4.64% Toyota Celica 86-89 15.08% 12.46% 18.14% 5.68% Toyota Celica 90-93 12.98% 10.37% 16.12% 5.75% Toyota Supra 86-92 29.09% 21.24% 38.42% 17.18%
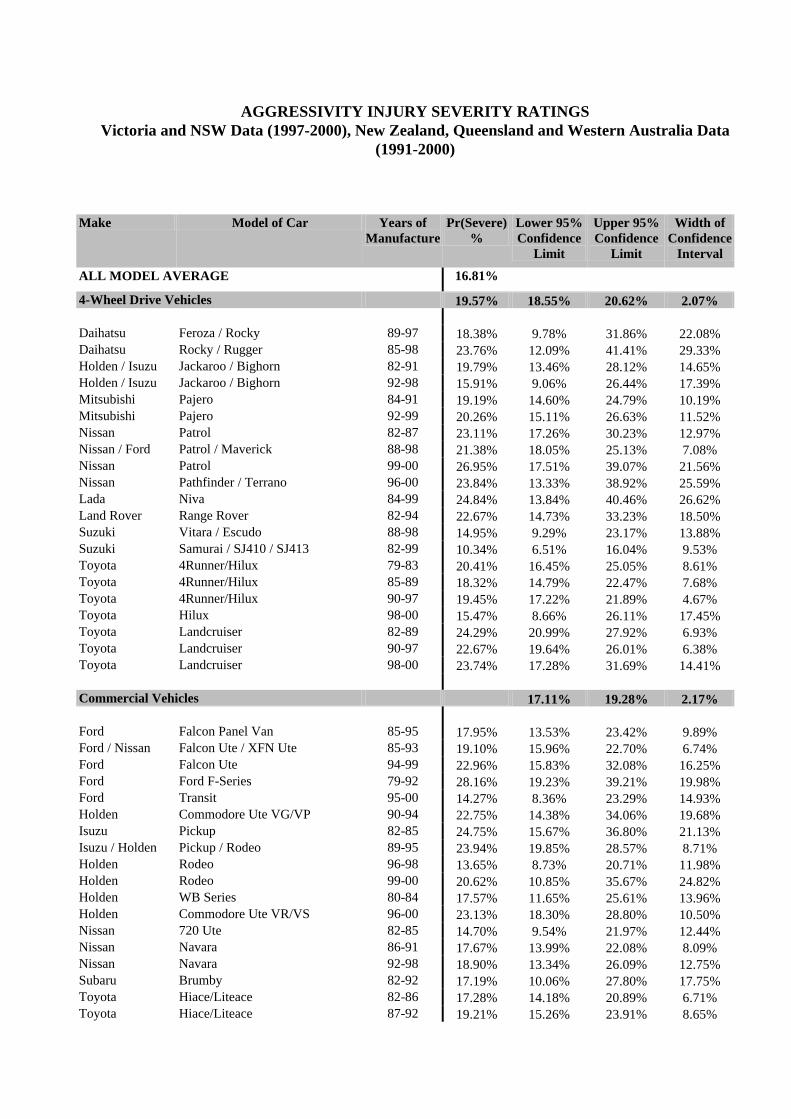
AGGRESSIVITY INJURY SEVERITY RATINGS Victoria and NSW Data (1997-2000), New Zealand, Queensland and Western Australia Data
(1991-2000)
Make Model of Car Years of Manufacture
Pr(Severe) %
Lower 95% Confidence
Limit
Upper 95% Confidence
Limit
Width of Confidence
Interval
ALL MODEL AVERAGE 16.81%
4-Wheel Drive Vehicles 19.57% 18.55% 20.62% 2.07% Daihatsu Feroza / Rocky 89-97 18.38% 9.78% 31.86% 22.08% Daihatsu Rocky / Rugger 85-98 23.76% 12.09% 41.41% 29.33% Holden / Isuzu Jackaroo / Bighorn 82-91 19.79% 13.46% 28.12% 14.65% Holden / Isuzu Jackaroo / Bighorn 92-98 15.91% 9.06% 26.44% 17.39% Mitsubishi Pajero 84-91 19.19% 14.60% 24.79% 10.19% Mitsubishi Pajero 92-99 20.26% 15.11% 26.63% 11.52% Nissan Patrol 82-87 23.11% 17.26% 30.23% 12.97% Nissan / Ford Patrol / Maverick 88-98 21.38% 18.05% 25.13% 7.08% Nissan Patrol 99-00 26.95% 17.51% 39.07% 21.56% Nissan Pathfinder / Terrano 96-00 23.84% 13.33% 38.92% 25.59% Lada Niva 84-99 24.84% 13.84% 40.46% 26.62% Land Rover Range Rover 82-94 22.67% 14.73% 33.23% 18.50% Suzuki Vitara / Escudo 88-98 14.95% 9.29% 23.17% 13.88% Suzuki Samurai / SJ410 / SJ413 82-99 10.34% 6.51% 16.04% 9.53% Toyota 4Runner/Hilux 79-83 20.41% 16.45% 25.05% 8.61% Toyota 4Runner/Hilux 85-89 18.32% 14.79% 22.47% 7.68% Toyota 4Runner/Hilux 90-97 19.45% 17.22% 21.89% 4.67% Toyota Hilux 98-00 15.47% 8.66% 26.11% 17.45% Toyota Landcruiser 82-89 24.29% 20.99% 27.92% 6.93% Toyota Landcruiser 90-97 22.67% 19.64% 26.01% 6.38% Toyota Landcruiser 98-00 23.74% 17.28% 31.69% 14.41%
Commercial Vehicles 17.11% 19.28% 2.17% Ford Falcon Panel Van 85-95 17.95% 13.53% 23.42% 9.89% Ford / Nissan Falcon Ute / XFN Ute 85-93 19.10% 15.96% 22.70% 6.74% Ford Falcon Ute 94-99 22.96% 15.83% 32.08% 16.25% Ford Ford F-Series 79-92 28.16% 19.23% 39.21% 19.98% Ford Transit 95-00 14.27% 8.36% 23.29% 14.93% Holden Commodore Ute VG/VP 90-94 22.75% 14.38% 34.06% 19.68% Isuzu Pickup 82-85 24.75% 15.67% 36.80% 21.13% Isuzu / Holden Pickup / Rodeo 89-95 23.94% 19.85% 28.57% 8.71% Holden Rodeo 96-98 13.65% 8.73% 20.71% 11.98% Holden Rodeo 99-00 20.62% 10.85% 35.67% 24.82% Holden WB Series 80-84 17.57% 11.65% 25.61% 13.96% Holden Commodore Ute VR/VS 96-00 23.13% 18.30% 28.80% 10.50% Nissan 720 Ute 82-85 14.70% 9.54% 21.97% 12.44% Nissan Navara 86-91 17.67% 13.99% 22.08% 8.09% Nissan Navara 92-98 18.90% 13.34% 26.09% 12.75% Subaru Brumby 82-92 17.19% 10.06% 27.80% 17.75% Toyota Hiace/Liteace 82-86 17.28% 14.18% 20.89% 6.71% Toyota Hiace/Liteace 87-92 19.21% 15.26% 23.91% 8.65%
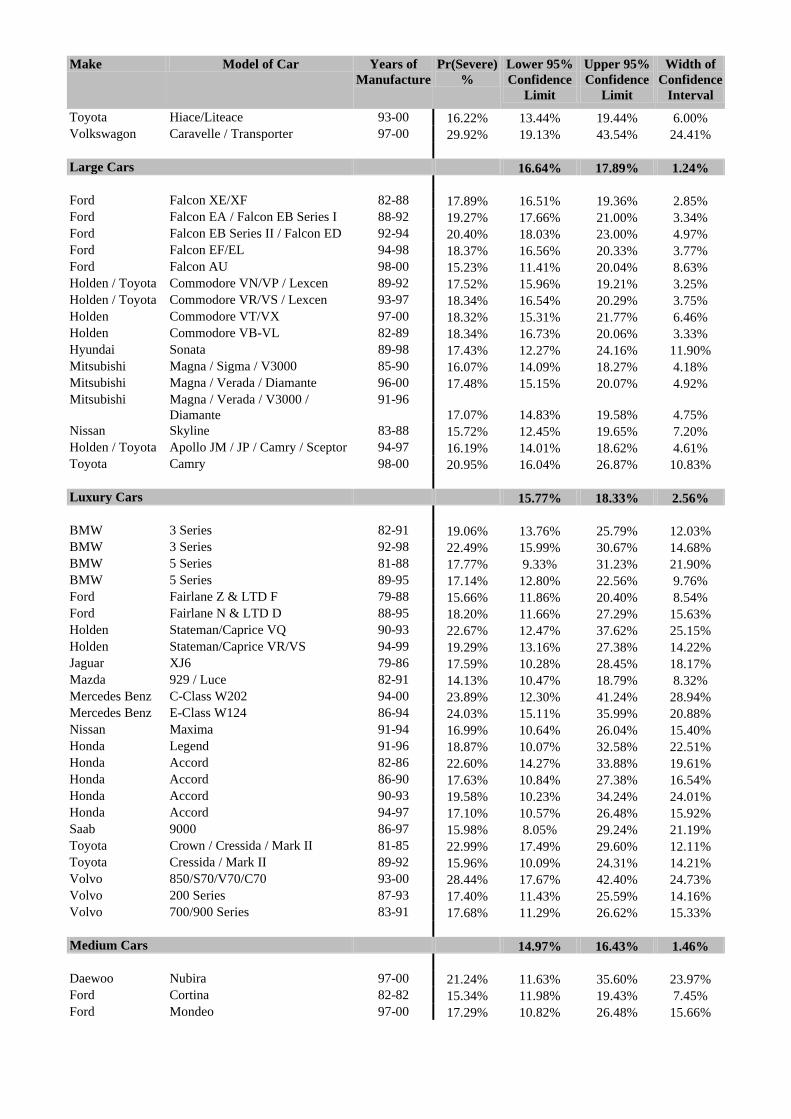
Make Model of Car Years of Manufacture
Pr(Severe) %
Lower 95% Confidence
Limit
Upper 95% Confidence
Limit
Width of Confidence
Interval
Toyota Hiace/Liteace 93-00 16.22% 13.44% 19.44% 6.00% Volkswagon Caravelle / Transporter 97-00 29.92% 19.13% 43.54% 24.41%
Large Cars 16.64% 17.89% 1.24% Ford Falcon XE/XF 82-88 17.89% 16.51% 19.36% 2.85% Ford Falcon EA / Falcon EB Series I 88-92 19.27% 17.66% 21.00% 3.34% Ford Falcon EB Series II / Falcon ED 92-94 20.40% 18.03% 23.00% 4.97% Ford Falcon EF/EL 94-98 18.37% 16.56% 20.33% 3.77% Ford Falcon AU 98-00 15.23% 11.41% 20.04% 8.63% Holden / Toyota Commodore VN/VP / Lexcen 89-92 17.52% 15.96% 19.21% 3.25% Holden / Toyota Commodore VR/VS / Lexcen 93-97 18.34% 16.54% 20.29% 3.75% Holden Commodore VT/VX 97-00 18.32% 15.31% 21.77% 6.46% Holden Commodore VB-VL 82-89 18.34% 16.73% 20.06% 3.33% Hyundai Sonata 89-98 17.43% 12.27% 24.16% 11.90% Mitsubishi Magna / Sigma / V3000 85-90 16.07% 14.09% 18.27% 4.18% Mitsubishi Magna / Verada / Diamante 96-00 17.48% 15.15% 20.07% 4.92% Mitsubishi Magna / Verada / V3000 /
Diamante 91-96
17.07% 14.83% 19.58% 4.75% Nissan Skyline 83-88 15.72% 12.45% 19.65% 7.20% Holden / Toyota Apollo JM / JP / Camry / Sceptor 94-97 16.19% 14.01% 18.62% 4.61% Toyota Camry 98-00 20.95% 16.04% 26.87% 10.83%
Luxury Cars 15.77% 18.33% 2.56% BMW 3 Series 82-91 19.06% 13.76% 25.79% 12.03% BMW 3 Series 92-98 22.49% 15.99% 30.67% 14.68% BMW 5 Series 81-88 17.77% 9.33% 31.23% 21.90% BMW 5 Series 89-95 17.14% 12.80% 22.56% 9.76% Ford Fairlane Z & LTD F 79-88 15.66% 11.86% 20.40% 8.54% Ford Fairlane N & LTD D 88-95 18.20% 11.66% 27.29% 15.63% Holden Stateman/Caprice VQ 90-93 22.67% 12.47% 37.62% 25.15% Holden Stateman/Caprice VR/VS 94-99 19.29% 13.16% 27.38% 14.22% Jaguar XJ6 79-86 17.59% 10.28% 28.45% 18.17% Mazda 929 / Luce 82-91 14.13% 10.47% 18.79% 8.32% Mercedes Benz C-Class W202 94-00 23.89% 12.30% 41.24% 28.94% Mercedes Benz E-Class W124 86-94 24.03% 15.11% 35.99% 20.88% Nissan Maxima 91-94 16.99% 10.64% 26.04% 15.40% Honda Legend 91-96 18.87% 10.07% 32.58% 22.51% Honda Accord 82-86 22.60% 14.27% 33.88% 19.61% Honda Accord 86-90 17.63% 10.84% 27.38% 16.54% Honda Accord 90-93 19.58% 10.23% 34.24% 24.01% Honda Accord 94-97 17.10% 10.57% 26.48% 15.92% Saab 9000 86-97 15.98% 8.05% 29.24% 21.19% Toyota Crown / Cressida / Mark II 81-85 22.99% 17.49% 29.60% 12.11% Toyota Cressida / Mark II 89-92 15.96% 10.09% 24.31% 14.21% Volvo 850/S70/V70/C70 93-00 28.44% 17.67% 42.40% 24.73% Volvo 200 Series 87-93 17.40% 11.43% 25.59% 14.16% Volvo 700/900 Series 83-91 17.68% 11.29% 26.62% 15.33% Medium Cars 14.97% 16.43% 1.46% Daewoo Nubira 97-00 21.24% 11.63% 35.60% 23.97% Ford Cortina 82-82 15.34% 11.98% 19.43% 7.45% Ford Mondeo 97-00 17.29% 10.82% 26.48% 15.66%
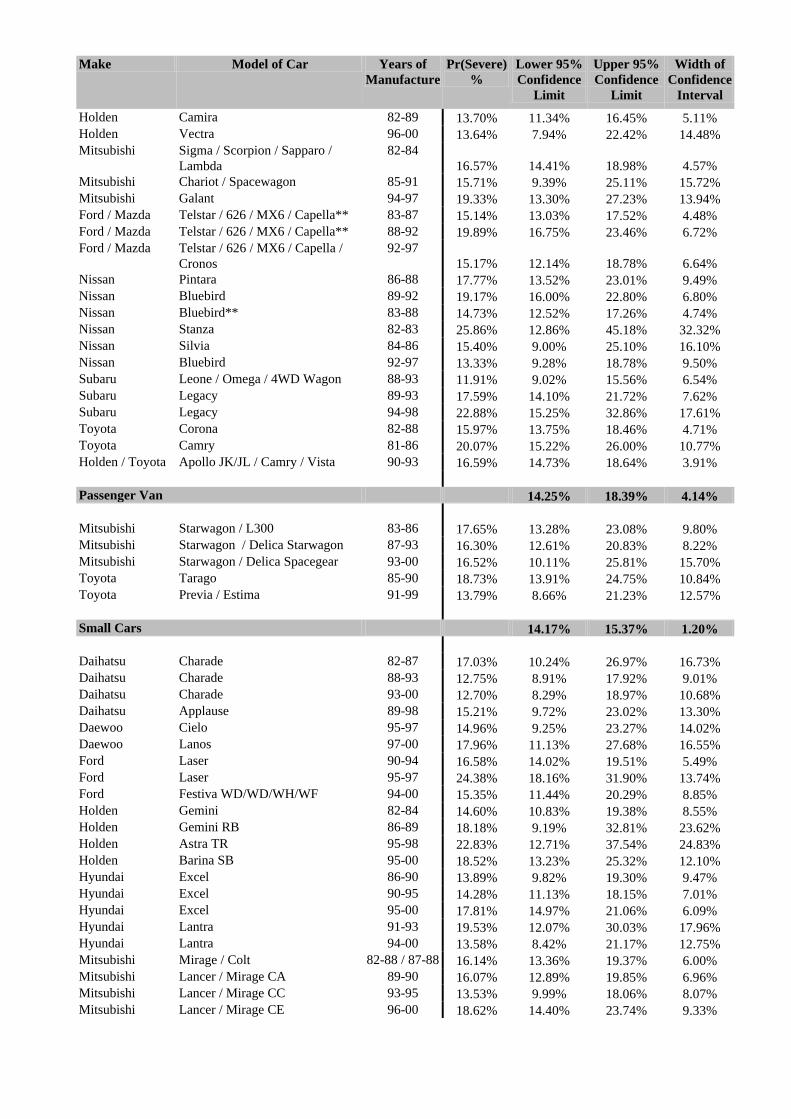
Make Model of Car Years of Manufacture
Pr(Severe) %
Lower 95% Confidence
Limit
Upper 95% Confidence
Limit
Width of Confidence
Interval
Holden Camira 82-89 13.70% 11.34% 16.45% 5.11% Holden Vectra 96-00 13.64% 7.94% 22.42% 14.48% Mitsubishi Sigma / Scorpion / Sapparo /
Lambda 82-84
16.57% 14.41% 18.98% 4.57% Mitsubishi Chariot / Spacewagon 85-91 15.71% 9.39% 25.11% 15.72% Mitsubishi Galant 94-97 19.33% 13.30% 27.23% 13.94% Ford / Mazda Telstar / 626 / MX6 / Capella** 83-87 15.14% 13.03% 17.52% 4.48% Ford / Mazda Telstar / 626 / MX6 / Capella** 88-92 19.89% 16.75% 23.46% 6.72% Ford / Mazda Telstar / 626 / MX6 / Capella /
Cronos 92-97
15.17% 12.14% 18.78% 6.64% Nissan Pintara 86-88 17.77% 13.52% 23.01% 9.49% Nissan Bluebird 89-92 19.17% 16.00% 22.80% 6.80% Nissan Bluebird** 83-88 14.73% 12.52% 17.26% 4.74% Nissan Stanza 82-83 25.86% 12.86% 45.18% 32.32% Nissan Silvia 84-86 15.40% 9.00% 25.10% 16.10% Nissan Bluebird 92-97 13.33% 9.28% 18.78% 9.50% Subaru Leone / Omega / 4WD Wagon 88-93 11.91% 9.02% 15.56% 6.54% Subaru Legacy 89-93 17.59% 14.10% 21.72% 7.62% Subaru Legacy 94-98 22.88% 15.25% 32.86% 17.61% Toyota Corona 82-88 15.97% 13.75% 18.46% 4.71% Toyota Camry 81-86 20.07% 15.22% 26.00% 10.77% Holden / Toyota Apollo JK/JL / Camry / Vista 90-93 16.59% 14.73% 18.64% 3.91% Passenger Van 14.25% 18.39% 4.14% Mitsubishi Starwagon / L300 83-86 17.65% 13.28% 23.08% 9.80% Mitsubishi Starwagon / Delica Starwagon 87-93 16.30% 12.61% 20.83% 8.22% Mitsubishi Starwagon / Delica Spacegear 93-00 16.52% 10.11% 25.81% 15.70% Toyota Tarago 85-90 18.73% 13.91% 24.75% 10.84% Toyota Previa / Estima 91-99 13.79% 8.66% 21.23% 12.57%
Small Cars 14.17% 15.37% 1.20% Daihatsu Charade 82-87 17.03% 10.24% 26.97% 16.73% Daihatsu Charade 88-93 12.75% 8.91% 17.92% 9.01% Daihatsu Charade 93-00 12.70% 8.29% 18.97% 10.68% Daihatsu Applause 89-98 15.21% 9.72% 23.02% 13.30% Daewoo Cielo 95-97 14.96% 9.25% 23.27% 14.02% Daewoo Lanos 97-00 17.96% 11.13% 27.68% 16.55% Ford Laser 90-94 16.58% 14.02% 19.51% 5.49% Ford Laser 95-97 24.38% 18.16% 31.90% 13.74% Ford Festiva WD/WD/WH/WF 94-00 15.35% 11.44% 20.29% 8.85% Holden Gemini 82-84 14.60% 10.83% 19.38% 8.55% Holden Gemini RB 86-89 18.18% 9.19% 32.81% 23.62% Holden Astra TR 95-98 22.83% 12.71% 37.54% 24.83% Holden Barina SB 95-00 18.52% 13.23% 25.32% 12.10% Hyundai Excel 86-90 13.89% 9.82% 19.30% 9.47% Hyundai Excel 90-95 14.28% 11.13% 18.15% 7.01% Hyundai Excel 95-00 17.81% 14.97% 21.06% 6.09% Hyundai Lantra 91-93 19.53% 12.07% 30.03% 17.96% Hyundai Lantra 94-00 13.58% 8.42% 21.17% 12.75% Mitsubishi Mirage / Colt 82-88 / 87-88 16.14% 13.36% 19.37% 6.00% Mitsubishi Lancer / Mirage CA 89-90 16.07% 12.89% 19.85% 6.96% Mitsubishi Lancer / Mirage CC 93-95 13.53% 9.99% 18.06% 8.07% Mitsubishi Lancer / Mirage CE 96-00 18.62% 14.40% 23.74% 9.33%
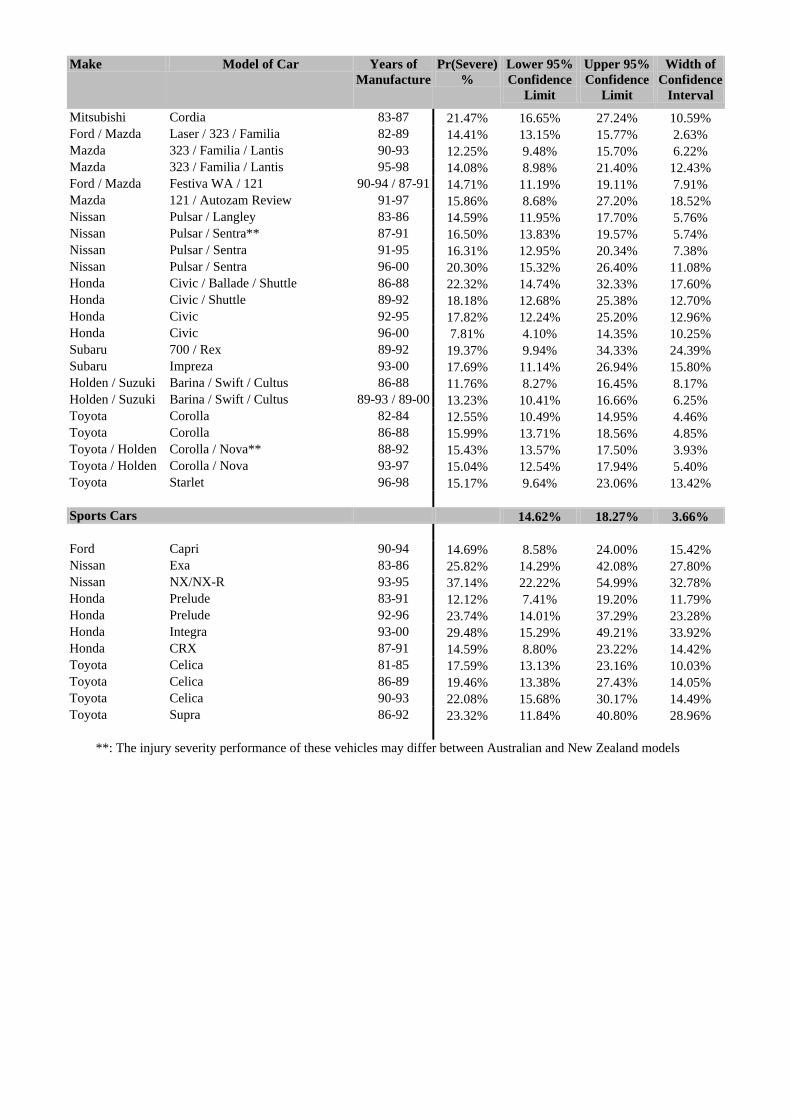
Make Model of Car Years of Manufacture
Pr(Severe) %
Lower 95% Confidence
Limit
Upper 95% Confidence
Limit
Width of Confidence
Interval
Mitsubishi Cordia 83-87 21.47% 16.65% 27.24% 10.59% Ford / Mazda Laser / 323 / Familia 82-89 14.41% 13.15% 15.77% 2.63% Mazda 323 / Familia / Lantis 90-93 12.25% 9.48% 15.70% 6.22% Mazda 323 / Familia / Lantis 95-98 14.08% 8.98% 21.40% 12.43% Ford / Mazda Festiva WA / 121 90-94 / 87-91 14.71% 11.19% 19.11% 7.91% Mazda 121 / Autozam Review 91-97 15.86% 8.68% 27.20% 18.52% Nissan Pulsar / Langley 83-86 14.59% 11.95% 17.70% 5.76% Nissan Pulsar / Sentra** 87-91 16.50% 13.83% 19.57% 5.74% Nissan Pulsar / Sentra 91-95 16.31% 12.95% 20.34% 7.38% Nissan Pulsar / Sentra 96-00 20.30% 15.32% 26.40% 11.08% Honda Civic / Ballade / Shuttle 86-88 22.32% 14.74% 32.33% 17.60% Honda Civic / Shuttle 89-92 18.18% 12.68% 25.38% 12.70% Honda Civic 92-95 17.82% 12.24% 25.20% 12.96% Honda Civic 96-00 7.81% 4.10% 14.35% 10.25% Subaru 700 / Rex 89-92 19.37% 9.94% 34.33% 24.39% Subaru Impreza 93-00 17.69% 11.14% 26.94% 15.80% Holden / Suzuki Barina / Swift / Cultus 86-88 11.76% 8.27% 16.45% 8.17% Holden / Suzuki Barina / Swift / Cultus 89-93 / 89-00 13.23% 10.41% 16.66% 6.25% Toyota Corolla 82-84 12.55% 10.49% 14.95% 4.46% Toyota Corolla 86-88 15.99% 13.71% 18.56% 4.85% Toyota / Holden Corolla / Nova** 88-92 15.43% 13.57% 17.50% 3.93% Toyota / Holden Corolla / Nova 93-97 15.04% 12.54% 17.94% 5.40% Toyota Starlet 96-98 15.17% 9.64% 23.06% 13.42%
Sports Cars 14.62% 18.27% 3.66% Ford Capri 90-94 14.69% 8.58% 24.00% 15.42% Nissan Exa 83-86 25.82% 14.29% 42.08% 27.80% Nissan NX/NX-R 93-95 37.14% 22.22% 54.99% 32.78% Honda Prelude 83-91 12.12% 7.41% 19.20% 11.79% Honda Prelude 92-96 23.74% 14.01% 37.29% 23.28% Honda Integra 93-00 29.48% 15.29% 49.21% 33.92% Honda CRX 87-91 14.59% 8.80% 23.22% 14.42% Toyota Celica 81-85 17.59% 13.13% 23.16% 10.03% Toyota Celica 86-89 19.46% 13.38% 27.43% 14.05% Toyota Celica 90-93 22.08% 15.68% 30.17% 14.49% Toyota Supra 86-92 23.32% 11.84% 40.80% 28.96%
**: The injury severity performance of these vehicles may differ between Australian and New Zealand models
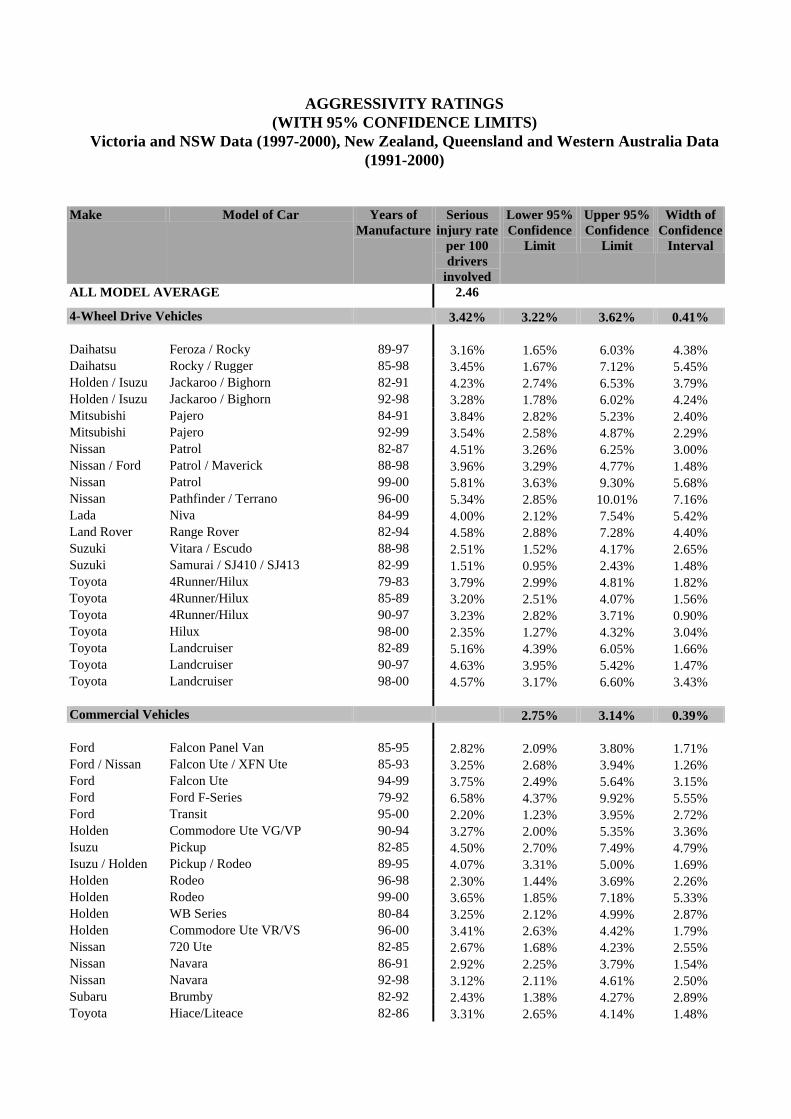
AGGRESSIVITY RATINGS
(WITH 95% CONFIDENCE LIMITS) Victoria and NSW Data (1997-2000), New Zealand, Queensland and Western Australia Data
(1991-2000)
Make Model of Car Years of Manufacture
Serious injury rate
per 100 drivers
involved
Lower 95% Confidence
Limit
Upper 95% Confidence
Limit
Width of Confidence
Interval
ALL MODEL AVERAGE 2.46
4-Wheel Drive Vehicles 3.42% 3.22% 3.62% 0.41% Daihatsu Feroza / Rocky 89-97 3.16% 1.65% 6.03% 4.38% Daihatsu Rocky / Rugger 85-98 3.45% 1.67% 7.12% 5.45% Holden / Isuzu Jackaroo / Bighorn 82-91 4.23% 2.74% 6.53% 3.79% Holden / Isuzu Jackaroo / Bighorn 92-98 3.28% 1.78% 6.02% 4.24% Mitsubishi Pajero 84-91 3.84% 2.82% 5.23% 2.40% Mitsubishi Pajero 92-99 3.54% 2.58% 4.87% 2.29% Nissan Patrol 82-87 4.51% 3.26% 6.25% 3.00% Nissan / Ford Patrol / Maverick 88-98 3.96% 3.29% 4.77% 1.48% Nissan Patrol 99-00 5.81% 3.63% 9.30% 5.68% Nissan Pathfinder / Terrano 96-00 5.34% 2.85% 10.01% 7.16% Lada Niva 84-99 4.00% 2.12% 7.54% 5.42% Land Rover Range Rover 82-94 4.58% 2.88% 7.28% 4.40% Suzuki Vitara / Escudo 88-98 2.51% 1.52% 4.17% 2.65% Suzuki Samurai / SJ410 / SJ413 82-99 1.51% 0.95% 2.43% 1.48% Toyota 4Runner/Hilux 79-83 3.79% 2.99% 4.81% 1.82% Toyota 4Runner/Hilux 85-89 3.20% 2.51% 4.07% 1.56% Toyota 4Runner/Hilux 90-97 3.23% 2.82% 3.71% 0.90% Toyota Hilux 98-00 2.35% 1.27% 4.32% 3.04% Toyota Landcruiser 82-89 5.16% 4.39% 6.05% 1.66% Toyota Landcruiser 90-97 4.63% 3.95% 5.42% 1.47% Toyota Landcruiser 98-00 4.57% 3.17% 6.60% 3.43%
Commercial Vehicles 2.75% 3.14% 0.39% Ford Falcon Panel Van 85-95 2.82% 2.09% 3.80% 1.71% Ford / Nissan Falcon Ute / XFN Ute 85-93 3.25% 2.68% 3.94% 1.26% Ford Falcon Ute 94-99 3.75% 2.49% 5.64% 3.15% Ford Ford F-Series 79-92 6.58% 4.37% 9.92% 5.55% Ford Transit 95-00 2.20% 1.23% 3.95% 2.72% Holden Commodore Ute VG/VP 90-94 3.27% 2.00% 5.35% 3.36% Isuzu Pickup 82-85 4.50% 2.70% 7.49% 4.79% Isuzu / Holden Pickup / Rodeo 89-95 4.07% 3.31% 5.00% 1.69% Holden Rodeo 96-98 2.30% 1.44% 3.69% 2.26% Holden Rodeo 99-00 3.65% 1.85% 7.18% 5.33% Holden WB Series 80-84 3.25% 2.12% 4.99% 2.87% Holden Commodore Ute VR/VS 96-00 3.41% 2.63% 4.42% 1.79% Nissan 720 Ute 82-85 2.67% 1.68% 4.23% 2.55% Nissan Navara 86-91 2.92% 2.25% 3.79% 1.54% Nissan Navara 92-98 3.12% 2.11% 4.61% 2.50% Subaru Brumby 82-92 2.43% 1.38% 4.27% 2.89% Toyota Hiace/Liteace 82-86 3.31% 2.65% 4.14% 1.48%
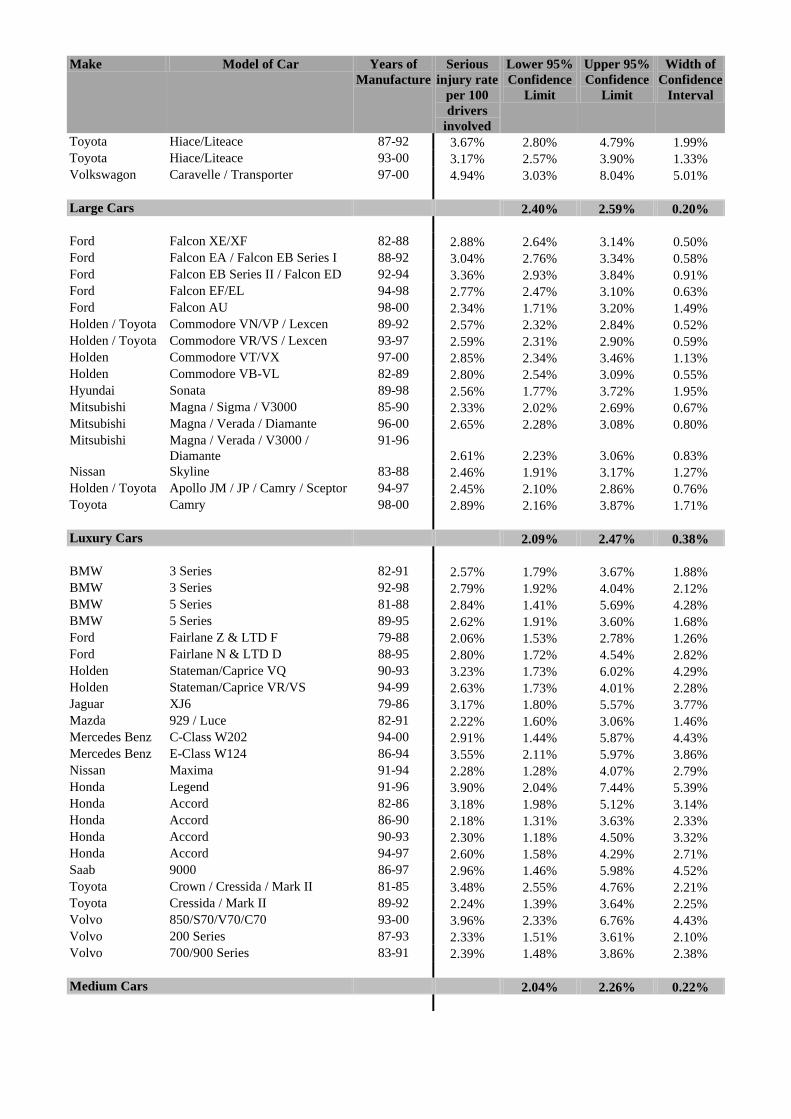
Make Model of Car Years of Manufacture
Serious injury rate
per 100 drivers
involved
Lower 95% Confidence
Limit
Upper 95% Confidence
Limit
Width of Confidence
Interval
Toyota Hiace/Liteace 87-92 3.67% 2.80% 4.79% 1.99% Toyota Hiace/Liteace 93-00 3.17% 2.57% 3.90% 1.33% Volkswagon Caravelle / Transporter 97-00 4.94% 3.03% 8.04% 5.01%
Large Cars 2.40% 2.59% 0.20% Ford Falcon XE/XF 82-88 2.88% 2.64% 3.14% 0.50% Ford Falcon EA / Falcon EB Series I 88-92 3.04% 2.76% 3.34% 0.58% Ford Falcon EB Series II / Falcon ED 92-94 3.36% 2.93% 3.84% 0.91% Ford Falcon EF/EL 94-98 2.77% 2.47% 3.10% 0.63% Ford Falcon AU 98-00 2.34% 1.71% 3.20% 1.49% Holden / Toyota Commodore VN/VP / Lexcen 89-92 2.57% 2.32% 2.84% 0.52% Holden / Toyota Commodore VR/VS / Lexcen 93-97 2.59% 2.31% 2.90% 0.59% Holden Commodore VT/VX 97-00 2.85% 2.34% 3.46% 1.13% Holden Commodore VB-VL 82-89 2.80% 2.54% 3.09% 0.55% Hyundai Sonata 89-98 2.56% 1.77% 3.72% 1.95% Mitsubishi Magna / Sigma / V3000 85-90 2.33% 2.02% 2.69% 0.67% Mitsubishi Magna / Verada / Diamante 96-00 2.65% 2.28% 3.08% 0.80% Mitsubishi Magna / Verada / V3000 /
Diamante 91-96
2.61% 2.23% 3.06% 0.83% Nissan Skyline 83-88 2.46% 1.91% 3.17% 1.27% Holden / Toyota Apollo JM / JP / Camry / Sceptor 94-97 2.45% 2.10% 2.86% 0.76% Toyota Camry 98-00 2.89% 2.16% 3.87% 1.71%
Luxury Cars 2.09% 2.47% 0.38% BMW 3 Series 82-91 2.57% 1.79% 3.67% 1.88% BMW 3 Series 92-98 2.79% 1.92% 4.04% 2.12% BMW 5 Series 81-88 2.84% 1.41% 5.69% 4.28% BMW 5 Series 89-95 2.62% 1.91% 3.60% 1.68% Ford Fairlane Z & LTD F 79-88 2.06% 1.53% 2.78% 1.26% Ford Fairlane N & LTD D 88-95 2.80% 1.72% 4.54% 2.82% Holden Stateman/Caprice VQ 90-93 3.23% 1.73% 6.02% 4.29% Holden Stateman/Caprice VR/VS 94-99 2.63% 1.73% 4.01% 2.28% Jaguar XJ6 79-86 3.17% 1.80% 5.57% 3.77% Mazda 929 / Luce 82-91 2.22% 1.60% 3.06% 1.46% Mercedes Benz C-Class W202 94-00 2.91% 1.44% 5.87% 4.43% Mercedes Benz E-Class W124 86-94 3.55% 2.11% 5.97% 3.86% Nissan Maxima 91-94 2.28% 1.28% 4.07% 2.79% Honda Legend 91-96 3.90% 2.04% 7.44% 5.39% Honda Accord 82-86 3.18% 1.98% 5.12% 3.14% Honda Accord 86-90 2.18% 1.31% 3.63% 2.33% Honda Accord 90-93 2.30% 1.18% 4.50% 3.32% Honda Accord 94-97 2.60% 1.58% 4.29% 2.71% Saab 9000 86-97 2.96% 1.46% 5.98% 4.52% Toyota Crown / Cressida / Mark II 81-85 3.48% 2.55% 4.76% 2.21% Toyota Cressida / Mark II 89-92 2.24% 1.39% 3.64% 2.25% Volvo 850/S70/V70/C70 93-00 3.96% 2.33% 6.76% 4.43% Volvo 200 Series 87-93 2.33% 1.51% 3.61% 2.10% Volvo 700/900 Series 83-91 2.39% 1.48% 3.86% 2.38% Medium Cars 2.04% 2.26% 0.22%
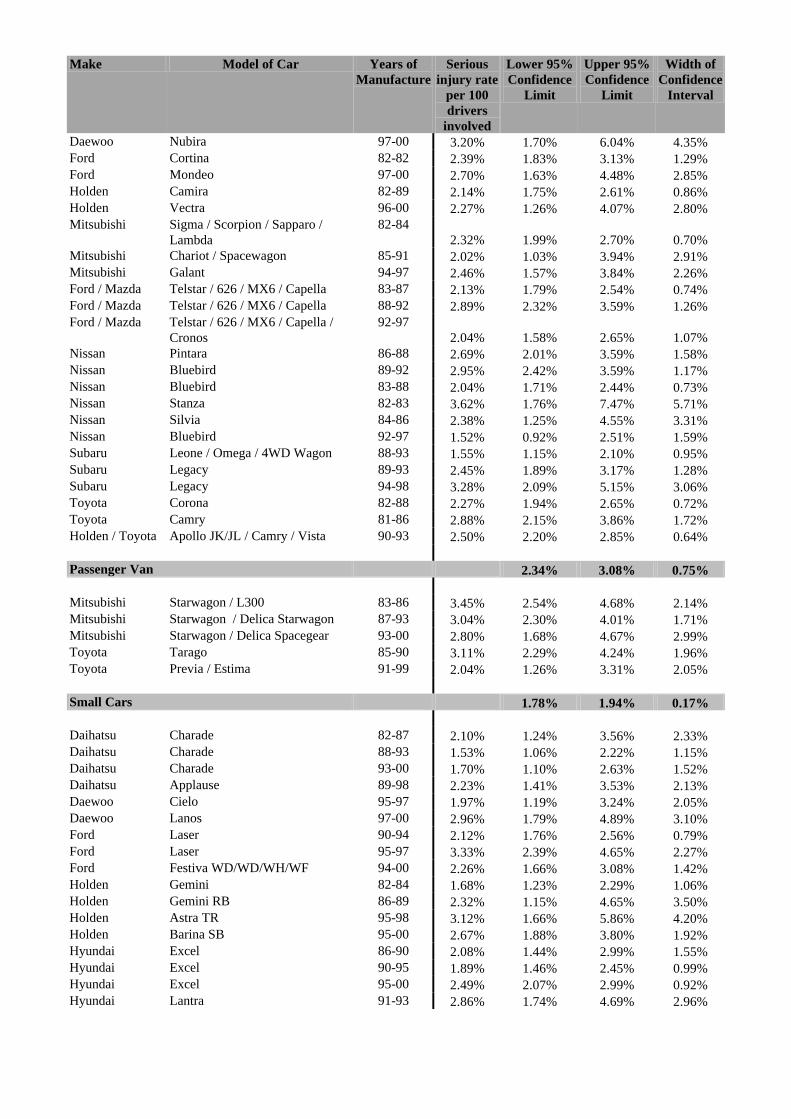
Make Model of Car Years of Manufacture
Serious injury rate
per 100 drivers
involved
Lower 95% Confidence
Limit
Upper 95% Confidence
Limit
Width of Confidence
Interval
Daewoo Nubira 97-00 3.20% 1.70% 6.04% 4.35% Ford Cortina 82-82 2.39% 1.83% 3.13% 1.29% Ford Mondeo 97-00 2.70% 1.63% 4.48% 2.85% Holden Camira 82-89 2.14% 1.75% 2.61% 0.86% Holden Vectra 96-00 2.27% 1.26% 4.07% 2.80% Mitsubishi Sigma / Scorpion / Sapparo /
Lambda 82-84
2.32% 1.99% 2.70% 0.70% Mitsubishi Chariot / Spacewagon 85-91 2.02% 1.03% 3.94% 2.91% Mitsubishi Galant 94-97 2.46% 1.57% 3.84% 2.26% Ford / Mazda Telstar / 626 / MX6 / Capella 83-87 2.13% 1.79% 2.54% 0.74% Ford / Mazda Telstar / 626 / MX6 / Capella 88-92 2.89% 2.32% 3.59% 1.26% Ford / Mazda Telstar / 626 / MX6 / Capella /
Cronos 92-97
2.04% 1.58% 2.65% 1.07% Nissan Pintara 86-88 2.69% 2.01% 3.59% 1.58% Nissan Bluebird 89-92 2.95% 2.42% 3.59% 1.17% Nissan Bluebird 83-88 2.04% 1.71% 2.44% 0.73% Nissan Stanza 82-83 3.62% 1.76% 7.47% 5.71% Nissan Silvia 84-86 2.38% 1.25% 4.55% 3.31% Nissan Bluebird 92-97 1.52% 0.92% 2.51% 1.59% Subaru Leone / Omega / 4WD Wagon 88-93 1.55% 1.15% 2.10% 0.95% Subaru Legacy 89-93 2.45% 1.89% 3.17% 1.28% Subaru Legacy 94-98 3.28% 2.09% 5.15% 3.06% Toyota Corona 82-88 2.27% 1.94% 2.65% 0.72% Toyota Camry 81-86 2.88% 2.15% 3.86% 1.72% Holden / Toyota Apollo JK/JL / Camry / Vista 90-93 2.50% 2.20% 2.85% 0.64% Passenger Van 2.34% 3.08% 0.75% Mitsubishi Starwagon / L300 83-86 3.45% 2.54% 4.68% 2.14% Mitsubishi Starwagon / Delica Starwagon 87-93 3.04% 2.30% 4.01% 1.71% Mitsubishi Starwagon / Delica Spacegear 93-00 2.80% 1.68% 4.67% 2.99% Toyota Tarago 85-90 3.11% 2.29% 4.24% 1.96% Toyota Previa / Estima 91-99 2.04% 1.26% 3.31% 2.05%
Small Cars 1.78% 1.94% 0.17% Daihatsu Charade 82-87 2.10% 1.24% 3.56% 2.33% Daihatsu Charade 88-93 1.53% 1.06% 2.22% 1.15% Daihatsu Charade 93-00 1.70% 1.10% 2.63% 1.52% Daihatsu Applause 89-98 2.23% 1.41% 3.53% 2.13% Daewoo Cielo 95-97 1.97% 1.19% 3.24% 2.05% Daewoo Lanos 97-00 2.96% 1.79% 4.89% 3.10% Ford Laser 90-94 2.12% 1.76% 2.56% 0.79% Ford Laser 95-97 3.33% 2.39% 4.65% 2.27% Ford Festiva WD/WD/WH/WF 94-00 2.26% 1.66% 3.08% 1.42% Holden Gemini 82-84 1.68% 1.23% 2.29% 1.06% Holden Gemini RB 86-89 2.32% 1.15% 4.65% 3.50% Holden Astra TR 95-98 3.12% 1.66% 5.86% 4.20% Holden Barina SB 95-00 2.67% 1.88% 3.80% 1.92% Hyundai Excel 86-90 2.08% 1.44% 2.99% 1.55% Hyundai Excel 90-95 1.89% 1.46% 2.45% 0.99% Hyundai Excel 95-00 2.49% 2.07% 2.99% 0.92% Hyundai Lantra 91-93 2.86% 1.74% 4.69% 2.96%
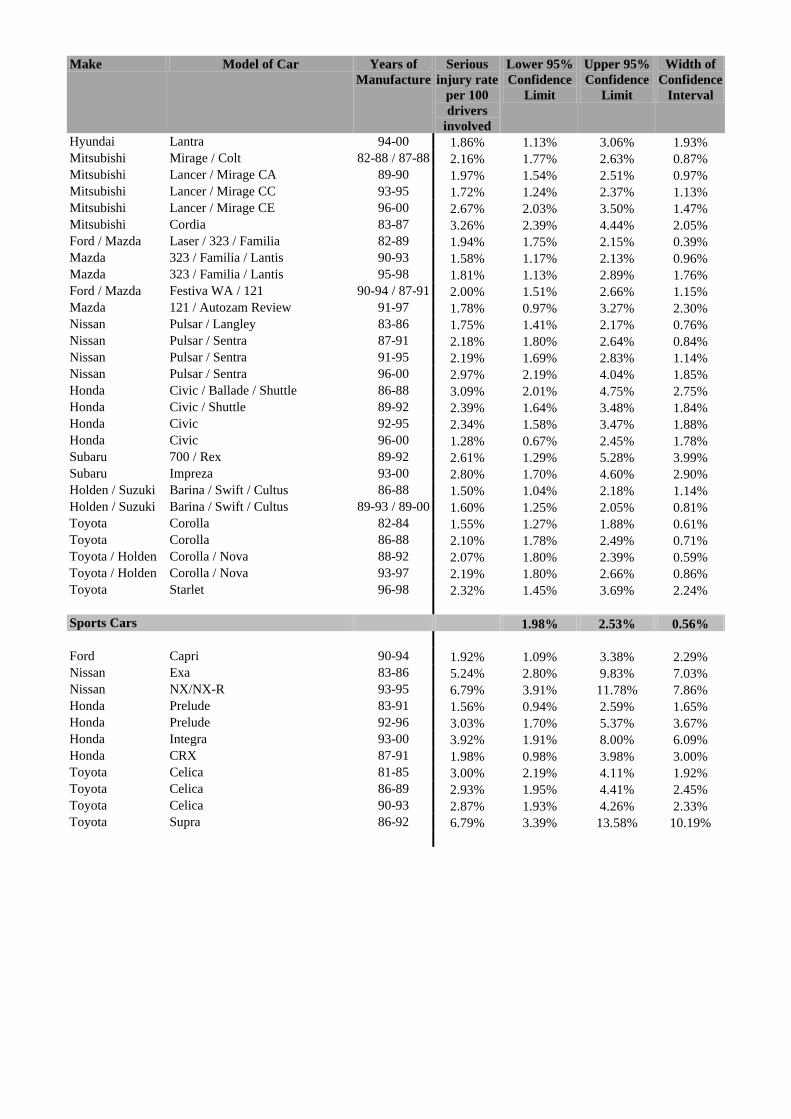
Make Model of Car Years of Manufacture
Serious injury rate
per 100 drivers
involved
Lower 95% Confidence
Limit
Upper 95% Confidence
Limit
Width of Confidence
Interval
Hyundai Lantra 94-00 1.86% 1.13% 3.06% 1.93% Mitsubishi Mirage / Colt 82-88 / 87-88 2.16% 1.77% 2.63% 0.87% Mitsubishi Lancer / Mirage CA 89-90 1.97% 1.54% 2.51% 0.97% Mitsubishi Lancer / Mirage CC 93-95 1.72% 1.24% 2.37% 1.13% Mitsubishi Lancer / Mirage CE 96-00 2.67% 2.03% 3.50% 1.47% Mitsubishi Cordia 83-87 3.26% 2.39% 4.44% 2.05% Ford / Mazda Laser / 323 / Familia 82-89 1.94% 1.75% 2.15% 0.39% Mazda 323 / Familia / Lantis 90-93 1.58% 1.17% 2.13% 0.96% Mazda 323 / Familia / Lantis 95-98 1.81% 1.13% 2.89% 1.76% Ford / Mazda Festiva WA / 121 90-94 / 87-91 2.00% 1.51% 2.66% 1.15% Mazda 121 / Autozam Review 91-97 1.78% 0.97% 3.27% 2.30% Nissan Pulsar / Langley 83-86 1.75% 1.41% 2.17% 0.76% Nissan Pulsar / Sentra 87-91 2.18% 1.80% 2.64% 0.84% Nissan Pulsar / Sentra 91-95 2.19% 1.69% 2.83% 1.14% Nissan Pulsar / Sentra 96-00 2.97% 2.19% 4.04% 1.85% Honda Civic / Ballade / Shuttle 86-88 3.09% 2.01% 4.75% 2.75% Honda Civic / Shuttle 89-92 2.39% 1.64% 3.48% 1.84% Honda Civic 92-95 2.34% 1.58% 3.47% 1.88% Honda Civic 96-00 1.28% 0.67% 2.45% 1.78% Subaru 700 / Rex 89-92 2.61% 1.29% 5.28% 3.99% Subaru Impreza 93-00 2.80% 1.70% 4.60% 2.90% Holden / Suzuki Barina / Swift / Cultus 86-88 1.50% 1.04% 2.18% 1.14% Holden / Suzuki Barina / Swift / Cultus 89-93 / 89-00 1.60% 1.25% 2.05% 0.81% Toyota Corolla 82-84 1.55% 1.27% 1.88% 0.61% Toyota Corolla 86-88 2.10% 1.78% 2.49% 0.71% Toyota / Holden Corolla / Nova 88-92 2.07% 1.80% 2.39% 0.59% Toyota / Holden Corolla / Nova 93-97 2.19% 1.80% 2.66% 0.86% Toyota Starlet 96-98 2.32% 1.45% 3.69% 2.24%
Sports Cars 1.98% 2.53% 0.56% Ford Capri 90-94 1.92% 1.09% 3.38% 2.29% Nissan Exa 83-86 5.24% 2.80% 9.83% 7.03% Nissan NX/NX-R 93-95 6.79% 3.91% 11.78% 7.86% Honda Prelude 83-91 1.56% 0.94% 2.59% 1.65% Honda Prelude 92-96 3.03% 1.70% 5.37% 3.67% Honda Integra 93-00 3.92% 1.91% 8.00% 6.09% Honda CRX 87-91 1.98% 0.98% 3.98% 3.00% Toyota Celica 81-85 3.00% 2.19% 4.11% 1.92% Toyota Celica 86-89 2.93% 1.95% 4.41% 2.45% Toyota Celica 90-93 2.87% 1.93% 4.26% 2.33% Toyota Supra 86-92 6.79% 3.39% 13.58% 10.19%
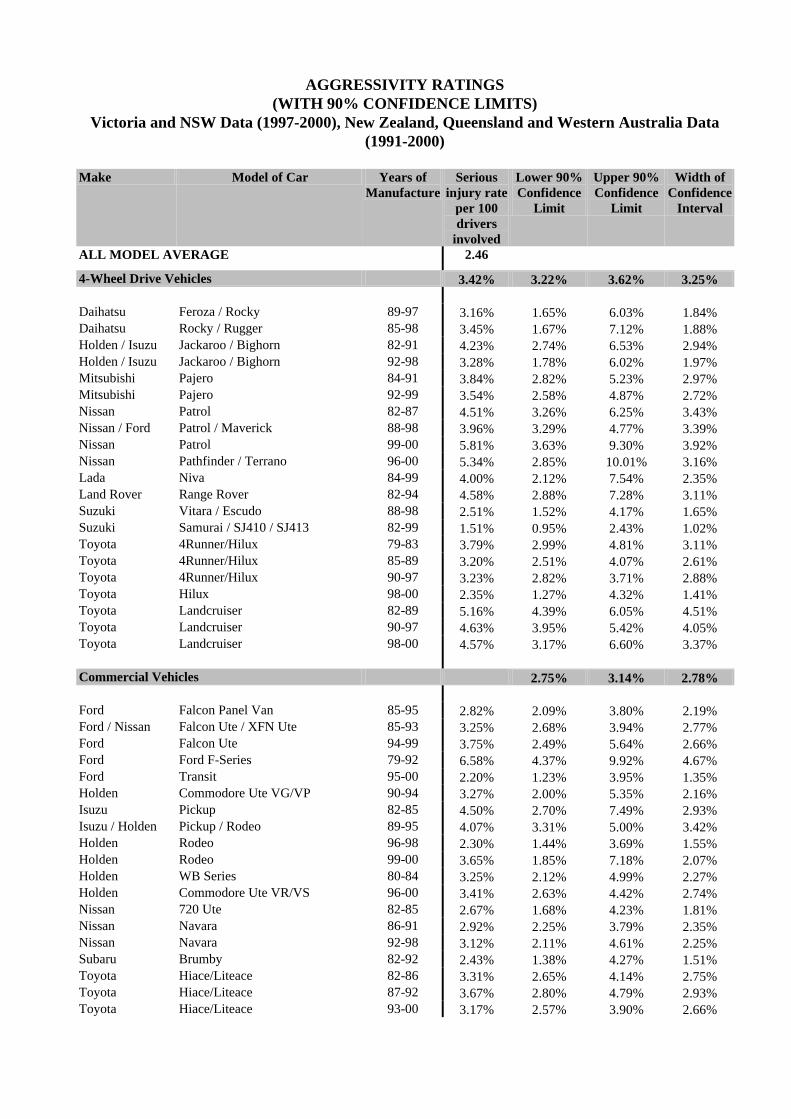
AGGRESSIVITY RATINGS
(WITH 90% CONFIDENCE LIMITS) Victoria and NSW Data (1997-2000), New Zealand, Queensland and Western Australia Data
(1991-2000)
Make Model of Car Years of Manufacture
Serious injury rate
per 100 drivers
involved
Lower 90% Confidence
Limit
Upper 90% Confidence
Limit
Width of Confidence
Interval
ALL MODEL AVERAGE 2.46
4-Wheel Drive Vehicles 3.42% 3.22% 3.62% 3.25% Daihatsu Feroza / Rocky 89-97 3.16% 1.65% 6.03% 1.84% Daihatsu Rocky / Rugger 85-98 3.45% 1.67% 7.12% 1.88% Holden / Isuzu Jackaroo / Bighorn 82-91 4.23% 2.74% 6.53% 2.94% Holden / Isuzu Jackaroo / Bighorn 92-98 3.28% 1.78% 6.02% 1.97% Mitsubishi Pajero 84-91 3.84% 2.82% 5.23% 2.97% Mitsubishi Pajero 92-99 3.54% 2.58% 4.87% 2.72% Nissan Patrol 82-87 4.51% 3.26% 6.25% 3.43% Nissan / Ford Patrol / Maverick 88-98 3.96% 3.29% 4.77% 3.39% Nissan Patrol 99-00 5.81% 3.63% 9.30% 3.92% Nissan Pathfinder / Terrano 96-00 5.34% 2.85% 10.01% 3.16% Lada Niva 84-99 4.00% 2.12% 7.54% 2.35% Land Rover Range Rover 82-94 4.58% 2.88% 7.28% 3.11% Suzuki Vitara / Escudo 88-98 2.51% 1.52% 4.17% 1.65% Suzuki Samurai / SJ410 / SJ413 82-99 1.51% 0.95% 2.43% 1.02% Toyota 4Runner/Hilux 79-83 3.79% 2.99% 4.81% 3.11% Toyota 4Runner/Hilux 85-89 3.20% 2.51% 4.07% 2.61% Toyota 4Runner/Hilux 90-97 3.23% 2.82% 3.71% 2.88% Toyota Hilux 98-00 2.35% 1.27% 4.32% 1.41% Toyota Landcruiser 82-89 5.16% 4.39% 6.05% 4.51% Toyota Landcruiser 90-97 4.63% 3.95% 5.42% 4.05% Toyota Landcruiser 98-00 4.57% 3.17% 6.60% 3.37%
Commercial Vehicles 2.75% 3.14% 2.78% Ford Falcon Panel Van 85-95 2.82% 2.09% 3.80% 2.19% Ford / Nissan Falcon Ute / XFN Ute 85-93 3.25% 2.68% 3.94% 2.77% Ford Falcon Ute 94-99 3.75% 2.49% 5.64% 2.66% Ford Ford F-Series 79-92 6.58% 4.37% 9.92% 4.67% Ford Transit 95-00 2.20% 1.23% 3.95% 1.35% Holden Commodore Ute VG/VP 90-94 3.27% 2.00% 5.35% 2.16% Isuzu Pickup 82-85 4.50% 2.70% 7.49% 2.93% Isuzu / Holden Pickup / Rodeo 89-95 4.07% 3.31% 5.00% 3.42% Holden Rodeo 96-98 2.30% 1.44% 3.69% 1.55% Holden Rodeo 99-00 3.65% 1.85% 7.18% 2.07% Holden WB Series 80-84 3.25% 2.12% 4.99% 2.27% Holden Commodore Ute VR/VS 96-00 3.41% 2.63% 4.42% 2.74% Nissan 720 Ute 82-85 2.67% 1.68% 4.23% 1.81% Nissan Navara 86-91 2.92% 2.25% 3.79% 2.35% Nissan Navara 92-98 3.12% 2.11% 4.61% 2.25% Subaru Brumby 82-92 2.43% 1.38% 4.27% 1.51% Toyota Hiace/Liteace 82-86 3.31% 2.65% 4.14% 2.75% Toyota Hiace/Liteace 87-92 3.67% 2.80% 4.79% 2.93% Toyota Hiace/Liteace 93-00 3.17% 2.57% 3.90% 2.66%
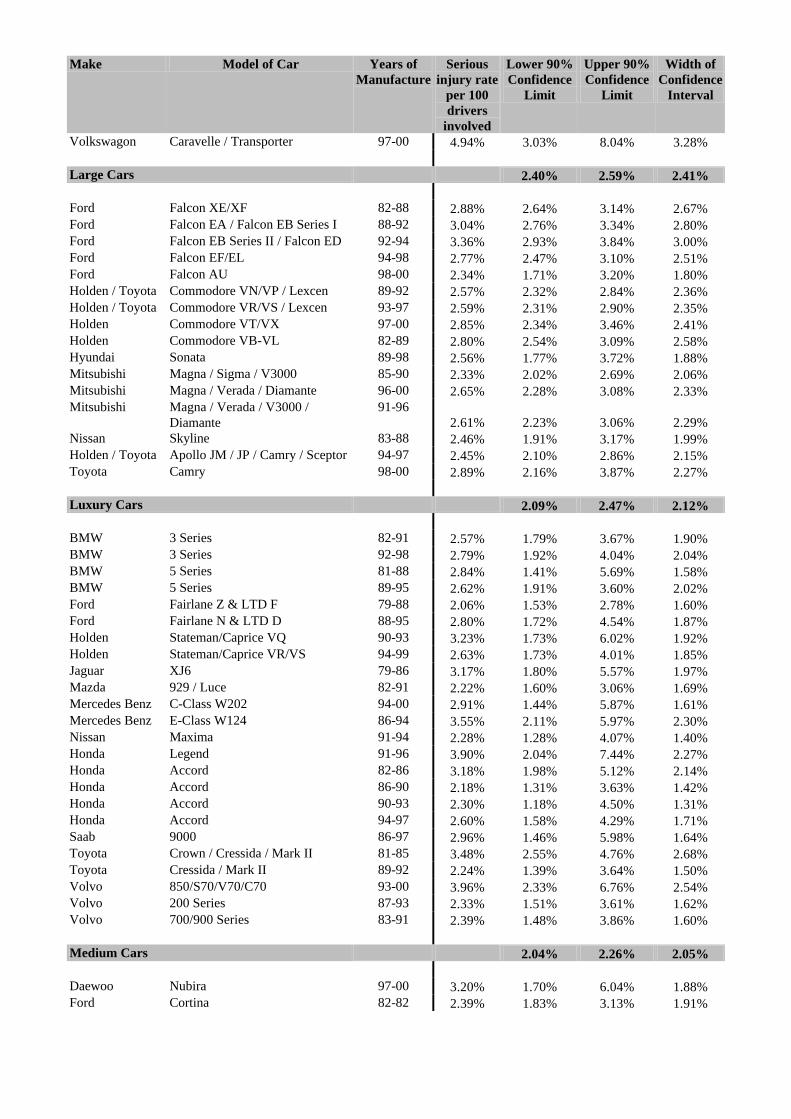
Make Model of Car Years of Manufacture
Serious injury rate
per 100 drivers
involved
Lower 90% Confidence
Limit
Upper 90% Confidence
Limit
Width of Confidence
Interval
Volkswagon Caravelle / Transporter 97-00 4.94% 3.03% 8.04% 3.28%
Large Cars 2.40% 2.59% 2.41% Ford Falcon XE/XF 82-88 2.88% 2.64% 3.14% 2.67% Ford Falcon EA / Falcon EB Series I 88-92 3.04% 2.76% 3.34% 2.80% Ford Falcon EB Series II / Falcon ED 92-94 3.36% 2.93% 3.84% 3.00% Ford Falcon EF/EL 94-98 2.77% 2.47% 3.10% 2.51% Ford Falcon AU 98-00 2.34% 1.71% 3.20% 1.80% Holden / Toyota Commodore VN/VP / Lexcen 89-92 2.57% 2.32% 2.84% 2.36% Holden / Toyota Commodore VR/VS / Lexcen 93-97 2.59% 2.31% 2.90% 2.35% Holden Commodore VT/VX 97-00 2.85% 2.34% 3.46% 2.41% Holden Commodore VB-VL 82-89 2.80% 2.54% 3.09% 2.58% Hyundai Sonata 89-98 2.56% 1.77% 3.72% 1.88% Mitsubishi Magna / Sigma / V3000 85-90 2.33% 2.02% 2.69% 2.06% Mitsubishi Magna / Verada / Diamante 96-00 2.65% 2.28% 3.08% 2.33% Mitsubishi Magna / Verada / V3000 /
Diamante 91-96
2.61% 2.23% 3.06% 2.29% Nissan Skyline 83-88 2.46% 1.91% 3.17% 1.99% Holden / Toyota Apollo JM / JP / Camry / Sceptor 94-97 2.45% 2.10% 2.86% 2.15% Toyota Camry 98-00 2.89% 2.16% 3.87% 2.27%
Luxury Cars 2.09% 2.47% 2.12% BMW 3 Series 82-91 2.57% 1.79% 3.67% 1.90% BMW 3 Series 92-98 2.79% 1.92% 4.04% 2.04% BMW 5 Series 81-88 2.84% 1.41% 5.69% 1.58% BMW 5 Series 89-95 2.62% 1.91% 3.60% 2.02% Ford Fairlane Z & LTD F 79-88 2.06% 1.53% 2.78% 1.60% Ford Fairlane N & LTD D 88-95 2.80% 1.72% 4.54% 1.87% Holden Stateman/Caprice VQ 90-93 3.23% 1.73% 6.02% 1.92% Holden Stateman/Caprice VR/VS 94-99 2.63% 1.73% 4.01% 1.85% Jaguar XJ6 79-86 3.17% 1.80% 5.57% 1.97% Mazda 929 / Luce 82-91 2.22% 1.60% 3.06% 1.69% Mercedes Benz C-Class W202 94-00 2.91% 1.44% 5.87% 1.61% Mercedes Benz E-Class W124 86-94 3.55% 2.11% 5.97% 2.30% Nissan Maxima 91-94 2.28% 1.28% 4.07% 1.40% Honda Legend 91-96 3.90% 2.04% 7.44% 2.27% Honda Accord 82-86 3.18% 1.98% 5.12% 2.14% Honda Accord 86-90 2.18% 1.31% 3.63% 1.42% Honda Accord 90-93 2.30% 1.18% 4.50% 1.31% Honda Accord 94-97 2.60% 1.58% 4.29% 1.71% Saab 9000 86-97 2.96% 1.46% 5.98% 1.64% Toyota Crown / Cressida / Mark II 81-85 3.48% 2.55% 4.76% 2.68% Toyota Cressida / Mark II 89-92 2.24% 1.39% 3.64% 1.50% Volvo 850/S70/V70/C70 93-00 3.96% 2.33% 6.76% 2.54% Volvo 200 Series 87-93 2.33% 1.51% 3.61% 1.62% Volvo 700/900 Series 83-91 2.39% 1.48% 3.86% 1.60% Medium Cars 2.04% 2.26% 2.05% Daewoo Nubira 97-00 3.20% 1.70% 6.04% 1.88% Ford Cortina 82-82 2.39% 1.83% 3.13% 1.91%
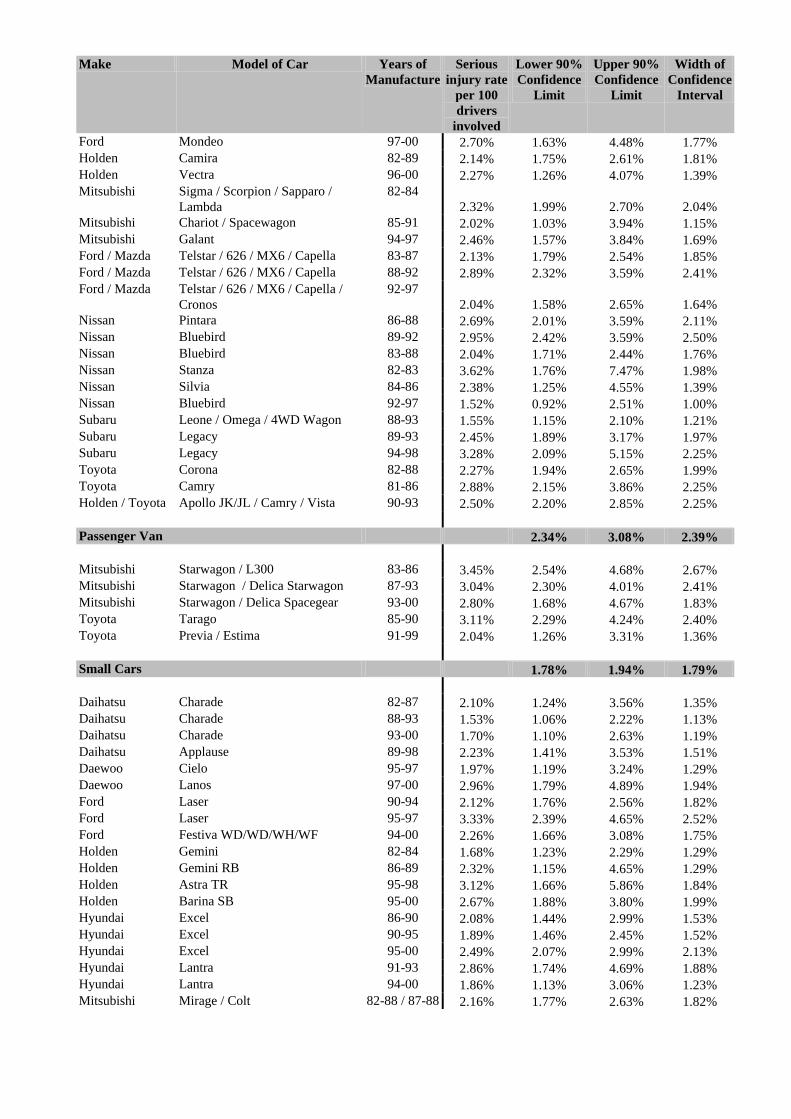
Make Model of Car Years of Manufacture
Serious injury rate
per 100 drivers
involved
Lower 90% Confidence
Limit
Upper 90% Confidence
Limit
Width of Confidence
Interval
Ford Mondeo 97-00 2.70% 1.63% 4.48% 1.77% Holden Camira 82-89 2.14% 1.75% 2.61% 1.81% Holden Vectra 96-00 2.27% 1.26% 4.07% 1.39% Mitsubishi Sigma / Scorpion / Sapparo /
Lambda 82-84
2.32% 1.99% 2.70% 2.04% Mitsubishi Chariot / Spacewagon 85-91 2.02% 1.03% 3.94% 1.15% Mitsubishi Galant 94-97 2.46% 1.57% 3.84% 1.69% Ford / Mazda Telstar / 626 / MX6 / Capella 83-87 2.13% 1.79% 2.54% 1.85% Ford / Mazda Telstar / 626 / MX6 / Capella 88-92 2.89% 2.32% 3.59% 2.41% Ford / Mazda Telstar / 626 / MX6 / Capella /
Cronos 92-97
2.04% 1.58% 2.65% 1.64% Nissan Pintara 86-88 2.69% 2.01% 3.59% 2.11% Nissan Bluebird 89-92 2.95% 2.42% 3.59% 2.50% Nissan Bluebird 83-88 2.04% 1.71% 2.44% 1.76% Nissan Stanza 82-83 3.62% 1.76% 7.47% 1.98% Nissan Silvia 84-86 2.38% 1.25% 4.55% 1.39% Nissan Bluebird 92-97 1.52% 0.92% 2.51% 1.00% Subaru Leone / Omega / 4WD Wagon 88-93 1.55% 1.15% 2.10% 1.21% Subaru Legacy 89-93 2.45% 1.89% 3.17% 1.97% Subaru Legacy 94-98 3.28% 2.09% 5.15% 2.25% Toyota Corona 82-88 2.27% 1.94% 2.65% 1.99% Toyota Camry 81-86 2.88% 2.15% 3.86% 2.25% Holden / Toyota Apollo JK/JL / Camry / Vista 90-93 2.50% 2.20% 2.85% 2.25% Passenger Van 2.34% 3.08% 2.39% Mitsubishi Starwagon / L300 83-86 3.45% 2.54% 4.68% 2.67% Mitsubishi Starwagon / Delica Starwagon 87-93 3.04% 2.30% 4.01% 2.41% Mitsubishi Starwagon / Delica Spacegear 93-00 2.80% 1.68% 4.67% 1.83% Toyota Tarago 85-90 3.11% 2.29% 4.24% 2.40% Toyota Previa / Estima 91-99 2.04% 1.26% 3.31% 1.36%
Small Cars 1.78% 1.94% 1.79% Daihatsu Charade 82-87 2.10% 1.24% 3.56% 1.35% Daihatsu Charade 88-93 1.53% 1.06% 2.22% 1.13% Daihatsu Charade 93-00 1.70% 1.10% 2.63% 1.19% Daihatsu Applause 89-98 2.23% 1.41% 3.53% 1.51% Daewoo Cielo 95-97 1.97% 1.19% 3.24% 1.29% Daewoo Lanos 97-00 2.96% 1.79% 4.89% 1.94% Ford Laser 90-94 2.12% 1.76% 2.56% 1.82% Ford Laser 95-97 3.33% 2.39% 4.65% 2.52% Ford Festiva WD/WD/WH/WF 94-00 2.26% 1.66% 3.08% 1.75% Holden Gemini 82-84 1.68% 1.23% 2.29% 1.29% Holden Gemini RB 86-89 2.32% 1.15% 4.65% 1.29% Holden Astra TR 95-98 3.12% 1.66% 5.86% 1.84% Holden Barina SB 95-00 2.67% 1.88% 3.80% 1.99% Hyundai Excel 86-90 2.08% 1.44% 2.99% 1.53% Hyundai Excel 90-95 1.89% 1.46% 2.45% 1.52% Hyundai Excel 95-00 2.49% 2.07% 2.99% 2.13% Hyundai Lantra 91-93 2.86% 1.74% 4.69% 1.88% Hyundai Lantra 94-00 1.86% 1.13% 3.06% 1.23% Mitsubishi Mirage / Colt 82-88 / 87-88 2.16% 1.77% 2.63% 1.82%
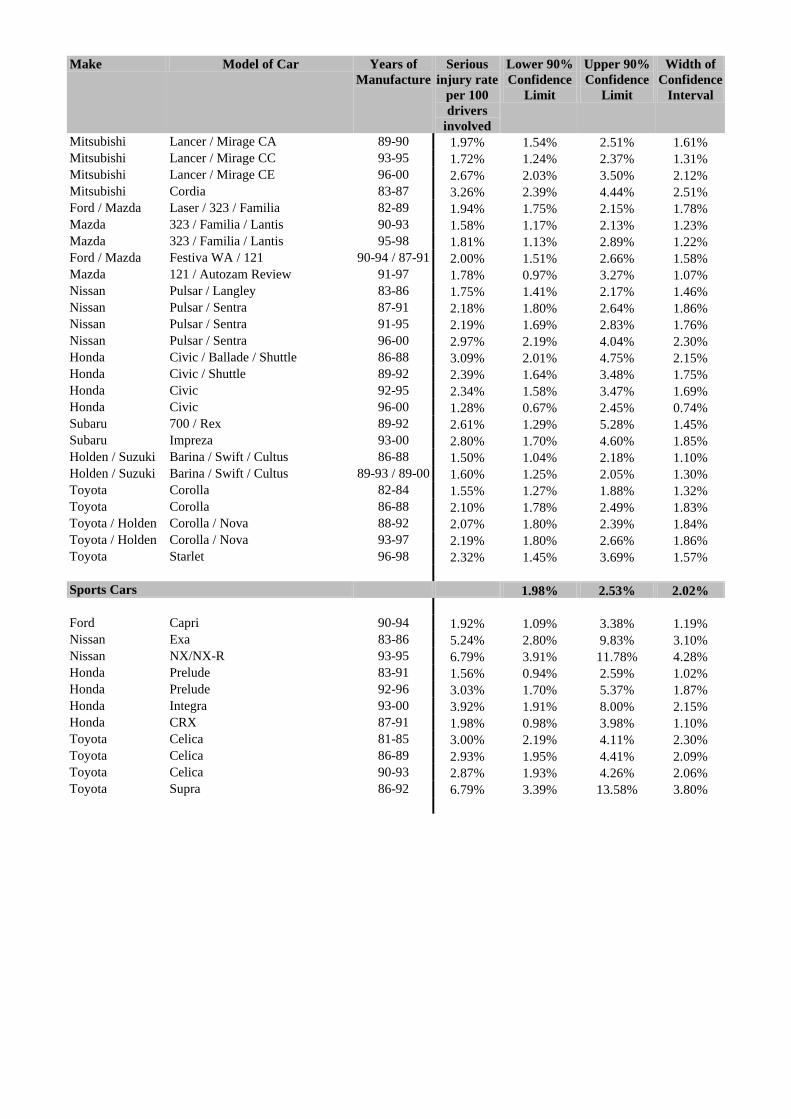
Make Model of Car Years of Manufacture
Serious injury rate
per 100 drivers
involved
Lower 90% Confidence
Limit
Upper 90% Confidence
Limit
Width of Confidence
Interval
Mitsubishi Lancer / Mirage CA 89-90 1.97% 1.54% 2.51% 1.61% Mitsubishi Lancer / Mirage CC 93-95 1.72% 1.24% 2.37% 1.31% Mitsubishi Lancer / Mirage CE 96-00 2.67% 2.03% 3.50% 2.12% Mitsubishi Cordia 83-87 3.26% 2.39% 4.44% 2.51% Ford / Mazda Laser / 323 / Familia 82-89 1.94% 1.75% 2.15% 1.78% Mazda 323 / Familia / Lantis 90-93 1.58% 1.17% 2.13% 1.23% Mazda 323 / Familia / Lantis 95-98 1.81% 1.13% 2.89% 1.22% Ford / Mazda Festiva WA / 121 90-94 / 87-91 2.00% 1.51% 2.66% 1.58% Mazda 121 / Autozam Review 91-97 1.78% 0.97% 3.27% 1.07% Nissan Pulsar / Langley 83-86 1.75% 1.41% 2.17% 1.46% Nissan Pulsar / Sentra 87-91 2.18% 1.80% 2.64% 1.86% Nissan Pulsar / Sentra 91-95 2.19% 1.69% 2.83% 1.76% Nissan Pulsar / Sentra 96-00 2.97% 2.19% 4.04% 2.30% Honda Civic / Ballade / Shuttle 86-88 3.09% 2.01% 4.75% 2.15% Honda Civic / Shuttle 89-92 2.39% 1.64% 3.48% 1.75% Honda Civic 92-95 2.34% 1.58% 3.47% 1.69% Honda Civic 96-00 1.28% 0.67% 2.45% 0.74% Subaru 700 / Rex 89-92 2.61% 1.29% 5.28% 1.45% Subaru Impreza 93-00 2.80% 1.70% 4.60% 1.85% Holden / Suzuki Barina / Swift / Cultus 86-88 1.50% 1.04% 2.18% 1.10% Holden / Suzuki Barina / Swift / Cultus 89-93 / 89-00 1.60% 1.25% 2.05% 1.30% Toyota Corolla 82-84 1.55% 1.27% 1.88% 1.32% Toyota Corolla 86-88 2.10% 1.78% 2.49% 1.83% Toyota / Holden Corolla / Nova 88-92 2.07% 1.80% 2.39% 1.84% Toyota / Holden Corolla / Nova 93-97 2.19% 1.80% 2.66% 1.86% Toyota Starlet 96-98 2.32% 1.45% 3.69% 1.57%
Sports Cars 1.98% 2.53% 2.02% Ford Capri 90-94 1.92% 1.09% 3.38% 1.19% Nissan Exa 83-86 5.24% 2.80% 9.83% 3.10% Nissan NX/NX-R 93-95 6.79% 3.91% 11.78% 4.28% Honda Prelude 83-91 1.56% 0.94% 2.59% 1.02% Honda Prelude 92-96 3.03% 1.70% 5.37% 1.87% Honda Integra 93-00 3.92% 1.91% 8.00% 2.15% Honda CRX 87-91 1.98% 0.98% 3.98% 1.10% Toyota Celica 81-85 3.00% 2.19% 4.11% 2.30% Toyota Celica 86-89 2.93% 1.95% 4.41% 2.09% Toyota Celica 90-93 2.87% 1.93% 4.26% 2.06% Toyota Supra 86-92 6.79% 3.39% 13.58% 3.80%
APPENDIX 6
PRESENTATION OF CRASHWORTHINESS AND AGGRESSIVITY RATINGS FOR CONSUMER INFORMATION

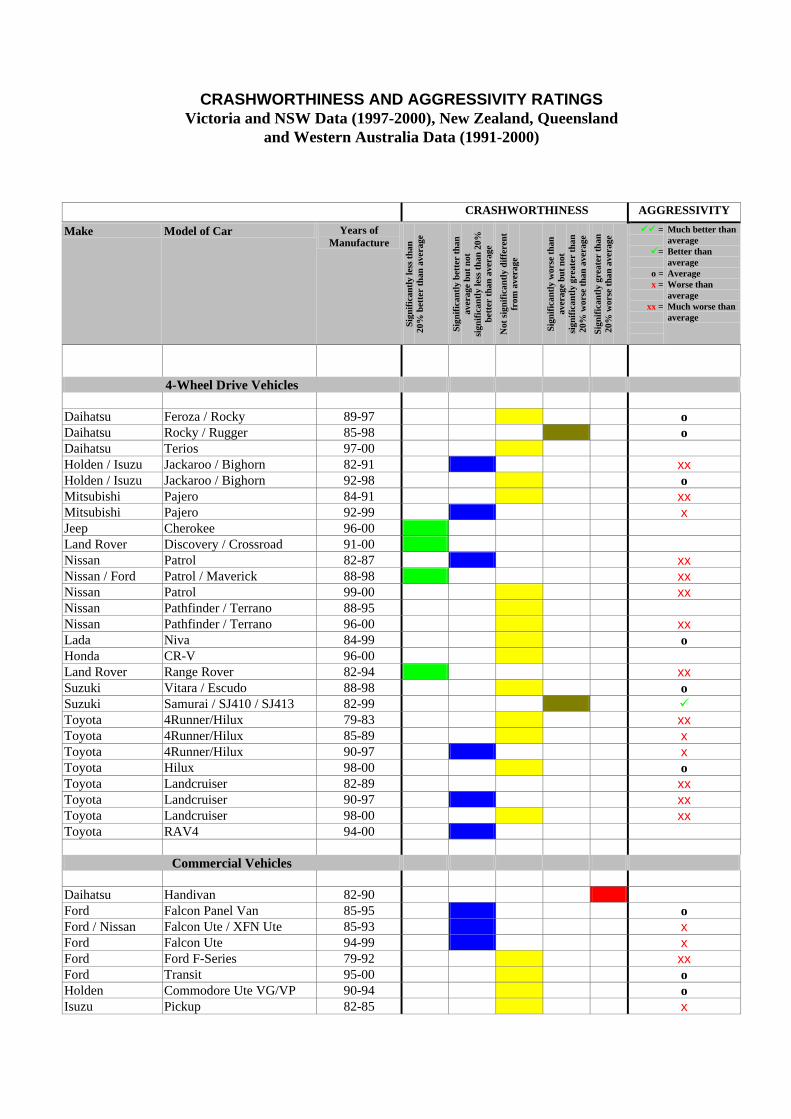
CRASHWORTHINESS AND AGGRESSIVITY RATINGS Victoria and NSW Data (1997-2000), New Zealand, Queensland
and Western Australia Data (1991-2000)
CRASHWORTHINESS AGGRESSIVITY
Make Model of Car Years of Manufacture
Sign
ific
antl
y le
ss t
han
20%
bet
ter
than
ave
rage
Sign
ific
antl
y be
tter
tha
n av
erag
e bu
t no
t si
gnif
ican
tly
less
tha
n 20
%
bett
er t
han
aver
age
Not
sig
nifi
cant
ly d
iffe
rent
fr
om a
vera
ge
Sign
ific
antl
y w
orse
tha
n av
erag
e bu
t no
t si
gnif
ican
tly
grea
ter
than
20
% w
orse
tha
n av
erag
e
Sign
ific
antl
y gr
eate
r th
an
20%
wor
se t
han
aver
age
üüüü =
üü=
o = x =
xx =
Much better than average Better than average Average Worse than average Much worse than average
4-Wheel Drive Vehicles Daihatsu Feroza / Rocky 89-97 o Daihatsu Rocky / Rugger 85-98 o Daihatsu Terios 97-00 Holden / Isuzu Jackaroo / Bighorn 82-91 xx Holden / Isuzu Jackaroo / Bighorn 92-98 o Mitsubishi Pajero 84-91 xx Mitsubishi Pajero 92-99 x Jeep Cherokee 96-00 Land Rover Discovery / Crossroad 91-00 Nissan Patrol 82-87 xx Nissan / Ford Patrol / Maverick 88-98 xx Nissan Patrol 99-00 xx Nissan Pathfinder / Terrano 88-95 Nissan Pathfinder / Terrano 96-00 xx Lada Niva 84-99 o Honda CR-V 96-00 Land Rover Range Rover 82-94 xx Suzuki Vitara / Escudo 88-98 o Suzuki Samurai / SJ410 / SJ413 82-99 ü Toyota 4Runner/Hilux 79-83 xx Toyota 4Runner/Hilux 85-89 x Toyota 4Runner/Hilux 90-97 x Toyota Hilux 98-00 o Toyota Landcruiser 82-89 xx Toyota Landcruiser 90-97 xx Toyota Landcruiser 98-00 xx Toyota RAV4 94-00
Commercial Vehicles Daihatsu Handivan 82-90 Ford Falcon Panel Van 85-95 o Ford / Nissan Falcon Ute / XFN Ute 85-93 x Ford Falcon Ute 94-99 x Ford Ford F-Series 79-92 xx Ford Transit 95-00 o Holden Commodore Ute VG/VP 90-94 o Isuzu Pickup 82-85 x
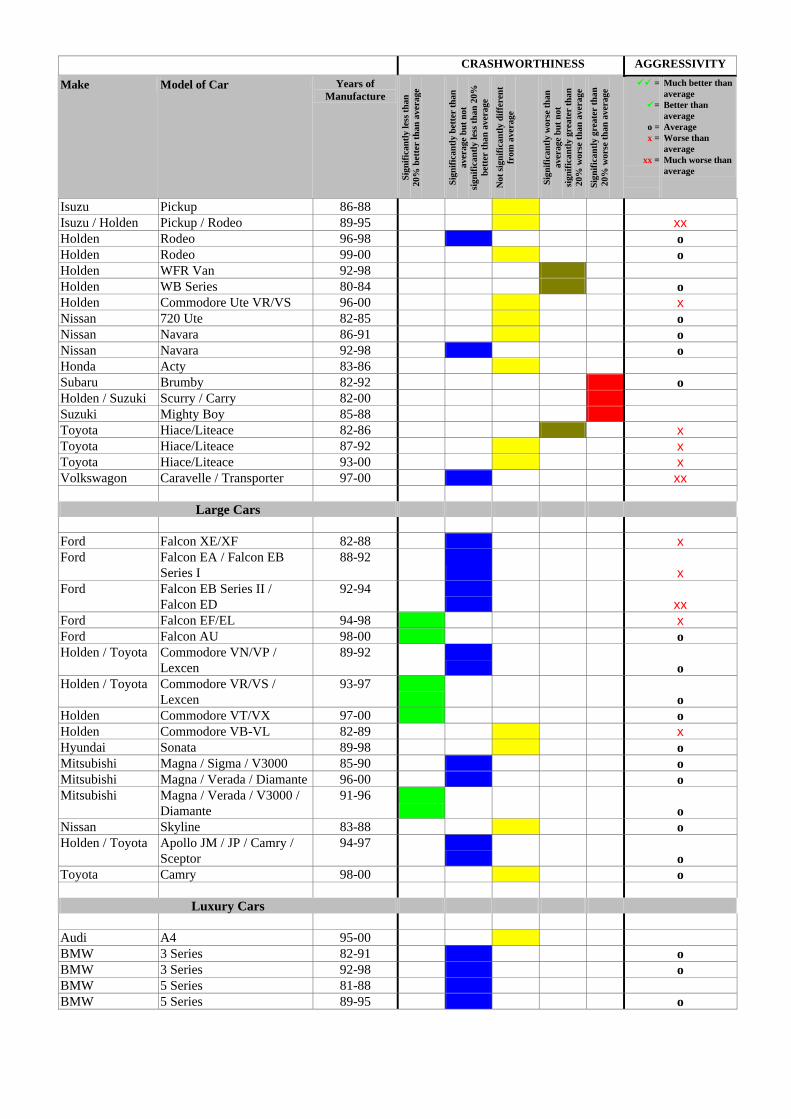
CRASHWORTHINESS AGGRESSIVITY
Make Model of Car Years of Manufacture
Sign
ific
antl
y le
ss t
han
20%
bet
ter
than
ave
rage
Sign
ific
antl
y be
tter
tha
n av
erag
e bu
t no
t si
gnif
ican
tly
less
tha
n 20
%
bett
er t
han
aver
age
Not
sig
nifi
cant
ly d
iffe
rent
fr
om a
vera
ge
Sign
ific
antl
y w
orse
tha
n av
erag
e bu
t no
t si
gnif
ican
tly
grea
ter
than
20
% w
orse
tha
n av
erag
e
Sign
ific
antl
y gr
eate
r th
an
20%
wor
se t
han
aver
age
üüüü =
üü=
o = x =
xx =
Much better than average Better than average Average Worse than average Much worse than average
Isuzu Pickup 86-88 Isuzu / Holden Pickup / Rodeo 89-95 xx Holden Rodeo 96-98 o Holden Rodeo 99-00 o Holden WFR Van 92-98 Holden WB Series 80-84 o Holden Commodore Ute VR/VS 96-00 x Nissan 720 Ute 82-85 o Nissan Navara 86-91 o Nissan Navara 92-98 o Honda Acty 83-86 Subaru Brumby 82-92 o Holden / Suzuki Scurry / Carry 82-00 Suzuki Mighty Boy 85-88 Toyota Hiace/Liteace 82-86 x Toyota Hiace/Liteace 87-92 x Toyota Hiace/Liteace 93-00 x Volkswagon Caravelle / Transporter 97-00 xx
Large Cars Ford Falcon XE/XF 82-88 x Ford Falcon EA / Falcon EB
Series I 88-92
x Ford Falcon EB Series II /
Falcon ED 92-94
xx Ford Falcon EF/EL 94-98 x Ford Falcon AU 98-00 o Holden / Toyota Commodore VN/VP /
Lexcen 89-92
o Holden / Toyota Commodore VR/VS /
Lexcen 93-97
o Holden Commodore VT/VX 97-00 o Holden Commodore VB-VL 82-89 x Hyundai Sonata 89-98 o Mitsubishi Magna / Sigma / V3000 85-90 o Mitsubishi Magna / Verada / Diamante 96-00 o Mitsubishi Magna / Verada / V3000 /
Diamante 91-96
o Nissan Skyline 83-88 o Holden / Toyota Apollo JM / JP / Camry /
Sceptor 94-97
o Toyota Camry 98-00 o
Luxury Cars Audi A4 95-00 BMW 3 Series 82-91 o BMW 3 Series 92-98 o BMW 5 Series 81-88 BMW 5 Series 89-95 o
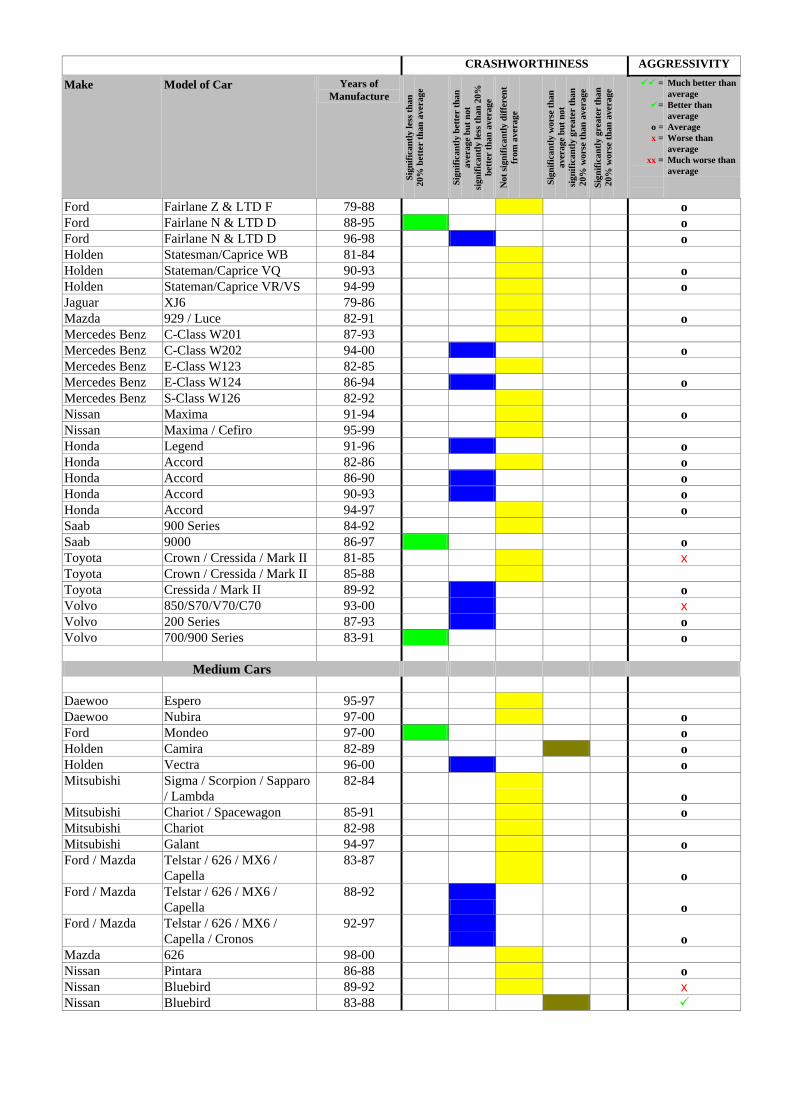
CRASHWORTHINESS AGGRESSIVITY
Make Model of Car Years of Manufacture
Sign
ific
antl
y le
ss t
han
20%
bet
ter
than
ave
rage
Sign
ific
antl
y be
tter
tha
n av
erag
e bu
t no
t si
gnif
ican
tly
less
tha
n 20
%
bett
er t
han
aver
age
Not
sig
nifi
cant
ly d
iffe
rent
fr
om a
vera
ge
Sign
ific
antl
y w
orse
tha
n av
erag
e bu
t no
t si
gnif
ican
tly
grea
ter
than
20
% w
orse
tha
n av
erag
e
Sign
ific
antl
y gr
eate
r th
an
20%
wor
se t
han
aver
age
üüüü =
üü=
o = x =
xx =
Much better than average Better than average Average Worse than average Much worse than average
Ford Fairlane Z & LTD F 79-88 o Ford Fairlane N & LTD D 88-95 o Ford Fairlane N & LTD D 96-98 o Holden Statesman/Caprice WB 81-84 Holden Stateman/Caprice VQ 90-93 o Holden Stateman/Caprice VR/VS 94-99 o Jaguar XJ6 79-86 Mazda 929 / Luce 82-91 o Mercedes Benz C-Class W201 87-93 Mercedes Benz C-Class W202 94-00 o Mercedes Benz E-Class W123 82-85 Mercedes Benz E-Class W124 86-94 o Mercedes Benz S-Class W126 82-92 Nissan Maxima 91-94 o Nissan Maxima / Cefiro 95-99 Honda Legend 91-96 o Honda Accord 82-86 o Honda Accord 86-90 o Honda Accord 90-93 o Honda Accord 94-97 o Saab 900 Series 84-92 Saab 9000 86-97 o Toyota Crown / Cressida / Mark II 81-85 x Toyota Crown / Cressida / Mark II 85-88 Toyota Cressida / Mark II 89-92 o Volvo 850/S70/V70/C70 93-00 x Volvo 200 Series 87-93 o Volvo 700/900 Series 83-91 o
Medium Cars Daewoo Espero 95-97 Daewoo Nubira 97-00 o Ford Mondeo 97-00 o Holden Camira 82-89 o Holden Vectra 96-00 o Mitsubishi Sigma / Scorpion / Sapparo
/ Lambda 82-84
o Mitsubishi Chariot / Spacewagon 85-91 o Mitsubishi Chariot 82-98 Mitsubishi Galant 94-97 o Ford / Mazda Telstar / 626 / MX6 /
Capella 83-87
o Ford / Mazda Telstar / 626 / MX6 /
Capella 88-92
o Ford / Mazda Telstar / 626 / MX6 /
Capella / Cronos 92-97
o Mazda 626 98-00 Nissan Pintara 86-88 o Nissan Bluebird 89-92 x Nissan Bluebird 83-88 ü

CRASHWORTHINESS AGGRESSIVITY
Make Model of Car Years of Manufacture
Sign
ific
antl
y le
ss t
han
20%
bet
ter
than
ave
rage
Sign
ific
antl
y be
tter
tha
n av
erag
e bu
t no
t si
gnif
ican
tly
less
tha
n 20
%
bett
er t
han
aver
age
Not
sig
nifi
cant
ly d
iffe
rent
fr
om a
vera
ge
Sign
ific
antl
y w
orse
tha
n av
erag
e bu
t no
t si
gnif
ican
tly
grea
ter
than
20
% w
orse
tha
n av
erag
e
Sign
ific
antl
y gr
eate
r th
an
20%
wor
se t
han
aver
age
üüüü =
üü=
o = x =
xx =
Much better than average Better than average Average Worse than average Much worse than average
Nissan Stanza 82-83 o Nissan Silvia 84-86 o Nissan Prairie 82-88 Nissan Bluebird 92-97 ü Peugeot 405 88-96 Peugeot 505 82-91 Subaru Leone / Omega / 4WD
Wagon 88-93
ü Subaru Legacy 89-93 o Subaru Legacy 94-98 o Toyota Corona 82-88 o Toyota Camry 81-86 o Holden / Toyota Apollo JK/JL / Camry /
Vista 90-93
o
Passenger Vans Mitsubishi Starwagon / L300 83-86 x Mitsubishi Starwagon / Delica
Starwagon 87-93
o Mitsubishi Starwagon / Delica
Spacegear 93-00
o Toyota Tarago 85-90 o Toyota Previa / Estima 91-99 o
Small Cars Alfa Romeo 33 83-95 Daihatsu Charade 82-87 o Daihatsu Charade 88-93 ü Daihatsu Charade 93-00 ü Daihatsu Applause 89-98 o Daihatsu Mira 90-98 Daihatsu Sirion 00-00 Daewoo 1.5i 94-95 Daewoo Cielo 95-97 o Daewoo Lanos 97-00 o Fiat Regata 84-88 Ford Laser 90-94 o Ford Laser 95-97 x Ford Festiva WD/WD/WH/WF 94-00 o Holden Gemini 82-84 ü Holden Gemini RB 86-89 o Holden Astra TR 95-98 o Holden Barina SB 95-00 o Hyundai Excel 86-90 o Hyundai Excel 90-95 ü Hyundai Excel 95-00 o Hyundai S Coupe 90-96 Hyundai Lantra 91-93 o Hyundai Lantra 94-00 o
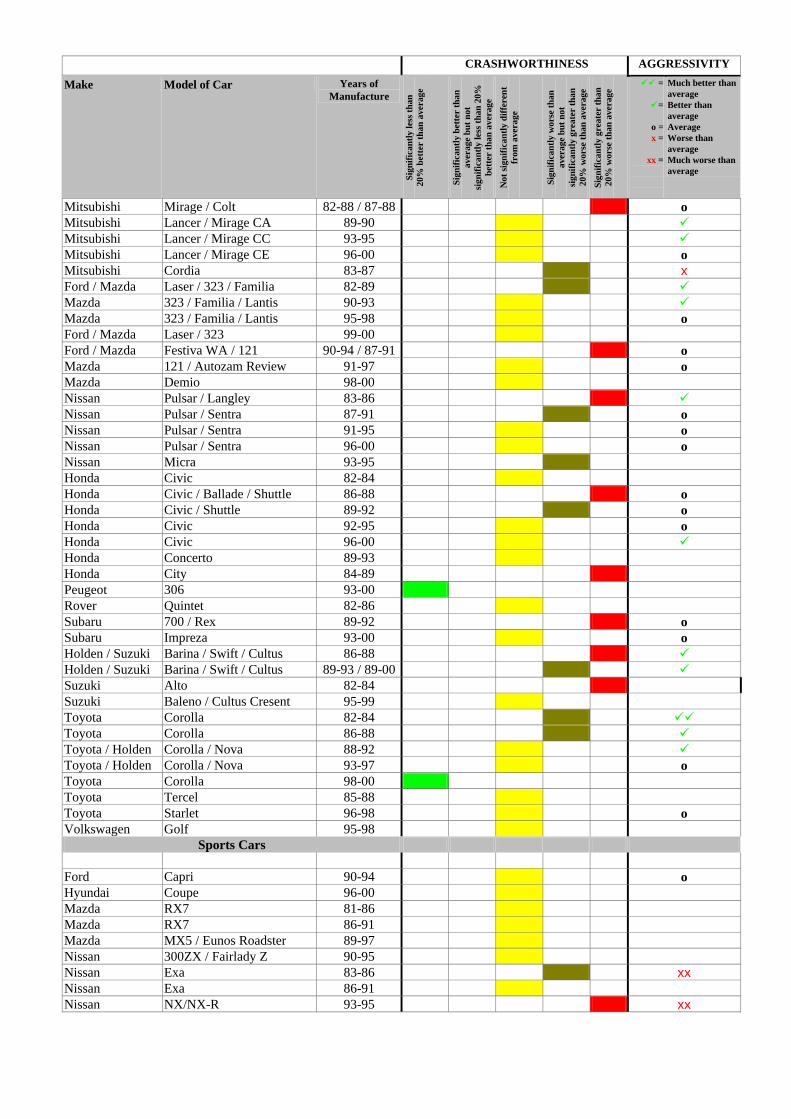
CRASHWORTHINESS AGGRESSIVITY
Make Model of Car Years of Manufacture
Sign
ific
antl
y le
ss t
han
20%
bet
ter
than
ave
rage
Sign
ific
antl
y be
tter
tha
n av
erag
e bu
t no
t si
gnif
ican
tly
less
tha
n 20
%
bett
er t
han
aver
age
Not
sig
nifi
cant
ly d
iffe
rent
fr
om a
vera
ge
Sign
ific
antl
y w
orse
tha
n av
erag
e bu
t no
t si
gnif
ican
tly
grea
ter
than
20
% w
orse
tha
n av
erag
e
Sign
ific
antl
y gr
eate
r th
an
20%
wor
se t
han
aver
age
üüüü =
üü=
o = x =
xx =
Much better than average Better than average Average Worse than average Much worse than average
Mitsubishi Mirage / Colt 82-88 / 87-88 o Mitsubishi Lancer / Mirage CA 89-90 ü Mitsubishi Lancer / Mirage CC 93-95 ü Mitsubishi Lancer / Mirage CE 96-00 o Mitsubishi Cordia 83-87 x Ford / Mazda Laser / 323 / Familia 82-89 ü Mazda 323 / Familia / Lantis 90-93 ü Mazda 323 / Familia / Lantis 95-98 o Ford / Mazda Laser / 323 99-00 Ford / Mazda Festiva WA / 121 90-94 / 87-91 o Mazda 121 / Autozam Review 91-97 o Mazda Demio 98-00 Nissan Pulsar / Langley 83-86 ü Nissan Pulsar / Sentra 87-91 o Nissan Pulsar / Sentra 91-95 o Nissan Pulsar / Sentra 96-00 o Nissan Micra 93-95 Honda Civic 82-84 Honda Civic / Ballade / Shuttle 86-88 o Honda Civic / Shuttle 89-92 o Honda Civic 92-95 o Honda Civic 96-00 ü Honda Concerto 89-93 Honda City 84-89 Peugeot 306 93-00 Rover Quintet 82-86 Subaru 700 / Rex 89-92 o Subaru Impreza 93-00 o Holden / Suzuki Barina / Swift / Cultus 86-88 ü Holden / Suzuki Barina / Swift / Cultus 89-93 / 89-00 ü Suzuki Alto 82-84 Suzuki Baleno / Cultus Cresent 95-99 Toyota Corolla 82-84 üü Toyota Corolla 86-88 ü Toyota / Holden Corolla / Nova 88-92 ü Toyota / Holden Corolla / Nova 93-97 o Toyota Corolla 98-00 Toyota Tercel 85-88 Toyota Starlet 96-98 o Volkswagen Golf 95-98
Sports Cars Ford Capri 90-94 o Hyundai Coupe 96-00 Mazda RX7 81-86 Mazda RX7 86-91 Mazda MX5 / Eunos Roadster 89-97 Nissan 300ZX / Fairlady Z 90-95 Nissan Exa 83-86 xx Nissan Exa 86-91 Nissan NX/NX-R 93-95 xx
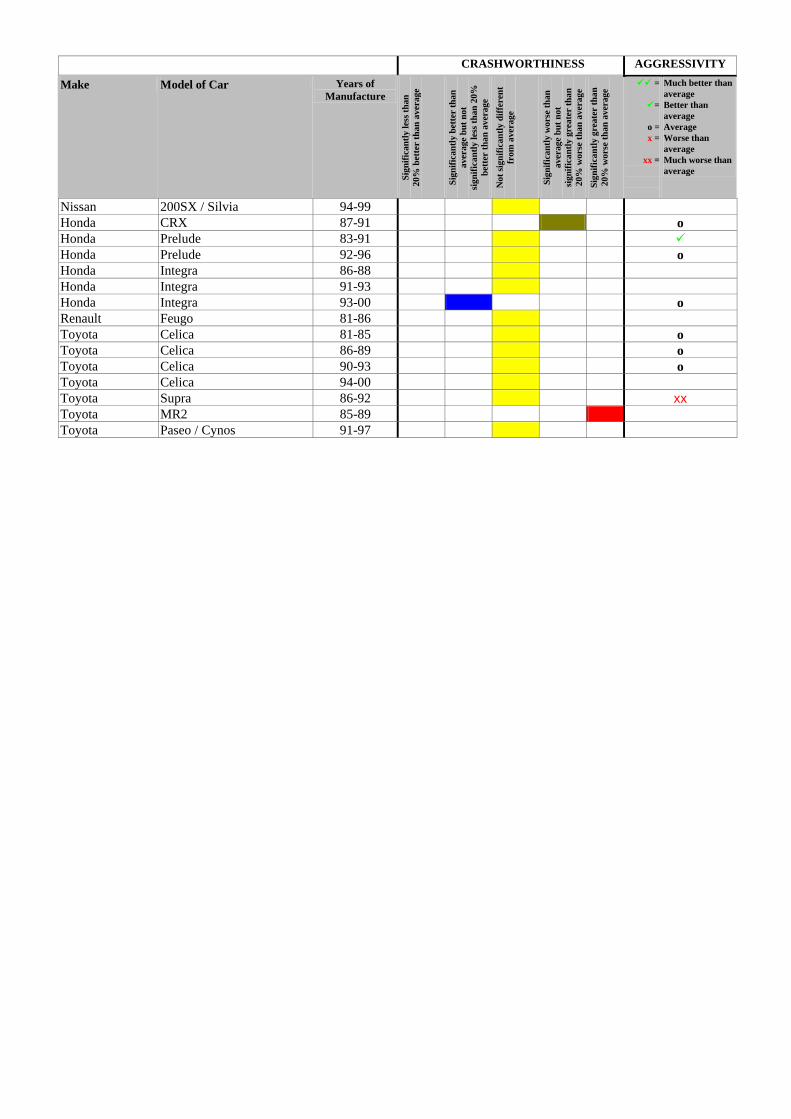
CRASHWORTHINESS AGGRESSIVITY
Make Model of Car Years of Manufacture
Sign
ific
antl
y le
ss t
han
20%
bet
ter
than
ave
rage
Sign
ific
antl
y be
tter
tha
n av
erag
e bu
t no
t si
gnif
ican
tly
less
tha
n 20
%
bett
er t
han
aver
age
Not
sig
nifi
cant
ly d
iffe
rent
fr
om a
vera
ge
Sign
ific
antl
y w
orse
tha
n av
erag
e bu
t no
t si
gnif
ican
tly
grea
ter
than
20
% w
orse
tha
n av
erag
e
Sign
ific
antl
y gr
eate
r th
an
20%
wor
se t
han
aver
age
üüüü =
üü=
o = x =
xx =
Much better than average Better than average Average Worse than average Much worse than average
Nissan 200SX / Silvia 94-99 Honda CRX 87-91 o Honda Prelude 83-91 ü Honda Prelude 92-96 o Honda Integra 86-88 Honda Integra 91-93 Honda Integra 93-00 o Renault Feugo 81-86 Toyota Celica 81-85 o Toyota Celica 86-89 o Toyota Celica 90-93 o Toyota Celica 94-00 Toyota Supra 86-92 xx Toyota MR2 85-89 Toyota Paseo / Cynos 91-97
Related Documents