Vegetation Patterns and Dynamics of Renosterveld at Agter-Groeneberg Conservancy, Western Cape, South Africa By Benjamin Alan Walton Thesis presented in partial fulfillment of the requirements for the degree of Master of Science at the Stellenbosch University Supervisor Professor Sue J Milton (Department of Conservation Ecology) Co-supervisors A le Roux (CapeNature) Professor L Mucina (Department of Botany and Zoology) April 2006

Welcome message from author
This document is posted to help you gain knowledge. Please leave a comment to let me know what you think about it! Share it to your friends and learn new things together.
Transcript
Vegetation Patterns and Dynamics of Renosterveld at Agter-Groeneberg
Conservancy, Western Cape, South Africa
By
Benjamin Alan Walton
Thesis presented in partial fulfillment of the requirements for the degree of
Master of Science at the Stellenbosch University
Supervisor
Professor Sue J Milton (Department of Conservation Ecology)
Co-supervisors
A le Roux (CapeNature)
Professor L Mucina (Department of Botany and Zoology)
April 2006

i
Φ Poem
“Colour
awash
over forelands
of fertile clay”
“When the winters’ cold and grim
the Oxalis’s start to brim - they open up.
The first feast for bees, in the shrubland short of trees not breeze.
Sun’s rays soon last longer in the days: Babianas, Chlorophytums, Geissorhizas, Gladiolius’s,
Hesperanthas, Lachenalias, Moraeas and Trachyandras spread their cheerful gaze.
Accompanied by annual daisies and bright gladioli filling the air with strong scents of honey -
monkey beetles waste no time as they perch upon delicate flowers, lest they are caught in the
season’s showers.
As if to suggest this is the best nature sends small midge flies to pollinate in jest, and surround
mammals to tease their bloody channels.
Another month has come and gone - not long now for the raaptol and Micranthus which provide
nectar for brown butterflies and painted ladies.
Then is the last sequence of bulbs - the fine white-filled fields of chinkerinchees.
Grasses’ hour is now soaking up the sun displaying beautifully crafted silhouettes till summers end.
As if heaven sent delicate geophytes are still producing their charm, when botanists avoid the
midday sun.
A brief lapse in displays until the autumn reds begin the seasonal cycles.”
Figure a: From left to right: Moraea villosa (Ker Gawl.) Ker Gawl. subsp. villosa, Gladiolus watsonius
Thunb. and Lampranthus elegans (Jacq.) Schwantes

ii
Declaration
I, the undersigned, hereby declare that the work contained in this thesis is my own original work
and that I have not previously, in its entirety or in part, submitted it at any university for a degree.
Signature…………………………………. Date………………………….
Dedicated to my daughter June Protea Walton
For those who cherish wild landscapes filled with wild plants and animals

iii
Table of Contents
Vegetation Patterns and Dynamics of Renosterveld at Agter-Groeneberg Conservancy, Western Cape, South Africa ............................................................................................................... Φ Poem.................................................................................................................................................i
Declaration..........................................................................................................................................ii
Table of Contents ..............................................................................................................................iii
List of Figures.....................................................................................................................................v
List of Tables ...................................................................................................................................viii
Preface................................................................................................................................................ix
Abstract...............................................................................................................................................x
Acknowledgements ..........................................................................................................................xii
Chapter 1: Renosterveld: Concept, Ecology and Variability ........................................................1 1.1. Introduction...................................................................................................................................2 1.2. Concept of Renosterveld...............................................................................................................5 1.3. Patterns of Functional Types.........................................................................................................8 1.4. Geology and Soils .......................................................................................................................10 1.5. Climate ........................................................................................................................................11 1.6. Disturbance and Vegetation Dynamics.......................................................................................12
1.6.1. Fire .......................................................................................................................................13 1.6.2. Biotic Influence....................................................................................................................18 1.6.3. Succession............................................................................................................................22
1.7. Distribution, Typology and Floristics of Renosterveld...............................................................27 1.8. Conservation Implications ..........................................................................................................29 1.9. References...................................................................................................................................32
Chapter 2: Agter-Groeneberg Conservancy: Description of the Study Area ............................46 2.1. The Study Area ...........................................................................................................................47 2.2. Major Vegetation Patterns ..........................................................................................................48 2.3. Rainfall and Temperature Patterns..............................................................................................51 2.4. Geology and Soils .......................................................................................................................52 2.5. Disturbance .................................................................................................................................55
2.5.1. Fire History ..........................................................................................................................55 2.5.2. Grazing Intensity..................................................................................................................56 2.5.3. Ploughing .............................................................................................................................57 2.5.4. Invasive Alien Plant Species................................................................................................58
2.6. References...................................................................................................................................59
Chapter 3: Vegetation Community Patterns in Renosterveld and Old-fields at Agter-Groeneberg Conservancy near Wellington, Western Cape, South Africa .................................62 3.1. Introduction.................................................................................................................................63 3.2. Materials and Methods................................................................................................................65
3.2.1. Vegetation Data....................................................................................................................65 3.2.2. Environmental Data .............................................................................................................67 3.2.3. Soil Sampling and Analysis .................................................................................................69
iv
3.2.4. Methods of Vegetation Classification..................................................................................71 3.2.5. Nomenclature of Plants and Plant Communities .................................................................72 3.2.6. Multivariate Analyses ..........................................................................................................72
3.3. Results.........................................................................................................................................73 3.3.1. Classification of Vegetation.................................................................................................73 3.3.2. Ordination ............................................................................................................................78
3.4. Discussion ...................................................................................................................................90 3.4.1. Vegetation Community Patterns ..........................................................................................90 3.4.2. Gradient Analyses ................................................................................................................92
3.5. References...................................................................................................................................94
Chapter 4: Vegetation Dynamics of Renosterveld at Agter-Groeneberg Conservancy, Western Cape, South Africa .........................................................................................................................100 4.1. Introduction...............................................................................................................................101 4.2. Materials and Methods..............................................................................................................103
4.2.1. Vegetation Data..................................................................................................................104 4.2.2. Environmental Data ...........................................................................................................106 4.2.3. Life-form Classification.....................................................................................................107 4.2.4. Statistical Analyses of Life-forms......................................................................................109 4.2.5. Ordination at the 10 m2 Scale ............................................................................................110
4.3. Results.......................................................................................................................................111 4.3.1. Life-form Richness at the 1000 m2 Scale...........................................................................111 4.3.2. Life-form Cover-abundance at the 10 m2 Scale.................................................................120 4.3.3. Alien Species......................................................................................................................127 4.3.4. Species Response Curves...................................................................................................129
4.4. Discussion .................................................................................................................................134 4.4.1. Life-form Richness Patterns at the 1000 m2 Scale.............................................................135 4.4.2. Horizontal Structure and Patterns at the 10 m2 Scale ........................................................138 4.4.3. Renosterveld Dynamics and Resilience.............................................................................141 4.4.4. Alien Species......................................................................................................................145
4.5. References.................................................................................................................................148
Chapter 5: Synthesis ......................................................................................................................154 5.1. Synthesis ...................................................................................................................................155 5.2. Management Recommendations ...............................................................................................158 5.3. Future Research Topics.............................................................................................................163 5.4. References.................................................................................................................................164
Appendices ......................................................................................................................................165
v
List of Figures
Figure a: From left to right: Moraea villosa (Ker Gawl.) Ker Gawl. subsp. villosa, Gladiolus watsonius Thunb. and Lampranthus elegans (Jacq.) Schwantes ..................................................i
Figure 1.1: The foothills of Elandskloof Mountains at Krantzkop (North-Eastern view) with 30-year-old fields near an uninhabited farmstead surrounded by Eucalyptus cladocalyx ................1
Figure 1.2: The Western Cape showing the original extent of Swartland Shale Renosterveld (SSR) (Mucina and Rutherford 2004) and adjacent vegetation types ....................................................3
Figure 2.1: North-East view from Slangkop ridge overlooking the Elandsberg flats with current- and old fields, as well as patches of Swartland Shale Renosterveld and Swartland Alluvium Fynbos (Mucina and Rutherford 2004) remnants leading up to the foothills............................46
Figure 2.2: Study area locality near Hermon in the Western Cape of South Africa.........................49 Figure 2.3: Study area showing the study sites (Voëlvlei, Elandsberg and Krantzkop), near Hermon
....................................................................................................................................................50 Figure 2.4: Average monthly rainfall (72 years) and temperature (39 years) data for Wellington (by
courtesy of the South African Weather Service) .......................................................................51 Figure 2.5: Study area showing the soil units (Görgens and de Clercq 2002) of the study sites
(Voëlvlei, Elandsberg and Krantzkop).......................................................................................54 Figure 3.1: A South-East view of a 15-year-old field at Slangkop (Elandsberg) adjacent to a narrow
stand of unploughed Swartland Shale Renosterveld (Mucina and Rutherford 2004), with Swartland Alluvium Fynbos flats in background. Note the advance of flowering Relhania fruticosa (L.) Bremer on to the old field....................................................................................62
Figure 3.2: Diagram of the 1000 m2 (20 m by 50 m) relevé layout used in this study .....................66 Figure 3.3: Hierarchical tree of 72 quadrats (as used in classification; see Tab. 3.6) at 10 m2 scale.
Complete linkage clustering with Chord distance (as resemblance function) was used ...........78 Figure 3.4a: PCA ordination diagram of the first two axes of 72 quadrat samples (10 m2). The
polygons recover the communities (in the form of an envelope enclosing all samples of related class, as featured in Tab. 3.6).....................................................................................................80
Figure 3.5a: CCA ordination diagram of the first two axes of 72 quadrat samples (10 m2). The polygons recover the seral stages (in the form of an envelope enclosing all samples of related sere)............................................................................................................................................82
Figure 3.5b: CCA ordination diagram of the first and third axes of 72 quadrat samples (10 m2). The polygons recover the seral stages (in the form of an envelope enclosing all samples of related sere)............................................................................................................................................83
Figure 3.5c: CCA ordination diagram of the second and third axes of 72 quadrat samples (10 m2). The polygons recover the seral stages (in the form of an envelope enclosing all samples of related sere) ................................................................................................................................84
Figure 3.5d: CCA ordination diagram of the first two axes of 72 quadrat samples (10 m2). The polygons recover the seral stages (in the form of an envelope enclosing all samples of related sere). Species richness of relevés was entered as a passive numerical co-variable ...................85
Figure 3.6: A one-way ANOVA test of phosphorus content per sere ..............................................87 Figure 3.7a: CCA ordination diagram of the first two axes of 24 relevés (1000 m2) with
environmental variables. Species richness of relevés was entered as a passive numerical co-variable.......................................................................................................................................88
Figure 3.7b: CCA ordination diagram of the first two axes of 24 relevés (1000 m2) with environmental variables. Species richness of relevés was entered as a passive numerical co-variable. Sample objects are classed loosely according to assumed habitat type, with polygons that recover the habitat...............................................................................................................89
vi
Figure 4.1: Grazing plains zebras (Equus burchelli “quagga’s”) on an old field at Elandsberg Private Nature Reserve.............................................................................................................100
Figure 4.2: Life-form species richness of 42 relevés (1000 m2) used in statistical analyses..........111 Figure 4.3: Total species richness of 1000 m2 relevés (n = 42) for different seres; 1 = 5-, 2 = 15-, 3
= 30-year-old fields and 4 = unploughed renosterveld ............................................................113 Figure 4.4: A one-way ANOVA test of parasite, phanerophyte, therophyte, and cryptophyte
average species richness per sere .............................................................................................114 Figure 4.5: Hemicryptophyte, lianella, nano-chamaephyte and chamaephyte species richness per
sere ...........................................................................................................................................115 Figure 4.6: The interaction of seral stage and grazing intensity on hemicryptophyte species richness
..................................................................................................................................................116 Figure 4.7: The interaction of seral stage and grazing intensity on total, therophyte, cryptophyte and
parasite species richness...........................................................................................................117 Figure 4.8: Main effects of seral stage differences and grazing intensity on total species richness at
left; and single ANOVA main effects of grazing intensity on chamaephyte and parasite life-form species richness at right...................................................................................................118
Figure 4.9: Main effects of seral stage differences for cryptophyte and lianella life-form species richness at left; and main effects of grazing intensity on cryptophyte and nano-chamaephyte life-form richness at right.........................................................................................................119
Figure 4.10: The interaction of seral stage and grazing intensity on nano-chamaephyte, chamaephyte, lianella and phanerophyte species richness.......................................................120
Figure 4.11: Average summed cover-abundance of therophyte, cryptophyte, parasite and total life-forms at the 10 m2 quadrat scale (n = 72) for different seres...................................................122
Figure 4.12: Average summed cover-abundance of hemicryptophyte, nano-chamaephyte, chamaephyte and lianella life-forms at the 10 m2 quadrat scale for different seres ................123
Figure 4.13: Total cover-abundance of all life-forms at the 10 m2 quadrat scale (n = 54) with the interaction of ploughing and grazing intensity ........................................................................124
Figure 4.14: Cover-abundance of therophyte, cryptophyte, hemicryptophyte and parasite life-forms at the 10 m2 quadrat scale with the interaction of ploughing and grazing intensity ................125
Figure 4.15: Cover-abundance of hemicryptophyte, nano-chamaephyte, lianella and chamaephyte life-forms at the 10 m2 quadrat scale with the main effect of ploughing.................................126
Figure 4.16: Cover-abundance of hemicryptophyte and parasite life-forms at the 10 m2 quadrat scale with the main effect of grazing intensity ........................................................................127
Figure 4.17: A count of alien species for each life-form in which they occur................................128 Figure 4.18: Alien species richness of different seres at left and alien species richness with different
grazing intensities at right ........................................................................................................128 Figure 4.19: Response curves of six species fitted using generalized additive models. Species are
diagnostic for different communities .......................................................................................130 Figure 4.20: Response curves in relation to the first DCA axis of six selected graminoids that
frequently occur at the AGC. Species were fitted using generalized additive models ............131 Figure 4.21: Response curves of eight selected perennial shrub species fitted using generalized
additive models ........................................................................................................................132 Figure 4.22: Response curves of six selected alien annual grass species fitted using generalized
additive models ........................................................................................................................133 Figure 5.1: Aspalathus aculeata Thunb. a lowland “special” (endemic and threatened) flowering at
Krantzkop in October, with Athanasia trifurcata (L.) L. in bud in the foreground.................154 Figure 5.2: A conceptual dynamic model for renosterveld after initial ploughing then disturbance
by grazing. LIG = Low Intensity Grazing and HIG = High Intensity Grazing, c-a = cover-abundance.................................................................................................................................156
Figure 5.3: A conceptual dynamic model for renosterveld in relation to fire and grazing disturbances (Cowling et al. 1986) ..........................................................................................157
vii
Figure 5.4: A conceptual dynamic model for renosterveld in relation to fire and grazing disturbances (Rebelo 1995)......................................................................................................157
Figure 5.5: Marasmodes sp. nov (pinnatifolia) (lowland special-endemic and threatened) flowering at Elandsberg in May ...............................................................................................................160
Figure 5.6: From top left to right: Drosera cistifolia L., Gladiolus watsonius Thunb., Gladiolus alatus L., Moraea tulbaghensis L.Bolus; from bottom left to right: Euryops thunbergii B.Nord, Monsonia speciosa L., Moraea villosa (Ker Gawl.) Ker Gawl. subsp. villosa, Lampranthus elegans (Jacq.) Schwantes........................................................................................................162
viii
List of Tables
Table 3.1: Quadrat scales and measurements within each relevé .....................................................67
Table 3.2: Large herbivore census (for 2003) at Elandsberg and Krantzkop....................................68
Table 3.3: Details of ploughing and grazing disturbance factors (and respective levels) for the 36
relevés surveyed in this study ....................................................................................................68
Table 3.4: Variables and methods of the soil analyses......................................................................69
Table 3.5: Environmental variables of 24 relevés (1000 m2) used in gradient analyses...................70
Table 3.6: Structured full relevé table of 10 m2 quadrats of renosterveld and old fields at the Agter-
Groeneberg Conservancy...........................................................................................................79
Table 4.1: Details of ploughing and grazing disturbance factors for 42 relevés analyzed for
differences in life-form richness amongst states. Relevés from sere 3 and sere 4 were analyzed
for interaction effects of ploughing and grazing......................................................................105
Table 4.2: Details of ploughing and grazing disturbance factors for 36 relevés containing 72
quadrats (2 per relevé) analyzed for differences in life-form cover-abundance amongst states.
Relevés from sere 3 and sere 4 were analyzed for interaction effects of ploughing and grazing
..................................................................................................................................................105
Table 4.3: Large herbivore census (for 2003) at Elandsberg and Krantzkop..................................107
Table 4.4: Summary of average life-form and total species richness of 1000 m2 relevés per sere,
with standard deviation (s.d.)...................................................................................................112
Table 4.5: Summary of average life-form and total cover-abundance of 10 m2 quadrats per sere,
with standard deviation (s.d.)...................................................................................................121
ix
Preface
This project forms one component of a study of renosterveld in the Western Cape1 by the
Renosterveld Rehabilitation Project based at Stellenbosch University in the Department of
Conservation Ecology. The Renosterveld Rehabilitation Project was partly funded by World Wide
Fund/Table Mountain Fund as part of the Cape Lowlands-Renosterveld Ecology and Management
project. This specific project was also supported by the National Research Foundation of South
Africa under Grant number 2053674. This thesis concerns a study of renosterveld vegetation
patterns and dynamics in relation to ploughing and grazing:
Chapter One is a general literature review of renosterveld vegetation.
Chapter Two is a précis of the study area characteristics applicable to both core chapters covering
data analysis and synthesis.
Chapter Three focuses on vegetation patterns with a description of classified communities and
ordination diagrams. This chapter is written in article format according to the South African Journal
of Botany, with the aim of publishing in mind.
Chapter Four concerns the interaction of ploughing and grazing on life-form richness and cover-
abundance. This chapter is written in article format according to the South African Journal of
Botany, with the aim of publishing in mind.
Chapter Five is a brief summary of findings and includes management recommendations.
1 Erratum: note all diagrams should read “Western Cape” and not “southwestern Cape”.
x
Abstract
Swartland Shale Renosterveld is restricted to fertile fine-grained soils in the winter rainfall region of
the Western Cape. Between 91% and 97% of this vegetation type is transformed, mostly due to
agriculture. Remaining fragments have an irreplaceable conservation value due to a high richness of
endemic geophytes. Information on renosterveld vegetation composition and response to
disturbance is sparse. Research occurred at three sites near Wellington: Voëlvlei Provincial Nature
Reserve (CapeNature), Elandsberg Private Nature Reserve (Elandsberg Farms (Pty.) Ltd.), and
Krantzkop munitions factory (Armscor/Somchem) forming a contiguous fragment in the Agter-
Groeneberg Conservancy. The primary research aim was to identify or ascertain patterns of plant
succession in Swartland Shale Renosterveld and associated different-aged old fields (previously
ploughed), with the interaction of grazing. The key research questions are: (1) What are the plant
communities of unploughed renosterveld and different-aged old fields which originated in habitats
of ploughed renosterveld? (2) What are the most characteristic features of the floristic and
ecological relationship between the described plant communities in terms of ecological factors
operating within the studied system? (3) Does total species and life-form group richness differ
between natural vegetation and old fields? (4) Is life-form richness influenced by ploughing and
grazing or the interaction between these disturbances? (5) Is life-form cover-abundance influenced
by ploughing and grazing or the interaction between these disturbances? (6) Does alien plant
species richness differ amongst seres, and with different levels of grazing intensity? A comparison
of life-form richness and cover-abundance of old field vegetation was made with adjacent natural
unploughed “controls”. The effects of ploughing on community structure, with the inclusion of
grazing was established. These life-form richness comparisons also occur across a gradient of
increasing large mammalian herbivore grazing intensity. Sampling was conducted in winter and
spring using nested 1000m2 relevés.
A hierarchical classification, description and floristic interpretation of renosterveld and old field
vegetation were made using TWINSPAN, SYN-TAX 2000 and CANOCO. The samples were
classified with TWINSPAN and two communities were described at the association level, namely:
Ursinia anthemoides–Cynodon dactylon Grassland Community (with two variants) and the
Pterygodio catholici–Elytropappetum rhinocerotis Shrubland Community (with two sub-
associations), respectively. The vegetation data were further hierachically classified using SYN-
TAX 2000 which revealed similar clustering of sample objects to that resulting from classification
xi
and ordination. Following ordination of sample objects with CANOCO, select groups of species
were used to depict their response curves in relation to seral development.
Briefly it was found that the effects of grazing vs. non-grazing was more pronounced on old fields
than in unploughed vegetation. Overall total species and life-form richness was reduced by
ploughing with old fields requiring a recovery period of 30 years to resemble unploughed
vegetation.
Keywords: Swartland Shale Renosterveld, phytosociology, vegetation patterns, life-forms,
succession, disturbance, ploughing, grazing, old fields.
xii
Acknowledgements
My Mother for providing me with moral and financial support throughout times of need. My Father
for his lateral thinking ability and persistence with my completion. My brothers Geoffrey A Walton
for composing the plot layout diagrams and Gregory D Walton for providing me with a laptop
which proved to be invaluable in field and home.
Professor Suzanne J Milton for accepting my independent proposal on a study of renosterveld
vegetation, and for supervising this project with all its inherent obstacles and streamlining the
necessary objectives and outcomes. Miss Annelise le Roux (CapeNature) for commenting on early
drafts and providing valuable insight into the surveying method and suggestion of TURBOVEG
usage. Professor L Mucina for assisting me with the second phase of this project regarding
phytosociological aspects, hierarchical clustering and ordination analyses. Mr. Ian P Newton for
kindly providing me with GIS data of renosterveld vegetation fragments and many other data
layers, and Dr. Richard Knight (University of the Western Cape) for assistance and coursework
provided in GIS applications. Help with statistical tests and conventions were provided by Professor
David Ward, Dr. M Kidd and Professor Nel. Special thanks to Professor Nel (Sentrum vir
Statistiese Konsultasie) for coursework in SAS and Statistica, also information about interpretation
of statistical tests. Information Technology at Stellenbosch University for assistance with basic
computer courses and their free technical support. Mr. Eugene Pienaar for tutoring me in
MEGATAB. Dr. A Rozanov, Dr. F Ellis and Mr. De Clercq (Department of Soil Science) for
information about soil formations, soil sampling and interpretation of soil analyses. Part-time
student field assistants Rene Gaigher and Theuns Pienaar for their enthuasim in the midday sun!
Mr. Peter Viljoen (CapeNature) for providing GIS data and logistical support, as well as Michael
Lewis. Mrs Elizabeth Parker (Elandsberg Farms (Pty) Ltd) for giving me access for research in the
Elandsberg Private Nature Reserve. Mike Gregor (Elandsberg Farms Manager), Nicola Farley and
Bernard Wooding for providing background information on land use (past and present), stocking
densities, reserve size and boundary, and logistical support and housing at Elandsberg. Mr. Steve
Mitchell (Denel/Somchem) for providing information on previous land users, stocking densities,
burning regimes and developments as well as logistical support at Krantzkop.

xiii
Mr. Stephan M Hennekens for providing me with a licenced copy of TURBOVEG (a databank
program including TWINSPAN and MEGATAB), and help with file formatting, answering queries
and constant updates to program bugs I identified.
Both the Bolus and Compton Herbaria staff and people who helped with identifications: Jo Beyers,
Pascale Chesselet, Chris Cupido, Graham Duncan, David Gywnne-Evans, Nick Helme, Cornelia
Klak, Hubert Kurzweil, John Manning, Edwina Marinus, Ladislav Mucina, Anton Pauw, Terry-
Trinder Smith, Dee Snijman, Kenneth Oberlander, Ted Oliver, Tony Verboom and Frans Weitz.
The Cape Conservation Unit (Botanical Society of South Africa) especially Sue Winter for
organizing five field outings during 2003, and two in 2004, in both West- and South Coast
Renosterveld, and synthesizing interactions with land users, conservation officials, academics and
other stakeholders. Also Shaun Ranger, Anton Wolfaardt, Rhulani Khubayi and Nick Helme for
interesting veld forays.
The World Wide Fund for nature (South Africa) for providing me with financial support for the first
two years of this project. The National Research Foundation for providing me with financial
support for the first two years of this project under Grant number 2053674. First National Bank for
granting me a student loan to afford costs incurred whilst studying.
1
Chapter 1
Renosterveld: Concept, Ecology and Variability
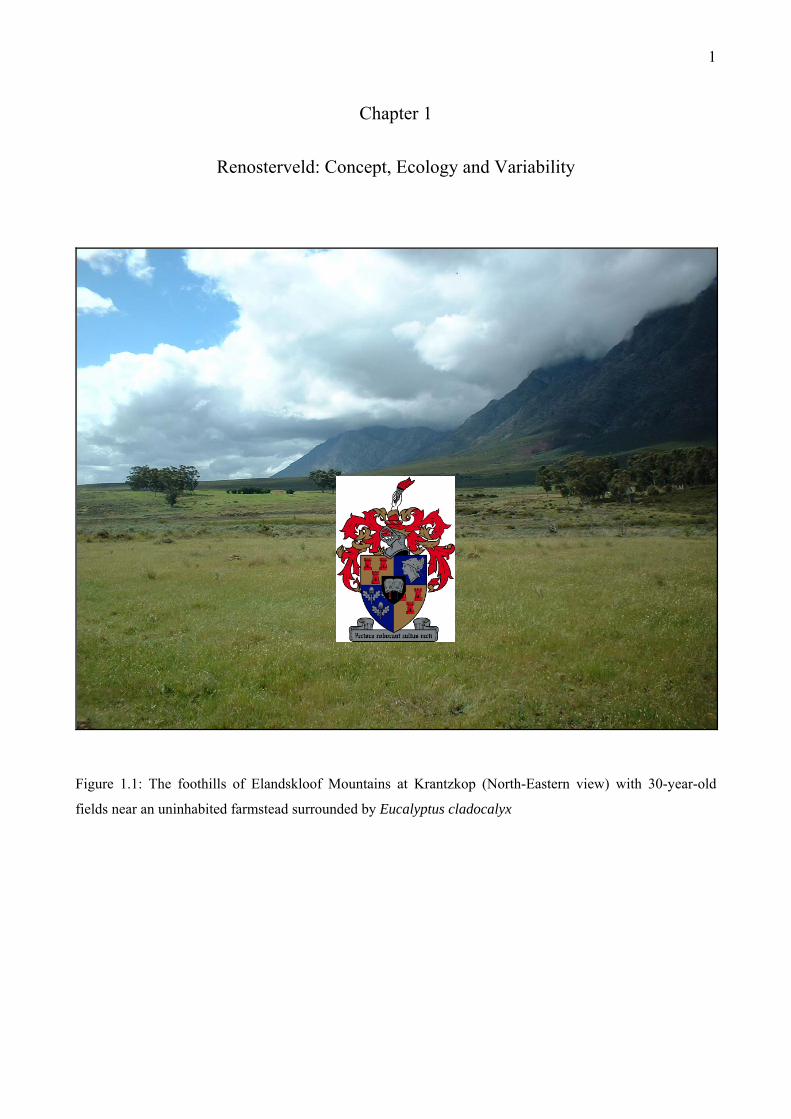
Figure 1.1: The foothills of Elandskloof Mountains at Krantzkop (North-Eastern view) with 30-year-old
fields near an uninhabited farmstead surrounded by Eucalyptus cladocalyx
2
1.1. Introduction
The aim of this thesis is to determine vegetation patterns in a remnant of renosterveld and gain an
understanding of several processes operating in shaping the post-ploughed recovery and local
vegetation dynamics in relation to large-herbivore grazing. A renosterveld fragment (Figure 1.1) at
the Agter-Groeneberg Conservancy (hereafter denoted AGC), was studied for a description of
community patterns which may have been typical of the once more widely distributed renosterveld
along the West Coast foreland (Figure 1.2). This particular chapter intends to present a brief
overview of the definition and ecology of renosterveld vegetation, and to outline ecosystem
processes maintaining floristic richness and diversity of renosterveld in relation to disturbance.
Renosterveld is a part of the Fynbos Biome (sensu Kruger 1978), one of five mediterranean-type
ecosystems (MTE) of the world. The five mediterranean-climate regions occupy 2.25 % of the
Earth’s surface (Rundel 2004), yet collectively account for almost 20% of vascular plant species
(Cowling et al. 1996). These regions are renowned for citrus fruit, viticulture, olives, figs and other
winter rainfall crops.
Plant communities of the Mediterranean region are highly diverse at the local and regional scale
(Lavorel 1999). A multitude of vegetation types occur within these five MTE’s of the world. The
Mediterranean Basin contains seasonal dry forests, macchia, garrigue, and related shrublands;
sclerophyllous chaparral and summer-deciduous coastal sage scrub vegetation occur in California
(Keeley 2000); central Chile supports matorral (Rundel 1981) and typical Australian mediterranean-
type shrublands contain mallee and kwongan (Fox 1995). Fynbos and renosterveld are MTE
shrubland types in South Africa.
Fynbos and renosterveld are found within the Cape Floristic Region (sensu Goldblatt 1978,
hereafter referred to as CFR) which was declared as one of twenty-five global biodiversity hotspots
(Myers et al. 2000) due to high concentrations of endemic taxa. The CFR comprises an area of
90000 km2 and is estimated to contain 9 030 vascular plant species (Goldblatt and Manning 2002),
or a ratio of one species per 10 km2, with 68% endemism (Bond and Goldblatt 1984). A
comparative study of species richness at the 0.1 ha scale (Rice and Westoby 1983) revealed that in
temperate sclerophyllous shrub-dominated vegetation on low-nutrient soils the species richness
generally is in the range of 50 to 100 species. At the 1000 m2 scale renosterveld has higher species
richness than fynbos: circa 84 and 66 species, respectively (Cowling 1983a).
3
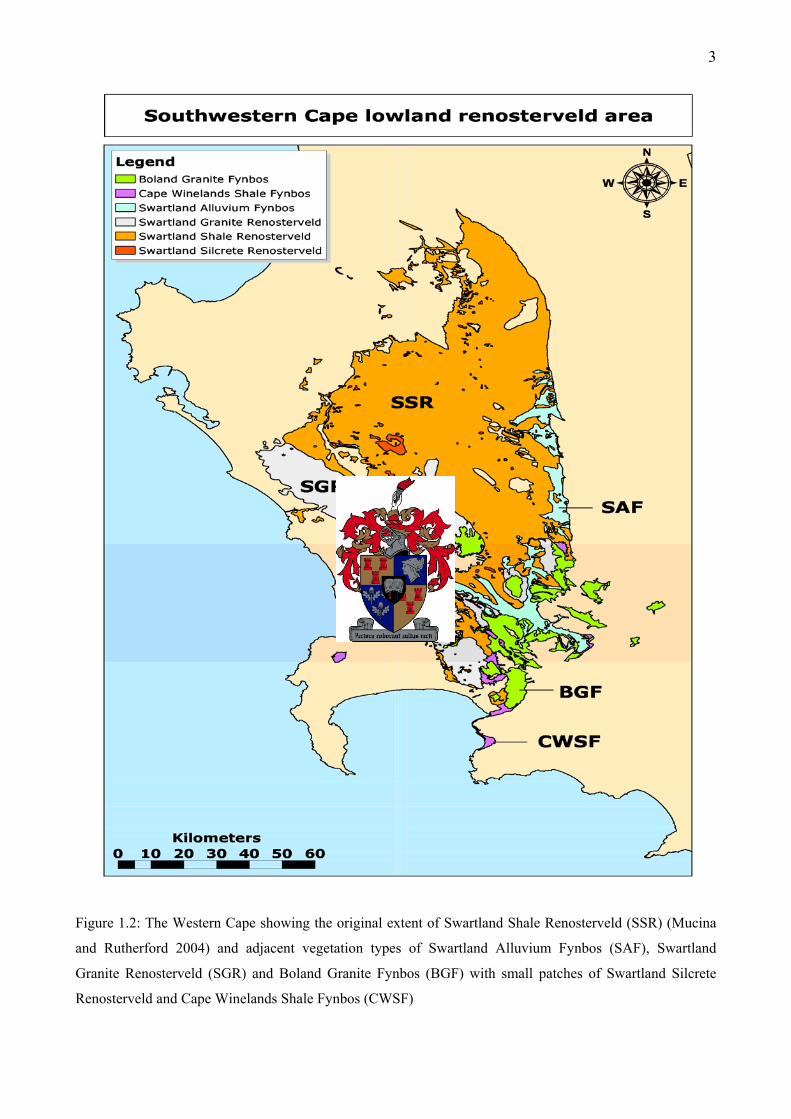
Figure 1.2: The Western Cape showing the original extent of Swartland Shale Renosterveld (SSR) (Mucina
and Rutherford 2004) and adjacent vegetation types of Swartland Alluvium Fynbos (SAF), Swartland
Granite Renosterveld (SGR) and Boland Granite Fynbos (BGF) with small patches of Swartland Silcrete
Renosterveld and Cape Winelands Shale Fynbos (CWSF)
4
The common feature of all MTE’s is that they occur in warm-temperate regions experiencing winter
rainfall and summer drought. MTE’s have often been compared with each other as there are
congruencies in growth-form adaptations to local climates, but a singular robust definition for
mediterranean type ecosystems is lacking. Rundel (2004) maintained that the definition of a
mediterranean-climate ecosystem lacks exclusive and distinctive criteria, as MTEs are defined in
rather general terms according to climate, floristics and physiognomy or a combination of these
criteria, to delineate their boundaries. High species richness and endemism (Thiaw and Chouchena-
Rojas 1999), frequent fires, an extensive flowering period with seasonal growth rhythms extending
into summer are diagnostic of MTE’s (Dodson and Kershaw 1995). Characteristic high species
richness is due to spatial heterogeneity in habitat and topography, also influenced by environmental
factors and moderate resource limitation (Moody and Meentemeyer 2001). Goldblatt (1978)
mentioned that high species richness in the CFR is attributed to environmental heterogeneity (and
edaphic diversity), different climatic regimes, and climatic fluctuations since the mid-Pliocene.
Campbell and van der Meulen (1980) investigated alpha and beta species diversity in mountain
fynbos vegetation along a temporal and altitudinal gradient and concluded that beta diversity was
most influenced by altitude and structure (the latter related to the age of post-fire vegetation).
Specifically alpha diversity (point diversity or richness) was lowest at low altitudes in mature stands
of vegetation, relative to younger stands due to overtopping by emergent proteoids, whilst beta
diversity (species turnover) was low at similar altitudes between different-aged stands. Cowling and
Campbell (1984) studied beta diversity along coenoclines of fynbos and non-fynbos in the
southeastern Cape revealing high turnover rates along an altitudinal gradient.
Huston (1994) suggests a model explaining this high diversity in terms of low competition related
to nutrient-poor soils and summer drought, combined with disturbance (fire or grazing). Another
model explaining higher species richness in fynbos relative to its analogues, proposed by Wisheu et
al. (2000), suggests that the abundance of the seeder strategy versus the resprouter strategy, coupled
with physical barriers and local isolation, could have allowed for a more rapid speciation pattern.
Three factors contributing to high plant species richness and diversity in mediterranean heathlands
are: oligotrophic soils allowing for either seeder or sprouter strategies upon death by fire, numeric
dominance by seeders, and short generation times of seeders with high speciation rates.
Renosterveld shrubland occurs on nutrient-rich soils, thus the model proposed by Wisheu et al.
(2000) would only apply for fynbos proper. Nutrient levels are then not the main determinant of
species richness and diversity in this nutrient non-limited environment.
5
1.2. Concept of Renosterveld
Francis Masson travelled with Carl Peter Thunberg northward up the west coast and passing
Kontreberg (19th February 1773) they entered “a large barren country, named the Zwart Land,
owing to the renosterbossies and bakkerbossies, grey-black and pitch-black when wet” (Bradlow
1994). Masson described the area as: “the earth is a grey sand, level for many miles, and covered
over with low shrubs of various sorts”. Masson travelled with Thunberg again, reaching the top of
Paardeberg (760 m, 6th of October 1774), where a “treasure of plants” were seen and an “extensive
view of adjacent country, which is level, and has but a barren appearance; yet contains several
plantations, producing abundance of corn (wheat) and wine; and the peasants live luxuriously”.
”Their plantations lie all around the foot of this mountain, which yields a number of fine rivulets,
without which this country would be uninhabited”. On the 7th of October 1774, they journeyed
“northward through a level country covered with low shrubs, but it being now spring, it was
everywhere decorated with flowers of the greatest beauty, every hour’s march producing new
charms” (Bradlow 1994).
On April 11th Burchell (1822) says the “open face of country, surface varied with smooth hills
covered almost exclusively with a neat pale bushy shrub, of the height of 3 or 4 feet, called
“rhinosterbosch” (rhinoceros bush), and said to have formerly been the food of the huge rhinoceros,
till those animals fled before the colonists, as these gradually advanced over the country where the
shrub grows.” Simon van der Stel apparently named it thus because rhinoceroses (hook-lipped or
Black Rhinoceros Diceros bicornis) inhabiting the coastal plains were camouflaged by it, and
because of renosterbosses wide cover over the landscape (van der Walt 2003). In Burchell’s book
(1822) a “Stoebe rhinocerotis” vignette presents a sprig in its natural size, the leaves are very
minute, and the scales, in the manner of the cypress, (the author had the same realisation in the field
of an almost Lilliputian forest) the flowers are small, and, though very numerous, are neither showy
nor ornamental, being of a simple herbaceous colour. Several species of Stoebe, which in growth
resemble this one, are all, without distinction called by the colonists, “rhinoster-bosch” (says similar
to tamarisk!), and perhaps in former days, been equally the favourite food of the rhinoceros.
Burchell (1822) described renosterveld vegetation as “renosterbos abounds in dry hilly lands; and
occupying extensive tracts, give a peculiar character to the landscape”. The term renosterveld
standardized by Boucher (1980) is not attributed to the most conspicuous and dominant species,
6
namely Elytropappus rhinocerotis 2 (renosterbos) often forming monotypic stands, but to a
vegetation in which rhinoceros previously occurred.
Contemporary descriptions and definitions of renosterveld are often ambiguous or complicated
unlike those for fynbos. Consensus is lacking as to what the distinguishing features of it are,
although descriptions have been adequately documented (Boucher and Moll 1981, Boucher 1983)
as well as in context of the Fynbos Biome (Moll et al. 1984), there is no singular identification of
underlying ecological patterns and processes especially in relation to fire. A description of
renosterveld is a perception (see Krug et al. 2004; Newton and Knight 2004); much relies on the
stance or view a priori one has of it. Fynbos has an adequate descriptive history, whereas
renosterveld has not had an equal focus of ecological description. Descriptively maligned to either:
“disclimax” (see Specht and Moll 1983), or “transitional” (scrub type Acocks 1953, fine-leaved
microphyllous shrubland, Cowling 1983a, Cowling 1984, Moll et al. 1984) or a “derived” (Boucher
1987) existence or state. Perceptions of renosterveld by agriculturalists as an unwanted “quasi-
state” as a result of pasturage overgrazing (du Toit and du Toit 1938) has led to a negative
connotation of dominant shrubs in renosterveld. Ecotones exist in reality as boundaries between two
or more vegetation types, a transition from one to another cannot exist for many square kilometres
without warranting a sufficient identity as a separate ecological entity. To suggest something is
transitional, in the first instance, implies there is an arrival or advance to a defined state of
vegetation type at some point. The notion that renosterveld was previously a grassland, now
invaded by Elytropappus rhinocerotis was not supported by isotopic evidence from litter and soil
samples (Stock et al. 1993). Geology and soil types are the primary determinants for differences
between fynbos and renosterveld vegetation types and habitats. Serotiny is a distinguishing feature
of fynbos on oligotrophic soils and noticeably lacking in renosterveld. Renosterveld on eutrophic
soils relies on a ground-stored seed bank, with no evidence of serotiny, and the many asteraceous
species with rapid growth rates and seed formation probably invalidate the requirement that serotiny
(see Enright et al. 1998) has to counteract disturbance by fires.
Moll and Jarman (1984a) identified the need for a clear definition of fynbos as different from the
traditional heathland category described by Specht (1979) as these communities are not restricted to
a mediterranean-climate region, but are physiognomically similar or floristically related. Thus the
definition proposed by Moll and Jarman (1984a) and Moll et al. (1984) for fynbos would entail an
“evergreen sclerophyllous shrubland on oligotrophic soils, comprising elements of the Cape
2 Dicerothamnus rhinocerotis is the new name for Elytropappus rhinocerotis but as yet is unpublished and exists in PhD format only (by M. Koekemoer). Thus the old name is given preference throughout this thesis.
7
Floristic Region”, which “consist of either functionally isobilateral picophyllous and/or
microphyllous to mesophyllous-leaved shrubs”, also “associated with evergreen aphyllous and/or
narrow-leaved sclerophyllous hemicryptophytes”. In addition Moll and Jarman (1984b)
incorporated changes to the limited definition of heathlands (as characteristically dominated by
Ericaceae) for application in South Africa, as “true” ericaceous heathlands here are restricted to
montane environments, as clarified by Campbell (1978). Structurally heathlands are characterised
by a closed (dense) to mid-dense (or open; Moll and Jarman 1984b) assemblage of evergreen,
sclerophyllous shrubs, dwarf shrubs, also including seasonal hemicryptophytes and therophytes
(Specht 1979). Evergreen sclerophyllous hemicryptophytes are an important component of
heathlands, as is the seasonal geophytic component and a few parasitic epiphytes. Depending on the
availability of water; trees and tall shrubs may be common, especially so in the absence of fire
(Armesto et al. 1995), or otherwise rare in heathland formations (Specht 1979), as is the case in
South Africa (with the exception of the Cedarberg open temperate forest, Kruger 1979a, 1979b).
The ericaceous presence is not ubiquitous to heathlands in the South African context, as these are
often absent or replaced by other families with picophyllous shrubs, like Asteraceae,
Thymelaeaceae and Rhamnaceae (Moll and Jarman 1984b). Thus fynbos “heathlands” are
ecologically restricted to oligotrophic soils, also sands, limestones and laterites or highly leached
soils. Moll and Jarman (1984b) consider the soils to be seasonally waterlogged but fail to explain
the good drainage provided by steep slopes on which much of fynbos occurs. Thus Specht’s (1979)
criterion still holds true: that sclerophyllous heathland formations occur on oligotrophic soils, either
well-drained or waterlogged. Heathland areas generally have both oligotrophic and eutrophic soils,
with sclerophyllous plants occurring on the former and herbs and grasses flourishing on the latter
(most notably in Australia). Thus with a similar climatic regime different vegetation types will
occur on different soil types.
Coastal renosterveld, including both West Coast Renosterveld and South Coast Renosterveld (sensu
Rebelo 1996, hereafter denoted WCR and SCR, respectively), comprises a mid-dense (i.e. partially
open) to closed 1-2 m tall matrix of small cupressoid, leptophyllous, molliphyllous, divaricately
branched (Boucher 1981) small-leaved evergreen shrubs (Moll et al. 1984, McDowell and Moll
1992), dominated by the Asteraceae family. Emergent bush-clump or thicket species of subtropical
affinities (like the Celastraceae and Oleaceae families) with broad orthophyllous leaves are
regularly spaced in the renosterveld matrix. Clumps of the wild olive (Olea europaea subsp.
africana) occur alongside rivers, drainage lines, or in rocky outcrops as well as on termitaria
(heuweltjies) (Boucher 1981). Renosterveld is hardy shrubland vegetation, enduring hot summers
and desiccating winds, adapted to survival in these climes by the sclerophyllous and cupressoid leaf
8
physiology of dominant microphyllous asteraceous shrub species or alternatively seasonal
dormancy by geophytes and some hemicryptophytes.
1.3. Patterns of Functional Types
A broad functional-type pattern or physiognomy of South African shrublands is defined on the basis
of floristics. Floristic affinities of renosterveld with fynbos are low in spite of their structural
similarity (Boucher and Moll 1981), although Boucher (1983) found that 54% of species were
shared between WCR and mountain fynbos at Jonkershoek. The presence of restioids, ericoids and
proteoids are diagnostic of fynbos vegetation. The restioid component is the most diagnostic (or
constant) physiognomic and floristic feature of fynbos (Kruger 1979a, Taylor 1978), followed by
the ericoid growth form and the frequent proteoid growth form. Differential structural elements of
sedges, non-ericaceous ericoids, and ericoid asteraceous forms occur throughout (Cowling and
Holmes 1992). The presence of endemic families, for example Penaeaceae and Stilbaceae are
common, as is leaf spinescence. The diagnostic fynbos plant families: Ericaceae, Proteaceae and
Restionaceae are lacking in renosterveld (Taylor 1978). Some ericoid, proteoid and restioid species
do occur in renosterveld at low densities (Taylor 1996), as some representatives of these families
are restricted to specific habitats (in renosterveld). Coastal renosterveld is best described as a
shrubland including swards of graminoids and geophytes with some open spaces allowing for an
abundance of ephemeral species. By nature of the topography, patches of wetlands occur in
renosterveld wherever drainage is poor, especially alongside slow-flowing rivers and in alluvial
floodplains. Termitaria (heuweltjies) are a feature of the renosterveld landscape, and provide
additional micro-habitats (synusia) in the shrubland matrix. A physiognomic feature of fynbos is the
lack of dominance by any one species (exceptions are found in seepage areas or localized types of
fynbos, and long post-fire intervals), unlike renosterveld which is usually dominated by one or more
asteraceous shrub species.
The mediterranean-type vegetation of the Fynbos Biome is composed of sclerophyllous species
adapted to seasonal drought by their conservative leaf size and transpiration rates. Seasonal drought
periods are a common feature of mediterranean-climate regions, even though average seasonal
temperatures vary. Sclerophylly in MTE’s is either a response to low nutrient environments or
seasonal drought (Specht 1979). Sclerophyllous leaves have thick cuticles with sunken stomata and
are varied in shape and form: leptophyllous; nanophyllous; microphyllous; cupressoid or aphyllous
(Specht 1979). Sclerophyllous leaves are usually small or inwardly-rolled as in Ericaceae and/or
9
with thick cuticles or hair to reduce evapotranspiration. Sclerophyllous shrubs and dwarf shrubs and
also geophytes dominate the ground stratum of plant communities on oligotrophic soils, while
grasses and herbs are rare. On eutrophic soils the ground stratum is herbaceous and composed of:
annual grasses, herbs, forbs and geophytes. Specht (1973) says in the mediterranean area of
southern Australia below the dominant overstorey of Eucalyptus, eutrophic soils support a ground
stratum of perennial tussock grasses and geophytes; in contrast to a ground stratum of shrubs on
oligotrophic soils. Sclerophylly is a response to conditions of water stress and an evergreen or
herbaceous ground stratum is a response to soil fertility (Specht 1979). Specht (1981) mentioned
that mediterranean shrublands on eutrophic (base-rich) soils produce shoot growth in spring in the
upper stratum; as opposed to late spring/summer shoot growth with vegetation on oligotrophic soils
(and intermediate soils like mallee with a summer-growth rhythm, Fox 1995).
Strata of Renosterveld
Mature renosterveld has many strata (Adamson 1938, Levyns 1929b, Boucher and Moll 1981) such
as: an upper stratum of (often cupressoid) asteraceous shrubs, a middle stratum of dwarf shrubs, and
a lower stratum of grasses, forbs, geophytes and annuals (with a large grass and geophyte
component, Rebelo 1995). Levyns (1929b) and Muir (1929) correctly observed the moss and lichen
flora on the surface (as well as plants festooned with lichen, B.A. Walton, personal observation),
with the former most noticeable in winter when the microbial activity is highest in the pedoderm.
Adamson described succession in renosterveld starting as an early sere with low life-form and
floristic diversity of annuals and pioneers, advancing to another sere with dwarf shrubs and later
“ericoid” dominance by a few shrubs. Renosterveld shrubland is often monotypically or co-
dominated by Elytropappus rhinocerotis (Levyns 1929b) or Athanasia trifurcata with other
shrub/dwarf shrub species occurring in lower densities and usually in the undergrowth (see Muir
1929). The success of Elytropappus rhinocerotis is attributed to an ability to grow deep tap roots (to
8 foot, Scott and van Breda 1937) after sufficient moisture to lateral roots has been provided
(seedlings are initially drought intolerant, Levyns 1927). Deep roots also facilitate conditions for
other plants to abstract water and other solutes. Stoebe is also known to have deep roots (to 5 feet,
see Cohen 1935), but prefers a higher soil water content for germination (coinciding after rainfall).
The lowest stratum (understorey) is mainly ephemeral and herbaceous with perennial grasses,
geophytes, prostrate herbs and procumbent dwarf shrubs.
The higher proportion of grasses in SCR distinguishes it from WCR, although much grass occurs in
stony places avoided by ploughing also in WCR with dense Themeda triandra swards (Acocks
1953). The WCR grass component is largely composed of C3 grasses (Vogel and Fuls 1978). In
10
SCR communities, both grassy and shrub structural cover states exist, and Cowling et al. (1986)
tentatively suggest an increased shrub component may be a result of overgrazing. Cowling (1983b,
1984), in a study of coastal shrublands, found that C3 grasses prefer cooler south-facing slopes
where the shrub stratum facilitates cooling and litter retains moisture, unlike C4 grasses which
prefer north-facing slopes. Thus radiation levels, rather than moisture, determine the patterns of
C3/C4 grasses in SCR. The C4 grasses overall had a higher coverage attributed to their competitive
ability over C3 grasses, and in the case of Themeda triandra a bimodal seasonal growth pattern
(Pierce and Cowling 1983) ensured dominance. Usually grass growth is initiated in early winter to
summer (Pierce 1984), with restioids from spring to summer, geophytes initiate growth in autumn
until the end of spring and shrub growth is varied throughout the year but usually occurs from late
winter to early summer.
1.4. Geology and Soils
The South African and Australian continents are mostly of Gondwanaland origin that in parts, are
overlain by a discontinuous strip of either Tertiary or Quaternary deposits. Cowling et al. (1996)
mentions that in more nutrient-rich soils, with longer fire-free intervals (like chaparral, garrigue and
phrygana); the shorter-lived species are out-competed by longer-lived shrubs in seral development.
Coastal renosterveld (Acocks 1953 Veld Type No. 46) is restricted to moderately fertile fine-
grained soils derived from granites and shales: it occurs on a rolling topography in the coastal
forelands of the Western Cape with a winter-rainfall regime (Boucher and Moll 1981), and an
undulating topography in the southern Cape region with a non-seasonal rainfall regime.
Along the West Coast forelands the geology is dominated by three terranes of the Malmesbury
Group from the Namibian period, namely: the Tygerberg Terrane (with the Tygerberg Formation);
the Swartland Terrane (with the Franschhoek, Moorreesburg, Bridgetown, Klipplaat and Berg River
Formations) and the Boland Terrane (with the Porterville and Piketberg Formations). Various Cape
granite plutons have intruded into the Malmesbury Group throughout the West Coast foreland,
namely: the Paarl, the Paardeberg and Darling Plutons (Anonymous 1990). The Klipheuwel Group
(with the Populiersbos and Magrug Formations) from the Cambrian Period is exposed occasionally.
Late Tertiary and Quaternary deposits comprise a large portion of the area as well. Some Dolerites
(at Voëlvlei) and Greenstones (in the Tulbagh Valley) occur intermittently (Visser et al. 1981).

11
Along the South Coast forelands the geology is dominated by the Malmesbury Group from the
Namibian period, with the Tygerberg Terrane (with the Tygerberg Formation) and the Boland
Terrane (with the Brandwacht Formation, partially thrust over the Porterville, Moorreesburg
(=Norree) and Franschhoek Formations). Various plutons from the same period occur throughout
the South Coast foreland, namely: the Hermanus, Robertson and Greyton Plutons (Anonymous
1997). The Klipheuwel Group (with the Magrug Formation) from the Cambrian Period is exposed
occasionally. Further inland the Malmesbury Group is composed of the Kaaimans and Kango
Formations (Anonymous 1991), and the Cape Granite Suite from the Cambrian period. The
Palaeozoic Period (Cambrian to Permian) produced the Cape Supergroup comprising: the Table
Mountain, Bokkeveld, Witteberg, Ecca and Beaufort Groups, which support fynbos except in some
formations which support renosterveld (like the Bokkeveld Group).
The South Coast Renosterveld areas (Vlakte and Ruêns and Enon Basin) are mostly ploughed up
for wheat (Ellis 1973). The geology of the lowland areas is comprised of Enon (Cretaceous
System), Bokkeveld Series of the Cape Supergroup and Tertiary sands and limestones. The Enon
beds give rise to conglomerates and clays which are unconsolidated and alternating. Quartz veins
and Bokkeveld shale or TMS inclusions are also found in the Enon beds. The higher hills of the
Ruêns and well planed Vlakte areas are formed from the Bokkeveld Series consisting of shales and
fine-grained phyllites. Occasionally limestone is occluded in the Bokkeveld Series.
Unlike fynbos on oligotrophic soils, renosterveld on eutrophic soils has a large biotic component of
arthropods, earthworms and termites able to break down plant material and aid in decomposition,
thus reducing the above-ground biomass able to burn.
1.5. Climate
Mediterranean type ecosystems are characterised by hot, dry summers and wet winters occurring in
the winter rainfall regions of the World (Hobbs et al. 1995), covering 2.73 million km2 (Thiaw and
Chouchena-Rojas 1999). The mediterranean regions of the World have similar climates influenced
by oceanic and atmospheric circulatory patterns. The total rainfall amount varies across these
regions and typical mediterranean-like vegetation extends beyond a mediterranean climate, for
example chaparral in Arizona (Keeley 2000). The five mediterranean regions of the world occur in
both hemispheres: the Mediterranean Basin and California in the Northern Hemisphere; and central
Chile, the southwestern and southern Cape region of South Africa and southeastern and
12
southwestern Australia in the Southern Hemisphere. These mediterranean regions occur between
the 30° and 40° latitudes either north or south (Hobbs et al. 1995).
Pleistocene glacial cycles had a more serious effect in the Northern Hemisphere and Chile than in
southern Africa, contributing to higher regional diversity in the CFR (see Goldblatt and Manning
2002), which escaped most of the glaciations (and aridity) of that period, notably in the western part
of the Cape flora (Cowling and Lombard 2002) and the southern Kalahari where humidity was high
(Van Zinderen Bakker and Coetzee 1988). During the Quaternary period prior to the Last Glacial
Maximum, cooler temperatures, especially in the southwestern and eastern Cape (Parkington et al.
2000) allowed for the spread of asteraceous shrublands (renosterveld) (Scott et al. 1997) in the
Fynbos Biome, where changes in vegetation were more pronounced at lower elevations. In the
Western Cape fynbos persisted as other floras descended to lower elevations in the cool period of
the last glacial maximum (18 000 BP), elsewhere in southern Africa and the Mediterranean region,
forest and xerophytic scrub and woods were replaced by steppe/grassland (Elenga et al. 2000).
In the Fynbos Biome, lowland renosterveld experiences a true mediterranean climate in the Western
Cape whilst a non-seasonal rainfall climate exists in the southern Cape (extending into the summer
rainfall region) (Wicht 1945, van Rensburg 1962, Boucher and Moll 1981). Generally the
renosterveld shrubland on the coastal forelands is defined as occurring on nutrient-rich soils
between a rainfall margin of 300 mm and 600 mm. At higher altitudes near foothills of mountain
ranges up to 800 mm of rainfall can occur (as well as in shale bands associated with the Cape
Supergroup). Thus renosterveld occurs along an edaphic and rainfall gradient between more mesic
fynbos elements and arid Karoo or thicket elements. Seedling recruitment in renosterveld plant
species may occur in pulses, coinciding with above average and consistent winter rains, alternating
with fire-cycles. At the upper rainfall margin > 800 mm of rainfall, fynbos can exist on highly
leached shale-derived soils (N Helme, personal communication), rather than forest elements in the
presence of fire. Exclusion of fire does not necessarily imply forest elements would succeed
renosterveld on the lowlands due to moisture limitations.
1.6. Disturbance and Vegetation Dynamics
Since the vegetation patterns and dynamics of sclerophyllous shrublands are influenced by various
disturbances, it is relevant to mention disturbances, which effectively “shape” the vegetation of
these regions. Renosterveld is described as a flora created and maintained by an intermediate level
13
of disturbance(s) (Boucher 1983), both at small and large scales. Porcupine diggings (Hystrix
africaeaustralis) and termite activity (Microhodotermes viator) create local habitat heterogeneity.
Whilst short fire intervals (compared with fynbos) maintain habitat heterogeneity at larger scales,
often creating a mosaic of vegetation patches of different ages with similar (or different) pioneer
and late successional dominant species, respectively. Heydenrych (1995) stated that “renosterveld is
a dynamic vegetation type, which fluctuates between a grass- and a shrub-dominated state,
depending on the use of fire and brush cutting techniques”. In addition grazing and browsing is an
important endogenous disturbance maintaining floristic diversity.
1.6.1. Fire
Fire Regime
Exogenous disturbance of sclerophyllous vegetation by fire is an integral part of the dynamics
altering, influencing and maintaining community composition and landscape patterning. Most fires
occur during summer in the West Coast foreland (Kruger 1979a, 1979c). Research on the response
of renosterveld vegetation following fire, and data on fuel properties is considerably lacking (van
Wilgen 1987). The natural frequency of fire cycles in renosterveld vegetation is undefined but is
assumed to be of a shorter fire cycle than fynbos, owing to its inherent resilience and dominant
species with short maturation times (Boucher 1983). Fire is prevalent during hot dry summers and
is facilitated by secondary compounds in sclerophyllous leaves (e.g. volatile oils). Levyns (1935a,
1956) confirmed "burning acts as a stimulus to germination [“sic”] compared to a brush-cut plot",
by fluctuating the temperature experienced by stored seed. Equally important is the understanding
of a dependency on a seed bank, with natural fluctuations in size (Cowling et al. 1987), by annuals
and re-seeding forbs and shrubs. Both browsing and grazing are major selective forces in life
history selection in species, similar to fire, which also influence the structure and composition of
renosterveld. Fires attract grazers to new plant growth (Bond and van Wilgen 1996) and in
grasslands too frequent fires disperse grazers and decrease prostrate “lawn” grasses, whilst a less
frequent fire-cycle maintains grazers at “lawns” thus ensuring their persistence (Archibald et al.
2005) relative to bunch grasses. A fire-severity study on the Cape Peninsula (Euston-Brown et al.
2002) showed that vegetation diversity on granite and Quaternary sands, was worst affected by high
alien plant densities, than rocky and phreatic sites. Although not strictly renosterveld this does
indicate the preference of some alien plant taxa for those soil types, and an equally disturbing
finding is that severe fires where alien plant densities were high pre-fire, caused a loss of major
plant functional groups (Euston-Brown et al. 2002).
14
In contradiction to earlier studies, the historical variability of the fire regime in California is
unaltered by fire suppression efforts, as large wild fires over the landscape still occur. The “natural”
fire regime was considered to be small-scale fragmentary fires thus preventing landscape scale
burns (Keeley 2002b, Keeley and Fotheringham 2003); however this is not the case and more large
scale and widespread fires were probably important. This has implications for the concept of the
natural fire regime of renosterveld, whereby both small- and landscape scale fires contribute to
overall stand age heterogeneity.
Fire and Herbivory
Southern Africa has been populated by humans since at least 100 000 years ago (Deacon 1983), and
probably since the Middle Stone-Age to at least the Late Stone-Age the inhabitants of the Cape
region were able to make fire with stick rubbing techniques. Similarly the Californian region has
experienced the use of fire by local inhabitants (Keeley 2002a), both past and present, to access
resources in dense shrublands by type conversions to grasslands or a mixture thereof. Deacon
(1983) made a distinction between hunter-gatherers using fire to stimulate grass growth to capture
selective browsers in fynbos environments; and nomadic herders (since 2000 BP) who burnt areas
to stimulate growth for heavy grazing of a short duration. The former would have occurred in
smaller groups in oligotrophic environments whilst the latter were present on the nutrient-rich
coastal forelands. Before the interglacial period the coastal foreland was larger in extent with large
herbivore populations from which hunter-gatherers could live. The use of fire to stimulate clonal
geophyte production (Watsonia and Hypoxis) was evident in archaeological remains. The use of fire
contributed to the vegetation patterns on a small scale, no doubt influencing local heterogeneity and
the landscape scale patterning. Deacon (1983) mentions that during the more favourable interglacial
periods human density was higher and use of fire would have been more significant in influencing
vegetation patterns. The use of fire was rapidly adopted by settlers farming at the Cape, and the
frequency of burning increased (Botha 1924). However too frequent burning coupled with
overgrazing tends to reverse the desired effect for sedentary farmers, leading to dominance by
shrubs.
Since the arrival of colonists in Chile, the matorral vegetation experienced a new fire regime
(exponentially increasing in frequency); consequently grazing combined with frequent fires leads to
a sparsely dominated Acacia caven anthropogenic community (Armesto et al. 1995). Although
Holmgren et al. (2000) found that fire did not influence the abundance of herbs, rather the presence
of introduced plant taxa and small mammals coupled with low nutrient status (altered by
15
anthropogenic disturbances) was the main reducing effect on native herbs which prefer the cover of
shrubs in matorral.
Post-fire Succession
Renosterveld is similar to lowland fynbos in that geophyte richness does not decline with an
advance of post-fire succession (B.A. Walton, personal observation). Hoffman et al. (1987)
distinguished that major difference between lowland fynbos and mountain fynbos (which generally
has more geophytes and annuals immediately following fire). Another difference found between
lowland and mountain fynbos was that an increase in species richness occurred with an increase in
vegetation cover in the former. Renosterveld diversity patterns seem to be maintained by fire to
change overall tall-canopy dominance. Post-fire renosterveld vegetation is initially dominated by a
ground stratum of an herbaceous flora (therophytes, geophytes and hemicryptophytes). Dwarf
shrubs and shrubs (often forming two strata) follow the ground stratum.
Adamson (1938) stated that “very frequent fires result in the establishment of a low bush
community which is not layered”, suggesting that over-burning could reduce one or another stratum
of the community (for example the dwarf shrub or forb component). Burchell (1811 sec. Boucher
1980) mentioned that renosterbos was becoming more abundant than other shrubs and grasses, due
to cultivation, untimely burning and overgrazing. Many of the species occurring in WCR are
resprouters (Levyns 1929b, Boucher 1981) and are stimulated to regenerate after fire, such as
geophytes, graminoids and some shrubs, as well as bush-clump resprouting species of the genera:
Euclea, Olea or Rhus. Clearly WCR is well adapted to fire-cycles, as 27% of species are resprouters
and 22% of species are geophytes from the collected sample by Boucher (1981). Owing to the large
geophytic component, the evidence of a response to fire is clear, as the below-ground perenniating
organs escape natural wild fires. A small pilot study in WCR at Elandsberg Private Nature Reserve
(hereafter denoted as Elandsberg) in the Wellington District, also showed most species richness at a
burnt site relative to an un-burnt site (B.A. Walton, unpublished data). From many field
observations it seems that fire facilitates temporal niche apportionment of species. Temporal
changes in availability of a habitat by fire allows for the relatively high species richness at the scale
of 1 m2 to 0.1 ha.
Characteristically following fire, as in fynbos, the ground stratum is rapidly dominated by
resprouting (or flowering, Michell 1922, Levyns 1924) geophytes and hemicryptophytes, open
space allows therophytes to germinate with sufficient moisture availability. Verboom et al. (2002)
measured a positive response of flowering in the geophyte Ehrharta capensis to the addition of
16
nutrients and clipping (to simulate fire or grazing) without depletion of the storage organ. This post-
fire persistence and immediate blooming of species is evidence that fire has influenced the Cape
flora over a long ecological time period by creating this niche which is occupied by a large
component of the flora (Goldblatt and Manning 2002). The availability of light (Michell 1922), free
nutrients and other stimuli following fire is plausibly a causal mechanism eliciting flowering en
masse in otherwise uneven flowering within populations. The shrub component follows either soon
after a fire or a year (or few) later, for example the seeders: Hermannia alnifolia, H. scabra and
Printzia polifolia; the resprouters: Anthospermum decumbens, A. spathulatum, Helichrysum
teretifolium, Phylica strigulosa (B.A. Walton, unpublished data), Phylica plumosa var. horizontalis
(with a stout rootstock from which to resprout from; Pillans 1942) and Stoebe plumosa.
Elytropappus rhinocerotis seed is produced in winter and germination rates are higher after a years
dormancy, declining after the fourth year (Levyns 1929a), and are stimulated by fire (Levyns 1927,
1929b). Brush-cutting did not elicit the same response as fire in stimulating renosterbos germination
(Levyns 1929b, 1935b), but only increased the hemicryptophyte component eventually selecting for
those growth forms resulting in structural degradation (see Boucher 1995). Renosterbos produces
copious numbers of seed that are extremely light with a feathery pappus easily dispersed by wind.
Seedlings are moisture-sensitive (Levyns 1927), thus a protracted germination trait ensures the
seedling emergence is successful (seedlings emerge for many weeks, Levyns 1935a). Levyns
(1935b) intelligibly noted the difference in the more rapid return of renosterbos dominance in
Stellenbosch renosterveld and a longer succession in Riversdale renosterveld - attributing the
difference to damp winter months in the former. Once the renosterbos has developed a deep tap root
(see Scott and van Breda 1937) it can withstand a variety of temperature and moisture fluctuations
and is the prime reason for its successful dominance (although roots are shallower in shallow or
moister soils). Also noteworthy is the rapid emergence either by seed or resprouting of nitrogen-
fixing species from the genus Aspalathus. It appears that after a fire (in the absence of herbivores) a
whole suite of palatable shrubs is able to germinate from seed and rapidly grow into dense stands,
for example Hermannia alnifolia and H. scabra (B.A. Walton, personal observation). These species
could experience the effects of overcrowding (or self-thinning) as discovered in some proteoids
(Bond et al. 1995). Another possibility is that the overtopping (sensu Campbell and van der Meulen
1980) or an overstorey effect (see Vlok and Yeaton 1999), of dominant Elytropappus rhinocerotis
or Athanasia trifurcata, influences differences in species richness between mature and post-fire
stands. Quite opposite to these latter references would be the role of facilitation by mother plants of
the aforementioned dominant species. Renosterbos seedlings are intolerant of shading by a dense
canopy (Levyns 1927, 1929a) and will usually germinate in open spaces, also in the absence of fire.
17
Thus the post-fire succession of renosterveld is similar to that occurring in fynbos with an initial
dominance by annuals, geophytes and hemicryptophytes, with a seral development into domination
by either a few or many shrub species. Shrub domination by one or two species appears to be an
interaction between this growth form only - thus all other growth forms are unaffected by it - or
benefit from the canopy structure.
The “climax” stage does not imply there is an exclusion of species, rather it appears that
Elytropappus rhinocerotis has a facilitative role as a nursery or refuge site protecting geophytes,
forbs, hemicryptophytes and dwarf shrubs from exposure or grazing and trampling. This process of
facilitation in renosterveld could be due to: photoperiodic requirements of other species, moisture
retention (and increased infiltration) by the pedoderm (with associated worm, moss and lichen
activity), protection from grazers and as structural support for lianellas. On old fields species
richness seems clustered around Elytropappus rhinocerotis. Feral pigs (Sus scrofa) unfortunately
take advantage of this occurrence, proceeding to scour geophytes clustered around the base of
Elytropappus rhinocerotis, often uprooting shrubs in the process (B.A. Walton, personal
observation). Thus feral pigs have revealed this facilitative process, albeit retarding recovery on to
old fields!
Californian shrublands are composed of dominant sclerophyllous fire-adapted plants that are:
resprouters, reseeders or a combination of these strategies (Moritz 2003). Community composition
changes with topographical, edaphic and pyrogenic factors (Moritz 2003). A study of post-fire
succession in Californian chaparral (Guo 2001) identified temporal changes in the species diversity,
density, cover and biomass between different life-forms and plant functional types. Initially annuals
(with the highest turnover rate), suffrutescent herbs and resprouters dominate the post-fire
community, and then over a few years shrubs begin to dominate in cover, replacing the temporary
post-fire floral diversity (Keeley 2000). Quite logically, resprouters (having the least temporal
variation in species composition) are quick to recover after fire and contribute a larger total biomass
relative to reseeding shrubs. Reproduction in a chaparral geophyte Zigadenus fremontii occurs
shortly after a fire although inter-fire intervals maintain growth and carbohydrate storage (Tyler and
Borchert 2002). With the increase in biomass and cover of woody shrubs a few years following fire,
species richness of “fire-annuals” tends to decline noticeably (Guo 2001, Keeley 2000). This is in
contrast to mountain fynbos communities which are consistently species rich throughout
succession. Post-fire succession in fynbos shows a gradual decrease in species richness, but overall
the species richness, immediately following fire and long after a fire, shows little difference. Thus
the “initial floristic composition” model of succession proposed by Egler (1954) is applicable to
18
fynbos as all, or most, species are present at a site following fire. Post-fire succession at a lowland
fynbos site (Hoffman et al. 1987) showed highest species richness five years after a fire rather than
12-19 years after a fire, similar to chaparral.
Successional patterns may change in the presence of exotic grasses and forbs that out-compete
shrub seedlings creating a “new” fire regime in fire-adapted vegetation. Fire disturbance has formed
a complex mosaic within grasslands; in addition, frequent fires cause a replacement of scrub by
annual grassland (Keeley 1984) effectively converting a more stable scrub or grassland state into an
annual fire regime. Coastal sage scrub is recently endangered due to human development as an
anthropogenically altered fire regime, can result in “type conversion” into grassland (Keeley 1990).
Similarly exotic grasses and forbs are abundant when oxidant levels and nitrogen deposition is high
(as in old fields), especially so if linked to an increased fire frequency (Giessow and Zedler 1996).
Coastal sage scrub sites following fire in the first year are dominated by resprouting shrubs (three
quarters of the shrub species) and herbs (including resprouting grasses), the latter comprising up to
three quarters of total species. Post-fire seedling recruitment occurs more abundantly after the
second year in coastal sage scrub, and pyrophytic endemics start to decline in abundance (as in
chaparral-which share many species). Interestingly two recruitment modes occur in chaparral: one
being disturbance dependent (for most species-both facultative and obligate seeders) and the other
disturbance independent (a few species which are obligate-resprouters and recruit seedlings in shade
of mature stands) (Keeley 1998, 2000). The major difference between coastal sage scrub and
chaparral is; in the absence of fire perennial herbaceous seedlings are recruited in the former at any
time-forming uneven aged stands (Keeley 1984), unlike the typical post-fire annual flora in
chaparral.
Coastal sage scrub is similar to renosterveld in that species have a smaller stature with faster growth
rates and light wind-dispersed seeds. The resilience of coastal sage scrub was modelled (Westman
and O’Leary 1986) in relation to differing intensities and frequencies of disturbance dependent on
constituent component strategies.
1.6.2. Biotic Influence
Ungulates
In the natural renosterveld plant community much grazing occurs. In the pre-colonial era, the
coastal forelands supported many species of large herbivorous vertebrates (Skead 1980). This
19
natural component of the landscape is sadly gone, hunted out by 1700 (Rebelo 1995). Presently
indigenous herbivore (game) farmers are breeding certain species, and knowledge of vegetation
condition and a suitable stocking density for farms is vital to sustain an ecosystem. The effect of
herbivory is known to influence species composition, structure and dynamics in the CFR (Johnson
1992), whereby nitrogen-fixing plants such as Aspalathus possess spines amidst low leaf nitrogen
levels of the majority of fynbos species. Campbell (1986) found that stem spinescence is more
prevalent in non-fynbos shrublands with nutrient rich soils than in fynbos (with oligotrophic soils),
attributed to larger leaf sizes and higher nutritive values of the former. Thus thicket and
renosterveld ecosystems on more nutrient-rich soils show higher levels of herbivory, which
suggests that nutrient availability has a pronounced effect on structure and function at all levels
within the ecosystem. For the purposes of plant diversity conservation, focus is now given on the
impacts of other biota and ecological processes conserved in- and outside reserves (Boshoff et al.
2001). Specifically medium and large sized mammals, which may ameliorate or inhibit certain life-
forms in different seres, have been considered for effective conservation management. Herbivores
are known to prefer old fields or natural (self-maintained) grazing “lawns”. Grazing on these
“lawns” is easier and possibly stimulates tussock growth, whilst the common Cynodon dactylon
sends out more stolons in response to grazing pressure.
Jones (1986) noted in a study at the Jan Briers Louw Reserve (formerly Eensaamheid Reserve and
hereafter referred to as JBL) that brush-cutting, grazing (by sheep and cattle) in a reserve extension
(20 ha) resulted in less Themeda triandra than in the reserve (8 ha, infrequently grazed by cattle,
with more species than the extension). Savory (1986) noted at JBL that the grazed reserve extension
area had higher cover abundances than the ungrazed reserve, noting a difference in life-form
groups, whilst Scott (1986) mentioned that the species richness was higher in the grazed extension.
A small project at Elandsberg (Stander 1988) measured the effects of grazing and found that species
richness and community structure was not significantly different between grazed and ungrazed
areas, but pointed out that grazed sites had more prostrate and bushy growth forms and higher
cover-abundances, with less prostrate growth and cover on non-grazed sites. Heydenrych (1995)
says "overgrazing, or grazing at the wrong time of year and habitat fragmentation for cultivation
will lead to the decline of natural flora".
Shrub seedling recruitment in the absence of fire occurs in the semi-arid southern Californian
coastal sage scrub-grassland mosaic (DeSimone 1999). In the northern Californian grassland the
evergreen shrub Baccharis pilularis becomes invasive with herbivory suggesting that grazing can
give shrubs a competitive advantage over grasses. In renosterveld a similar process may occur,
20
whereby grazing pressure may facilitate shrub colonization, by reducing the cover of grasses and
forbs. This process would be contrary to the popular belief that mammal-maintained grassy areas
would cause a persistence of the grassy component. In the mediterranean vegetation of Israel,
grazing caused a significantly greater density of geophytes than non-grazed paired sites, and this
positive effect was less in low productivity sites (Noy-Meir and Oron 2001).
Other Vertebrates
The high richness and abundance of geophytes in renosterveld is apparent in the field. Geophytes
such as Micranthus junceus show an adaptation to dispersal by mole rats (Georychus capensis,
Lovegrove and Jarvis 1986) producing side cormlets as well as in Gladiolus alatus (B. A. Walton,
personal observation) and leaf bulbils (Sparaxis bulbifera; B. A. Walton, personal observation).
Aardvarks (Orycteropus afer) occur in renosterveld, eating both ants and termites (Taylor et al.
2002). Porcupines (Hystrix africaeaustralis) feed on bulbs and occur amongst (agricultural)
perturbations and being resilient are able to survive through their reproductive plasticity (van Aarde
1998). Frugivorous birds are responsible for the dispersal of some bush-clump species like; Rhus
species, Gymnosporia buxifolia, Putterlickia pyracantha, and therefore contribute to environmental
heterogeneity in renosterveld Also bush-clump species often possess defence strategies for
herbivory (spinescence) (Knight et al. 1989), especially so in nutrient-rich environments (Campbell
1986). Aardvarks, foxes and other insectivores in turn inhabit clumps of olive trees (Olea europaea
subsp. africana) or clumps of Maytenus acutifolia, Rhus and Salvia species, often associated with
heuweltjies.
The author has seen the following species eaten at Elandsberg by porcupines and mole rats;
Babiana angustifolia, Cyanella hyacinthoides, Micranthus tubulosus, Moraea lewisiae, Moraea
villosa, Ornithogalum thyrsoides, and Oxalis purpurea. Babiana angustifolia occurs in seasonally
inundated areas and sandy soils alongside rivulets in association with Triglochin bulbosa. This
same habitat is also favoured by feral pigs (Sus scrofa), rooting for geophytes, possibly competing
directly with indigenous small mammals, even disturbing nesting snakes. Feral pigs forage for
geophytes intensely during the wet period when the ground is soft and easy to dig, thus the wetter
sites are utilized the most throughout the season until hard and dry (B. A. Walton, personal
observation), similar to the behaviour of the porcupine see Bragg 2003).
WCR communities almost support the entire population of the endemic and rare geometric tortoise
Psammobates geometricus, with outlier populations in the Berg River Valley. Small conservation
reserves for Psammobates geometricus (Baard and Mouton 1993) have ensured the survival for
21
some remaining patches (Baard 1993). Psammobates geometricus is absent from both strandveld
and sand-plain fynbos with its moisture and food requirements suitably found in renosterveld
(Baard 1995). Some typical food plants of Psammobates geometricus include Babiana angustifolia,
Briza maxima, Cyanella hyacinthoides, Cynodon dactylon, Lachenalia contaminata, Themeda
triandra, Ehrharta calycina, Eragrostis curvula and Pentachistis curvifolia (Balsamo et al. 2004).
Based on personal observations it would appear that Psammobates geometricus actually prefers the
Swartland Alluvium Fynbos habitat than Swartland Shale Renosterveld.
Insects
Activities of harvester termites (Microhodotermes viator) create a regular mosaic formation of
vegetation within fertile soil patches known as termitaria (heuweltjies) with clear differences from
the surrounding matrix. These termites inhabit ancient termitaria, new sites or occur in association
with other termite species such as Angulitermes braunsi, foraging by day or night depending on soil
surface temperature (Coaton and Sheasby 1974). Characteristically forming mounds from frass
deposition, these organisms consume considerable amounts of biomass (both fresh and dry
material) and bring subterranean minerals to the surface. The author has observed harvester termites
(Microhodotermes viator) cutting fresh plant material in the field: Athanasia trifurcata, Babiana
odorata, Cynodon dactylon, Elytropappus rhinocerotis, Eragrostis curvula, Ficinia oligantha,
Plantago coronopus, Moraea galaxia, and Tribolium species. Termites mostly cut grass or sedge
culms and also Elytropappus rhinocerotis (renosterbos) tips leaving them in the open to dry out,
and later transporting them to their nest. Little “piles” of dead plant material often indicate the
nearby presence of a nest! According to A. Milewski (personal communication) there could be a
possible overlap with the hook-lipped Black Rhino (Diceros bicornis) in several of its dietary
choices! Most green geophyte leaves and renosterbos are unpalatable to ruminants. The efficiency
of the harvester termites in collecting fresh and dry plant material may explain why the ground is
often devoid of litter! Termites perform an important role in nutrient cycling, by both collecting
above ground material and concentrating it into piles and then nests, and by transporting minerals to
the surface soil layers. This overall process creates heuweltjies which are more nutrient rich than the
surrounding renosterveld matrix. These nutrient rich termitaria facilitate colonization by
therophytes and certain geophytes (Moraea flaccida). There are clear and significant differences in
on- and off-mound plant assemblages (both species and life-forms), with species benefiting from
higher available nutrients (advantageous for exotic annual grasses and therophytes like Avena
barbata and Bromus pectinatus), effective permeability and frequent disturbances. Termitaria often
lack a shrub cover, or sustain certain shrub species which occur in low densities in the renosterveld
matrix like Lobostemon argenteus or Salvia chamelaeagnea. Termites at a landscape scale create
22
positive small-scale disturbances and in the process produce a dappled effect of landscape
heterogeneity. Around October time termites take to wing leaving their nests in search of new
homes, it is quite a site to witness as swifts or martins are ready making snatching noises in the air
as they literally decimate them.
Ants occur in renosterveld and potentially collect seed of elaiosome-bearing seeds such as Sebaea
species and Polygalaceae (N. Helme personal communication). Oil collecting bees pollinate Diascia
species, Hemimeris racemosa and other oil-producing plants from the Orchidaceae (Corycium
orobanchoides, Pterygodium alatum, P. catholicum; Pauw 2004). In short a myriad chain of
interactions occur in the seemingly mundane renosterveld vegetation.
Burrowing by small and large mammals constantly breaks up the soil surface creating depressions
facilitating establishment of many therophytes and geophytes. Thus the interactions by termites and
small mammals contribute to local species richness by creating small scale disturbances which
facilitate the establishment of pioneer species and biotically dispersed species. However feral pigs
seem to hasten the spread of alien annual grasses and forbs as their digging size is larger than
porcupines (B.A. Walton, personal observation).
1.6.3. Succession
The discussion here of succession relates to that following ploughing. Other types of anthropogenic
disturbances such as hydrological changes to drainage catchments by dam building, soil mining;
and primary succession following rainfall erosion will not be mentioned in the scope of this review.
Models of Succession
I suspect the pattern of shrub dominance in renosterveld reflects a sequence of facilitative and/or
tolerant succession related to fire strategies of plants and niche apportionment by different life-
forms. It might also be determined by the soil nutrient status, enabling a short span towards
maturity of the component species. Guo (2001) noted that different plant groups play different roles
during post-fire succession and that these groups change in terms of their biomass (resource
allocation), cover and diversity with time. After much quantitative research on successionally
induced community compositional changes on old fields there is still no general unified theory able
to predict the pathway and outcome(s) of composition and structure (Kahmen and Poschlod 2004).
In short, secondary succession is determined by local environmental site and propagules variables.

23
Plant communities are complex assemblages of species with an interacting web of processes,
however the sum of its parts does not always equal the whole, and vice versa. Possibly more than
one type of succession process occurs in a landscape depending on the scale of disturbance. The
type of succession is habitat specific, such as in: alluvial plains, wetlands, mesic/xeric, or elevated
sites. Whittaker (1974) described a “climax pattern” hypothesis where environmental gradients
determine local climaxes and species are independent and “shared” by communities in a “steady
state climax”, thus a departure from a climax state determined by climate alone. The sequence of
arrival and initial composition of species also determine the subsequent assemblage dynamics as
well as the sequence of disturbances types themselves (Fukami 2001).
Connell and Slatyer’s (1977) mechanistic models of succession, namely: facilitation, tolerance and
inhibition assume that colonizing species have high seed production, an ability to germinate in
disturbed environments, rapid growth and seed dormancy. These equilibrium models assume tight
linkages exist amongst species (West and Yorks 2002), implying that competition and facilitation
induce abiotic changes to the local environment enabling an advancement to a defined climax state
of stability in relation to climate. The facilitation model assumes pioneers are the initial arrivals that
improve conditions for the subsequent arrival of perennial or climax species which later out-
compete them. The tolerance model assumes species are not displaced by competition but rather
niche apportionment allows for co-existence. The inhibition model assumes pioneers-regardless of
strategy-occupy and preclude establishment of later arrivals, i.e. a pre-emptive model without
succession (bar the initial establishments). Non-equilibrium conceptual models include: the lottery
model (sensu Chesson and Warner 1981, Dewi and Chesson 2003) which predicts that community
components are randomly assembled; or the state and transition model (Westoby et al. 1989, West
and Yorks 2002) of stable or unstable states that change slowly or rapidly in response to
endogenous or exogenous disturbances.
Resilience
Lavorel (1999) suggests that resilience of mediterranean vegetation to disturbance is attributable to
evolutionary history. Recovery from disturbances such as fire, grazing and soil disturbances are
rapid and ameliorated by a change in relative abundance of species and efficient regeneration
strategies. There are three ways in which ecological diversity contributes to community resilience,
namely: (1) a shift in abundance of response groups following a disturbance, (2) random lottery
model effects within response groups’ maintaining high species richness and (3) landscape scale
variation (spatio-temporal) of different seres creates a patchy mosaic allowing dispersal between
24
different-aged patches. Resilience is the quantitative property of the speed of recovery of an
ecosystem variables’ return to a stable state (implying equilibrium exists). Resilience thus varies
among ecosystem components and processes, and experimental studies indicate that ecological
diversity tends to increase resilience to disturbance (Lavorel 1999, Guo 2001). Understanding the
recovery pathway following disturbance, is important for research and management. Armesto et al.
(1995) describe causes and mechanisms that influence or determine vegetational change. The three
causes of succession, namely (1) site availability due to disturbance or death, (2) differential
colonization due to life history attributes and location of species (slightly different from the lottery
model) and (3) differential performance of species. In South Africa research is required to contrast
fire resilience strategies of serotinous fynbos shrubs with short dispersal distances (“in-situ
resilience”), as opposed to well dispersed renosterveld shrubs (“resilient by migration”; Cowling et
al. 1987).
Succession after Ploughing
Studies of post-ploughing succession are poorly documented in the Fynbos Biome. Ploughing of the
Swartland occurred rapidly after the arrival of settlers as soon as the fertility of the region was
discovered. From a farming perspective the presence of Anthospermum aethiopicum (Levyns
1935a), Elytropappus rhinocerotis (Levyns 1935a, Scott and van Breda 1937) and Eriocephalus
africanus in stony ground indicated good quality agricultural soils (M. Gregor, personal
communication), which increasingly were broken into with the advent of mechanized farming since
the 1950’s. Dry-land agriculture poses many problems in Australia and South Africa where salinity
levels of the soil and groundwater increase due to the removal of deep-rooted natural vegetation
(see Flügel 1995).
The remaining portions of WCR are comparable in size to remnants of the prairies of North
America, steppes of Russia, the mallee scrub (McDowell and Moll 1992) in the wheatbelt of
southwestern Australia (Dirnbock et al. 2002) - all severely reduced by agriculture. The AGC has a
contiguous viable fragment of WCR forming a continuum with mountain and lowland fynbos. Dale
Parker (1982) mentioned that “it is not yet established how long, if ever, it will take for the
indigenous veld to take over again on abandoned agricultural lands" and stated that “a partial
recovery depending on the area is perhaps possible after 25 years". Tiny fragments and patches in a
“sea” of agriculture remaining on hillocks and slopes are unrepresentative of the former range of
WCR on fertile flats (McDowell and Moll 1992). The presence of many Red Data species in
fragments of the flats, indicate the once wider pre-agrarian distributions (McDowell and Moll 1992)
and is a consequence of extensive agricultural clearance” (Hall 1987). Kemper et al. (2000) states
25
that fragmentation increases from east to west (15% and 4% remaining vegetation respectively), as
a consequence of topography where the WCR is an undulating foreland enabling total
transformation unlike the more rolling SCR plain with steep hillsides. Kemper (1997, 1999) showed
that small fragments contain more individuals of certain geophyte species than larger fragments
(Babiana ambigua and Ornithogalum thyrsoides; B. A. Walton, personal observation of
Ornithogalum thyrsoides and Sparaxis bulbifera) and no significant difference in diversity between
small and large patches was found to occur. However this may be an artefact of micro-habitat
preferences of local species in remaining fragments traditionally unsuitable for agriculture, as well
as dense populations of “weedy” species like Ornithogalum thyrsoides (Kemper 1999). This could
indicate that renosterveld vegetation experienced regular disturbances in the past and the floral
component is pre-adapted to survive disturbances (whether fire or browsing). Certain species persist
in small patches over time, in spite of edge effects and even grazing (protected by the formulation
of secondary poisonous compounds like Ornithogalum thyrsoides, especially so if clonal or self-
compatible) and some may well occur naturally in small pockets in specific microhabitats which
could well be marginal habitats for agriculture (for example wetlands and hardpans). Typically in
renosterveld after the destructive effect of ploughing is the colonization of bare ground by many
ruderal species and grasses. Cynodon dactylon rapidly forms a closed mat creating an old field, and
usually occurs on deep rich soils where its roots can penetrate the water table surviving the summer
drought period (Galiano 1985). In addition Cynodon dactylon is a C4 grass able to utilize maximum
solar radiation and grow during summer (shade inhibits growth: Guglielmini and Satorre 2004), and
withstand grazing pressures.
Fish (1988) compared ploughed and unploughed renosterveld vegetation at Elandsberg and
concluded that there was no significant difference in species richness between the two treatments.
Some areas were dominated either by Athanasia trifurcata or Elytropappus rhinocerotis, and that
this “switch in dominance may be related to chance factors such as the season of ploughing (or
burning!). Athanasia trifurcata, Elytropappus rhinocerotis, Hermannia species, Lobostemon
argenteus, Phylica species and a grass taxon were observed as being constant in the field (Fish
1988). McDowell and Moll (1992) mentioned that disturbance by chemical insecticide application,
herbicide application, fertilizer addition and tilling all have an impact on diversity, and their
example of an old field adjacent to the 20 ha Kalabaskraal Nature Reserve (near Malmesbury) has
“been re-colonized by just under one dozen indigenous species”, after 15 years of recovery. The
surrounding land-use (fertilizers and herbicides) affects soil chemistry, possibly excluding some
indigenous species, leading to dominance by alien species (McLaughlin and Mineau 1995). As
early as Thunberg’s time (no doubt earlier) European taxa were observed, transported via wheat
26
seed, for example: Hordeum murinum, Lolium temulentum, Phalaris canariensis, Polygonum
aviculare and Urtica urens as far north as the Karoo (Asbestos Mountains).
Colonization on old fields in Europe follows a certain pattern of continuing species replacement
(Wilcox 1998), also with added disturbances (Debussche et al. 1996). In contrast shrub recovery on
to old fields from natural vegetation is dependent on the location of the propagule source (Lavorel
1999, Degn 2001). Interestingly Wilcox (1998) found that later-colonizing species accelerate
succession, whilst increasing the abundance of annuals will not retard succession. Warren (2000)
experimented with clover (Trifolium repens), a nitrogen-fixer, and suggested that the increase in
nitrogen may facilitate grasses but retard the succession of forbs (grazing was also found to increase
the cover of clover). European annual grasses now dominate Californian prairies that had common
indigenous perennial grasses (Brown and Rice 2000), where Vulpia myuros (zorro fescue) exhibited
a plastic growth response to density and decreased the above ground biomass of perennial grasses
and their survival with an increase in its density. A similar pattern has occurred in western United
States where nutrient additions have converted ecosystems into “old fields” of Centaurea forbs
from the original nitrogen-limited grasslands (LeJeune and Seastedt 2001). Lavorel (1999) suggests
that disturbed sites favour species with high fecundity with associated large soil seed banks. This
biased lottery draw of species frequencies proportional to seed bank frequencies and a potential to
achieve positive growth rates results in species diversity (Lavorel 1999) evidenced in South African
shrublands. In the case of restoration of Californian grasslands or prairies, one has to evaluate
potential sites so that further type-conversions are avoided, i.e. sites dominated by alien annual
grass species may have been former indigenous grasslands or shrublands. Site evaluation of the
substrate in this regard is important, as the perennial bunchgrasses are physiologically limited to
deep soils sustaining their rootstocks. Whereas the persistence through summer as seed by alien
annual grasses can occur on shallow soils (< 25cm) which can be rocky, porous and slightly
alkaline (Keeley 1993).
To summarize briefly it seems that in the absence of an upper stratum component in the vegetation,
species richness is considerably lower. This can be attributed to frequent disturbances by fire
(savanna fire regime simulation) or overgrazing/selective grazing of palatable shrubs. After
ploughing the consequent removal of the seed bank and geophyte bank causes secondary succession
to become a lengthy process relative to natural post-fire succession. Grazing does not seem to be
destructive in unploughed vegetation compared with old fields which are more sensitive to grazing.
27
1.7. Distribution, Typology and Floristics of Renosterveld
Renosterveld has five different variations determined by geographical location occurring on the
coastal forelands, lower slopes and the upland interior (included by Moll and Bossi 1984) in the
southwestern and eastern Cape in the CFR. Included here are the escarpment renosterveld and
outliers in the north western province (Kamiesberg, see Acocks 1953, Rutherford and Westfall
1994, Low and Rebelo 1996), thus broader than the Capensis Region as defined by Taylor (1978) or
Kruger (1978). Contemporary mapping efforts have further included newly delineated renosterveld
vegetation types (Mucina and Rutherford 2004), in these five broad renosterveld types.
Coastal Renosterveld described by Acocks (1953, Veld Type No. 46), comprises two coastal
foreland portions: one western (known as the Swartland) and one eastern (known as the Ruêns) and
an elevated smaller portion at Elgin. The vegetation type formerly referred to as WCR (Rebelo
1996) comprises two Broad Habitat Units defined by Cowling and Heijnis (1999), which are
Boland Renosterveld (BHU 32) and Swartland Renosterveld (BHU 31), and is now (for the most
part) referred to as Swartland Shale Renosterveld (Mucina and Rutherford 2004). Newly described
vegetation types of Swartland Silcrete Renosterveld occur as isolated patches on the West Coast
forelands. Western Silcretes (Mucina and Rutherford 2004) occur on the South Coast forelands. The
small elevated portion originally included by Acocks in Coastal Renosterveld, then included into
South and South West Coast Renosterveld by Rebelo (1996), is now delimited as Elgin Shale
Fynbos (Mucina and Rutherford 2004). South Coast Renosterveld (Rebelo 1996) was assigned to
Central and Eastern Overberg Renosterveld, and Western Overberg Renosterveld BHU’s (Cowling
and Heijnis 1999).
Acocks (1953) Veld Type No. 43 comprises all the elevated inland renosterveld vegetation as
Mountain Renosterveld. Rebelo (1996) split this into three different vegetation types based on
locality: Central Mountain Renosterveld, Escarpment Mountain Renosterveld and North-western
Mountain Renosterveld. Thus Central Mountain Renosterveld is upland renosterveld which occurs
on the Great and Little Karoo basin fringes and westward towards Worcester. The vegetation has an
open to medium-dense canopy, either low or high of Elytropappus rhinocerotis and Pteronia
incana, with scattered emergent trees and large shrubs such as: Acacia karroo, Aloe ferox, Euclea
undulata, and Rhus species. Grazing depresses the grass component; there is also a forb and
succulent component. It is grazed and ploughed for pastures, cereals, fruit orchards and vines.
Rainfall is between 250-400 mm p.a., falling in winter mainly. Escarpment Mountain Renosterveld
(Low and Rebelo 1996) occurs on the Escarpment foothills from Calvinia to Sutherland, then to
28
Beaufort West and the Roggeveld, Koms and Nuweveld Mountains. It is dominated by
Elytropappus species and Relhania genistifolia, and used for stock farming (sheep). Mean annual
precipitation is between 200-300 mm and it falls mainly in winter. North-western Mountain
Renosterveld (Low and Rebelo 1996) occurs in the Kamiesberge Mountains near Leliefontein in
Namaqualand, zonal between fynbos and Succulent Karoo along an aridity gradient. Dominant
species are Elytropappus rhinocerotis, Eriocephalus africanus, Euryops lateriflorus and Nylandtia
spinosa. It is ploughed and grazed, with stock farming, none is formally conserved. Mean annual
precipitation is 250 mm, mostly in winter (with some mists in summer and winter).
Renosterveld communities are exceptionally rich in geophytes (Duthie 1930, Cowling 1983a,
Paterson-Jones 1998) adapted to seasonally dry climates, notably of the families: Asparagaceae,
Iridaceae, Hyacinthaceae, Asphodelaceae, Oxalidaceae (Boucher 1981) as well as Amaryllidaceae,
Geraniaceae and Orchidaceae (Goldblatt and Manning 2002) as well as Anthericaceae and
Colchicaceae. The frequency and diversity of geophytes, according to Kruger (1979), increases with
that of soil fertility, aridity and fire frequency. Geophytic species richness is most pronounced in
WCR extending northward into the succulent Karoo (Procheş et al. 2006), compared with the lower
geophytic richness in SCR where the understorey is predominantly grassy (Paterson-Jones 1998).
Goldblatt (1976) defined an area corresponding to the winter rainfall region of the Fynbos Biome
(and including the Succulent Karoo), which constitute the core of diversity and endemism for the
genus Moraea. Many of these Moraea species are nearing extinction (or are extinct) due to the
plough. Other genera with species near to extinction are Gladiolus watsonius and Oxalis natans.
The flora of the CFR has a low proportion of annuals (6.8%) for a largely semi-arid climate
compared with California (30%) and Chile (16%). This could indicate that the CFR is more resilient
than other mediterranean vegetation types with a predisposition to shrub cover (annuals are most
abundant following disturbance by fires or grazing). Annuals persist in time by producing large
seed outputs and contribute to a seed bank, whereas geophytes invest energy in below ground
organs to retreat from “unfavourable growth periods” (Goldblatt and Manning 2002). Other
speciose plant families that occur in renosterveld are: Asteraceae, Boraginaceae, Fabaceae,
Rhamnaceae, Rosaceae, Rubiaceae and Thymelaeaceae (Goldblatt and Manning 2002). Genera
such as: Gnidia, Helichrysum, Hermannia, Lobostemon, Muraltia, Otholobium and Phylica
commonly occur in the renosterveld matrix.
Goldblatt and Manning (2000) noted that renosterveld shares few species with the adjacent fynbos
vegetation, and consists of many microphyllous asteraceous plants with a dense shrubland and rich
herbaceous flora. Renosterveld shrublands support many grass species (207 species occur in the
29
Fynbos Biome according to Goldblatt and Manning 2000), but is neither a grassland nor a woody
savanna, rather a shrubby continuum from mountainous fynbos shrublands on to nutrient-rich
lowlands, opening wide in places near wetlands or hardpans, alternating with lowland fynbos or
strandveld on oligotrophic and tertiary sands, respectively. SCR has a higher proportion of grasses
than WCR (Acocks 1953). Temperate grass subfamilies are most dominant in renosterveld
compared with tropical grass subfamilies in the Fynbos Biome, and some C4 grasses from the latter
subfamily, like Hyparrhenia hirta and Themeda triandra, can dominate disturbed vegetation of
road verges on shale or granitic soils (Linder 1989). The C3 grasses of the WCR are from the
Arundinoid and Pooid subfamilies (Linder 1989) of the genera: Ehrharta, Eragrostis,
Merxmuellera, Pentachistis and Tribolium with some C4 grasses, such as Cymbopogon marginatus
and Themeda triandra. The Arundinoid subfamily has been further subdivided into the subfamilies:
Arundinoideae and Danthonioideae with the genus Eragrostis in the tribe Eragrostideae of the
subfamily Chloridoideae (Grass Phylogeny Working Group 2001), and Ehrharta in the
Ehrhartoideae (Verboom et al. 2004).
The different and newly described renosterveld vegetation types (Mucina and Rutherford 2004) are
defined according to their particular geology, structure and characteristic species. They are too
numerous to mention here. In short Swartland Shale Renosterveld is typically shrubby whilst
Swartland Alluvium Renosterveld has more open spaces and dominated by dwarf shrubs or
hydrophilic grasses. Swartland Silcrete Renosterveld often has open hard-pan areas with unique
decumbent or dwarf succulents. However even within a vegetation type structural variation exists
between the amount and size of shrubs (and thicket or bush-clump elements) and the grass and
herbaceous (including geophytes) components.
1.8. Conservation Implications
Little remains today of the once vast stretch of natural renosterveld vegetation which occurred on
the West Coast forelands, (known as the Swartland; Meadows 2003), from Somerset West in the
south to Piketberg in the north. Presently there is focus on the last remaining portions of WCR and
SCR of the Fynbos Biome. With the aim to establish and understand the general vegetation patterns
and processes maintaining species richness and abundance, with a view to conserving these
threatened natural ecosystems.
30
High soil fertility and agricultural potential of coastal renosterveld regions (sensu Acocks 1953)
resulted in severe transformation by agriculture for crops like: canola, vines, olives, Eucalyptus (for
bee farming, windrows and woodlots) and grain (barley, rye, oat and wheat) and some forestry
practices as well as artificial pastures (of grasses and herbs). Only 18 000 isolated fragments of
coastal renosterveld remain (von Hase et al. 2003) of varying levels of ecological integrity. Within-
fragment dynamics will ultimately be related to the surrounding matrix types (Jules and Shahani
2003). First Boucher (1981) estimated only 5.76% of WCR remains, then McDowell (1988)
estimated that 3% remains of the original extent of WCR, and only 0.46% is conserved (6648 km2)
(Wood and Low 1998). Reyers et al. (2001) proposed that 9% remains, although Newton and
Knight (2005) identified 6.5% as remaining, similar to the CCU (von Hase et al. 2003) estimate of
5% remaining for Boland, Swartland and Elgin Renosterveld Broad Habitat Units. Similarly the
SCR region is also severely fragmented and first McDowell (1988) mentioned only 18% remains,
then Kemper (1997) mentioned 15% remains, whilst the CCU (von Hase et al. 2003) calculated that
12% remains of Overberg Renosterveld, whereas Reyers et al. (2001) suggests 39% remains of
south and south-west (i.e. including Elgin Renosterveld BHU) coast renosterveld. Mountain
renosterveld is less transformed occurring in distinct portions unfortunately lacking
phytosociological surveys with concomitant descriptions of community types. Reyers et al. (l.c.),
using vegetation types of Low and Rebelo (1996), suggest that mountain renosterveld is almost
entirely intact, where North-Western Mountain Renosterveld has 94%, Escarpment Mountain
Renosterveld has 99% and Central Mountain Renosterveld has 80% remaining, respectively.
Remaining fragments have an irreplaceable conservation value (sensu Pressey et al. 1994, Ferrier et
al. 2000) as mapped by CAPE (Cowling et al. 1999, Young and Fowkes 2003) to achieve
conservation targets (Cowling and Heijnis 2001, Cowling et al. 2003) and a high richness of
endemic geophytes (Goldblatt and Manning 2002). Preceding agriculture, the pastoral Khoe-Kheon
grazed their cattle and sheep in lowland vegetation (renosterveld) (Deacon 1983), and herbivores
are still grazing renosterveld as additional feed on some farms. South Africa’s demand for housing,
road widening/alteration, occasional brick-making and surface sand mining (B. A. Walton, personal
observation) and alien plant invasions further threaten remaining fragments. As a consequence of
fragmentation (or severe attrition in the case of coastal renosterveld), a simple rule of geometry
applies: that the perimeter length of a patch changes as a linear function, whilst the area changes as
a square function (Hunter 1996). The smaller a patch becomes the more area is exposed as an edge,
and corresponding edge effects are more prevalent. Fragment size and degree of isolation from the
“mainland” determine species diversity and ultimately the population viability (Donaldson 2002).
31
The challenge for conservation is that there is scant baseline information on renosterveld vegetation
composition and responses to disturbances, to enable effective management decisions concerning
land use. The cessation of ploughing on set-aside schemes, nature reserves or fallow land allowed
for this study of old field succession. The Departments of Botany and Zoology, and Conservation
Ecology at Stellenbosch University undertook research projects into various ecological aspects of
renosterveld. For example at Elandsberg: Shiponeni (2003) studied seed dispersal syndromes, van
Rooyen (2003) studied the extent of alien grass penetration into renosterveld, Midoko-Iponga
(2004) studied competition by Cynodon dactylon and herbivory on selected shrub species, with
disturbance treatments, Farley (in prep.) studied habitat preferences of herbivores at Elandsberg (all
in WCR) and Raitt (2005) studied renosterveld in relation to management and grazing in the
Heidelberg District. Luyt (2005) studied the habitat preference of bontebok in the Bontebok
National Park in the Swellendam District, while Winter (2003) investigated land user willingness to
conserve SCR fragments in the Overberg. Similarly, studies by Conservation Farming (SANBI)
investigated renosterveld in the Nieuwoudtville area (Bragg 2003).
A concerted effort was made by the Botanical Society’s Cape Conservation Unit (CCU) to compile
a map of remaining fragments of WCR and SCR, with species checklists. This included all lowlying
areas instead of only the higher slopes surrounding hills and mountains (see Tansley 1982). GIS
data were prepared by Ian Newton (UWC) and the CCU in conjunction with ground surveying by
Nick Helme to ascertain fragment condition, i.e. whether agricultural fields, old fields or
renosterveld. Another objective of the CCU was to designate priority pilot areas to implement
conservation partnerships with land users via the CapeNature (formerly Western Cape Nature
Conservation Board) conservation stewardship project. The study area of this project coincided
within the Agter-Groeneberg pilot site. Contemporary conservators and land users are therefore able
to apply research guidelines within their daily operational activities. Understanding and interpreting
ecosystem patterns operating in renosterveld, at a local and landscape scale are important to
conservation. Information on vegetation dynamics at a fine scale in relation to disturbances such as
fire, grazing or ploughing are necessary for an holistic overview of renosterveld ecosystem patterns
and processes. This project interprets small-scale vegetation patterns in nature to facilitate
conservation of this highly fragmented vegetation type. Finally implementation of relevant
environmental policies coupled with empirical findings and adaptive management will be the key
and litmus-test in deciding the future fate of renosterveld.
32
1.9. References
Acocks JPH (1953) Veld Types of South Africa (1st edn). Botanical Survey Memoir No. 28.
Department of Agriculture: Division of Botany, the Government Printer, Pretoria, pp 1-192
Acocks JPH (1988) Veld Types of South Africa (3rd edn). Memoirs of the Botanical Survey of
South Africa 57. Botanical Research Institute, Pretoria. ISBN 0-621-11394-8
Adamson RS (1938) The vegetation of South Africa. Monographs of the British Empire Vegetation:
92-97. London
Anonymous (1990) 3318 Cape Town: 1:250 000 Geological Series.Government Printer, Pretoria
Anonymous (1991) 3320 Ladismith: 1:250 000 Geological Series. Government Printer, Pretoria
Anonymous (1997) 3319 Worcester: 1:250 000 Geological Series. Government Printer, Pretoria
Archibald S, Bond WJ, Stock WD, Fairbanks DHK (2005) Shaping the landscape: Fire-grazer
interactions in an African savanna. Ecological Applications 15: 96-109
Armesto JJ, Vidiella PE, Jimenez HE (1995) Evaluating causes and mechanisms of succession in
the Mediterranean regions of Chile and California. In: Arroyo MTK, Zedler PH, Fox MD (eds)
Ecology and Biogeography of Mediterranean Ecosystems in Chile, California, and Australia.
Ecological Studies 108. Springer-Verlag, New York, pp 418-434. ISBN 0-387-94266-1
Axelrod DI (1977) Outline history of California vegetation. In: Barbour MG, Major J (eds)
Terrestrial Vegetation of California. John Wiley and Sons, New York, pp 139-220. ISBN
0471565369
Baard EHW (1993) Distribution and status of the geometric tortoise Psammobates geometricus in
South Africa. Biological Conservation 63: 235-239
Baard EHW, Mouton P Le FN (1993) A hypothesis explaining the enigmatic distribution of the
geometric tortoise, Psammobates geometricus, in South Africa. Herpetological Journal 3: 65-67
Balsamo RA, Hofmeyr MD, Henen BT, Bauer AM (2004) Leaf biomechanics as a potential tool to
predict feeding preferences of the geometric tortoise Psammobates geometricus. African
Zoology 39: 175-181
Bartolome JW (1989) Proceedings of Man and the Biosphere Symposium, Landscape Ecology,
Study of Mediterranean grazed ecosystems. Nice, France
Bond P, Goldblatt P (1984) Plants of the Cape Flora: A descriptive catalogue. Journal of the South
African Botany, Supplementary Volume No. 13. National Botanic Gardens, Kirstenbosch,
Claremont. ISBN 0-620-07668-2

33
Bond WJ, Maze K, Desmet P (1995) Fire life histories and the seeds of chaos. Ecoscience 2: 252-
260
Bond WJ, van Wilgen BW (1996) Fire and plants. Population and community biology series 14.
Chapman & Hall, London, UK, pp 1-263. ISBN 0-412-47540-5
Boshoff AF, Kerley GIH, Cowling RM (2001) A pragmatic approach to estimating the distributions
and spatial requirements of the medium- to large-sized mammals in the Cape Floristic Region,
South Africa. Diversity and Distributions 7: 29-43
Botha CG (1924) Note on early veld burning in the Cape Colony. South African Journal of Science
21: 351-352
Boucher C (1980) Notes on the use of the term "Renosterveld". Bothalia 13: 237
Boucher C (1981) Floristic and structural features of the coastal foreland vegetation south of the
Berg River, Western Cape Province, South Africa. In: Moll EJ (ed) Proceedings of a symposium
on coastal Lowlands of the Western Cape. University of the Western Cape, Cape Town, pp 21-
26
Boucher C, Moll EJ (1981) South African mediterranean shrublands. In: Di Castri F, Goodall DW
and Specht RL (eds) Ecosystems of the world, Vol. 11, Mediterranean Type Shrublands. Elsevier
Scientific Publishing Company, Amsterdam, pp 233-248. ISBN 0-444-41858-X
Boucher C (1983) Floristic and structural features of the coastal foreland vegetation south of the
Berg River, western Cape Province, South Africa. Bothalia 14: 669-674
Boucher C (1987) A phytosociological study of transects through the Western Cape Coastal
Foreland, South Africa. PhD Thesis, University of Stellenbosch
Boucher C (1995) Overview on management of renosterveld. In: Low AB, Jones FE (eds) The
sustainable use and management of renosterveld remnants in the Cape Floristic Region.
Proceedings of a Symposium. FCC Report 1995/4. Flora Conservation Committee, Botanical
Society of South Africa, Kirstenbosch, pp 47-50. ISBN 1-874999-07-4
Bradlow FR (1994) Francis Masson’s account of three journeys at the Cape of Good Hope 1772-
1775: with introduction and annotations. Tablecloth Press, Cape Town. ISBN 0-620-18571-6
Bragg C (2003) Cape porcupine density, burrow distribution and space use in a geophyte-diverse
semi-arid environment. MSc Thesis, University of Cape Town, Rondebosch
Brown CS, Rice KJ (2000) The Mark of Zorro: Effects of the Exotic Annual Grass Vulpia myuros
on California Native Perennial Grasses. Restoration Ecology 8: 10-17
Burchell WJ (1822) Travels in the Interior of Southern Africa Volume 1. Longman, Hurst, Rees,
Orme and Brown, Paternoster-Row
Campbell BM, van der Meulen F (1980) Patterns of plant species diversity in fynbos vegetation,
South Africa. Vegetatio 43: 43-47

34
Campbell BM (1986) Plant spinescence and herbivory in a nutrient-poor ecosystem. Oikos 47: 168-
172
Chesson PL, Warner RR (1981) Environmental variability promotes coexistence in lottery
competitive systems. American Naturalist 117: 923-943
Clements FE (1928) Plant succession and indicators: A definitive edition of plant succession and
plant indicators. The HW Wilson Company, New York.
Coaton WGH, Sheasby JL (1974) National survey of the Isoptera of Southern Africa 6. The genus
Microhodotermes Sjöstedt (Hodotermitidae). Cimbebasia A 3: 47-59
Cohen C (1935) Stoebe sp.: A contribution to its ecology. The Journal of South African Botany 1:
171-175
Collins SL, Steinauer EM (1998) Disturbance, diversity and species interactions in Tallgrass
Prairie. In: Knapp AK, Briggs JM, Hartnett DC, Collins SL (eds) Grassland Dynamics: Long-
Term Ecological Research in Tallgrass Prairie. Oxford University Press, New York. ISBN 0-19-
511486-8
Connell JH, Slatyer RO (1977) Mechanisms of succession in natural communities and their role in
community stability and organization. American Naturalist 111: 1119-1144
Cowling RM (1983a) Diversity relations in Cape shrublands and other vegetation in the
southeastern Cape, South Africa. Vegetatio 54: 103-127
Cowling RM (1983b) The occurrence of C3 and C4 grasses in fynbos and allied shrublands in the
South Eastern Cape, South Africa. Oecologia 58: 121-127
Cowling RM (1984) A syntaxonomic and synecological study in the Humansdorp region of the
Fynbos Biome. Bothalia 15: 175-227
Cowling RM, Campbell BM (1984) Beta diversity along fynbos and non-fynbos coenoclines in the
lower Gamtoos River Valley, south-eastern Cape. South African Journal of Botany 3: 187-189
Cowling RM, Pierce SM, Moll EJ (1986) Conservation and Utilization of South Coast
Renosterveld, an endangered South African Vegetation Type. Biological Conservation 37: 363-
377
Cowling RM, Le Maitre DC, McKenzie B, Prys-Jones RP, van Wilgen BW (1987) Disturbance and
the dynamics of fynbos biome communities. South African National Scientific Programmes
Report No. 135. Council for Scientific and Industrial Research, Pretoria, pp 1-135. ISBN 0-
7988-3832-9
Cowling RM, Holmes PM (1992) Flora and vegetation. In: Cowling RM (ed) The Ecology of
Fynbos: nutrients fire and diversity. Oxford University Press, Southern Africa, Cape Town.
ISBN 0-19-570661-7
35
Cowling RM, Rundel PW, Lamont BB, Arroyo MK, Arianoutsou M (1996) Plant diversity in
mediterranean-climate regions. Trends in Ecology and Evolution 11: 362-366
Cowling RM, Pressey RL, Lombard AT, Heijnis CE, Richardson DM, Cole N (1999) Framework
for a conservation plan for the Cape Floristic Region. Institute for Plant Conservation Report
9902, University of Cape Town, Rondebosch
Cowling RM, Heijnis CE (2001) The identification of Broad Habitat Units as biodiversity entities
for systematic conservation planning in the Cape Floristic Region. South African Journal of
Botany 67: 15-38
Cowling RM, Lombard AT (2002) Heterogeneity, speciation/extinction history and climate:
explaining regional plant diversity patterns in the Cape Floristic Region. Diversity and
Distributions 8: 163-179
Cowling RM, Pressey RL, Rouget M, Lombard AT (2003) A conservation plan for a global
biodiversity hotspot- The Cape Floristic Region, South Africa. Biological Conservation 112:191-
216
Deacon HJ (1983) The peopling of the Fynbos Region. In: Deacon HJ, Hendey QB, Lambrechts
JJN (eds) Fynbos Palaeoecology: A preliminary synthesis. South African National Scientific
Programmes Report No. 75. Council for Scientific and Industrial Research, Pretoria, pp 183-204.
ISBN 0-7988-2953-2
Debussche M, Escarré J, Lepart J, Houssard C, Lavorel S (1996) Changes in Mediterranean plant
successions: old fields revisited. Journal of Vegetation Science 7: 519-526
DeSimone SA, Zedler PH (1999) Shrub seedling recruitment in unburned Californian Coastal Sage
scrub and adjacent grassland. Ecology 80: 2018-2032.
Degn HJ (2001) Succession from farmland to heathland: a case for conservation of nature and
historic farming methods. Biological Conservation 97: 319-330
Dewi S, Chesson P (2003) The age-structured lottery model. Theoretical Population Biology 64:
331-343
Dirnbock T, Hobbs RJ, Lambeck RJ, Caccetta PA (2002) Vegetation distribution in relation to
topographically driven processes in southwestern Australia. Applied Vegetation Science 5: 147-
158
Dodson JR, Kershaw AP (1995) Evolution and History of Mediterranean Vegetation Types in
Australia. In: Arroyo MTK, Zedler PH, Fox MD (eds) Ecology and Biogeography of
Mediterranean Ecosystems in Chile, California, and Australia. Ecological Studies 108. Springer-
Verlag, New York, pp 418-434. ISBN 0-387-94266-1

36
Donaldson J, Nanni I, Zachariades C, Kemper J (2002) Effects of habitat fragmentation on
Pollinator diversity and plant reproductive success in Renosterveld shrublands of South Africa.
Conservation Biology 16: 1267-1276
du Toit R, du Toit E (1938) Rhenoster bush as a weed. Farming in South Africa, pp 429-430, 445
Duthie AV (1930) List of vascular cryptograms and flowering plants of the Stellenbosch Flats.
Annals of the University of Stellenbosch Volume 8, Section A: 4. Nasionale Pers, Cape Town,
pp 1-52
Egler FE (1954) Vegetation science concepts: 1. Initial floristic composition, a factor in old field
vegetation development. Vegetatio 4: 412-417
Elenga H, Peyron O, Bonnefille R, Jolly D, Cheddadi R, Guiot J, Andrieu V, Bottema S, Buchet G,
de-Beaulieu J-L, Hamilton AC, Maley J, Marchant R, Perez-Obiol R, Reille M, Riollet G, Scott
L, Straka H, Taylor D, Van Campo E, Vincens A, Laarif F, Jonson H (2000) Pollen-based biome
reconstruction for southern Europe and Africa 18 000 yr BP. Journal of Biogeography 27: 621-
634
Enright NJ, Marsula R, Lamont BB, Wissel C (1998) The ecological significance of canopy seed
storage in fire-prone environments: a model for non-sprouting shrubs. Journal of Ecology 86:
946-959
Euston-Brown D, Botha S, Bond WJ (2002) Final Report: Influence of fire severity on post-fire
vegetation recovery on the Cape Peninsula. Unpublished report prepared for the Working for
Water Programme
Farley N (in prep.) Habitat preferences of large herbivores: A comparison between renosterveld and
old fields. MTech Cape Technikon, Cape Town
Ferrier S, Pressey RL, Barrett TW (2000) A new predictor of the irreplaceability of areas for
achieving a conservation goal, its application to real-world planning, and a research agenda for
further refinements. Biological Conservation 93: 303-325
Fish KB (1988) Comparative vegetation study of a ploughed and an unploughed site in a disturbed
Renosterveld community. Botany project (third year), University of Cape Town, Rondebosch, pp
1-9
Flügel W-A (1995) River salination due to Dryland agriculture in the western Cape Province,
Republic of South Africa. Environment International 21: 679-686
Fox MD (1995) Australian Mediterranean Vegetation: Intra- and intercontinental comparisons. In
Arroyo MTK, Zedler PH, Fox MD (eds) Ecology and Biogeography of Mediterranean
Ecosystems in Chile, California and Australia. Ecological Studies Vol. 108: Analysis and
Synthesis. Springer-Verlag, New York, pp 137-159. ISBN 0-387-94266-1
Fukami T (2001) Sequence effects of disturbance on community structure. Oikos 92: 215-224
37
Galiano EF (1985) The small-scale pattern of Cynodon dactylon in Mediterranean pastures.
Vegetatio 63: 121-127
Giessow J, Zedler P (1996) The effects of fire frequency and firebreaks on the abundance and
species richness of exotic plant species in coastal sage scrub. California Exotic Pest Plant
Council: Symposium proceedings
Goldblatt P (1976) The genus Moraea in the winter rainfall region of Southern Africa. Annals of
the Missouri Botanical Gardens 63: 657-786
Goldblatt P (1978) An analysis of the flora of southern Africa: its characteristics, relationships and
origins. Annals of the Missouri Botanical Gardens 65: 369-436
Goldblatt P, Manning JC (2000) Cape Plants: A conspectus of the Cape Flora of South Africa.
Strelitzia 9. National Botanic Institute, Kirstenbosch. ISBN 0-620-26236-2
Goldblatt P, Manning JC (2002) Plant Diversity of the Cape Region of Southern Africa. Annals of
the Missouri Botanical Gardens 89: 281-302
Grass Phylogeny Working Group (2001) Phylogeny and subfamilial classification of the grasses
(Poaceae). Annals of the Missouri Botanical Gardens 88: 373-457
Guglielmini AC, Satorre EH (2004) The effect of non-inversion tillage and light availability on
dispersal and spatial growth of Cynodon dactylon. Weed Research 44: 366-374
Guo Q (2001) Early post-fire succession in California chaparral: Changes in diversity, density,
cover and biomass. Ecological Research 16: 471-485
Hall AV (1987) Threatened plants in the fynbos and karoo biomes, South Africa. Biological
Conservation 40: 29-52
Heydenrych B (1995) Wild flowers of the Darling Renosterveld, can they be maintained for future
generations? Veld and Flora: 72-73
Hobbs RJ, Richardson DM, Davis GW (1995) Mediterranean-Type Ecosystems: Opportunities and
constraints for studying the function of biodiversity. In: Davis GW, Richardson DM (eds)
Mediterranean-Type Ecosystems: The function of biodiversity. Springer-Verlag, Berlin, pp 1-42.
ISBN 3-540-57809-9
Hoffman MT, Moll EJ, Boucher C (1987) Post-fire succession at Pella, a South African lowland
fynbos site. South African Journal of Botany 53: 370-374
Holmgren M, Avilés R, Sierralta L, Segura M, Fuentes R (2000) Why have European herbs so
successfully invaded the Chilean matorral? Effects of herbivory, soil nutrients, and fire. Journal
of Arid Environments 44: 197-211
Hunter ML (1996) Fundamentals of Conservation Biology. Blackwell Science, Massachusetts, pp
185-187. ISBN 0-86542-371-7
38
Huston MA (1994) Biological Diversity. The coexistence of species in changing landscapes.
Cambridge University Press, Cambridge
Jones C (1986) Vegetation analysis of the Eensaamheid Reserve and extension. Botany project
(third year), University of Cape Town, Rondebosch
Johnson SD (1992) Plant-animal relationships. In: Cowling RM (ed) The Ecology of Fynbos:
Nutrients, fire and diversity. Oxford University Press, Cape Town, pp 175-205. ISBN 0-19-
570661-7
Jules ES, Shahani P (2003) A broader ecological context to habitat fragmentation: Why matrix
habitat is more important than we thought. Journal of Vegetation Science 14: 459-464
Kahmen S, Poschlod P (2004) Plant functional trait responses to grassland succession over 25
years. Journal of Vegetation Science 15: 21-32
Keeley JE, Keeley SC (1984) Postfire recovery of California Coastal Sage Scrub. American
Midland Naturalist 111: 105-117
Keeley JE (1990) The California Valley Grassland. In: Schoenherr AA (ed) Endangered plant
communities of southern California. Southern California Botanists, Fullerton, Special
Publication No. 3
Keeley JE (1993) Native Grassland Restoration in California: Assessing suitable sites. Restoration
and management notes 11: 2, Winter No. 127: 149-150
Keeley JE (1998) Coupling demography, physiology and evolution in chaparral shrubs. In: Rundel
PW, Montenegro G, Jaksic FM (eds) Landscape degradation and biodiversity in Mediterranean-
Type Ecosystems. Ecological studies 136. Springer-Verlag, Berlin, pp 257-264. ISBN 3-540-
64475-X
Keeley JE (2000) Chaparral. In: Barbour MG, Billings WD (eds) North American Terrestrial
Vegetation. (2nd edn). Cambridge University Press, Cambridge, pp 203-253. ISBN 0-521-
55027-0
Keeley JE (2002a) Native American impacts on fire regimes of the California coastal ranges.
Journal of Biogeography 29: 303-320
Keeley JE (2002b) Fire management of California shrubland landscapes. Environmental
Management 29: 395-408
Keeley JE, Fotheringham CJ (2003) Historical fire regime in Southern California. Fire Management
Today 63: 1. United States Geological Survey
Kemper J (1997) The effects of fragmentation of South Coast Renosterveld on vegetation patterns
and processes. MSc Thesis, University of Cape Town, Rondebosch
39
Kemper J, Cowling RM, Richardson DM (1999) Fragmentation of South African renosterveld
shrublands: effects on plant community structure and conservation implications. Biological
Conservation 90: 103-111
Kemper J, Cowling RM, Richardson DM, Forsyth GG, McKelly DH (2000) Landscape
fragmentation in South Coast Renosterveld, South Africa, in relation to rainfall and topography.
Austral Ecology 25: 179-186
Knight RS, Rebelo AG, Siegfried WR (1989) Plant assemblages on Mima-like earth mounds in the
Clanwilliam district, South Africa. South African Journal of Botany 55: 465-472
Krug RM, Krug CB, Midoko-Iponga D, Walton BA, Milton SJ, Newton IP, Farley N, Shiponeni N
(2004) Reconstructing West Coast Renosterveld: past and present ecological processes in a
Mediterranean shrubland of South Africa. In: Arianoutsou M, Papanastasis VP (eds) Proceedings
10th MEDECOS Conference, Rhodes, Greece. Millpress, Rotterdam, pp 1-12. ISBN 90-5966-
016-1
Kruger FJ (1978) A description of the Fynbos Biome Project. South African National Scientific
Programmes Report 28. Council for Scientific and Industrial Research, Pretoria, pp 1-23. ISBN
0-7988-1335-0
Kruger FJ (1979a) South African Heathlands. In: Specht RL (ed) Ecosystems of the World 9A:
Heathlands and related shrublands: Descriptive studies. Elsevier, Amsterdam, pp 1-17. ISBN 0-
444-41810-5
Kruger FJ (1979b) Plant Ecology. In: Day J, Siegfried WR, Louw GN, Jarman ML (eds) Fynbos
ecology: a preliminary synthesis. South African National Scientific Programmes Report No. 40.
Council for Scientific and Industrial Research, Pretoria, pp 88-126. ISBN 0-7988-1686-4
Kruger FJ (1979c) Fire. In: Day J, Siegfried WR, Louw GN, Jarman ML (eds) Fynbos ecology: a
preliminary synthesis. South African National Scientific Programmes Report No. 40. Council for
Scientific and Industrial Research, Pretoria, pp 43-57. ISBN 0-7988-1686-4
Lavorel S (1999) Ecological diversity and resilience of Mediterranean vegetation to disturbance.
Diversity and Distributions 5: 3-13
LeJeune KD, Seastedt TR (2001) Centaurea species: The forb that won the west. Conservation
Biology 15: 1568-1574
Levyns MR (1924) Some observations on the effects of bush fires on the vegetation of the Cape
Peninsula. South African Journal of Science 21: 346-347
Levyns MR (1927) A preliminary note on the rhenoster bush (Elytropappus rhinocerotis) and the
germination of its seed. Transactions of the Royal Society of South Africa 14: 383-388
Levyns MR (1929a) The problem of the rhenoster bush. South African Journal of Science 16: 166-
169
40
Levyns MR (1929b) Veld-burning experiments at Ida’s Valley, Stellenbosch. Transactions of the
Royal Society of South Africa 17: 61-92
Levyns MR (1935a). Germination in some South African seeds. Journal of South African Botany 1:
161-170
Levyns MR (1935b) Veld-burning experiments at Oakdale, Riversdale. Transactions of the Royal
Society of South Africa 23: 231-243
Levyns MR (1956) Notes on the biology and distribution of the Rhenoster bush. South African
Journal of Science 52:141-143
Linder HP (1989) Grasses in the Cape Floristic Region: Phytogeographical implications. South
African Journal of Science 85: 502-505
Lovegrove BG, Jarvis JUM (1986) Coevolution between mole-rats (Bathyergidae) and a geophyte,
Micranthus (Iridaceae). Cimbebasia A 8: 79-85
Low AB, Rebelo AG (1996) Vegetation of South Africa, Lesotho and Swaziland. Dept.
Environmental Affairs and Tourism, Pretoria, pp 1-85. ISBN 0-621-17316-9
Luyt EC (2005) Habitat preferences and sustainable stocking rates for Bontebok (Damaliscus
dorcas dorcas) in the Bontebok National Park. MSc Thesis, Stellenbosch University
McDowell CR (1988) Factors Affecting the Conservation of Renosterveld by Private Landowners.
PhD Thesis, University of Cape Town, Rondebosch
McDowell CR, Moll EJ (1992) The influence of Agriculture on the decline of West Coast
Renosterveld, South-western Cape, South Africa. Journal of Environmental Management 35:
173–192
McLaughlin A, Mineau P (1995) The impact of agricultural practices on biodiversity. Agriculture,
Ecosystems and Environment 55: 201-212
Michell MR (1922) Some observations on the effects of a bush fire on the vegetation of Signal Hill.
Transactions of the Royal Society of South Africa 10: 213-232
Midoko-Iponga D (2004) Renosterveld Restoration: The role of competition, herbivory and other
disturbances. MSc Thesis, University of Stellenbosch
Moll EJ, Jarman ML (1984a) Clarification of the term fynbos. South African Journal of Science 80:
351-352
Moll EJ, Jarman ML (1984b) Is fynbos a heathland? South African Journal of Science 80: 352-355
Moll EJ, Bossi L (1984) Assessment of the extent of the natural vegetation of the Fynbos Biome of
South Africa. South African Journal of Science 80: 355-358
Moll EJ, Campbell BM, Cowling RM, Bossi L, Jarman ML, Boucher C (1984) A description of
major vegetation categories in and adjacent to the Fynbos Biome. South African National
41
Scientific Programmes Report No. 83. Council for Scientific and Industrial Research, Pretoria,
pp 12-14
Moody A, Meentemeyer RK (2001) Environmental factors influencing spatial patterns of shrub
diversity in chaparral, Santa Ynez Mountains, California. Journal of Vegetation Science 12: 41-
52
Moritz MA (2003) Spatiotemporal analysis of controls on shrubland fire regimes: age dependency
and fire hazard. Ecology 84: 351-361
Mucina L, Rutherford MC (eds) (2004) Vegetation Map of South Africa, Lesotho and Swaziland:
Shapefiles of basic mapping units. Beta version 4.0, February 2004, National Botanical Institute,
Kirstenbosch
Muir J (1929) The vegetation of the Riversdale area, Cape Province. Botanical Survey of South
Africa Memoir No. 13. The Government Printer, Pretoria, pp 1-82
Myers N, Mittermeier RA, Mittermeier CG, da Fonseca GAB, Kent J (2000) Biodiversity hotspots
for conservation priorities. Nature 403: 853-858
Newton IP, Knight R (2004) The matrix: The evolutionary development of coastal renosterveld.
Veld and Flora 90: 162-165
Newton IP, Knight R (2005) The use of Landsat imagery for the identification of the remaining
West Coast Renosterveld fragments, western Cape Province, South Africa. South African
Journal of Botany 71: 67-75
Noy-Meir I, Oron T (2001) Effects of grazing on geophytes in Mediterranean vegetation. Journal of
Vegetation Science 12: 749-760
Ojeda F, Simmons MT, Arroyo J, Maranon T, Cowling RM (2001) Biodiversity in South African
fynbos and Mediterranean heathland. Journal of Vegetation Science 12: 867-874
Paterson-Jones C (1998) Renosterveld’s Floral Treasure: Headed for extinction. Africa-
Environment and Wildlife 6: 27-32
Parker D (1982) The Western Cape Lowlands Fynbos-what is there left to conserve? Veld & Flora
68: 98-101
Parkington J, Cartwright C, Cowling RM, Baxter A, Meadows M (2000) Palaeovegetation at the
last glacial maximum in the western Cape, South Africa: wood charcoal and pollen from Elands
Bay Cave. South African Journal of Science 96: 543-546
Pauw A (2004) Variation in pollination across a fragmented landscape at the Cape of Africa. PhD
Thesis, University of Cape Town, Rondebosch
Pierce SM, Cowling RM (1983) Phenology of fynbos, renosterveld and subtropical thicket in the
south eastern Cape. South African Journal of Botany 3: 1-16
42
Pierce SM (1984) A synthesis of plant phenology in the Fynbos Biome. South African National
Scientific Programmes Report No. 88. Council for Scientific and Industrial Research, Pretoria,
pp 1-57. ISBN 0-7-988-3146-4
Pillans NS (1942) The genus Phylica Linn. Journal of South African Botany 3: 1-164
Pressey RL, Johnson IR, Wilson PD (1994) Shades of irreplaceability: towards a measure of the
contribution of sites to a reservation goal. Biodiversity and Conservation 3: 242-262
Procheş Ş, Cowling RM, Goldblatt P, Manning JC, Snijman DA (2006) An overview of the Cape
geophytes. Biological Journal of the Linnean Society 87: 27-43
Raitt G (2005) Themeda triandra Renosterveld in the Heidelberg District. MSc Thesis, University
of Stellenbosch
Rebelo AG (1995) Renosterveld: conservation and research. In: Low AB, Jones FE (eds) The
sustainable use and management of Renosterveld remnants in the Cape Floristic Region.
Proceedings of a Symposium. Flora Conservation Committee Report 1995/4. Botanical Society
of South Africa, Kirstenbosch, pp 32-42. ISBN 1-874999-07-4
Rebelo AG (1996) West Coast Renosterveld. In: Low AB, Rebelo AG (eds) Vegetation of South
Africa, Lesotho and Swaziland: A companion to the Vegetation Map of South Africa, Lesotho
and Swaziland. Department of Environmental Affairs and Tourism, Pretoria, pp 66. ISBN 0-621-
17316-9
Rebelo AG (1996) South and South-west Coast Renosterveld. In: Low AB, Rebelo AG (eds)
Vegetation of South Africa, Lesotho and Swaziland: A companion to the Vegetation Map of
South Africa, Lesotho and Swaziland. Department of Environmental Affairs and Tourism,
Pretoria, pp 67. ISBN 0-621-17316-9
Reyers B, Fairbanks DHK, Van Jaarsveld AS, Thompson M (2001) Priority areas for the
conservation of South African vegetation: a coarse-filter approach. Diversity and Distributions 7:
79-95
Rice B, Westoby M (1983) Plant species richness at the 0.1 hectare scale in Australian vegetation
compared to other continents. Vegetatio 52: 129-140
Rundel PW (1981) The matorral zone of central Chile. In: di Castri F, Goodall DW, Specht RL
(eds) Mediterranean-type shrublands. Elsevier, Amsterdam, pp 175-201. ISBN 044441858X
Rundel PW (2004) Mediterranean-climate ecosystems: defining there extent and community
dominance. In: Arianoutsou M, Papanastasis VP (eds) Proceedings 10th MEDECOS Conference,
Rhodes, Greece. Millpress, Rotterdam, pp 1-12. ISBN 90-5966-016-1
Rutherford MC, Westfall RH (1994) Biomes of Southern Africa: an objective categorization. (2nd
edn). Memoirs of the Botanical Survey of South Africa 63. National Botanical Institute, Pretoria,
pp 44-48. ISBN 1-874907-24-2
43
Savory J (1986) The effects of overgrazing on the structural-functional composition of West Coast
Renosterveld. Botany project (third year), University of Cape Town, Rondebosch
Sax DF (2002) Native and naturalized plant diversity are positively correlated in scrub communities
of California and Chile. Diversity and Distributions 8: 193-210
Scott JD, van Breda NG (1937) Preliminary studies on the root system of the rhenosterbos
(Elytropappus rhinocerotis) on the Worcester Veld Reserve. South African Journal of Science
33: 560-569
Scott JM (1986) The effects of grazing on the alpha diversity of West Coast Renosterveld at the
farm “Eensaamheid”. Botany project (third year), University of Cape Town, Rondebosch
Scott L, Anderson HM, Anderson JM (1997) Vegetation history. In: Cowling RM, Richardson DM,
Pierce SM (eds) Vegetation of Southern Africa. Cambridge University Press, Cambridge, pp 62-
84. ISBN 0-521-57142-1
Shiponeni NN (2003) Dispersal of seeds as a constraint in revegetation of old fields in Renosterveld
vegetation in the Western Cape, South Africa. MSc Thesis, Stellenbosch University
Skead CJ (1980) Historical mammal incidence in the Cape Province Volume 1: The Western and
Northern Cape. Department of Nature and Environmental Conservation of the Provincial
Administration of the Cape of Good Hope, Cape Town, South Africa. ISBN 0-7984-0106-0
Specht RL (1973) Structure and functional response of ecosystems in the Mediterranean climate of
Australia. In: di Castri F, Mooney HA (eds) Mediterranean Type Ecosystems: Origin and
structure. Springer-Verlag, Berlin, pp 113-120. ISBN 3-540-06106-1
Specht RL (1979) Heathlands and related shrublands of the world. In: Specht RL (ed) Ecosystems
of the World 9A: Heathlands and related shrublands: Descriptive studies. Elsevier, Amsterdam,
pp 1-17. ISBN 0-444-41810-5
Specht RL (1981) Conservation of Australian Heathlands. In: Specht RL (ed) Ecosystems of the
World 9B Heathlands and related shrublands: Analytical studies. Elsevier, Amsterdam, pp 235-
240. ISBN 0-444-41809-1
Specht RL, Moll EJ (1983) Mediterranean-Type Heathlands and Sclerophyllous Shrublands of the
World: An Overview. In: Kruger FJ, Mitchell DT, Jarvis JUM (eds) Mediterranean-Type
Ecosystems. Springer-Verlag, Berlin, pp 41-65. ISBN 3540121587
Stander M (1988) A comparative study of Coastal Renosterveld communities subjected to grazing
by wild game. Botany project (third year), University of Cape Town, Rondebosch
Stock WD, Bond WJ, Le Roux D (1993) Isotope evidence from soil carbon to reconstruct
vegetation history in the south-western Cape Province. South African Journal of Science 89:
153-154
44
Tansley S (1982) Koppie Conservation Project. Wildlife Society of Southern Africa and the South
African Nature Foundation, Rondebosch, pp 1-100
Taylor HC (1978) Capensis. In: Werger MJA (ed) Biogeography and ecology of Southern Africa.
Dr W. Junk, The Hague, pp 171-229. ISBN 90-6193-083-9
Taylor HC (1996) Cederberg vegetation and flora. Strelitzia 3. National Botanic Institute, Pretoria.
ISBN 1-874907-28-5
Taylor WA, Lindsey PA, Skinner JD (2002) The feeding ecology of the aardvark Orycteropus afer.
Journal of Arid Environments 50: 135-152
Thiaw I, Chouchena-Rojas M (1999) Biological diversity of Dryland, Mediterranean, Arid, Semi-
arid, Savanna and Grassland ecosystems (Agenda 4.4). Fourth meeting of the subsidiary body on
scientific, technical and technological advice (Montreal, Canada, 21-25 June). The World
Conservation Union (IUCN)
Tyler C, Borchert M (2002) Reproduction and growth of the chaparral geophyte, Zigadenus
fremontii (Liliaceae), in relation to fire. Plant Ecology 165: 11-20
van Aarde R (1998) An ecological perspective of reproduction in the Cape Porcupine. Transactions
of the Royal Society of South Africa 53: 237-243
van der Walt P (2003) Renosterbosveld. Game and Hunt
van Rensburg WLJ (1962) Die Aandeel van grasse in veldtipes rondom Stellenbosch. MSc Thesis,
Stellenbosch University
Van Rooyen S (2003) Factors affecting alien grass invasion into West Coast Renosterveld
fragments. MSc Thesis, Stellenbosch University
van Wilgen BW (1987) Fire regimes in the Fynbos Biome. In: Cowling RM, Le Maitre DC,
McKenzie B, Prys-Jones RP, van Wilgen BW. (eds) Disturbance and the dynamics of fynbos
biome communities. South African National Scientific Programmes Report No. 135. Council for
Scientific and Industrial Research, Pretoria, pp 6-14. ISBN 0-7988-3832-9
Van Zinderen Bakker EM, Coetzee JA (1988) A review of late Quaternary pollen studies in East,
Central and Southern Africa. Review of Palaeobotany and Palynology 55:155-174
Verboom GA, Stock WD, Linder HP (2002) Determinants of postfire flowering in the geophytic
grass Ehrharta capensis. Functional Ecology 16: 705-713
Verboom GA, Linder HP, Stock WD (2004) Testing the adaptive nature of radiation: Growth form
and life history divergence in the African grass genus Ehrharta (Poaceae: Ehrhartoideae).
American Journal of Botany 91: 1364-1370
Visser HN, De Villiers JE, Theron JN, Hill RS (1981) Die Geologie van die gebied tussen Ceres an
Moorreesburg. Department of Mines, Pretoria, Geological Survey Report No. 1981-0024, Open
file 177
45
Vlok JHJ, Yeaton RI (1999) The effect of overstorey proteas on plant species richness in South
African mountain Fynbos. Diversity and Distributions 5: 213-222
Vogel JC, Fuls A, Ellis RP (1978) The geographic distribution of Kranz grasses in South Africa.
South African Journal of Science 74: 209-215
von Hase A, Rouget M, Maze K, Helme N (2003) A fine-scale conservation plan for Cape
Lowlands Renosterveld: A technical report. Cape Conservation Unit CCU 2/03, Botanical
Society of South Africa, Claremont
Warren JM (2000) The Role of White Clover in the Loss of Diversity in Grassland Habitat
Restoration. Restoration Ecology 8: 318-323
West NE, Yorks TP (2002) Vegetation responses following wildfire on grazed and ungrazed
sagebrush semi-desert. Journal of Range Management 55:171-181
Westman WE, O’Leary JF (1986) Measures of resilience: The response of coastal sage scrub to fire.
Vegetatio 65: 179-189
Westoby M, Walker B, Noy-Meir I (1989) Opportunistic management for rangelands not at
equilibrium. Journal of Range Management 42: 266-274
Whittaker RH (1974) Climax concepts and recognition. In: Knapp R (ed) Vegetation dynamics Part
VIII. Dr. W. Junk, The Hague. ISBN 90-6193-189-4
Wicht CL (1945) Reports of the committee on the preservation of the vegetation of the south
western Cape. Royal Society of South Africa, Cape Town, pp 5-56
Wilcox A (1998) Early plant succession on former arable land. Agriculture, Ecosystems and
Environment 69: 143-157
Winter SJ (2003) Attitudes and behaviour of landholders towards the conservation of the Overberg
coastal renosterveld, a threatened vegetation type in the Cape Floral Kingdom. MSc Thesis,
Stellenbosch University
Wisheu IC, Rosenweig ML, Olsvig-Whittaker L, Shmida A (2000) What makes nutrient-poor
mediterranean heathlands so rich in plant diversity? Evolutionary Ecological Research 2: 935-
955
Wood J, Low AB (1998) The ecology and conservation of the Tygerberg. In: du Plessis NM (ed)
The Tygerberg: The story of the Tygerberg Hills and towns of Parow, Belville and Durbanville.
Tafelberg, Cape Town. ISBN 0-624-03576X
Young A, Fowkes S (2003) The Cape Action Plan for the Environment: Overview of an ecoregional
planning process. Biological Conservation 112: 15-28
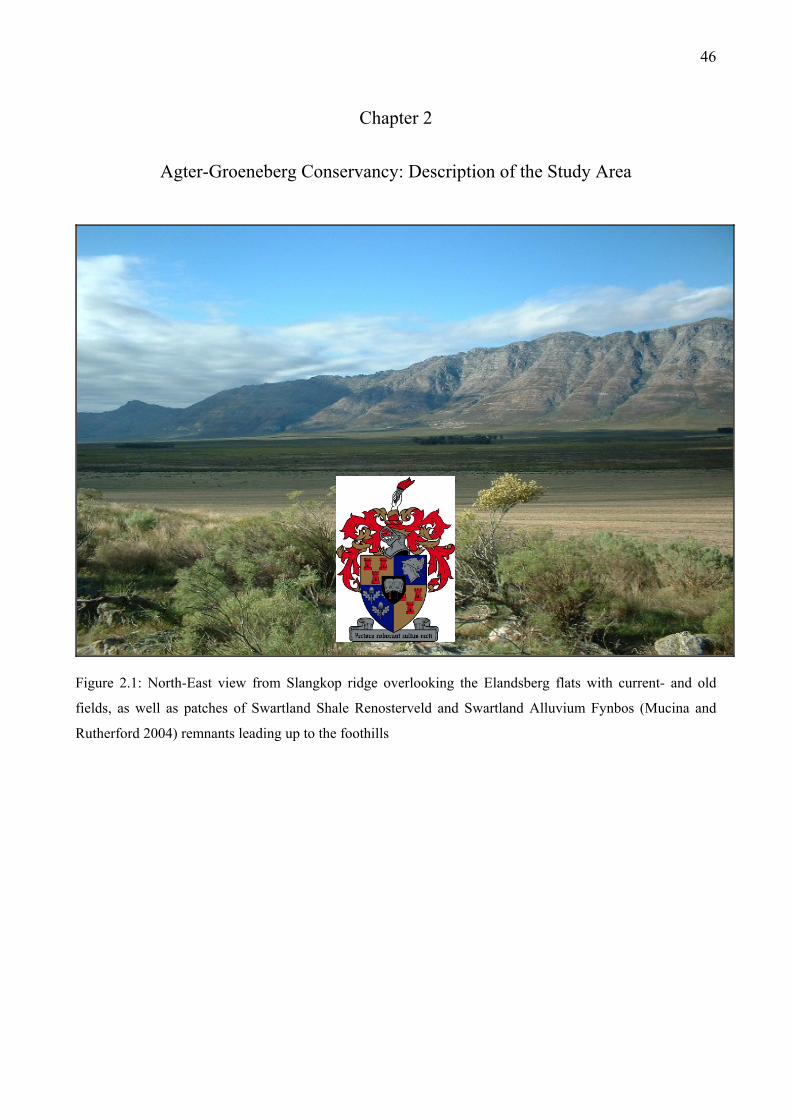
46
Chapter 2
Agter-Groeneberg Conservancy: Description of the Study Area
Figure 2.1: North-East view from Slangkop ridge overlooking the Elandsberg flats with current- and old
fields, as well as patches of Swartland Shale Renosterveld and Swartland Alluvium Fynbos (Mucina and
Rutherford 2004) remnants leading up to the foothills
47
2.1. The Study Area
The study area (Figure 2.1) is a contiguous portion of the Agter-Groeneberg Conservancy (hereafter
referred to as AGC), north of Wellington near Hermon in the Western Cape (Figure 2.2), at 19°00’–
19°02’ E, 33°36’–33°50’ S, at altitudes ranging from 60 to 120 m. This area includes the Voëlvlei
Provincial Nature Reserve (861.86 ha, hereafter denoted Voëlvlei), Elandsberg Private Nature
Reserve (3800 ha, hereafter denoted Elandsberg) and Krantzkop munitions and rocket fuel factory
(2500 ha, hereafter denoted Krantzkop). The eastern side of these properties are unfenced along the
upper foothills as they meet the mountain slopes. Other properties in the AGC, not included in this
study area include Rooshoek (1251.65 ha), Limietrivier (662.29 ha), Foxenburg (110.16 ha),
Boplaas (78.63 ha), Palmiet Valley (349.34 ha), Lupinvale (161.146 ha), Kruishof (255.69 ha),
Bool Smuts (23.498 ha), and Countess Labia (23.919 ha). Voëlvlei (Vogel Vallij, erf no. 253),
managed by CapeNature (formerly Western Cape Nature Conservation Board), incorporates some
unplanted Department of Water Affairs and Forestry property (Kasteels Kloof, erf no. 255). The
AGC surrounds the Voëlvlei Dam and water treatment plant (managed by the Cape Metropolitan
Council). Voëlvlei is a medium-use utilization zone characterized by previous user impacts,
infrastructure and degradation (Anonymous 2000). Elandsberg is owned at present by Elandsberg
Farms (Pty.) Ltd. and includes the erven Elandskloof (15), Langehoogte (14), and Bartholomiews
Klip (17 and 19) with farmsteads. A brief history of Elandsberg is in Appendix 1. Additionally old
fields at the Droogepan (6) and Tweespruit (8) erven have been set-aside and are included in the
Elandsberg Private Nature Reserve. Krantzkop is the property of Armscor with Somchem a division
of the Denel (Pty) Ltd. company on site, bordering Elandsberg from the south and including the
farm Welbedagt (20), previously owned by Elandsberg prior to expropriation by Armscor.
Krantzkop has a total area of 3000 ha, of which an exclusion zone of 200 ha incorporates the
factory establishments, whilst another private area of 300 ha is on lease to a neighbouring farm for
wheat production.
The area utilized by large herbivores at Krantzkop is 2500 ha (excluding herbivores inside the 200
ha exclusion zone). The three sites are contiguous from north to south with differences in large
mammalian herbivore densities. Voëlvlei contains no intentionally stocked large mammalian
herbivores except for occasional Grey Rhebuck (Pelea capreolus), thus serving as a control for the
impact or influence of grazing on vegetation patterns. Elandsberg and Krantzkop are stocked with
wild animals for the purpose of ecotourism, occasional game trophy hunting, and breeding
programmes for the Plains Zebra (Equus burchelli, locally called the “quagga”) and TB-free Cape
Buffalo (Syncerus caffer caffer). Krantzkop has double the biomass (kilograms per hectare of Large
48
Animal Unit’s) compared with Elandsberg, thus forming a gradient from north to south of
increasing grazing intensity. These sites were selected for research as they contain a portion of the
last remaining Swartland Shale Renosterveld (Mucina and Rutherford 2004) and are all afforded
protection status. Recently (2004) these three sites have been officially incorporated into the AGC
due to efforts by the conservation stewardship programme of CapeNature, thus fulfilling a
conservation objective of CapeNature.
2.2. Major Vegetation Patterns
The study area is located within Coastal Renosterveld (sensu Acocks 1953) of the Fynbos Biome
(sensu Kruger 1978, Rutherford and Westfall 1994), classified later as West Coast Renosterveld
(Low and Rebelo 1998) as well, in part, as the Boland Renosterveld BHU (Broad Habitat Unit
sensu Cowling and Heijnis 1999). The vegetation of the study area (Figure 2.3) has recently been
classified as Swartland Shale Renosterveld (Mucina and Rutherford 2004), a unit roughly
encompassing Boland Renosterveld and Swartland Renosterveld BHU’s (Cowling and Heijnis
2001). The Swartland Shale Renosterveld occurring at this portion of the AGC is found in the form
of discrete patches, representing one of seven fragments larger than 1000 ha (Von Hase et al. 2003).
The undulating topography of the West Coast foreland allows for a natural drainage system towards
the Atlantic Ocean where the vegetation experiences wide differences in moisture availability. The
Berg River (with its primary catchment area starting in Franschoek) drains the major portion of the
West Coast forelands. The remaining renosterveld occurs in a narrow strip running south to north
prior to the foothills of the Elandskloof Mountains, dissected by seasonal rivulets and rivers.
Swartland Alluvium Fynbos and Swartland Shale Renosterveld (Mucina and Rutherford 2004)
mostly occur on lower lying areas (Figure 2.3), often seasonally inundated due to the gentle
undulating topography. Discrete stands of Swartland Shale Renosterveld also occur on west-facing
slopes (like Blourug at Elandsberg), ridges and flats in clumps or isolated patches. Wetlands occur
where drainage is poor or along the fringes of rivulets and rivers experiencing seasonal inundation.
Thicket-like vegetation occurs often on ridge crests of Klipheuwel (for example Slangkop ridge on
Elandsberg Farm); in addition unusual ferricrete outcrop (hardpan) associated communities occur in
more sparsely vegetated patches.
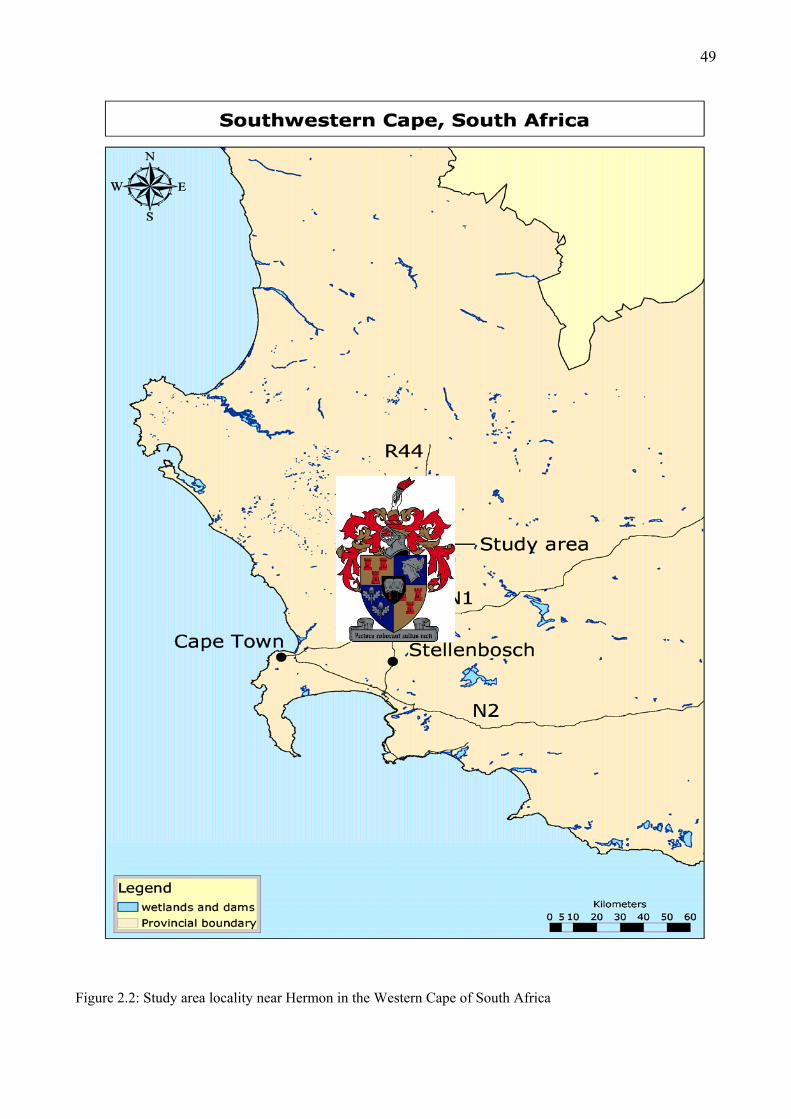
49
Figure 2.2: Study area locality near Hermon in the Western Cape of South Africa
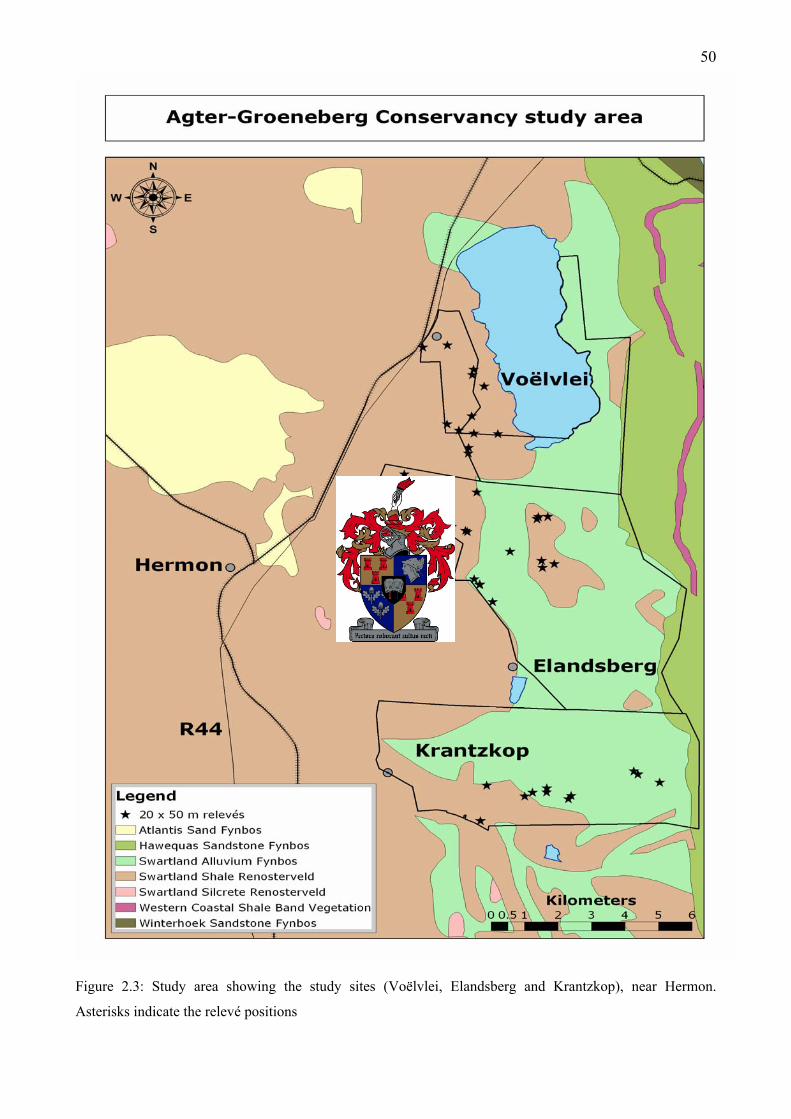
50
Figure 2.3: Study area showing the study sites (Voëlvlei, Elandsberg and Krantzkop), near Hermon.
Asterisks indicate the relevé positions
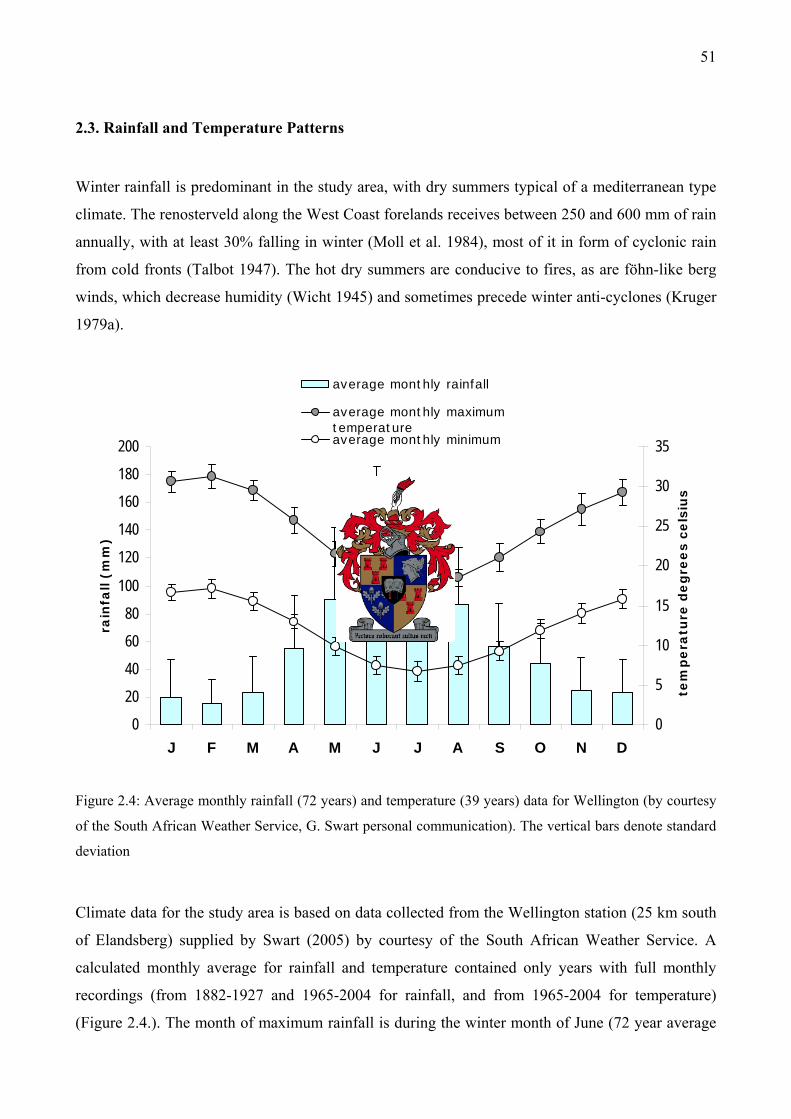
51
2.3. Rainfall and Temperature Patterns
Winter rainfall is predominant in the study area, with dry summers typical of a mediterranean type
climate. The renosterveld along the West Coast forelands receives between 250 and 600 mm of rain
annually, with at least 30% falling in winter (Moll et al. 1984), most of it in form of cyclonic rain
from cold fronts (Talbot 1947). The hot dry summers are conducive to fires, as are föhn-like berg
winds, which decrease humidity (Wicht 1945) and sometimes precede winter anti-cyclones (Kruger
1979a).
0
20
40
60
80
100
120
140
160
180
200
J F M A M J J A S O N D
rain
fall (
mm
)
0
5
10
15
20
25
30
35
tem
pe
ratu
re d
eg
ree
s c
els
ius
average monthly rainfall
average monthly maximumtemperatureaverage monthly minimum
Figure 2.4: Average monthly rainfall (72 years) and temperature (39 years) data for Wellington (by courtesy
of the South African Weather Service, G. Swart personal communication). The vertical bars denote standard
deviation
Climate data for the study area is based on data collected from the Wellington station (25 km south
of Elandsberg) supplied by Swart (2005) by courtesy of the South African Weather Service. A
calculated monthly average for rainfall and temperature contained only years with full monthly
recordings (from 1882-1927 and 1965-2004 for rainfall, and from 1965-2004 for temperature)
(Figure 2.4.). The month of maximum rainfall is during the winter month of June (72 year average
52
of 123.68 mm) and the month of minimum rainfall coincides during the peak of summer in
February (72 year average of 15.58 mm), with an annual rainfall average of 663.5 mm (in 2001
851.9 mm was recorded and in 2002, 780.5 mm). The coldest temperatures occur in the month of
July (average temperature for 39 years is 6.68°C) whilst the warmest temperatures occur in the
month of February, (average temperature for 39 years is 31.26°C). Wind is strongly seasonal with
south-easterly winds in summer (Fuggle and Ashton 1979) whereas in winter the north-western
winds precede frontal low pressure cells, originating from the circum-polar westerly winds,
bringing rainfall (Kruger 1979b).
2.4. Geology and Soils
Primary focus here is on the Coastal Foreland physiographic zone (Wellington 1955) between the
coast and the Cape Fold Belt. The geology of the West Coast foreland supporting renosterveld is
predominantly built by metamorphosed shales of the Pre-Cambrian Malmesbury Group, unlike the
fine sandstones of marine origin (Tankard et al. 1982) of the Table Mountain Group (Ordovician
and Silurian), flooded by the sea until the late Tertiary (Flügel 1995). The West Coast forelands are
bordered eastward by the Olifants River and Elandskloof Mountains built mainly of sandstones of
the Table Mountain Group (Cape Supergroup) and westward, flanking the sea, the shales are
overlain by Tertiary aeolian sand deposits, some 30 km wide in places, on the low lightly dissected
peneplain (< 200 m). This undulating inland plateau the orogenic Saldania Belt (Rozendaal et al.
1999), flanks the Kalahari Craton, has as its main exposure the Malmesbury Group, with three
terranes subdivided by north-west fault and sear zones. The Colenso (Saldanha-Stellenbosch) fault
divides the Tygerberg terrane (west) from the Swartland terrane, whilst the Piketberg-Wellington
fault zone divides the Swartland from the Boland terrane (east). The Swartland terrane is composed
of the Berg River, Klipplaat and Moorreesburg Formations (Pre-Cambrian/Namibian), with the
latter formation being most dominant (Rozendaal et al. 1999). The Berg River Formation contains
chlorite schist, greywacke, cherty limestone lenses and quartz schist on top; it is overlain by the
Klipplaat Formation composed of quartz-sericite-chlorites schist with phyllite and limestone
interbeds. The Moorreesburg Formation has a basal arenite with adjacent chlorite-muscovite schist
and is composed largely of inter-layered greywacke and phyllite. Near the study site the Porterville
Formation (Pre-Cambrian/Namibian) from the Boland terrane of the Malmesbury Group is also
present. The Klipheuwel beds (Cambrian) are exposed in a few areas (like Heuningberg, Visser et
al. 1981) composed mostly of sandstone and conglomerates, with minor shale bands. In general the
Klipheuwel Group form a flatter landscape than the Malmesbury Group and are harder containing
53
less salts (Merryweather 1965). In places, there are granitic intruded masses of the Cape Granite
Suite (Kruger 1979a) from the early Cambrian (for example Paarl Mountain, Paardeberg and granite
plutons near Darling) which break the even surface, and some younger (Ordovician) inselbergs of
the Table Mountain Group (for example Piketberg and Riebeek Kasteel). Overlaying portions of the
Moorreesburg Formation is a more recent gravely alluvium from the early Quaternary period,
typically occurring alongside the Elandskloof mountain range at the study site. At Voëlvlei there are
igneous greenstones and epidiorite dykes about 5 km long (now submerged in part) parallel to the
Malmesbury Formation (Visser et al. 1981). The greenstone here is associated with carbonate rocks
(with chert) either pure dolomitic limestone or a mixture of greenstone and dolomite (like
pyroclasts).
Along the foothill zone of the Cape Folded Belt red apedal soils occur unlike the residual and
duplex soils found on the peneplain surfaces (Lambrechts 1983). The rocks of the Malmesbury
Group give rise to shallow, brownish sandy soils that are susceptible to erosion and sheet wash
(especially on slopes) following heavy rains (Talbot 1947). These nutrient-rich soils derived from
the shales are fine-grained clays and silts. The soils are acid, loams to sandy loams with moderate
amounts of exchangeable bases and total nitrogen, with low levels of available phosphorous
(Cowling et al. 1986). The Swartland soils have similar phosphorus content to mountain fynbos on
granite-derived soils (Witkowski and Mitchell 1987). According to Ellis (1973), soils derived from
granite and shale of the coastal forelands are base-saturated with a corresponding high pH value,
and are relatively fertile. These fine-textured soils impede drainage (Kruger 1979a) and
consequently affect infiltration properties. The natural biotic pedoderm of bacteria, lichens, mosses,
liverworts and fungi as well as earthworm activity facilitate infiltration and the supply of nutrients
to plants. Infiltration rates are greatly reduced after tillage and destruction of the pedoderm where
the biological crust is transformed into a mineral (or physical) crust (Mills and Fey 2003), if
otherwise not of local substrate origin. The four specific soil units (Görgens and de Clercq 2002)
(Figure 2.5) occurring at the study area where relevés were sampled are listed in order of most
occurrence, and abbreviated as K, Av + Cv, Cv + C, C + Cv. These soil units are all a mixture of
soil forms (Anonymous 1991) and a description of soil form composition follows.
The most abundant substrate in the study area are the terrace gravels (K), which are deep, very
stony, grey to yellow sandy loams; with dominant (> 60%) Fernwood, Vilafontes, Kroonstad,
Lamotte and Wasbank soil forms, and subdominant (< 40%) Witfontein and Kroonstad soil forms.
The next most abundant soil forms are a combination of two soil units (Av + Cv), both shallow
gravelly loam (mostly ploughed). The dominant composite soil unit on either rock or hardpan (Av)
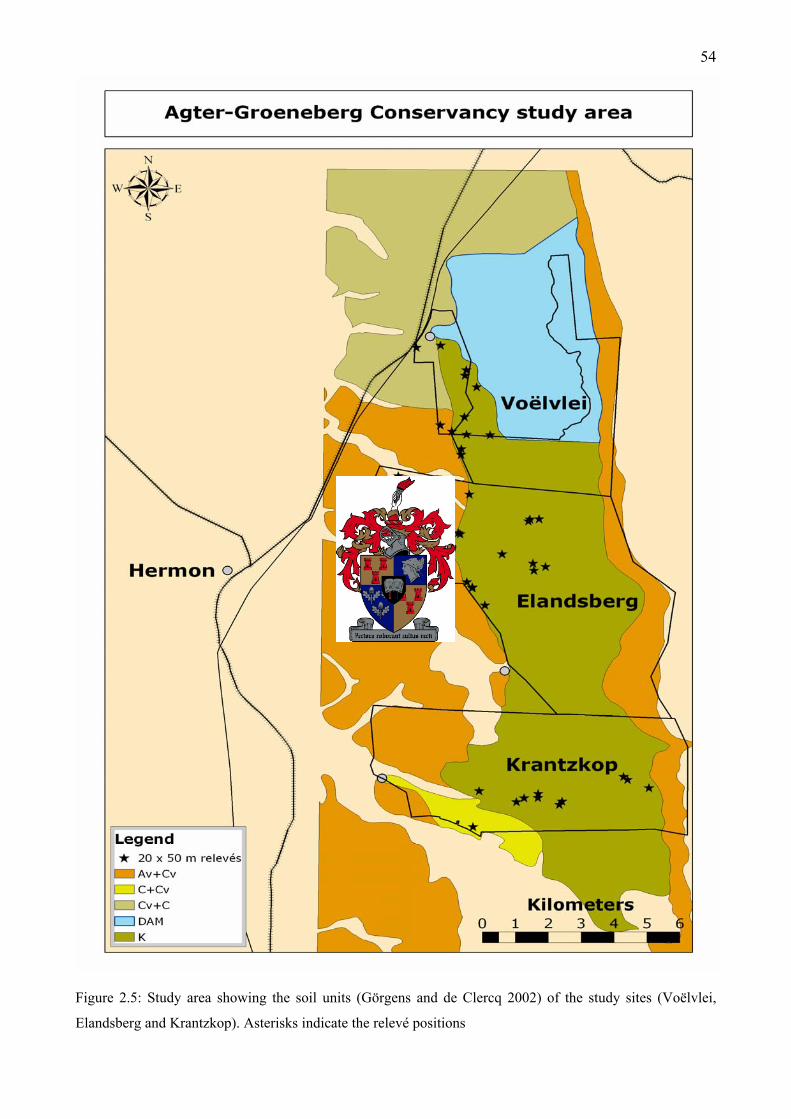
54
Figure 2.5: Study area showing the soil units (Görgens and de Clercq 2002) of the study sites (Voëlvlei,
Elandsberg and Krantzkop). Asterisks indicate the relevé positions
55
has dominant Glenrosa and Mispah soil forms and rock, and subdominant Swartland and Klapmuts
soil forms. The subdominant composite soil unit is a dry grey-coloured duplex soil (Cv) with
dominant Swartland, Glenrosa, Cartref, Tukulu and Klapmuts soil forms, with subdominant
Estcourt, Sterkspruit and Kroonstad soil forms. Then follows a combination of two soil units Cv +
C, both dry grey-coloured gravelly loamy duplex soils, and occur on the boundary of Voëlvlei
(mostly ploughed). They are the dominant shallow duplex composite soil unit (Cv, as described
above) and the subdominant moderately-deep duplex composite soil unit (C) with the dominant
Swartland, Klapmuts, Tukulu, Cartref and Glenrosa soil forms with the subdominant Estcourt,
Sterkspruit, Vilafontes, Kroonstad and Valsrivier soil forms. The least abundant soils are also a
combination of two soil units C + Cv occuring at the south west end of the Krantzkop old fields
only in a small area. It has the same components as described above except the soil unit dominance
is reversed.
Heuweltjies occur throughout the area and are richer in organic material, finer in texture and higher
in pH than surrounding soils (Merryweather 1965). Termite activity results in the accumulation of
calcium salts and organic matter, thoroughly mixed in the soil, with channels lined with fine
particles (and fungus gardens in active mounds). Heuweltjies in sandier soils (overlaying shales) are
more different to the surrounding soil surface horizon than those in shale alone, as fine particles are
mined deeper from below to line channels.
2.5. Disturbance
The environmental disturbance factors primarily incorporated in this study are grazing and
ploughing. Both a grazing gradient (of three different stocking rates) and a ploughing gradient (of
four seral stages in a chronosequence including a control) were major foci of this study.
2.5.1. Fire History
Fires usually occur in the summer dry season in the Western Cape (Kruger 1979c), often due to
lightning strikes in the mountains (Wicht 1945, personal observation) or by humans. “Fire-stick
farming” was practiced since the Holocene to maintain productive geophytes like Watsonia
borbonica, as well as in conjunction with hunting herbivores (Deacon 1983).
56
At Krantzkop fire-breaks are regularly burnt every three years, which are extremely wide (> 200 m)
to prevent the rocket fuel and munitions factory from igniting and exploding. The entire property,
excluding the wild olive ridge and the flats below it surrounding the factory establishment, burnt in
1993. Much of the area had also burnt three years earlier. Prior to this, most of the vegetation (both
fynbos and renosterveld) was approximately 25 years old (S. Mitchell, personal communication).
Similarly, many wild fires have occurred at Elandsberg and Voëlvlei, during 1982, 1988, 1989 and
1999. Elandsberg, Voëlvlei and Krantzkop have frequently burned, often in patches (the most recent
in long “tongues” descending from the mountain range to the foothills and forelands or plains
below) which has created a mosaic of different stand ages of varying sizes. GIS data (by courtesy of
P. Viljoen at Waterval, CapeNature) were used to identify the current stand ages in which relevés
were sampled and a list is included in Appendix 2.
2.5.2. Grazing Intensity
Three levels of grazing intensity occur across the three contiguous study sites, forming a grazing
gradient of increasing intensity from North to South. Voëlvlei is not intentionally stocked with large
mammalian herbivores, except for a few wild Grey Rhebok (Pelea capreolus), Grysbok
(Raphicerus melanotis) and probably Duiker (Sylvicapra grimmii), and serves as a control site for
grazing. Elandsberg and Krantzkop are purposely stocked with large mammalian herbivores, the
latter having double the amount of herbivores than the former. An adequate census count of all
species at Elandsberg is available for 1996 and 2003 only, whilst a repeated census count is
available for Krantzkop since 1985. Information about herbivore densities at Krantzkop was
obtained from S. Mitchell who is responsible for their management and conservation.
For this study, only the herbivore census count of 2003 was used to quantify the stocking rate for
the two sites. Elandsberg has only two reliable census counts from 1996 and 2003, whereas
Krantzkop has 14 census counts from 1985. At Elandsberg, the introduced browsers and grazers
include Black Wildebeest (Connochaetes gnou), Bontebok (Damaliscus pyrgargus), Eland
(Taurotragus oryx), Gemsbok (Oryx gazella), Ostrich (Struthio camelus australis), Plains Zebra
(Equus burchelli, locally called “quagga’s”), Red Hartebeest (Alcelaphus buselaphus) and
Springbok (Antidorcas marsupialis). Cape Buffalo (Syncerus caffer caffer) are kept in a separate
camp outside the reserve, and are therefore excluded from this study. In 2002, the Blue Wildebeest
(Connochaetes taurinus) were removed from Elandsberg. Occasionally Eland jump the fences at
Krantzkop and Elandsberg, and Grey Rhebok (Pelea capreolus) have been observed in Elandsberg
57
farmlands and at Voëlvlei (B. Walton, unpublished observations). A sole Mountain Zebra (Equus
zebra zebra) seen at Elandsberg probably arrived along the foothills from Krantzkop.
Densities of introduced large mammalian herbivores at Krantzkop have remained stable over the
last five years (S. Mitchell, personal communication). Krantzkop has a large fenced internal no-
access zone that splits the herbivore populations in an otherwise open tract of shrubland, riverine
terrace/wetland and scattered old fields. The Eland move freely between areas, Bontebok and Black
Wildebeest stay on the old fields. Oryx and Red Hartebeest utilize renosterveld for browsing, whilst
Blue Wildebeest stay at the foothills with adjacent old fields (S. Mitchell, personal communication).
Potential consumption of plants by other herbivores was excluded from this study. The geometric
tortoise (Psammobates geometricus) is known to browse Briza maxima, Babiana angustifolia,
Cyanella hyacinthoides, Cynodon dactylon, Ehrharta calycina, Eragrostis curvula, Lachenalia
contaminata, Pentachistis curvifolia and Themeda triandra (Balsamo et al. 2004). Similarly
browsing by harvester termites on: Athanasia trifurcata, Babiana odorata, Cynodon dactylon,
Elytropappus rhinocerotis, Eragrostis curvula; feeding of feral pigs on Babiana angustifolia,
Cyanella hyacinthoides and uprooting, as well as by large herbivores, of Elytropappus rhinocerotis,
Eriocephalus africanus subsp. paniculatus, Relhania fruticosa were observed (B. Walton,
unpublished observations). Porcupines were not incorporated in the scope of this study, and their
impacts were assumed to be similar across the study area. Feral pigs (Sus scrofa) occur at all sites
and were introduced into state forests in the 1920’s (Bigalke and Pepler 1991) as a biocontrol agent
for the pine emperor moth (Imbrasia cytherea). Their disturbance due to their foraging activity
especially in loamy seasonally waterlogged areas is worrying and they consume and destroy local
patches of geophytes (B. Walton, unpublished observations). The disturbance caused by Feral Pigs
is assumed to be similar at all sites, but their true densities are unknown. The Elandsberg Farms
(Pty.) Ltd. hunt approximately 100 Feral Pigs a year in post-harvested wheat fields (B. Wooding,
personal communication).
2.5.3. Ploughing
Since the initial arrival of colonists in the 17th century in South Africa, the Swartland has endured
transformation by agriculture that intensified during the 20th century. The once extensive stock
farming was replaced by an intensive wheat production system especially since the 1940’s
(Meadows 2003) and which accelerated by mechanized farming during the 1950’s.
58
Voëlvlei and Krantzkop were last ploughed in the 1970’s, prior to the expropriation of agricultural
land by CapeNature and Armscor, respectively. Krantzkop was last ploughed in 1975. Thus,
Voëlvlei and Krantzkop only have 30-year-old fields and unploughed renosterveld available for a
study of post-ploughed secondary succession. Elandsberg has a chronosequence of three different-
aged old fields and unploughed renosterveld, namely last ploughed in the 1960’s, 1987, and in
1997. The different-aged old fields at Elandsberg have different ploughing histories (Appendix 2).
Both the 5- and 15-year-old fields were intensely cultivated, unlike the 30-year-old fields
surrounded by renosterveld. Those latter fields were briefly ploughed for oats, grazed by sheep and
then abandoned (M. Gregor personal communication). The 30-year-old fields at Voëlvlei and
Krantzkop were intensely cultivated until expropriation and cessation of ploughing.
2.5.4. Invasive Alien Plant Species
As “alien”, we consider here those species that are not native to the Cape flora. Agricultural
practices have facilitated the spread and existence of mostly ruderal species. In the Swartland,
annual (as well as some perennial forbs and hemicryptophytes) alien taxa comprise most of the
alien component in terms of richness and abundance, specifically mediterranean grasses that have
entered the area since the advent of agriculture. Burchell (1967) collected Briza maxima at Cape
Town in 1810 and a species of Bromus and Lolium in the interior. Alien annual grasses were
transported with oat and wheat seeds or other pasture plants (like Medicago) from Europe. The alien
annuals are a feature of the agriculturally transformed landscapes, and are either used as pasture
feed (like Lolium perenne) or inhabit fallow or old fields, along with many ruderal herbaceous alien
species. Consequently, they are also found in natural vegetation either spread via wind from
adjacent agricultural fields or dispersed in herbivore dung.
Large trees such as acacias consequently spread into and from areas neglected by farming or other
non-irrigable areas in the agricultural matrix alongside drainage lines (Acacia mearnsii) or deep
sands typical of sandplain fynbos (Acacia cyclops and A. saligna; Merryweather 1965). Eucalyptus
cladocalyx and other species generally radiate outward from woodlots or around the fringes of
waterways and dams where planted. Pinus species descend from mountainside plantations and are
common in places amongst granitic outcrops often with Hakea sericea. Fire increases the spread of
these alien trees with concomitant problems of increased fire severity due to higher fuel loads.

59
2.6. References
Acocks JPH (1953) Veld Types of South Africa (1st edn). Botanical Survey Memoir No. 28. The
Government Printer, Pretoria
Anonymous (1991) Soil Classification: A taxonomic system for South Africa, by the Soil
Classification Working Group. Memoirs on the Agricultural Natural Resources of South Africa
No. 15. Department of Agricultural Development, Pretoria. ISBN 0-621-10784-0
Anonymous (2000) Waterval Conservation Area Management Plan. Western Cape Nature
Conservation Board
Balsamo RA, Hofmeyr MD, Henen BT, Bauer AM (2004) Leaf biomechanics as a potential tool to
predict feeding preferences of the geometric tortoise Psammobates geometricus. African
Zoology 39: 175-181
Bigalke RC, Pepler D (1991) Mammals introduced to the mediterranean region of South Africa. In:
Groves RH, Di Castri F (eds) Biogeography of Mediterranean Invasions. Cambridge University
Press, Cambridge pp 285-292. ISBN 0-521-36040-4
Burchell WJ (1967) Travels in the Interior of Southern Africa Volume 1. C. Struik (Pty) Ltd., Cape
Town, reprinted limited edition
Cowling RM, Pierce SM, Moll EJ (1986) Conservation and utilization of South Coast Renosterveld,
an endangered South African vegetation type. Biological Conservation 37: 363-377
Cowling RM, Heijnis CE (2001) The identification of Broad Habitat Units as biodiversity entities
for systematic conservation planning in the Cape Floristic Region. South African Journal of
Botany 67: 15-38
Deacon HJ (1983) The peopling of the Fynbos Region. In: Deacon HJ, Hendey QB, Lambrechts
JJN (eds) Fynbos Palaeoecology: A preliminary synthesis. South African National Scientific
Programmes Report No. 75: 183-204. Council for Scientific and Industrial Research, Pretoria.
ISBN 0-7988-2953-2
Ellis F (1973) Soil studies in the Duiwenhoks River catchment area. MSc Thesis, Stellenbosch
University
Flügel W-A (1995) River salination due to Dryland agriculture in the western Cape Province,
Republic of South Africa. Environment International 21: 679-686
Fuggle RF, Ashton ER (1979) Climate. In: Day J, Siegfried WR, Louw GN, Jarman ML (eds)
Fynbos ecology: a preliminary synthesis. South African National Scientific Programmes Report
No. 40: 7-15. Council for Scientific and Industrial Research, Pretoria. ISBN 0-7988-1686-4
60
Görgens A, de Clercq WP (2002) Water quality information systems for integrated water resource
management: The Riviersonderend-Berg River system. WRC Report: Submitted August 2002
Kruger FJ (1978) A description of the Fynbos Biome Project. South African National Scientific
Programmes Report No. 28: 1-23. Council for Scientific and Industrial Research, Pretoria. ISBN
0-7988-1335-0
Kruger FJ (1979a) South African heathlands. In: Specht RL (ed.) Ecosystems of the World 9A:
Heathlands and related shrublands: descriptive studies. Elsevier, Amsterdam, pp 1-17. ISBN 0-
444-41810-5
Kruger FJ (1979b) Introduction. In: Day J, Siegfried WR, Louw GN, Jarman ML (eds) Fynbos
ecology: a preliminary synthesis. South African National Scientific Programmes Report No. 40:
7-15. Council for Scientific and Industrial Research, Pretoria. ISBN 0-7988-1686-4
Kruger FJ (1979c) Fire. In: Day J, Siegfried WR, Louw GN, Jarman ML (eds) Fynbos ecology: a
preliminary synthesis. South African National Scientific Programmes Report No. 40: 7-15.
Council for Scientific and Industrial Research, Pretoria. ISBN 0-7988-1686-4
Lambrechts JJN (1983) Soils, soil processes and soil distribution in the Fynbos region: an
introduction. In: Deacon HJ, Hendey QB, Lambrechts JJN (eds) Fynbos palaeoecology: A
preliminary synthesis. South African National Scientific Programmes Report No. 75: 61-69.
Council for Scientific and Industrial Research, Pretoria. ISBN 0-7988-2953-2
Low AB, Rebelo AG (eds) (1998) Vegetation of South Africa, Lesotho and Swaziland. Dept.
Environmental Affairs and Tourism, Pretoria. ISBN 0-621-17316-9
Meadows ME (2003) Soil erosion in the Swartland, Western Cape Province, South Africa:
implications of past and present policy and practice. Environmental Science & Policy 6: 17-28
Merryweather FR (1965) The soils of the Wellington-Malmesbury area. MSc Thesis, Stellenbosch
University
Mills AJ, Fey MV (2003) Declining soil quality in South Africa: effects of land use on soil organic
matter and surface crusting. South African Journal of Science 99: 429-436
Moll EJ, Campbell BM, Cowling RM, Bossi L, Jarman ML, Boucher C (1984) A description of
major vegetation categories in and adjacent to the Fynbos Biome. South African National
Scientific Programmes Report No. 83: 12-14. Council for Scientific and Industrial Research,
Pretoria. ISBN 0-7988-3019-0
Mucina L, Rutherford MC (eds) (2004) Vegetation map of South Africa, Lesotho and Swaziland:
Shape files of basic mapping units. Beta version 4.0, February 2004. National Botanical Institute,
Cape Town
61
Rozendaal A, Greese PG, Scheepers R, Le Roux JP (1999) Neoproterozoic to early Cambrian
crustal evolution of the Pan-African Saldania Belt, South Africa. Precambrian Research 97: 303-
323
Rutherford MC, Westfall RH (1994) Biomes of Southern Africa: an objective categorization. 2nd
edn. Memoirs of the Botanical Survey of South Africa 63. National Botanical Institute, Pretoria.
ISBN 1-874907-24-2
Talbot WJ (1947) Swartland and Sandveld: A survey of land utilization and soil erosion in the
western lowland of the Cape Province. Oxford University Press, Cape Town
Tankard AJ (1982) Crustal evolution of Southern Africa: 3.8 billion years of earth history. Springer,
New York. ISBN 0387906088
Visser HN, De Villiers JE, Theron JN, Hill RS (1981) Die Geologie van die gebied tussen Ceres an
Moorreesburg. Department of Mines, Pretoria, Geological Survey Report No. 1981-0024, Open
file 177
von Hase A, Rouget M, Maze K, Helme N (2003) A fine-scale conservation plan for Cape lowlands
Renosterveld. Technical report. Cape Conservation Unit CCU 2/03. Botanical Society of South
Africa, Claremont
Wellington JH (1955) South Africa, a geological study. Cambridge University Press, Cambridge
Wicht CL (1945) Reports of the committee on the preservation of the vegetation of the south
western Cape. Royal Society of South Africa, Cape Town
Witkowski ETF, Mitchell DT (1987) Variations in soil phosphorus in the Fynbos Biome, South
Africa. Journal of Ecology 75: 1159-1171
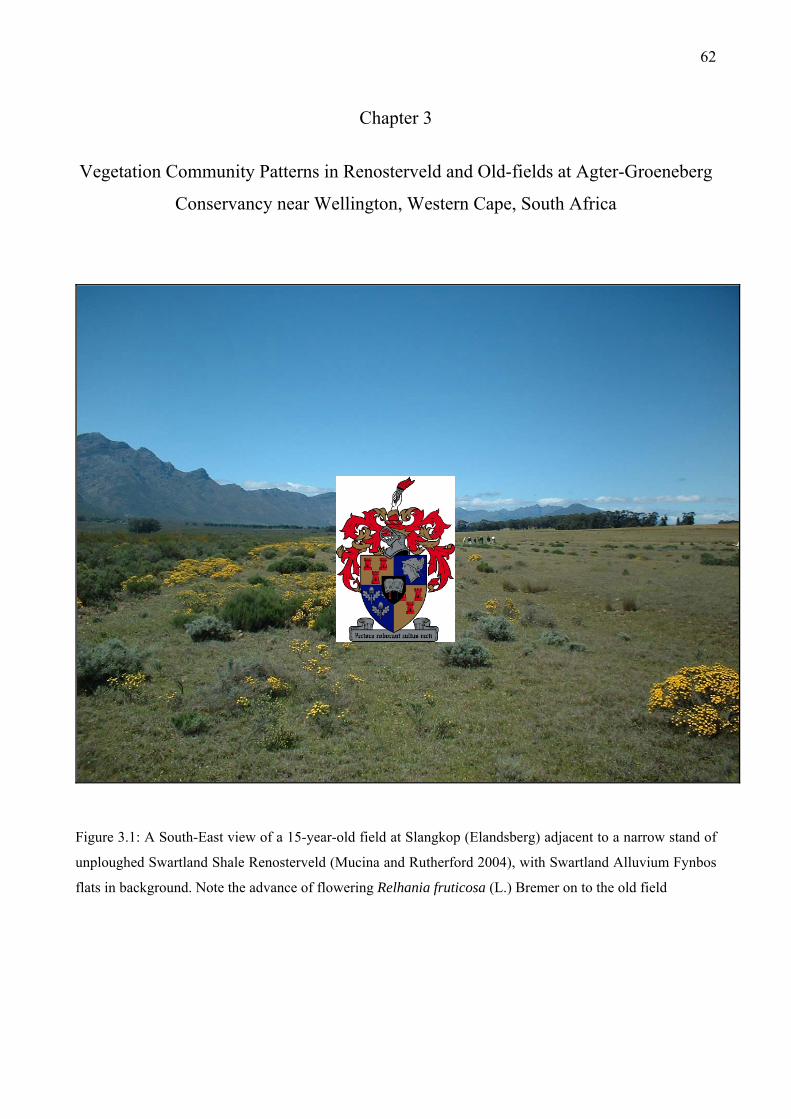
62
Chapter 3
Vegetation Community Patterns in Renosterveld and Old-fields at Agter-Groeneberg
Conservancy near Wellington, Western Cape, South Africa
Figure 3.1: A South-East view of a 15-year-old field at Slangkop (Elandsberg) adjacent to a narrow stand of
unploughed Swartland Shale Renosterveld (Mucina and Rutherford 2004), with Swartland Alluvium Fynbos
flats in background. Note the advance of flowering Relhania fruticosa (L.) Bremer on to the old field
63
3.1. Introduction
The renosterveld is a unique species-rich ecosystem (Levyns 1929, Duthie 1930, Taylor 1978),
acknowledged as having a 100% irreplaceability value (von Hase et al. 2003) due to natural habitat
demise and transformation (Figure 3.1). The decline of renosterveld vegetation has not occurred
without recommendations for formal protection by researchers and conservation agencies, however
targets have not been met (see Tansley 1982, Jarman 1986, McDowell 1988) and many valuable
tracts have been continuously transformed since then. In order to define effective measures aimed at
conservation of a natural ecosystem, the basic vegetation and ecological patterns have to be
thoroughly surveyed and described. Vegetation classification, description and mapping in the
Fynbos Biome traditionally concentrated on fynbos (see Werger 1972, Glyphis et al. 1978, Laidler
et al. 1978, Campbell 1983, 1985, McDonald 1985, Taylor 1996, Cowling 1992, Simmons 1996,
Cowling et al. 1997, Hoare et al. 2000). Some studies investigated various issues of patterns in the
renosterveld (Levyns 1929, 1935, Muir 1929, Grobler and Marais 1967, Linder 1976, van der
Merwe 1976, 1977, Cowling 1983, Pierce and Cowling 1983, Cowling 1984, Cowling et al. 1988,
Rebelo et al. 1991, Euston-Brown 1995) or drew valuable comparisons with fynbos (see Cowling
1983, Kruger and Taylor 1979). Still, the renosterveld vegetation of the Fynbos Biome of South
Africa is lacking adequate coverage by empirical baseline studies involving classification,
description, and (until recently) mapping of vegetation. A holistic correlation of these patterns with
intrinsic ecological patterns and processes is also incomplete. Studies for example by Michell
(1922), Taylor (1978), Cowling et al. (1986), Wood and Low (1993) usually only involved
compilations of checklists (see Heydenrych and Littlewort 1995); but see Boucher (1987).
Levyns (1935) noted that renosterveld is often dominated by Elytropappus rhinocerotis, and has a
conspicuous shrub synusia and speciose herbaceous component (graminoids, geophytes and
annuals). Acocks (1953) ascribed the differences in grass abundance between West Coast
renosterveld and South Coast renosterveld to seasonal versus non-seasonal rainfall patterns,
respectively. Acocks (l.c.) described the species-rich coastal renosterveld vegetation in terms of the
absence of (or relationship to) thicket vegetation elements. Merryweather (1965) mentioned that
heuweltjies on the West Coast forelands are formed by termite activity, and are absent on the South
Coast foreland (Boucher and Moll 1981). Taylor (1978) described coastal renosterveld on the
elevated coastal plain, as being dominated by renosterbos (Elytropappus rhinocerotis) with co-
dominant shrub species like Relhania genistifolia (widespread, see Bremer 1976) or R. fruticosa
(mostly West Coast renosterveld), and many grass species of low cover. A lucid point mentioned
from research conducted by Levyns (1927), was that renosterbos seedlings are moisture sensitive,
64
perhaps implying grassier conditions when drought persists. Kruger (1979) described coastal
renosterveld as a complex successional gradient from a shrubland to shrubby grassland.
A major contentious issue still clouding the enigmatic renosterveld is an accurate and stable
definition of renosterveld. Generally the renosterveld shrubland on the West Coast foreland is
defined as occurring on nutrient-rich soils (unlike fynbos on oligotrophic soils) between a rainfall
margin of 300 mm and 600 mm. Renosterveld occurs along an edaphic and rainfall gradient
between more mesic fynbos elements and thicket elements along both the West and South Coast
forelands, unlike the zonations of the interior renosterveld between xeric fynbos and Karoo
elements. Coastal renosterveld usually has three strata (Adamson 1938, Levyns 1929, Boucher and
Moll 1981), such as (1) the upper layer 1.0 to 1.5 m tall, (2) the lower layer of 0.1 to 0.5 m tall), and
rarely (3) a taller shrub layer (up to 3.0 m tall) occurring on heuweltjies or alongside drainage lines.
In an attempt to document vegetation community patterns in renosterveld, this chapter embarks on
the classification and description of the renosterveld (and associated) vegetation in a limited, but
representative area. This vegetation description will serve as a baseline study for further ecological
studies aimed at formulation of efficient and sensible management guidelines, decisions and
practices to be implemented in context of actual biodiversity.
Our study object is the Agter-Groeneberg Conservancy (hereafter referred to as AGC), formally
established in 2004 via the conservation stewardship programme of CapeNature. AGC (including
both renosterveld and fynbos) contains at least 950 plant taxa, nearly 10% of the Fynbos Biome’s
flora. AGC contains some local endemics, such as Brunsvigia elandsmontana and Moraea villosa
subsp. elandsmontana as well as a large number of threatened taxa.
The following questions are being addressed in this Chapter:
1. What are the plant communities of unploughed renosterveld and different-aged old fields which
originated in habitats of ploughed renosterveld?
2. What are the most characteristic features of the floristic and ecological relationship between the
described plant communities in terms of ecological factors operating within the studied system?

65
3.2. Materials and Methods
3.2.1. Vegetation Data
A phytosociological survey was conducted to gather vegetation data on presence and relative-
abundance of taxa in relevés. Vegetation was sampled on both old fields (presumed to have
previously supported renosterveld vegetation) as well as in unploughed renosterveld. A nested
quadrat sampling method of 1000 m2 relevés was used. The relevé layout design used here is shown
in Figure 3.2. The adopted sampling scale of 0.1 ha was chosen for comparative purposes with
previous vegetation surveys in mediterranean type ecosystems (Rice and Westoby 1983). Relevés
were placed at sites with similar habitat conditions, either unploughed renosterveld or different-
aged old fields with a low (5- and 15-year-old fields) or high shrub cover (30-year-old fields).
Vegetation stands never ploughed were used as the baseline reference (controls) from which to infer
community compositional changes caused by previous ploughing and contemporary grazing
disturbances.
The different-aged old fields and controls were assigned to a seral stage class; 5-year-old fields
(Sere 1), 15-year-old fields (Sere 2), 30-year-old fields (Sere 3) and unploughed renosterveld (Sere
4). Not all seral stages occurred at Voëlvlei or Krantzkop as those two sites were last ploughed in
the 1970’s, prior to the expropriation of agricultural land by CapeNature and Armscor, respectively
(Krantzkop was last ploughed in 1975). Thus only unploughed renosterveld and 30-year-old fields
existed at Voëlvlei and Krantzkop, making an unbalanced design. Elandsberg has old fields of
different set-aside ages, namely last ploughed in the 1960’s, 1987, and in 1997. A sequence of aerial
photographs (1938, 1949, 1967, 1973, 1987 and 1997) was used to select suitable sites for relevés
in vegetation of the four seral stages within the study area. The aerial photographs give an
indication of the decline in extent of untransformed vegetation since 1934 to 1996, especially after
the introduction of mechanized farming in the 1950’s (M. Gregor, personal communication).
All taxa present were recorded (with the exception of unidentifiable or rare seedlings) on field data
sheets (Appendix 3.1), and the height of common species was measured (an average of three
individuals). Species (in relevés and nested quadrats) were assigned to a life-form class (Raunkiaer
1934, Mueller-Dombois and Ellenberg 1974) in the field and later verified in the literature
(Goldblatt and Manning 2000) or by expert botanical knowledge (Appendix 3.2). Raunkiaer’s life-
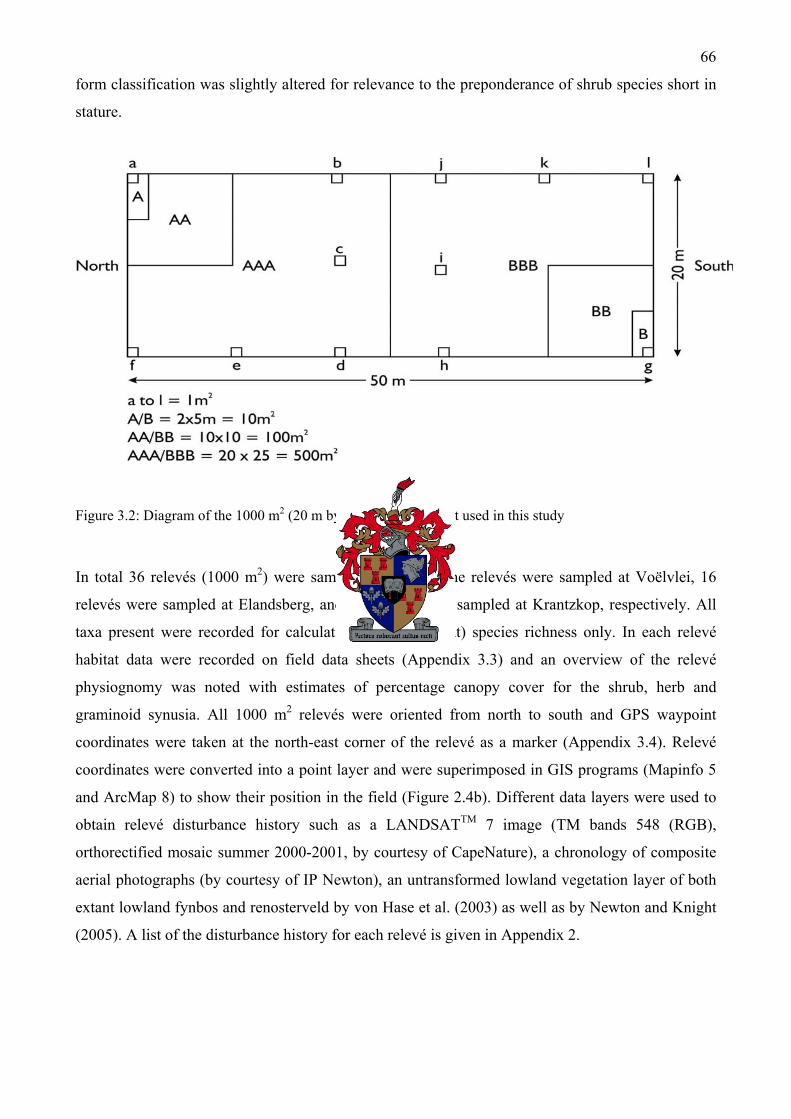
66
form classification was slightly altered for relevance to the preponderance of shrub species short in
stature.
Figure 3.2: Diagram of the 1000 m2 (20 m by 50 m) relevé layout used in this study
In total 36 relevés (1000 m2) were sampled, of which nine relevés were sampled at Voëlvlei, 16
relevés were sampled at Elandsberg, and 11 relevés were sampled at Krantzkop, respectively. All
taxa present were recorded for calculation of alpha (point) species richness only. In each relevé
habitat data were recorded on field data sheets (Appendix 3.3) and an overview of the relevé
physiognomy was noted with estimates of percentage canopy cover for the shrub, herb and
graminoid synusia. All 1000 m2 relevés were oriented from north to south and GPS waypoint
coordinates were taken at the north-east corner of the relevé as a marker (Appendix 3.4). Relevé
coordinates were converted into a point layer and were superimposed in GIS programs (Mapinfo 5
and ArcMap 8) to show their position in the field (Figure 2.4b). Different data layers were used to
obtain relevé disturbance history such as a LANDSATTM 7 image (TM bands 548 (RGB),
orthorectified mosaic summer 2000-2001, by courtesy of CapeNature), a chronology of composite
aerial photographs (by courtesy of IP Newton), an untransformed lowland vegetation layer of both
extant lowland fynbos and renosterveld by von Hase et al. (2003) as well as by Newton and Knight
(2005). A list of the disturbance history for each relevé is given in Appendix 2.
67
Two 10 m2 quadrats per 1000 m2 relevé (72 in total) were sampled at alternate ends of the relevé
(see Figure 3.2.). Cover-abundance was recorded with the refined Braun-Blanquet scale (Barkman
et al. 1964) (Table 3.1, Appendix 3.5).
Table 3.1: Quadrat scales and measurements within each relevé
10 m2 All species identified and their cover-abundance recorded
1000 m2 All species identified and a percentage estimate of total shrub/graminoid/herb canopy cover
recorded
3.2.2. Environmental Data
Grazing intensity increased along a gradient at the three sites (see Chapter Two: Study area) and
were assigned to classes of; low intensity (LI), moderate intensity (MI) and high intensity (HI),
respectively, as a nominal scale and recoded and binarized as pseudo-variables for gradient
analyses. A total stocking density per site for large herbivores was calculated (Table 3.2). To obtain
this figure the number of individuals per species was multiplied by their metabolic equivalent (a
fraction of a standard Large Animal Unit (LAU) with a mass of 450 kg, Bothma 2002). Dividing
the sum of the LAU’s per site by the area in hectares (Σ (n *LAU)/ha) gives the value of 0.05
LAU/ha for Elandsberg and 0.11 LAU/ha for Krantzkop respectively. Thus the stocking rate at
Krantzkop is precisely 2.2 times that of Elandsberg. No calculation of a sustainable stocking
capacity was attempted, only a direct measurement of existing stock. Table 3.3, depicts the amount
of relevés sampled at the AGC with corresponding ploughing and grazing disturbance factors.
The post-fire age of stands (fire-age) was determined on site with the aid of mental records (M.
Gregor and B. Wooding for Elandsberg), GIS data (with a record of the extent of each fire for the
area by courtesy of CapeNature, P. Viljoen, Tulbagh) and a sequence of orthophotos as described
above for seral stage determination, for use in multivariate analyses. The different fire-ages of
stands were not evenly replicated across other factor levels, as it proved difficult to obtain in the
field due to the patchy and random distribution of fires across the study sites. Relevés were assigned
to a fire-age class burnt last either in: 1982 (F1), 1988 (F2) and/or 1999 (F3), as a nominal scale and
recoded as pseudo-variables for gradient analyses.
Vegetation and environmental data were stored and managed in the TURBOVEG databank program
(Hennekens and Schaminée 2001).
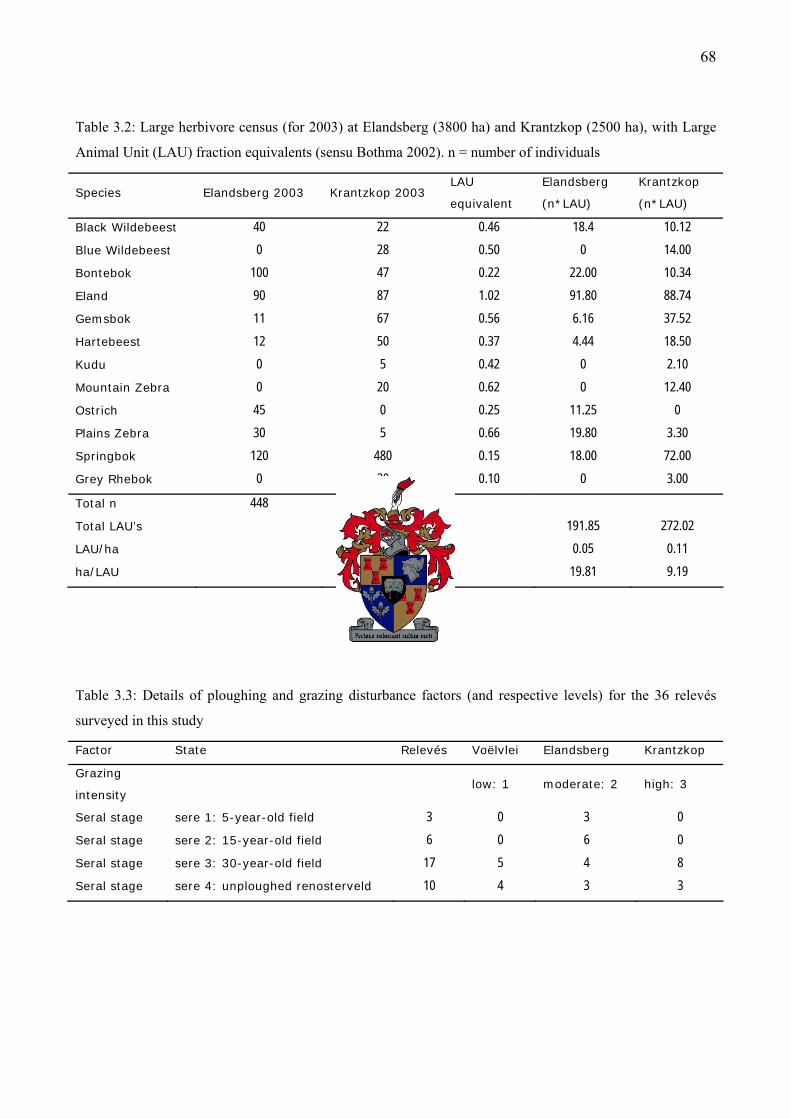
68
Table 3.2: Large herbivore census (for 2003) at Elandsberg (3800 ha) and Krantzkop (2500 ha), with Large
Animal Unit (LAU) fraction equivalents (sensu Bothma 2002). n = number of individuals
Species Elandsberg 2003 Krantzkop 2003 LAU
equivalent
Elandsberg
(n*LAU)
Krantzkop
(n*LAU)
Black Wildebeest 40 22 0.46 18.4 10.12 Blue Wildebeest 0 28 0.50 0 14.00 Bontebok 100 47 0.22 22.00 10.34 Eland 90 87 1.02 91.80 88.74 Gemsbok 11 67 0.56 6.16 37.52 Hartebeest 12 50 0.37 4.44 18.50 Kudu 0 5 0.42 0 2.10 Mountain Zebra 0 20 0.62 0 12.40 Ostrich 45 0 0.25 11.25 0 Plains Zebra 30 5 0.66 19.80 3.30 Springbok 120 480 0.15 18.00 72.00 Grey Rhebok 0 30 0.10 0 3.00
Total n 448 841 Total LAU’s 191.85 272.02 LAU/ha 0.05 0.11 ha/LAU 19.81 9.19
Table 3.3: Details of ploughing and grazing disturbance factors (and respective levels) for the 36 relevés
surveyed in this study
Factor State Relevés Voëlvlei Elandsberg Krantzkop
Grazing
intensity low: 1 moderate: 2 high: 3
Seral stage sere 1: 5-year-old field 3 0 3 0 Seral stage sere 2: 15-year-old field 6 0 6 0 Seral stage sere 3: 30-year-old field 17 5 4 8 Seral stage sere 4: unploughed renosterveld 10 4 3 3
69
3.2.3. Soil Sampling and Analysis
Soil samples (500 grams) were taken in twenty-four 1000 m2 relevés only with a hand core borer at
five random points and mixed together. The samples were not evenly replicated for all factor levels
(seral stage and grazing intensity). Soil analyses (Table 3.4) were conducted by BemLab cc in
Somerset West. The following soil characteristics were measured: texture, pH (KCl; see McLean
1982), electrical resistance (Ohms; see Richards 1954), hydrogen (cmol(+)/kg), organic carbon (%,
see Nelson and Sommers 1982), nitrogen (%), phosphorus (mg/kg; see Bray and Kurtz 1945),
potassium (mg/kg), exchangeable cations; Na, K, Ca, Mg (cmol(+)/kg; see Chapman 1965) and base
saturation (Table 3.5). Carbon, nitrogen and potassium content (a measure of organic material)
could be limiting (or not freely-available) in shale and one can expect a difference in amount with
ploughed versus unploughed land. Univariate tests of significance (ANOVA) were employed
(StatSoft, Inc. 2004) for establishing differences in the content of the measured soil variables
amongst the seral stages, and distribution of normality was checked as well.
Table 3.4: Variables and methods of the soil analyses (performed by BemLab cc, Somerset West). Data
types: I: interval scale, R: ratio-scale
Variable name Data type Unit of
measurement Method of unit of measurement
Soil reaction I pH 10 g soil + 25 ml 1M KCl, read
after 1 hour
Electrical resistance of soil R ohms
Soil sample is saturated with de-
ionized water and resistance is
measured in a USDA cup
Extractable cations:
Na, K, Ca and Mg
(Ammonium acetate - 1M, pH 7)
R
cmol(+)/kg
and
mg/kg (K)
5 g soil + 50 ml ammonium
acetate solution, shaken for 30
minutes and filtered. Analyzed
for Na, K, Ca and Mg with the
ICP
Extractable phosphorus R mg/kg Bray 2
Organic carbon R % Walkley Black
Total nitrogen R % Digestion with a Leco FP528
nitrogen analyzer
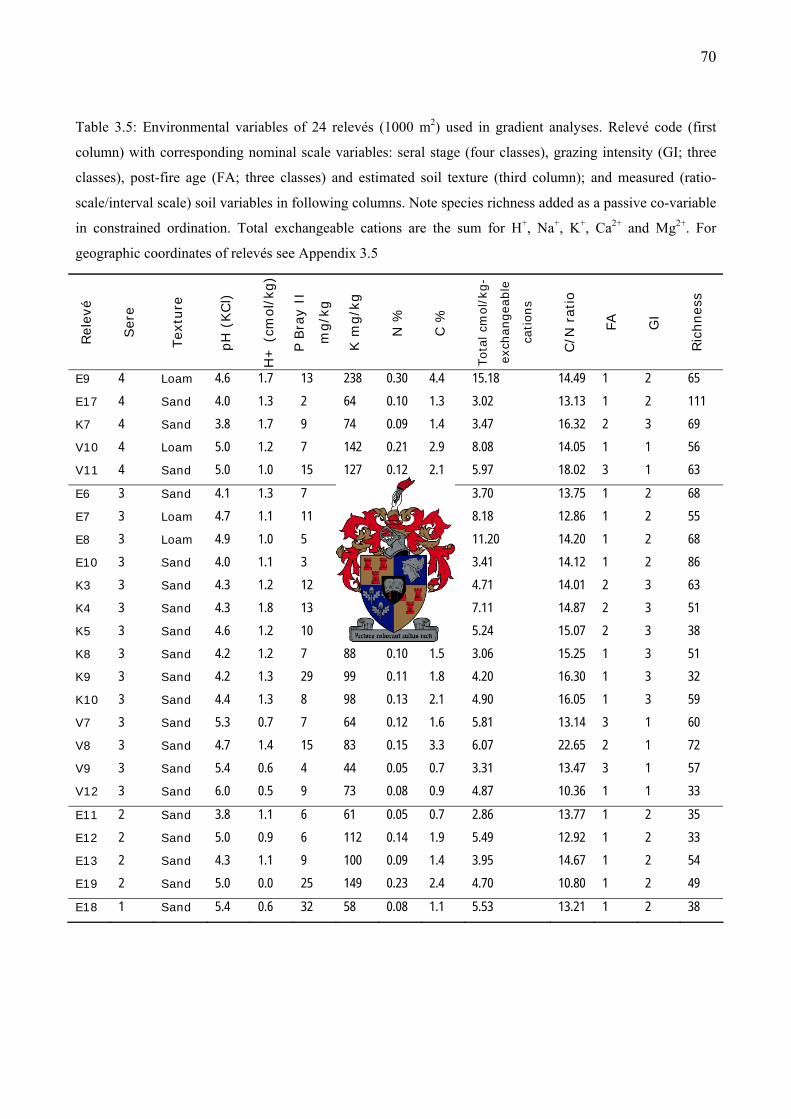
70
Table 3.5: Environmental variables of 24 relevés (1000 m2) used in gradient analyses. Relevé code (first
column) with corresponding nominal scale variables: seral stage (four classes), grazing intensity (GI; three
classes), post-fire age (FA; three classes) and estimated soil texture (third column); and measured (ratio-
scale/interval scale) soil variables in following columns. Note species richness added as a passive co-variable
in constrained ordination. Total exchangeable cations are the sum for H+, Na+, K+, Ca2+ and Mg2+. For
geographic coordinates of relevés see Appendix 3.5
Rel
evé
Ser
e
Tex
ture
pH
(KCl)
H+
(cm
ol/
kg)
P Bra
y II
mg/k
g
K m
g/k
g
N %
C %
Tota
l cm
ol/
kg-
exch
angea
ble
cations
C/N
rat
io
FA
GI
Ric
hnes
s
E9 4 Loam 4.6 1.7 13 238 0.30 4.4 15.18 14.49 1 2 65
E17 4 Sand 4.0 1.3 2 64 0.10 1.3 3.02 13.13 1 2 111 K7 4 Sand 3.8 1.7 9 74 0.09 1.4 3.47 16.32 2 3 69 V10 4 Loam 5.0 1.2 7 142 0.21 2.9 8.08 14.05 1 1 56 V11 4 Sand 5.0 1.0 15 127 0.12 2.1 5.97 18.02 3 1 63
E6 3 Sand 4.1 1.3 7 77 0.10 1.3 3.70 13.75 1 2 68 E7 3 Loam 4.7 1.1 11 147 0.16 2.1 8.18 12.86 1 2 55 E8 3 Loam 4.9 1.0 5 178 0.18 2.6 11.20 14.20 1 2 68 E10 3 Sand 4.0 1.1 3 73 0.09 1.2 3.41 14.12 1 2 86 K3 3 Sand 4.3 1.2 12 125 0.16 2.3 4.71 14.01 2 3 63 K4 3 Sand 4.3 1.8 13 116 0.22 3.3 7.11 14.87 2 3 51 K5 3 Sand 4.6 1.2 10 73 0.13 2.0 5.24 15.07 2 3 38 K8 3 Sand 4.2 1.2 7 88 0.10 1.5 3.06 15.25 1 3 51 K9 3 Sand 4.2 1.3 29 99 0.11 1.8 4.20 16.30 1 3 32 K10 3 Sand 4.4 1.3 8 98 0.13 2.1 4.90 16.05 1 3 59 V7 3 Sand 5.3 0.7 7 64 0.12 1.6 5.81 13.14 3 1 60 V8 3 Sand 4.7 1.4 15 83 0.15 3.3 6.07 22.65 2 1 72 V9 3 Sand 5.4 0.6 4 44 0.05 0.7 3.31 13.47 3 1 57 V12 3 Sand 6.0 0.5 9 73 0.08 0.9 4.87 10.36 1 1 33
E11 2 Sand 3.8 1.1 6 61 0.05 0.7 2.86 13.77 1 2 35 E12 2 Sand 5.0 0.9 6 112 0.14 1.9 5.49 12.92 1 2 33 E13 2 Sand 4.3 1.1 9 100 0.09 1.4 3.95 14.67 1 2 54 E19 2 Sand 5.0 0.0 25 149 0.23 2.4 4.70 10.80 1 2 49
E18 1 Sand 5.4 0.6 32 58 0.08 1.1 5.53 13.21 1 2 38
71
3.2.4. Methods of Vegetation Classification
The 10 m2 scale quadrats (72 in total, two quadrats per 1000 m2 relevés) with 244 species cover-
abundance measurements were used in vegetation classification. The 72 quadrats with cover-
abundance and environmental data were exported from TURBOVEG in a Cornell condensed file
format used in MEGATAB (Hennekens and Schaminée 2001). Prior to export the differentiated
alpha-numerical Braun-Blanquet cover-abundance values were code-replaced using an ordinal scale
(van der Maarel 1979). All species layers (i.e. seedling, juvenile or adult) were exported to allow for
better matrix table sorting, but were later merged when appropriate in MEGATAB. The data were
classified using TWINSPAN (Hill 1979) in MEGATAB. The raw matrix table was further manually
sorted to optimize the species-group versus relevé-group coincidence.
Manual sorting of species was done in the full matrix table as well as the synoptic table to arrange
species by order of most to least frequent. Differential species were diagnosed on the basis of
fidelity (see Schaminée et al. 1995): as either exclusive differential species (de; purely in one
phytocoenon) or selective differential species (ds; if overlapping division boundaries), at this
syntaxonomic scale. Diagnostic species were assigned to a phytocoenon on the basis of their
frequency of occurrence: a strictly dichotomic numerical approach using a 40% difference in
frequency between divisions as the criterion-otherwise relegated to the common species group at
the top of the table. This dichotomic approach was repeated between subordinate divisions within
phytocoena to distinguish species faithful to certain sub-communities or variants as well. Similarly
species not differential to subordinate divisions were relegated as diagnostic for phytocoena only.
The communities were described to the level of association and sub-association or as variants. All
common species showing no fidelity to any phytocoena or divisions were re-arranged in order of
occurrence with most frequent ranked at the top (except for the group of common alien species
placed after the lowest occurring indigenous taxon). Species occurring once or twice only were
relegated to Appendix 3.5.
SYN-TAX 2000 (Podani 2001) was used to perform Complete Linkage Clustering (with Chord
Distance as a measure of resemblance) to classify 72 quadrat data (10 m2). For theory of clustering
and resemblance methodologies see Podani (1994).
72
3.2.5. Nomenclature of Plants and Plant Communities
Specimens were collected and either identified on site or in Herbaria (for the complete plant
checklist see Appendix 4.2). The nomenclature of taxa follows Goldblatt and Manning (2000) and
Goldblatt et al. (2005).
The naming of associations and sub-associations follows the principles of the syntaxonomic
nomenclature as depicted in the 3rd ed. of the Code of Phytosociological Nomenclature (Weber et
al. 2000). The communities were also named by a combination of major dominants and structural
terms.
3.2.6. Multivariate Analyses
Ordination at 10 m2 Scale
The 10 m2 quadrats were also subjected to ordination. The aim here was to identify possible
coenoclines (gradients of vegetation composition) and to compare those to environmental variables.
The nominal-scale environmental variables of quadrats included in the ordination analyses were
seral stage (four classes), grazing intensity (three classes) and fire-age (three classes), (as described
above in 3.2.1). These explanatory variables were re-coded and binarized as pseudo-variables. No
further data transformation was done prior to any ordination.
The vegetation samples were analyzed using Principle Components Analysis (PCA). The program
package CANOCO (ter Braak and Šmilauer 2002, Lepš and Šmilauer 2003) was used to perform
the linear model of indirect gradient analysis (PCA). Scaling was focussed on inter-species
correlations with species scores divided by their standard deviation, and the data were
untransformed with centring by species (not samples). Quadrat field names were re-coded with their
corresponding classified community unit code to reflect whether patterns of similarity found with
TWINSPAN vegetation classification were similar in multivariate ordination space.
The 72 quadrat data with corresponding nominal-scale environmental variables were analyzed using
Canonical Correspondence Analysis (CCA). The program package CANOCO was used to perform
the CCA. Bi-plot scaling was focussed on inter-species distances, and the data were untransformed
with no forward selection. Another CCA ordination was performed with the addition of quadrat
73
species richness included as a passive co-variable-enabling better separation of sample scores (as
they were agglomerated). The scaling was as above for the first CCA ordination with no data
transformation or forward selection.
Ordination of samples and soils variables (1000 m2 scale)
Twenty-four relevés at the 1000 m2 scale (with species presence-absence data) were analyzed using
Canonical Correspondence Analysis (CCA) to determine vegetation patterns in relation to soil
properties. The list of environmental variables measured and used in ordination is in Table 3.4 and
3.5. A CCA ordination was used to illustrate whether ploughing had altered the soil properties
relative to unploughed renosterveld. As the sample scores were agglomerated in an initial ordination
species richness of relevés was included as a passive co-variable in a bi-plot. Bi-plot scaling was
focussed on inter-species distances, and the data were untransformed with no forward selection.
3.3. Results
3.3.1. Classification of Vegetation
The first division of the 72 quadrats with TWINSPAN yielded a distinct separation between the
different-aged old fields dominated by Cynodon dactylon, and renosterveld vegetation with a
medium (60 cm) to high (> 75 cm) shrub stratum. Thus there are two major plant associations or
communities identified (Table 3.6): the Ursinia anthemoides-Cynodon dactylon Grassland (1) and
the Pterygodium catholicum–Elytropappus rhinocerotis Shrubland (2). Further secondary divisions
yielded two variants of the old-field Ursinia anthemoides–Cynodon dactylon Grassland and two
sub-associations or sub-communities of the Pterygodium catholicum–Elytropappus rhinocerotis
Shrubland, respectively.
Community 1: Ursinia anthemoides–Cynodon dactylon Grassland Community
Table 3.6, relevés 1-34
Scientific name: Ursinio anthemoidis–Cynodontetum dactyli ass. nova hoc loco
Holotypus: Table 3.6, relevé 9
74
The Ursinio anthemoidis–Cynodontetum dactyli Community was described on the basis of 34
relevés with ten diagnostic species. It is dominated by stoloniferous grass Cynodon dactylon with
the emergent annual Ursinia anthemoides (present from mid-winter to late spring). The community
is characterized also by the presence of many alien annual grasses and forbs such as Bromus rigidus
(de), Echium plantagineum (de), Erodium botrys, Lolium perenne (de), Medicago sativa (de),
Trifolium angustifolium and T. repens (de). This phytocoenon is composed of different-aged old
fields, in various stages of secondary succession following the abstention of ploughing. Recovery
has allowed for the arrival of pioneering species such as some geophytes, dwarf shrubs and shrubs,
on to these fields in the chronosequence mirroring secondary successional states of a previously
ploughed renosterveld community. The propagule sources here are both endogenous and
exogenous: from adjacent agricultural fields (alternatively with grain or pasture crops and ruderal
species) and nearby stands of either; Swartland Shale Renosterveld or Swartland Alluvium Fynbos
(Mucina and Rutherford 2004), and more rocky ridges (possibly laterites) as well as taxa which
have escaped tillage. Advancing or pioneering palatable shrub species are usually browsed by large
herbivores: for example Anthospermum spathulatum, Hermannia alnifolia, H. scabra, Muraltia
heisteria and Thesium funale). The bulbous geophyte Lachenalia contaminata (de) is present here
as it prefers open areas alongside rivulets or seasonally inundated, often growing en masse.
Variant 1: Arctotheca calendula Variant
Table 3.6, relevés 1-6
This variant comprises a small cluster of six relevés with two diagnostic species only (selective
differentials), possibly distinguished on the basis of high nutrient levels corresponding to fields of a
recent set-aside age of five years only. These fields have thus had recent applications of lime, which
were used to homogenize the soil properties. The presence of the rosette annual Arctotheca
calendula typifies this variant as does the occurrence of the alien forb Erodium moschatum.
Variant 2: Petrorhagia prolifera Variant
Table 3.6, relevés 7-34
The second variant comprises 28 relevés and seven diagnostic species with Petrorhagia prolifera
being most dominant. The other frequently occurring species are indigenous geophytes such as Disa
bracteata (de), Romulea flava (de) and Trachyandra flexifolia (de). The annuals Cerastium capense
(de) and Monopsis debilis (de) are also present. These species no doubt tolerate or thrive in poorly-
shaded conditions, where seasonal moisture (and even inundation) allows them to persist.
75
Community 2: Pterygodium catholicum–Elytropappus rhinocerotis Shrubland Community
Table 3.6, relevés 35-72
Scientific name: Pterygodio catholici–Elytropappetum rhinocerotis ass. nova hoc loco
Holotypus: Table 3.6, relevé 49
This community was described on the basis of 38 relevés and has 26 diagnostic species. Both
unploughed renosterveld and some 30-year-old fields comprise the Pterygodio catholici–
Elytropappetum rhinocerotis Community. It is dominated by Elytropappus rhinocerotis and other
co-dominant shrub species: Anthospermum galioides (de), Eriocephalus africanus subsp.
paniculatus (kapokbos) and Lobostemon argenteus (de). The emergent proteoid Leucadendron
lanigerum var. lanigerum (de) is occasional. These shrubs often reach a height of 1.2 m (even 1.5
m) in unploughed renosterveld and 30-year-old fields. These 30-year-old fields have differing
disturbance histories-some were ploughed often and utilized extensively for agriculture, whilst
others were briefly ploughed and abandoned when deemed unsuitable for crops due to the rockiness
of the substrate. These 30-year-old fields are either surrounded by unploughed renosterveld or in
close proximity to unploughed renosterveld. Propagules are dispersed on to old fields by wind as
well as by animals (ecto- or endozoochory), where they are kept at a height of 30 to 70 cm due to
browsing by herbivores. Dwarf shrubs like Aspalathus ciliaris (de), Erica coarctata (de),
Pelargonium myrrhifolium (de) and Phylica strigulosa (de) - a resprouter often partially browsed -
are interspersed amongst shrubs or open spaces. The small suffrutescent Polygala scabra (de) is
hairy and cryptic usually occurring in the shade of bushes. One can often distinguish three
vegetation strata, with the first being that of the tall shrubs, the second of low-grown prostrate and
dwarf shrubs, and the third one comprising graminoids, rosette perennials, geophytes and annuals.
The ground stratum is often partially covered by lichens and mosses, the latter especially from early
winter to late spring, however these were not sampled. Anthospermum galioides is indifferent to
disturbance by fire, either killed or able to resprout from the base (personal observation; Puff 1986)
and often browsed short, otherwise rambling. The orchid Pterygodium catholicum (de), diagnostic
for this community, is usually encountered in leaf during its growing season from mid winter (June)
to late spring (October) until flowering. It is a clonal geophyte forming large clumps under bushes
or near them, in moss and annual covered clayey soils often broken up by earthworm activity. An
interaction with an oil collecting bee (Rediviva peringueyi) determines whether seed is set for
Pterygodium catholicum (likewise for the annual Hemimeris racemosa), whereby the bee pollinator
requires an ample sized stand of vegetation for a solitary nesting site in which to burrow into the
soil (Pauw 2004). Typically, following fire annuals and graminoids dominate the ground stratum
76
and geophytes are stimulated to flower en masse (Goldblatt and Manning 2002; personal
observation; A. Pauw, personal communication; B. Bytebier, personal communication). The erect
Gladiolus watsonius (de) typical of heavy clay soils (Delpierre and du Plessis 1974) and endemic
(Goldblatt and Manning 1998) to West Coast Renosterveld, could be considered a flagship species
here as it mostly has been observed in unploughed renosterveld (occasionally in 30-year-old fields)
and is a sheer delight to the eye and nose and no doubt to its pollinator (s). Other geophytes
occurring in this community are; Cyphia volubilis (de) (intricately intertwined in the protection
afforded by bushes from browsing) is striking when in bloom, the prostrate Cyphia phyteuma (de)
nestles under or amongst bush cover or in small spaces, Moraea gawleri (de) often up to 60 cm, is
abundant in places in spring as are many unidentified taxa of Drimia s.l. (de) and of Eriospermum
(de). Annuals begin to germinate in early winter and mostly flower during or before spring. These
include Adenogramma lichtensteiniana (de), Diascia elongata (de), Hemimeris racemosa (de),
Phyllopodium cordatum (de), Sebaea albens (de) and Vellereophytum dealbatum (de). The
graminoids here are the short perennial grasses: Tribolium hispidum and T. uniolae; and the weakly
perennial or annual Pentachistis airoides subsp. airoides The latter species is common in
renosterveld “forming a thick mat between the bushes” (Linder and Ellis 1990). The grasses do
considerably well amongst bushes or interstitial open spaces, in the absence or presence of grazers,
and flourish shortly after fire.
Sub-community 1: Oxalis pes-caprae–Hermannia alnifolia Sub-community
(Table 3.6, relevés 35-58)
Scientific name: Pterygodio catholici-Elytropappetum rhinocerotosi oxalidetosum pedis-
capraeae subass. nova
Holotypus: Table 3.6, relevé 49
This sub-community was described on the basis of 24 relevés; it has 12 diagnostic species, and it is
often dominated by the shrub Hermannia alnifolia (de) also by the decumbent palatable pea
Indigofera psoraloides (de) and occasionally Otholobium decumbens (de). It contains many
geophytes such as Androcymbium capense (de), Babiana odorata (de), Cyanella lutea (de),
Hesperantha falcata (de), Oxalis pes-caprae, O. tomentosa and Sparaxis villosa (de). The fern
Mohria caffrorum (de) occurs here with the succulent annual plant Carpanthea pomeridiana (de),
the former occurring most abundantly in unploughed stands representing a rich green or thick
stratum over the soil surface pedoderm during winter. This community is influenced by herbivory
since many species are palatable (see van Breda and Barnard 1991) and Hermannia alnifolia,
having an endo-zoorochorous mode of dispersal (Shiponeni 2003) is typically browsed to 50 cm
77
here, even amongst dense shrub cover. Hermannia alnifolia and H. scabra are usually reseeders and
form dense stands a short period following fire (especially in the absence of browsers at Voëlvlei)
and flower in the next season. Their abundance declines as more dominant and less palatable shrubs
mature, like Elytropappus rhinocerotis and Athanasia trifurcata.
Sub-community 2: Ischyrolepis capensis-Anthospermum spathulatum Sub-community
(Table 3.6, relevés 59-72)
Scientific name: Pterygodio catholici-Elytropappetum rhinocerotis ischyrolepidetosum capensis
subass. nova hoc. loco
Holotypus: Table 3.6, relevé 62
This sub-community is based on 14 relevés and 19 diagnostic species. It is dominated by the restio
Ischyrolepis capensis, which occurs in dry habitats and disturbed places at low elevations (Haaksma
and Linder 2000), the shrub Anthospermum spathulatum (de) (often stunted by browsing) and the
dwarf shrub Aspalathus ciliaris. A. spathulatum is usually killed by fire, but occasionally resprouts
from the base as well (Puff 1986; B. A. Walton, personal observation). The resprouting habit is
probably dependant on moisture availability. The plant often forms a stunted rounded bush here
from browsing, unlike its usual erect habit. Ehrharta longifolia, Ficinia indica and Ischyrolepis
gaudichaudianus (de) are other graminoids occurring in this vegetation type. Ischyrolepis capensis,
I. gaudichaudianus and Ficinia indica are all resprouters rejuvenated after fire; Ficinia indica is
usually browsed either by termites or mammalian herbivores. Ehrharta longifolia is an annual or
pauciennial found under cover of shrubs as a respite from direct sunshine and grazers. The rosette
hemicryptophyte Berkheya armata (de) is common, while Gazania serrata occurs occasionally on
the flats especially in more open areas, and Lotononis prostrata (de) rambles throughout in places.
Aristea africana (de), Empodium plicatum, Eriospermum capense (de), Lachenalia pallida,
Lapeirousia azurea (de), Oxalis livida, Spiloxene capensis (de) and Wachendorfia brachyandra are
the most common geophytes here. The wealth of geophytes, in particular the presence of wetland
type taxa like Empodium and Spiloxene, suggest a less well-drained habitat than Sub-community 1.
The latter taxa grow along verges of rivulets or seasonal rivers and often occur in drainage lines of
old fields. The succulent Lampranthus elegans with an erect, prostrate or spreading habit occurs
often in seasonally inundated flats and is a marvel to the eye, as well as the mat-forming
Lampranthus tegens (de).
The hierarchical clustering (complete linkage with chord distance) corroborated the vegetation
classification of quadrats found using TWINSPAN quite well (Figure 3.3). The first split showed
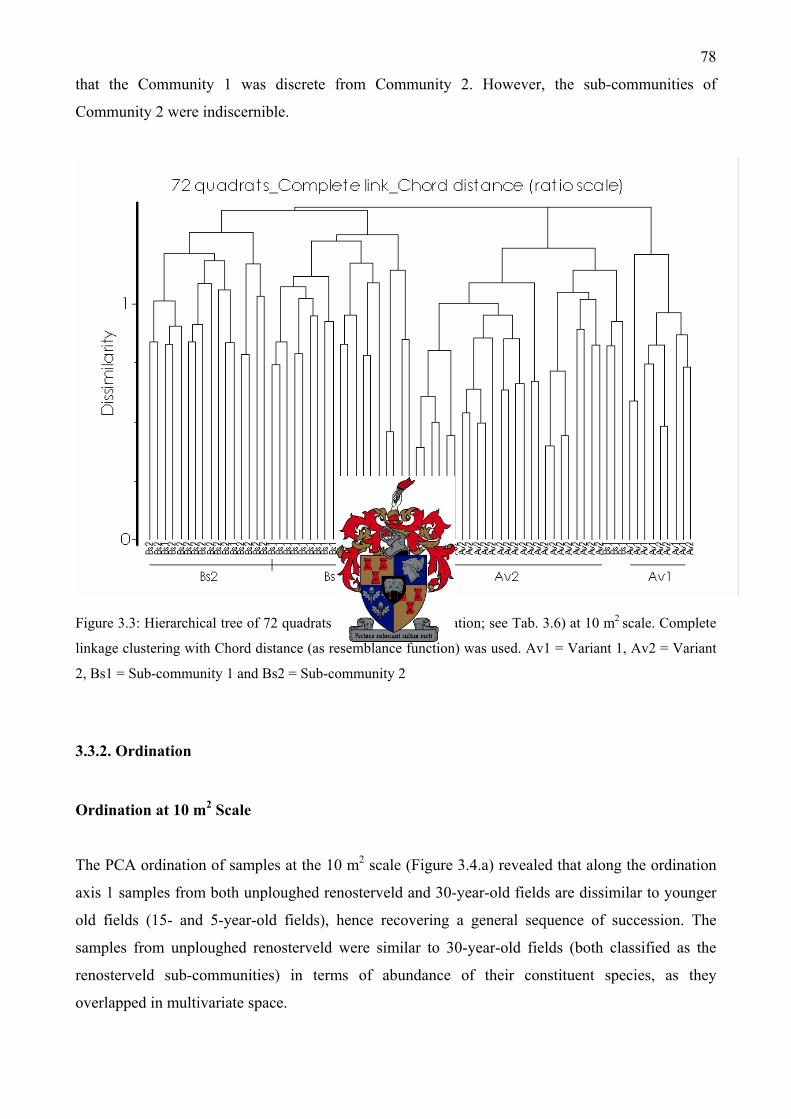
78
that the Community 1 was discrete from Community 2. However, the sub-communities of
Community 2 were indiscernible.
Figure 3.3: Hierarchical tree of 72 quadrats (as used in classification; see Tab. 3.6) at 10 m2 scale. Complete
linkage clustering with Chord distance (as resemblance function) was used. Av1 = Variant 1, Av2 = Variant
2, Bs1 = Sub-community 1 and Bs2 = Sub-community 2
3.3.2. Ordination
Ordination at 10 m2 Scale
The PCA ordination of samples at the 10 m2 scale (Figure 3.4.a) revealed that along the ordination
axis 1 samples from both unploughed renosterveld and 30-year-old fields are dissimilar to younger
old fields (15- and 5-year-old fields), hence recovering a general sequence of succession. The
samples from unploughed renosterveld were similar to 30-year-old fields (both classified as the
renosterveld sub-communities) in terms of abundance of their constituent species, as they
overlapped in multivariate space.
79
Table 3.6: Structured full relevé table of 10 m2 quadrats of renosterveld and old fields at the Agter-
Groeneberg Conservancy. HL = herb layer, SL = shrub layer; grazing code is the level of intensity (1 = none,
2 = moderate and 3 = high); seral code is the seral stage (1 = 5-year-old fields, 2 = 15-year-old fields, 3 = 30-
year-old fields and 4 = unploughed renosterveld); fire age code is the post-fire age of vegetation (1 = 20-29
years ago, 2 = 10-19 years ago, and 4 = < 5 years ago ). Alien taxa are in italics. See Appendix 3.6 for a list
of infrequently occurring taxa, omitted in this table. The column "Diag." indicates the diagnostic value of a
taxon as a composite code; c = common species in this table, de = exclusive differential species, ds =
selective differential species.
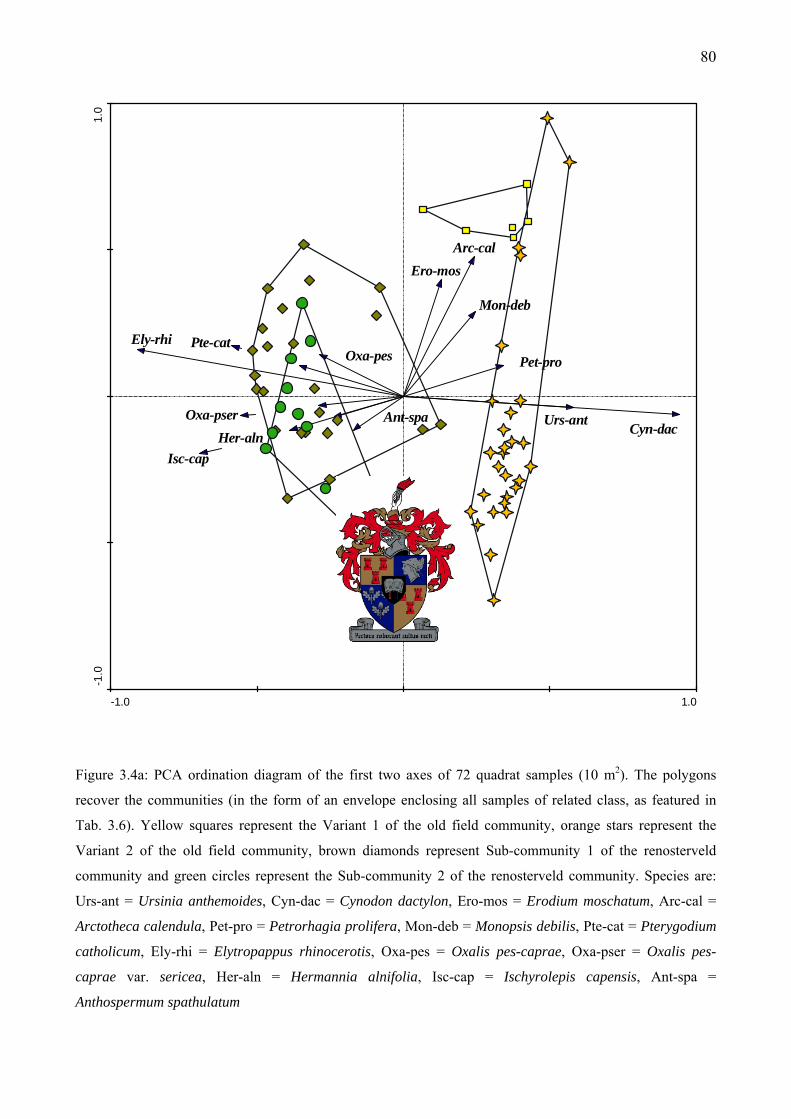
80
-1.0 1.0
-1.0
1.0
Ely-rhi
Isc-cap
Oxa-pserHer-aln
Pte-cat
Ant-spaCyn-dacUrs-ant
Pet-proOxa-pes
Mon-deb
Arc-calEro-mos
Figure 3.4a: PCA ordination diagram of the first two axes of 72 quadrat samples (10 m2). The polygons
recover the communities (in the form of an envelope enclosing all samples of related class, as featured in
Tab. 3.6). Yellow squares represent the Variant 1 of the old field community, orange stars represent the
Variant 2 of the old field community, brown diamonds represent Sub-community 1 of the renosterveld
community and green circles represent the Sub-community 2 of the renosterveld community. Species are:
Urs-ant = Ursinia anthemoides, Cyn-dac = Cynodon dactylon, Ero-mos = Erodium moschatum, Arc-cal =
Arctotheca calendula, Pet-pro = Petrorhagia prolifera, Mon-deb = Monopsis debilis, Pte-cat = Pterygodium
catholicum, Ely-rhi = Elytropappus rhinocerotis, Oxa-pes = Oxalis pes-caprae, Oxa-pser = Oxalis pes-
caprae var. sericea, Her-aln = Hermannia alnifolia, Isc-cap = Ischyrolepis capensis, Ant-spa =
Anthospermum spathulatum
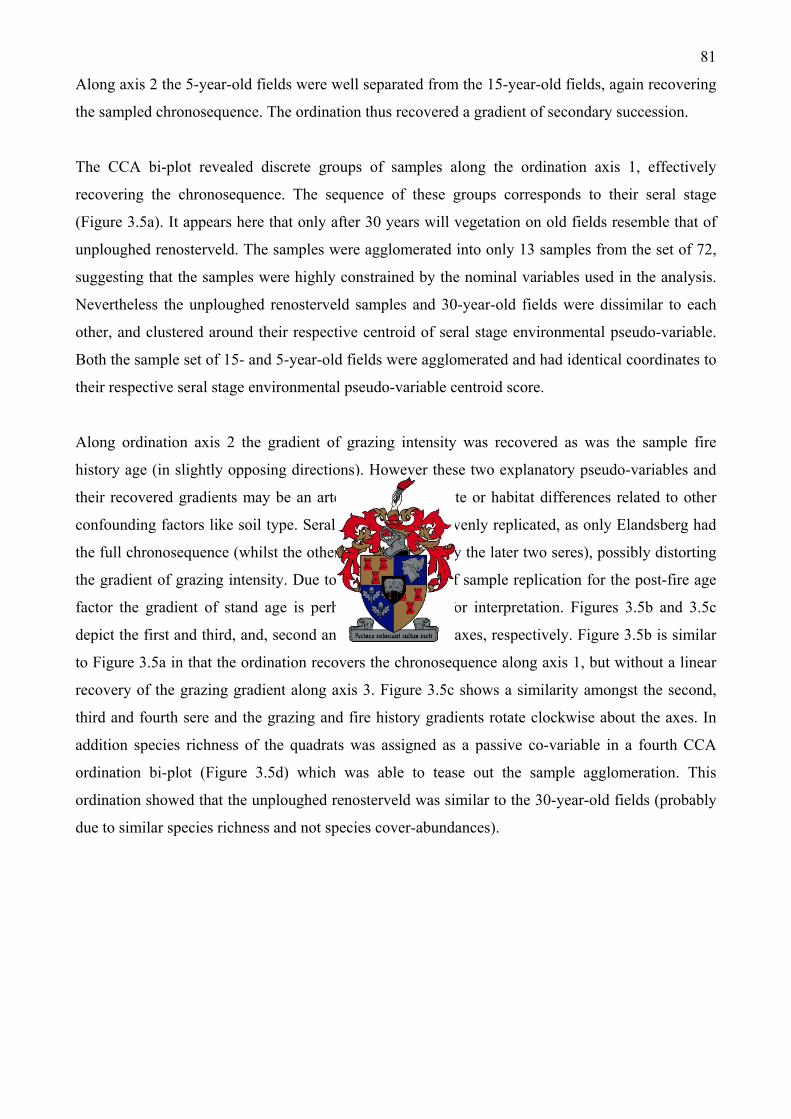
81
Along axis 2 the 5-year-old fields were well separated from the 15-year-old fields, again recovering
the sampled chronosequence. The ordination thus recovered a gradient of secondary succession.
The CCA bi-plot revealed discrete groups of samples along the ordination axis 1, effectively
recovering the chronosequence. The sequence of these groups corresponds to their seral stage
(Figure 3.5a). It appears here that only after 30 years will vegetation on old fields resemble that of
unploughed renosterveld. The samples were agglomerated into only 13 samples from the set of 72,
suggesting that the samples were highly constrained by the nominal variables used in the analysis.
Nevertheless the unploughed renosterveld samples and 30-year-old fields were dissimilar to each
other, and clustered around their respective centroid of seral stage environmental pseudo-variable.
Both the sample set of 15- and 5-year-old fields were agglomerated and had identical coordinates to
their respective seral stage environmental pseudo-variable centroid score.
Along ordination axis 2 the gradient of grazing intensity was recovered as was the sample fire
history age (in slightly opposing directions). However these two explanatory pseudo-variables and
their recovered gradients may be an artefact of specific site or habitat differences related to other
confounding factors like soil type. Seral stages were not evenly replicated, as only Elandsberg had
the full chronosequence (whilst the other two sites had only the later two seres), possibly distorting
the gradient of grazing intensity. Due to the unevenness of sample replication for the post-fire age
factor the gradient of stand age is perhaps not reliable for interpretation. Figures 3.5b and 3.5c
depict the first and third, and, second and third ordination axes, respectively. Figure 3.5b is similar
to Figure 3.5a in that the ordination recovers the chronosequence along axis 1, but without a linear
recovery of the grazing gradient along axis 3. Figure 3.5c shows a similarity amongst the second,
third and fourth sere and the grazing and fire history gradients rotate clockwise about the axes. In
addition species richness of the quadrats was assigned as a passive co-variable in a fourth CCA
ordination bi-plot (Figure 3.5d) which was able to tease out the sample agglomeration. This
ordination showed that the unploughed renosterveld was similar to the 30-year-old fields (probably
due to similar species richness and not species cover-abundances).
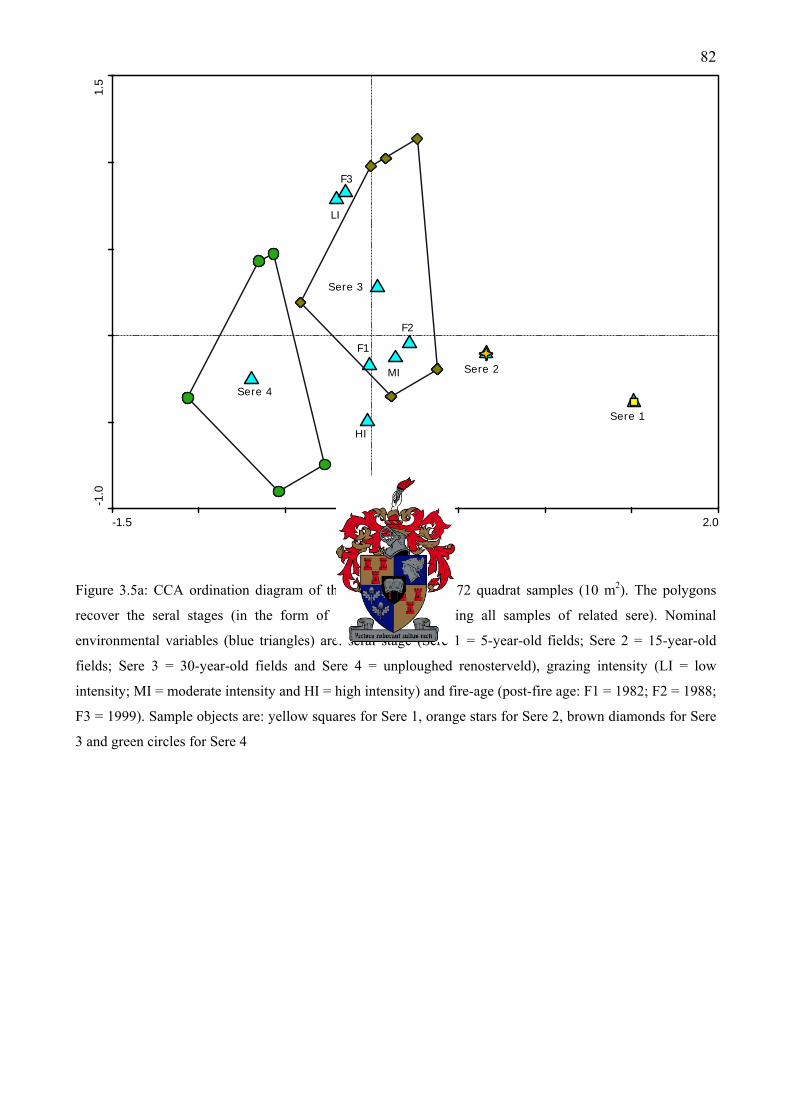
82
-1.5 2.0
-1.0
1.5
Sere 1
Sere 2
Sere 3
Sere 4
LI
MI
HI
F1
F2
F3
Figure 3.5a: CCA ordination diagram of the first two axes of 72 quadrat samples (10 m2). The polygons
recover the seral stages (in the form of an envelope enclosing all samples of related sere). Nominal
environmental variables (blue triangles) are: seral stage (Sere 1 = 5-year-old fields; Sere 2 = 15-year-old
fields; Sere 3 = 30-year-old fields and Sere 4 = unploughed renosterveld), grazing intensity (LI = low
intensity; MI = moderate intensity and HI = high intensity) and fire-age (post-fire age: F1 = 1982; F2 = 1988;
F3 = 1999). Sample objects are: yellow squares for Sere 1, orange stars for Sere 2, brown diamonds for Sere
3 and green circles for Sere 4
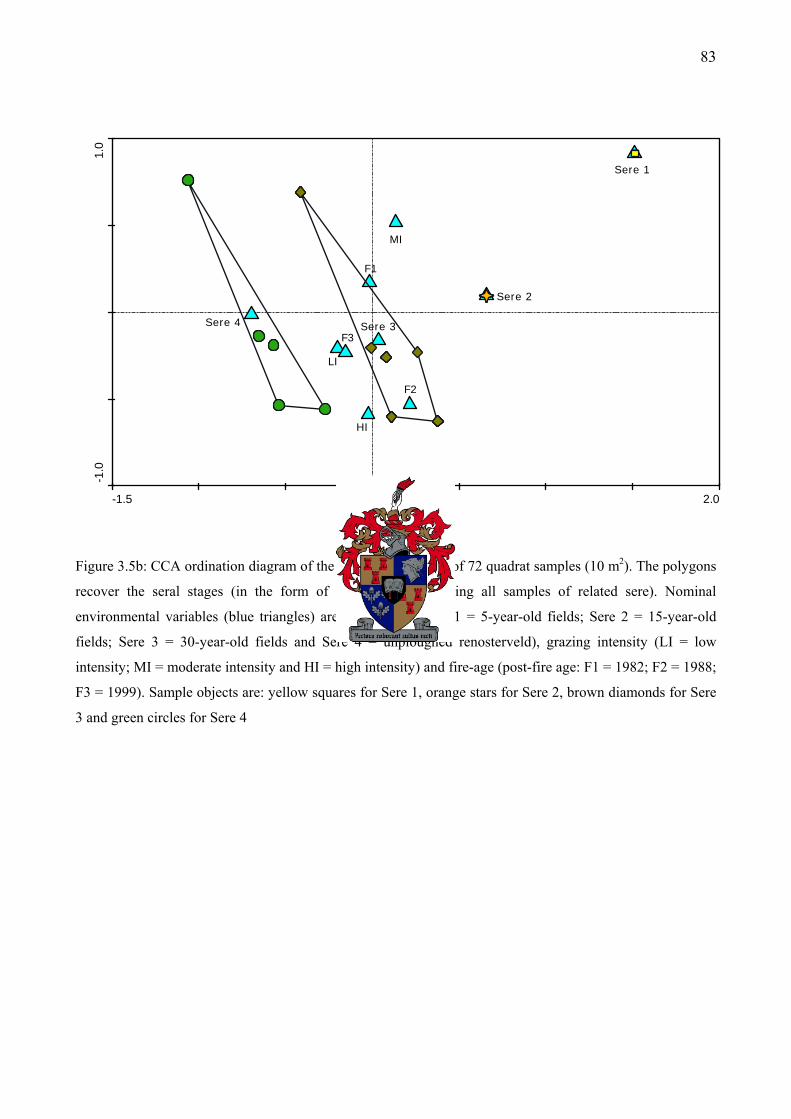
83
-1.5 2.0
-1.0
1.0
Sere 1
Sere 2
Sere 3Sere 4
LI
MI
HI
F1
F2
F3
Figure 3.5b: CCA ordination diagram of the first and third axes of 72 quadrat samples (10 m2). The polygons
recover the seral stages (in the form of an envelope enclosing all samples of related sere). Nominal
environmental variables (blue triangles) are: seral stage (Sere 1 = 5-year-old fields; Sere 2 = 15-year-old
fields; Sere 3 = 30-year-old fields and Sere 4 = unploughed renosterveld), grazing intensity (LI = low
intensity; MI = moderate intensity and HI = high intensity) and fire-age (post-fire age: F1 = 1982; F2 = 1988;
F3 = 1999). Sample objects are: yellow squares for Sere 1, orange stars for Sere 2, brown diamonds for Sere
3 and green circles for Sere 4
84
-1.0 1.5
-1.0
1.0
Sere 1
Sere 2
Sere 3
Sere 4
LI
MI
HI
F1
F2
F3
Figure 3.5c: CCA ordination diagram of the second and third axes of 72 quadrat samples (10 m2). The
polygons recover the seral stages (in the form of an envelope enclosing all samples of related sere). Nominal
environmental variables (blue triangles) are: seral stage (Sere 1 = 5-year-old fields; Sere 2 = 15-year-old
fields; Sere 3 = 30-year-old fields and Sere 4 = unploughed renosterveld), grazing intensity (LI = low
intensity; MI = moderate intensity and HI = high intensity) and fire-age (post-fire age: F1 = 1982; F2 = 1988;
F3 = 1999). Sample objects are: yellow squares for Sere 1, orange stars for Sere 2, brown diamonds for Sere
3 and green circles for Sere 4
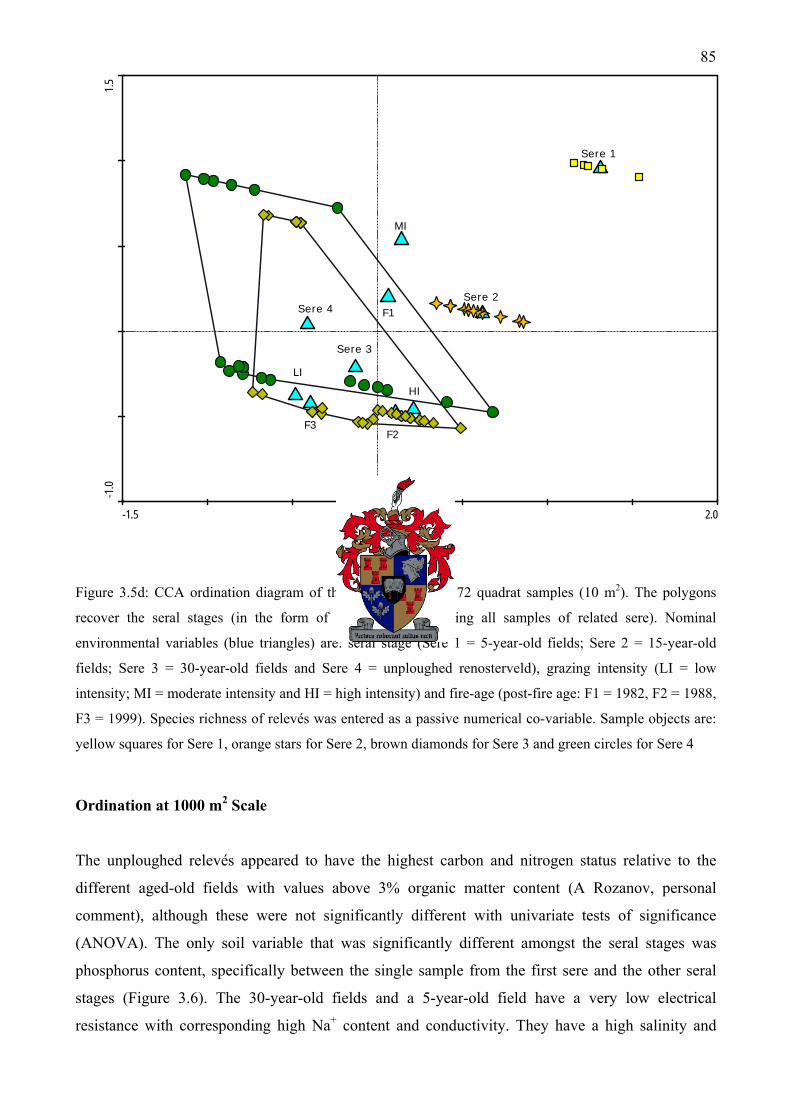
85
-1.5 2.0
-1.0
1.5
Sere 1
Sere 2
Sere 3
Sere 4
LI
MI
HI
F1
F2F3
Figure 3.5d: CCA ordination diagram of the first two axes of 72 quadrat samples (10 m2). The polygons
recover the seral stages (in the form of an envelope enclosing all samples of related sere). Nominal
environmental variables (blue triangles) are: seral stage (Sere 1 = 5-year-old fields; Sere 2 = 15-year-old
fields; Sere 3 = 30-year-old fields and Sere 4 = unploughed renosterveld), grazing intensity (LI = low
intensity; MI = moderate intensity and HI = high intensity) and fire-age (post-fire age: F1 = 1982, F2 = 1988,
F3 = 1999). Species richness of relevés was entered as a passive numerical co-variable. Sample objects are:
yellow squares for Sere 1, orange stars for Sere 2, brown diamonds for Sere 3 and green circles for Sere 4
Ordination at 1000 m2 Scale
The unploughed relevés appeared to have the highest carbon and nitrogen status relative to the
different aged-old fields with values above 3% organic matter content (A Rozanov, personal
comment), although these were not significantly different with univariate tests of significance
(ANOVA). The only soil variable that was significantly different amongst the seral stages was
phosphorus content, specifically between the single sample from the first sere and the other seral
stages (Figure 3.6). The 30-year-old fields and a 5-year-old field have a very low electrical
resistance with corresponding high Na+ content and conductivity. They have a high salinity and
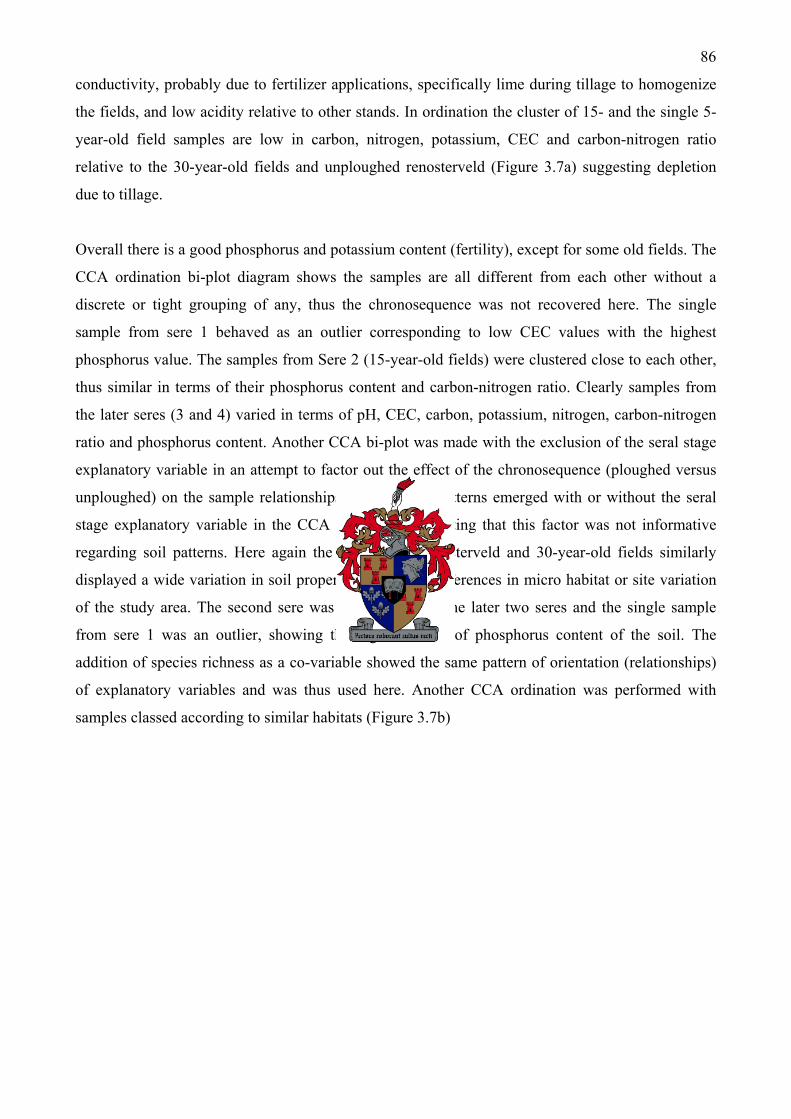
86
conductivity, probably due to fertilizer applications, specifically lime during tillage to homogenize
the fields, and low acidity relative to other stands. In ordination the cluster of 15- and the single 5-
year-old field samples are low in carbon, nitrogen, potassium, CEC and carbon-nitrogen ratio
relative to the 30-year-old fields and unploughed renosterveld (Figure 3.7a) suggesting depletion
due to tillage.
Overall there is a good phosphorus and potassium content (fertility), except for some old fields. The
CCA ordination bi-plot diagram shows the samples are all different from each other without a
discrete or tight grouping of any, thus the chronosequence was not recovered here. The single
sample from sere 1 behaved as an outlier corresponding to low CEC values with the highest
phosphorus value. The samples from Sere 2 (15-year-old fields) were clustered close to each other,
thus similar in terms of their phosphorus content and carbon-nitrogen ratio. Clearly samples from
the later seres (3 and 4) varied in terms of pH, CEC, carbon, potassium, nitrogen, carbon-nitrogen
ratio and phosphorus content. Another CCA bi-plot was made with the exclusion of the seral stage
explanatory variable in an attempt to factor out the effect of the chronosequence (ploughed versus
unploughed) on the sample relationships. No different patterns emerged with or without the seral
stage explanatory variable in the CCA ordination suggesting that this factor was not informative
regarding soil patterns. Here again the unploughed renosterveld and 30-year-old fields similarly
displayed a wide variation in soil properties related to differences in micro habitat or site variation
of the study area. The second sere was dissimilar from the later two seres and the single sample
from sere 1 was an outlier, showing the highest levels of phosphorus content of the soil. The
addition of species richness as a co-variable showed the same pattern of orientation (relationships)
of explanatory variables and was thus used here. Another CCA ordination was performed with
samples classed according to similar habitats (Figure 3.7b)

87
1 2 3 4
Seral stage
-10
-5
0
5
10
15
20
25
30
35
40P
Bray
II m
g/kg
aa
ab
b
F (3, 20) = 3.5142, p = 0.03405
Figure 3.6: A one-way ANOVA test of phosphorus content (y-axis, weighted means) per sere. 1 = a single 5-
year-old field (Sere 1), 2 = 15-year-old fields (Sere 2, n = 4), 3 = 30-year-old fields (Sere 3, n = 14) and 4 =
unploughed renosterveld (Sere 4, n = 5). Vertical bars denote 0.95 confidence intervals; characters depict
Bonferroni degree of similarity
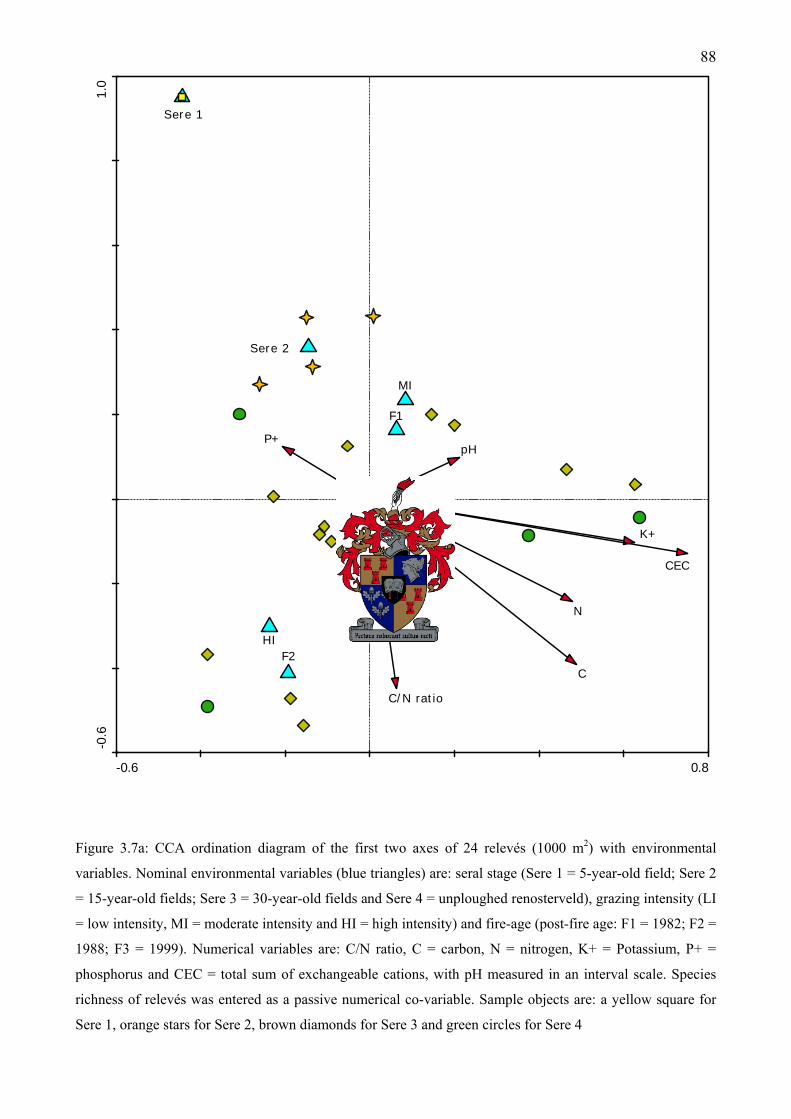
88
-0.6 0.8
-0.6
1.0
pH
C
N
P+
K+
CEC
C/N ratio
Sere 1
Sere 2
S3
S4
LI
MI
HI
F1
F2
F3
Figure 3.7a: CCA ordination diagram of the first two axes of 24 relevés (1000 m2) with environmental
variables. Nominal environmental variables (blue triangles) are: seral stage (Sere 1 = 5-year-old field; Sere 2
= 15-year-old fields; Sere 3 = 30-year-old fields and Sere 4 = unploughed renosterveld), grazing intensity (LI
= low intensity, MI = moderate intensity and HI = high intensity) and fire-age (post-fire age: F1 = 1982; F2 =
1988; F3 = 1999). Numerical variables are: C/N ratio, C = carbon, N = nitrogen, K+ = Potassium, P+ =
phosphorus and CEC = total sum of exchangeable cations, with pH measured in an interval scale. Species
richness of relevés was entered as a passive numerical co-variable. Sample objects are: a yellow square for
Sere 1, orange stars for Sere 2, brown diamonds for Sere 3 and green circles for Sere 4
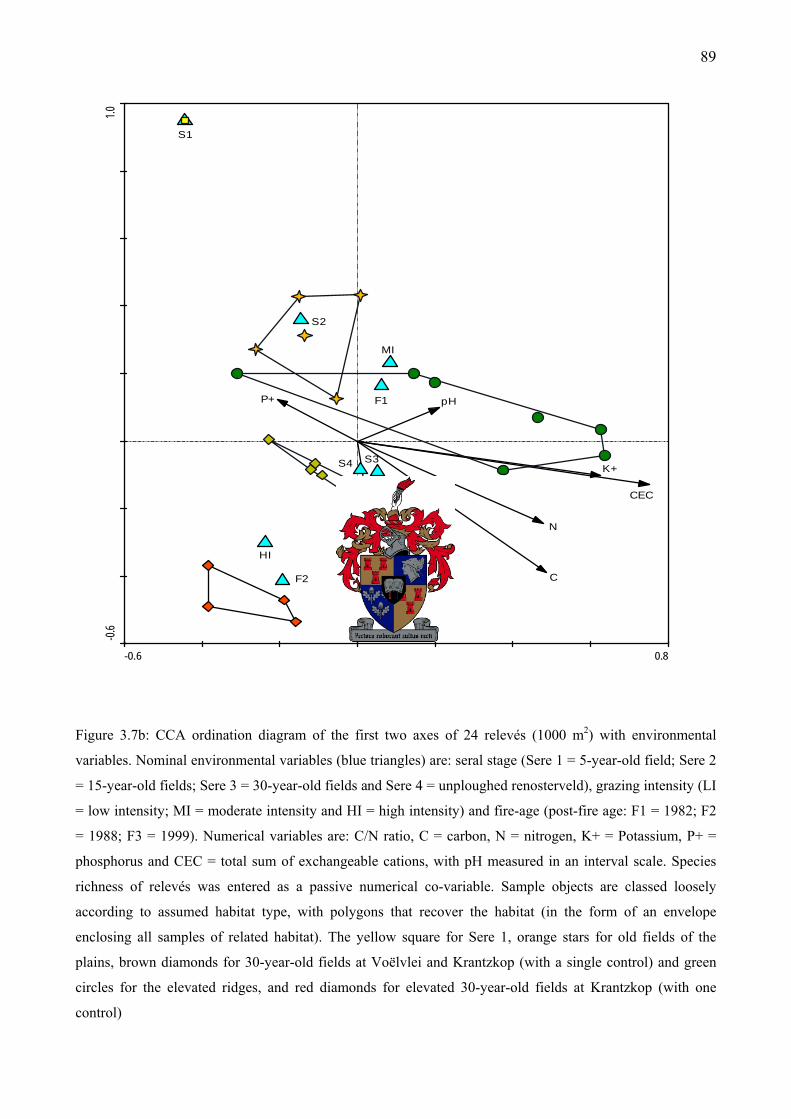
89
-0.6 0.8
-0.6
1.0
pH
C
N
P+
K+
CEC
C/N ratio
S1
S2
S3S4
LI
MI
HI
F1
F2
F3
Figure 3.7b: CCA ordination diagram of the first two axes of 24 relevés (1000 m2) with environmental
variables. Nominal environmental variables (blue triangles) are: seral stage (Sere 1 = 5-year-old field; Sere 2
= 15-year-old fields; Sere 3 = 30-year-old fields and Sere 4 = unploughed renosterveld), grazing intensity (LI
= low intensity; MI = moderate intensity and HI = high intensity) and fire-age (post-fire age: F1 = 1982; F2
= 1988; F3 = 1999). Numerical variables are: C/N ratio, C = carbon, N = nitrogen, K+ = Potassium, P+ =
phosphorus and CEC = total sum of exchangeable cations, with pH measured in an interval scale. Species
richness of relevés was entered as a passive numerical co-variable. Sample objects are classed loosely
according to assumed habitat type, with polygons that recover the habitat (in the form of an envelope
enclosing all samples of related habitat). The yellow square for Sere 1, orange stars for old fields of the
plains, brown diamonds for 30-year-old fields at Voëlvlei and Krantzkop (with a single control) and green
circles for the elevated ridges, and red diamonds for elevated 30-year-old fields at Krantzkop (with one
control)
90
3.4. Discussion
3.4.1. Vegetation Community Patterns
Acocks (1988) showed a picture of renosterveld at the AGC (Welbedacht Farm) and listed species
occurring in both renosterveld and fynbos, apparently descriptive for “western” coastal renosterveld
then. A tentative phytosociological survey of fynbos and renosterveld vegetation at Elandsberg was
done by Diemer (2000). The renosterveld “community” has species found in my survey of
renosterveld, but I failed to establish the relevé size at which the survey was done. An attempt at
classifying renosterveld on the Tygerberg Hills, excluding the annual and geophytic components,
was made by Paterson (1982). The informal classification was not comprehensive and many taxa
remained unidentified. A phytosociological study of renosterveld on Signal Hill by Joubert and
Moll (1992) is comprehensive, and two separate tables are shown for perennial versus ephemeral
taxa. Group I, an overlap of two communities, seems to correspond with the Pterygodio catholici–
Elytropappetum rhinocerotis Shrubland of this study, albeit on steep slopes of Signal Hill with
different component species. The most comprehensive study of renosterveld vegetation with
classification, description and mapping of communities to date was conducted by Boucher (1987),
who also included relevés sampled at Krantzkop (Welbedacht Farm) and Elandsberg. The
communities described by Boucher (l.c.) at Krantzkop and Elandsberg include the Ischyrolepo-
Leucospermum calligeri (Boucher 1987, Figure 104), the “Oleo-Eucleetum acutifoliae bush-
clump”, and the “Ischyrolepo-Leucadendron brunioides” (Boucher 1987, Figure 105), both
subordinate to the Ehrharto - Elytropappetalia rhinocerotidis and the Elytropappo - Ischyrolepion
capensi. Here both Alluvium Shale Fynbos has been classified together with Swartland Shale
Renosterveld, which are two distinct vegetation types. Boucher (l.c.) described many renosterveld
and derived communities on both flat and sloped ground at the Bottelary Hills, Devon Valley,
Groeneberg, Helderfontein Farm, Kanonkop, Paardeberg and Saron. Taylor (1996) described the
Ischyrolepis capensis - Elytropappus rhinocerotis, occurring in the Cederberg Pakhuis shale band,
as distinct from the surrounding mountain fynbos with 16 exclusive taxa. There is a high cover and
diversity of the graminoid element on these fine textured soils and the community is dominated by
Elytropappus rhinocerotis with occasional emergent orthophyllous proteoids. The difference
between Taylor’s community and the Pterygodio catholici–Elytropappetum rhinocerotis Shrubland
is that the former occurs at higher elevations often on slopes probably within a higher rainfall
91
regime, and the suite of species is entirely different. Linder (1976) correlated percentage clay and
silt in soil with pH and found renosterveld communities had a preference for higher values than
fynbos on the Piketberg. Linder’s Renosterveld community had two strata only with an 80%-90%
shrub cover (and occasional open patches with grasses Ehrharta and Merxmuellera co-dominant).
This community occurs on shale without fynbos elements (up to 600 m) and shares constant species
(like Elytropappus rhinocerotis, Eriocephalus africanus, Euryops speciosissimus and Mohria
caffrorum) with the Relhania squarrosa “Dry Fynbos” community on lower slopes (between 300-
600 m). Thus the Renosterveld community would be unlike that which I have described here only in
terms of being on a slope at a higher altitude, as there is a high richness of annuals and geophytes.
An inventory of the Darling Hills was done by Heydenrych and Littlewort (1995) who listed 420
species (of which nearly one third were monocotyledonous), but did not attempt a community
description. Rebelo et al. (1991), using a structural approach (see Linder and Campbell 1979,
Campbell et al. 1981, Campbell 1985), described a renosterveld shrubland in the Riversdale Plain as
a Series within the Karroid and Renoster Shrubland Group. This renosterveld shrubland was
differentiated on the basis of low total cover, a high asteraceous cover, presence of succulents, and
absence of fynbos flagship taxa (proteoids, ericoids and restiods). The Bokkeveld Shale formation
was shared by the renosterveld shrubland in the west and Kaffrian Succulent Thicket in the east
(almost discretely divided by the Kafferkuils River), the latter on deeper soils and steeper
topography. Cowling (1984) surveyed South Coast Renosterveld in the Humansdorp region
describing four communities of renosterveld there. Similarly Cowling et al. (1988) did a
phytosociological survey of the Agulhas Plain using Campbell’s approach and also described a
Renoster Shrubland Group which shared the dominant Elytropappus rhinocerotis with the
Mesotrophic Asteraceous Fynbos Sub-series.
Thus the communities described here are unique at the association level in the Fynbos Biome. The
Pterygodio catholici–Elytropappetum rhinocerotis Shrubland has in part been described before but
not as this association. The Ursinio anthemoidis–Cynodontetum dactyli Grassland description is
unique, probably as old fields have not ever been described locally. The diagnostic species for both
communities will provide a key to the identification of communities in the field. The communities
described will add to an ecological understanding of renosterveld and form part of a larger
framework of renosterveld vegetation classification and description.
92
3.4.2. Gradient Analyses
The communities described were investigated further in relation to explanatory (environmental)
variables (seral stage, grazing intensity and post-fire age). The ordination and grouping of
vegetation samples was similar to that of the numerical vegetation classification. Thus an indirect
gradient analysis (PCA) showed the variants of Community 1 to be discrete entities and dissimilar
to Community 2, whilst the two Sub-communities of Community 2 were similar to each other. With
a constrained ordination (CCA) using the explanatory variables it was clear that the seral stage of
the samples was the most discriminating factor and that the chronosequence or secondary
succession was effectively recovered along the first axis. With the inclusion of species richness as a
co-variable, it was shown that 30-year-old fields were similar to unploughed renosterveld. This
implies that species richness and their cover-abundance of 30-year old fields had sufficient time to
resemble unploughed renosterveld.
The CCA ordination thus shows a pattern of difference in species composition with time or the
advancement of succession. The temporal change in species composition with succession shows a
turnover of species, where ruderal species are replaced by more typical renosterveld species. Thus
renosterveld appears to be resilient to a destructive ploughing event, especially if the ploughing
frequency is low or occurred once only, and if given ample rest.
The constrained ordination (CCA) of 24 samples (at the 1000 m2 scale) with the explanatory
variables (soil properties, seral stage, grazing intensity, post-fire age and species richness) was not
clear. Perhaps an unequal replication of samples for all levels of disturbances was a limitation in
producing a pattern of discrete groups of similar samples. However both the 30-year-old fields and
unploughed renosterveld showed a wide variation in soil characteristics probably attributed to
micro-habitat differences, and were similar in that regard. Thus some 30-year old fields were either
not often ploughed (as was the case at Elandsberg) and their soils properties were not irreversibly
altered like the often ploughed younger old fields. The group of 15-year-old fields were a discrete
entity in terms of similar soil characteristics, notably with high phosphorus content relative to the
other samples. Thus the artefact of the addition of lime to the agricultural fields was recovered in
the ordination, as this had not effectively been diluted from the site. The phosphorus content was
independent of the carbon and nitrogen content in this study, which is unusual (Dr. A. Rozanov,
personal communication), indicating that besides the organic phosphorus content of the soil the
addition of mineral phosphorous (and persistence in the soil) has made these variables
independently related. What the ordination did show anecdotally was the difference in micro-habitat
93
soil characteristics-especially along Axis 2 with the C/N ratio-which I loosely categorized (on the
basis of personal observations) into: old fields of the “plains”, elevated ridges, 30-year-old fields
(from Voëlvlei, with one control, and Krantzkop) and elevated 30-year-old fields from Krantzkop
(with one control). Thus even after transformation, soil properties are probably determined by the
micro-habitat and local soil forms which determine the “type” of vegetation more so than a previous
ploughing event.
94
3.5. References
Acocks JPH (1953) Veld Types of South Africa. Botanical Survey of South Africa Memoir No. 28.
The Government Printer, Pretoria, pp 1-192
Acocks JPH (1988) Veld types of South Africa. (3rd edn). Memoirs of the Botanical Survey of
South Africa 57. Botanical Research Institute, Pretoria. ISBN 0-621-11394-8
Adamson RS (1938) The vegetation of South Africa. Monographs of British Empire Vegetation.
Whitefriars Press, London, pp 1-234
Barkman JJ, Doing H, Segal S (1964) Kritische Bemerkungen und Vorschläge zur quantitativen
Vegetationsanalyse. Acta Botanica Neerlandica 13: 394-419
Bothma J du P (2002) Game ranch management. 4th ed. Van Schaik, Pretoria. ISBN 0-627-02471-8
Boucher C, Moll EJ (1981) South African Mediterranean Shrublands. In: Di Castri F, Goodall DW,
Specht RL (eds) Ecosystems of the World 11. Mediterranean-Type Shrublands. Elsevier,
Amsterdam, pp 233-248. ISBN 0-444-41858-X
Boucher C (1987) A phytosociological study of transects through the Western Cape Coastal
Foreland, South Africa. PhD Thesis, Stellenbosch University
Bray RH, Kurtz LT (1945) Determination of total, organic and available forms of phosphorus in
soils. Soil Science 59: 39-45
Bremer K (1976) The genus Relhania (Compositae). Opera Botanica 40: 1-86
Campbell BM, Cowling RM, Bond WJ, Kruger FJ (1981) Structural characterization of vegetation
in the Fynbos Biome. South African National Scientific Programmes Report No. 52. Council for
Scientific and Industrial Research, Pretoria.
Campbell BM (1983) Montane plant environments in the Fynbos Biome. Bothalia 14: 283-298
Campbell BM (1985) Vegetation in a floristically complex area: the Cape Floristic Region. South
African Journal of Botany 52: 129-140
Chapman HD (1965) Total exchangeable bases. In: Black CA, Evans DD, White JL, Ensminger LE,
Clark FE (eds) Methods of soil analysis, Agronomy No. 9, Part 2: Chemical and Microbiological
properties. American Society of Agronomy, Madison, Wisconsin, pp 902-904
Cocks MP, Stock WD (2001) Field patterns of nodulation in fifteen Aspalathus species and their
ecological role in the fynbos vegetation of southern Africa. Basic and Applied Ecology 2: 115-
125
Cowling RM (1983) Diversity relations in Cape shrublands and other vegetation in the southeastern
Cape, South Africa. Vegetatio 54: 103-127
95
Cowling RM (1984) A syntaxonomic and synecological study in the Humansdorp region of the
Fynbos Biome. Bothalia 15: 175-227
Cowling RM, Pierce SM, Moll EJ (1986) Conservation and utilization of South Coast Renosterveld,
an endangered South African vegetation type. Biological Conservation 37: 363-377
Cowling RM, Campbell BM, Mustart P, McDonald DJ, Jarman ML, Moll EJ (1988) Vegetation
classification in a floristically complex area: The Agulhas Plain. South African Journal of
Botany 54: 290-300
Cowling RM (1992) (ed) The ecology of fynbos: Nutrients fire and diversity. Oxford University
Press, Cape Town. ISBN 0-19-570661-7
Cowling RM, Richardson DM, Pierce SM (eds) (1997) Vegetation of Southern Africa. Cambridge
University Press, Cambridge. ISBN 0-521-57142-1
Delpierre GR, Du Plessis (1974) The winter-growing Gladioli of South Africa: A pictorial record
with descriptions. Tafelberg, Cape Town. ISBN 0-624-00576-3
Diemer N (2000) Fire management at Elandsberg Nature Reserve. Management Plan Report No.
67, Department of Conservation Ecology, Stellenbosch University, pp 1-60
Duthie AV (1930) List of vascular cryptograms and flowering plants of the Stellenbosch Flats.
Annals of the University of Stellenbosch 8, Section A, 4: 1-52
Euston-Brown D (1995) Environmental and dynamic determinants of vegetation distribution in the
Kouga and Baviaanskloof Mountains, Eastern Cape. MSc Thesis, University of Cape Town,
Rondebosch
Glyphis J, Moll EJ, Campbell BM (1978) Phytosociological studies on Table Mountain, South
Africa: The Back Table. South African Journal of Botany 44: 281-289
Goldblatt P, Manning JC (1998) Gladiolus in Southern Africa. Fernwood Press, Cape Town. ISBN
1-874950-32-6
Goldblatt P, Manning JC (2000) Cape plants: A conspectus of the Cape flora of South Africa.
National Botanical Institute, Kirstenbosch. ISBN 0-620-26236-2
Goldblatt P, Manning JC (2002) Plant Diversity of the Cape Region of Southern Africa. Annals of
the Missouri Botanical Gardens 89: 281-302
Goldblatt P, Manning JC, Snijman D (2005) Cape plants: corrections and additions to the flora. 1.
Bothalia 35: 35-46
Grobler PJ, Marais J (1967) Die plantegroei van die Nasionale Bontebokpark, Swellendam. Koedoe
10: 132-148
Haaksma ED, Linder HP (2000) Restios of the fynbos. Botanical Society of South Africa, Cape
Town. ISBN 1-874999-21
96
Hennekens SM, Schaminée JHJ (2001) TURBOVEG, a comprehensive data base management
system for vegetation data. Journal of Vegetation Science 12: 589-591
Heydenrych B, Littlewort P (1995) Flora survey of Darling: A preliminary investigation into the
conservation of the Renosterveld remnants in the Darling area. Unpublished FCC Report 95/3.
Flora Conservation Committee, Botanical Society of South Africa, Kirstenbosch
Hill MO (1979) TWINSPAN: A FORTRAN Programme for arranging multivariate data in an
ordered two-way table by classification of the individuals and attributes. Ecology and
Systematics, Cornell University, Ithaca, NY
Hoare DB, Victor JE, Lubke RA, Mucina L (2000) Vegetation of the coastal fynbos and rocky
headlands south of George, South Africa. Bothalia 30: 87-96
Jarman ML (ed) (1986) Conservation priorities in lowland regions of the fynbos biome. South
African National Scientific Programmes Report No. 87. Council for Scientific and Industrial
Research, Pretoria. ISBN 0-7988-3145-6
Joubert C, Moll EJ (1992) A phytosociological study of Signal Hill, Cape Town, utilizing both
perennial and ephemeral species. Bothalia 22: 255-282
Kruger FJ (1978) A description of the Fynbos Biome Project. South African National Scientific
Programmes Report No. 28. Council for Scientific and Industrial Research, Pretoria, pp 1-23.
ISBN 0-7988-1335-0
Kruger FJ (1979) Plant Ecology. In: Day J, Siegfried WR, Louw GN, Jarman ML (eds) Fynbos
ecology: a preliminary synthesis. South African National Scientific Programmes Report No. 40.
South Africa, Pretoria. ISBN 0-7988-1686-4
Kruger FJ, Taylor HC (1979) Plant species diversity in Cape fynbos: Gamma and delta diversity.
Vegetatio 41: 85-93
Laidler D, Moll EJ, Campbell BM, Glyphis J (1978) Phytosociological studies on Table Mountain,
South Africa: The Front Table. South African Journal of Botany 44: 291-295
Lepš J, Šmilauer P (2003) Multivariate analysis of ecological data using CANOCO. Cambridge
University Press, Cambridge. ISBN 0-521-89108
Levyns MR (1927) A preliminary note on the rhenoster bush (Elytropappus rhinocerotis) and the
germination of its seed. Transactions of the Royal Society of South Africa 14: 383-388
Levyns MR (1929) Veld-burning experiments at Ida’s Valley, Stellenbosch. Transactions of the
Royal Society of South Africa 17: 61-92
Levyns MR (1935) Veld-burning experiments at Oakdale, Riversdale. Transactions of the Royal
Society of South Africa 23: 231-243
Linder HP (1976) A preliminary study of the vegetation of Piketberg Mountain, Cape Province.
BSc Honours project, University of Cape Town, Rondebosch

97
Linder HP, Campbell BM (1979) Towards a structural-functional classification of fynbos: a
comparison of methods. Bothalia 12: 723-729
Linder HP, Ellis RP (1990) A revision of Pentachistis (Arundineae: Poaceae). Contributions from
the Bolus Herbarium No. 12, University of Cape Town, Rondebosch. ISBN 0799212210
McDonald DJ (1985) The plant communities of Swartboschkloof, Jonkershoek. South African
National Scientific Programmes Report No. 104. Foundation for Research Development, Council
for Scientific and Industrial Research, Pretoria. ISBN 0-7988-3391-2
McDowell CR (1988) Factors Affecting the Conservation of Renosterveld by Private Landowners.
PhD Thesis, University of Cape Town, Rondebosch
McLean EO (1982) Soil pH and lime requirement. In: AL Page (ed) Methods of soil analysis, Part
2: Chemical and Microbiological properties. American Society of Agronomy, Madison,
Wisconsin, pp 199-224. ISBN 0-89118-072-9
Michell MR (1922) Some observations on the effects of a bush fire on the vegetation of Signal Hill.
Transactions of the Royal Society of South Africa 10: 213-232
Merryweather FR (1965) The soils of the Wellington-Malmesbury area. MSc Thesis, Stellenbosch
University
Mucina L, Rutherford MC (eds.) (2004) Vegetation Map of South Africa, Lesotho and Swaziland:
Shapefiles of basic mapping units. Beta Version 4.0, February 2004. National Botanical Institute,
Kirstenbosch
Muir J (1929) The vegetation of the Riversdale area, Cape Province. Botanical Survey of South
Africa Memoir No. 13. The Government Printer, Pretoria
Mueller-Dombois D, Ellenberg H (1974) Aims and methods of vegetation ecology. John Wiley and
Sons, New York. ISBN 0-471-62291-5
Nelson DW, Sommers LE (1982) Total carbon, organic carbon and organic matter. In: AL Page
(ed) Methods of soil analysis, Part 2: Chemical and Microbiological properties. American
Society of Agronomy, Madison, Wisconsin, pp 539-579. ISBN 0-89118-072-9
Newton IP, Knight R (2005) The use of Landsat imagery for the identification of the remaining
West Coast Renosterveld fragments, western Cape Province, South Africa. South African
Journal of Botany 71: 67-75
Paterson CC (1982) A phytosociological classification of the vegetation of the Tygerberg Nature
Reserve and De Grendel farm, Belville. Botany third year project, University of Cape Town,
Rondebosch
Pauw A (2004) Variation in pollination across a fragmented landscape at the Cape of Africa. PhD
Thesis, University of Cape Town, Rondebosch

98
Pierce SM, Cowling RM (1983) Phenology of fynbos, renosterveld and subtropical thicket in the
south eastern Cape. South African Journal of Botany 3: 1-16
Podani J (1994) Multivariate data analysis in ecology and systematics- A methodological guide to
the SYN-TAX 5.0 package. Ecological Computational Series (ECS) 6. SPB Academic
Publishing bv, The Hague, pp 1- 316. ISBN 90-5103-094-0
Podani J (2001) SYN-TAX 2000 Computer program for data analysis in ecology and systematics:
for WINDOWS 95, 98 & NT: user’s manual. Scientia Publishing, Budapest. ISBN 963-8326-23-
9
Puff C (1986) A biosystematic study of the African and Madagascan Rubiaceae-Anthospermeae.
Springer-Verlag, Wien. ISBN 0-387-81919-3
Raunkiaer C (1934) The life forms of plants and statistical plant geography being the collected
papers of C Raunkiaer. Oxford University Press, Oxford
Rebelo AG, Cowling RM, Campbell BM, Meadows M (1991) Plant communities of the Riversdale
Plain. South African Journal of Botany 57: 10-28
Rebelo AG (1996) West Coast Renosterveld. In: Low AB, Rebelo AG (eds) Vegetation of South
Africa, Lesotho and Swaziland: A companion to the Vegetation Map of South Africa, Lesotho
and Swaziland. Department of Environmental Affairs and Tourism, Pretoria, pp 66. ISBN 0-621-
17316-9
Rebelo AG (1996) South and South-west Coast Renosterveld. In: Low AB, Rebelo AG (eds)
Vegetation of South Africa, Lesotho and Swaziland: A companion to the Vegetation Map of
South Africa, Lesotho and Swaziland. Department of Environmental Affairs and Tourism,
Pretoria, pp 67. ISBN 0-621-17316-9
Rice B, Westoby M (1983) Plant species richness at the 0.1 hectare scale in Australian vegetation
compared to other continents. Vegetatio 52: 129-140
Richards LA (ed) United States Salinity Laboratory Staff (1954) Diagnosis and improvement of
saline and alkaline soils. USDA Handbook No. 60. U.S. Government Printing Office,
Washington, DC
Schaminée JHJ, Stortelder AHF, Westhoff V (1995) De synthetische fase van het
vegetatieonderzoek. In: Schaminée JHJ, Stortelder AHF, Westhoff V (eds) De Vegetatie van
Nederland, Deel 1: Inleiding tot de plantensociologie-grondslagen, methoden en toepassingen.
Opulus Press, Uppsala, pp 81-114.
Shiponeni NN (2003) Dispersal of seeds as a constraint in revegetation of old fields in Renosterveld
vegetation in the Western Cape, South Africa. MSc Thesis, Stellenbosch University
Simmons MT (1996) Vegetation, diversity and rarity on the Cape Peninsula, South Africa. MSc
Thesis, University of Cape Town, Rondebosch
99
StatSoft, Inc. (2004). STATISTICA (data analysis software system). Version 7. www.statsoft.com.
Tansley S (1982) Koppie Conservation Project. Wildlife Society of Southern Africa and the South
African Nature Foundation, Rondebosch, pp 1-100
Taylor HC (1978) Capensis. In: Werger MJA (ed) Biogeography and ecology of southern Africa.
Dr. W. Junk, The Hague, pp 171-229. ISBN 90-6193-083-9
Taylor HC (1996) Cederberg vegetation and flora. National Botanical Institute, Pretoria. ISBN 1-
874907-28-5
ter Braak CJF, Šmilauer P (2002) CANOCO Reference manual and CanoDraw for Windows User’s
guide: Software for Canonical Community Ordination (version 4.5). Microcomputer Power,
Ithaca, NY
van Breda PAB, Barnard SA (1991) Veld plants of the winter rainfall region: A guide to the use of
veld plants for grazing. Department of Agricultural Development, Bulletin No. 422. Cape and
Transvaal Printers (Pty.) Ltd., Pretoria. ISBN 0-621-13470-8
van der Maarel E (1979) Transformation of cover-abundance values in phytosociology and its
effects on community similarity. Vegetatio 39: 97-114
van der Merwe CV (1976) ‘n Algemene beskrywing van die DeHoop-Natuurreservaat. Unpublished
Report, Departement van Natuur- en Omgewingsbewaring, Kaapstad, pp 1-28
van der Merwe CV (1977) ‘n Plantegroeibeskrywing van die Vrolijkheid-Natuurbewaringstasie.
Unpublished Report, Departement van Natuur- en Omgewingsbewaring, Kaapstad, pp 1-26
von Hase A, Rouget M, Maze K, Helme N (2003) A fine-scale conservation plan for Cape lowlands
Renosterveld. Unpublished Technical Report, Cape Conservation Unit CCU 2/03, Botanical
Society of South Africa, Kirstenbosch
Weber HE, Moravec J, Theurillat J-P (2000) International Code of Phytosociological
Nomenclature. 3rd edn. Journal of Vegetation Science 11: 739-768
Wood J, Low B (1993) Environmental survey and management guidelines for the Tygerberg and
environs: Part 1: Environmental survey. South African Nature Foundation
Werger MJA (1972) A phytosociological study of the Cape Fynbos and other vegetation at
Jonkershoek, Stellenbosch. Bothalia 10: 599-614
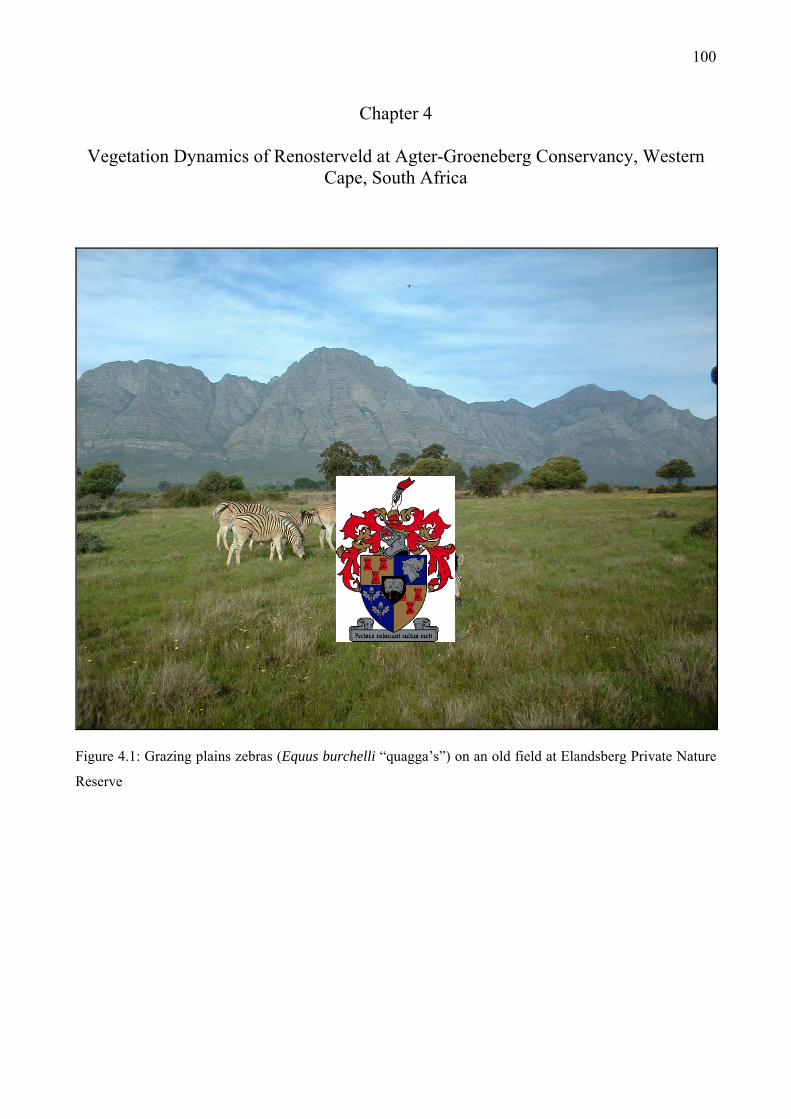
100
Chapter 4
Vegetation Dynamics of Renosterveld at Agter-Groeneberg Conservancy, Western Cape, South Africa
Figure 4.1: Grazing plains zebras (Equus burchelli “quagga’s”) on an old field at Elandsberg Private Nature
Reserve
101
4.1. Introduction
Vegetation patterns and dynamics in renosterveld and associated different-aged old fields are the
objects of study here. This explorative study describes succession on: (a) set-aside old fields, and
(b) set-aside old fields with different grazing intensities (Figure 4.1). Little has been documented
regarding vegetation dynamics of renosterveld in relation to disturbances such as ploughing and
grazing. An understanding of the trajectory of secondary succession on old fields proximate to
indigenous propagule sources at the Agter-Groeneberg Conservancy (hereafter denoted AGC) will
be gained. Life-form richness and cover-abundance in unploughed renosterveld vegetation and
different-aged old fields was quantified and compared, with different grazing intensities. This study
of life-form patterns will be used to infer general processes relating to renosterveld dynamics.
Disturbance, defined by White and Pickett (1985), is “a discrete event in time and space that alters
the structure of populations, communities and ecosystems”. Biotic density, biomass and spatial
distribution are altered by a change in resource and substrate availability and distribution, or by an
alteration of the physical environment. Natural and more recent anthropogenic disturbances are
known to influence patterns in vegetation (Walker and Willig 1999). Plant functional group
classification based on morphological and ecological traits (Grime 1985, 2001) is used to study
vegetation responses to both natural and anthropogenic disturbances. A classification of species into
life-forms was deemed necessary, in order to assess the effects of ploughing and grazing
disturbances on vegetation dynamics.
Disturbance by herbivory may select for both physical and chemical defence strategies (Ruiz et al.
2002) in plant species. Spinescence is prevalent in renosterveld (Campbell 1986) in shrubs and
dwarf shrubs such as: Aspalathus spinosa, Asparagus capensis, Berkheya rigida, Cliffortia
juniperina, Gymnosporia buxifolia, Lycium afrum and Muraltia heisteria; hemicryptophytes like
Arctopus echinatus, Berkheya armata and therophytes like Gorteria personata. A pertinent issue is
to determine which life-forms herbivory would: promote, favour, or facilitate; and which life-forms
it would disturb, stress or diminish. A synopsis of the life-form groups occurring at different seral
stages would, in part, reveal this. It would be logical to assume that endo-zoochorous species will
be favoured as well as spinescent species (the latter often palatable such as Aspalathus spinosa or
Asparagus retrofractus). By keeping plant communities in a state of intermediate levels of
disturbance (sensu Connell 1978), herbivores may maintain high levels of species richness and
102
diversity (Bakker and Olff 2003) either by creating open spaces in a shrubland matrix or dispersing
seed whilst browsing and grazing, and especially by a combination of these processes. Dispersal of
plant species by herbivores is an important function in vegetation composition influencing
vegetation patterning (Vera 2000). Pioneering plants (annuals, some forbs and geophytes also short-
lived perennials) adapted to frequent or intense disturbance, whether by herbivory or fire, are
equally suited to ruderal conditions caused by anthropogenic disturbances (Petsikos et al. 2004, Van
Rooyen 2002).
Ploughing is a destructive, rapid and intense unnatural disturbance event resulting in the complete
removal of above- and below-ground biomass. It effectively resets the system to nil, dramatically
altering successional pathways in comparison to those either caused by grazing or fire disturbance
events. With cessation of ploughing one therefore expects plant species arriving on to old fields and
which increase in abundance, are species adapted for long-distance dispersal or have propagules
that survive ploughing. Certain plant traits are well suited to the novel disturbance of low frequency
ploughing. These include dormant seeds or vegetative plant parts (stolons), bulbs, corms, rhizomes
and tubers. Deep rooted plants able to reproduce clonally or vegetatively: for example Rumex
cordatus and R. crispus (Zaller 2004) can escape ploughing. Geophytes that grow deeper each
season to avoid predation by gazelles (Ward and Saltz 1994), mole rats (Georychus capensis) or
porcupines (Hystrix africaeaustralis, foraging for Babiana odorata and Cyanella hyacinthoides,
B.A. Walton, personal observation), or diggings by aardvarks (Orycteropus afer) would be equally
suited to escape the plough. Selected species are adapted to survive predator diggings (Lovegrove
and Jarvis 1986) by either shedding bulbils (and/or cormlets) or by growing deeper each year like
Babiana stricta (see Michell 1922). Similarly, size matters and small bulbs of Oxalis purpurea
(sorrel/suuring) or Romulea rosea (froetang) are well adapted to evade large ploughs, enabling
persistence on some old fields unlike large geophytes from the Amaryllidaceae like Crossyne
guttata.
What determines species and life-form composition of renosterveld vegetation and associated-old
fields? Disturbances by fire, herbivory and foraging (see Gutterman 2001, Bragg et al. 2005)
processes influence the vegetation patterning. The pathway of succession on old fields is related to
the site disturbance history; contemporary disturbances and proximity to propagule sources (see
Pickett et al. 1987). The specific habitat where succession occurs is of prime importance as
successional pathways are affected by topography, soil quality, hydrology, wind, erosion and
previous applications of chemicals (and contemporary run-off from adjacent agriculture).
Succession on old fields depends on species mobility (from a proximate propagule source), seed
103
dispersal agents (wind, water, birds, ants, porcupines, small and large mammals), competitive
interactions, herbivory and propagule persistence. Old fields of renosterveld are generally
dominated by indigenous and alien annuals and a perennial stoloniferous C4 grass Cynodon
dactylon, with a characteristic guerrilla-type space acquisition strategy, dispersed by tillage
(Guglielmini and Satorre 2004) as well as herbivores (Shiponeni 2003). Some bunchgrasses do
occur on old fields, in pockets (probably in favoured micro-sites due to soil type, B.A. Walton,
personal observation), as well as a few shrub species dispersed from nearby stands of natural
vegetation. A question often posed is how long, if at all, do old fields take to completely recover or
resemble natural stands of renosterveld? Do these old fields ever attain a “natural” state? Since little
empirical evidence exists for secondary succession on to old fields following ploughing of
renosterveld, this study is an attempt to recognize patterns that will aid in determining the
mechanisms and processes of renosterveld dynamics. Understanding these patterns and processes
on old fields and in unploughed renosterveld with the interaction of grazing is equally applicable to
landscape rehabilitation in an agricultural matrix; or vegetation restoration near extant renosterveld.
The objective of this chapter is to answer the following questions:
1: Does total species and life-form group richness differ between natural vegetation and old fields?
2: Is life-form richness influenced by ploughing and grazing or the interaction between these
disturbances?
3: Is life-form cover-abundance influenced by ploughing and grazing or the interaction between
these disturbances?
4: Does alien plant species richness differ amongst seres, and with different levels of grazing
intensity?
4.2. Materials and Methods
This study was conducted in the Western Cape of South Africa, in three contiguous sites of the
AGC in the Wellington District (refer to Chapter Two for a concise account of the study area and
environmental characteristics). The AGC is composed of some remaining fragments of Swartland
Shale Renosterveld (the vegetation type of focus), and Swartland Alluvium Fynbos (Mucina and
104
Rutherford 2004). The three sites have different management histories which relate to the presence
of different- or single-aged old fields. Patterns of succession on to old fields from adjacent
unploughed renosterveld stands were quantified, with cessation of ploughing incorporating three
levels of grazing intensities as an interacting effect. Four levels, of three different-aged old fields
and of unploughed renosterveld, were classed as seral stages. The different-aged old fields (seres)
were used as surrogates, i.e. a chronosequence (see Foster and Tilman 2000), in lieu of temporal
studies of permanent plots. Unploughed renosterveld (control) was used as the baseline reference
from which to infer community compositional changes caused by previous ploughing disturbances
(of set-aside fields) and grazing disturbances (following introduction of herbivores at two sites). In
order to determine interacting effects I quantified three levels of grazing intensity (low, moderate
and high) at the three different sites in conjunction with previous ploughing disturbances. A
sequence of aerial photographs (1938, 1949, 1967, 1973, 1987 and 1997) was used to select suitable
sites for relevés in vegetation of the four seral stages within the study area. The aerial photographs
give an indication of the decline in extent of untransformed vegetation since 1934 to 1996,
especially after the introduction of mechanized farming in the 1950’s (M. Gregor, personal
communication). A summary of factors contributing to the disturbance history of relevés is given in
Appendix 2.
4.2.1. Vegetation Data
The different-aged old fields and renosterveld controls were assigned to a seral stage class: 5-year-
old fields (Sere 1), 15-year-old fields (Sere 2), 30-year-old fields (Sere 3) and unploughed
renosterveld (Sere 4), as a nominal scale. Initially it was intended that all four seral stages, of three
replicates each, be sampled at all three sites totalling thirty-six relevés in a completely crossed
design. Not all seral stages could be met at Voëlvlei or Krantzkop, as both these sites were last
ploughed in the 1970’s prior to the expropriation of agricultural land by: Cape Metropolitan Council
(for a water treatment plant and storage dam) and CapeNature at Voëlvlei; and Armscor (for a
munitions factory) at Krantzkop (last ploughed in 1975), respectively. Only unploughed
renosterveld and 30-year-old field replicates existed at Voëlvlei and Krantzkop; an unbalanced
design for the first two seres. Elandsberg has old fields of different set-aside ages last ploughed in
the 1960’s, 1987, and in 1997, respectively. The actual frequency of ploughing on a given field was
not measured; rather the set-aside age was used as a surrogate measure of the succession trajectory.
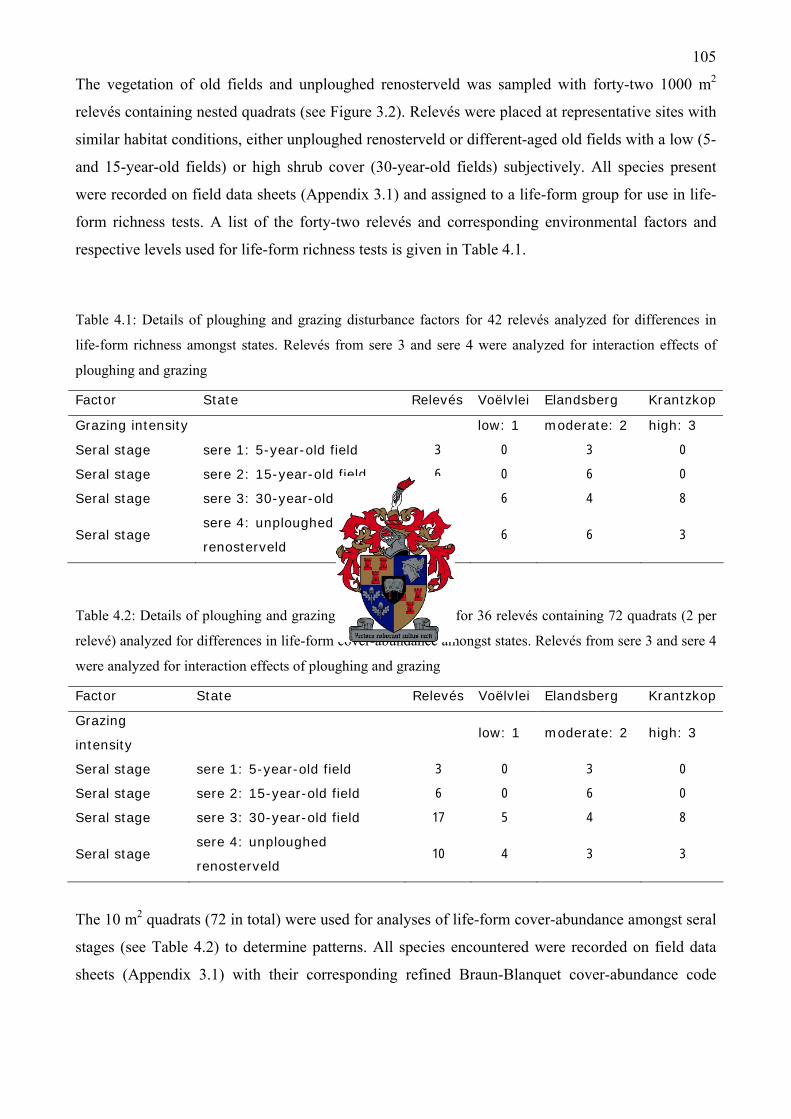
105
The vegetation of old fields and unploughed renosterveld was sampled with forty-two 1000 m2
relevés containing nested quadrats (see Figure 3.2). Relevés were placed at representative sites with
similar habitat conditions, either unploughed renosterveld or different-aged old fields with a low (5-
and 15-year-old fields) or high shrub cover (30-year-old fields) subjectively. All species present
were recorded on field data sheets (Appendix 3.1) and assigned to a life-form group for use in life-
form richness tests. A list of the forty-two relevés and corresponding environmental factors and
respective levels used for life-form richness tests is given in Table 4.1.
Table 4.1: Details of ploughing and grazing disturbance factors for 42 relevés analyzed for differences in
life-form richness amongst states. Relevés from sere 3 and sere 4 were analyzed for interaction effects of
ploughing and grazing
Factor State Relevés Voëlvlei Elandsberg Krantzkop
Grazing intensity low: 1 moderate: 2 high: 3
Seral stage sere 1: 5-year-old field 3 0 3 0
Seral stage sere 2: 15-year-old field 6 0 6 0
Seral stage sere 3: 30-year-old field 18 6 4 8
Seral stage sere 4: unploughed
renosterveld 15 6 6 3
Table 4.2: Details of ploughing and grazing disturbance factors for 36 relevés containing 72 quadrats (2 per
relevé) analyzed for differences in life-form cover-abundance amongst states. Relevés from sere 3 and sere 4
were analyzed for interaction effects of ploughing and grazing
Factor State Relevés Voëlvlei Elandsberg Krantzkop
Grazing
intensity low: 1 moderate: 2 high: 3
Seral stage sere 1: 5-year-old field 3 0 3 0
Seral stage sere 2: 15-year-old field 6 0 6 0
Seral stage sere 3: 30-year-old field 17 5 4 8
Seral stage sere 4: unploughed
renosterveld 10 4 3 3
The 10 m2 quadrats (72 in total) were used for analyses of life-form cover-abundance amongst seral
stages (see Table 4.2) to determine patterns. All species encountered were recorded on field data
sheets (Appendix 3.1) with their corresponding refined Braun-Blanquet cover-abundance code
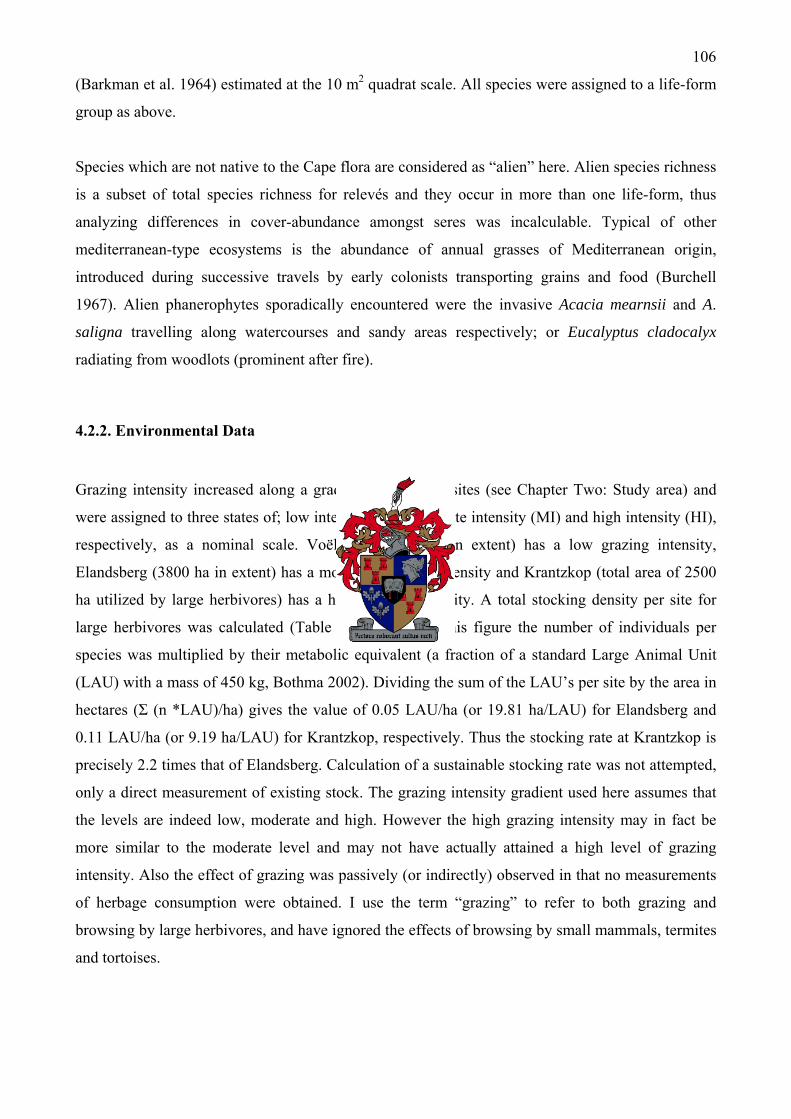
106
(Barkman et al. 1964) estimated at the 10 m2 quadrat scale. All species were assigned to a life-form
group as above.
Species which are not native to the Cape flora are considered as “alien” here. Alien species richness
is a subset of total species richness for relevés and they occur in more than one life-form, thus
analyzing differences in cover-abundance amongst seres was incalculable. Typical of other
mediterranean-type ecosystems is the abundance of annual grasses of Mediterranean origin,
introduced during successive travels by early colonists transporting grains and food (Burchell
1967). Alien phanerophytes sporadically encountered were the invasive Acacia mearnsii and A.
saligna travelling along watercourses and sandy areas respectively; or Eucalyptus cladocalyx
radiating from woodlots (prominent after fire).
4.2.2. Environmental Data
Grazing intensity increased along a gradient at the three sites (see Chapter Two: Study area) and
were assigned to three states of; low intensity (LI), moderate intensity (MI) and high intensity (HI),
respectively, as a nominal scale. Voëlvlei (861.86 ha in extent) has a low grazing intensity,
Elandsberg (3800 ha in extent) has a moderate grazing intensity and Krantzkop (total area of 2500
ha utilized by large herbivores) has a high grazing intensity. A total stocking density per site for
large herbivores was calculated (Table 4.3). To obtain this figure the number of individuals per
species was multiplied by their metabolic equivalent (a fraction of a standard Large Animal Unit
(LAU) with a mass of 450 kg, Bothma 2002). Dividing the sum of the LAU’s per site by the area in
hectares (Σ (n *LAU)/ha) gives the value of 0.05 LAU/ha (or 19.81 ha/LAU) for Elandsberg and
0.11 LAU/ha (or 9.19 ha/LAU) for Krantzkop, respectively. Thus the stocking rate at Krantzkop is
precisely 2.2 times that of Elandsberg. Calculation of a sustainable stocking rate was not attempted,
only a direct measurement of existing stock. The grazing intensity gradient used here assumes that
the levels are indeed low, moderate and high. However the high grazing intensity may in fact be
more similar to the moderate level and may not have actually attained a high level of grazing
intensity. Also the effect of grazing was passively (or indirectly) observed in that no measurements
of herbage consumption were obtained. I use the term “grazing” to refer to both grazing and
browsing by large herbivores, and have ignored the effects of browsing by small mammals, termites
and tortoises.
107
Table 4.3: Large herbivore census (for 2003) at Elandsberg (3800 ha) and Krantzkop (2500 ha), with Large
Animal Unit (LAU) fraction equivalents (sensu Bothma 2002). n = number of individuals
Species Elandsberg 2003 Krantzkop 2003 LAU
equivalent
Elandsberg
(n*LAU)
Krantzkop
(n*LAU)
Black Wildebeest 40 22 0.46 18.40 10.12
Blue Wildebeest 0 28 0.50 0 14.00
Bontebok 100 47 0.22 22.00 10.34
Eland 90 87 1.02 91.80 88.74
Gemsbok 11 67 0.56 6.16 37.52
Hartebeest 12 50 0.37 4.44 18.50
Kudu 0 5 0.42 0 2.10
Mountain Zebra 0 20 0.62 0 12.40
Ostrich 45 0 0.25 11.25 0
Plains Zebra 30 5 0.66 19.80 3.30
Springbok 120 480 0.15 18.00 72.00
Grey Rhebok 0 30 0.10 0 3.00
Total n 448 841
Total LAU’s 191.85 272.02
LAU/ha 0.05 0.11
ha/LAU 19.81 9.19
4.2.3. Life-form Classification
The life-form classification of Raunkiaer (1934) grouped plants by regenerative capacity according
to meristem position, based on over-wintering adaptations of plants (Clements 1928). This approach
was the most rapid here as life-histories of many species were not adequately understood or
referenced, nor were specific traits in relation to grazing (palatability or toxicity) and ploughing
(regeneration capacity) identified from the onset of this study. There are numerous systems of life-
forms with varying levels of detail that were not used here (see Barkman 1988). Species were
categorized by their observable life-form features and assigned to a life-form group regardless of
their phylogeny and life-history, on the basis of their growth habit and meristem position, following
Raunkiaer and Mueller-Dombois and Ellenberg (1974). This definition implies form is an
expression of adaptations. Raunkiaer’s classes are not entirely transposable for use in Southern
African sclerophyllous vegetation thus some modifications were deemed necessary. The grouping
of species across phylogenetic relationships allowed for comparisons of renosterveld and old field
community structure on the basis of life-form group richness and their cover-abundance.
108
Eight life-form classes (or groups) were allocated: therophytes, cryptophytes, hemicryptophytes,
nano-chamaephytes, chamaephytes, phanerophytes, lianellas and parasites. Characteristics used in
allocating each species to a class are given below, with differences between my working definitions
and that of Raunkiaer’s explained.
Therophytes (annuals) are “plants whose shoot and root system dies after seed production and
which complete their life cycle within one year”. Ephemerals, annuals and biennials were included
as therophytes, as were alien taxa usually classed as forbs (i.e. Trifolium repens).
“Perennial (including biennial) herbaceous plants experiencing periodic shoot reduction” are
divided into two categories namely: hemicryptophytes and cryptophytes. Hemicryptophytes have
“periodic shoot reduction to a remnant shoot system that lies relatively close to the ground surface”.
Hemicryptophytes here are all graminoids and include rosette-like asteroids (for example Berkheya
armata). Cryptophytes have a “periodic reduction of the complete shoot system to storage organs
embedded in the soil” during unfavourable growth conditions. Cryptophytes included all types of
geophytes with below ground storage organs. The genera Drosera and Triglochin were excluded
from this class as marginal in a synopsis of geophytes of the Capensis region by Procheş and
Cowling (2004), but included here. Geophytic grasses were assigned as hemicryptophytes.
Chamaephytes as defined by Raunkiaer, are “plants whose mature branch or shoot system remains
perennially within 50 cm above ground surface, or plants that grow taller than 50 cm, but whose
shoots die back periodically to that height limit”. The size class structure of Raunkiaer’s
chamaephyte was modified to reflect size classes of renosterveld shrubs. Chamaephytes were
defined as growing upward from 35 cm to 2.5 metres, and include woody dwarf shrubs and shrubs,
for example Asparagus capensis, Athanasia trifurcata and Elytropappus rhinocerotis. Chamaephyte
juveniles were assigned to the same category. The nano-chamaephyte class included dwarf shrubs
which were woody and consistently small, i.e. below 35 cm like Helichrysum asperum and
succulents like Lampranthus aduncus and L. leptaleon.
Phanerophytes or trees, include orthophyllous species that are largely clumps of tall woody plants
confined to termitaria (heuweltjies) and natural drainage lines in renosterveld. These include Olea
europaea subsp. africana and other bird-dispersed fleshy fruited species (for example Maytenus
oleoides, Rhus lucida) that favour friable soils. Alien phanerophytes are predominant in some areas
as strays from woodlots or riparian invasions: typically Acacia mearnsii, A. cyclops, A. saligna and
Eucalyptus cladocalyx.
109
Lianellas encountered which were geophytic (Cyphia volubilis) were classed according to growth
form, i.e. as lianella.
Parasites contained few species, with hemi-parasites like Thesium funale.
4.2.4. Statistical Analyses of Life-forms
Life-form Richness at the 1000 m2 Scale
Life-form richness of forty-two relevés at the 1000 m2 scale, in both unploughed renosterveld
vegetation and different-aged old fields was compared, using univariate statistical tests of
significance (StatSoft 2004) when statistical assumptions were not violated (Gotelli and Ellison
2004). These forty-two relevés contained no less than 411 species. The data were tested for
normality using Lilliefors test and systematically checked for homogeneity of variance within
groups using Levene’s test and the Cochran-Bartlett test. Non-normal distributions were due to: low
or uneven occurrences in the group (hemicryptophytes), low species numbers (lianella,
phanerophyte and parasite groups) or absence across factor levels. Phanerophyte and lianella life-
forms did not occur at the first two seres whilst the parasite life-form was absent at the first sere.
Life-form groups non-normally distributed or heteroschedastic were analyzed using non-parametric
statistical tests; either Kruskal-Wallis ANOVA by ranks or a Mann-Whitney U test, for multiple or
two independent group comparisons, respectively. Most of the heterogeneity of variance within
groups was due to an unequal replication of samples amongst levels, and in some cases low variable
counts, possibly inflating or deflating some results.
The interactions between ploughing and grazing were analysed using multivariate statistical tests of
significance (ANOVA) for relevés with comparable seral stages, namely 30-year-old fields and
unploughed renosterveld, (n = 33). All three sites were analyzed using the grazing intensity factor
but not all seral stages were available, as Elandsberg is the only site with all four seral stages.
Where the data were non-normally distributed (Lilliefors test) or heteroschedasticity of the samples
occurred (Levene’s test, Cochran-Bartlett test), a bootstrapping (resampling, Simon and Bruce
1991, Nel and Kidd StatSoft 2004 macro) test was performed to reveal the true variance between
treatments. The bootstrap test relies on sample variations within levels and shows whether the
confidence intervals found in the Bonferroni test (least square means) are actually alike or not.
110
Life-form Cover-abundance at the 10 m2 Scale
The quadrats at the 10 m2 scale (n = 72) were used in analyses for quantifying differences in cover-
abundance within life-form groups amongst seral stages. The interactions between grazing and
ploughing were analysed using multivariate statistical tests of significance (ANOVA) only for those
relevés (n = 33) with comparable seral stages as explained for the richness tests above. The refined
Braun-Blanquet (Barkman et al. 1964) cover-abundance data were transformed to an ordinal scale
(van der Maarel 1979) prior to export from TURBOVEG (Hennekens and Schaminée 2001). Cover-
abundance values of each species in life-form groups was summed per quadrat, and used in
statistical analyses in StatSoft (2004). The data were tested for distributions of normality using
Lilliefors test, and heteroschedasticity (the uneven distribution of data) in relevés was measured
with Levene’s test and the Cochran-Bartlett test.
Where the data were non-normally distributed (Lilliefors test) or heteroschedasticity of the samples
occurred (Levene’s test, Cochran-Bartlett test), a bootstrapping test was performed (to compensate
for non-normal distributions or heteroschedasticity) to reveal the true variance between treatments.
Non-parametric statistics were employed for the main effects when no significant interacting effects
occurred; either Kruskal-Wallis ANOVA by ranks (for multiple independent groups) or a Mann-
Whitney U test (for two groups). Again most of the heterogeneity of variance was due to an unequal
amount of samples amongst treatments, and in some cases low counts per variable.
4.2.5. Ordination at the 10 m2 Scale
The 72 quadrats at the 10 m2 scale which were used for quantifying differences in cover-abundance
were also used to perform ordination analyses. The aim here was to investigate response curves of
selected species in seral development. The species cover-abundance values were transformed from
the refined Braun-Blanquet scale (Barkman et al. 1964) into an ordinal scale (van der Maarel 1979)
prior to export from TURBOVEG (Hennekens and Schaminée 2001). No further data
transformation was done in CANOCO prior to ordination. The vegetation samples were analyzed
using Detrended Correspondence Analysis (DCA). The program package CANOCO (ter Braak and
Šmilauer 2002, Lepš and Šmilauer 2003) was used to perform the DCA. In CanoDraw the DCA
axis 1 was used to plot a select group of species in a Generalized Additive Model (GAM) to show
their response along the compositional gradient of secondary succession.
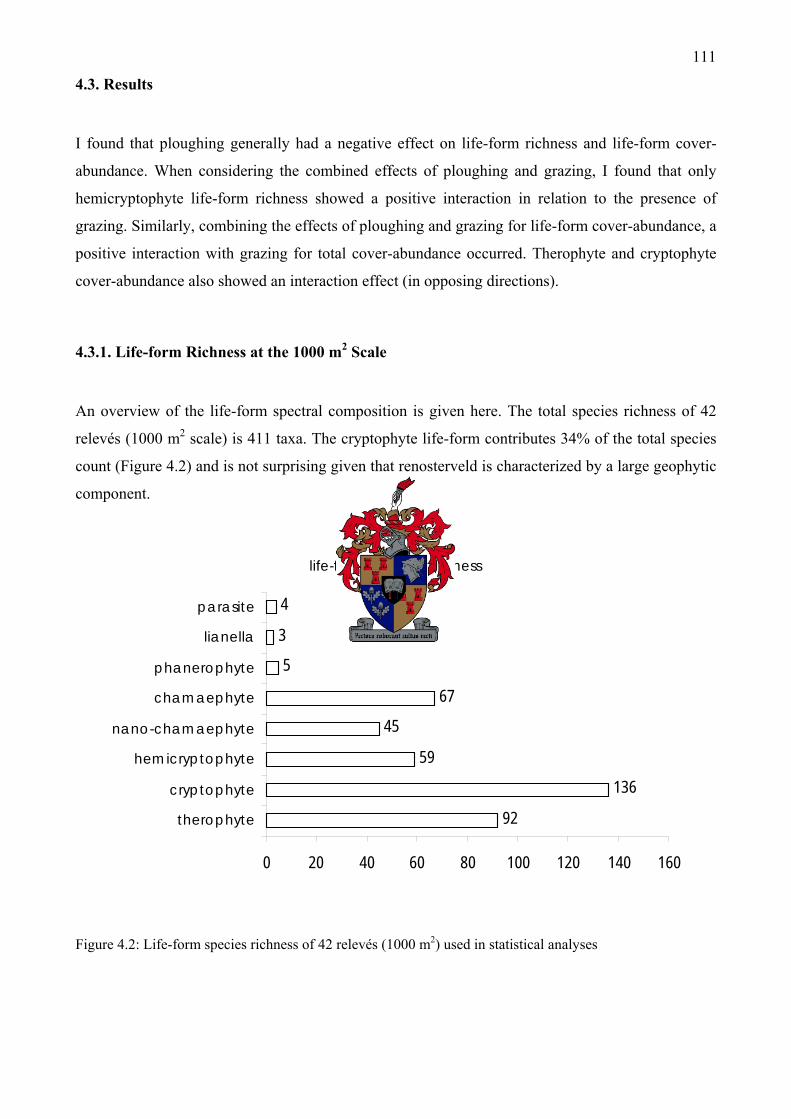
111
4.3. Results
I found that ploughing generally had a negative effect on life-form richness and life-form cover-
abundance. When considering the combined effects of ploughing and grazing, I found that only
hemicryptophyte life-form richness showed a positive interaction in relation to the presence of
grazing. Similarly, combining the effects of ploughing and grazing for life-form cover-abundance, a
positive interaction with grazing for total cover-abundance occurred. Therophyte and cryptophyte
cover-abundance also showed an interaction effect (in opposing directions).
4.3.1. Life-form Richness at the 1000 m2 Scale
An overview of the life-form spectral composition is given here. The total species richness of 42
relevés (1000 m2 scale) is 411 taxa. The cryptophyte life-form contributes 34% of the total species
count (Figure 4.2) and is not surprising given that renosterveld is characterized by a large geophytic
component.
life-form species richness
92
136
59
45
67
5
3
4
0 20 40 60 80 100 120 140 160
therophyte
cryptophyte
hemicryptophyte
nano-chamaephyte
chamaephyte
phanerophyte
lianella
parasite
Figure 4.2: Life-form species richness of 42 relevés (1000 m2) used in statistical analyses
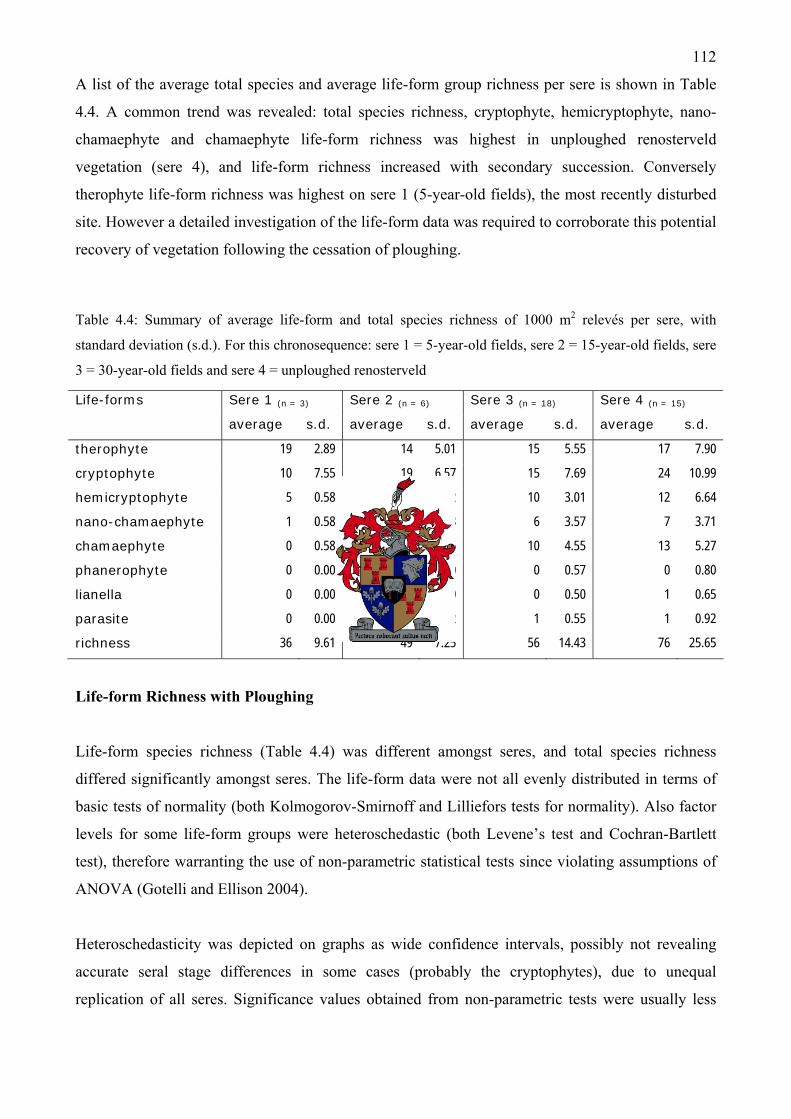
112
A list of the average total species and average life-form group richness per sere is shown in Table
4.4. A common trend was revealed: total species richness, cryptophyte, hemicryptophyte, nano-
chamaephyte and chamaephyte life-form richness was highest in unploughed renosterveld
vegetation (sere 4), and life-form richness increased with secondary succession. Conversely
therophyte life-form richness was highest on sere 1 (5-year-old fields), the most recently disturbed
site. However a detailed investigation of the life-form data was required to corroborate this potential
recovery of vegetation following the cessation of ploughing.
Table 4.4: Summary of average life-form and total species richness of 1000 m2 relevés per sere, with
standard deviation (s.d.). For this chronosequence: sere 1 = 5-year-old fields, sere 2 = 15-year-old fields, sere
3 = 30-year-old fields and sere 4 = unploughed renosterveld
Life-forms Sere 1 (n = 3) Sere 2 (n = 6) Sere 3 (n = 18) Sere 4 (n = 15)
average s.d. average s.d. average s.d. average s.d.
therophyte 19 2.89 14 5.01 15 5.55 17 7.90
cryptophyte 10 7.55 19 6.57 15 7.69 24 10.99
hemicryptophyte 5 0.58 9 2.42 10 3.01 12 6.64
nano-chamaephyte 1 0.58 2 1.33 6 3.57 7 3.71
chamaephyte 0 0.58 4 2.66 10 4.55 13 5.27
phanerophyte 0 0.00 0 0.00 0 0.57 0 0.80
lianella 0 0.00 0 0.00 0 0.50 1 0.65
parasite 0 0.00 0 0.52 1 0.55 1 0.92
richness 36 9.61 49 7.25 56 14.43 76 25.65
Life-form Richness with Ploughing
Life-form species richness (Table 4.4) was different amongst seres, and total species richness
differed significantly amongst seres. The life-form data were not all evenly distributed in terms of
basic tests of normality (both Kolmogorov-Smirnoff and Lilliefors tests for normality). Also factor
levels for some life-form groups were heteroschedastic (both Levene’s test and Cochran-Bartlett
test), therefore warranting the use of non-parametric statistical tests since violating assumptions of
ANOVA (Gotelli and Ellison 2004).
Heteroschedasticity was depicted on graphs as wide confidence intervals, possibly not revealing
accurate seral stage differences in some cases (probably the cryptophytes), due to unequal
replication of all seres. Significance values obtained from non-parametric tests were usually less
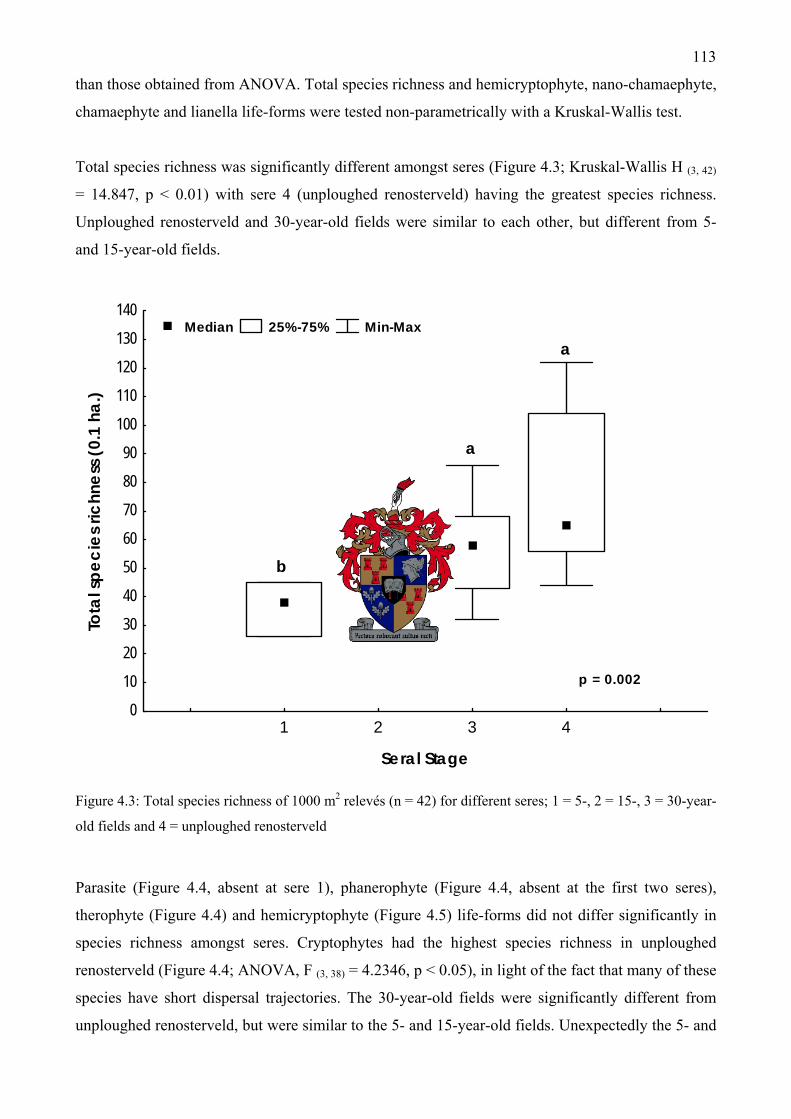
113
than those obtained from ANOVA. Total species richness and hemicryptophyte, nano-chamaephyte,
chamaephyte and lianella life-forms were tested non-parametrically with a Kruskal-Wallis test.
Total species richness was significantly different amongst seres (Figure 4.3; Kruskal-Wallis H (3, 42)
= 14.847, p < 0.01) with sere 4 (unploughed renosterveld) having the greatest species richness.
Unploughed renosterveld and 30-year-old fields were similar to each other, but different from 5-
and 15-year-old fields.
1 2 3 4
Seral Stage
0
10
20
30
40
50
60
70
80
90
100
110
120
130
140
Tota
l spe
cies
rich
ness
(0.1
ha.
)
a
a
bb
Median 25%-75% Min-Max
p = 0.002
Figure 4.3: Total species richness of 1000 m2 relevés (n = 42) for different seres; 1 = 5-, 2 = 15-, 3 = 30-year-
old fields and 4 = unploughed renosterveld
Parasite (Figure 4.4, absent at sere 1), phanerophyte (Figure 4.4, absent at the first two seres),
therophyte (Figure 4.4) and hemicryptophyte (Figure 4.5) life-forms did not differ significantly in
species richness amongst seres. Cryptophytes had the highest species richness in unploughed
renosterveld (Figure 4.4; ANOVA, F (3, 38) = 4.2346, p < 0.05), in light of the fact that many of these
species have short dispersal trajectories. The 30-year-old fields were significantly different from
unploughed renosterveld, but were similar to the 5- and 15-year-old fields. Unexpectedly the 5- and
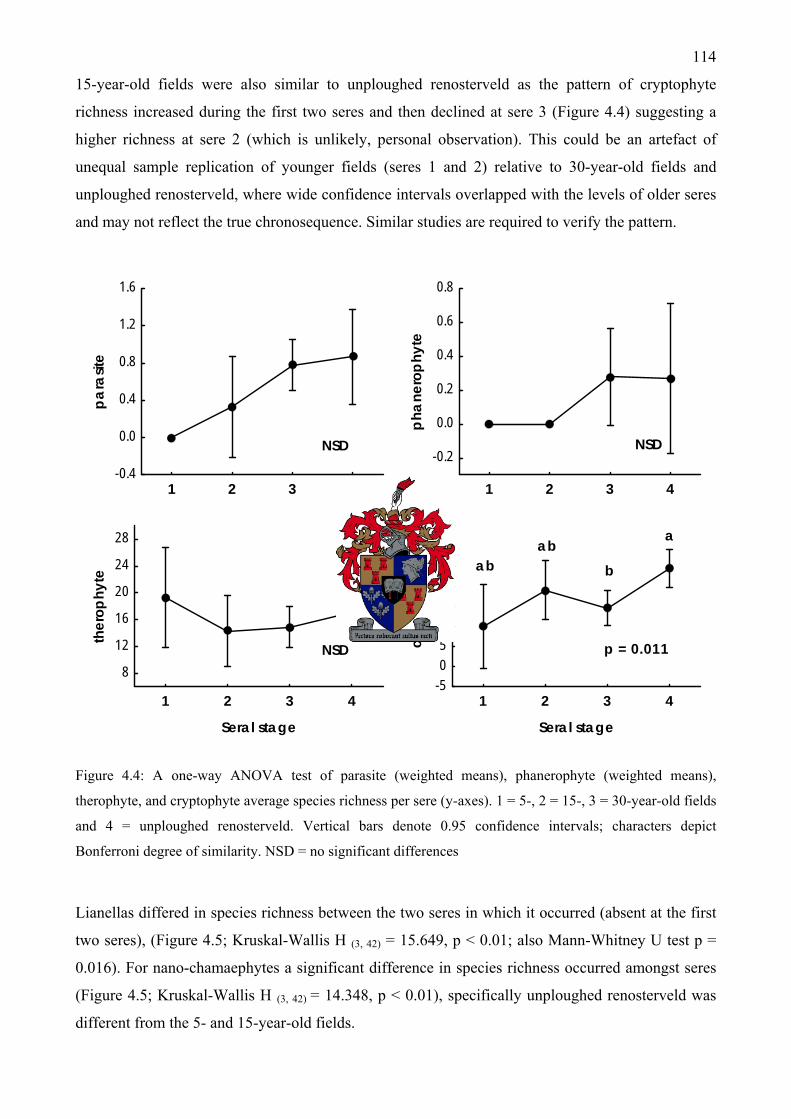
114
15-year-old fields were also similar to unploughed renosterveld as the pattern of cryptophyte
richness increased during the first two seres and then declined at sere 3 (Figure 4.4) suggesting a
higher richness at sere 2 (which is unlikely, personal observation). This could be an artefact of
unequal sample replication of younger fields (seres 1 and 2) relative to 30-year-old fields and
unploughed renosterveld, where wide confidence intervals overlapped with the levels of older seres
and may not reflect the true chronosequence. Similar studies are required to verify the pattern.
1 2 3 4-0.4
0.0
0.4
0.8
1.2
1.6
para
site
1 2 3 4
-0.2
0.0
0.2
0.4
0.6
0.8
phan
erop
hyte
1 2 3 4
Seral stage
8
12
16
20
24
28
ther
ophy
te
1 2 3 4
Seral stage
-505
101520253035
cryp
toph
yte
a
bab
ab
NSD
NSD
NSD
p = 0.011
Figure 4.4: A one-way ANOVA test of parasite (weighted means), phanerophyte (weighted means),
therophyte, and cryptophyte average species richness per sere (y-axes). 1 = 5-, 2 = 15-, 3 = 30-year-old fields
and 4 = unploughed renosterveld. Vertical bars denote 0.95 confidence intervals; characters depict
Bonferroni degree of similarity. NSD = no significant differences
Lianellas differed in species richness between the two seres in which it occurred (absent at the first
two seres), (Figure 4.5; Kruskal-Wallis H (3, 42) = 15.649, p < 0.01; also Mann-Whitney U test p =
0.016). For nano-chamaephytes a significant difference in species richness occurred amongst seres
(Figure 4.5; Kruskal-Wallis H (3, 42) = 14.348, p < 0.01), specifically unploughed renosterveld was
different from the 5- and 15-year-old fields.
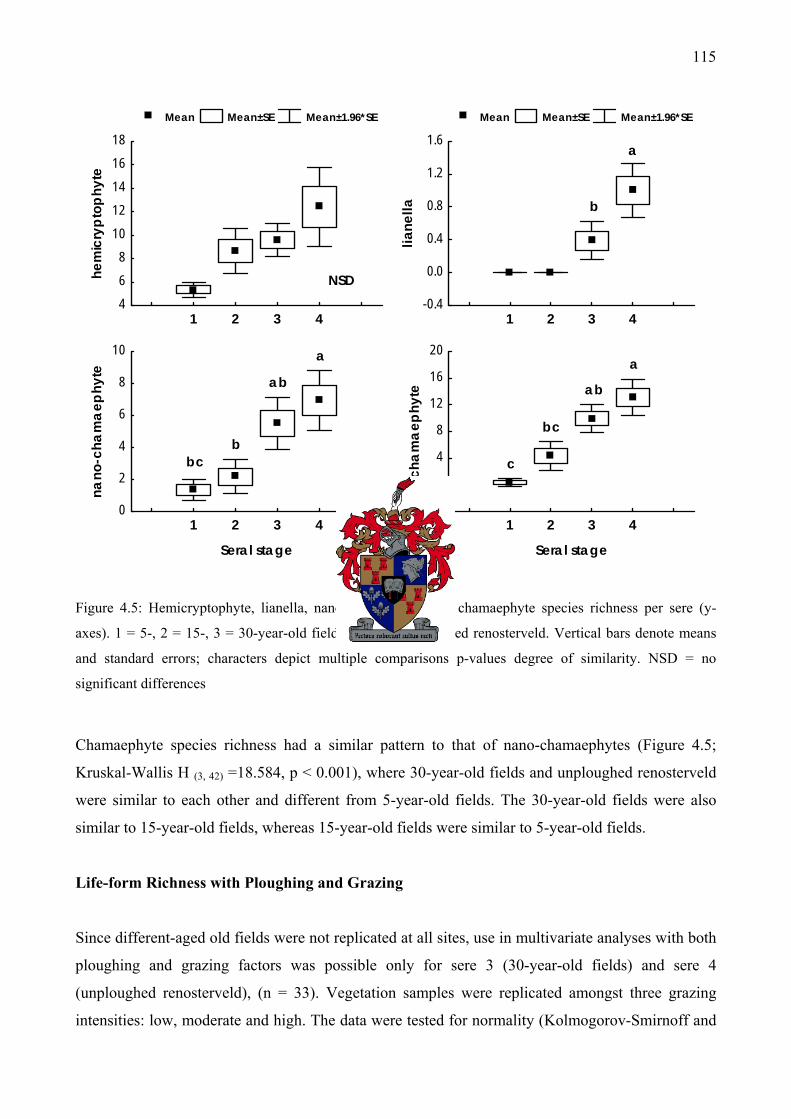
115
Mean Mean±SE Mean±1.96*SE
1 2 3 4468
1012141618
hem
icry
ptop
hyte
Mean Mean±SE Mean±1.96*SE
1 2 3 4-0.4
0.0
0.4
0.8
1.2
1.6
liane
lla
1 2 3 4
Seral stage
0
2
4
6
8
10
nano
-cha
mae
phyt
e
1 2 3 4
Seral stage
-4
0
4
8
12
16
20
cham
aeph
yte
a
b
a
ab
bbc
a
ab
bc
c
NSD
Figure 4.5: Hemicryptophyte, lianella, nano-chamaephyte and chamaephyte species richness per sere (y-
axes). 1 = 5-, 2 = 15-, 3 = 30-year-old fields and 4 = unploughed renosterveld. Vertical bars denote means
and standard errors; characters depict multiple comparisons p-values degree of similarity. NSD = no
significant differences
Chamaephyte species richness had a similar pattern to that of nano-chamaephytes (Figure 4.5;
Kruskal-Wallis H (3, 42) =18.584, p < 0.001), where 30-year-old fields and unploughed renosterveld
were similar to each other and different from 5-year-old fields. The 30-year-old fields were also
similar to 15-year-old fields, whereas 15-year-old fields were similar to 5-year-old fields.
Life-form Richness with Ploughing and Grazing
Since different-aged old fields were not replicated at all sites, use in multivariate analyses with both
ploughing and grazing factors was possible only for sere 3 (30-year-old fields) and sere 4
(unploughed renosterveld), (n = 33). Vegetation samples were replicated amongst three grazing
intensities: low, moderate and high. The data were tested for normality (Kolmogorov-Smirnoff and
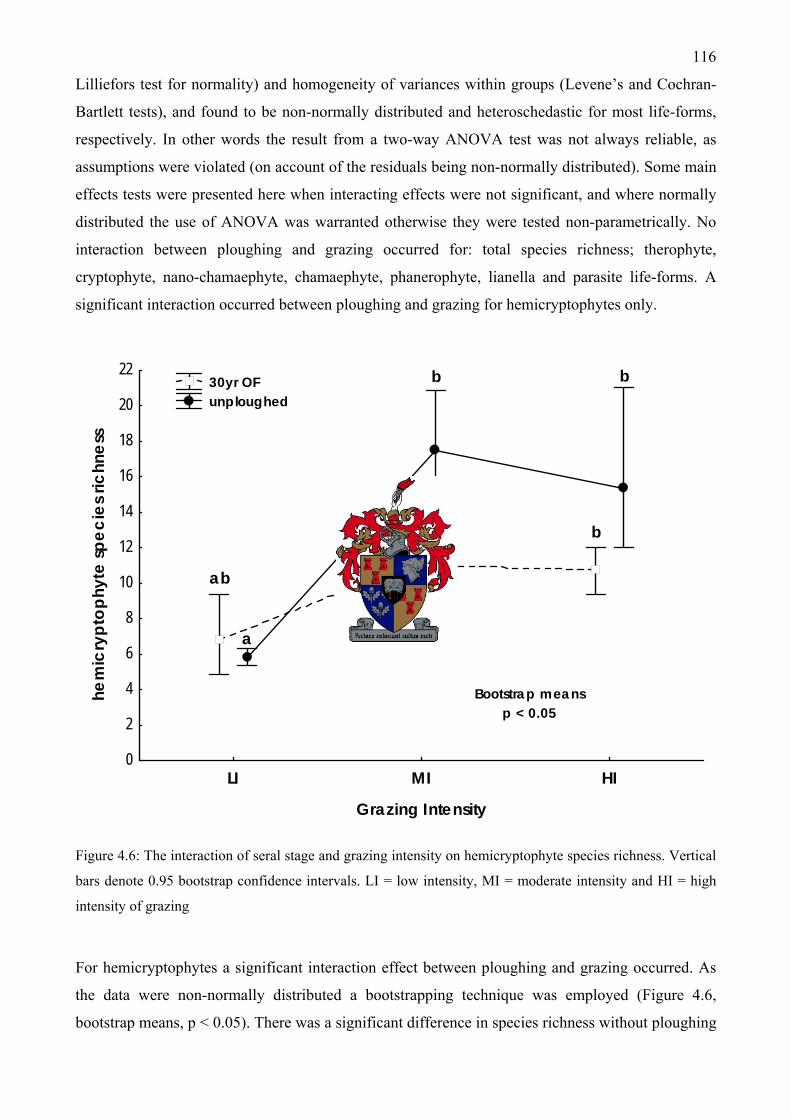
116
Lilliefors test for normality) and homogeneity of variances within groups (Levene’s and Cochran-
Bartlett tests), and found to be non-normally distributed and heteroschedastic for most life-forms,
respectively. In other words the result from a two-way ANOVA test was not always reliable, as
assumptions were violated (on account of the residuals being non-normally distributed). Some main
effects tests were presented here when interacting effects were not significant, and where normally
distributed the use of ANOVA was warranted otherwise they were tested non-parametrically. No
interaction between ploughing and grazing occurred for: total species richness; therophyte,
cryptophyte, nano-chamaephyte, chamaephyte, phanerophyte, lianella and parasite life-forms. A
significant interaction occurred between ploughing and grazing for hemicryptophytes only.
LI MI HI
Grazing Intensity
0
2
4
6
8
10
12
14
16
18
20
22
hem
icry
ptop
hyte
spec
ies r
ichn
ess
ab
a
ab
b
b
b
Bootstrap meansp < 0.05
30yr OF unploughed
Figure 4.6: The interaction of seral stage and grazing intensity on hemicryptophyte species richness. Vertical
bars denote 0.95 bootstrap confidence intervals. LI = low intensity, MI = moderate intensity and HI = high
intensity of grazing
For hemicryptophytes a significant interaction effect between ploughing and grazing occurred. As
the data were non-normally distributed a bootstrapping technique was employed (Figure 4.6,
bootstrap means, p < 0.05). There was a significant difference in species richness without ploughing
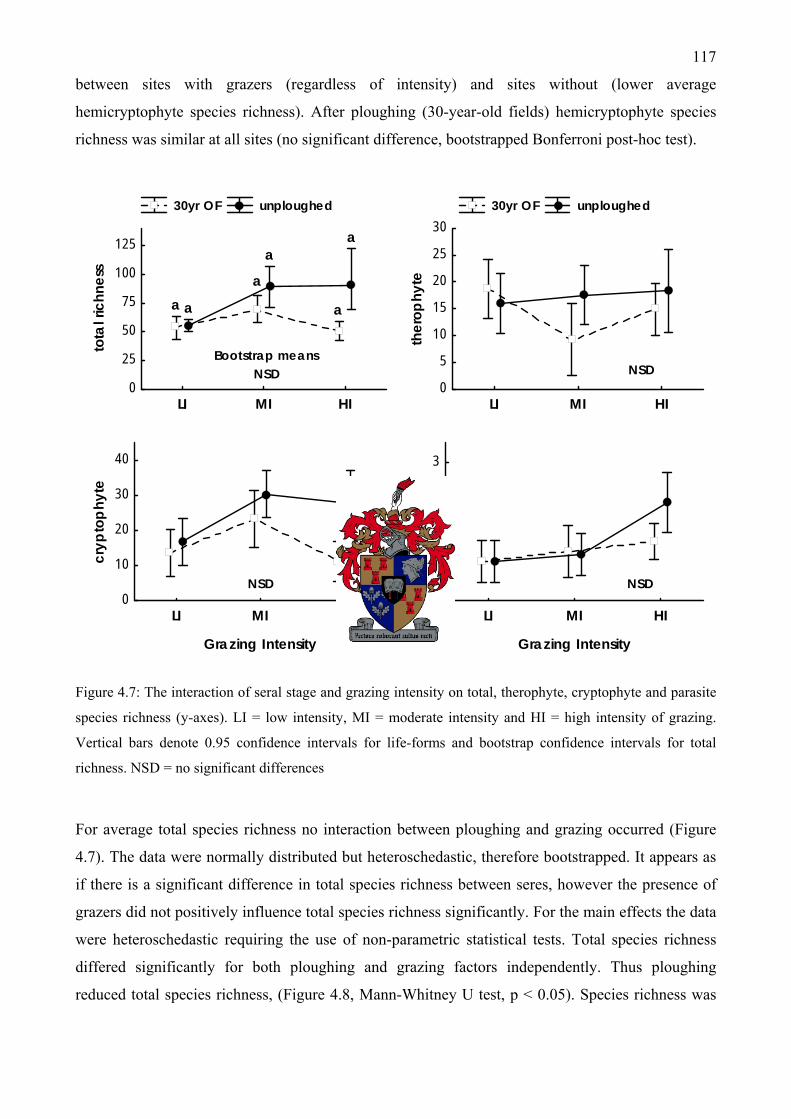
117
between sites with grazers (regardless of intensity) and sites without (lower average
hemicryptophyte species richness). After ploughing (30-year-old fields) hemicryptophyte species
richness was similar at all sites (no significant difference, bootstrapped Bonferroni post-hoc test).
30yr OF unploughed
LI MI HI0
25
50
75
100
125
tota
l ric
hnes
s
30yr OF unploughed
LI MI HI0
5
10
15
20
25
30
ther
ophy
te
LI MI HI
Grazing Intensity
0
10
20
30
40
cryp
toph
yte
LI MI HI
Grazing Intensity
0
1
2
3
para
site
a a
a
a
a
a
Bootstrap meansNSD NSD
NSDNSD
Figure 4.7: The interaction of seral stage and grazing intensity on total, therophyte, cryptophyte and parasite
species richness (y-axes). LI = low intensity, MI = moderate intensity and HI = high intensity of grazing.
Vertical bars denote 0.95 confidence intervals for life-forms and bootstrap confidence intervals for total
richness. NSD = no significant differences
For average total species richness no interaction between ploughing and grazing occurred (Figure
4.7). The data were normally distributed but heteroschedastic, therefore bootstrapped. It appears as
if there is a significant difference in total species richness between seres, however the presence of
grazers did not positively influence total species richness significantly. For the main effects the data
were heteroschedastic requiring the use of non-parametric statistical tests. Total species richness
differed significantly for both ploughing and grazing factors independently. Thus ploughing
reduced total species richness, (Figure 4.8, Mann-Whitney U test, p < 0.05). Species richness was
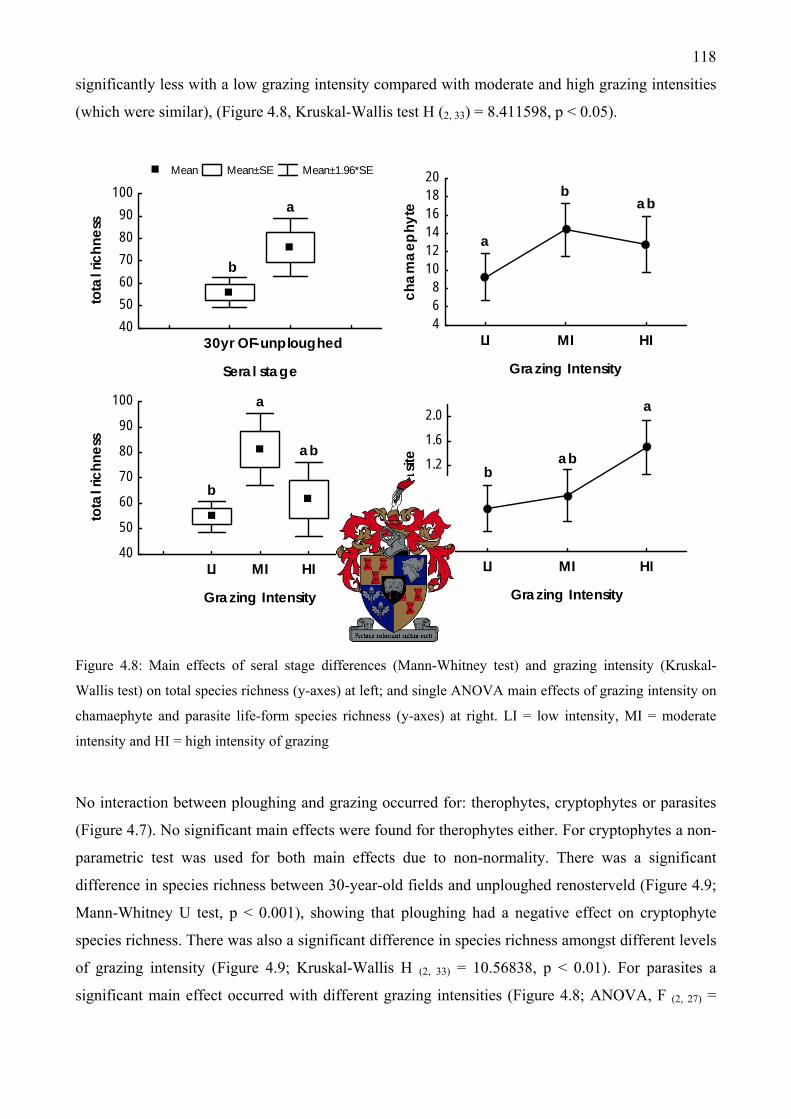
118
significantly less with a low grazing intensity compared with moderate and high grazing intensities
(which were similar), (Figure 4.8, Kruskal-Wallis test H (2, 33) = 8.411598, p < 0.05).
Mean Mean±SE Mean±1.96*SE
30yr OF -unploughed
Seral stage
405060708090
100
tota
l ric
hnes
s
LI MI HI
Grazing Intensity
468
101214161820
cham
aeph
yte
LI MI HI
Grazing Intensity
40
50
60
70
80
90
100
tota
l ric
hnes
s
LI MI HI
Grazing Intensity
0.00.40.81.21.6
2.0pa
rasit
e
a
b
a
bab
a
b
abb
ab
a
Figure 4.8: Main effects of seral stage differences (Mann-Whitney test) and grazing intensity (Kruskal-
Wallis test) on total species richness (y-axes) at left; and single ANOVA main effects of grazing intensity on
chamaephyte and parasite life-form species richness (y-axes) at right. LI = low intensity, MI = moderate
intensity and HI = high intensity of grazing
No interaction between ploughing and grazing occurred for: therophytes, cryptophytes or parasites
(Figure 4.7). No significant main effects were found for therophytes either. For cryptophytes a non-
parametric test was used for both main effects due to non-normality. There was a significant
difference in species richness between 30-year-old fields and unploughed renosterveld (Figure 4.9;
Mann-Whitney U test, p < 0.001), showing that ploughing had a negative effect on cryptophyte
species richness. There was also a significant difference in species richness amongst different levels
of grazing intensity (Figure 4.9; Kruskal-Wallis H (2, 33) = 10.56838, p < 0.01). For parasites a
significant main effect occurred with different grazing intensities (Figure 4.8; ANOVA, F (2, 27) =
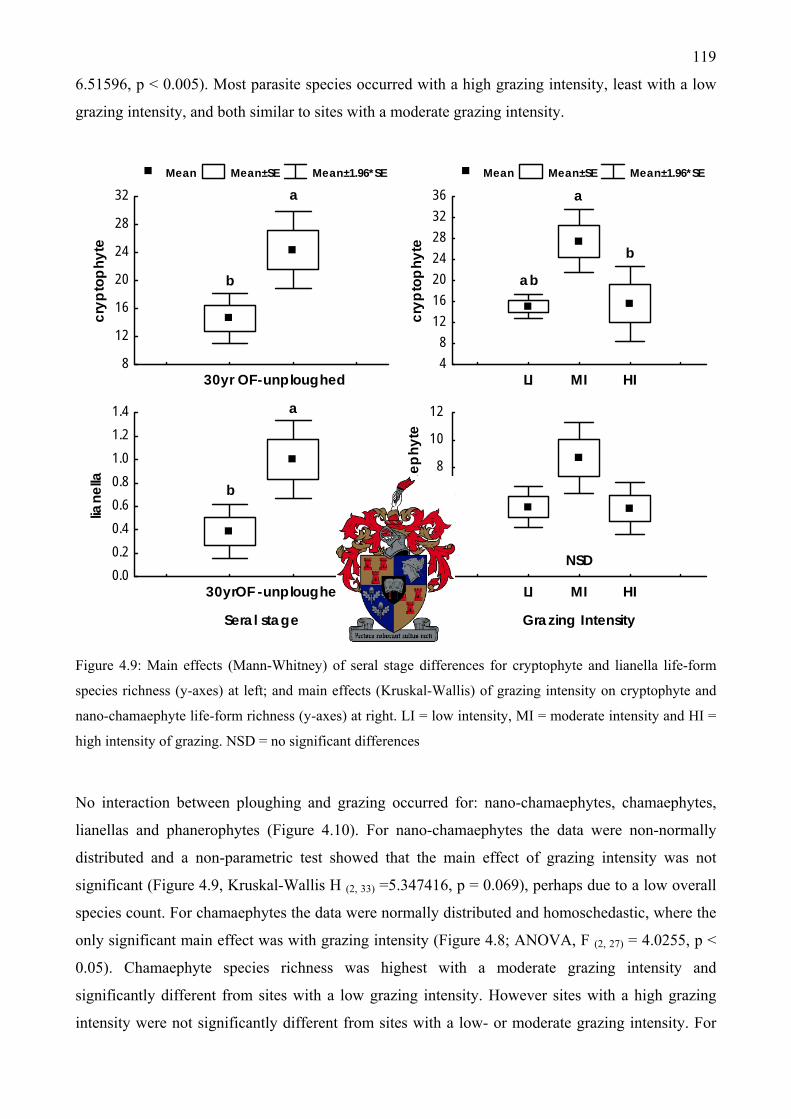
119
6.51596, p < 0.005). Most parasite species occurred with a high grazing intensity, least with a low
grazing intensity, and both similar to sites with a moderate grazing intensity.
Mean Mean±SE Mean±1.96*SE
30yr OF -unploughed8
12
16
20
24
28
32
cryp
toph
yte
Mean Mean±SE Mean±1.96*SE
LI MI HI48
12162024283236
cryp
toph
yte
30yrOF -unploughed
Seral stage
0.00.20.40.60.81.01.21.4
liane
lla
LI MI HI
Grazing Intensity
0
2
4
6
8
10
12 na
no-c
ham
aeph
yte
a
b
a
b
ab
a
b
NSD
Figure 4.9: Main effects (Mann-Whitney) of seral stage differences for cryptophyte and lianella life-form
species richness (y-axes) at left; and main effects (Kruskal-Wallis) of grazing intensity on cryptophyte and
nano-chamaephyte life-form richness (y-axes) at right. LI = low intensity, MI = moderate intensity and HI =
high intensity of grazing. NSD = no significant differences
No interaction between ploughing and grazing occurred for: nano-chamaephytes, chamaephytes,
lianellas and phanerophytes (Figure 4.10). For nano-chamaephytes the data were non-normally
distributed and a non-parametric test showed that the main effect of grazing intensity was not
significant (Figure 4.9, Kruskal-Wallis H (2, 33) =5.347416, p = 0.069), perhaps due to a low overall
species count. For chamaephytes the data were normally distributed and homoschedastic, where the
only significant main effect was with grazing intensity (Figure 4.8; ANOVA, F (2, 27) = 4.0255, p <
0.05). Chamaephyte species richness was highest with a moderate grazing intensity and
significantly different from sites with a low grazing intensity. However sites with a high grazing
intensity were not significantly different from sites with a low- or moderate grazing intensity. For

120
lianellas no interacting effect was found to occur probably due to the occasional occurrence and
sample size of species. A significant main effect of ploughing occurred for lianellas between seres
(Figure 4.9; Mann-Whitney U test, p = 0.016). Logically, this suggests that ploughing alters
vegetation structure and reduces lianella life-form richness.
30yr OF unploughed
LI MI HI02468
101214
nano
-cha
mae
phyt
e
30yr OF unploughed
LI MI HI0
4
8
12
16
20
24
cham
aeph
yte
LI MI HI
Grazing Intensity
-2
-1
0
1
2
3
4
liane
lla
LI MI HI
Grazing Intensity
-2
-1
0
1
2
3
phan
erop
hyte
Figure 4.10: The interaction of seral stage and grazing intensity on nano-chamaephyte, chamaephyte, lianella
(weighted means) and phanerophyte (weighted means) species richness (y-axes). LI = low intensity, MI =
moderate intensity and HI = high intensity of grazing. Vertical bars denote 0.95 confidence intervals
4.3.2. Life-form Cover-abundance at the 10 m2 Scale
The Influence of Ploughing on Life-form Cover-abundance
Cover-abundance data from the 10 m2 quadrats (n = 72) were used in these analyses. Phanerophytes
did not occur in the 10 m2 quadrats analyzed here. As the data were non-normally distributed a
bootstrap randomization test was used. The life-form groups responded to ploughing differently in
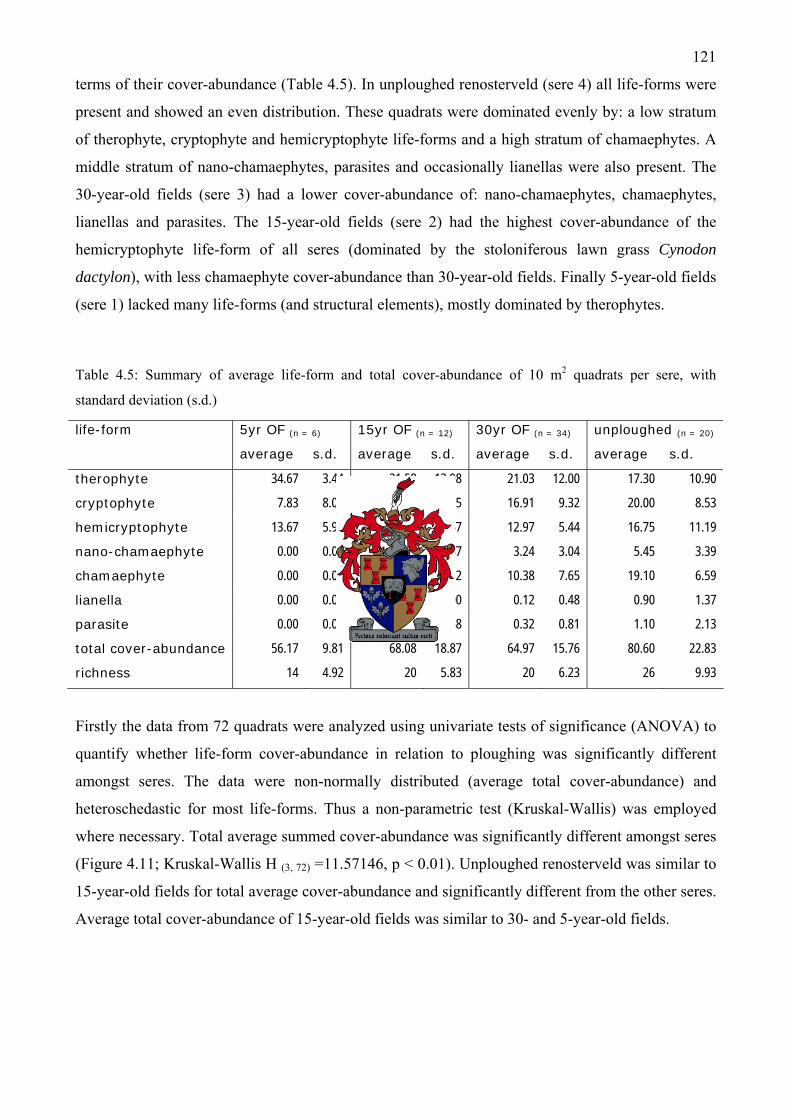
121
terms of their cover-abundance (Table 4.5). In unploughed renosterveld (sere 4) all life-forms were
present and showed an even distribution. These quadrats were dominated evenly by: a low stratum
of therophyte, cryptophyte and hemicryptophyte life-forms and a high stratum of chamaephytes. A
middle stratum of nano-chamaephytes, parasites and occasionally lianellas were also present. The
30-year-old fields (sere 3) had a lower cover-abundance of: nano-chamaephytes, chamaephytes,
lianellas and parasites. The 15-year-old fields (sere 2) had the highest cover-abundance of the
hemicryptophyte life-form of all seres (dominated by the stoloniferous lawn grass Cynodon
dactylon), with less chamaephyte cover-abundance than 30-year-old fields. Finally 5-year-old fields
(sere 1) lacked many life-forms (and structural elements), mostly dominated by therophytes.
Table 4.5: Summary of average life-form and total cover-abundance of 10 m2 quadrats per sere, with
standard deviation (s.d.)
life-form 5yr OF (n = 6) 15yr OF (n = 12) 30yr OF (n = 34) unploughed (n = 20)
average s.d. average s.d. average s.d. average s.d.
therophyte 34.67 3.44 31.58 12.98 21.03 12.00 17.30 10.90
cryptophyte 7.83 8.01 18.25 10.15 16.91 9.32 20.00 8.53
hemicryptophyte 13.67 5.99 13.33 2.67 12.97 5.44 16.75 11.19
nano-chamaephyte 0.00 0.00 2.33 2.67 3.24 3.04 5.45 3.39
chamaephyte 0.00 0.00 2.42 3.12 10.38 7.65 19.10 6.59
lianella 0.00 0.00 0.00 0.00 0.12 0.48 0.90 1.37
parasite 0.00 0.00 0.17 0.58 0.32 0.81 1.10 2.13
total cover-abundance 56.17 9.81 68.08 18.87 64.97 15.76 80.60 22.83
richness 14 4.92 20 5.83 20 6.23 26 9.93
Firstly the data from 72 quadrats were analyzed using univariate tests of significance (ANOVA) to
quantify whether life-form cover-abundance in relation to ploughing was significantly different
amongst seres. The data were non-normally distributed (average total cover-abundance) and
heteroschedastic for most life-forms. Thus a non-parametric test (Kruskal-Wallis) was employed
where necessary. Total average summed cover-abundance was significantly different amongst seres
(Figure 4.11; Kruskal-Wallis H (3, 72) =11.57146, p < 0.01). Unploughed renosterveld was similar to
15-year-old fields for total average cover-abundance and significantly different from the other seres.
Average total cover-abundance of 15-year-old fields was similar to 30- and 5-year-old fields.
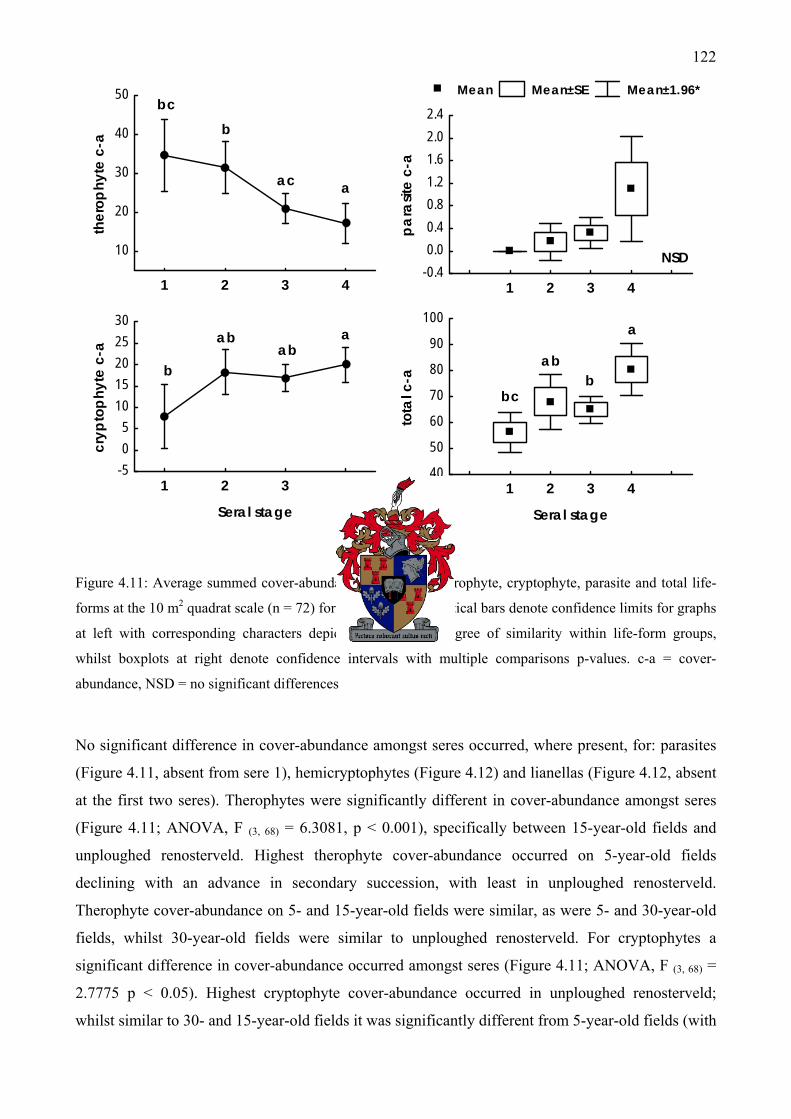
122
1 2 3 4
10
20
30
40
50th
erop
hyte
c-a
Mean Mean±SE Mean±1.96*
1 2 3 4-0.40.00.40.81.21.62.02.4
para
site
c-a
1 2 3 4
Seral stage
-505
1015202530
cryp
toph
yte
c-a
1 2 3 4
Seral stage
40
50
60
70
80
90
100
tota
l c-a
aac
bbc
aab
ab
b
a
bab
bc
NSD
Figure 4.11: Average summed cover-abundance (y-axes) of therophyte, cryptophyte, parasite and total life-
forms at the 10 m2 quadrat scale (n = 72) for different seres. Vertical bars denote confidence limits for graphs
at left with corresponding characters depicting Bonferroni degree of similarity within life-form groups,
whilst boxplots at right denote confidence intervals with multiple comparisons p-values. c-a = cover-
abundance, NSD = no significant differences
No significant difference in cover-abundance amongst seres occurred, where present, for: parasites
(Figure 4.11, absent from sere 1), hemicryptophytes (Figure 4.12) and lianellas (Figure 4.12, absent
at the first two seres). Therophytes were significantly different in cover-abundance amongst seres
(Figure 4.11; ANOVA, F (3, 68) = 6.3081, p < 0.001), specifically between 15-year-old fields and
unploughed renosterveld. Highest therophyte cover-abundance occurred on 5-year-old fields
declining with an advance in secondary succession, with least in unploughed renosterveld.
Therophyte cover-abundance on 5- and 15-year-old fields were similar, as were 5- and 30-year-old
fields, whilst 30-year-old fields were similar to unploughed renosterveld. For cryptophytes a
significant difference in cover-abundance occurred amongst seres (Figure 4.11; ANOVA, F (3, 68) =
2.7775 p < 0.05). Highest cryptophyte cover-abundance occurred in unploughed renosterveld;
whilst similar to 30- and 15-year-old fields it was significantly different from 5-year-old fields (with
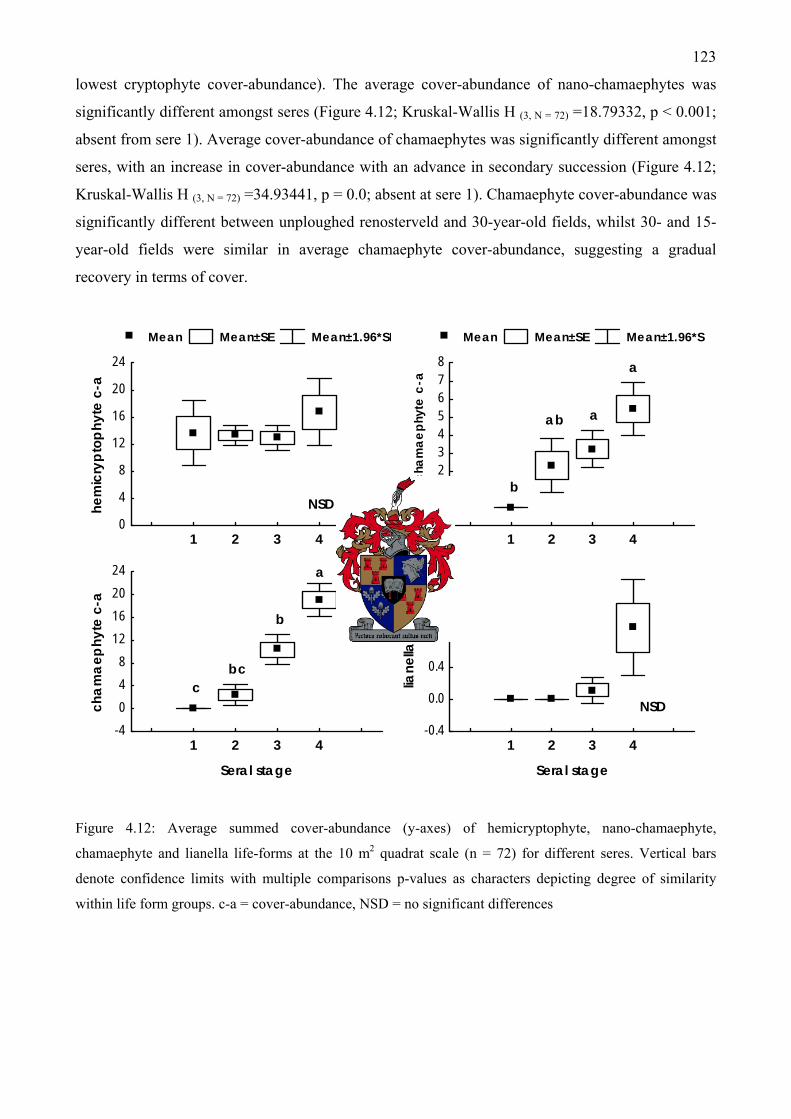
123
lowest cryptophyte cover-abundance). The average cover-abundance of nano-chamaephytes was
significantly different amongst seres (Figure 4.12; Kruskal-Wallis H (3, N = 72) =18.79332, p < 0.001;
absent from sere 1). Average cover-abundance of chamaephytes was significantly different amongst
seres, with an increase in cover-abundance with an advance in secondary succession (Figure 4.12;
Kruskal-Wallis H (3, N = 72) =34.93441, p = 0.0; absent at sere 1). Chamaephyte cover-abundance was
significantly different between unploughed renosterveld and 30-year-old fields, whilst 30- and 15-
year-old fields were similar in average chamaephyte cover-abundance, suggesting a gradual
recovery in terms of cover.
Mean Mean±SE Mean±1.96*SE
1 2 3 40
4
8
12
16
20
24
hem
icry
ptop
hyte
c-a
Mean Mean±SE Mean±1.96*S
1 2 3 4-1012345678
nano
-cha
mae
phyt
e c-
a
1 2 3 4
Seral stage
-4048
12162024
cham
aeph
yte
c-a
1 2 3 4
Seral stage
-0.4
0.0
0.4
0.8
1.2
1.6
liane
lla c
-a
a
aab
b
a
b
bcc
NSD
NSD
Figure 4.12: Average summed cover-abundance (y-axes) of hemicryptophyte, nano-chamaephyte,
chamaephyte and lianella life-forms at the 10 m2 quadrat scale (n = 72) for different seres. Vertical bars
denote confidence limits with multiple comparisons p-values as characters depicting degree of similarity
within life form groups. c-a = cover-abundance, NSD = no significant differences

124
The Influence of Ploughing and Grazing on Life-form Cover-abundance
Life-form cover-abundance in relation to both ploughing and grazing disturbances was analyzed
only between the last two seres (30-year-old fields and unploughed stands, n = 54), as previously
mentioned due to unequal replication of earlier seres. For interacting effects with grazing after
ploughing a bootstrapping test was performed as the data were non-normally distributed for:
cryptophytes, hemicryptophytes, parasites and total cover-abundance; as well as heteroschedastic
for: therophytes, hemicryptophytes, parasites and total cover-abundance.
LI MI HI
Grazing Intensity
40
50
60
70
80
90
100
110
120
130
tota
l c-a ab
ab ab
ab
a
b
30yr OF unploughed
Bootstrap meansp < 0.05
Figure 4.13: Total cover-abundance of all life-forms at the 10 m2 quadrat scale (n = 54) with the interaction
of ploughing and grazing intensity. LI = low intensity, MI = moderate intensity and HI = high intensity of
grazing. Vertical bars denote bootstrap means, characters depict Bonferroni degree of similarity, c-a = cover-
abundance
Figure 4.13 (bootstrap means (2, 48), p < 0.05) shows a significant interaction between ploughing and
grazing on total cover-abundance of all life-forms. Only with a high grazing intensity is there a
difference in cover-abundance between unploughed renosterveld and 30-year-old fields (the latter
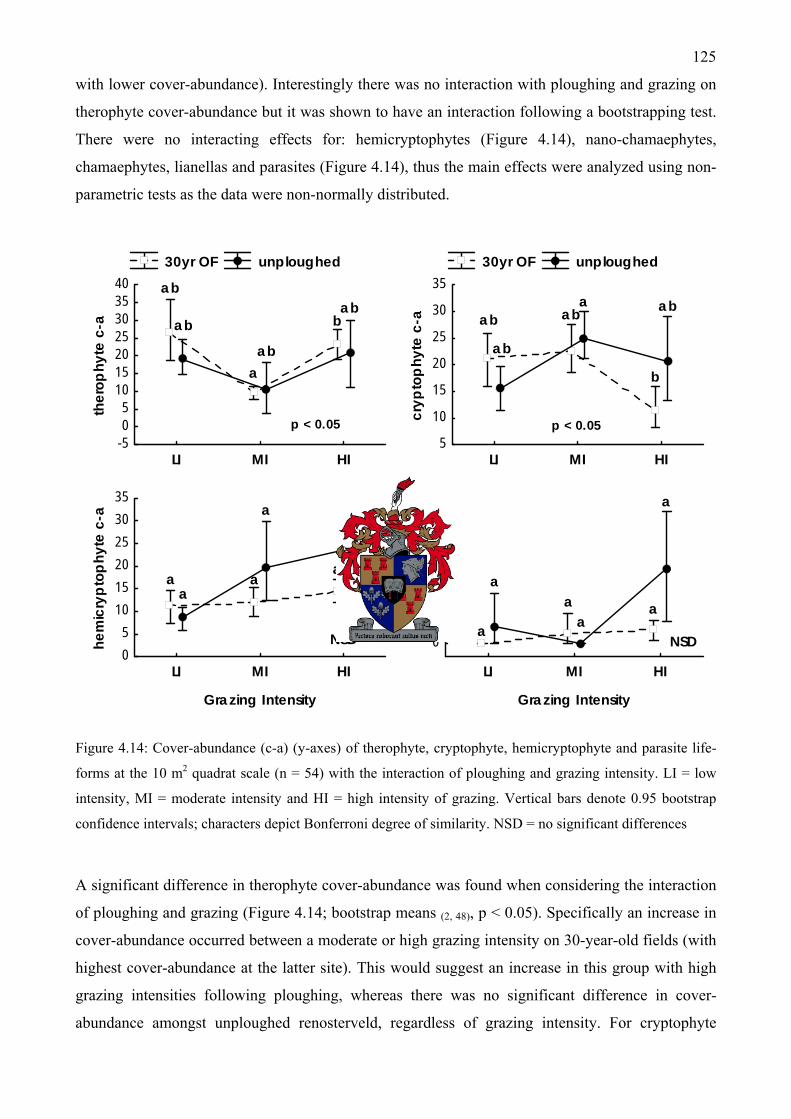
125
with lower cover-abundance). Interestingly there was no interaction with ploughing and grazing on
therophyte cover-abundance but it was shown to have an interaction following a bootstrapping test.
There were no interacting effects for: hemicryptophytes (Figure 4.14), nano-chamaephytes,
chamaephytes, lianellas and parasites (Figure 4.14), thus the main effects were analyzed using non-
parametric tests as the data were non-normally distributed.
30yr OF unploughed
LI MI HI-505
10152025303540
ther
ophy
te c
-a
30yr OF unploughed
LI MI HI5
10
15
20
25
30
35
cryp
toph
yte
c-a
LI MI HI
Grazing Intensity
05
101520253035
hem
icry
ptop
hyte
c-a
LI MI HI
Grazing Intensity
0
1
2
3
4
5
para
site
c-a
ab
ab
aab
bab
ab
ab
aba
b
ab
aa
a
a
a
a
a
aa
aa
a
NSD NSD
p < 0.05 p < 0.05
Figure 4.14: Cover-abundance (c-a) (y-axes) of therophyte, cryptophyte, hemicryptophyte and parasite life-
forms at the 10 m2 quadrat scale (n = 54) with the interaction of ploughing and grazing intensity. LI = low
intensity, MI = moderate intensity and HI = high intensity of grazing. Vertical bars denote 0.95 bootstrap
confidence intervals; characters depict Bonferroni degree of similarity. NSD = no significant differences
A significant difference in therophyte cover-abundance was found when considering the interaction
of ploughing and grazing (Figure 4.14; bootstrap means (2, 48), p < 0.05). Specifically an increase in
cover-abundance occurred between a moderate or high grazing intensity on 30-year-old fields (with
highest cover-abundance at the latter site). This would suggest an increase in this group with high
grazing intensities following ploughing, whereas there was no significant difference in cover-
abundance amongst unploughed renosterveld, regardless of grazing intensity. For cryptophyte
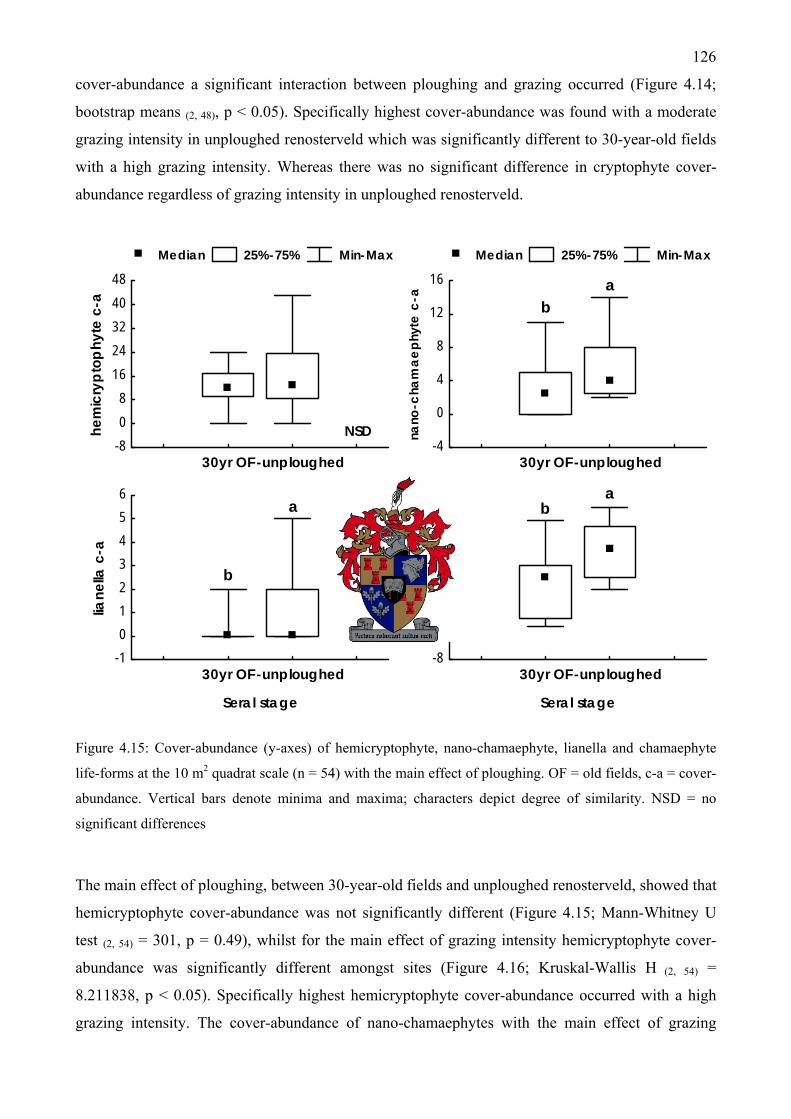
126
cover-abundance a significant interaction between ploughing and grazing occurred (Figure 4.14;
bootstrap means (2, 48), p < 0.05). Specifically highest cover-abundance was found with a moderate
grazing intensity in unploughed renosterveld which was significantly different to 30-year-old fields
with a high grazing intensity. Whereas there was no significant difference in cryptophyte cover-
abundance regardless of grazing intensity in unploughed renosterveld.
Median 25%-75% Min-Max
30yr OF -unploughed-808
1624324048
hem
icry
ptop
hyte
c-a
Median 25%-75% Min-Max
30yr OF -unploughed-4
0
4
8
12
16
nano
-cha
mae
phyt
e c-
a
30yr OF -unploughed
Seral stage
-10123456
liane
lla c
-a
30yr OF -unploughed
Seral stage
-8
0
8
16
24
32
cham
aeph
yte
c-a
ba
a
b
ab
NSD
Figure 4.15: Cover-abundance (y-axes) of hemicryptophyte, nano-chamaephyte, lianella and chamaephyte
life-forms at the 10 m2 quadrat scale (n = 54) with the main effect of ploughing. OF = old fields, c-a = cover-
abundance. Vertical bars denote minima and maxima; characters depict degree of similarity. NSD = no
significant differences
The main effect of ploughing, between 30-year-old fields and unploughed renosterveld, showed that
hemicryptophyte cover-abundance was not significantly different (Figure 4.15; Mann-Whitney U
test (2, 54) = 301, p = 0.49), whilst for the main effect of grazing intensity hemicryptophyte cover-
abundance was significantly different amongst sites (Figure 4.16; Kruskal-Wallis H (2, 54) =
8.211838, p < 0.05). Specifically highest hemicryptophyte cover-abundance occurred with a high
grazing intensity. The cover-abundance of nano-chamaephytes with the main effect of grazing
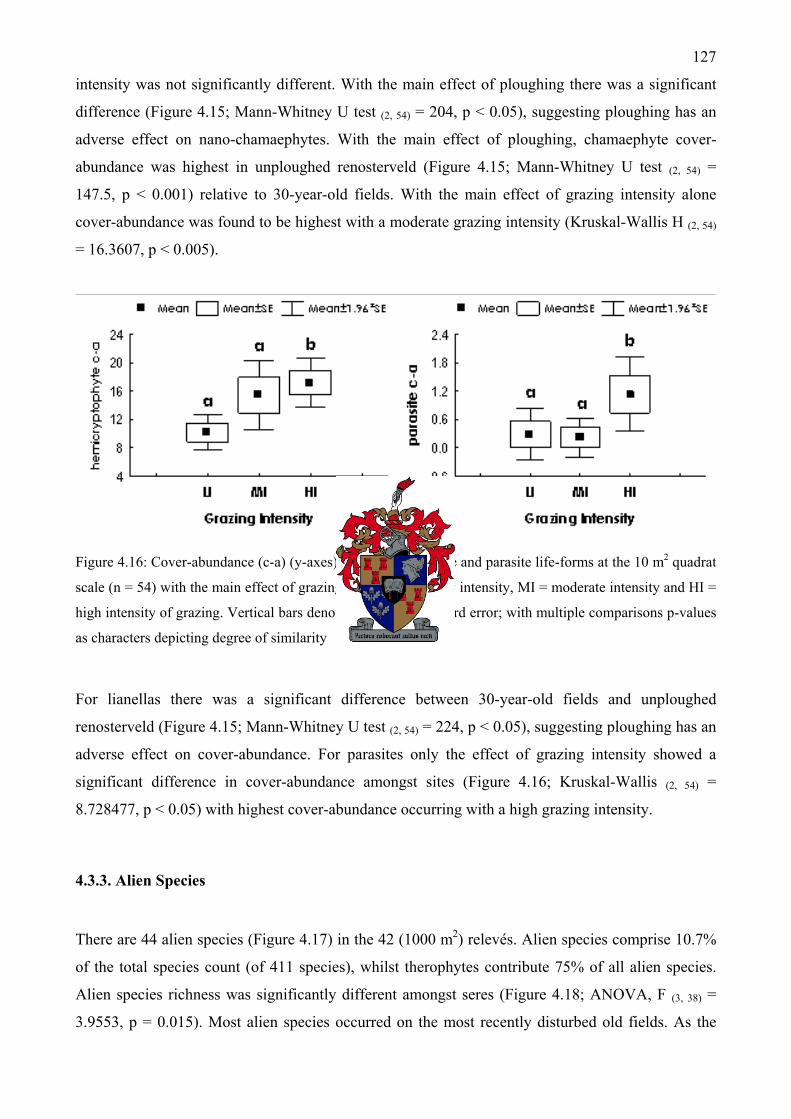
127
intensity was not significantly different. With the main effect of ploughing there was a significant
difference (Figure 4.15; Mann-Whitney U test (2, 54) = 204, p < 0.05), suggesting ploughing has an
adverse effect on nano-chamaephytes. With the main effect of ploughing, chamaephyte cover-
abundance was highest in unploughed renosterveld (Figure 4.15; Mann-Whitney U test (2, 54) =
147.5, p < 0.001) relative to 30-year-old fields. With the main effect of grazing intensity alone
cover-abundance was found to be highest with a moderate grazing intensity (Kruskal-Wallis H (2, 54)
= 16.3607, p < 0.005).
Figure 4.16: Cover-abundance (c-a) (y-axes) of hemicryptophyte and parasite life-forms at the 10 m2 quadrat
scale (n = 54) with the main effect of grazing intensity. LI = low intensity, MI = moderate intensity and HI =
high intensity of grazing. Vertical bars denote means and standard error; with multiple comparisons p-values
as characters depicting degree of similarity
For lianellas there was a significant difference between 30-year-old fields and unploughed
renosterveld (Figure 4.15; Mann-Whitney U test (2, 54) = 224, p < 0.05), suggesting ploughing has an
adverse effect on cover-abundance. For parasites only the effect of grazing intensity showed a
significant difference in cover-abundance amongst sites (Figure 4.16; Kruskal-Wallis (2, 54) =
8.728477, p < 0.05) with highest cover-abundance occurring with a high grazing intensity.
4.3.3. Alien Species
There are 44 alien species (Figure 4.17) in the 42 (1000 m2) relevés. Alien species comprise 10.7%
of the total species count (of 411 species), whilst therophytes contribute 75% of all alien species.
Alien species richness was significantly different amongst seres (Figure 4.18; ANOVA, F (3, 38) =
3.9553, p = 0.015). Most alien species occurred on the most recently disturbed old fields. As the
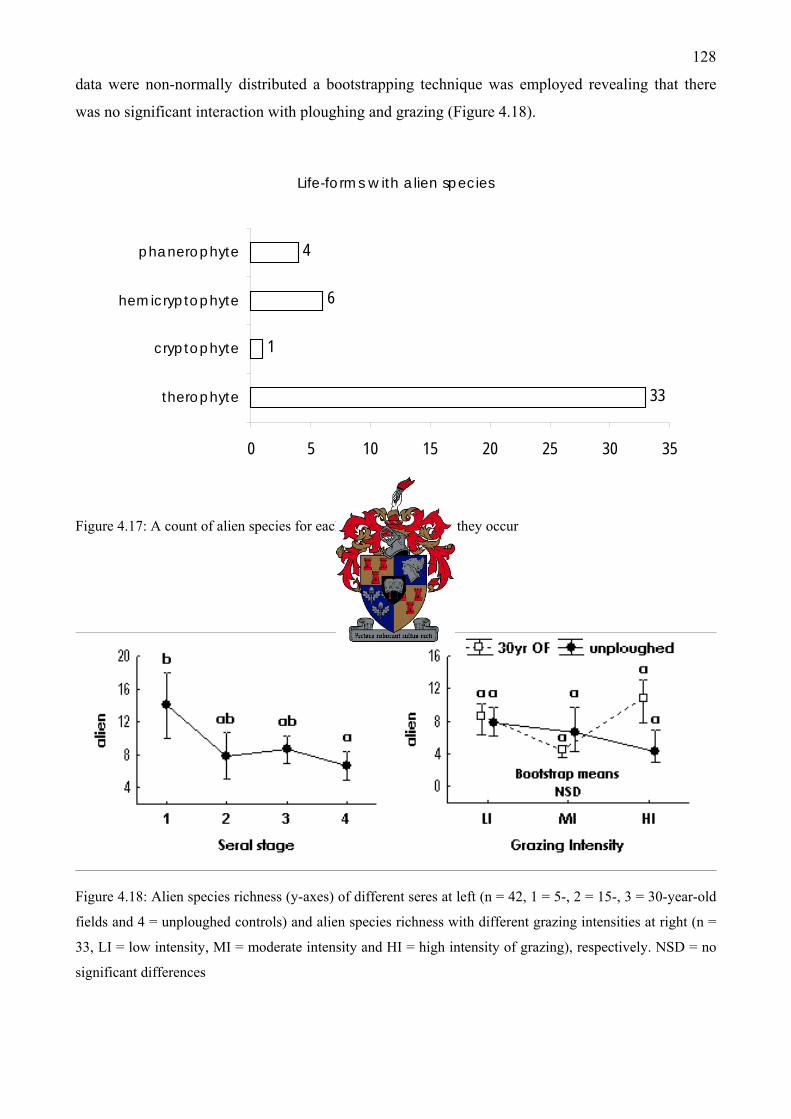
128
data were non-normally distributed a bootstrapping technique was employed revealing that there
was no significant interaction with ploughing and grazing (Figure 4.18).
Life-forms with alien species
33
1
6
4
0 5 10 15 20 25 30 35
therophyte
cryptophyte
hemicryptophyte
phanerophyte
Figure 4.17: A count of alien species for each life-form in which they occur
Figure 4.18: Alien species richness (y-axes) of different seres at left (n = 42, 1 = 5-, 2 = 15-, 3 = 30-year-old
fields and 4 = unploughed controls) and alien species richness with different grazing intensities at right (n =
33, LI = low intensity, MI = moderate intensity and HI = high intensity of grazing), respectively. NSD = no
significant differences
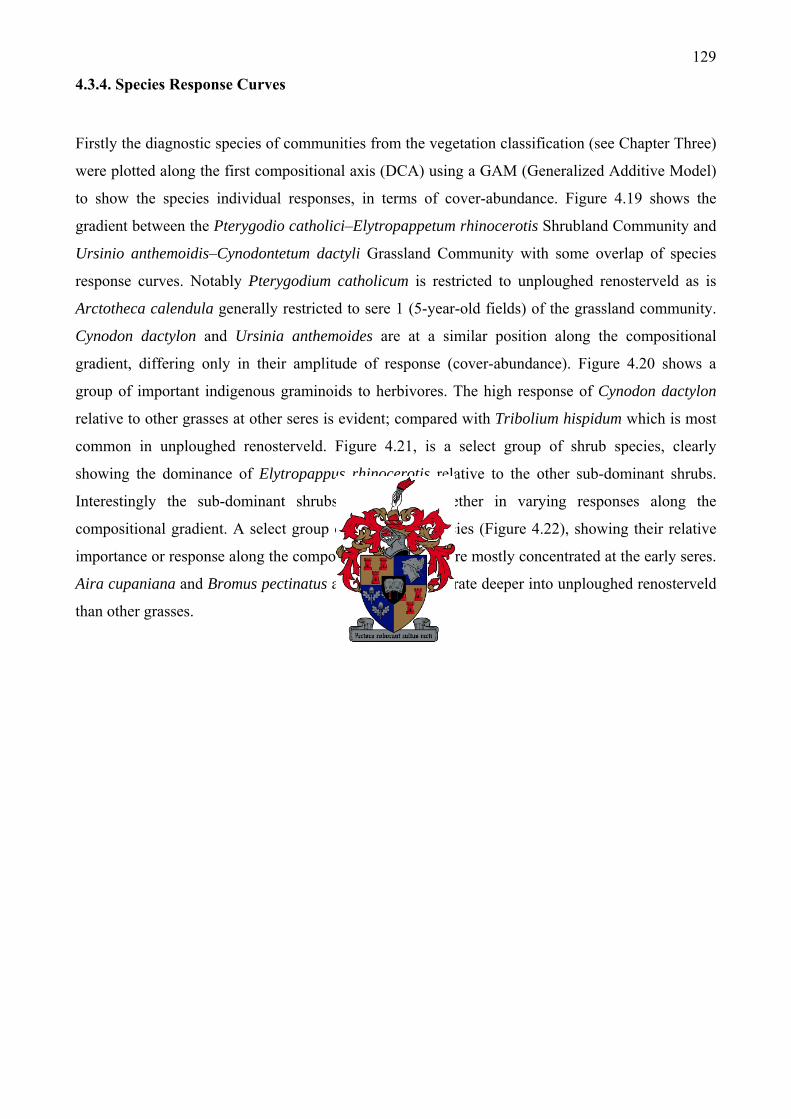
129
4.3.4. Species Response Curves
Firstly the diagnostic species of communities from the vegetation classification (see Chapter Three)
were plotted along the first compositional axis (DCA) using a GAM (Generalized Additive Model)
to show the species individual responses, in terms of cover-abundance. Figure 4.19 shows the
gradient between the Pterygodio catholici–Elytropappetum rhinocerotis Shrubland Community and
Ursinio anthemoidis–Cynodontetum dactyli Grassland Community with some overlap of species
response curves. Notably Pterygodium catholicum is restricted to unploughed renosterveld as is
Arctotheca calendula generally restricted to sere 1 (5-year-old fields) of the grassland community.
Cynodon dactylon and Ursinia anthemoides are at a similar position along the compositional
gradient, differing only in their amplitude of response (cover-abundance). Figure 4.20 shows a
group of important indigenous graminoids to herbivores. The high response of Cynodon dactylon
relative to other grasses at other seres is evident; compared with Tribolium hispidum which is most
common in unploughed renosterveld. Figure 4.21, is a select group of shrub species, clearly
showing the dominance of Elytropappus rhinocerotis relative to the other sub-dominant shrubs.
Interestingly the sub-dominant shrubs are nested together in varying responses along the
compositional gradient. A select group of alien grass species (Figure 4.22), showing their relative
importance or response along the compositional gradient, are mostly concentrated at the early seres.
Aira cupaniana and Bromus pectinatus are shown to penetrate deeper into unploughed renosterveld
than other grasses.
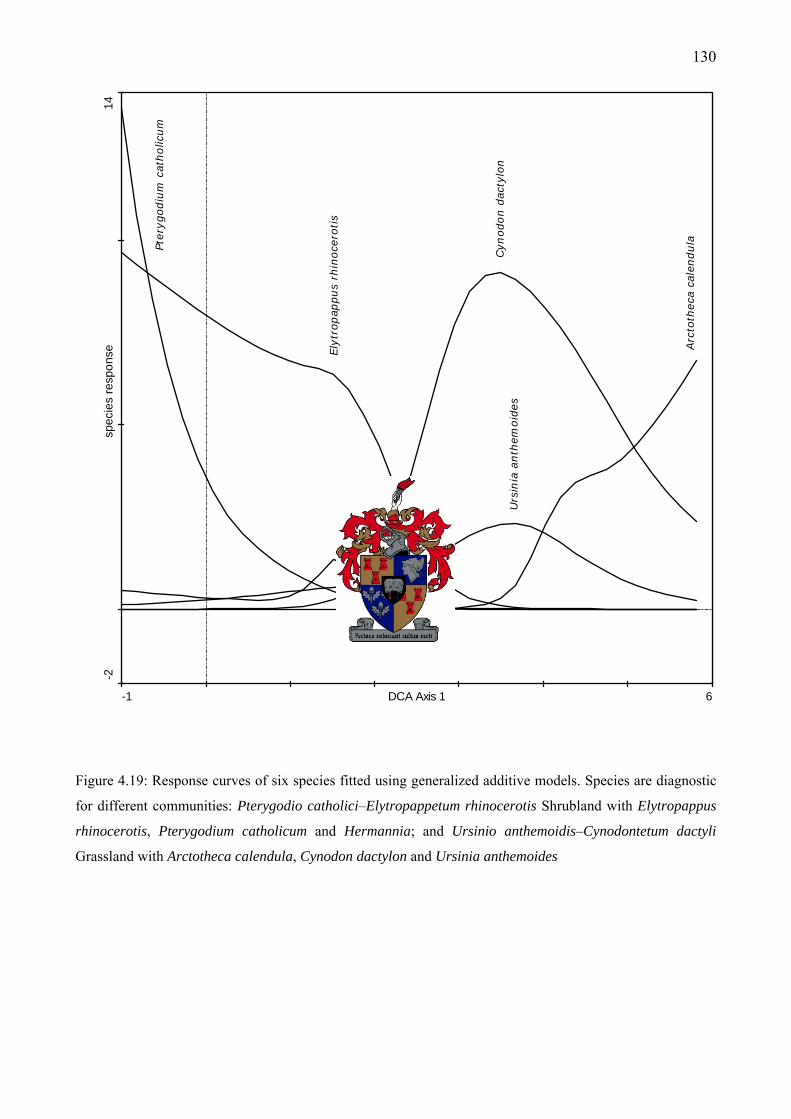
130
-1 6DCA Axis 1
-214
spec
ies
resp
onse A
rcto
thec
a ca
lendula
Cyn
odon d
acty
lon
Ely
tropap
pus
rhin
oce
rotis
Her
man
nia
Ptery
godiu
m c
atholic
um
Urs
inia
anth
emoid
es
Figure 4.19: Response curves of six species fitted using generalized additive models. Species are diagnostic
for different communities: Pterygodio catholici–Elytropappetum rhinocerotis Shrubland with Elytropappus
rhinocerotis, Pterygodium catholicum and Hermannia; and Ursinio anthemoidis–Cynodontetum dactyli
Grassland with Arctotheca calendula, Cynodon dactylon and Ursinia anthemoides
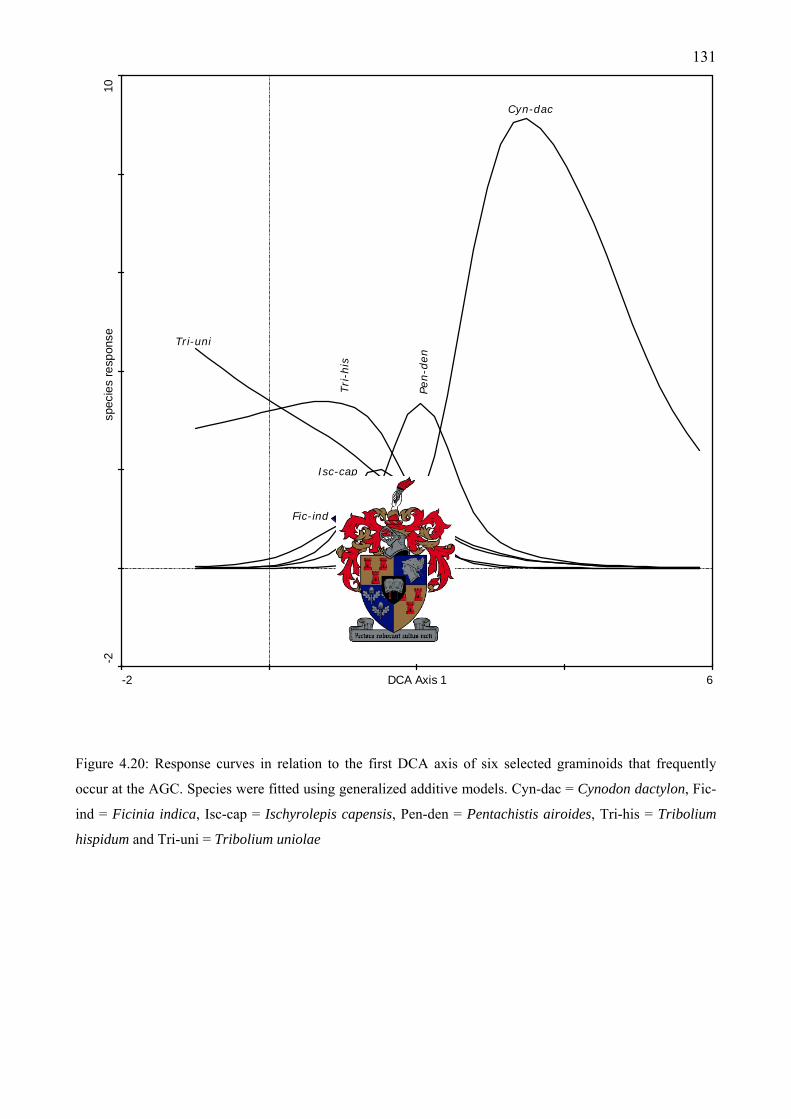
131
-2 6DCA Axis 1
-210
spec
ies
resp
onse
Cyn-dac
Fic-ind
Isc-cap
Pen-d
en
Tri
-his
Tri-uni
Figure 4.20: Response curves in relation to the first DCA axis of six selected graminoids that frequently
occur at the AGC. Species were fitted using generalized additive models. Cyn-dac = Cynodon dactylon, Fic-
ind = Ficinia indica, Isc-cap = Ischyrolepis capensis, Pen-den = Pentachistis airoides, Tri-his = Tribolium
hispidum and Tri-uni = Tribolium uniolae
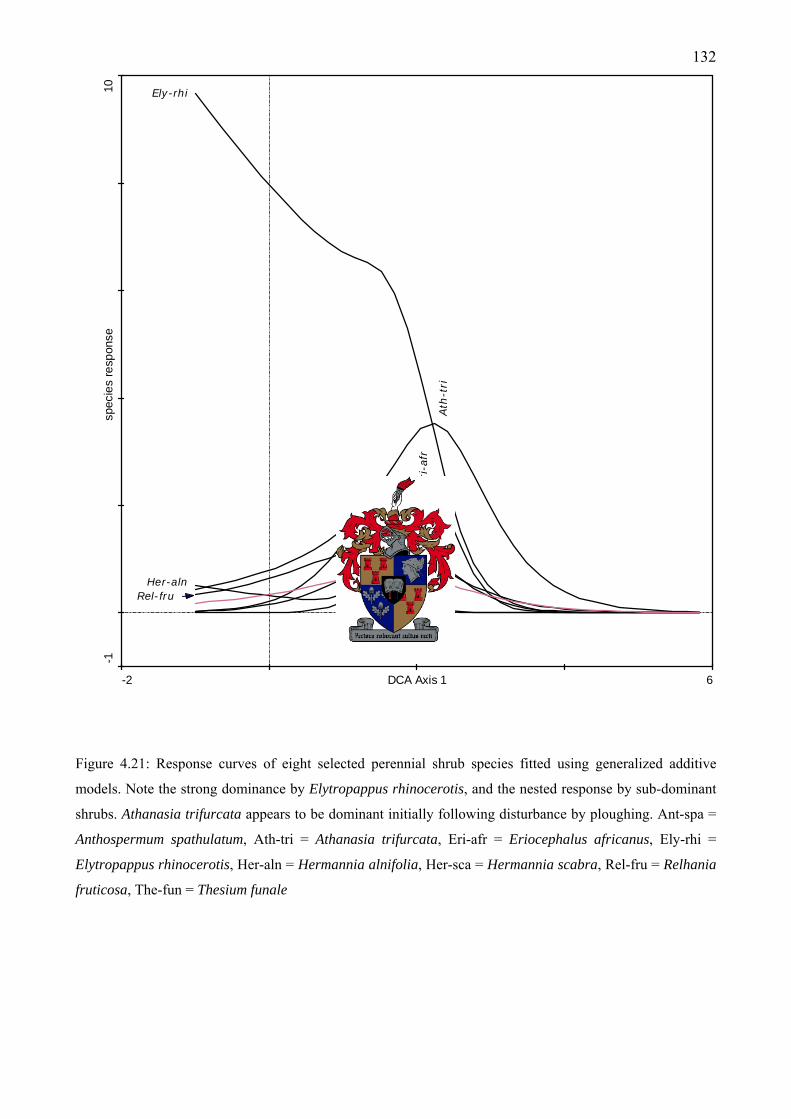
132
-2 6DCA Axis 1
-110
spec
ies
resp
onse
Ant-spa
Ath
-tri
Ely-rhi
Eri
-afr
Her-aln
Her-
sca
Rel-fruThe-fun
Figure 4.21: Response curves of eight selected perennial shrub species fitted using generalized additive
models. Note the strong dominance by Elytropappus rhinocerotis, and the nested response by sub-dominant
shrubs. Athanasia trifurcata appears to be dominant initially following disturbance by ploughing. Ant-spa =
Anthospermum spathulatum, Ath-tri = Athanasia trifurcata, Eri-afr = Eriocephalus africanus, Ely-rhi =
Elytropappus rhinocerotis, Her-aln = Hermannia alnifolia, Her-sca = Hermannia scabra, Rel-fru = Relhania
fruticosa, The-fun = Thesium funale
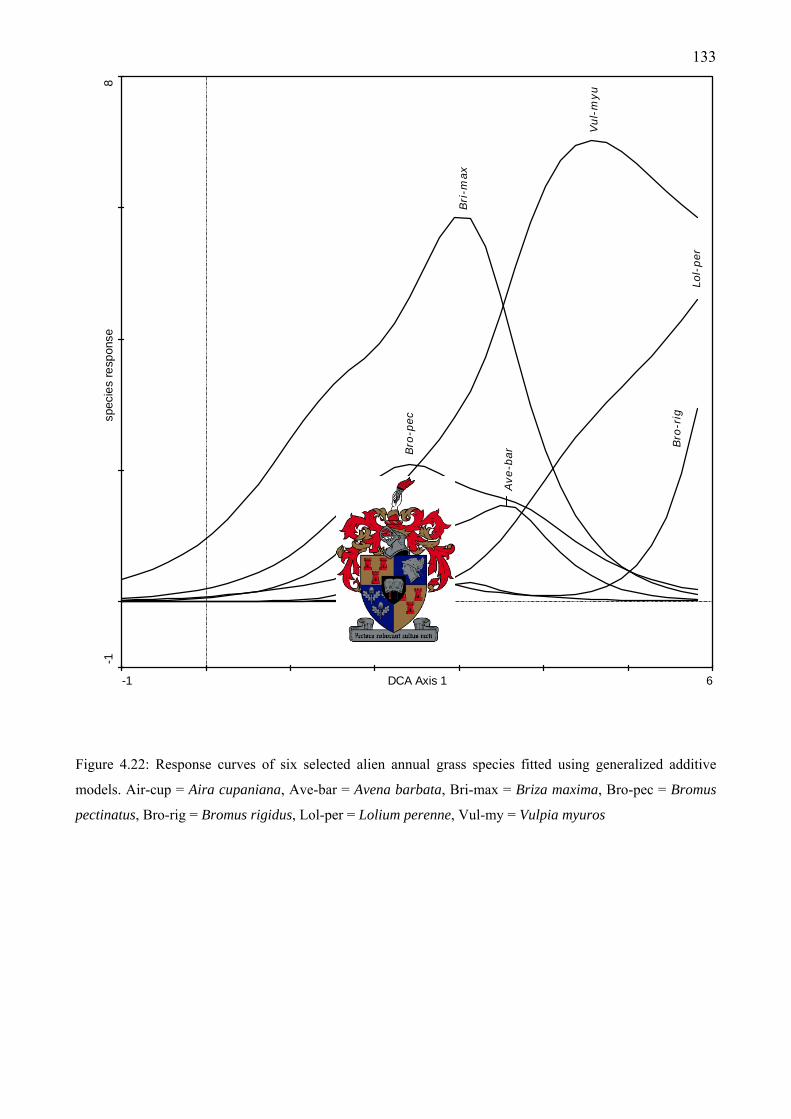
133
-1 6DCA Axis 1
-18
spec
ies
resp
onse
Air
-cup
Ave
-bar
Bri
-max
Bro
-pec
Bro
-rig
Lol-
per
Vul-
myu
Figure 4.22: Response curves of six selected alien annual grass species fitted using generalized additive
models. Air-cup = Aira cupaniana, Ave-bar = Avena barbata, Bri-max = Briza maxima, Bro-pec = Bromus
pectinatus, Bro-rig = Bromus rigidus, Lol-per = Lolium perenne, Vul-my = Vulpia myuros
134
4.4. Discussion
This study considers secondary succession on set-aside old fields in a chronosequence of 30 years
or more. Renosterveld vegetation is highly fragmented and these findings have relevance for
restoration or rehabilitation of old fields and degraded landscapes of Swartland Shale Renosterveld
(Mucina and Rutherford 2004). In some respects the destruction of vegetation by ploughing is
irreversible, in others not. Certain life-forms are more sensitive to ploughing than others. Life-forms
that do not re-colonize old fields would have to be manually seeded or planted on to old fields; in
contrast to life-forms freely able to arrive on to old fields by dispersal from proximate propagule
sources.
General patterns of life-form change, with respect to richness and cover-abundance on old fields
relative to unploughed renosterveld is discussed. The observed chronosequence here is
acknowledged as being dependant on close proximity to a propagule source. I thus doubt that a
similar pattern would occur on set aside fields deep inside an agricultural matrix (where indigenous
bunchgrasses are absent, a major problem for restoration of valley grasslands in California (Keeley
1990). From the perspective of life-form richness and cover-abundance, 30-year-old fields resemble
that of unploughed renosterveld. Thus they are pleasing to the eye and fulfilling the functional cover
over the landscape, alleviating rapid soil erosion by wind and water and sustaining many biotic
interactions. In reality many species are lost by ploughing particularly those species with naturally
narrow distribution ranges. Common species like Pterygodium catholicum may also lack the ability
to disperse on to old fields due to pollinator dependencies (Pauw 2004) on viable (large) fragments
for nesting sites to ensure sexual reproduction. Also species with short dispersal trajectories would
be affected by fragmentation. Thus a lack of certain species on old fields may have something more
to do with pollinator interactions or suitable micro-habitat requirements than dispersal alone.
Dispersal syndromes of species were studied by Kemper (1997) and Shiponeni (2003) where a 1:1
ratio of wind dispersed versus biotically dispersed species was found. Wind dispersed species like
Elytropappus rhinocerotis (renosterbos) have long dispersal distances compared to short seed rains
of some geophytes like Babiana angustifolia. Seed rain of bird dispersed species falls close to
perches in matorral (Feuntes et al. 1986). Similarly in renosterveld and strandveld, bird-dispersed
species form bush-clumps (heuweltjies, associated with Olea europaea subsp. africana, Boucher
1987). Bird perch dependency limits entry of these species on to old fields, and perches are
typically lacking. Thus wind dispersed species would be the primary group of colonizers on to old
fields adjacent to a propagule source. Biotically dispersed species like succulents (see Milton and
135
Dean 2001); chamaephytes such as Hermannia alnifolia and H. scabra; and the hemi-parasite
Thesium funale could be the secondary group of arrivals on to old fields transported in herbivore
dung. In accompaniment of seed mobility is the extant seed bank. Logically the seed bank of old
fields would be depauperate or exhausted compared with unploughed renosterveld, and the former
seed bank would consist of many ruderal and/or alien species with few indigenous geophytes (see
Shiponeni 2003). Thus the speciose seed bank propagule source of unploughed renosterveld would
be a constant source for old fields. In addition many species like some geophytes occur in discrete
microhabitats and are naturally locally rare, often persisting in marginal habitats (unsuitable for
agriculture until quite recently, wetland verges and hard-pans). These specialized species are not
always able to advance on to unsuitable old fields habitats.
Renosterveld is a hardy shrubland vegetation, enduring hot summers and desiccating winds.
Unploughed renosterveld is in a cyclical state or suspended succession, rather like a climax state,
dominated by shrubs with open spaces and grasses throughout. Seedlings of the dominant stratum
can germinate, and reach maturity mostly only in open spaces in the natural matrix (similar to
coastal sage scrub DeSimone and Zedler 1999, Keeley 1984). The author has seen seedling
germination between adults of shrub species thereby indicating partial reliance on fire-stimulated
germination, and Boucher (1981) noted robust renosterbos individuals of at least 50 years on old
fields. This does not imply that seedlings and even young juveniles are tolerant of severe dry
(drought-like) periods. Seedling recruitment in renosterveld may occur in pulses, coinciding with
above-average and consistent winter rains with or without fire. Indigenous seedbanks would be
depleted as a result of ploughing, thus old fields would only contain a subset of the original
composition. In addition seedbanks of old fields would be exhausted as germination occurs and heat
and wind kill most recruits, and this process would repeat itself until all seeds are spent. Seedbank
“exhaustion” may explain why some old fields are not recruiting an observable shrub stratum. In
this scenario colonization of fields can only occur with the arrival of propagules either
blown/washed in or dispersed by organisms.
4.4.1. Life-form Richness Patterns at the 1000 m2 Scale
Unploughed renosterveld has most species and highest life-form richness compared with recovering
old fields, but had a similar species richness to 30-year-old fields. Similarly, the interaction of
ploughing and grazing did not influence species richness patterns, although a moderate grazing
intensity (relative to a low grazing intensity) favoured highest species richness. Once renosterveld is
136
ploughed it takes as long as 30 years for succession to advance to a structural state resembling that
of unploughed renosterveld. The horizontal structure of 30-year-old fields is similar to unploughed
renosterveld and species richness is almost as high but never entirely recovered.
Therophytes were equally speciose at all seres suggesting that they were not promoted, or at least
affected, by ploughing relative to other life-forms. This is in contrast to that shown by Krug et al.
2004. Many alien and/or ruderal species are therophytes generally adapted to regularly disturbed
environments. Certain therophytes may be restricted to, or benefit from, places shaded by a dense
cover of chamaephytes (shading and protection affect for Nemesia barbata, Hemimeris racemosa),
as is the case in matorral (Holmgren et al. 2000). The species composition of therophytes differs
amongst seres, thus there is a turnover as a result of anthropogenic disturbance and species
occurring in unploughed renosterveld. No interaction occurred with ploughing and grazing for
therophytes thus one can only assume that another factor or disturbance mechanism influences their
patterning. Perhaps the trampling effect and dispersal both ways by grazers between old fields and
unploughed renosterveld mitigates the contrast in richness at recently disturbed sites (an exogenous
propagule source) with unploughed renosterveld (an endogenous propagule source).
Cryptophytes were the most speciose life-form comprising 34% of the sampled pool here (and 17%
of the Cape flora, Goldblatt and Manning 2000), with unploughed renosterveld vegetation
containing highest cryptophyte species richness. Seed dispersal distances are often short and
individual species have narrow distribution ranges like Gladiolus watsonius (Goldblatt and
Manning 1998). Ploughing adversely affected this group however cryptophyte richness was similar
after 30 years of recovery, yet complete richness was never attained. A moderate grazing intensity
seemed to favour highest richness, in accordance with the intermediate disturbance hypothesis
(sensu Connell 1978), suggesting that a high grazing intensity decreased certain cryptophytes.
Cryptophytes are favoured by porcupines and mole-rats as a food-source and aid in their dispersal
(Lovegrove and Jarvis 1986). Above ground cryptophyte plant parts are occasionally browsed
(leaves, flowers or fruit of Romulea flava, B. A. Walton, personal observation) and are also
harvested by termites (Babiana odorata and Moraea galaxia, B. A. Walton, personal observation).
It appears that cryptophytes are unhindered by Cynodon dactylon of old fields, as they are capable
of sending apical shoots directly through the “lawn”.
Pioneering cryptophytes are numerically abundant on old fields, for example: Baeometra uniflora
(winged seed), Moraea lewisiae (usually winged seed) or species adapted to frequent disturbance
like Oxalis obtusa, Oxalis pes-caprae (Petsikos et al. 2004), Oxalis purpurea; and/or dispersed
137
biotically like Geissorhiza aspera (granular seed) and Romulea flava (granular seed). Cryptophytes
like Babiana angustifolia, Moraea villosa and Triglochin bulbosa persisting on or near old fields as
part of original micro-habitats contribute to local propagule sources. Some 30-year-old fields had
heuweltjies with associated geophytes like Moraea flaccida that once colonized increase and persist
undeterred by browsing pressure since they are toxic. Cryptophytes favouring sandier conditions,
typically Gladiolus alatus occurred on 15-year-old fields, often forming regular patches or in a
clumped distribution pattern. Dispersal no doubt occurred in many geophytic species as their seed
generally remains viable for about three years (or less, Manning et al. 2002) only.
Hemicryptophytes were not adversely affected by ploughing, and if given an appropriate amount of
resting time, can potentially re-colonize old fields. This is in contrast to preliminary findings shown
by Krug et al. (2004), as hemicryptophyte richness did not increase with an advance of succession
(merely a slight turnover of species occurred). Long dispersal distance of bunchgrass seed by wind
(Hensen and Müller 1997) ensures colonization on to old fields, as well equally aided by ecto- and
endo-zoochorous dispersal vectors. From this study it appears that grazers perform an important and
necessary dispersal function of hemicryptophytes in unploughed vegetation, relative to sites with a
low grazing intensity. In ploughed vegetation this effect was not apparent. Herbivore grazing
stimulates vegetative growth preventing a moribund state, resembling disturbance by fire.
Mammalian herbivores browse sedges such as Ficinia indica commonly, and occasionally graze
new growth of restioids (Elegia filacea; B. A. Walton, personal observation). Bunchgrasses are
favoured when in shoot by large mammalian herbivores: for example Digitaria eriantha, Ehrharta
calycina, Ehrharta capensis, Eragrostis capensis, Heteropogon contortus, Pentachistis densifolia,
Themeda triandra, Tribolium hispidum, and Tribolium uniolae. The abundant presence of Themeda
triandra in Elandsberg and Krantzkop is promising suggesting that current managed stocking rates
have not yet caused a severe decline of this preferred bunchgrass (whilst Digitaria eriantha is rare)-
although this could indicate disturbance (Linder 1989). Cynodon dactylon is continuously grazed by
large mammalian herbivores on old fields, therefore reducing the effect of competition by this
stoloniferous grass on emerging annual and perennial (shrub) seedlings. A feedback loop possibly
arises whereby herbivores browse annual and perennial species, thus retarding the rate of succession
of shrubs on to old fields (arrested secondary succession or even retrogressive succession, see
Walker et al. 2000).
Nano-chamaephyte recovery was promising after 30 years. It appears ploughing affects this group
severely. This group is composed of disturbance tolerant species, for example Helichrysum asperum
(palatable) and disturbance intolerant decumbent or erect succulents (dispersed by water, some
138
favouring moist sites, others dispersed by herbivores). Chamaephytes were negatively affected by
ploughing, but recovery was also promising after 30 years, and grazing seemed to influence
richness. Overgrazing signs are visible at Krantzkop where numerous shrubs: Elytropappus
rhinocerotis, Eriocephalus africanus subsp. paniculatus, Lobostemon argenteus and Relhania
fruticosa, have been uprooted either due to trampling, strong browsing pressure (also rooting by
Eland) or feral pig activity. Palatable shrub and dwarf shrub recovery on to old fields is delayed by
grazing especially for: Anthospermum galioides, Anthospermum spathulatum, Hermannia alnifolia,
Hermannia scabra and Thesium funale, which are kept trimmed to about 15 cm. This “bonsai-
effect” is especially evident on 15-year-old fields, but also occurs on both 30-year-old fields and in
unploughed renosterveld. Less palatable shrub species: typically Athanasia trifurcata and
Elytropappus rhinocerotis are only occasionally browsed enabling their dominance in the
vegetation. However the former is browsed by termites whilst the latter is occasionally browsed by
mammals (B.A. Walton, personal observation) as are the new shoot tips of the potentially toxic
Salvia chamelaeagnea. Athanasia trifurcata is potentially toxic (Kellerman et al. 1988), hence a
valid reason for its dominance (or preference for lime-deficient soils). The deep-rooting ability of
renosterbos (Scott and van Breda 1937) might be the primary reason of its ease of advance on to old
fields relative to more shallow-rooted shrubs, as well as penetration being facilitated by a ploughed
surface.
Presence of (a) parasite(s) at the site with a high grazing intensity could reflect that herbivores
favour them and are responsible for dispersal of palatable hemi-parasites like Thesium funale (also
related to an increase in host plants). Most lianella species occurred in unploughed renosterveld,
attributed to chamaephyte presence as their necessary structural support (requiring vegetation
maturity). Phanerophytes were negligible here in terms of richness and not often sampled.
4.4.2. Horizontal Structure and Patterns at the 10 m2 Scale
Total cover-abundance was significantly different amongst seres, increasing with an advance in
succession. After 30 years of rest from ploughing the total cover-abundance decreased with an
increase in grazing intensity. Herbivores had an effect on total cover-abundance of renosterveld (by
browsing and trampling) which was more pronounced only after ploughing. This warrants close
inspection and monitoring of the condition of vegetation and stocking densities on recovering
landscapes.

139
Therophyte cover-abundance was highest on recently disturbed ground (i.e. 5-year-old fields),
whilst cryptophyte and chamaephyte cover-abundance would logically be highest in natural or well
recovered vegetation. Grazing (especially of a high intensity) influenced therophyte cover-
abundance on 30-year-old fields but not in unploughed renosterveld. Cryptophyte cover-abundance
was significantly different amongst seres, specifically low on 5-year-old fields and increasing with
an advance in succession. Cryptophyte cover-abundance was affected by a high grazing intensity
especially following ploughing. Cryptophytes flourish in abundance on Cynodon dactylon old fields
as a “shield” and the lack of shrubs allows for colonizing geophyte species to benefit and spread in
large numbers (especially wind-dispersed species like Moraea lewisiae), or those tolerant to heavy
disturbance like Oxalis purpurea. Conversely other (shade-tolerant) geophytic species may require
the facilitative (nurse-plant) effect of a shrub cover for persistence and even arrival - either as a
wind-trap or perch.
There was no difference in cover-abundance of hemicryptophytes amongst seres. Directly
attributable to an anemochorous dispersal strategy, thus they were blown back on to old fields. This
is in contrast to preliminary findings shown by Krug et al. (2004), as hemicryptophyte cover-
abundance did not increase with an advance of succession, after initial colonization. Grasses like:
Bromus rigidus, B. pectinatus, Cynodon dactylon, Eragrostis curvula, Pentachistis densifolia,
Tribolium hispidum are dispersed in herbivore dung (Shiponeni 2003). Cynodon dactylon is
disturbance tolerant, an early pioneer in succession and occasionally occurring in unploughed
renosterveld. Interestingly this study shows that hemicryptophyte cover-abundance is similar at all
seres, i.e. with or without a shrub stratum. However younger old fields are dominated by Cynodon
dactylon and 30-year old fields or unploughed renosterveld have a more diverse cover-abundance.
There was no interaction with ploughing and grazing for hemicryptophyte cover-abundance.
Highest hemicryptophyte cover-abundance occurred with a high grazing intensity (contrary to
patterns of other life-forms) no doubt due to this life-forms adaptation to browsing.
Nano-chamaephyte cover-abundance was significantly affected by ploughing. As observed some
succulents are sensitive to disturbance by ploughing, and many occurring here require sufficient
moisture to persist like Lampranthus aduncus, consequently occurring in specific micro-habitats
near drainage lines on open old fields. Hardy dwarf shrubs would be expected to occur throughout
the chronosequence and even decline in abundance in unploughed vegetation due to shading. This
was not the case, for example Helichrysum asperum is palatable (van Breda and Barnard 1991)-so it
probably is dispersed into the shrubland matrix. Nano-chamaephytes were most abundant in
140
unploughed vegetation implying sensitivity to disturbance (especially succulents-with short
dispersal distances).
Chamaephyte cover-abundance was affected by ploughing, and recovered fully after 30 years. This
is unlike findings presented by Krug et al. (2004) which showed no difference in cover-abundance
amongst seres. Chamaephyte cover-abundance increased with an advance in succession, following
the trend for species richness. This group is the most prominent stratum in the vegetation and
affected by ploughing but able to effectively recover unlike some more sensitive dwarf shrubs or
cryptophytes. Chamaephyte cover-abundance was highest in unploughed stands compared with 30-
year-old fields, and highest at the site with a moderate grazing intensity. Given time chamaephytes
increase in cover on a field and reduce cryptophyte and hemicryptophyte cover-abundance, and
possibly facilitate the arrival of more specialist-dispersed species (even increase richness) as
observed around many shrubs in the fields. Renosterbos has a facilitative effect on more sensitive or
shade-tolerant species, either dispersed by birds/animals or wind (even water along channels and
drainage lines). Chamaephyte re-entry on to old fields is limited by moisture requirements during
germination. Abundant moisture also traps seed after wind has blown seed of dominant species into
depressions, following drying they are stored in situ and with sufficient moisture availability they
germinate. The presence of chamaephytes along drainage lines on old fields may be related to the
slight depressions in an otherwise homogeneously ploughed landscape trapping wind blown seed.
Further waves of succession of chamaephytes or later arrivals might occur in cohorts coinciding
with above average annual rainfall in the appropriate season, allowing for their tap roots to
penetrate deep prior to summer drought.
There was no significant difference in cover-abundance for lianellas and parasites amongst seres.
Not surprising as these groups are low in richness, and lianellas require a structure to grow on
(perhaps bird-dispersed?) whilst the parasites are low in abundance (as cover not occupancy) on old
fields and are palatable and browsed continuously by the herbivores (Thesium funale). Some
lianella species like Microloma sagittatum (van Breda and Barnard 1991) are palatable and may
avoid direct browsing pressure by their entwined habit amongst spiny or soft shrubs. Lianella cover-
abundance was highest in unploughed renosterveld whilst parasite cover-abundance was highest
with a high grazing intensity (no doubt related to endo-zoochorous dispersal).
McDowell (1988) compared the cover of plant families and species in relation to grazing versus
non-grazing at Jan Briers Louw (hereafter referred to as JBL, formerly Eensaamheid Private Nature
Reserve). JBL consists of both Swartland Alluvium Fynbos and Swartland Shale Renosterveld
141
vegetation types. Heavy grazing increased the asteraceous and iridaceous components, whilst
causing a decline in the poaceous and rutaceous components (even decimating the proteoid species),
but no significant difference occurred in total plant cover and diversity. McDowell (1988) stated
that well-managed pasturage was a “minor threat to the extinction of floristic elements” and certain
species would benefit from grazing-however a turnover of species occurred. These grazing effects
were not studied in renosterveld only, and the mention of proteoid elements depicts that. Stander
(1988) compared the cover of functional groups between grazed and ungrazed renosterveld at JBL,
and showed that with grazing there was a higher cover of reseeder shrubs as well as more species of
shrubs and geophytes than without grazing. This scenario is more likely to occur with overgrazing
promoting woody colonization-perhaps a useful strategy towards restoring the woody stratum to
grassy old fields by reducing the competitiveness of grasses? A study in mesic coastal Californian
prairies focused on the impact of cattle grazing on native annual forbs and found that species
richness and cover (also exotic annual grass and forb cover) were higher on grazed sites (Hayes and
Holl 2003). Indigenous grass species richness and cover showed no difference between paired
grazed and ungrazed sites, unlike indigenous perennial forb richness and cover, which was higher at
ungrazed sites. This suggests an adaptive and flexible management approach is necessary to ensure
all species are equally conserved - especially palatable species.
The response curves of selected groups indicated changes in abundances with the sequence of
succession. For the phytocoena there was a clear distinction in abundance between the renosterveld
shrubland and the grassy old fields. The response curves of selected hemicryptophytes showed the
overwhelming abundance of Cynodon dactylon at early seres compared with the more speciose later
seres. Revealing the composition of species occurring at a given sere in secondary succession, as
well as the obvious dominant and early colonizers allows for indicators of accurate restorative and
rehabilitative work. Species not found to occur after ploughing would have to be manually added.
4.4.3. Renosterveld Dynamics and Resilience
Generally the mode of succession here would be facilitation (sensu Connell and Slatyer 1977) by
dominant and sub-dominant shrubs, later changing into a mode of tolerance. The use of floristic
data is more deterministic than using groups of dominant types (Lepš 1987) when describing
succession. The described phytocoena (see Chapter Three) were ordinated using CCA which
showed a unidirectional sequence along axis 1, i.e. the succession was effectively recovered, and
30-year-old fields resembled unploughed renosterveld.
142
Different directions and outcomes of secondary succession are related to disturbance type and
history, as well as the life history traits of the final crop prior to abandonment (see Myster and
Pickett 1994). Succession on old fields here has been uninterrupted by ploughing for 30 years or
more. These 30-year-old fields have differing disturbance histories: some were ploughed often and
extensively utilized for agriculture; whilst others were briefly ploughed then abandoned when
deemed unsuitable due to rockiness and/or high water-level of substrate. Most 30-year-old fields
here are either surrounded by, or are proximate to unploughed renosterveld. In addition, species
may have been dispersed more frequently here since the introduction of large mammalian
herbivores (1974 for Elandsberg and 1982 for Krantzkop). Herbivores (both large and small) create
micro-sites suitable for the establishment of propagules (Bakker and Olff 2003, Gutterman 2001).
Fires no doubt influence the heterogeneity of the vegetation causing small and large scale patterning
effects.
Perhaps lacking in models of succession is the assumption of a retention of propagules following
ploughing especially in cryptophytes adapted to annual subterranean movement (Cyanella
hyacinthoides) and the downward percolation of small versus large seed into the seed bank
(Luzuriaga et al. 2005). Thus a propagule source would remain after ploughing of a mixture of
species. Ploughing definitely irreversibly altered the seed bank richness. Thus the synanthropic
community is a state (Westoby et al. 1989) unlike that of unploughed renosterveld, as a
consequence of seed bank depletion, a mere “subset” of its former composition. Species which
remained are those that endured ploughing. Arrivals on old fields are dispersed by various vectors
(abiotic and biotic). However at small spatial scales habitat characteristics determine the community
composition, like: drainage (either wetland, seasonally inundated, open plain or rocky area);
chemistry (nutrient status) and the fire regime. Marginal habitats never ploughed may contain
naturally rare and localized species which contribute to the adjacent old field succession if the
habitat is suitable.
Some areas of both natural vegetation and old fields are either strongly dominated by renosterbos or
klaaslouwbos (Athanasia trifurcata). This patchy domination may be the result of the timing of fire
in relation to flowering. Their flowering times are six months apart in general (renosterbos in
May/June and klaaslouwbos in December/January) and seed production followed by fire at a certain
time may determine which of these two potentially dominant species will produce the most recruits.
The growth phases occur at the same time from late summer to autumn. An alternative hypothesis
(from the knowledge of farmers) is that klaaslouwbos prefers lime deficient soils, thus this pattern
143
may indicate a response to the nutrient status of the soils. So as seed is annually produced fire
timing may produce different dominant patches over the landscape in combination with soil
preferences. In this “nutrient-non-limited” environment seed production is copious in many
dominant species which therefore rely on fresh seed for recruits. Klaaslouwbos also tends to retain
its seed in capitula (“serotinous-mimicry”) for a short while perhaps until rain knocks them off - as
is the case with succulent plants.
Variation in grassiness in renosterveld is comparable to fynbos in succession. Fynbos is
characteristically dominated by many shrub species, giving it a colourful and varied textural
appearance, which easily affords an idea of richness (or diversity) to the observer. A monotypically
dominated shrubland like renosterveld with a uniform textural appearance does not appear as
speciose to the untrained observer-which it is. Hence it is often not perceived as a vegetation type
with a unique identity, similar in richness to fynbos but different in its coarse textural appearance.
To wade “betwixt” the shrubbery is to acquaint oneself with its inherent richness. Disturbance by
fire destroys above-ground vegetation structure and shrub-dominated “climax” state causing a
relapse or rejuvenation into an initially graminoid-dominated state. The graminoid-dominated state
is similar to the immediate post-fire succession in fynbos where therophytes, cryptophytes and
hemicryptophytes take advantage of extra light and flower profusely. Cryptophyte richness is not
diminished as post-fire succession advances (B. A. Walton, personal observation) similar to
lowland fynbos (Hoffman et al. 1987), only flowering of certain species may decline like Satyrium
erectum, (or increase for shade-tolerant species, like Pterygodium catholicum or Sparaxis villosa).
Evidence obtained here suggests that renosterveld vegetation is resilient (see Lavorel 1999) and
able to “bounce back” into a structurally diverse state. This occurs after sufficient “resting” time by
being set aside following an initial or recurring destruction by ploughing. It is a very different
outcome from that following fire (or brush-cutting) as typically resprouting perennial geophytes,
graminoids and shrubs have been destroyed, which usually form the vegetative bulk of post-fire
regeneration. The initial colonizers following ploughing are often ruderal species if adjacent to
agricultural fields, and wind dispersed species, indigenous or alien, able to grow on barren land.
Large fields take longer to be colonized and covered by plant species than small fields. Old fields
adjacent to indigenous vegetation could become colonized in time as opposed to old fields distant or
isolated from propagule sources. Some 30-year-old fields in this study were completely surrounded
by unploughed vegetation, ensuring colonization which culminated in a state of dense shrubland
vegetation. A different scenario would exist if old fields are isolated or inherently different habitats
144
(adjacent to wetlands) as was found in other grassy 30-year-old fields-which have did not advance
into a structurally diverse state. Renosterveld is resilient up to certain thresholds limited by
propagule source material (and distance from source) and also grazing following ploughing.
There is a lack of shrub cover on some old fields at Elandsberg below Slangkop ridge, previously
ploughed and assumed to be renosterveld in the past. Careful inspection of the surrounding
vegetation and their ecology, aerial photographs and species present, has led me to infer that
perhaps Alluvium Shale Fynbos was more prevalent at the site. Also vegetation of Slangkop ridge
(another habitat) adds to local propagule sources. On the whole that site is seasonally inundated and
contains many geophytic species which thrive in these conditions. Those fields which were part of
alluvial rivulets and river terraces were unsuitable for agriculture and thus less of a liability as an
addition to the reserve and thus set-aside. Surrounding these rivulets and wetlands are tall grasses
and the shrub stratum tends to step back to some agreeable zone of moisture. Thus a closed canopy
of shrubs in a wetland site is not likely to occur and is a possible explanation of the “slow” recovery
on some old fields. In addition old fields occupied by territorial Bontebok or Eland are continuously
grazed short and thus remain as old fields. This is evident at De Hoop Nature Reserve along a
fence-line contrast of a short “lawn” versus the roadside verge with taller “lawn” grasses.
Life-forms under threat from ploughing, like nano-chamaephytes (succulents especially) and some
cryptophytes, require manual reintroduction to areas for rehabilitation. Certain species thrive in
disturbed conditions whilst others do not. Perennial grasses return to old fields generally, but might
require a specific habitat subsequently transformed by ploughing. Rare or common species can
equally be negatively affected by ploughing. Large or “bulky” geophytes like Brunsvigia
elandsmontana and Crossyne guttata are rarely encountered on old fields. They have an effective
wind dispersal mechanism able to be transported over long distances to rest in depressions or
barriers (shrubs/fences). However they may require amenable habitat and moisture conditions in
which to germinate and persist. Some species, by default, are marginal or have low population
densities thus chance (a lottery effect, see Dewi and Chesson 2003) would play a major role in the
composition of old fields whereby local species would be represented before distant (and suitable)
species.
In terms of continuous grazing pressure one would assume only weedy geophytes, toxic or
spinescent woody species are able to persist in mature vegetation and on old fields, as is the case in
degraded renosterveld on slopes in the South Coast Renosterveld (B.A. Walton, personal
observation). However simplicity is hardly a solution for a speciose and complex ecosystem. The
145
spinescent Aspalathus spinosa is palatable and browsed intermittently and palatable shrubs such as
Hermannia scabra and Thesium funale frequently occur on old fields (dispersed endo-zoochorously
or by birds in the latter example).
4.4.4. Alien Species
Most alien species occurred on recently ploughed fields, following a pattern of a decrease in
richness with an increase in resting period (see Meiners et al. 2002) - or a closing of “invasion
windows” (see Myster and Pickett 1994) with a decrease in the rate of succession. However grazing
intensity did not influence patterns of alien species richness. Vlok (1988) studied the alpha diversity
of 1 m2 relevés in lowland fynbos and renosterveld showing that with an increase in alien annual
cover there was a corresponding decrease in indigenous annual and geophytic species richness.
Similarly the indigenous annual cover and geophyte density declined. This may have an effect on
old fields where alien annual cover is high, allowing only for tall geophytes to persist in 80%
infested sites. Vlok (1988) mentioned that few annuals such as Arctotheca calendula and
Dimorphotheca pluvialis persist under dense infestation, as observed here on 5-year-old fields, and
rare and localized species may decline. Most alien species are therophytes here (75%) specifically
annual forbs and grasses, and these colonizing species tolerate or prefer recently disturbed sites.
Similarly in Australian rangelands the annual forb and grasses contribute between 67% and 77% of
the alien flora (Grice 2004). This is a challenge for natural ecosystem management as alien species
are continuously and inadvertently sown onto pastures (or purposely like Lolium perenne) or
remnants of previous plantings or dispersed in livestock feed. Alien species are thus invading and
re-invading old fields and unploughed renosterveld by endo-zoochorous dispersal (see Shiponeni
2003, Balsamo et al. 2004), or ecto-zoochorously.
The Ursinio anthemoidis–Cynodontetum dactyli Grassland Community is characterized by a high
dominance of alien annual and ruderal species (see Chapter Three) which thrive on these recently
disturbed sites. Their “naturalization” in the ecosystem should be tested for the possibility of
displacing cryptophytes and indigenous annuals. I think competition would arise between alien
forbs with a rosette growth form (like Hypochaeris radicata), and indigenous annuals and some
geophytes; whereas erect annual grasses do not tend to smother other plants. I would not suggest
spraying of poison to reduce their cover-abundance but rather allow for the shrub layer to reduce or
displace them. In addition restriction of herbivore movement in certain camps may alleviate the
spread of many of these alien taxa. However in some instances herbivory, especially shortly after
146
flowering, may reduce seed production of Echium plantagineum (Patterson’s curse) (Smyth et al.
1997). Alien annual grasses however may change the natural fire regime by increasing the fire
frequency. Their dry biomass at the end of summer is particularly susceptible to being burnt in
some instances. If burning occurs frequently this would remove the shrub component, as is the case
with fire-breaks which resemble “grasslands” amongst fynbos.
A high grazing intensity following ploughing appeared to influence and increase alien species
richness, relative to unploughed renosterveld at the same grazing intensity. In reality those old fields
at the site with high grazing intensities are close to a source of alien phanerophytes (choking the
nearby river) whilst the other sites are closer to agricultural fields (which are by practice constantly
cleared of alien phanerophytes both manually and with poisons) or are completely surrounded by
unploughed renosterveld.
Disturbances, including ploughing and grazing, have been shown to promote invasions of alien
plant species in fynbos, succulent Karoo (Milton 2004) and Valley grasslands/chaparral (Keeley
1990, 1993, D’Antonio and Vitousek 1992). In other vegetation types herbivory has promoted alien
herbaceous plants (see Hobbs and Huenneke 1992), as has prairie dog foraging (Larson 2003).
Alien plants could also influence the direction (vector) of succession by altering the equilibrium
state by type-conversion. This in turn could influence vegetation (forage) quality and animal
behaviour whereby palatable mediterranean alien species such as: Avena barbata, Briza maxima,
Briza minor, Bromus pectinatus, Medicago sativa and Lolium perenne, are grazed then dispersed on
to old fields and in natural vegetation. Type conversion of perennial grasslands in western United
States has occurred by alien annual forbs or grasses which now resemble old fields (see LeJeune
and Seastedt 2001, Brown and Rice 2000). Also invasive bunchgrasses have led to a decrease in
diversity of prairie or shrublands (see Heidinga and Wilson 2002, Lambrinos 2000).
Vegetation could be restored for, and facilitated by, indigenous small and large herbivore breeding
programmes. In addition ecosystem restoration would improve biodiversity conservation and
benefit land users by reducing erosion, increase soil moisture infiltration and retention, and increase
floral and faunal ecotourism. Rural landscapes and old fields could be rehabilitated by an improved
stock farming model further providing fodder and shelter for sheep, as is the desire of some land
users. These varied management aims require diverse states of vegetation composition or minimum
habitat quality conditions to achieve the desired goals. Biodiversity conservation requires that an
ecosystem resembles and includes the high richness and diversity of indigenous plant taxa occurring
147
at untransformed sites, thus retaining sufficient complexity and functionality, and ensuring the
maintenance of evolutionary processes
In summary I conclude that, from evidence discovered in this study, ploughing destroys natural
vegetation. Succession on old fields is retarded by grazing (even after old fields have been initially
set-aside without grazers). The highly palatable or preferred species to selective grazers are initially
consumed and virtually displaced. Species which remain are either largely unpalatable (or toxic)
otherwise spinescent. Subsequently these species are also grazed for roughage (for example
renosterbos). Thus the lawn grass sustains the large herbivore component, and even Eland graze it
(B.A. Walton, personal observation). Old field are species depauperate nevertheless they fulfil an
important function and platform for herbivore conservation. Some old fields do contain important or
even rare species, as relicts from the untransformed vegetation and usually are particular to specific
sites or micro-habitats. Structurally all old fields are similar but their component species differ and
thus must be considered as an important part of area-wide or landscape conservation planning. I
would add that to enable effective landscape restoration in an agricultural sea with scattered
bejewelled islands (“life-boats”) these old fields form the major contribution toward greenbelts
connecting valuable fragments. Singularly small renosterveld fragments cannot sustain herbivores
without compromising plant resilience, whereas old fields can.
148
4.5. References
Barkman JJ, Doing H, Segal S (1964) Kritische Bemerkungen und Vorschläge zur quantitativen
Vegetationsanalyse. Acta Botanica Neerlandica 13: 394-419
Barkman JJ (1988) New systems of plant growth forms and phenological plant types. In: Werger
MJA, van der Aart PJM, During HJ, Verhoeven JTA (eds) Plant form and vegetation structure.
SPB Academic Publishing bv., The Hague, pp 9-44. ISBN 90-5103-015-0
Bakker ES, Olff H (2003) Impact of different-sized herbivores on recruitment opportunities for
subordinate herbs in grasslands. Journal of Vegetation Science 14: 465-474
Balsamo RA, Hofmeyr MD, Henen BT, Bauer AM (2004) Leaf biomechanics as a potential tool to
predict feeding preferences of the geometric tortoise Psammobates geometricus. African
Zoology 39: 175-181
Bothma J du P (2002) Game Ranch Management (4th edn). Van Schaik Publishers, Pretoria. ISBN
0-627-02471-8
Boucher C (1981) Floristic and structural features of the coastal foreland vegetation south of the
Berg River, Western Cape Province, South Africa. In: Moll EJ (ed) Proceedings of a symposium
on coastal Lowlands of the Western Cape. University of the Western Cape, Cape Town, pp 21-
26
Boucher C (1987) A phytosociological study of transects through the Western Cape Coastal
Foreland, South Africa. PhD Thesis, University of Stellenbosch
Bragg CJ, Donaldson JD, Ryan PG (2005) Density of Cape porcupines in a semi-arid environment
and their impact on soil turnover and related ecosystem processes. Journal of Arid Environments
61: 261-275
Brown CS, Rice KJ (2000) The Mark of Zorro: Effects of the exotic annual grass Vulpia myuros on
California native perennial grasses. Restoration Ecology 8: 10-17
Burchell WJ (Esq.) (1967) Travels in the Interior of Southern Africa Volume 1. C. Struik (Pty) Ltd.,
Cape Town, reprinted limited edition
Campbell BM (1986) Plant spinescence and herbivory in a nutrient-poor ecosystem. Oikos 47: 168-
172
Clements FE (1928) Plant succession and indicators: A definitive edition of plant succession and
plant indicators. The HW Wilson Company, New York
Connell JH, Slatyer RO (1977) Mechanisms of succession in natural communities and their role in
community stability and organization. American Naturalist 111: 1119-1144
149
Connell JH (1978) Diversity in Tropical Rain Forests and Coral Reefs. Science Vol. 199: 1302-
1309
D’Antonio CM, Vitousek PM (1992) Biological invasions by exotic grasses, the grass/fire cycle,
and global change. Annual Review of Ecology and Systematics 23: 63-87
DeSimone SA, Zedler PH (1999) Shrub seedling recruitment in unburned Californian coastal sage
scrub and adjacent grassland. Ecology 80: 2018-2032
Dewi S, Chesson P (2003) The age-structured lottery model. Theoretical Population Biology 64:
331-343
Foster BL, Tilman D (2000) Dynamic and static views of succession: Testing the descriptive power
of the chronosequence approach. Plant Ecology 146: 1-10
Fuentes ER, Hoffmann AJ, Poiani A, Alliende MC (1986) Vegetation change in large clearings:
patterns in the Chilean Matorral. Oecologia 68: 358-366
Goldblatt P, Manning JC (1998) Gladiolus in Southern Africa. Fernwood Press, Vlaeberg. ISBN 1-
874950-32-6
Goldblatt P, Manning JC (2000) Cape Plants: A conspectus of the Cape Flora of South Africa.
Strelitzia 9. National Botanic Institute, Kirstenbosch. ISBN 0-620-26236-2
Gotelli NJ, Ellison AM (2004) A primer of ecological statistics. Sinauer Associates, Inc.,
Sunderland, Massachusetts. ISBN 0-878-93269-0
Grice AC (2004) Weeds and the monitoring of biodiversity in Australian rangelands. Austral
Ecology 29: 51-58
Grime JP (1985) Towards a functional description of vegetation. In: White J (ed) The Population
Structure of Vegetation. Dr. W. Junk Publishers, Dordrecht, pp 503-514. ISBN 90-6193-184-3
Grime JP (2001) Plant strategies, vegetation processes, and ecosystem properties. (2nd edn). John
Wiley & Sons, Chichester. ISBN 0-471-49601-4
Guglielmini AC, Satorre EH (2004) The effect of non-inversion tillage and light availability on
dispersal and spatial growth of Cynodon dactylon. Weed Research 44: 366-374
Gutterman Y (2001) Regeneration of Plants in Arid Ecosystems Resulting from Patch Dynamics.
Geobotany 27. Kluwer, Dordrecht, pp 1- 243. ISBN 0-7923-6725-1
Hayes GF, Holl KD (2003) Cattle grazing impacts on annual forbs and vegetation composition of
mesic Grasslands in California. Conservation Biology 17: 1694-1702
Hennekens SM, Schaminée JHJ (2001) TURBOVEG, a comprehensive data base management
system for vegetation data. Journal of Vegetation Science 12: 589-591
Hensen I, Müller C (1997) Experimental and structural investigations of anemochorous dispersal.
Plant Ecology 133: 169-180
150
Hobbs RJ, Huenneke LF (1992) Disturbance, diversity and invasion: implications for conservation.
Conservation Biology 6: 324-337
Hoffman MT, Moll EJ, Boucher C (1987) Post-fire succession at Pella, a South African lowland
fynbos site. South African Journal of Botany 53: 370-374
Holmgren M, Avilés R, Sierralta L, Segura M, Fuentes R (2000) Why have European herbs so
successfully invaded the Chilean matorral? Effects of herbivory, soil nutrients, and fire. Journal
of Arid Environments 44: 197-211
Keeley JE, Keeley SC (1984) Postfire recovery of California Coastal Sage Scrub. American
Midland Naturalist 111: 105-117
Keeley JE (1990) The California Valley Grassland. In: Schoenherr AA (ed) Endangered plant
communities of southern California. Southern California Botanists, Fullerton, Special
Publication No. 3
Keeley JE (1993) Native Grassland Restoration in California: Assessing suitable sites. Restoration
and management notes 11: 2, Winter No. 127: 149-150
Kellerman TS, Coetzer JAW, Naude TW (1998) Plant poisonings and mycotoxicoses of livestock in
Southern Africa. Oxford University Press, Cape Town. ISBN 0195704886
Kemper J (1997) The effects of fragmentation of South Coast Renosterveld on vegetation patterns
and processes. MSc Thesis, University of Cape Town, Rondebosch
Krug CB, Krug RM, Midoko-Iponga D, Walton BA, Milton SJ, Shiponeni NN (2004) Restoration
of West Coast Renosterveld: facilitating the return of a highly threatened vegetation type. In:
Arianoutsou M, Papanastasis VP (eds) Proceedings 10th MEDECOS Conference, Rhodes,
Greece. Millpress, Rotterdam, pp 1-12. ISBN 90-5966-016-1
Lambrinos JG (2000) The impact of the invasive alien grass Cortaderia jubata (Lemoine) Stapf on
an endangered mediterranean-type shrubland in California. Diversity and Distributions 6:217-
231
Larson DL (2003) Native weeds and exotic plants: relationships to disturbance in mixed-grass
prairie. Plant Ecology 169: 317-333
Lavorel S (1999) Ecological diversity and resilience of Mediterranean vegetation to disturbance.
Diversity and Distributions 5: 3-13
Lepš J (1987) Vegetation dynamics in early old field succession: a quantitative approach. Vegetatio
72: 95-102
Lepš J, Šmilauer P (2003) Multivariate analysis of ecological data using CANOCO. Cambridge
University Press, Cambridge. ISBN 0-521-89108
Linder HP (1989) Grasses in the Cape Floristic Region: Phytogeographical implications. South
African Journal of Science 85: 502-505

151
Lovegrove BG, Jarvis JUM (1986) Coevolution between mole-rats (Bathyergidae) and a geophyte,
Micranthus (Iridaceae). Cimbebasia A 8: 80-85
Luzuriaga AL, Escudero A, Olano JM, Loidi J (2005) Regenerative role of seed banks following an
intense soil disturbance. Acta Oecologica 27: 57-66
Manning J, Goldblatt P, Snijman D (2002) The color encyclopedia of Cape Bulbs. Timber Press,
Portland. ISBN 0-88192-547-0
McDowell CR (1988) Factors Affecting the Conservation of Renosterveld by Private Landowners.
PhD Thesis, University of Cape Town, Rondebosch
Meiners SJ, Pickett STA, Cadenasso ML (2002) Exotic plant invasions over 40 years of old field
successions: community patterns and associations. Ecography 25: 215-223
Michell MR (1922) Some observations on the effects of a bush fire on the vegetation of Signal Hill.
Transactions of the Royal Society of South Africa 10:213-232
Milton SJ, Dean WRJ (2001) Seeds dispersed in dung of insectivores and herbivores in semi-arid
southern Africa. Journal of Arid Environments 47: 1-18
Milton SJ (2004) Grasses as invasive alien plants in South Africa. South African Journal of Science
100: 69-75
Mueller-Dombois D, Ellenberg H (1974) Aims and Methods of Vegetation Ecology. John Wiley &
Sons, New York. ISBN 0-471-62290-7
Mucina L, Rutherford MC (eds) (2004) Vegetation Map of South Africa, Lesotho and Swaziland:
Shapefiles of basic mapping units. Beta Version 4.0, February 2004, National Botanical Institute,
Rondebosch
Myster RW, Pickett STA (1994) A comparison of the rate of succession over 18 yr in 10 contrasting
old fields. Ecology 75: 387-392
Pauw A (2004) Variation in pollination across a fragmented landscape at the Cape of Africa. PhD
Thesis, University of Cape Town, Rondebosch
Petsikos C, Dalias P, Troumbis A (2004) Effects of Oxalis pes-caprae L. invasion on diversity and
carbon cycle in the grassland understorey of a Mediterranean olive grove. In: Arianoutsou M,
Papanastasis VP (eds) Proceedings 10th MEDECOS Conference, Rhodes, Greece. Millpress,
Rotterdam. ISBN 90-5966-016-1
Pickett STA, Collins SL, Armesto JJ (1987) A hierarchical consideration of causes and mechanisms
of succession. Vegetatio 69: 109-114
Procheş Ş, Cowling RM (2004) Cape geophytes: putting the pieces together. In: Arianoutsou M,
Papanastasis VP (eds) Proceedings 10th MEDECOS Conference, Rhodes, Greece. Millpress,
Rotterdam. ISBN 90-5966-016-1
152
Raunkiaer C (1934) The life forms of plants and statistical plant geography being the collected
papers of C Raunkiaer. Oxford University Press, Oxford
Ruiz N, Ward D, Saltz D (2002) Calcium oxalate crystals in leaves of Pancratium sickenbergeri:
constitutive or induced defence? Functional Ecology 16: 99-105
Scott JD, van Breda NG (1937) Preliminary studies on the root system of the rhenosterbos
(Elytropappus rhinocerotis) on the Worcester Veld Reserve. South African Journal of Science
33: 560-569
Shiponeni NN (2003) Dispersal of seeds as a constraint in revegetation of old fields in Renosterveld
vegetation in the Western Cape, South Africa. MSc Thesis, Stellenbosch University
Simon JL, Bruce P (1991) Resampling: A tool for everyday statistical work. Chance 4 (1): 22-32
Smyth MJ, Sheppard AW, Swirepik A (1997) The effect of grazing on seed production in Echium
plantagineum. Weed Research 37:63-70
Stander M (1988) A comparative study of Coastal Renosterveld communities subjected to grazing
by wild game. Botany project, University of Cape Town, Rondebosch
StatSoft, Inc. (2004). STATISTICA (data analysis software system), version 7. www.statsoft.com.
ter Braak CJF, Šmilauer P (2002) CANOCO Reference manual and CanoDraw for Windows User’s
guide: Software for Canonical Community Ordination (version 4.5). Microcomputer Power
(Ithaca, NY, USA)
van Breda PAB, Barnard SA (1991) Veld plants of the winter rainfall region: A guide to the use of
veld plants for grazing. Department of Agricultural Development, Bulletin No. 422. The
Government Printer, Pretoria. ISBN 0-621-13470-8
van der Maarel E (1979) Transformation of cover-abundance values in phytosociology and its
effects on community similarity. Vegetatio 39: 97-114
Van Rooyen MW (2002) Management of the old field vegetation in the Namaqua National Park,
South Africa: conflicting demands of conservation and tourism. The Geographical Journal 168:
211-223
Vera FWM (2000) Grazing ecology and forest history. CABI Publishing, Guildford, UK. ISBN 0
85199 442 3
Vlok JHJ (1988) Alpha diversity of lowland Fynbos herbs at various levels of infestation by alien
annuals. South African Journal of Botany 54: 623-627
Walker LR, Willig MR (1999) An introduction to terrestrial disturbances. In: Walker LR (ed)
Ecosystems of the World 16: Ecosystems of disturbed ground. Elsevier, Amsterdam, pp 1-16.
ISBN 0-444-82420-0
Walker J, Thompson CH, Olley J, Reddell P (2000) Retrogressive succession in old landscapes.
Proceedings IAVS Symposium. Opulus Press, Uppsala, pp 21-23
153
Ward D, Saltz D (1994) Foraging at different spatial scales: Dorcas gazelles foraging for lilies in
the Negev Desert. Ecology 75: 48-58
Westoby M, Walker B, Noy-Meir I (1989) Opportunistic management for rangelands not at
equilibrium. Journal of Range Management 42: 266-274
White PS, Pickett STA (1985) Natural disturbance and patch dynamics: an introduction. In: Pickett
STA, White PS (eds) The ecology of natural disturbance and patch dynamics. Academic Press,
New York
Zaller JG (2004) Ecology and non-chemical control of Rumex crispus and R. obtusifolius
(Polygonaceae): a review. Weed Research 44: 414-432
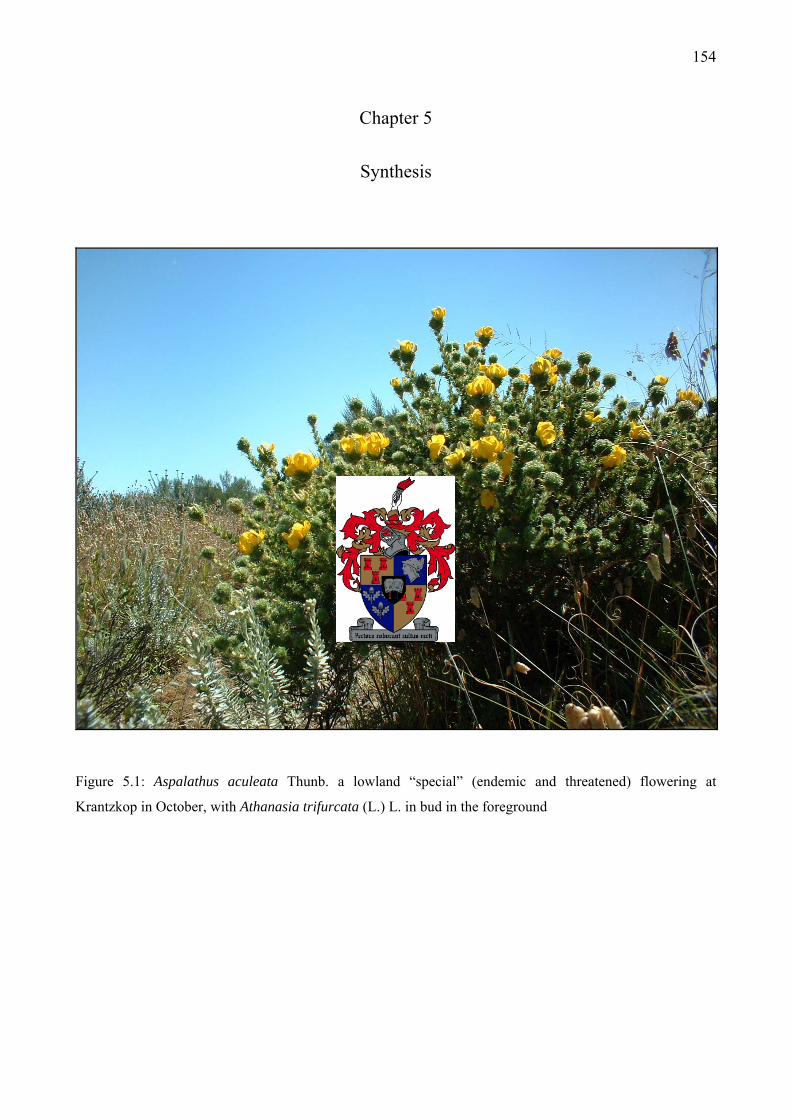
154
Chapter 5
Synthesis
Figure 5.1: Aspalathus aculeata Thunb. a lowland “special” (endemic and threatened) flowering at
Krantzkop in October, with Athanasia trifurcata (L.) L. in bud in the foreground
155
5.1. Synthesis
Renosterveld, unlike fynbos often forms a monotypic stand of Elytropappus rhinocerotis
(renosterbos) and sometimes it’s open with a variety of shrub species (see Figure 5.1). It is this
seemingly homogeneous matrix that conceals its true nature when observed during the summer
months (although graminoids are flowering). However during the winter months the ground layer is
rich in species and almost totally covered - this is where life-form richness or structural diversity
occurs - whereas fynbos visually has a diverse structural composition in the top layer.
Since no model exists for succession of species on post-ploughed fields that were previously
renosterveld, I have composed a conceptual model (Figure 5.2). Life-form composition in
renosterveld was studied in four different states (seres) as described in Chapter Four, namely: 5-
year-old fields; 15-year-old fields; 30-year-old fields and unploughed renosterveld (controls).
Evidence of four states was obtained, however they were not available at all sites. Thus the first two
seres lack empirical evidence of their structural composition at both a low and high grazing
intensity. A range of factors ultimately determine the outcome of succession towards one or another
stable or unstable state (see George et al. 1992). Notably exogenous factors can have more
influence over determining state characteristics than endogenous factors like grazing (see Jackson
and Bartolome (2002). However old fields are an unnatural phenomenon thus population dynamics
come to the fore on recovering landscapes as found by Midoko-Iponga (2004) where Cynodon
dactylon competition negatively affected both Athanasia trifurcata and Relhania fruticosa juvenile
plants. When renosterveld vegetation is ploughed there is a crash in total species and life-form
richness, which advances through different seral states to almost resemble that of unploughed
vegetation. Conversely following ploughing there is an initial increase in alien species, and with
seral development a reduction in alien species occurs. On 30-year-old fields the presence of grazers
reduces the total amount of vegetation cover-abundance from 70% to 60% (without grazers).
In comparison to previous conceptual models of renosterveld vegetation dynamics my model does
not attempt to explain vegetation patterns in relation to disturbance by fire (which is not the object
of this study). Cowling et al. (1986) tentatively suggest that the season of burning coupled with
grazing determines whether the renosterveld vegetation state is very grassy or not (Figure 5.3). This
model suggests that non-grassy renosterveld when burnt in autumn (and grazed) turns into grassy
renosterveld which in turn reverts to non-grassy renosterveld when burnt in spring (and grazed).
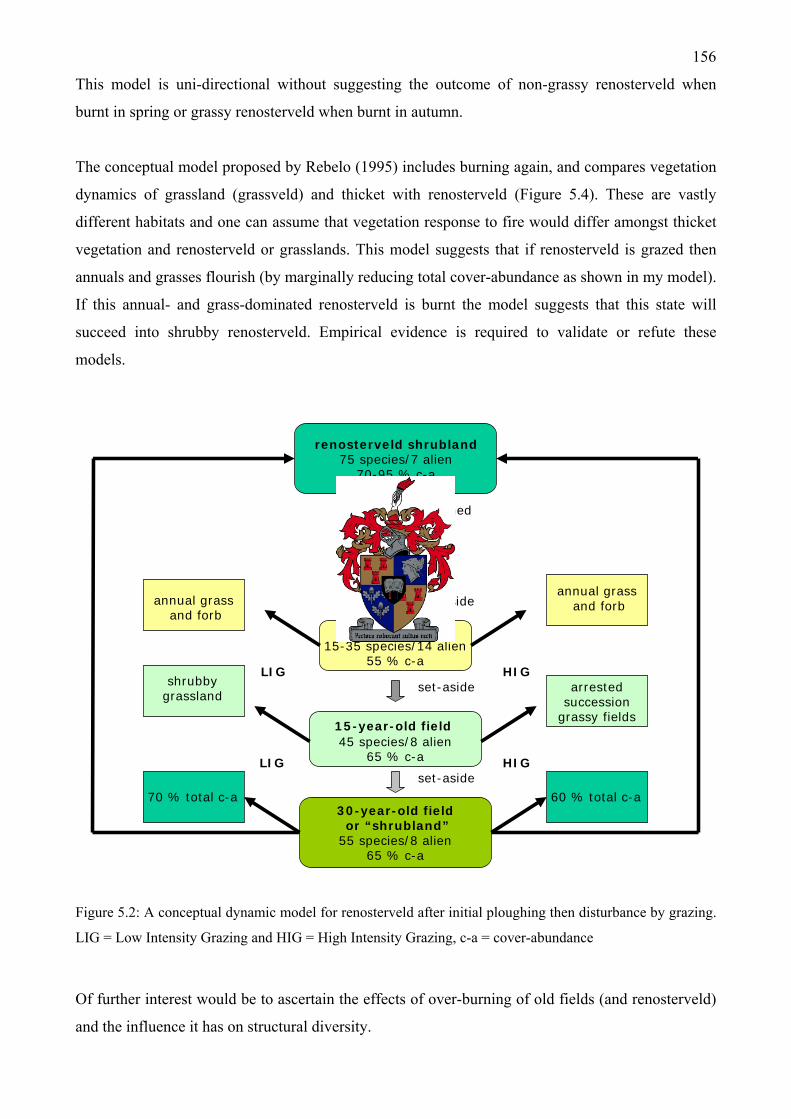
156
This model is uni-directional without suggesting the outcome of non-grassy renosterveld when
burnt in spring or grassy renosterveld when burnt in autumn.
The conceptual model proposed by Rebelo (1995) includes burning again, and compares vegetation
dynamics of grassland (grassveld) and thicket with renosterveld (Figure 5.4). These are vastly
different habitats and one can assume that vegetation response to fire would differ amongst thicket
vegetation and renosterveld or grasslands. This model suggests that if renosterveld is grazed then
annuals and grasses flourish (by marginally reducing total cover-abundance as shown in my model).
If this annual- and grass-dominated renosterveld is burnt the model suggests that this state will
succeed into shrubby renosterveld. Empirical evidence is required to validate or refute these
models.
bare
5-year-old field15-35 species/14 alien
55 % c-a
15-year-old field45 species/8 alien
65 % c-a
renosterveld shrubland75 species/7 alien
70-95 % c-a
30-year-old fieldor “shrubland”
55 species/8 alien65 % c-a
ploughed
set-aside
set-aside
set-aside
HIG
HIG
LIG
LIG
annual grassand forb
60 % total c-a70 % total c-a
arrested succession
grassy fields
shrubbygrassland
annual grassand forb
Figure 5.2: A conceptual dynamic model for renosterveld after initial ploughing then disturbance by grazing.
LIG = Low Intensity Grazing and HIG = High Intensity Grazing, c-a = cover-abundance
Of further interest would be to ascertain the effects of over-burning of old fields (and renosterveld)
and the influence it has on structural diversity.
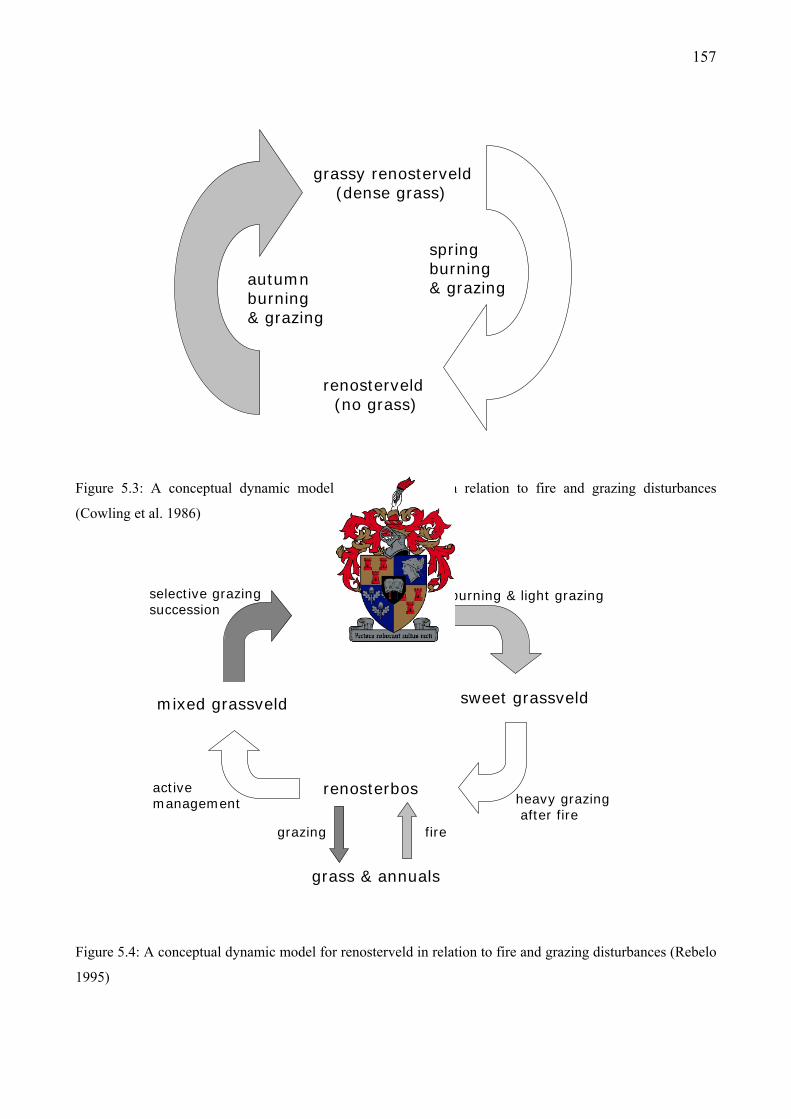
157
grassy renosterveld(dense grass)
renosterveld(no grass)
autumn burning & grazing
spring burning & grazing
Figure 5.3: A conceptual dynamic model for renosterveld in relation to fire and grazing disturbances
(Cowling et al. 1986)
thicket
renosterbos
mixed grassveld sweet grassveld
grass & annuals
grazing fire
heavy grazingafter fire
active management
selective grazing succession
burning & light grazing
Figure 5.4: A conceptual dynamic model for renosterveld in relation to fire and grazing disturbances (Rebelo
1995)
158
5.2. Management Recommendations
A valuable knowledge of renosterveld vegetation structure and composition in the natural state is
essential to management purposes. Identifying secondary states resulting from anthropogenic
transformations and natural disturbances is the crux of the matter in ecosystem restoration or
rehabilitation. Indicators of ecosystem health as a benchmark in formulating restorative activities
are useful in applying the most effective approach. The local site conditions would be the major
determinants of a potential advancement of succession towards any preferred or expected climax
state - usually dominated by one or many shrub species.
Firstly it should be clearly defined as to what the preferred outcomes of restoration are, as this will
determine which steps to pursue in reaching those goals. Rehabilitation implies a rectification of a
degraded and eroded ecosystem or habitat towards an improved functioning ecosystem, usually
where the threshold of remediation has surpassed restorative efforts. To subjectively distinguish
between strictly natural ecosystem conservation stewardship and sustainable agricultural motives is
warranted. The former would require that all biotic components are sustained with evolutionary
patterns and processes maintained for evolutionary advancement. The latter would require efficient
soil protection, water consumption, biomass production, carbon (or nitrogen or potassium)
sequestration and sustainable yields. Thus biodiversity conservation allows for interacting processes
to occur with measures to implement remedial tasks such as alien eradication. Farmers would
benefit from natural vegetation on many levels. Natural vegetation has and is used as supplementary
feed by sheep, goats and cattle, although necessitating constant assessment of stand quality. Trade-
offs of maintaining natural stands to farmers are: erosion control, water cycling (and efficient
removal of excessive salts), propagule sources, eco-tourism and are further complemented with
initiation of formal conservation strategies.
Caution should be applied when introducing herbivores onto old fields as this is where a delayed
succession may occur. It is rather noteworthy that the intensity of grazing does not specifically
influence the increase in alien species richness; rather the presence of the indigenous herb layer
determines the extent of invasion. Exotic alien annual pasture grasses and herbs on old fields are an
artefact of agriculture and would seem they have been integrated into the indigenous vegetation
since their arrival. Here large mammalian herbivores play two opposing roles by grazing alien
annuals (thus decreasing competition with indigenous annuals and herbs) and further dispersing
them in their dung. It is suspected that too frequent fires on old fields would actually facilitate the
persistence and spread of exotic alien annual species, conversely decreasing the shrub component
159
and increasing the fire frequency as is the case in Californian annual grasslands (Keeley 1990).
Perhaps a fine balance of fire frequency and grazing would promote the arrival and persistence of
the shrub component. A suggested appropriate ploughing regime to enable recovery of a complete
renosterveld stand - if and when desired - would be a rotation of more than thirty years. This time
period is obviously not convenient for land users wishing to plant annual crops, but has the
advantage of reducing erosion and conserving plant species.
As my results suggest the life-forms most resilient to ploughing are: therophytes and
hemicryptophytes. These are useful for a complete (or perhaps patchy) cover of fields and
landscapes suitable for grazers alone. The chamaephyte life-form group returns to full cover and
richness after some 30 years providing additional benefits for soil conservation and desalinization,
also facilitating other life-forms to exist (lianellas and some delicate cryptophytes). Cryptophytes
pose a different concern, perhaps not many are palatable but it is the most speciose life-form in
renosterveld. Nano-chamaephytes are equally interesting containing many red data listed
succulents, and an undescribed dwarf shrub called Marasmodes sp. nov. (Figure 5.5). These are
often browsed but seem to require long periods of stability to return to old fields. One taxon
Lampranthus scaber is quite unusual; it either sheds its leaves or even branches - as a cryptophytic
trait (Hartmann 2002).
For management purposes a benchmark means to measure veld quality for grazers would be useful.
This would imply using cover-abundance measurements of the grazing forage assemblage, either
using relevés or line-intercept methods. Herein lays the key: the assemblage would have to be
known by experts and the knowledge transferred to land users and managers.
Biogeographical and edaphic patterns of species composition in renosterveld differ from area to
area, necessitating particular local management strategies: for example renosterveld stands in
Hermon are densely dominated by renosterbos and klaaslouwbos; whilst those in Darling are
dominated by Otholobium hirtum (rheebokbos), Eriocephalus africanus (kapokbos) and tall
Aspalathus species. However, despite these site-specific local differences, the object of this project
was to identify vegetation patterns of renosterveld at the Agter-Groeneberg Conservancy.
Management of renosterveld needs to incorporate all disturbance factors including grazing effects,
burning cycles, brush-cutting and ploughing history (with associated recovery period).
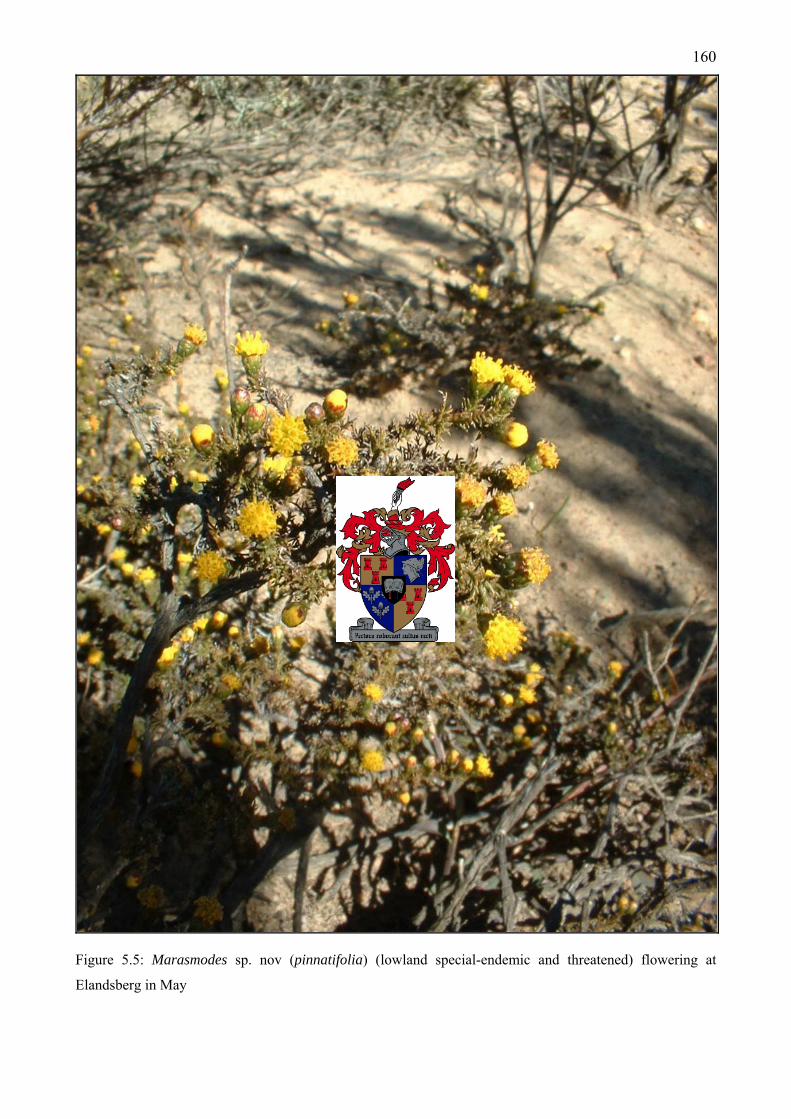
160
Figure 5.5: Marasmodes sp. nov (pinnatifolia) (lowland special-endemic and threatened) flowering at
Elandsberg in May
161
This research into secondary succession on to old fields will aid in management of both pristine and
set-aside land, and indicate patterns of recovery useful for restorative or rehabilitative vegetation
projects.
Suggestions for the AGC:
Determine the actual veld conditions, namely; of grass species and palatable shrub composition and
densities. Determine indicator-type grasses in terms of grazing quality or degraded veld to enable a
rapid assessment of veld deterioration or improvement. Establish permanent plots for vegetation
sampling and monitoring of dominant and rare species. Maintain large grazer/browser exclusion
plots for long-term data capture on the effects of herbivory in renosterveld. Shrub damage (often
uprooted) in mature veld adjacent to old fields is evident at Krantzkop and to some extent at
Elandsberg - perhaps as a result of too much trampling by large herbivores and feral pig rooting.
The opposite is true for Voëlvlei which lacks herbivores and the shrub stratum is very dense in
places (especially the prickly unbrowsed Aspalathus species remaining dense, long after fire). Some
mammalian herbivores like Eland could be introduced to Voëlvlei.
Combine efforts to tackle the feral pig problem of their excessive rooting of both common and rare
geophytes (Wachendorfia paniculata was decimated in a small patch of renosterveld at Elandsberg
Farms (Pty.) Ltd.; B. A. Walton personal observation). This problem occurs in many parts of the
world and expert knowledge of feral pig eradication exists via the Global Invasive Species
Programme. Krantzkop regularly maintains and repairs fencing damaged by feral pigs moving from
site to site.
At Krantzkop strict management is required of all the areas outside the boundaries of the munitions
factory and storage dump. Development of these areas should remain at an absolute minmum.
Sensitive geophyte bed areas e.g. the firebreak flats recently had strips bulldozed (N to S) resulting
in wider roads to upgrade the drainage to the sludge dams. This area is already transformed as it
forms a protective firebreak (> 200 m wide) and thus doesn’t require excessive scouring of the
surface to prevent possible spread of fire.
At Voëlvlei a land conservation management agreement with the boat club and other surrounding
properties should be facilitated. Similarly the AGC must insist on an unplanted verge on the
farmers’ side of the fence to reduce problematic plant invasions, like Avena barbata (wild oats) and
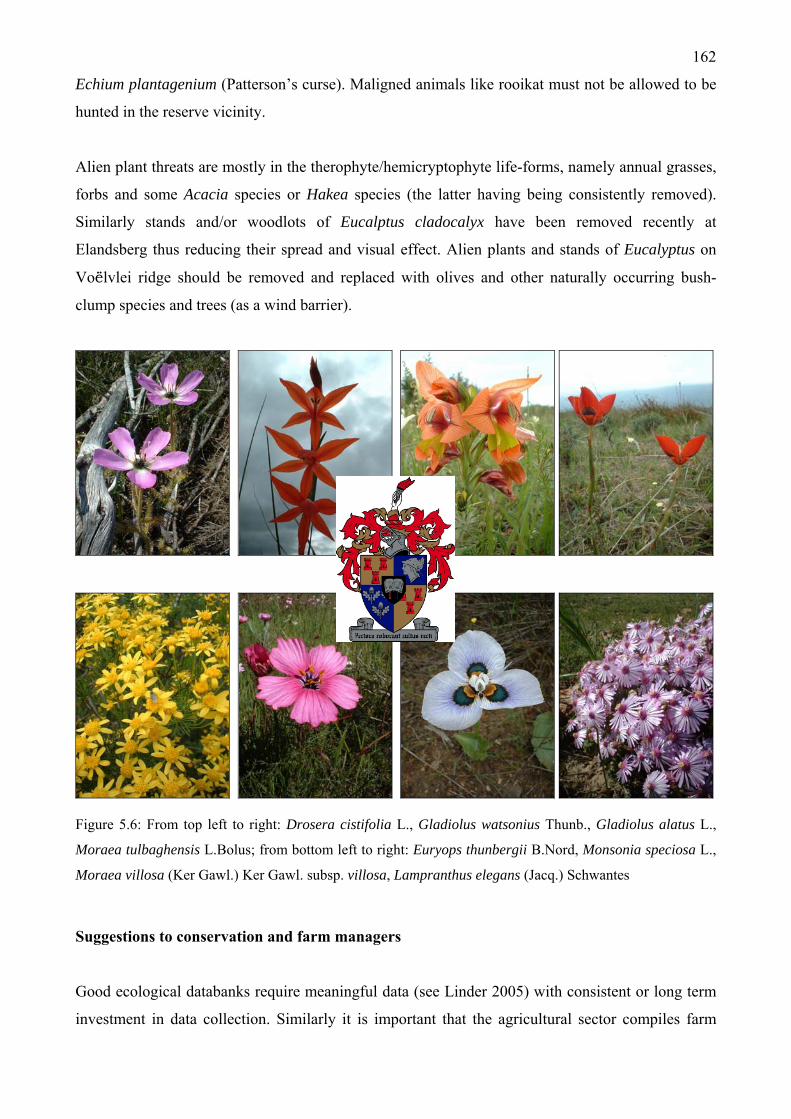
162
Echium plantagenium (Patterson’s curse). Maligned animals like rooikat must not be allowed to be
hunted in the reserve vicinity.
Alien plant threats are mostly in the therophyte/hemicryptophyte life-forms, namely annual grasses,
forbs and some Acacia species or Hakea species (the latter having being consistently removed).
Similarly stands and/or woodlots of Eucalptus cladocalyx have been removed recently at
Elandsberg thus reducing their spread and visual effect. Alien plants and stands of Eucalyptus on
Voëlvlei ridge should be removed and replaced with olives and other naturally occurring bush-
clump species and trees (as a wind barrier).
Figure 5.6: From top left to right: Drosera cistifolia L., Gladiolus watsonius Thunb., Gladiolus alatus L.,
Moraea tulbaghensis L.Bolus; from bottom left to right: Euryops thunbergii B.Nord, Monsonia speciosa L.,
Moraea villosa (Ker Gawl.) Ker Gawl. subsp. villosa, Lampranthus elegans (Jacq.) Schwantes
Suggestions to conservation and farm managers
Good ecological databanks require meaningful data (see Linder 2005) with consistent or long term
investment in data collection. Similarly it is important that the agricultural sector compiles farm
163
records of stocking densities per camp including mortalities and births to allow for reliable census
counts and growth rate calculations. Also a log book should be thoroughly compiled regarding time
of ploughing, crops planted, in which camp, and how often planted or rested. This will enable a
valuable account of the sites history which ultimately determines the strategy of restoration should
it ever occur. A visitor logbook is of utmost importance to all. Research conducted on farms or in
reserves should be official whereby both parties benefit and contracts negotiated ensuring the
transfer of information, reports or theses. This is integral to future research incorporating an
overview of previous research and an adequate site history.
A proposed management scenario for conservation of renosterveld is a full surveying of the
vegetation, correctly identifying species (see Figure 5.6) and classification of samples to describe
communities to understand the pattern variability. Managers require accurate plant and animal
databases, underlain with mapped vegetation units in conjunction with scientific studies prior to
pursuing management strategies and an attempt at applying gross benchmark rules.
Reserve managers need to maintain databases adequately whether printed or electronic material. It
is the responsibility of the reserve to ensure that records are stored, updated and collated with
related resources both old and new in spite of restructuring efforts and staff turnover. A key
function is to also research all the relevant literature and store it on site and make sure that
Afrikaans/English documents are translated and stored and not discarded. A booklet including all
site information should be compiled in the interests of self reflection, community education and as a
potential tourist guideline.
5.3. Future Research Topics
Opportunities for future research of renosterveld vegetation dynamics in relation to disturbance are
identified.
1. Determine seedling establishment following fire by species as well as by Plant Functional
Type.
2. Quantify the effects of trampling and herbivory (buck, porcupine, aardvark and rodent) on
seedling establishment and survival. Do factors such as nutrient deposition (heuweltjies,
wallows or diggings) and gap creation (micro-scale disturbances) promote certain guilds?
164
3. Quantify the response of organisms to fire, where spiders, grasshoppers would positively
respond to post-burnt areas, as do large and small mammalian herbivores.
4. Initiate phenological/physiological studies of key species to assess their nutrient-root-shoot
interactions.
5. Monitor the impacts of grazing on renosterveld vegetation. A comparison could be made
between domestic versus indigenous fauna transformed versus untransformed vegetation.
6. Investigate nutrient cycling of the pedoderm-related organisms. Develop an understanding
of the importance of the moss and lichen flora in nutrient cycling.
7. What is the effect of shading by shrubs on geophytes, herbs and dwarf shrubs and the role
shrubs play as support for lianellas and delicate geophyte inflorescences?
5.4. References
Cowling RM, Pierce SM, Moll EJ (1986) Conservation and Utilization of South Coast
Renosterveld, an endangered South African Vegetation Type. Biological Conservation 37: 363-
377
George MR, Brown JR, Clawson WJ (1992) Application of nonequilibrium ecology to management
of Mediterranean grasslands. Journal of Range Management 45: 436-440
Hartmann HEK (ed) (2002) Illustrated handbook of succulent plants: Aizoceae F-Z. Springer-
Verlag, Berlin. ISBN 3-540-41723-0
Jackson RD, Bartolome JW (2002) A state-transition approach to understanding nonequilibrium
plant community dynamics in Californian grasslands. Plant Ecology 162: 49-65
Keeley JE (1990) The California Valley Grassland. In: Schoenherr AA (ed) Endangered plant
communities of southern California. Southern California Botanists, Fullerton, Special
Publication No. 3
Linder HP (2005) A protocol for the systematic documentation of the ecology of Cape plants. South
African Journal of Botany 71: 201-210
Midoko-Iponga D (2004) Renosterveld Restoration: The role of competition, herbivory and other
disturbances. MSc Thesis, Stellenbosch University
Rebelo AG (1995) Renosterveld: conservation and research. In: Low AB, Jones FE (eds) The
sustainable use and management of Renosterveld remnants in the Cape Floristic Region.
Proceedings of a Symposium. Flora Conservation Committee Report 1995/4. Botanical Society
of South Africa, Kirstenbosch, pp 32-42. ISBN 1-874999-07-4

165
Appendices
Appendix 1: A chronological account of the history of Elandsberg Farms (Pty.) Ltd. From Becker
(1996) .......................................................................................................................................166
Appendix 2: Relevé disturbance history obtained from aerial photographs in ArcMap 8; E =
Elandsberg, K= Krantzkop, V= Voëlvlei sites.........................................................................167
Appendix 3.1: An example of a floristic data sheet used for all quadrat scales in the 1000 m2
relevés. Note cover-abundance data recorded only at the 1 m2 and 10 m2 scales ...................169
Appendix 3.2: Relevé (1000 m2) with nested quadrat codes and life-form codes..........................170
Appendix 3.3: Habitat data recorded at the 1000 m2 relevé scale ..................................................171
Appendix 3.4: North-Eastern corner relevé coordinates in decimal degrees (Datum WP,
configuration WGS84); E = Elandsberg, K = Krantzkop and V = Voëlvlei) ..........................172
Appendix 3.5: Braun-Blanquet cover-abundance refined scale (Barkman et al. 1964) recorded at
the 10 m2 quadrat scale ............................................................................................................173
Appendix 3.6: List of infrequently occurring species (once or twice) omitted from the structured
relevé table (Tab. 3.6) ..............................................................................................................174
Appendix 4.1: Total species and life-form richness of 42 relevés (1000 m2).................................176
Appendix 4.2: Species list for 42 relevés (total of 411 species). Life-forms (Lf) are: 1 = therophyte
(92), 2 = cryptophyte (136), 3 = hemicryptophyte (59), 4 = nano-chamaephyte (47), 5 =
chamaephyte (67), 6 = phanerophyte (5), 7 = lianella (3) and 8 = parasite (4); and site E =
Elandsberg, V = Voëlvlei and K = Krantzkop. X = Alien.......................................................177
References .......................................................................................................................................185
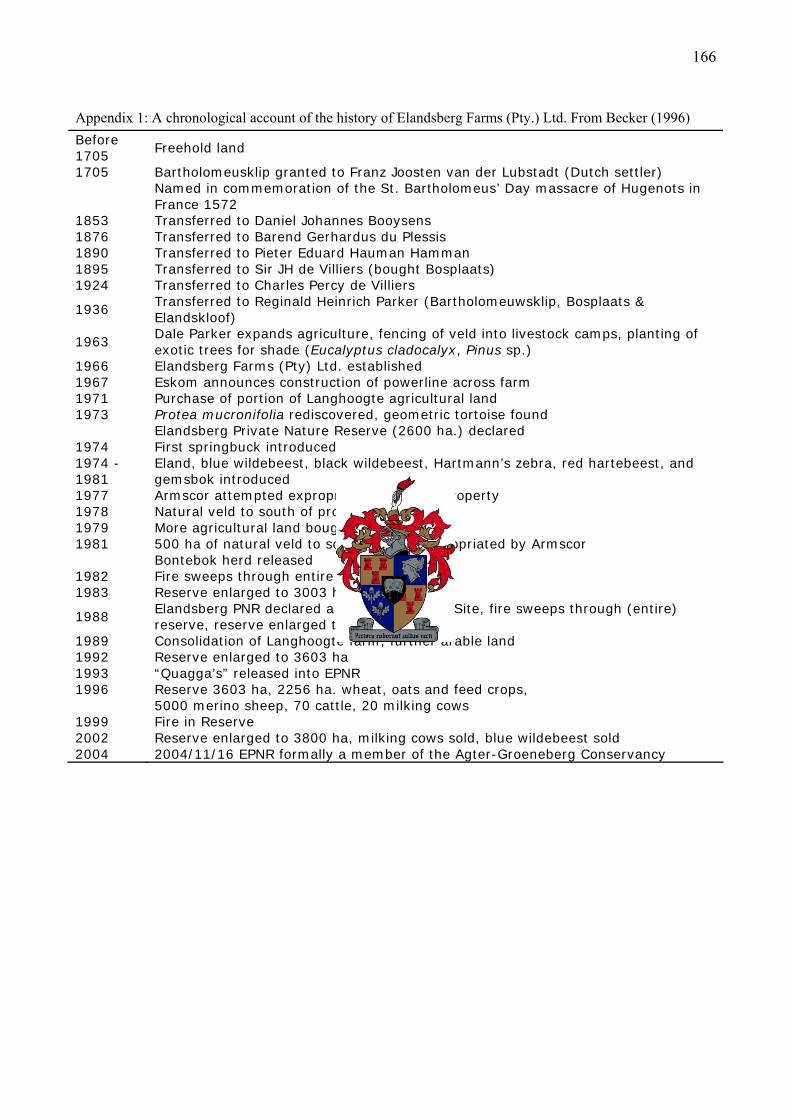
166
Appendix 1: A chronological account of the history of Elandsberg Farms (Pty.) Ltd. From Becker (1996) Before 1705
Freehold land
1705 Bartholomeusklip granted to Franz Joosten van der Lubstadt (Dutch settler)
Named in commemoration of the St. Bartholomeus’ Day massacre of Hugenots in France 1572
1853 Transferred to Daniel Johannes Booysens 1876 Transferred to Barend Gerhardus du Plessis 1890 Transferred to Pieter Eduard Hauman Hamman 1895 Transferred to Sir JH de Villiers (bought Bosplaats) 1924 Transferred to Charles Percy de Villiers
1936 Transferred to Reginald Heinrich Parker (Bartholomeuwsklip, Bosplaats & Elandskloof)
1963 Dale Parker expands agriculture, fencing of veld into livestock camps, planting of exotic trees for shade (Eucalyptus cladocalyx, Pinus sp.)
1966 Elandsberg Farms (Pty) Ltd. established 1967 Eskom announces construction of powerline across farm 1971 Purchase of portion of Langhoogte agricultural land 1973 Protea mucronifolia rediscovered, geometric tortoise found Elandsberg Private Nature Reserve (2600 ha.) declared 1974 First springbuck introduced 1974 - 1981
Eland, blue wildebeest, black wildebeest, Hartmann’s zebra, red hartebeest, and gemsbok introduced
1977 Armscor attempted expropriation of entire property 1978 Natural veld to south of property purchased 1979 More agricultural land bought 1981 500 ha of natural veld to south forcibly expropriated by Armscor Bontebok herd released 1982 Fire sweeps through entire reserve 1983 Reserve enlarged to 3003 ha
1988 Elandsberg PNR declared a Natural Heritage Site, fire sweeps through (entire) reserve, reserve enlarged to 3400 ha
1989 Consolidation of Langhoogte farm, further arable land 1992 Reserve enlarged to 3603 ha 1993 “Quagga’s” released into EPNR 1996 Reserve 3603 ha, 2256 ha. wheat, oats and feed crops, 5000 merino sheep, 70 cattle, 20 milking cows 1999 Fire in Reserve 2002 Reserve enlarged to 3800 ha, milking cows sold, blue wildebeest sold 2004 2004/11/16 EPNR formally a member of the Agter-Groeneberg Conservancy
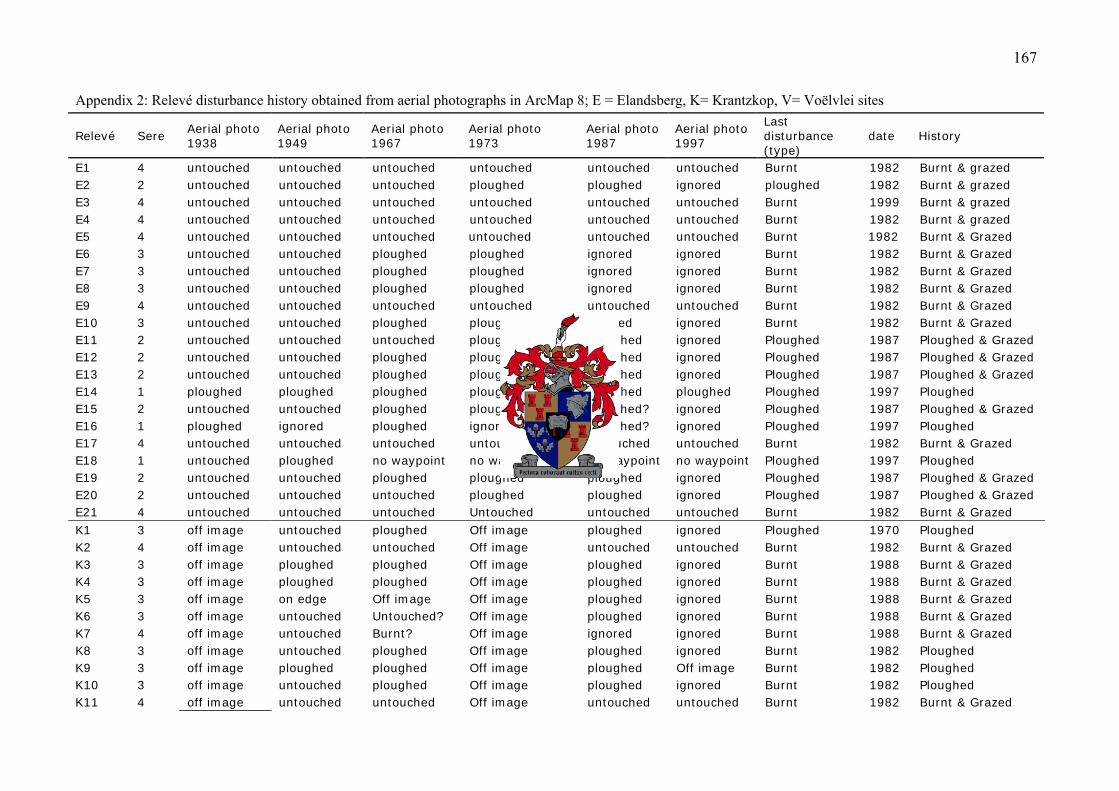
167
Appendix 2: Relevé disturbance history obtained from aerial photographs in ArcMap 8; E = Elandsberg, K= Krantzkop, V= Voëlvlei sites
Relevé Sere Aerial photo 1938
Aerial photo 1949
Aerial photo 1967
Aerial photo 1973
Aerial photo 1987
Aerial photo 1997
Last disturbance (type)
date History
E1 4 untouched untouched untouched untouched untouched untouched Burnt 1982 Burnt & grazed E2 2 untouched untouched untouched ploughed ploughed ignored ploughed 1982 Burnt & grazed E3 4 untouched untouched untouched untouched untouched untouched Burnt 1999 Burnt & grazed E4 4 untouched untouched untouched untouched untouched untouched Burnt 1982 Burnt & grazed E5 4 untouched untouched untouched untouched untouched untouched Burnt 1982 Burnt & Grazed E6 3 untouched untouched ploughed ploughed ignored ignored Burnt 1982 Burnt & Grazed E7 3 untouched untouched ploughed ploughed ignored ignored Burnt 1982 Burnt & Grazed E8 3 untouched untouched ploughed ploughed ignored ignored Burnt 1982 Burnt & Grazed E9 4 untouched untouched untouched untouched untouched untouched Burnt 1982 Burnt & Grazed E10 3 untouched untouched ploughed ploughed ignored ignored Burnt 1982 Burnt & Grazed E11 2 untouched untouched untouched ploughed ploughed ignored Ploughed 1987 Ploughed & Grazed E12 2 untouched untouched ploughed ploughed ploughed ignored Ploughed 1987 Ploughed & Grazed E13 2 untouched untouched ploughed ploughed ploughed ignored Ploughed 1987 Ploughed & Grazed E14 1 ploughed ploughed ploughed ploughed ploughed ploughed Ploughed 1997 Ploughed E15 2 untouched untouched ploughed ploughed Ploughed? ignored Ploughed 1987 Ploughed & Grazed E16 1 ploughed ignored ploughed ignored Ploughed? ignored Ploughed 1997 Ploughed E17 4 untouched untouched untouched untouched untouched untouched Burnt 1982 Burnt & Grazed E18 1 untouched ploughed no waypoint no waypoint no waypoint no waypoint Ploughed 1997 Ploughed E19 2 untouched untouched ploughed ploughed ploughed ignored Ploughed 1987 Ploughed & Grazed E20 2 untouched untouched untouched ploughed ploughed ignored Ploughed 1987 Ploughed & Grazed E21 4 untouched untouched untouched Untouched untouched untouched Burnt 1982 Burnt & Grazed K1 3 off image untouched ploughed Off image ploughed ignored Ploughed 1970 Ploughed K2 4 off image untouched untouched Off image untouched untouched Burnt 1982 Burnt & Grazed K3 3 off image ploughed ploughed Off image ploughed ignored Burnt 1988 Burnt & Grazed K4 3 off image ploughed ploughed Off image ploughed ignored Burnt 1988 Burnt & Grazed K5 3 off image on edge Off image Off image ploughed ignored Burnt 1988 Burnt & Grazed K6 3 off image untouched Untouched? Off image ploughed ignored Burnt 1988 Burnt & Grazed K7 4 off image untouched Burnt? Off image ignored ignored Burnt 1988 Burnt & Grazed K8 3 off image untouched ploughed Off image ploughed ignored Burnt 1982 Ploughed K9 3 off image ploughed ploughed Off image ploughed Off image Burnt 1982 Ploughed K10 3 off image untouched ploughed Off image ploughed ignored Burnt 1982 Ploughed K11 4 off image untouched untouched Off image untouched untouched Burnt 1982 Burnt & Grazed
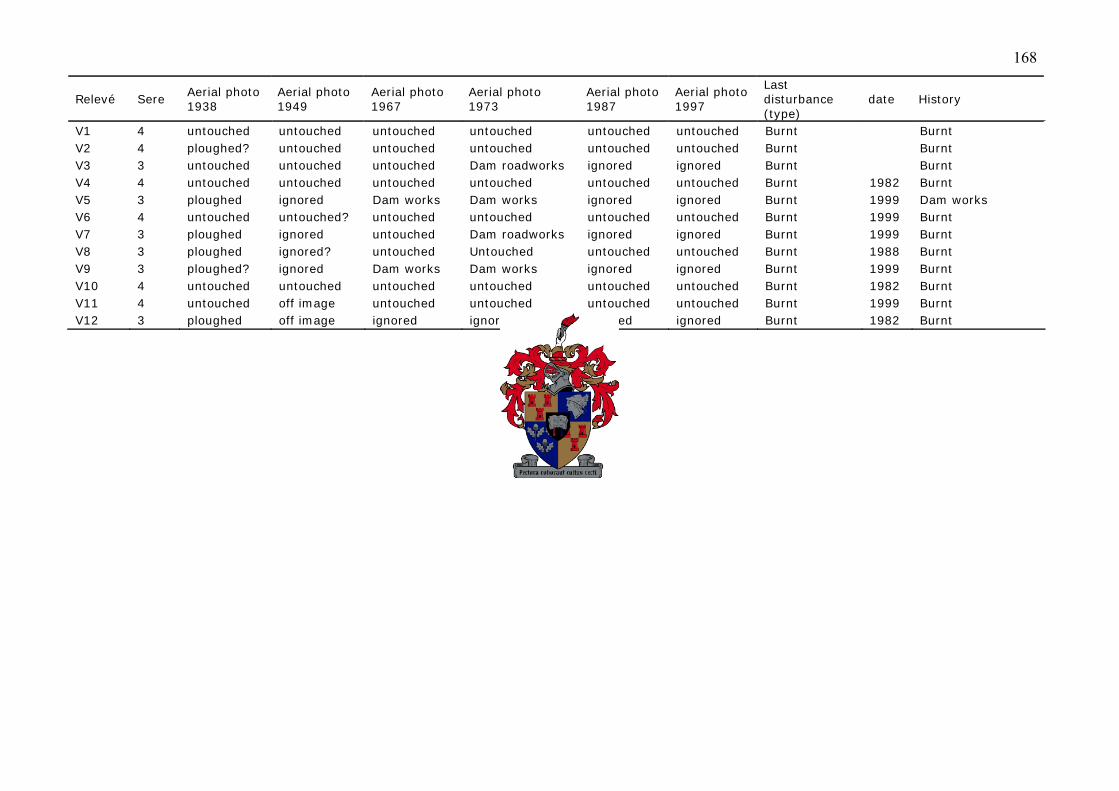
168
Relevé Sere Aerial photo 1938
Aerial photo 1949
Aerial photo 1967
Aerial photo 1973
Aerial photo 1987
Aerial photo 1997
Last disturbance (type)
date History
V1 4 untouched untouched untouched untouched untouched untouched Burnt Burnt V2 4 ploughed? untouched untouched untouched untouched untouched Burnt Burnt V3 3 untouched untouched untouched Dam roadworks ignored ignored Burnt Burnt V4 4 untouched untouched untouched untouched untouched untouched Burnt 1982 Burnt V5 3 ploughed ignored Dam works Dam works ignored ignored Burnt 1999 Dam works V6 4 untouched untouched? untouched untouched untouched untouched Burnt 1999 Burnt V7 3 ploughed ignored untouched Dam roadworks ignored ignored Burnt 1999 Burnt V8 3 ploughed ignored? untouched Untouched untouched untouched Burnt 1988 Burnt V9 3 ploughed? ignored Dam works Dam works ignored ignored Burnt 1999 Burnt V10 4 untouched untouched untouched untouched untouched untouched Burnt 1982 Burnt V11 4 untouched off image untouched untouched untouched untouched Burnt 1999 Burnt V12 3 ploughed off image ignored ignored ignored ignored Burnt 1982 Burnt
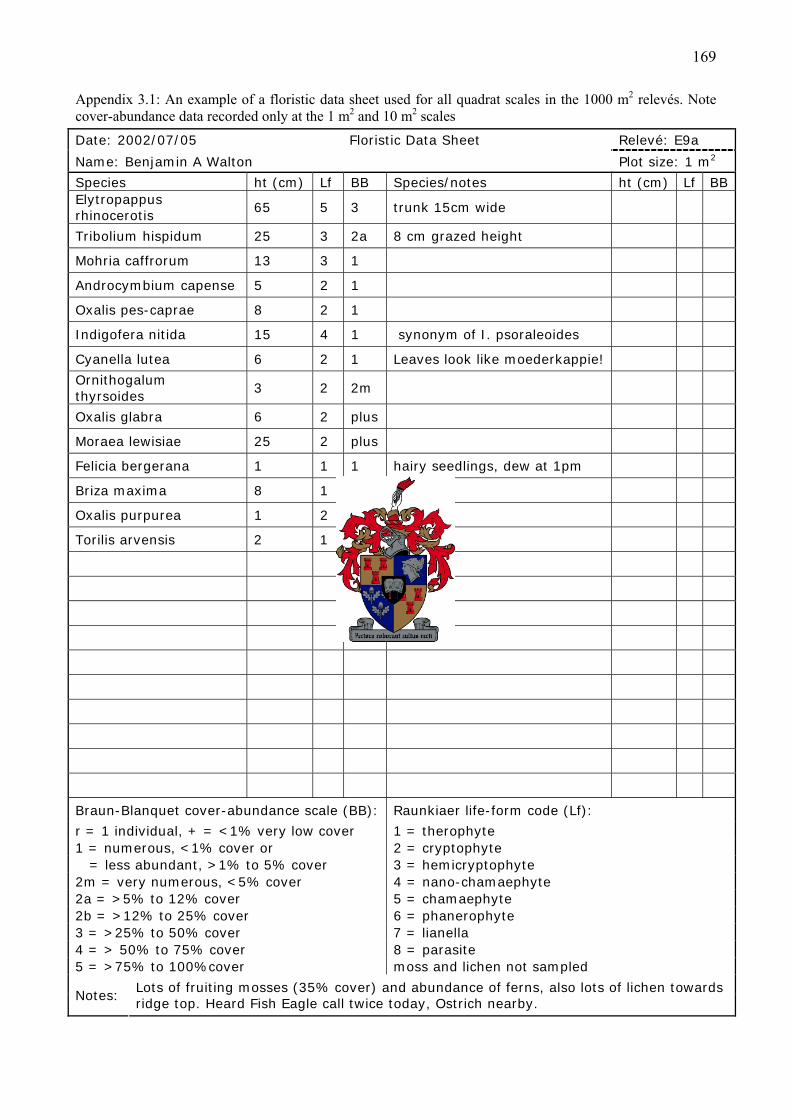
169
Appendix 3.1: An example of a floristic data sheet used for all quadrat scales in the 1000 m2 relevés. Note cover-abundance data recorded only at the 1 m2 and 10 m2 scales Date: 2002/07/05 Floristic Data Sheet Relevé: E9a
Name: Benjamin A Walton Plot size: 1 m2
Species ht (cm) Lf BB Species/notes ht (cm) Lf BB Elytropappus rhinocerotis
65 5 3 trunk 15cm wide
Tribolium hispidum 25 3 2a 8 cm grazed height
Mohria caffrorum 13 3 1
Androcymbium capense 5 2 1
Oxalis pes-caprae 8 2 1
Indigofera nitida 15 4 1 synonym of I. psoraleoides
Cyanella lutea 6 2 1 Leaves look like moederkappie!
Ornithogalum thyrsoides
3 2 2m
Oxalis glabra 6 2 plus
Moraea lewisiae 25 2 plus
Felicia bergerana 1 1 1 hairy seedlings, dew at 1pm
Briza maxima 8 1 2m alien
Oxalis purpurea 1 2 1
Torilis arvensis 2 1 r seedling
Braun-Blanquet cover-abundance scale (BB): Raunkiaer life-form code (Lf):
r = 1 individual, + = <1% very low cover 1 = therophyte 1 = numerous, <1% cover or 2 = cryptophyte = less abundant, >1% to 5% cover 3 = hemicryptophyte 2m = very numerous, <5% cover 4 = nano-chamaephyte 2a = >5% to 12% cover 5 = chamaephyte 2b = >12% to 25% cover 6 = phanerophyte 3 = >25% to 50% cover 7 = lianella 4 = > 50% to 75% cover 8 = parasite 5 = >75% to 100%cover moss and lichen not sampled
Notes: Lots of fruiting mosses (35% cover) and abundance of ferns, also lots of lichen towards ridge top. Heard Fish Eagle call twice today, Ostrich nearby.
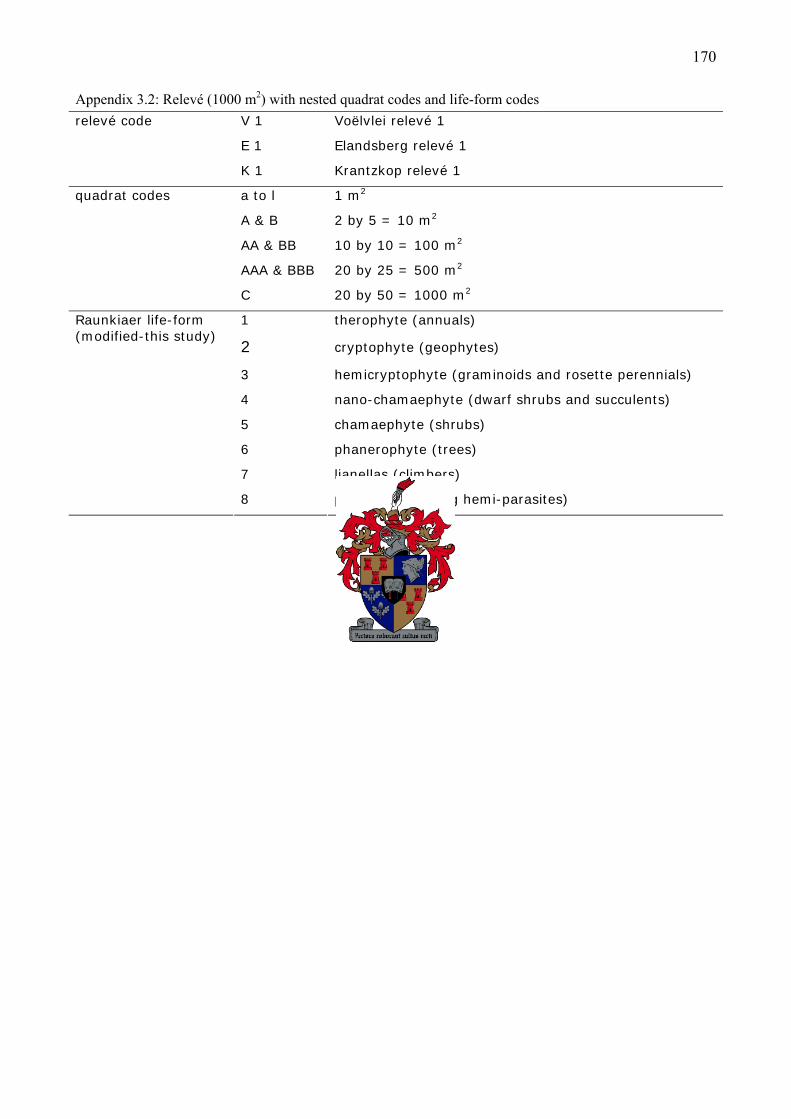
170
Appendix 3.2: Relevé (1000 m2) with nested quadrat codes and life-form codes V 1 Voëlvlei relevé 1
E 1 Elandsberg relevé 1
relevé code
K 1 Krantzkop relevé 1
a to l 1 m2
A & B 2 by 5 = 10 m2
AA & BB 10 by 10 = 100 m2
AAA & BBB 20 by 25 = 500 m2
quadrat codes
C 20 by 50 = 1000 m2
1 therophyte (annuals)
2 cryptophyte (geophytes)
3 hemicryptophyte (graminoids and rosette perennials)
4 nano-chamaephyte (dwarf shrubs and succulents)
5 chamaephyte (shrubs)
6 phanerophyte (trees)
7 lianellas (climbers)
Raunkiaer life-form (modified-this study)
8 parasite (including hemi-parasites)
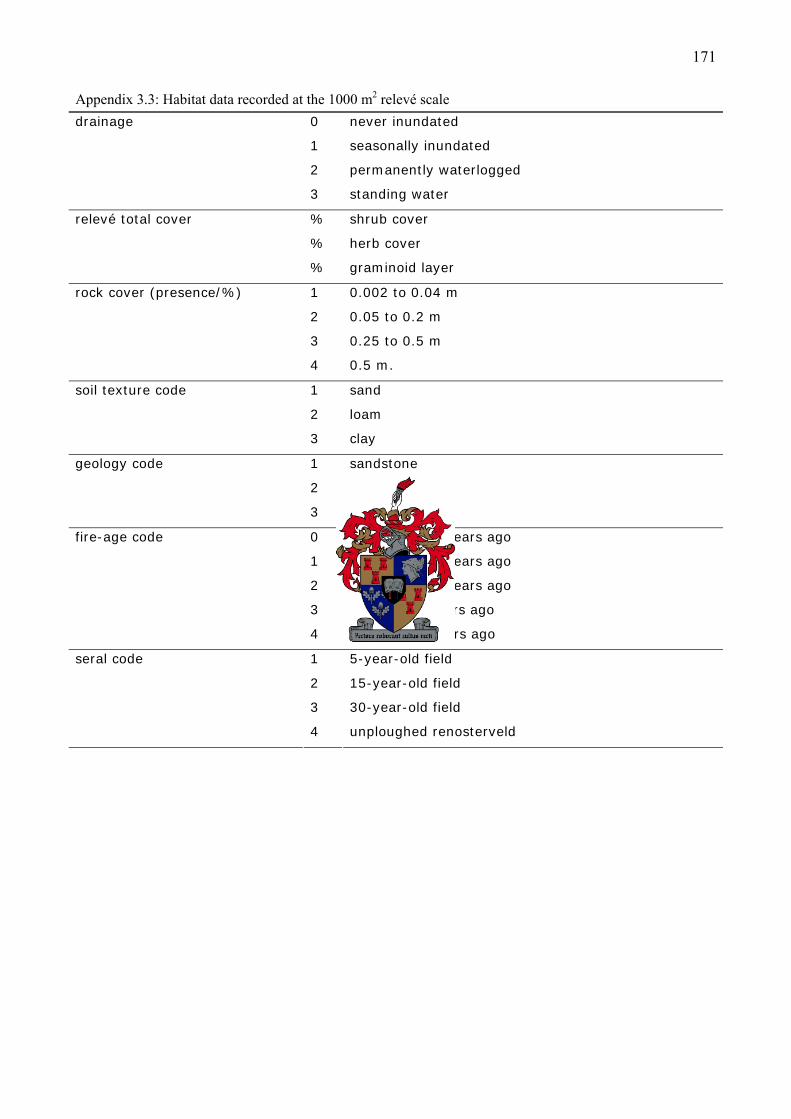
171
Appendix 3.3: Habitat data recorded at the 1000 m2 relevé scale 0 never inundated
1 seasonally inundated
2 permanently waterlogged
drainage
3 standing water
% shrub cover
% herb cover
relevé total cover
% graminoid layer
1 0.002 to 0.04 m
2 0.05 to 0.2 m
3 0.25 to 0.5 m
rock cover (presence/%)
4 0.5 m.
1 sand
2 loam
soil texture code
3 clay
1 sandstone
2 granite
geology code
3 shale
0 burned 30-39 years ago
1 burned 20-29 years ago
2 burned 10-19 years ago
3 burned 5-9 years ago
fire-age code
4 burned < 5 years ago
1 5-year-old field
2 15-year-old field
3 30-year-old field
seral code
4 unploughed renosterveld
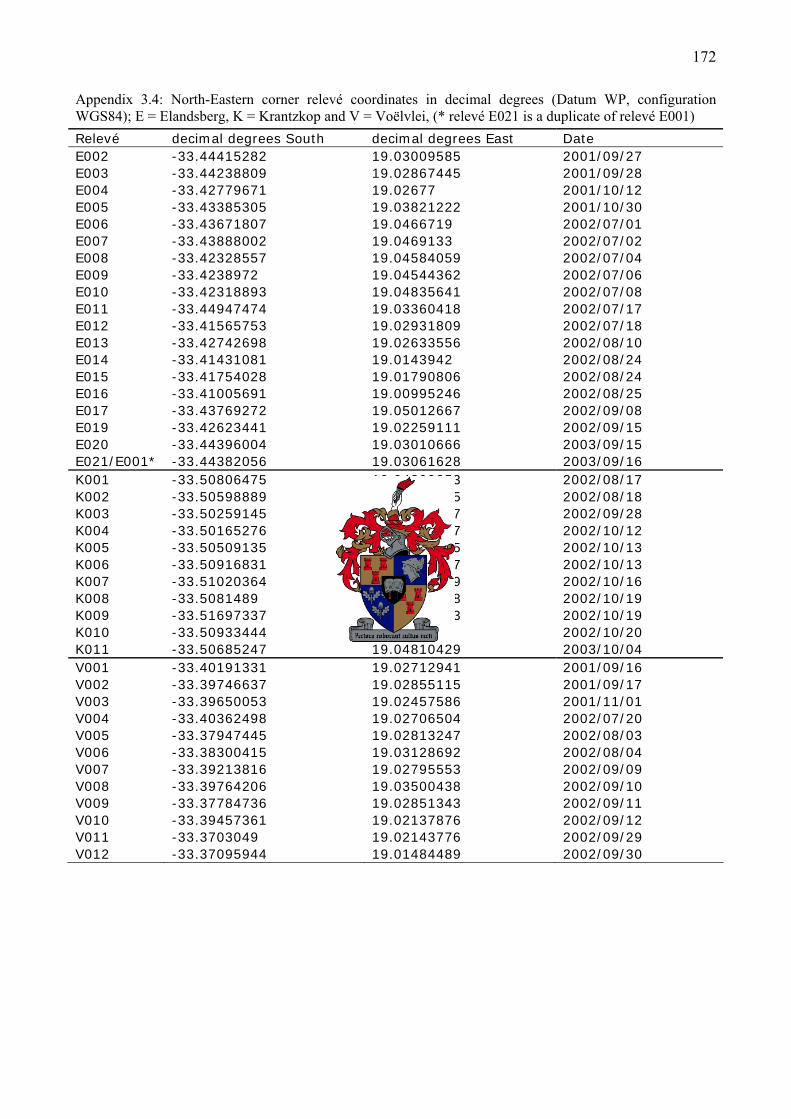
172
Appendix 3.4: North-Eastern corner relevé coordinates in decimal degrees (Datum WP, configuration WGS84); E = Elandsberg, K = Krantzkop and V = Voëlvlei, (* relevé E021 is a duplicate of relevé E001) Relevé decimal degrees South decimal degrees East Date E002 -33.44415282 19.03009585 2001/09/27 E003 -33.44238809 19.02867445 2001/09/28 E004 -33.42779671 19.02677 2001/10/12 E005 -33.43385305 19.03821222 2001/10/30 E006 -33.43671807 19.0466719 2002/07/01 E007 -33.43888002 19.0469133 2002/07/02 E008 -33.42328557 19.04584059 2002/07/04 E009 -33.4238972 19.04544362 2002/07/06 E010 -33.42318893 19.04835641 2002/07/08 E011 -33.44947474 19.03360418 2002/07/17 E012 -33.41565753 19.02931809 2002/07/18 E013 -33.42742698 19.02633556 2002/08/10 E014 -33.41431081 19.0143942 2002/08/24 E015 -33.41754028 19.01790806 2002/08/24 E016 -33.41005691 19.00995246 2002/08/25 E017 -33.43769272 19.05012667 2002/09/08 E019 -33.42623441 19.02259111 2002/09/15 E020 -33.44396004 19.03010666 2003/09/15 E021/E001* -33.44382056 19.03061628 2003/09/16 K001 -33.50806475 19.04800253 2002/08/17 K002 -33.50598889 19.03196275 2002/08/18 K003 -33.50259145 19.07254457 2002/09/28 K004 -33.50165276 19.07139667 2002/10/12 K005 -33.50509135 19.07838115 2002/10/13 K006 -33.50916831 19.05462197 2002/10/13 K007 -33.51020364 19.05386559 2002/10/16 K008 -33.5081489 19.04425808 2002/10/19 K009 -33.51697337 19.03027833 2002/10/19 K010 -33.50933444 19.0421497 2002/10/20 K011 -33.50685247 19.04810429 2003/10/04 V001 -33.40191331 19.02712941 2001/09/16 V002 -33.39746637 19.02855115 2001/09/17 V003 -33.39650053 19.02457586 2001/11/01 V004 -33.40362498 19.02706504 2002/07/20 V005 -33.37947445 19.02813247 2002/08/03 V006 -33.38300415 19.03128692 2002/08/04 V007 -33.39213816 19.02795553 2002/09/09 V008 -33.39764206 19.03500438 2002/09/10 V009 -33.37784736 19.02851343 2002/09/11 V010 -33.39457361 19.02137876 2002/09/12 V011 -33.3703049 19.02143776 2002/09/29 V012 -33.37095944 19.01484489 2002/09/30
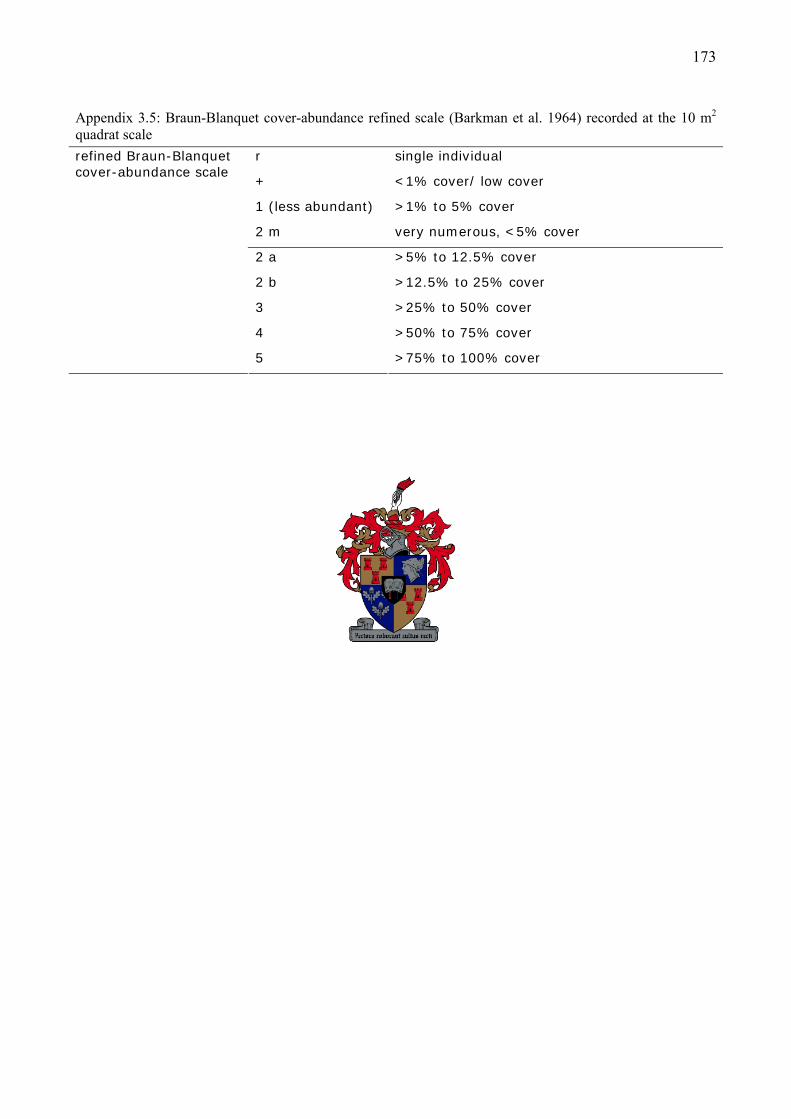
173
Appendix 3.5: Braun-Blanquet cover-abundance refined scale (Barkman et al. 1964) recorded at the 10 m2 quadrat scale
r single individual
+ <1% cover/ low cover
1 (less abundant) >1% to 5% cover
2 m very numerous, <5% cover
2 a >5% to 12.5% cover
2 b >12.5% to 25% cover
3 >25% to 50% cover
4 >50% to 75% cover
refined Braun-Blanquet cover-abundance scale
5 >75% to 100% cover

174
Appendix 3.6: List of infrequently occurring species (once or twice) omitted from the structured relevé table (Tab. 3.6) with; name, relevé code and cover-abundance value (in brackets) Diascia parviflora Benth (2, 2), Polygonum aviculare L. (3, 1), Oxalis flava L. (4, 2), Romulea cruciata (Jacq.) Baker (6, 1), Plantago coronopus L. (6, 3), Galenia ecklonis Walp. (7, 1; 63, 2), Romulea rosea (L.) Eckl. (8, 1), Disperis villosa (L.f.) Sw. (9, 1), Ornithogalum suaveolens Jacq. (10, 2), Manulea pusilla E.Mey. ex Benth. (13, 5), Babiana ambigua (Roem. & Schult.) G.J.Lewis (13, 5), Micranthus alopecuroides (L.) Rothm. (14, 8), Drosera trinervia (15, 2), Stoebe plumosa (L.) Thunb. (15, 1), Tribolium echinatum (Thunb.) Renvoize (20, 7; 64, 8), Gorteria personata L. (20, 5; 64, 3), Convolvulus capensis Burm.f. (20, 5), Ehrharta capensis Thunb. (20, 1; 54, 7), Polycarpon tetraphyllum L.f. (21, 2), Lobostemon fruticosus (L.) H.Buek (23, 6; 66, 2), Anagallis arvensis L. (23, 1; 43, 1) Senecio paniculatus P.J.Bergius (23, 1), Crassula umbellata Thunb. (24, 2), Rumex cordatus Poir. (25, 5), Melinis repens (Willd.) Zizka (25, 3), Phalaris minor Retz. (27, 3; 50, 2), Vicia sativa L. (29, 3), Hyparrhenia hirta (L.) Stapf (31, 5), Trachyandra muricata (L.f.) Kunth (31, 3), Vellereophyton dealbatum (Thunb.) Hilliard & B.L.Burtt (31, 1), Emex australis Steinh. (32, 1), Muraltia heisteria (L.) DC. (32, 3; 71, 3), Felicia tenella (L.) Nees (35, 6; 41, 6), Gastridium phleoides (Nees & Meyen) C.E.Hubb. (37, 2; 47, 2), Satyrium erectum Sw. (49, 2; 50, 2), Otholobium uncinatum (Eckl. & Zeyh.) C.H.Stirt. (49, 1; 51, 3), Muraltia ericaefolia DC. (51, 1; 52, 6), Sutera uncinata (Desr.) Hilliard (53, 3; 57, 1), Baeometra uniflora (Jacq.) G.J.Lewis (53, 2; 56, 1), Helichrysum teretifolium (L.) D.Don (53, 2; 54, 2), Pelargonium pinnatum (L.) L'Hér. (53, 2, 54, 2), Senecio pubigerus L. (64, 3; 68, 3), Lampranthus sp. (65, 2; 66, 2), Selago fruticosa L. (67, 3; 68, 5), Heliophila pusilla L.f. var. macrosperma Marais (69, 4; 70, 3), Pelargonium lobatum (Burm.f.) L'Hér. (69, 3; 70, 2), Lachenalia orchioides (L.) Aiton (69, 2; 70, 1), Trachyandra sp. (69, 1; 70, 2), Lampranthus aduncus (Haw.) N.E.Br. (70, 1; 71, 3), Felicia bergerana (Spreng.) O.Hoffm. (71, 3; 72, 2), Agathosma serpyllacea Licht. ex Roem. & Schult. (71, 2; 72, 1), Aizoon paniculatum L. (59, 1; 66, 1), Dorotheanthus bellidiformis (Burm.f.) N.E.Br. (36, 1), Muraltia trinervia (L.f.) DC. (38, 1), Moraea fugacissima (L.f.) Goldblatt (39, 1), Brachypodium distachyon (L.) P.Beauv. (40, 2), Galenia africana L. (41, 5), Drosanthemum salicola L.Bolus (41, 5), Aspalathus aculeata Thunb. (42, 6), Microcodon glomeratum A.DC. (43, 1), Cotula bipinnata Thunb. (47, 5), Poa annua L. (47, 3), Nemesia barbata (Thunb.) Benth. (47, 1), Sonchus oleraceus L. (49, 2), Phylica ericoides L. (52, 1), Euclea acutifolia E.Mey. ex A.DC. (53, 7), Torilis arvensis (Huds.) Link (53, 3), Rhus rosmarinifolia Vahl (54, 3), Merxmuellera stricta (Schrad.) Conert (54, 3), Phylica plumosa L. var. horizontalis (Vent.) Sond. (57, 1), Festuca scabra Vahl (58, 3), Aspalathus ericifolia L. (59, 1), Spiloxene flaccida (Nel) Garside (59, 2), Cotula coronopifolia L. (59, 2), Hermannia cuneifolia Jacq. (60, 3), Erepsia patula (Haw.) Schwantes (60, 3), Helichrysum patulum (L.) D.Don (60, 3), Drosera alba E.Phillips (61, 3), Erica inaequalis (Klotzch) E.G.H.Oliv. (62, 2), Geissorhiza imbricata (D.Delaroche) Ker Gawl. (62, 2), Stoebe fusca (L.) Thunb. (64, 1), Oxalis monophylla L. (66, 3), Hesperantha radiata (Jacq.) Ker Gawl. (66, 2), Montinia caryophyllacea Thunb. (67, 2), Aspalathus perforata (Thunb.) R.Dahlgren (67, 2), Anginon difforme (L.) B.L.Burtt (67, 2), Sebaea exacoides (L.) Schinz (68, 1), Cullumia ciliaris (L.) R.Br. (69, 3), Thesium sp. (69, 3), Cymbopogon marginatus (Steud.) Stapf ex Burtt Davy (69, 3), Tetragonia portulacoides Fenzl (69, 3), Moraea umbellata Thunb. (69, 2), Senecio arenarius Thunb. (69, 3), Bulbine sp. (69, 1), Antimima sp. (70, 3), Arctotis incisa Thunb. (70, 5), Monsonia speciosa L. (70, 2), Drosera pauciflora Banks ex DC. (70, 2), Gladiolus alatus L. (70, 1), Onixotis punctata (L.) Mabb. (70, 1), Lachenalia longibracteata E. Phillips (70, 1), Polycarena gilioides Benth. (70, 2), Crassula dichotoma L. (70, 2), Metalasia dregeana DC. (71, 3), Gnidia laxa (L.f.) Gilg (71, 2), Corymbium africanum L. (71, 3), Microcodon sp. (71, 3), Trachyandra paniculata Oberm. (71, 3), Othonna heterophylla L.f. (71, 2), Cyphia bulbosa (L.) P.J. Bergius (71, 2), Lachenalia polyphylla Baker (71, 2), Oxalis versicolor L. (71, 2), Ornithogalum sp. (71, 2), Cliffortia ruscifolia L. (72, 3), Cliffortia juniperina L.f. (72, 2), Zygophyllum sessilifolium L. (72,

175
2), Brunsvigia sp. (72, 3), Berkheya herbacea (L.f.) Druce (72, 3), Nemesia versicolor E.Mey. ex Benth. (72, 2), Diospyros glabra (L.) De Winter. (72, 1).
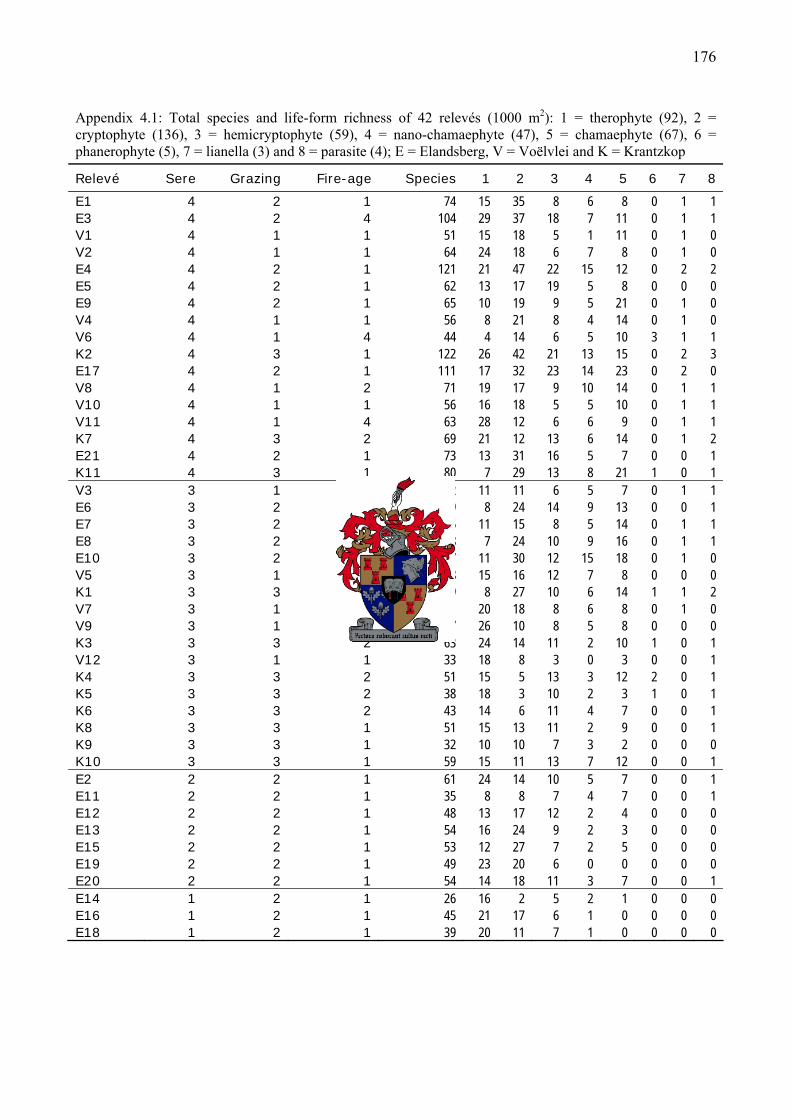
176
Appendix 4.1: Total species and life-form richness of 42 relevés (1000 m2): 1 = therophyte (92), 2 = cryptophyte (136), 3 = hemicryptophyte (59), 4 = nano-chamaephyte (47), 5 = chamaephyte (67), 6 = phanerophyte (5), 7 = lianella (3) and 8 = parasite (4); E = Elandsberg, V = Voëlvlei and K = Krantzkop
Relevé Sere Grazing Fire-age Species 1 2 3 4 5 6 7 8
E1 4 2 1 74 15 35 8 6 8 0 1 1 E3 4 2 4 104 29 37 18 7 11 0 1 1 V1 4 1 1 51 15 18 5 1 11 0 1 0 V2 4 1 1 64 24 18 6 7 8 0 1 0 E4 4 2 1 121 21 47 22 15 12 0 2 2 E5 4 2 1 62 13 17 19 5 8 0 0 0 E9 4 2 1 65 10 19 9 5 21 0 1 0 V4 4 1 1 56 8 21 8 4 14 0 1 0 V6 4 1 4 44 4 14 6 5 10 3 1 1 K2 4 3 1 122 26 42 21 13 15 0 2 3 E17 4 2 1 111 17 32 23 14 23 0 2 0 V8 4 1 2 71 19 17 9 10 14 0 1 1 V10 4 1 1 56 16 18 5 5 10 0 1 1 V11 4 1 4 63 28 12 6 6 9 0 1 1 K7 4 3 2 69 21 12 13 6 14 0 1 2 E21 4 2 1 73 13 31 16 5 7 0 0 1 K11 4 3 1 80 7 29 13 8 21 1 0 1 V3 3 1 1 42 11 11 6 5 7 0 1 1 E6 3 2 1 69 8 24 14 9 13 0 0 1 E7 3 2 1 55 11 15 8 5 14 0 1 1 E8 3 2 1 68 7 24 10 9 16 0 1 1 E10 3 2 1 87 11 30 12 15 18 0 1 0 V5 3 1 4 58 15 16 12 7 8 0 0 0 K1 3 3 1 69 8 27 10 6 14 1 1 2 V7 3 1 4 61 20 18 8 6 8 0 1 0 V9 3 1 4 57 26 10 8 5 8 0 0 0 K3 3 3 2 63 24 14 11 2 10 1 0 1 V12 3 1 1 33 18 8 3 0 3 0 0 1 K4 3 3 2 51 15 5 13 3 12 2 0 1 K5 3 3 2 38 18 3 10 2 3 1 0 1 K6 3 3 2 43 14 6 11 4 7 0 0 1 K8 3 3 1 51 15 13 11 2 9 0 0 1 K9 3 3 1 32 10 10 7 3 2 0 0 0 K10 3 3 1 59 15 11 13 7 12 0 0 1 E2 2 2 1 61 24 14 10 5 7 0 0 1 E11 2 2 1 35 8 8 7 4 7 0 0 1 E12 2 2 1 48 13 17 12 2 4 0 0 0 E13 2 2 1 54 16 24 9 2 3 0 0 0 E15 2 2 1 53 12 27 7 2 5 0 0 0 E19 2 2 1 49 23 20 6 0 0 0 0 0 E20 2 2 1 54 14 18 11 3 7 0 0 1 E14 1 2 1 26 16 2 5 2 1 0 0 0 E16 1 2 1 45 21 17 6 1 0 0 0 0 E18 1 2 1 39 20 11 7 1 0 0 0 0
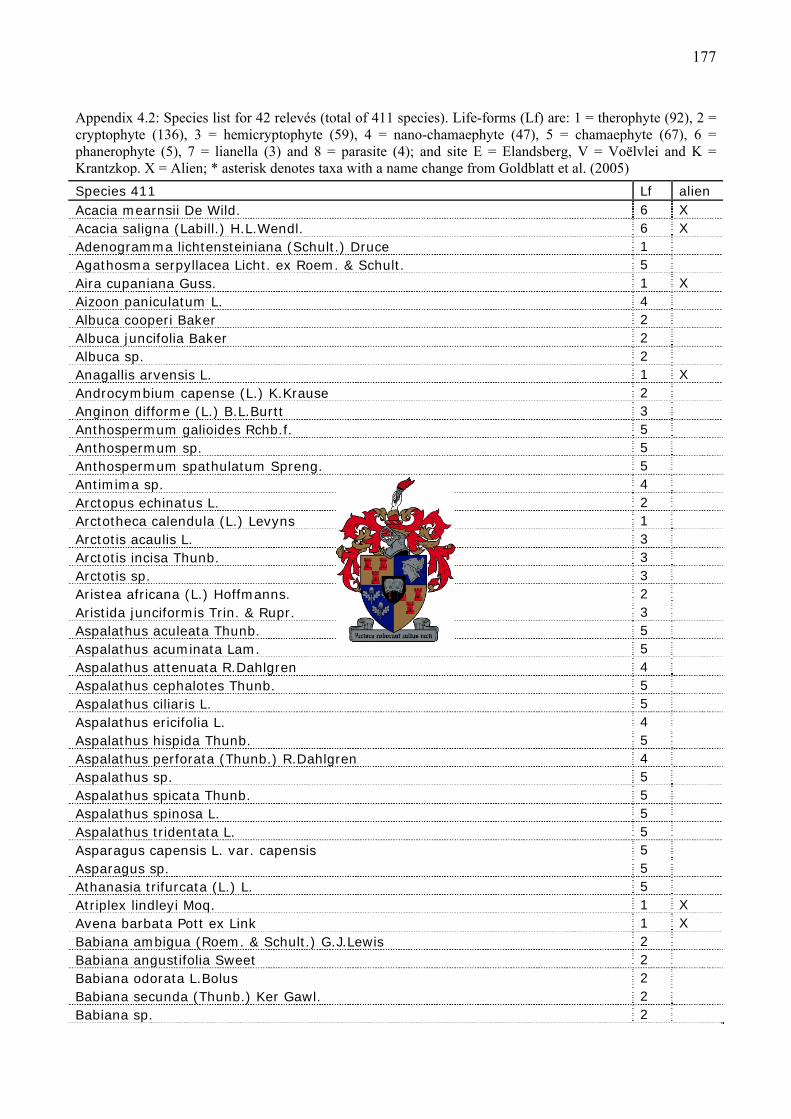
177
Appendix 4.2: Species list for 42 relevés (total of 411 species). Life-forms (Lf) are: 1 = therophyte (92), 2 = cryptophyte (136), 3 = hemicryptophyte (59), 4 = nano-chamaephyte (47), 5 = chamaephyte (67), 6 = phanerophyte (5), 7 = lianella (3) and 8 = parasite (4); and site E = Elandsberg, V = Voëlvlei and K = Krantzkop. X = Alien; * asterisk denotes taxa with a name change from Goldblatt et al. (2005) Species 411 Lf alien Acacia mearnsii De Wild. 6 X Acacia saligna (Labill.) H.L.Wendl. 6 X Adenogramma lichtensteiniana (Schult.) Druce 1 Agathosma serpyllacea Licht. ex Roem. & Schult. 5 Aira cupaniana Guss. 1 X Aizoon paniculatum L. 4 Albuca cooperi Baker 2 Albuca juncifolia Baker 2 Albuca sp. 2 Anagallis arvensis L. 1 X Androcymbium capense (L.) K.Krause 2 Anginon difforme (L.) B.L.Burtt 3 Anthospermum galioides Rchb.f. 5 Anthospermum sp. 5 Anthospermum spathulatum Spreng. 5 Antimima sp. 4 Arctopus echinatus L. 2 Arctotheca calendula (L.) Levyns 1 Arctotis acaulis L. 3 Arctotis incisa Thunb. 3 Arctotis sp. 3 Aristea africana (L.) Hoffmanns. 2 Aristida junciformis Trin. & Rupr. 3 Aspalathus aculeata Thunb. 5 Aspalathus acuminata Lam. 5 Aspalathus attenuata R.Dahlgren 4 Aspalathus cephalotes Thunb. 5 Aspalathus ciliaris L. 5 Aspalathus ericifolia L. 4 Aspalathus hispida Thunb. 5 Aspalathus perforata (Thunb.) R.Dahlgren 4 Aspalathus sp. 5 Aspalathus spicata Thunb. 5 Aspalathus spinosa L. 5 Aspalathus tridentata L. 5 Asparagus capensis L. var. capensis 5 Asparagus sp. 5 Athanasia trifurcata (L.) L. 5 Atriplex lindleyi Moq. 1 X Avena barbata Pott ex Link 1 X Babiana ambigua (Roem. & Schult.) G.J.Lewis 2 Babiana angustifolia Sweet 2 Babiana odorata L.Bolus 2 Babiana secunda (Thunb.) Ker Gawl. 2 Babiana sp. 2
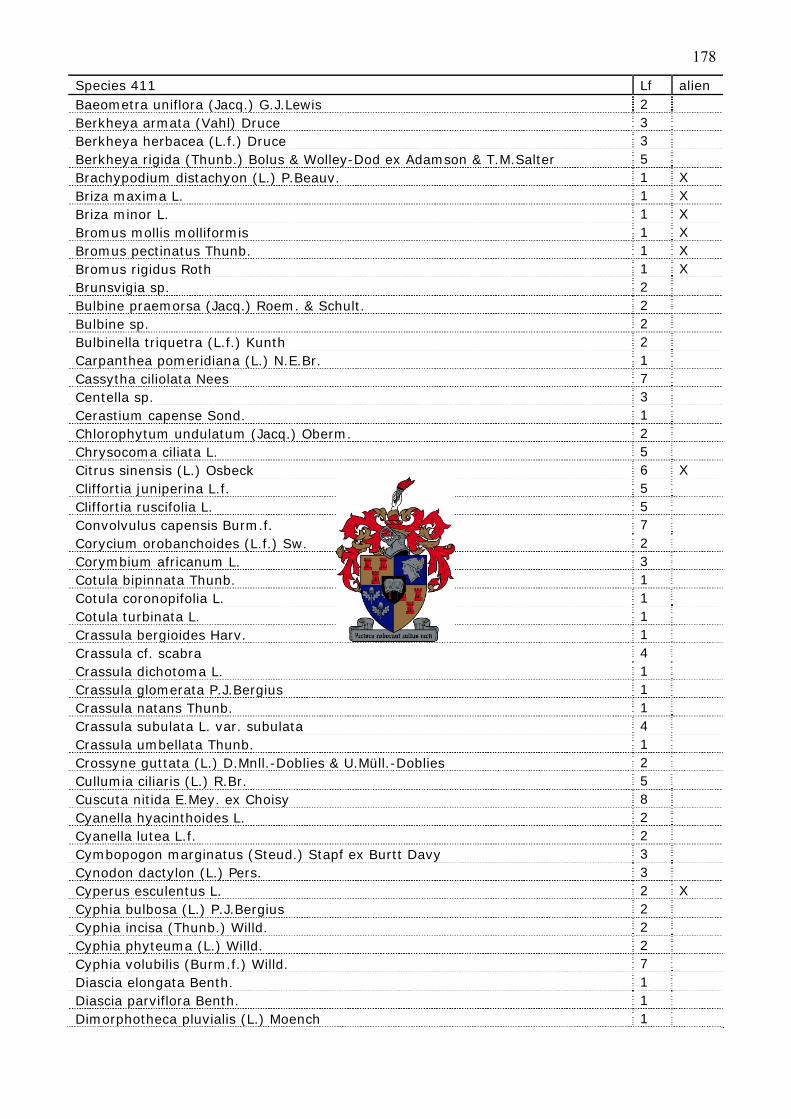
178
Species 411 Lf alien Baeometra uniflora (Jacq.) G.J.Lewis 2 Berkheya armata (Vahl) Druce 3 Berkheya herbacea (L.f.) Druce 3 Berkheya rigida (Thunb.) Bolus & Wolley-Dod ex Adamson & T.M.Salter 5 Brachypodium distachyon (L.) P.Beauv. 1 X Briza maxima L. 1 X Briza minor L. 1 X Bromus mollis molliformis 1 X Bromus pectinatus Thunb. 1 X Bromus rigidus Roth 1 X Brunsvigia sp. 2 Bulbine praemorsa (Jacq.) Roem. & Schult. 2 Bulbine sp. 2 Bulbinella triquetra (L.f.) Kunth 2 Carpanthea pomeridiana (L.) N.E.Br. 1 Cassytha ciliolata Nees 7 Centella sp. 3 Cerastium capense Sond. 1 Chlorophytum undulatum (Jacq.) Oberm. 2 Chrysocoma ciliata L. 5 Citrus sinensis (L.) Osbeck 6 X Cliffortia juniperina L.f. 5 Cliffortia ruscifolia L. 5 Convolvulus capensis Burm.f. 7 Corycium orobanchoides (L.f.) Sw. 2 Corymbium africanum L. 3 Cotula bipinnata Thunb. 1 Cotula coronopifolia L. 1 Cotula turbinata L. 1 Crassula bergioides Harv. 1 Crassula cf. scabra 4 Crassula dichotoma L. 1 Crassula glomerata P.J.Bergius 1 Crassula natans Thunb. 1 Crassula subulata L. var. subulata 4 Crassula umbellata Thunb. 1 Crossyne guttata (L.) D.Mnll.-Doblies & U.Müll.-Doblies 2 Cullumia ciliaris (L.) R.Br. 5 Cuscuta nitida E.Mey. ex Choisy 8 Cyanella hyacinthoides L. 2 Cyanella lutea L.f. 2 Cymbopogon marginatus (Steud.) Stapf ex Burtt Davy 3 Cynodon dactylon (L.) Pers. 3 Cyperus esculentus L. 2 X Cyphia bulbosa (L.) P.J.Bergius 2 Cyphia incisa (Thunb.) Willd. 2 Cyphia phyteuma (L.) Willd. 2 Cyphia volubilis (Burm.f.) Willd. 7 Diascia elongata Benth. 1 Diascia parviflora Benth. 1 Dimorphotheca pluvialis (L.) Moench 1
179
Species 411 Lf alien Diosma pedicellata I.Williams 5 Diospyros glabra (L.) De Winter 5 Dipcadi brevifolium (Thunb.) Fourc. 2 Disa bracteata Sw. 2 Dischisma capitatum (Thunb.) Choisy 1 Disperis villosa (L.f.) Sw. 2 Dorotheanthus bellidiformis (Burm.f.) N.E.Br. 1 Drimia exuviata (Jacq.) Jessop 2 Drimia physodes (Jacq.) Jessop 2 Drimia sp. 2 Drosanthemum salicola L.Bolus 4 Drosera alba E.Phillips 2 Drosera cistiflora L. 2 Drosera pauciflora Banks ex DC. 2 Drosera sp. 2 Drosera trinervia Spreng. 2 Echiostachys incanus (Thunb.) Levyns 3 Echium plantagineum L. 3 X Ehrharta calycina Sm. 3 Ehrharta capensis Thunb. 3 Ehrharta longifolia Schrad. 3 Elegia filacea Mast. 3 Elegia sp. 3 Eleocharis limosa (Schrad.) Schult. 3 Elytropappus rhinocerotis (L.f.) Less. 5 Emex australis Steinh. 1 Empodium plicatum (Thunb.) Garside 2 Eragrostis curvula (Schrad.) Nees 3 Erepsia patula (Haw.) Schwantes 4 Erepsia sp. 4 Erica coarctata J.C.Wendl. 5 Erica inaequalis (Klotzch) E.G.H.Oliv. 4 Erica paniculata L. 5 Eriocephalus africanus L. 5 Eriospermum capense (L.) Thunb. 2 Eriospermum sp. 2 Erodium botrys (Cav.) Bertol. 1 X Erodium moschatum (L.) L'HTr. 1 X Eucalyptus cladocalyx F.J.Müll. 6 X Euclea acutifolia E.Mey. ex A.DC. 5 Euphorbia tuberosa L. 2 Felicia bergerana (Spreng.) O.Hoffm. 1 Felicia tenella (L.) Nees 1 Festuca scabra Vahl 3 Ficinia indica (Lam.) Pfeiff. 3 Ficinia oligantha (Steud.) J.Raynal 3 Ficinia sp. 3 Galenia africana L. 5 Galenia ecklonis Walp. 4 Gastridium phleoides (Nees & Meyen) C.E.Hubb. 1 X Gazania serrata DC. 3
180
Species 411 Lf alien Geissorhiza aspera Goldblatt 2 Geissorhiza juncea (Link) A.Dietr. 2 Geranium dissectum L. 1 X Geranium molle L. 1 X Gerbera crocea (L.) Kuntze 3 Gethyllis afra L. 2 Gibbaria ilicifolia (L.) Norl. 4 Gladiolus alatus L. 2 Gladiolus hyalinus 2 Gladiolus watsonius Thunb. 2 Gnidia cf. oppositifolia 4 Gnidia laxa (L.f.) Gilg 5 Gorteria personata L. 1 Hebenstretia ramosissima Jaroscz 1 Helichrysum asperum (Thunb.) Hilliard & B.L.Burtt 4 Helichrysum cylindriflorum (L.) Hilliard & B.L.Burtt 1 Helichrysum dasyanthum (Willd.) Sweet 4 Helichrysum indicum (L.) Grierson 1 Helichrysum patulum (L.) D.Don 4 Helichrysum sp. 5 Helichrysum teretifolium (L.) D.Don 5 Heliophila pusilla L.f. var. macrosperma Marais 1 Heliophila sp. 1 Helminthotheca echioides L. 1 X Hemimeris racemosa (Houtt.) Merr. 1 Hermannia alnifolia L. 5 Hermannia cuneifolia Jacq. 5 Hermannia scabra Cav. 5 Hesperantha falcata (L.f.) Ker Gawl. 2 Hesperantha pilosa (L.f.) Ker Gawl. 2 Hesperantha radiata (Jacq.) Ker Gawl. 2 Heteropogon contortus (L.) Roem. & Schult. 3 Holothrix villosa Lindl. 2 Hordeum vulgare L. 1 Hyparrhenia hirta (L.) Stapf 3 Hypochaeris radicata L. 3 X Hypodiscus sp. 3 Indigofera psoraloides (L.) L. 4 Ischyrolepis capensis (L.) H.P.Linder 3 Ischyrolepis gaudichaudiana (Kunth) H.P.Linder 3 Isolepis hystrix (Thunb.) Nees 1 Isolepis verrucosula (Steud.) Nees 1 Itasina filifolia (Thunb.) Raf. 3 Ixia lutea Eckl. 2 Ixia sp. 2 Juncus bufonius L. 1 X Juncus cephalotes Thunb. 1 Lachenalia contaminata Aiton 2 Lachenalia corymbosa (L.) J.C.Manning & Goldblatt * 2 Lachenalia longibracteata E.Phillips 2 Lachenalia orchioides (L.) Aiton 2

181
Species 411 Lf alien Lachenalia pallida Aiton 2 Lachenalia polyphylla Baker 2 Lachenalia sp. 2 Lachenalia unifolia Jacq. 2 Lachnaea eriocephala L. 4 Lampranthus aduncus (Haw.) N.E.Br. 4 Lampranthus dilutus N.E.Br. 4 Lampranthus elegans (Jacq.) Schwantes 4 Lampranthus filicaulis (Haw.) N.E.Br. 4 Lampranthus leptaleon (Haw.) N.E.Br. 4 Lampranthus peacockiae (L.Bolus) L.Bolus 4 Lampranthus scaber (L.) N.E.Br. 4 Lampranthus sp. 4 Lampranthus spiniformis (Haw.) N.E.Br. 4 Lampranthus tegens (F.Muell.) N.E.Br. 4 Lapeirousia azurea (Eckl. ex Baker) Goldblatt 2 Lessertia capensis (P.J.Bergius) Druce 4 Leucadendron corymbosum P.J.Bergius 5 Leucadendron lanigerum H.Buek ex Meisn. var. lanigerum 5 Leysera gnaphalodes (L.) L. 4 Linum acuticarpum Rogers 4 Lobelia erinus L. 1 Lobostemon argenteus (P.J.Bergius) H.Buek 5 Lobostemon capitatus (L.) H.Buek 4 Lobostemon fruticosus (L.) H.Buek 5 Lolium perenne L. 3 X Lotononis prostrata (L.) Benth. 4 Lotus sp. 1 X Manulea pusilla E.Mey. ex Benth. 1 Medicago sativa L. 1 X Melinis repens (Willd.) Zizka 3 Merciera eckloniana H.Buek. Ex Eckl. & Zeyh. * 1 Merxmuellera stricta (Schrad.) Conert 3 Metalasia cf. octoflora 5 Metalasia dregeana DC. 5 Micranthus alopecuroides (L.) Rothm. 2 Micranthus tubulosus (Burm.) N.E.Br. 2 Microcodon glomeratum A.DC. 3 Microcodon sp. 1 Mohria caffrorum (L.) Desv. 3 Monopsis debilis (L.f.) C.Presl 1 Monopsis variifolia (Sims) Urb. 1 Monsonia speciosa L. 3 Montinia caryophyllacea Thunb. 5 Moraea flaccida (Sweet) Steud. 2 Moraea fugacissima (L.f.) Goldblatt 2 Moraea fugax (D.Delaroche) Jacq. 2 Moraea galaxia (L.f.) Goldblatt 2 Moraea gawleri Spreng. 2 Moraea lewisiae (Goldblatt) Goldblatt 2 Moraea lugubris (Salisb.) Goldblatt 2
182
Species 411 Lf alien Moraea minor Eckl. 2 Moraea papilionacea (L.f.) Ker Gawl. 2 Moraea sp. 2 Moraea umbellata Thunb. 2 Moraea versicolor (Salisb. ex Klatt) Goldblatt 2 Moraea villosa (Ker Gawl.) Ker Gawl. ssp. villosa 2 Moraea viscaria (L.f.) Ker Gawl. 2 Muraltia ericaefolia DC. 5 Muraltia ericoides (Burm.f.) Steud. 4 Muraltia heisteria (L.) DC. 5 Muraltia trinervia (L.f.) DC. 4 Nemesia barbata (Thunb.) Benth. 1 Nemesia versicolor E.Mey. ex Benth. 1 Nenax hirta (Cruse) Salter ssp. hirta 5 Olea europaea L. ssp. africana (Mill.) P.S.Green 6 Onixotis punctata (L.) Mabb. 2 Ornithogalum hispidum Hornem. 2 Ornithogalum juncifolium Jacq. 2 Ornithogalum sp. 2 Ornithogalum suaveolens Jacq. 2 Ornithogalum thyrsoides Jacq. 2 Osteospermum cf. spinosum 5 Otholobium decumbens (Aiton) C.H.Stirt. 4 Otholobium hirtum (L.) C.H.Stirt. 5 Otholobium uncinatum (Eckl. & Zeyh.) C.H.Stirt. 5 Othonna heterophylla L.f. 3 Othonna pinnata L.f. 4 Othonna sp. 4 Oxalis adspersa Eckl. & Zeyh. 2 Oxalis commutata Sond. 2 Oxalis flava L. 2 Oxalis glabra Thunb. 2 Oxalis hirta L. 2 Oxalis livida Jacq. 2 Oxalis monophylla L. 2 Oxalis natans 2 Oxalis obtusa Jacq. 2 Oxalis pes-caprae L. 2 Oxalis pes-caprae L. var. sericea (L.f.) Salter 2 Oxalis polyphylla Jacq. 2 Oxalis purpurea L. 2 Oxalis tomentosa L.f. 2 Oxalis versicolor L. 2 Passerina truncata subsp. truncata (Meisn.) Bredenkamp & B.E.van Wyk 5 Pelargonium chamaedryfolium Jacq. 1 Pelargonium lobatum (Burm.f.) L'Hér. 2 Pelargonium myrrhifolium (L.) L'Hér. 4 Pelargonium pinnatum (L.) L'Hér. 2 Pelargonium sp. 2 Pelargonium triste (L.) L'Hér. 2 Pennisetum clandestinum Chiov. 3 X
183
Species 411 Lf alien Pennisetum macrourum Trin. 3 Pentachistis sp. 1 Pentaschistis airoides (Nees) Stapf subsp. airoides 3/1
Pentaschistis curvifolia (Schrad.) Stapf 3 Petrorhagia prolifera (L.) Ball & Heywood 1 X Phalaris minor Retz. 1 X Pharnaceum cf. lineare 4 Phylica ericoides L. 5 Phylica plumosa L. var. horizontalis (Vent.) Sond. 5 Phylica sp. 5 Phylica strigulosa Sond. 4 Phyllopodium cordatum (Thunb.) Hilliard 1 Plantago cafra Decne. 1 Plantago coronopus L. 1 X Poa annua L. 1 X Polpoda stipulacea (Leight.) Adamson 4 Polycarena gilioides Benth. 1 Polycarpon tetraphyllum L.f. 1 X Polygala scabra L. 4 Polygonum aviculare L. 1 X Prionanthium pholiuroides Stapf 1 Pterygodium alatum (Thunb.) Sw. 2 Pterygodium catholicum (L.) Sw. 2 Pterygodium volucris (L.f.) Sw. 2 Pycreus nitidus (Lam.) J.Raynal 3 Relhania fruticosa (L.) K.Bremer 5 Restio sp. 3 Rhus lucida L. 5 Rhus rosmarinifolia Vahl 5 Romulea cruciata (Jacq.) Baker 2 Romulea flava (Lam.) M.P.de Vos 2 Romulea hirsuta (Eckl. ex Klatt) Baker 2 Romulea rosea (L.) Eckl. 2 Romulea sp. 2 Rostraria cristata (L.) Tzvelev 1 X Rumex cordatus Poir. 2 Rumex crispus L. 3 X Salvia chamelaeagnea P.J.Bergius 5 Satyrium cf. bicorne 2 Satyrium erectum Sw. 2 Schizoglossum cordifolium E.Mey. 2 Schoenoxiphium ecklonii Nees 3 Sebaea albens (L.f.) Roem. & Schult. 1 Sebaea exacoides (L.) Schinz 1 Selago fruticosa L. 5 Senecio arenarius Thunb. 1 Senecio littoreus Thunb. 1 Senecio paniculatus P.J.Bergius 5 Senecio pubigerus L. 5 Senecio rosmarinifolius L.f. 5 Silene gallica L. 1 X
184
Species 411 Lf alien Sonchus oleraceus L. 1 X Sparaxis grandiflora (D.Delaroche) Ker Gawl. 2 Sparaxis villosa (Burm.f.) Goldblatt 2 Spergula arvensis L. 1 X Spergularia sp. 1 X Spiloxene capensis (L.) Garside 2 Spiloxene flaccida (Nel) Garside 2 Spiloxene serrata (Thunb.) Garside 2 Spiloxene sp. 2 Staberoha distachyos (Rottb.) Kunth 3 Stipagrostis zeyheri (Nees) De Winter ssp. zeyheri 3 Stoebe cinerea (L.) Thunb. 5 Stoebe fusca (L.) Thunb. 5 Stoebe plumosa (L.) Thunb. 5 Stoebe spiralis Less. 5 Strumaria tenella (L.f.) Snijman 2 Struthiola leptantha Bolus 5 Sutera uncinata (Desr.) Hilliard 5 Tetragonia portulacoides Fenzl 3 Tetraria bolusii C.B.Clarke 3 Thamnochortus bachmannii Mast. 3 Thamnochortus sp. 3 Themeda triandra Forssk. 3 Thesium funale L. 8 Thesium sp. 8 Thesium strictum P.J.Bergius 8 Torilis arvensis (Huds.) Link 1 X Trachyandra chlamydophylla 2 Trachyandra flexifolia (L.f.) Kunth 2 Trachyandra hirsutiflora (Adamson) Oberm. 2 Trachyandra hispida (L.) Kunth 2 Trachyandra muricata (L.f.) Kunth 2 Trachyandra paniculata Oberm. 2 Trachyandra revoluta (L.) Kunth 2 Trachyandra sp. 2 Tribolium acutiflorum (Nees) Renvoize 1 Tribolium echinatum (Thunb.) Renvoize 1 Tribolium hispidum (Thunb.) Desv. 3 Tribolium uniolae (L.f.) Renvoize 3 Trifolium angustifolium L. 1 X Trifolium repens L. 3 X Trifolium sp. 1 X Triglochin bulbosa L. 2 Tritonia crispa (L.f.) Ker Gawl. 2 Ursinia anthemoides (L.) Poir. 1 Vellereophyton dealbatum (Thunb.) Hilliard & B.L.Burtt 1 Vicia sativa L. 1 X Vulpia cf. bromoides 1 X Vulpia myuros (L.) C.C.Gmel. 1 X Wachendorfia cf. parviflora 2 Wachendorfia paniculata 2
185
Species 411 Lf alien Wahlenbergia capensis (L.) A.DC. 1 Wahlenbergia sp. 4 Wahlenbergia subulata (L'Hér.) Lammers 4 Watsonia dubia Eckl. ex Klatt 2 Wurmbea inusta (Baker) B.Nord. 2 Wurmbea recurva B.Nord. 2 Zaluzianskya divaricata Walp. 1 Zaluzianskya sp. 1 Zygophyllum sessilifolium L. 4
References Barkman JJ, Doing H, Segal S (1964) Kritische Bemerkungen und Vorschläge zur quantitativen
Vegetationsanalyse. Acta Botanica Neerlandica 13: 394-419
Becker CF (1996) Elandsberg Private Nature Reserve, Book 1. Cape Technikon Nature
Conservation Experiential training, Cape Town
Goldblatt P, Manning JC, Snijman D (2005) Cape plants: corrections and additions to the flora. 1.
Bothalia 35: 35-46
Related Documents