1 VCE Physics Guide to Reporting on Practical Work Carrying out practical work is an opportunity to practice and explore the seven key science inquiry skills listed in the VCE Physics Study Design (VCAA, p11); namely to • develop aims and questions, formulate hypotheses and make predictions, • plan and undertake investigations, • comply with safety and ethical guidelines, • conduct investigations to collect and record data, • analyse and evaluate data, methods and scientific models, • draw evidence-based conclusions, • and communicate and explain scientific ideas When you write a report and/or poster, you show your mastery of science inquiry skills. An effective report clearly explains what was done, why it was done, what was found and the meaning and significance of the outcome. Your report or poster should have the following sections (VCAA, p13): 1. Title 2. Introduction 3. Methodology 4. Record of results 5. Discussion 6. Conclusion 7. References and acknowledgements

Welcome message from author
This document is posted to help you gain knowledge. Please leave a comment to let me know what you think about it! Share it to your friends and learn new things together.
Transcript

1
VCE Physics Guide to Reporting on Practical Work Carrying out practical work is an opportunity to practice and explore the seven key science
inquiry skills listed in the VCE Physics Study Design (VCAA, p11); namely to
• develop aims and questions, formulate hypotheses and make predictions,
• plan and undertake investigations,
• comply with safety and ethical guidelines,
• conduct investigations to collect and record data,
• analyse and evaluate data, methods and scientific models,
• draw evidence-based conclusions,
• and communicate and explain scientific ideas
When you write a report and/or poster, you show your mastery of science inquiry skills.
An effective report clearly explains what was done, why it was done, what was found and the
meaning and significance of the outcome. Your report or poster should have the following
sections (VCAA, p13):
1. Title
2. Introduction
3. Methodology
4. Record of results
5. Discussion
6. Conclusion
7. References and acknowledgements

2
1. Title Includes: title of experiment (must be in the form of a question), author’s name, group members’ names and when and
where the activity was carried out.
Key science skill (VCAA, 2016)
• use appropriate physics terminology, representations and conventions
Example
Title: How does light bulb brightness depend on current? by James Fevola
Partners: Leroy Brown and Jacinta Macintosh
Date: 15 February 2017, Kew High School
Link to rubric – Communicating: reporting conventions
2. Introduction Includes: aim and hypothesis, background information, variables
Key science skill (VCAA, 2016)
• determine aim and hypothesis, questions and predictions that can be tested
• identify independent, dependent and controlled variables
• acknowledge sources of information and use standard scientific referencing conventions
2.1 Aim and Hypothesis Practical work in physics is carried out to observe and/or measure how changing one physical quantity affects another
physical quantity.
The aim is a clear statement of the purpose of the practical work in terms of the physical quantities that are being
investigated.
Example
Aim: To observe the effect of changing the potential difference across a light bulb on the brightness of the bulb.
The aim is often accompanied by a hypothesis that makes a prediction about the outcome of the experiment and is
expressed as “If ….. then …..because ….”.
Example
Hypothesis: If the potential difference across the light bulb is increased, then the bulb should get brighter because more
energy is being transferred to the light bulb.
The aim and hypothesis can be put into context by providing relevant background information.
Link to rubric – Questioning and Predicting: Aim/Hypothesis

3
2.2 Background Information and Referencing The more background knowledge that you have, the more informed your hypothesis.
Sources of background information need to be acknowledged. This is done by referring to the reference source in the text
in an abbreviated way, known as “inline citation”. The full details of the source of information are given in the list of
references at the end of the report. The American Psychological Association (APA) style is preferred for citing and
referencing in Science at Kew High School. Details on how to format the inline citations and references for different types
of reference sources such as books, magazines and web pages can be found at https://libraryguides.vu.edu.au/apa-
referencing/getting-started-in-apa-referencing.
Example
Inline citation:
Light globes are an example of a non-ohmic device (Wikipedia, 2019).
Full details in list of references at end of report:
Wikipedia. (2019, Jan). Incandescent Light Bulb. Retrieved from Wikipedia:
https://en.wikipedia.org/wiki/Incandescent_light_bulb
Link to rubric – Questioning and Predicting: Background Information
2.3 Variables Anything that has a value that might affect your experiment is a variable.
The physical quantity that you are measuring is called the dependent variable.
The physical quantity that you are changing, in order to see how it affects the dependent variable is called the
independent variable.
Ideally, the values of all the other variables in your experiment should be controlled, so that the only change affecting the
dependent variable is the change in the independent variable. You should identify the controlled variable and the method
of control, if relevant.
Sometimes there will be variables that you will attempt to keep constant during the experiment which might affect your
experiment, but which you don’t have control over, such as the temperature of the room. Such variables are called
uncontrolled variables.
Example
Independent variable: potential difference across light globe, V (V)
Dependent variable: brightness of light, I (lumens)
Controlled variable: length of connecting wires = 0.30m
Uncontrolled variable: temperature of classroom = 25°C
Link to rubric – Questioning and Predicting: Variables

4
3. Methodology Includes: Materials and Apparatus, Method, Risk Assessment
Key science skill (VCAA, 2016)
• determine appropriate type of investigation: conduct experiments;
• select and use equipment, materials and procedures appropriate to the investigation, taking into account potential
sources of error and uncertainty
• apply ethical principles when undertaking and reporting investigations
• apply relevant occupational health and safety guidelines while undertaking practical investigations
• use appropriate physics terminology, representations and conventions, including standard abbreviations, graphing
conventions and units of measurement
3.1 Materials and Apparatus Your report should include a list of all equipment and materials that you used when conducting the experiment and a
labelled, schematic block diagram of the equipment set up. The list needs to include enough detail for the experiment to
be able to be carried out by someone else. A schematic block diagram represents items of equipment by simple geometric
shapes and the connections between pieces of equipment by straight lines. A photograph is a useful accompaniment to a
block diagram, but does not replace one. Your diagram should take at least 1/3 of a page so that all labels can be clearly
read.
Example
Apparatus: 12 V incandescent light globe, 1000 Ω variable resistor, 12 V DC power supply, voltmeter, ammeter, Digital light
intensity meter, 4 connecting wires
Link to rubric – Planning and Conducting: Materials and Apparatus
Figure 1: Schematic Block Diagram of Circuit
Light
intensity
meter
5
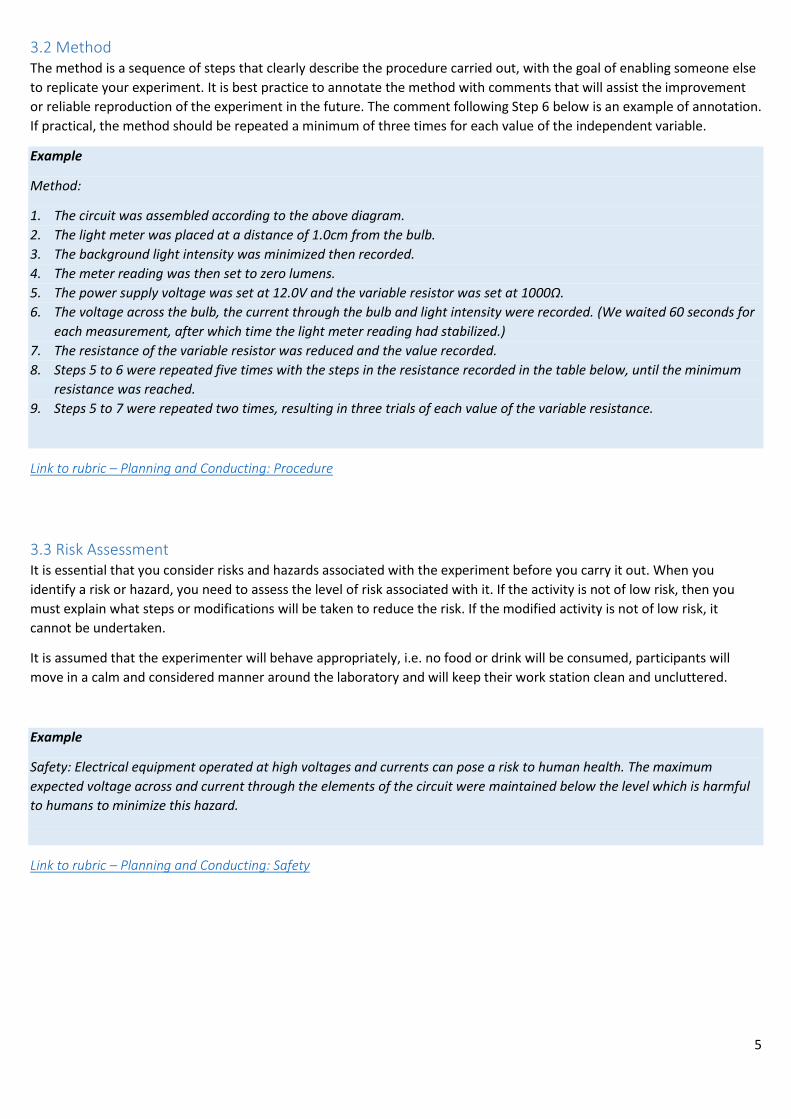
3.2 Method The method is a sequence of steps that clearly describe the procedure carried out, with the goal of enabling someone else
to replicate your experiment. It is best practice to annotate the method with comments that will assist the improvement
or reliable reproduction of the experiment in the future. The comment following Step 6 below is an example of annotation.
If practical, the method should be repeated a minimum of three times for each value of the independent variable.
Example
Method:
1. The circuit was assembled according to the above diagram.
2. The light meter was placed at a distance of 1.0cm from the bulb.
3. The background light intensity was minimized then recorded.
4. The meter reading was then set to zero lumens.
5. The power supply voltage was set at 12.0V and the variable resistor was set at 1000Ω.
6. The voltage across the bulb, the current through the bulb and light intensity were recorded. (We waited 60 seconds for
each measurement, after which time the light meter reading had stabilized.)
7. The resistance of the variable resistor was reduced and the value recorded.
8. Steps 5 to 6 were repeated five times with the steps in the resistance recorded in the table below, until the minimum
resistance was reached.
9. Steps 5 to 7 were repeated two times, resulting in three trials of each value of the variable resistance.
Link to rubric – Planning and Conducting: Procedure
3.3 Risk Assessment It is essential that you consider risks and hazards associated with the experiment before you carry it out. When you
identify a risk or hazard, you need to assess the level of risk associated with it. If the activity is not of low risk, then you
must explain what steps or modifications will be taken to reduce the risk. If the modified activity is not of low risk, it
cannot be undertaken.
It is assumed that the experimenter will behave appropriately, i.e. no food or drink will be consumed, participants will
move in a calm and considered manner around the laboratory and will keep their work station clean and uncluttered.
Example
Safety: Electrical equipment operated at high voltages and currents can pose a risk to human health. The maximum
expected voltage across and current through the elements of the circuit were maintained below the level which is harmful
to humans to minimize this hazard.
Link to rubric – Planning and Conducting: Safety

6
4. Results Includes: Recording Qualitative Data, Recording Quantitative Data
Science Inquiry skill (VCAA, 2016):
• systematically generate, collect, record and summarise both qualitative and quantitative data
• use appropriate physics terminology, representations and conventions, including standard abbreviations, graphing
conventions and units of measurement
4.1 Observations Recording observations as you carry out your experiment is a key aspect of practical work. Observations can be
• notes jotted down next to your procedure as you carry it out,
• a sketch of a change in appearance of a material that you are using
• a note of a change in equipment or material or data as the experiment proceeds.
Your observations can play a key role in helping you interpret your results.
Example
We found the radiant heat from the light globe became quite noticeable for voltages above 10V and that the current and
voltage readings were less stable.
Link to rubric – Recording: Qualitative data
4.2 Quantitative Data
Measurements All raw measurements should be recorded in your logbook.
Your measurement needs to include all of the digits that you are able to read and, in the case of an analogue meter,
estimate, as well as the unit of measurement.
There is a standard symbol to represent most physical quantities and there is an associated unit of measurement, which
can also be abbreviated by a symbol. For example, when measuring the current in the circuit, the symbol for current is “I”
and the corresponding unit of measurement is the ampere, abbreviated by “A”. A list of standard abbreviations for
physical quantities and their measurement units is given at the end of this document in Appendix B.
Any measurement you make is ultimately limited by the precision of the instrument. You should record the range of values
that are included by your measurement. This range is called the measurement uncertainty. At a secondary school level,
the accepted value of the measurement uncertainty for an instrument where the reading stays steady, such as illustrated
by the above ammeters, is half of the smallest increment on the scale.
Example
Current measured by analogue meter, IA = (3.0 ± 0.1) A
Current measured by digital meter, ID = (5.000 ± 0.005) A
Link to rubric – Recording: Quantitative data

7
Data Tables Data should be recorded in a labelled table with ruled columns. The names of measured quantities and their units should
be included in the header row. If the measurements are stable, and the measurement uncertainty is the same for all
readings, then the uncertainty can also be included in the header.
Note that the uncertainty is only expressed to 1 significant figure and that the decimal place value of the final significant
figure in the average value should match the decile place of the uncertainty.
Example
Data for brightness versus voltage measurement
Variable
Resistor
Setting
(Ω)
(±0.1Ω)
Voltage
across
globe
(V)
(±0.05
V)
Trial 1
Lamp
Brightness
(lumens)
(±0.1 lumens)
Trial 2
Lamp
Brightness
(lumens)
(±0.1 lumens)
Trial 3
Lamp
Brightness
(lumens)
(±0.1 lumens)
50.0 3.00 100.0 100.0 100.0
10.0 10.00 200.0 210.0 220.0
Link to rubric – Recording: Quantitative data
8
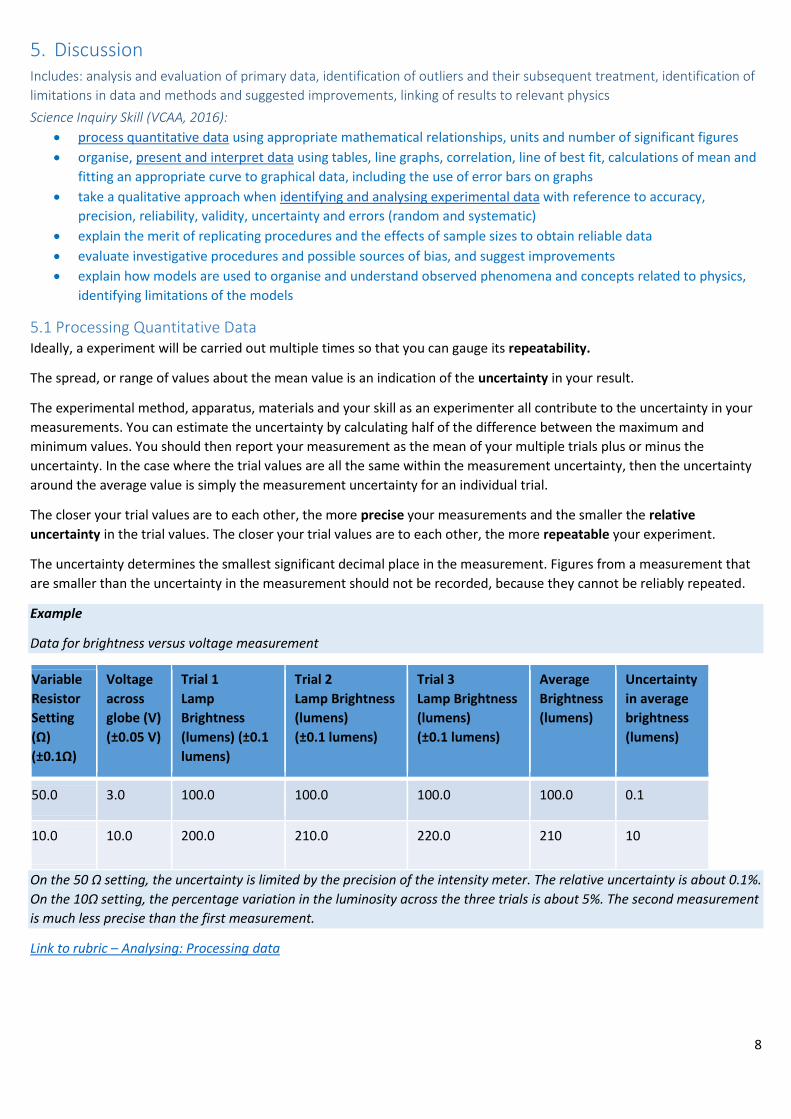
5. Discussion Includes: analysis and evaluation of primary data, identification of outliers and their subsequent treatment, identification of
limitations in data and methods and suggested improvements, linking of results to relevant physics
Science Inquiry Skill (VCAA, 2016):
• process quantitative data using appropriate mathematical relationships, units and number of significant figures
• organise, present and interpret data using tables, line graphs, correlation, line of best fit, calculations of mean and
fitting an appropriate curve to graphical data, including the use of error bars on graphs
• take a qualitative approach when identifying and analysing experimental data with reference to accuracy,
precision, reliability, validity, uncertainty and errors (random and systematic)
• explain the merit of replicating procedures and the effects of sample sizes to obtain reliable data
• evaluate investigative procedures and possible sources of bias, and suggest improvements
• explain how models are used to organise and understand observed phenomena and concepts related to physics,
identifying limitations of the models
5.1 Processing Quantitative Data Ideally, a experiment will be carried out multiple times so that you can gauge its repeatability.
The spread, or range of values about the mean value is an indication of the uncertainty in your result.
The experimental method, apparatus, materials and your skill as an experimenter all contribute to the uncertainty in your
measurements. You can estimate the uncertainty by calculating half of the difference between the maximum and
minimum values. You should then report your measurement as the mean of your multiple trials plus or minus the
uncertainty. In the case where the trial values are all the same within the measurement uncertainty, then the uncertainty
around the average value is simply the measurement uncertainty for an individual trial.
The closer your trial values are to each other, the more precise your measurements and the smaller the relative
uncertainty in the trial values. The closer your trial values are to each other, the more repeatable your experiment.
The uncertainty determines the smallest significant decimal place in the measurement. Figures from a measurement that
are smaller than the uncertainty in the measurement should not be recorded, because they cannot be reliably repeated.
Example
Data for brightness versus voltage measurement
Variable
Resistor
Setting
(Ω)
(±0.1Ω)
Voltage
across
globe (V)
(±0.05 V)
Trial 1
Lamp
Brightness
(lumens) (±0.1
lumens)
Trial 2
Lamp Brightness
(lumens)
(±0.1 lumens)
Trial 3
Lamp Brightness
(lumens)
(±0.1 lumens)
Average
Brightness
(lumens)
Uncertainty
in average
brightness
(lumens)
50.0 3.0 100.0 100.0 100.0 100.0 0.1
10.0 10.0 200.0 210.0 220.0 210 10
On the 50 Ω setting, the uncertainty is limited by the precision of the intensity meter. The relative uncertainty is about 0.1%.
On the 10Ω setting, the percentage variation in the luminosity across the three trials is about 5%. The second measurement
is much less precise than the first measurement.
Link to rubric – Analysing: Processing data

9
5.2 Graphing Data A graph visually assists with finding patterns and trends in data.
You will almost always have bivariate data and want to plot a “scatter” or “x-y” graph. When plotting
• give your graph a title
• the independent variable goes on the horizontal axis
• the dependent variable goes on the vertical axis
• choose a scale where each grid line is a multiple of 1, 2 or 5, so that points can easily be read from your graph,
without reference to a table of values.
• include (0,0) in your graph
• use at least half a page so that you can plot accurately (if plotting by hand) and your graph is easy to read
• each axis needs a label and a measurement unit
• plot the uncertainty bars for each data point, both independent and dependent, if visible on the scale of the graph
• do not include a line that “joins” the dots
• do include a line of best fit or “trendline”, the simplest smoothly varying function that passes through your
uncertainty bars (often called “error bars”) that is consistent with a physical model of the system
• include a mathematical statement summarising the trend indicated by the graph in terms of the dependent and
independent variables.
Example
Students investigate how the current through the light globe depends upon the potential difference across the globe.
If a material is Ohmic, the current is expected to be directly proportional to the potential difference across the globe.
Two possible trendlines have been drawn for this data. The blue dotted line is a linear trendline, which suggests that the
increase in current through the light globe is proportional to the potential difference or voltage drop across the globe. The
orange dashed line is a power relationship and simply suggests that the current increases as the voltage increases, however
the amount by which it increases is getting smaller as the voltage increases.
The trendline describes how the dependent variable is affected by the independent variable. Your aim is to compare the
observed behaviour with any model that you might have of how it would be expected to behave and/or give a plausible
physical explanation for the observed behaviour. Interpreting the physical implications of the vertical intercept and
gradient of the trendline is discussed in the next section.
I = 14.8 V + 58.5 I = 52 V0.60
0
50
100
150
200
250
0.00 2.00 4.00 6.00 8.00 10.00 12.00 14.00
Cu
rren
t, I
(mA
)
Voltage, V (V)
IV Characteristic for Incandescent globe

10
5.3 Deriving physical quantities from data Sometimes you will put your measured data into a mathematical equation and calculate the value of a physical quantity.
This is called a derived value.
The vertical intercept and gradient of a trendline are also important derived physical values.
When you carry out a calculation, you need to include the details in your logbook, and a sample calculation.
You need to justify the exclusion of any data points that you do not wish to include in your calculation.
The uncertainty in your measured value will cause there to be uncertainty in your derived value.
Link to rubric – Analysing: Derived Physical Values
Uncertainty in a value derived from a sum or difference of measured values
If the derived value is the sum or difference of two measured values, then the uncertainty in the derived value is the sum
of the individual uncertainty in each measured value.
Example
A circuit was constructed using three fixed resistors. The student measured the resistances using an ohmmeter, but had to
change scale on the digital meter. The measured values were:
Resistor Label (Ω)
Uncertainty (Ω)
R1 300 ±0.5
R2 50.0 ±0.05
R3 250 ±0.5
The expected total resistance of a circuit constructed in series from the three resistors is (R1 + R2 + R3 ) = (300 + 50.0 + 250)
±(0.5 + 0.05 + 0.5) Ω = 600.0 ± 1.05 Ω = (6.00 ±0.01 )×102 Ω. The uncertainty is only quoted to one significant figure, which
is why 1.05 has been rounded to 1. By writing the result in standard form, it makes the precision of the derived value very
clear. In this experiment, a person measuring the total resistance would be expected to obtain a value between 601 and
599 Ω based on the information given.
Uncertainty in more complex derived values
The simplest estimate of the uncertainty in a derived value involves considering the relative uncertainty of all of the
measurements that contribute to the value. The relative uncertainty in the derived value cannot be less than the relative
uncertainty of any of the contributing measurements. So, a simple approximation is to put the uncertainty in the derived
value equal to the largest uncertainty in the contributing measurements.
Example
A circuit was constructed using three fixed resistors. The student measured the resistances using an ohmmeter, but had to
change scale on the digital meter. The measured values were:
Resistor Label (Ω)
Uncertainty (Ω)
Relative Uncertainty
R1 300 ±0.5 0.17%
R2 50.0 ±0.05 0.10%
R3 250 ±0.5 0.20%
The expected average total resistance of a circuit constructed in parallel from the three resistors is 1/(1/R1 +1/ R2 + 1/R3 ) =
1/(1/300 + 1/50.0 + 1/250) = 36.59 Ω Taking the measurement uncertainties into account, the R3 has the highest relative
uncertainty (0.2%), so the uncertainty in the total circuit resistance must be at least 36.59Ω×0.0020 = 0.07.
Putting it altogether, the expected total resistance is (36.59 ±.07) Ω.

11
A slightly more sophisticated estimate of the uncertainty in a derived value is made by taking half of the difference
between the maximum value of the calculation for the given measurements and the minimum possible value of calculation
for the given measurements. This is quite a crude approach, but a sophisticated estimate of uncertainty is too technical for
high school science.
Example
A circuit was constructed using three fixed resistors. The student measured the resistances using an ohmmeter, but had to
change scale on the digital meter. The measured values were:
Resistor Label (Ω)
Uncertainty (Ω)
R1 300 ±0.5
R2 50.0 ±0.05
R3 250 ±0.5
The expected average total resistance of a circuit constructed in parallel from the three resistors is 1/(1/R1 +1/ R2 + 1/R3 ) =
1/(1/300 + 1/50.0 + 1/250) = 36.59 Ω Taking the measurement uncertainties into account, the smallest value would be
1/(1/300.5 + 1/50.05 + 1/250.5) = 36.63 Ω and the largest value would be 1/(1/299.5 + 1/49.95 + 1/249.5) = 36.54 Ω.
Putting it altogether, the expected total resistance is 36.59 ±.05 Ω.
Vertical intercept
When the value of the independent variable is zero, what is the expected value of the dependent variable?
If you expected the trendline to pass through the origin of the graph and it does not, then maybe there is a source of
systematic uncertainty in your experiment. You need to remember that the uncertainty bars on the data points will mean
that there is a range of reasonable values for both the slope and the intercept of the trendline. As a rough guide, if the
value of the intercept is less than 5% of the vertical range of a positive linear trendline, then, within uncertainty, the
trendline is assumed to pass through the origin. Alternatively, if the trendline does not have a physically reasonable
intercept, then the trendline may not be an appropriate fit to the data and another form of the trendline should be
considered.
Example
Looking at the vertical intercept for the above graph, we see that the linear trendline predicts a large current (58.5mA),
even when there is no potential difference across the globe. This indicates that a linear trendline is not the best match to
the expected physics for this experiment.
The trendline does not pass through all of the data uncertainty bars, which could indicate that there may have been
difficulty controlling all the variables in this experiment, but in this case suggests that a linear relationship is not a good
model for this situation.
Gradient
The gradient describes the rate of change of the dependent variable as the independent variable is changed. In Physics,
the gradient is often related to a particular physical property of the system. Calculating the gradient is an example of
finding a derived physical value. The unit of the gradient is the ratio of the unit of the dependent variable divided by the
independent variable and can often be related to a particular physical property of the system.
Example
The unit of the gradient of the above graph is mA/V, which is the same as 1/kΩ. This unit suggests that the gradient is
related to the reciprocal of the resistance of the light globe.

12
If the relationship between the dependent and independent variables is linear, then the value of the gradient of the line of
best fit is easy to calculate. The uncertainty bars on the data points mean that there will be a range of lines that are a good
fit to the data. You should draw a second line – the steepest line that is still consistent with your data. The difference
between the gradient of the second line and the line of best fit will give you an indication of the uncertainty in the gradient
of your trendline.
Example
Students investigate how the current through a standard resistor depends upon the potential difference across the resistor,
obtaining the data graphed below. If a material is ohmic, the current through the resistor is expected to be directly
proportional to the potential difference across the resistor.
The line of best fit indicates that the current through the resistor is directly proportional to the voltage across the resistor.
This means that the resistor is an Ohmic material. The value of the resistance is the inverse of the gradient of the above
trendline = 1/(4.0mA/V) = 250 Ω. We can determine the appropriate number of significant figures for this value by
estimating its uncertainty.
The orange line is the steepest line that still passes through all of the uncertainty bars on the data points. The inverse of the
gradient of this line is (14 – 2)V/(60 – 10)mA = 240 Ω
Putting the two together we find that the value of the standard resistance in this situation is (2.5 ± 0.1)×102 Ω.
Link to rubric – Analysing: Derived Physical Values
I = 4.0 VR² = 0.99
0.0
10.0
20.0
30.0
40.0
50.0
60.0
0.0 2.0 4.0 6.0 8.0 10.0 12.0 14.0 16.0
Cu
rren
t, I
(mA
)
Voltage, V (V)
IV Characteristic for resistor
13
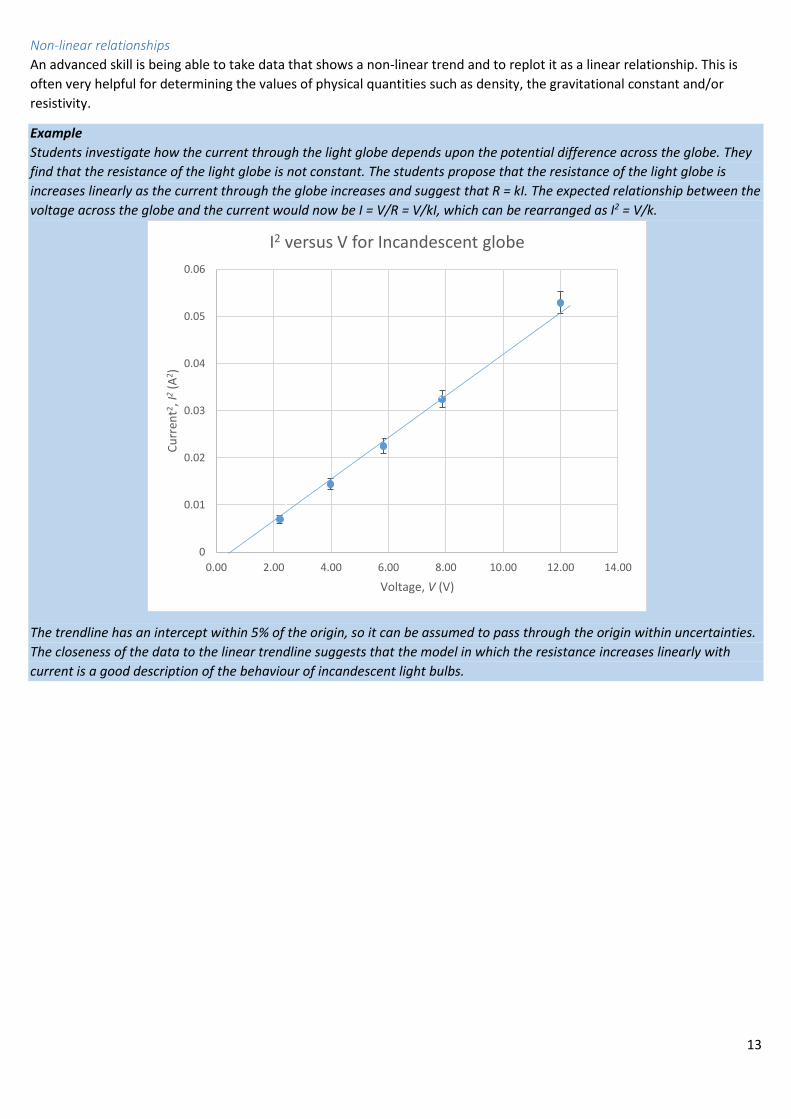
Non-linear relationships
An advanced skill is being able to take data that shows a non-linear trend and to replot it as a linear relationship. This is
often very helpful for determining the values of physical quantities such as density, the gravitational constant and/or
resistivity.
Example
Students investigate how the current through the light globe depends upon the potential difference across the globe. They
find that the resistance of the light globe is not constant. The students propose that the resistance of the light globe is
increases linearly as the current through the globe increases and suggest that R = kI. The expected relationship between the
voltage across the globe and the current would now be I = V/R = V/kI, which can be rearranged as I2 = V/k.
The trendline has an intercept within 5% of the origin, so it can be assumed to pass through the origin within uncertainties.
The closeness of the data to the linear trendline suggests that the model in which the resistance increases linearly with
current is a good description of the behaviour of incandescent light bulbs.
0
0.01
0.02
0.03
0.04
0.05
0.06
0.00 2.00 4.00 6.00 8.00 10.00 12.00 14.00
Cu
rren
t2 , I2
(A2 )
Voltage, V (V)
I2 versus V for Incandescent globe
14
5.4 Describing Data To understand and interpret data we make comparisons.
If we are expecting to obtain a particular value in an experiment, we compare the value obtained with the value expected.
The closer the obtained value is to the expected value, the more accurate the value. The difference between the obtained
value and the expected value is the error. If all of the values are either higher or lower than the expected value, it suggests
a systematic error in the execution or interpretation of the experiment.
If we carry out multiple trials, we compare the values that we obtain each time we perform the experiment. The closer the
values are to each other, the more precise the measurements and the more repeatable the experiment. The greater the
spread of values, the larger the uncertainty in the experiment.
If someone else carries out the same experiment, we compare the results obtained by the other person with our results.
The closer the values are to each other, the more reproducible the experiment.
Your discussion should include a comment on the precision, accuracy, repeatability and reproducibility of the values that
you have obtained.
You need to identify possible sources of random and systematic error and/or uncertainty in your experiment and link them
to the observed precision, accuracy, repeatability and reproducibility of your values.
Example
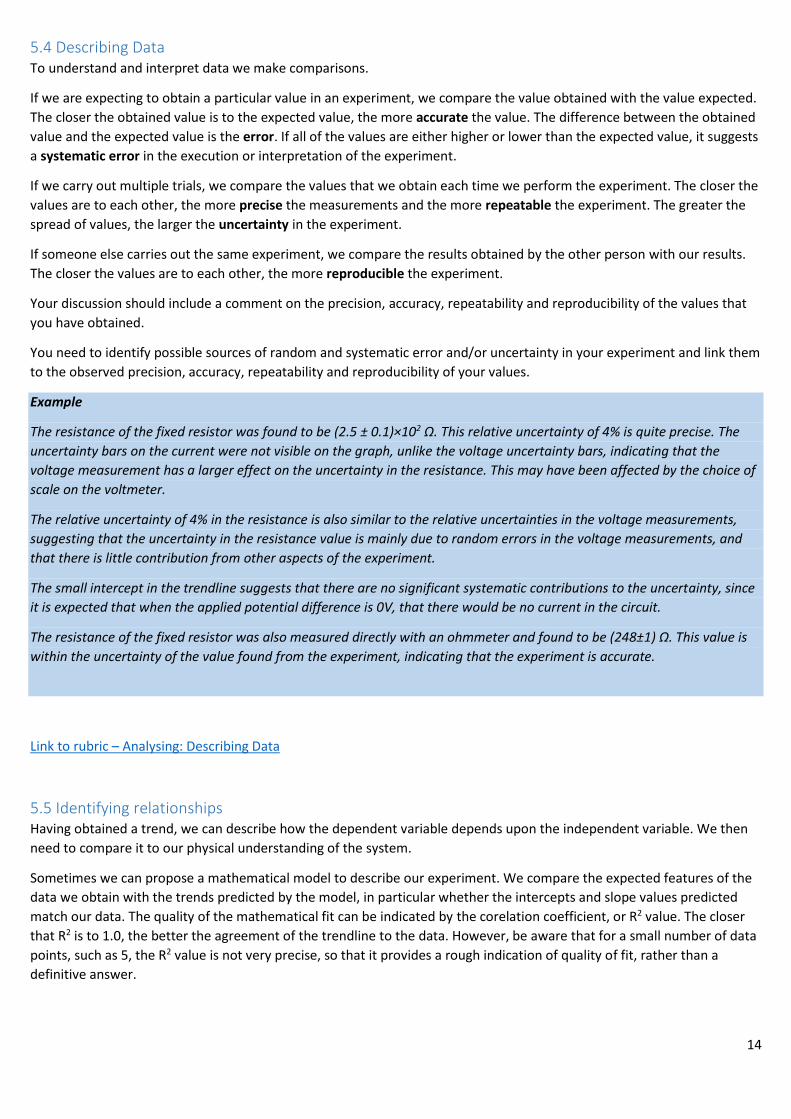
The resistance of the fixed resistor was found to be (2.5 ± 0.1)×102 Ω. This relative uncertainty of 4% is quite precise. The
uncertainty bars on the current were not visible on the graph, unlike the voltage uncertainty bars, indicating that the
voltage measurement has a larger effect on the uncertainty in the resistance. This may have been affected by the choice of
scale on the voltmeter.
The relative uncertainty of 4% in the resistance is also similar to the relative uncertainties in the voltage measurements,
suggesting that the uncertainty in the resistance value is mainly due to random errors in the voltage measurements, and
that there is little contribution from other aspects of the experiment.
The small intercept in the trendline suggests that there are no significant systematic contributions to the uncertainty, since
it is expected that when the applied potential difference is 0V, that there would be no current in the circuit.
The resistance of the fixed resistor was also measured directly with an ohmmeter and found to be (248±1) Ω. This value is
within the uncertainty of the value found from the experiment, indicating that the experiment is accurate.
Link to rubric – Analysing: Describing Data
5.5 Identifying relationships Having obtained a trend, we can describe how the dependent variable depends upon the independent variable. We then
need to compare it to our physical understanding of the system.
Sometimes we can propose a mathematical model to describe our experiment. We compare the expected features of the
data we obtain with the trends predicted by the model, in particular whether the intercepts and slope values predicted
match our data. The quality of the mathematical fit can be indicated by the corelation coefficient, or R2 value. The closer
that R2 is to 1.0, the better the agreement of the trendline to the data. However, be aware that for a small number of data
points, such as 5, the R2 value is not very precise, so that it provides a rough indication of quality of fit, rather than a
definitive answer.
15
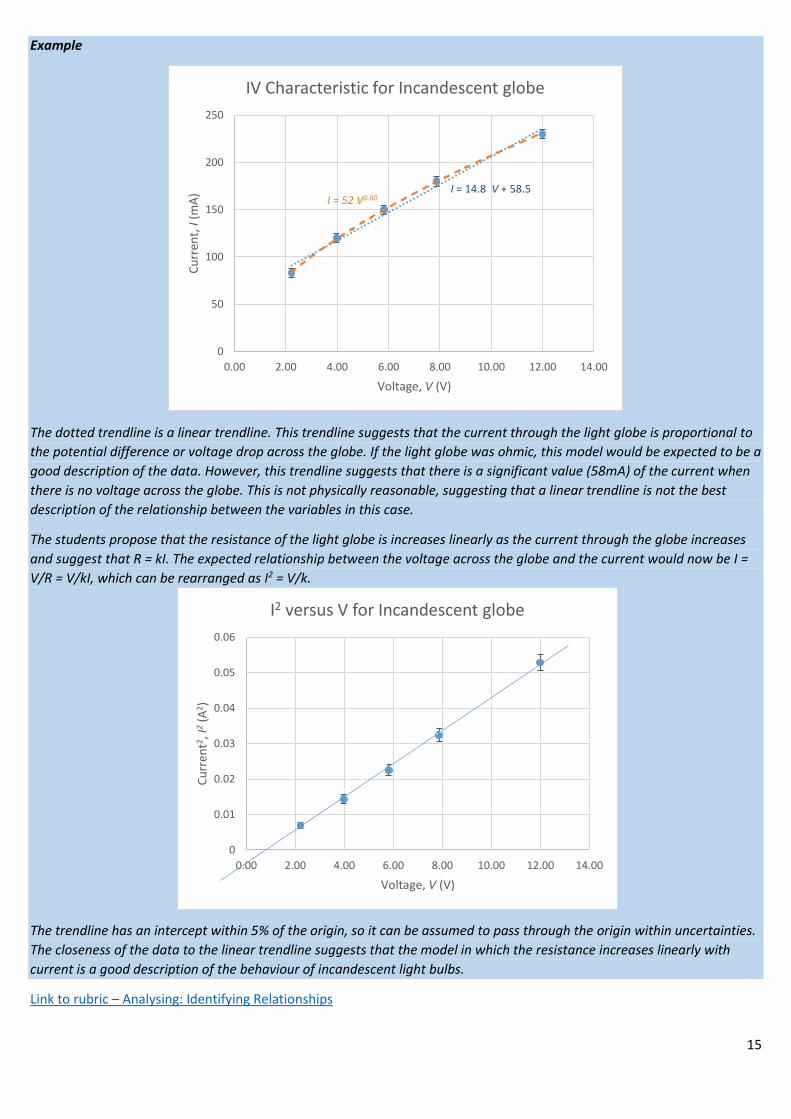
Example
The dotted trendline is a linear trendline. This trendline suggests that the current through the light globe is proportional to
the potential difference or voltage drop across the globe. If the light globe was ohmic, this model would be expected to be a
good description of the data. However, this trendline suggests that there is a significant value (58mA) of the current when
there is no voltage across the globe. This is not physically reasonable, suggesting that a linear trendline is not the best
description of the relationship between the variables in this case.
The students propose that the resistance of the light globe is increases linearly as the current through the globe increases
and suggest that R = kI. The expected relationship between the voltage across the globe and the current would now be I =
V/R = V/kI, which can be rearranged as I2 = V/k.
The trendline has an intercept within 5% of the origin, so it can be assumed to pass through the origin within uncertainties.
The closeness of the data to the linear trendline suggests that the model in which the resistance increases linearly with
current is a good description of the behaviour of incandescent light bulbs.
Link to rubric – Analysing: Identifying Relationships
I = 14.8 V + 58.5 I = 52 V0.60
0
50
100
150
200
250
0.00 2.00 4.00 6.00 8.00 10.00 12.00 14.00
Cu
rren
t, I
(mA
)
Voltage, V (V)
IV Characteristic for Incandescent globe
0
0.01
0.02
0.03
0.04
0.05
0.06
0.00 2.00 4.00 6.00 8.00 10.00 12.00 14.00
Cu
rren
t2 , I2
(A2 )
Voltage, V (V)
I2 versus V for Incandescent globe

16
5.6 Reflecting You should identify the weaknesses and strengths of your experiment and comment on its repeatability and
reproducibility. You should discuss whether the experiment was a valid test of the aim of the experiment.
Example
Although a relatively precise value was obtained for the resistance, and the low relative uncertainty in the average of the
measurements indicated a repeatable experiment, a more precise result could have been obtained if the relative
uncertainty in the voltage measurements was smaller. It is possible that using an instrument with a higher resolution would
improve the precision in the resistance value, however it may have been that insufficient care was taken to minimise
parallax errors when using the voltmeter, or that the quality of the connection to the circuit was poor. These issues could be
improved by better placement of the voltmeter to minimise parallax errors when reading it and by checking and cleaning
the contact points for the voltmeter.
Because no other students carried out the same experiment, we are not able to comment on the reproducibility of the
experiment.
A consistent and repeatable trend has been found for the dependence of the current upon the voltage in this case,
indicating that this experiment is a valid test of the aim, which was to investigate the relationship between current and
voltage for a fixed resistor.
Link to rubric – Evaluating: Reflecting
6. Conclusions Includes: providing a response to the question
The conclusion should directly address the aim, briefly summarise the result found in your experiment and state the
degree to which your hypothesis was supported.
Example
The current through the resistor was found to be directly proportional to the voltage across the resistor, and to be well
described by the relationship I = (4.0 ±0.2)mA/V V, which supports our expected hypothesis for an ohmic material.
Link to rubric – Evaluating: Drawing conclusions
7. References and Acknowledgements Includes: referencing and acknowledgement of all quotations and sourced content as they appear in the report,
acknowledgement of co-workers
Example
Barbara McKinnon wishes to thank Reiner Kamp and Helena James for the use of their data in this document.
References
VCAA. (2016). Physics Study Design. VCAA Retrieved from
https://www.vcaa.vic.edu.au/Documents/vce/physics/2016PhysicsSD.pdf
Link to rubric – Communicating: Reporting Conventions

17
Glossary Accuracy
Aim
Error
Hypothesis
Independent variable
Dependent variable
Continuous variable
Discrete variable
Precision
Random error
Relative error
Relative uncertainty
Reliability
Repeatability
Reproducibility
Significant figures
Systematic error
Uncertainty

18
Standard abbreviations in Physics
The SI systems consists of seven fundamental units, and the measurement units for all other quantities are able to be
expressed in terms of one or more of the seven fundamental units.
Base quantity Name Symbol
Length, l metre m
Mass, m kilogram kg
Time, t second s
electric current, I ampere A
thermodynamic temperature, T kelvin K
amount of substance, n mole mol
luminous intensity, Iv candela cd
Many quantities, for example, force, are given a so-called derived unit. For force, it is the newton, with the symbol “N”,
which is equivalent to kg m s-2. The following table lists all the derived units used in VCE Physics. As can be seen, not all
derived quantities are represented by a unique symbol. The full list of symbols used to represent quantities in VCE is
published in the VCE formula sheet.
Derived quantity Name Symbol
Expression in terms of
other SI units
Expression in terms of
SI base units
Frequency, f hertz Hz - s-1
Force, F newton N - m·kg·s-2
pressure, stress, P pascal Pa N/m2 m-1·kg·s-2
energy, work, quantity of heat, E, W, Q joule J N·m m2·kg·s-2
power, radiant flux, P watt W J/s m2·kg·s-3
electric charge, quantity of electricity, Q coulomb C - s·A
electric potential difference, electromotive force, V
volt V W/A m2·kg·s-3·A-1
electric resistance, R ohm V/A m2·kg·s-3·A-2
magnetic flux, Φ weber Wb V·s m2·kg·s-2·A-1
magnetic flux density, B tesla T Wb/m2 kg·s-2·A-1
activity (of a radionuclide), N becquerel Bq - s-1
Celsius temperature, T degree Celsius °C - K

19
Criterion Not Met 1 2 3 4 5
Qu
esti
on
ing
and
Pre
dic
tin
g
Background
Information
Background information included.
Directly relevant background information included.
Relevant information included, linked to the proposed experiment in terms of the variables used.
Relevant information included, linked to the proposed experiment in terms of the variables used and a connection made between the model of the phenomenon and the experiment.
Relevant information included, linked to the proposed experiment in terms of the variables used, a connection made between the model of the phenomenon and the experiment and reference sources acknowledged.
Aim/Hypothesis The aim of the experiment was stated.
The aim of the experiment was stated and a relevant hypothesis proposed.
The aim of the experiment was stated and a relevant hypothesis proposed, with supporting reasons given.
The aim of the experiment was stated and a relevant hypothesis proposed, with supporting reasons given, based on relevant science understanding.
Variables Experimental variables were identified.
Independent and dependent experimental variables were correctly identified.
Independent, dependent and controlled variables were correctly identified.
Independent, dependent, and controlled variables were identified and the method of control described.
Independent, dependent, uncontrolled and controlled variables were identified and the method of control described.
Pla
nn
ing
and
Co
nd
uct
ing
Materials and
Apparatus
A list of materials and apparatus was provided.
A list of materials and apparatus and a diagram, was provided.
A list of materials and apparatus, including details of quantities and a diagram of apparatus, was provided.
A list of materials and apparatus, including details of quantities was provided and a labelled diagram occupying at least 1/3 of a page.
A list of materials and apparatus, including details of quantities was provided and a clear scientific diagram occupying at least 1/3 of a page. All labels and listed items were correctly spelt.
Procedure A reproducible experimental procedure was outlined.
A reproducible experimental procedure was outlined clearly in steps.
A reproducible experimental procedure was outlined clearly in steps, including multiple trials and a range of independent variables.
A reproducible experimental procedure was outlined clearly in steps, including multiple trials and a well-chosen range of independent variables.
An annotated, reproducible experimental procedure was outlined clearly in steps, including multiple trials and a well-chosen range of independent variables.
Safety Hazards were identified.
Hazards relevant to the experiment were identified.
Hazards relevant to the experiment were identified and the steps taken to reduce the associated risk stated.
A risk assessment was undertaken using a risk assessment tool, from which hazards and the steps necessary to reduce the associated risk were identified.
A risk assessment was undertaken using a risk assessment tool, from which hazards and steps necessary to reduce the associated risk were identified and the viability of the experiment evaluated.
Rec
ord
ing
Qualitative Data Relevant observations were recorded.
Relevant observations were recorded systematically.
Quantitative
Data
Relevant data was collected and recorded.
Relevant data was collected and tabulated in a labelled table with units included in the header row.
Relevant data was collected and tabulated in a labelled table with units included in the header row and an appropriate number of significant figures recorded for each measurement.
Relevant data was collected and tabulated in a labelled table with units included in the header row and an appropriate number of significant figures recorded for each measurement. Measurement uncertainty was included for all measured values.
Relevant data was collected and tabulated in a labelled table with units included in the header row and an appropriate number of significant figures recorded for each measurement. Measurement uncertainty was recorded for all measured values and was consistent with the number of decimal places in the measurement value.
An
alys
ing
Processing Data The average of data from multiple trials was calculated and recorded.
The average and range of data from multiple trials was calculated and recorded.
The average and uncertainty of data from multiple trials was calculated and recorded.
The average and uncertainty for multiple trials were calculated and recorded. The uncertainty contained no more than one significant figure.
The average and uncertainty for multiple trials were calculated and recorded. The uncertainty contained no more than one significant figures. The number of decimal places recorded for the average was consistent with the reported uncertainty.
20
Criterion Not Met 1 2 3 4 5
An
alys
ing
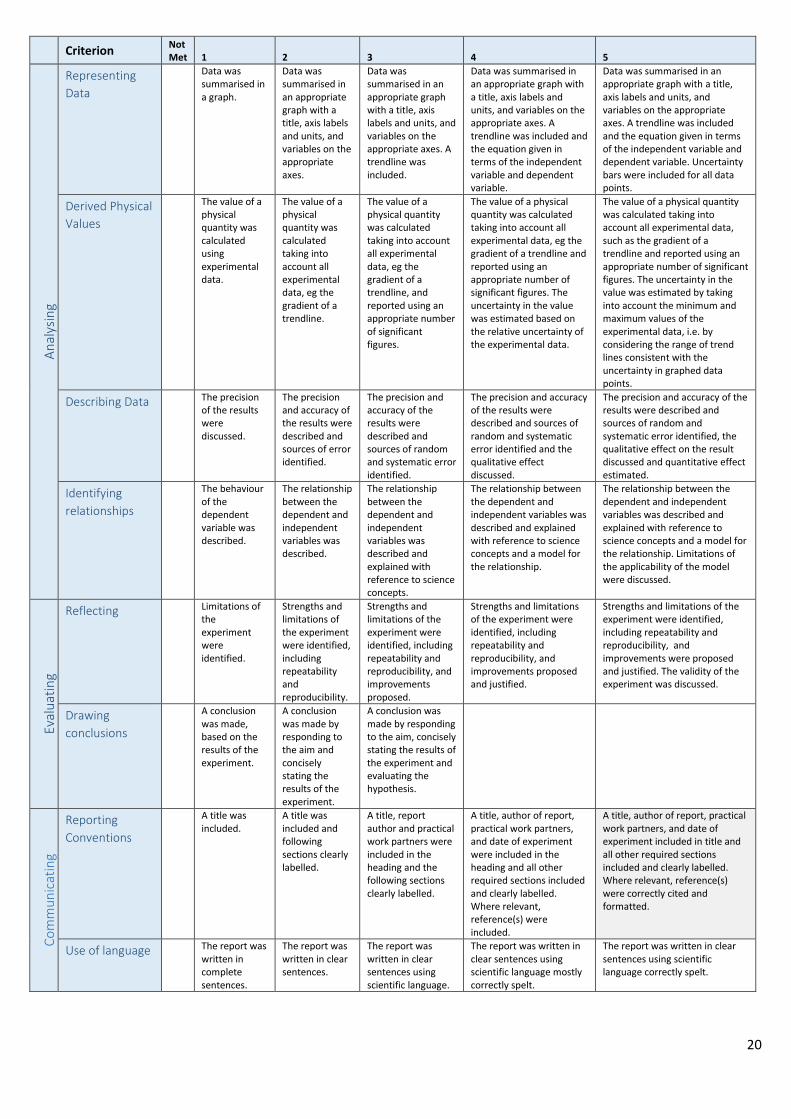
Representing
Data
Data was summarised in a graph.
Data was summarised in an appropriate graph with a title, axis labels and units, and variables on the appropriate axes.
Data was summarised in an appropriate graph with a title, axis labels and units, and variables on the appropriate axes. A trendline was included.
Data was summarised in an appropriate graph with a title, axis labels and units, and variables on the appropriate axes. A trendline was included and the equation given in terms of the independent variable and dependent variable.
Data was summarised in an appropriate graph with a title, axis labels and units, and variables on the appropriate axes. A trendline was included and the equation given in terms of the independent variable and dependent variable. Uncertainty bars were included for all data points.
Derived Physical
Values
The value of a physical quantity was calculated using experimental data.
The value of a physical quantity was calculated taking into account all experimental data, eg the gradient of a trendline.
The value of a physical quantity was calculated taking into account all experimental data, eg the gradient of a trendline, and reported using an appropriate number of significant figures.
The value of a physical quantity was calculated taking into account all experimental data, eg the gradient of a trendline and reported using an appropriate number of significant figures. The uncertainty in the value was estimated based on the relative uncertainty of the experimental data.
The value of a physical quantity was calculated taking into account all experimental data, such as the gradient of a trendline and reported using an appropriate number of significant figures. The uncertainty in the value was estimated by taking into account the minimum and maximum values of the experimental data, i.e. by considering the range of trend lines consistent with the uncertainty in graphed data points.
Describing Data The precision of the results were discussed.
The precision and accuracy of the results were described and sources of error identified.
The precision and accuracy of the results were described and sources of random and systematic error identified.
The precision and accuracy of the results were described and sources of random and systematic error identified and the qualitative effect discussed.
The precision and accuracy of the results were described and sources of random and systematic error identified, the qualitative effect on the result discussed and quantitative effect estimated.
Identifying
relationships
The behaviour of the dependent variable was described.
The relationship between the dependent and independent variables was described.
The relationship between the dependent and independent variables was described and explained with reference to science concepts.
The relationship between the dependent and independent variables was described and explained with reference to science concepts and a model for the relationship.
The relationship between the dependent and independent variables was described and explained with reference to science concepts and a model for the relationship. Limitations of the applicability of the model were discussed.
Eval
uat
ing
Reflecting Limitations of the experiment were identified.
Strengths and limitations of the experiment were identified, including repeatability and reproducibility.
Strengths and limitations of the experiment were identified, including repeatability and reproducibility, and improvements proposed.
Strengths and limitations of the experiment were identified, including repeatability and reproducibility, and improvements proposed and justified.
Strengths and limitations of the experiment were identified, including repeatability and reproducibility, and improvements were proposed and justified. The validity of the experiment was discussed.
Drawing
conclusions
A conclusion was made, based on the results of the experiment.
A conclusion was made by responding to the aim and concisely stating the results of the experiment.
A conclusion was made by responding to the aim, concisely stating the results of the experiment and evaluating the hypothesis.
Co
mm
un
icat
ing
Reporting
Conventions
A title was included.
A title was included and following sections clearly labelled.
A title, report author and practical work partners were included in the heading and the following sections clearly labelled.
A title, author of report, practical work partners, and date of experiment were included in the heading and all other required sections included and clearly labelled. Where relevant, reference(s) were included.
A title, author of report, practical work partners, and date of experiment included in title and all other required sections included and clearly labelled. Where relevant, reference(s) were correctly cited and formatted.
Use of language The report was written in complete sentences.
The report was written in clear sentences.
The report was written in clear sentences using scientific language.
The report was written in clear sentences using scientific language mostly correctly spelt.
The report was written in clear sentences using scientific language correctly spelt.

21
Related Documents