For a free demo, contact: Shashank Randev I BDM I VCCEdge +91-22-61214000 |[email protected] 2011 PRIVATE EQUITY REPORTING DECK

VccEdge 2011 presentation deck
Jul 12, 2015
Welcome message from author
This document is posted to help you gain knowledge. Please leave a comment to let me know what you think about it! Share it to your friends and learn new things together.
Transcript
For a free demo, contact:Shashank Randev I BDM I VCCEdge+91-22-61214000 |[email protected]
2011PRIVATE EQUITY REPORTING DECK
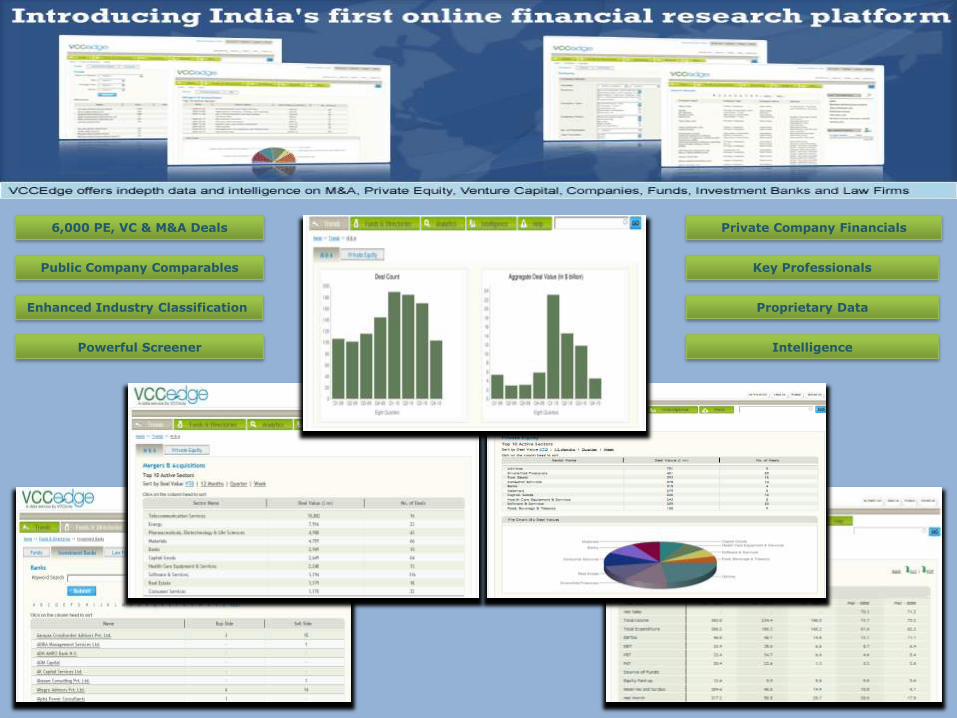
Powerful Screener
6,000 PE, VC & M&A Deals Private Company Financials
Intelligence
Proprietary Data
Key Professionals
Enhanced Industry Classification
Public Company Comparables

Private Equity Investments
COPYRIGHT © 2010 All rights reserved VCCEdge
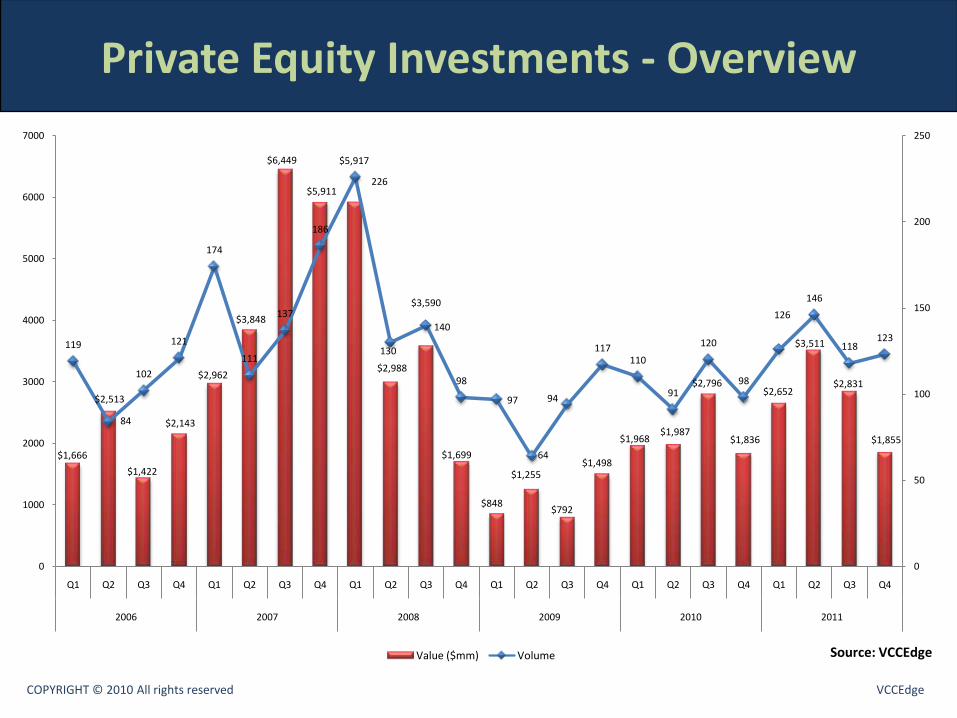
Private Equity Investments - Overview
COPYRIGHT © 2010 All rights reserved VCCEdge
$1,666
$2,513
$1,422
$2,143
$2,962
$3,848
$6,449
$5,911
$5,917
$2,988
$3,590
$1,699
$848
$1,255
$792
$1,498
$1,968$1,987
$2,796
$1,836
$2,652
$3,511
$2,831
$1,855
119
84
102
121
174
111
137
186
226
130
140
98
97
64
94
117110
91
120
98
126
146
118123
0
50
100
150
200
250
0
1000
2000
3000
4000
5000
6000
7000
Q1 Q2 Q3 Q4 Q1 Q2 Q3 Q4 Q1 Q2 Q3 Q4 Q1 Q2 Q3 Q4 Q1 Q2 Q3 Q4 Q1 Q2 Q3 Q4
2006 2007 2008 2009 2010 2011
Value ($mm) Volume Source: VCCEdge
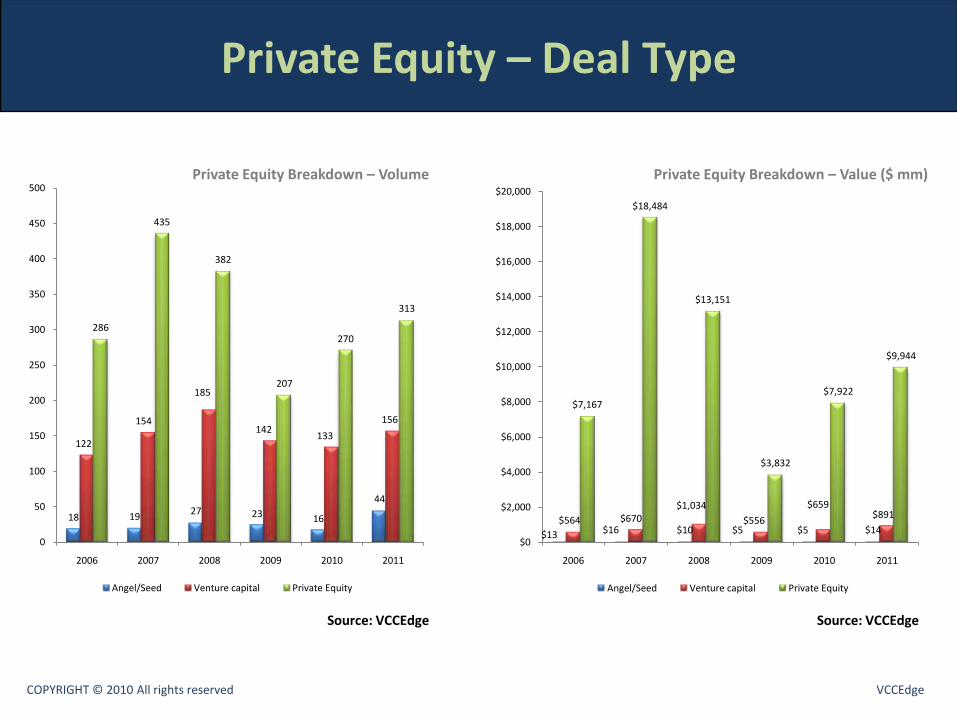
Private Equity – Deal Type
COPYRIGHT © 2010 All rights reserved VCCEdge
18 1927 23 16
44
122
154
185
142133
156
286
435
382
207
270
313
0
50
100
150
200
250
300
350
400
450
500
2006 2007 2008 2009 2010 2011
Angel/Seed Venture capital Private Equity
Source: VCCEdge
Private Equity Breakdown – Volume
$13 $16 $10 $5 $5 $14$564 $670
$1,034
$556
$659$891
$7,167
$18,484
$13,151
$3,832
$7,922
$9,944
$0
$2,000
$4,000
$6,000
$8,000
$10,000
$12,000
$14,000
$16,000
$18,000
$20,000
2006 2007 2008 2009 2010 2011
Angel/Seed Venture capital Private Equity
Source: VCCEdge
Private Equity Breakdown – Value ($ mm)
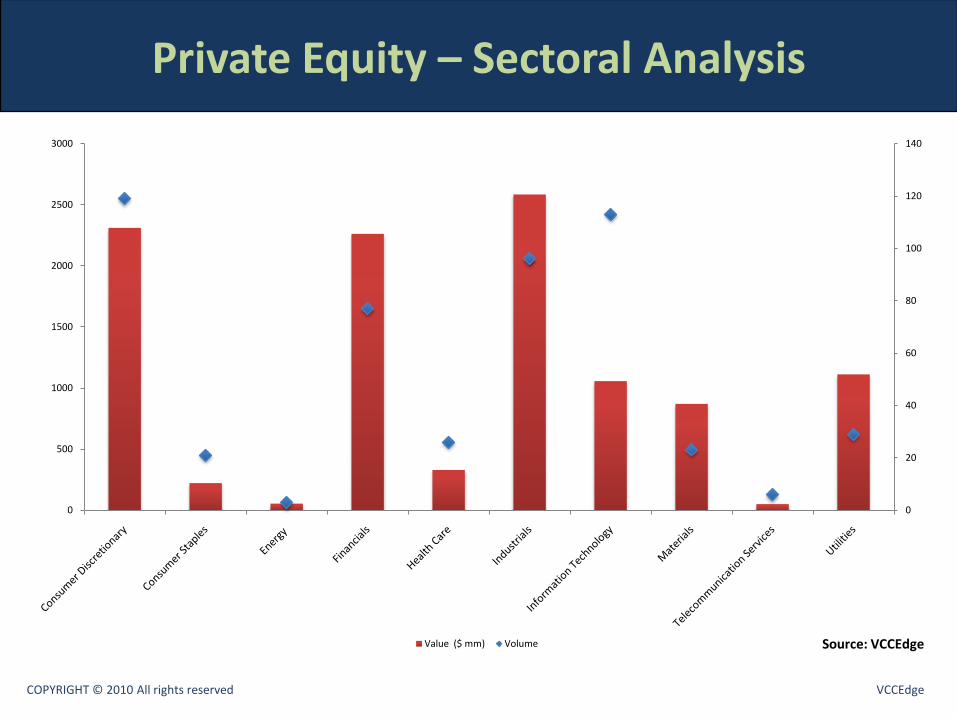
Private Equity – Sectoral Analysis
COPYRIGHT © 2010 All rights reserved VCCEdge
0
20
40
60
80
100
120
140
0
500
1000
1500
2000
2500
3000
Value ($ mm) Volume Source: VCCEdge
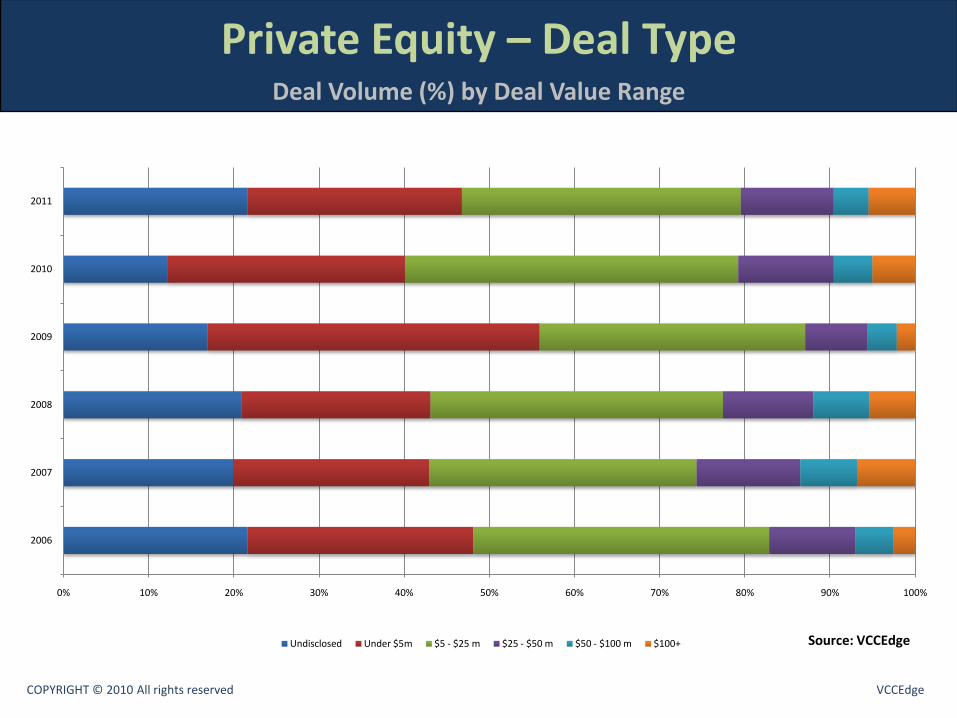
Private Equity – Deal TypeDeal Volume (%) by Deal Value Range
COPYRIGHT © 2010 All rights reserved VCCEdge
0% 10% 20% 30% 40% 50% 60% 70% 80% 90% 100%
2006
2007
2008
2009
2010
2011
Undisclosed Under $5m $5 - $25 m $25 - $50 m $50 - $100 m $100+ Source: VCCEdge

Private Equity – Deal TypeTotal Investment (%) by Deal Value Range
COPYRIGHT © 2010 All rights reserved VCCEdge
0% 10% 20% 30% 40% 50% 60% 70% 80% 90% 100%
2006
2007
2008
2009
2010
2011
Under $5m $5 - $25 m $25 - $50 m $50 - $100 m $100+Source: VCCEdge
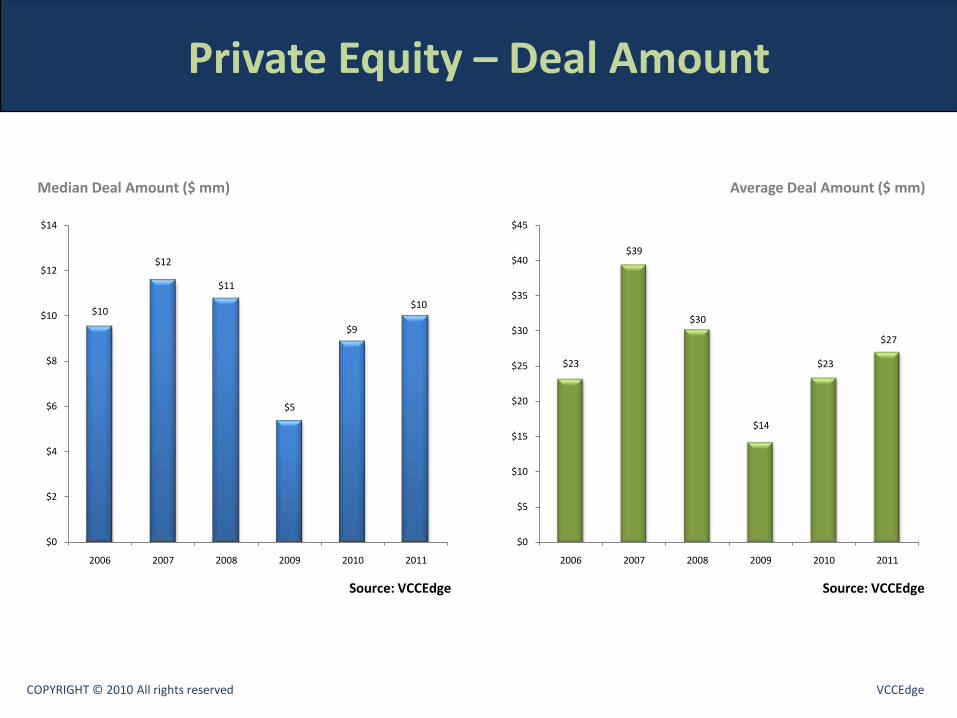
Private Equity – Deal Amount
COPYRIGHT © 2010 All rights reserved VCCEdge
$10
$12
$11
$5
$9
$10
$0
$2
$4
$6
$8
$10
$12
$14
2006 2007 2008 2009 2010 2011
Median Deal Amount ($ mm)
Source: VCCEdge
$23
$39
$30
$14
$23
$27
$0
$5
$10
$15
$20
$25
$30
$35
$40
$45
2006 2007 2008 2009 2010 2011
Average Deal Amount ($ mm)
Source: VCCEdge
Private Equity Exits
COPYRIGHT © 2010 All rights reserved VCCEdge

Private Equity Exits - Overview
COPYRIGHT © 2010 All rights reserved VCCEdge
$812
$301
$191
$507
$387
$774
$1,077
$452
$168
$865
$67
$29$66
$881
$665
$873
$922
$1,339
$716
$1,603
$789
$712
$960
$412
21
9
15
21
28
30
24
34
25
15
6
16
10
33
40
38
44
39
46
43
3230
37
16
0
5
10
15
20
25
30
35
40
45
50
0
200
400
600
800
1000
1200
1400
1600
1800
Q1 Q2 Q3 Q4 Q1 Q2 Q3 Q4 Q1 Q2 Q3 Q4 Q1 Q2 Q3 Q4 Q1 Q2 Q3 Q4 Q1 Q2 Q3 Q4
2006 2007 2008 2009 2010 2011
Value ($mm) Volume Source: VCCEdge
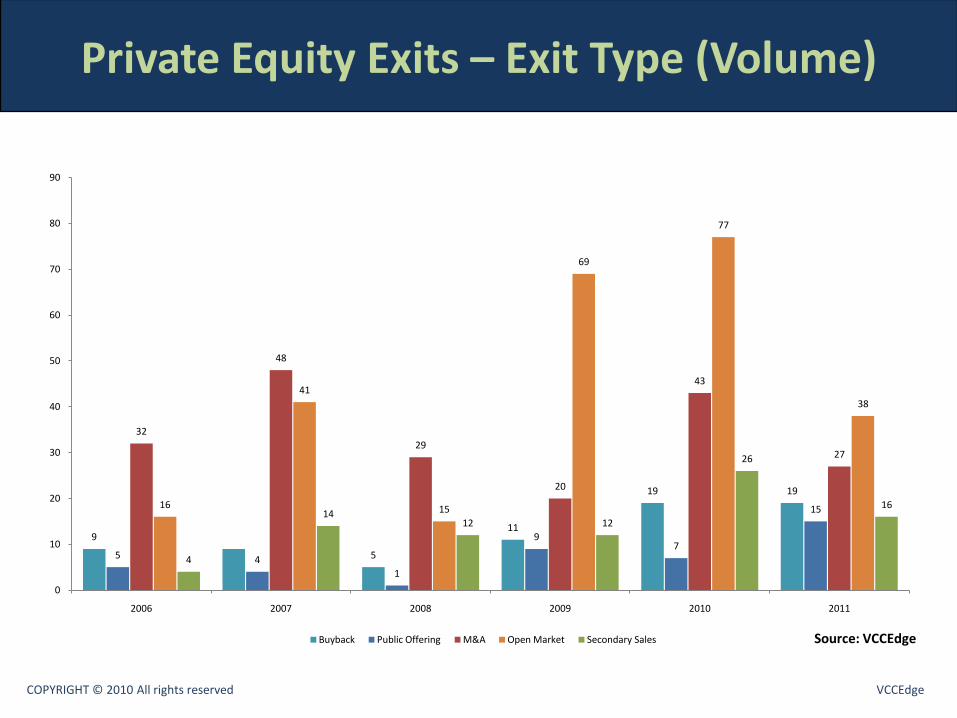
Private Equity Exits – Exit Type (Volume)
COPYRIGHT © 2010 All rights reserved VCCEdge
9
5
11
19 19
5 4
1
97
15
32
48
29
20
43
27
16
41
15
69
77
38
4
1412 12
26
16
0
10
20
30
40
50
60
70
80
90
2006 2007 2008 2009 2010 2011
Buyback Public Offering M&A Open Market Secondary Sales Source: VCCEdge
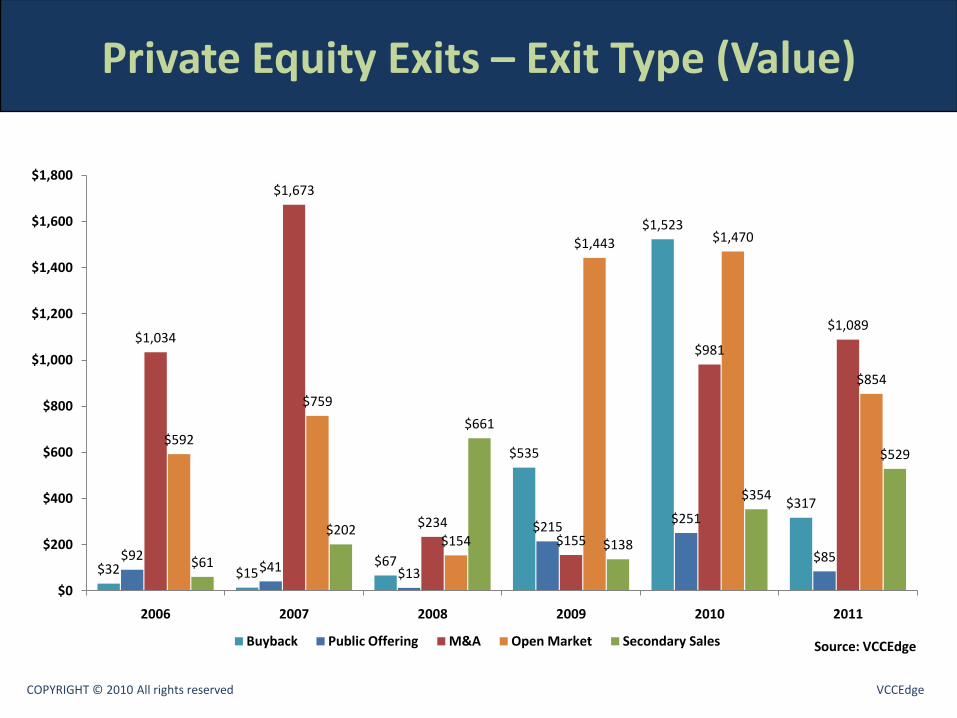
Private Equity Exits – Exit Type (Value)
COPYRIGHT © 2010 All rights reserved VCCEdge
$32 $15$67
$535
$1,523
$317
$92$41 $13
$215$251
$85
$1,034
$1,673
$234$155
$981
$1,089
$592
$759
$154
$1,443 $1,470
$854
$61
$202
$661
$138
$354
$529
$0
$200
$400
$600
$800
$1,000
$1,200
$1,400
$1,600
$1,800
2006 2007 2008 2009 2010 2011
Buyback Public Offering M&A Open Market Secondary Sales Source: VCCEdge
Private Equity Funds
COPYRIGHT © 2010 All rights reserved VCCEdge
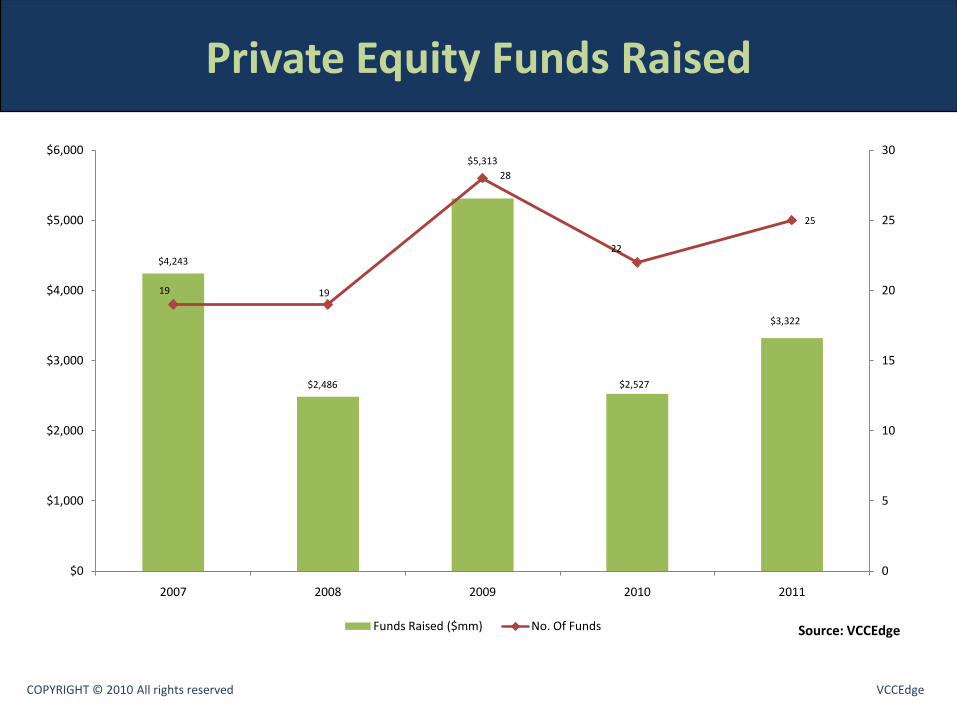
Private Equity Funds Raised
COPYRIGHT © 2010 All rights reserved VCCEdge
$4,243
$2,486
$5,313
$2,527
$3,322
19 19
28
22
25
0
5
10
15
20
25
30
$0
$1,000
$2,000
$3,000
$4,000
$5,000
$6,000
2007 2008 2009 2010 2011
Funds Raised ($mm) No. Of Funds Source: VCCEdge
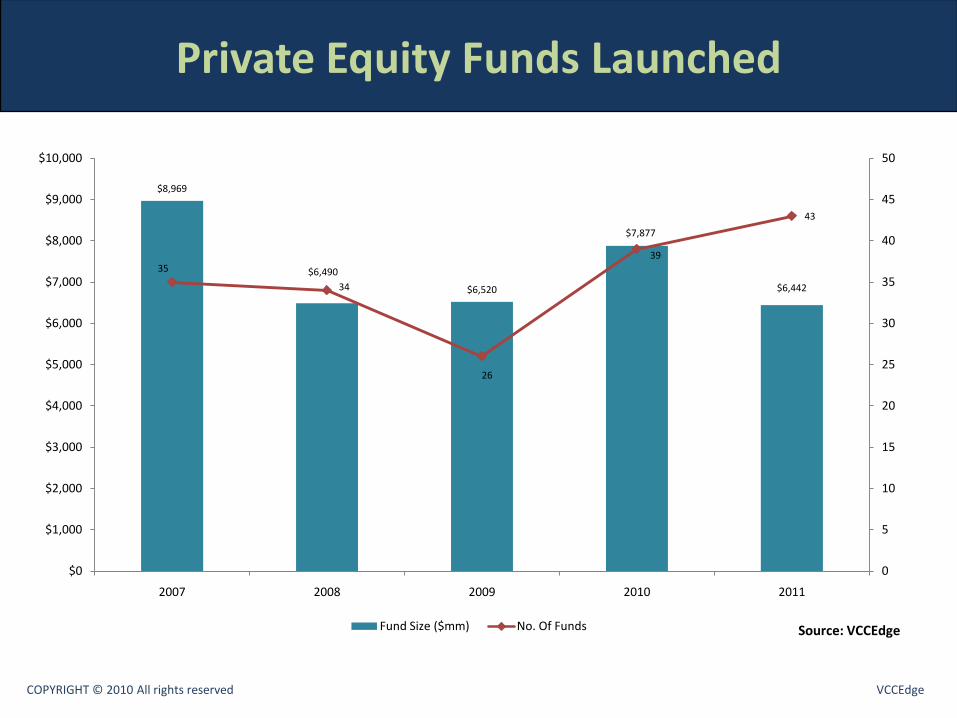
Private Equity Funds Launched
COPYRIGHT © 2010 All rights reserved VCCEdge
$8,969
$6,490
$6,520
$7,877
$6,442
35
34
26
39
43
0
5
10
15
20
25
30
35
40
45
50
$0
$1,000
$2,000
$3,000
$4,000
$5,000
$6,000
$7,000
$8,000
$9,000
$10,000
2007 2008 2009 2010 2011
Fund Size ($mm) No. Of Funds Source: VCCEdge
Related Documents