Corporate Factbook 20 September 2021

Welcome message from author
This document is posted to help you gain knowledge. Please leave a comment to let me know what you think about it! Share it to your friends and learn new things together.
Transcript

Corporate Factbook20 September 2021
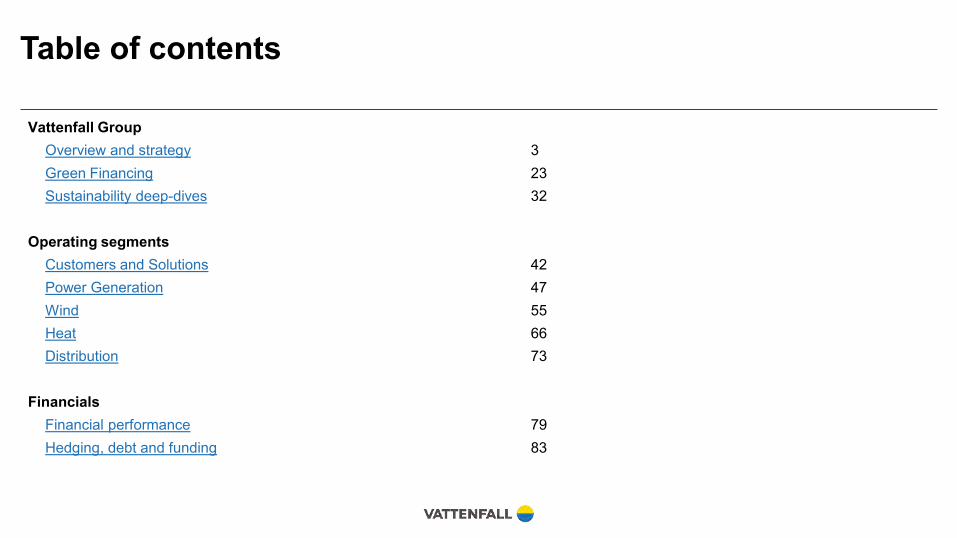
Table of contents
Vattenfall GroupOverview and strategy 3Green Financing 23Sustainability deep-dives 32
Operating segmentsCustomers and Solutions 42Power Generation 47Wind 55Heat 66Distribution 73
FinancialsFinancial performance 79Hedging, debt and funding 83

35%
35%
20%
10%Nuclear
Hydro
Fossil
Wind
This is Vattenfall
1 Excluding Vattenfall’s subsidiaries Gotlands Elnät and Västerbergslagens Elnät as wellas the Berlin grid business which was sold to the city of Berlin on July 1st, 2021 3
In Brief• Vattenfall is a leading European
energy company• We want to make fossil-free living
possible within one generation• We are driving the transition to a more
sustainable energy system through growth in renewable production and climatesmart energy solutions for our customers
• 100 per cent owned by the Swedish State
• Our long-term credit ratings are BBB+ stable outlook by S&P and A3 stableoutlook by Moody’s
900 0001Electricity grid customers
19,859Employees
1.8 MillionHeat customers
2.3 MillionGas customers
6.8 MillionElectricity customers
• Sweden• Germany• Netherlands• Denmark• United Kingdom
Main markets CO2 emissions & Renewable capacity
Electricity generationbreakdown by technology, 2020
EBITDA breakdown by segment, 2020
05001 0001 5002 0002 5003 0003 5004 000
0
30
60
90
MW
Mto
nnes
Installed renewable capacity (MW)CO2 emissions (Mtonnes)
112.8TWh
Activities in the Value Chain
Upstream TransmissionProduction Distribution Trading Retail Services
Active Inactive
49%20%
6%
19%
Customers & Solutions
6%
Wind
Power Generation
Heat
Distribution
SEK46.5 bn

Vattenfall Executive Group Management
For more info: please see page 86-87 in the Annual- and Sustainability Report 20201 Assumes position on October 1
4
President and CEOAnna Borg
Business AreaHeat
Senior Vice PresidentUlrika Jardfelt
Business Area Customers & Solutions
Senior Vice PresidentMartijn Hagens
Business AreaWind
Senior Vice PresidentHelene Biström
Business AreaPower Generation
Senior Vice President,GenerationTorbjörn Wahlborg
Business Area Distribution2
Senior Vice PresidentAnnika Viklund
Senior Vice President, MarketsAnna-Karin Stenberg
Senior Vice President, CFOKerstin Ahlfont
Senior Vice President, CommunicationsKarin Lepasoon1
Senior Vice President, Strategic DevelopmentAndreas Regnell
Senior Vice President, Human ResourcesChristian Barthélémy
Senior Vice President, General Counsel and Secretary to the Board of DirectorsAnne Gynnerstedt
2 The electricity distribution operations are regulated by the Swedish Electricity Act (Ellagen) and the German Energy Industry Act (Energiewirtschaftsgesetz), and are unbundled from Vattenfall’s other operations. The Head of Business Area Distribution is therefore not a member of the EGM

Employee representativeRobert Lönnqvist
Employee representativeRolf Ohlsson
Employee representativeJeanette Regin
Employee representative (deputy)Lennart Bengtsson
Employee representative (deputy)Anders Bohlin
Employee representative (deputy)Christer Gustafsson
Vattenfall Board of Directors
5
Chairman of the BoardLars G. Nordström
Board memberViktoria Bergman
Board memberMats Granryd
Board memberAnn Carlsson
Board memberTomas Kåberger
Board memberHåkan Erixon
Board memberFredrik Rystedt
Board memberJenny Lahrin
Board memberÅsa Söderström Winberg
For more info: please see page 84-85 in the Annual- and Sustainability Report 2020
Vattenfall’s value chain
Production Electricity distribution Sales of electricity, heat and gas
District heating Energy services & decentralised generation
Production from• Hydro• Nuclear• Coal• Natural gas• Wind• Solar• Biomass• WasteActively phasing out fossil-based production
• Guarantees secure supply via well-functioning distribution grids and smart grid solutions
• Enables customers to feed self-generated electricity into the grid (“prosumers”)
• Flexibility services to both electricity producers and consumers to optimise grid functionality
• Sells electricity, heat and gas to consumers and business customers
• Focuses on various price and service models, and gives customers the opportunity to understand and reduce their environmental impact
• Drives the transformation towards fossil-free heating and cooling solutions together with partners, cities and regions
• One of Europe’s largest producers and distributors of district heating
Offers energy services• Heat pumps• Solar panels• Charging solutions for
electric vehicles• Battery storage• Grid services• Smart metersProvides marketplaces and access to marketplaces where customers can buy and sell electricity
6

7

8
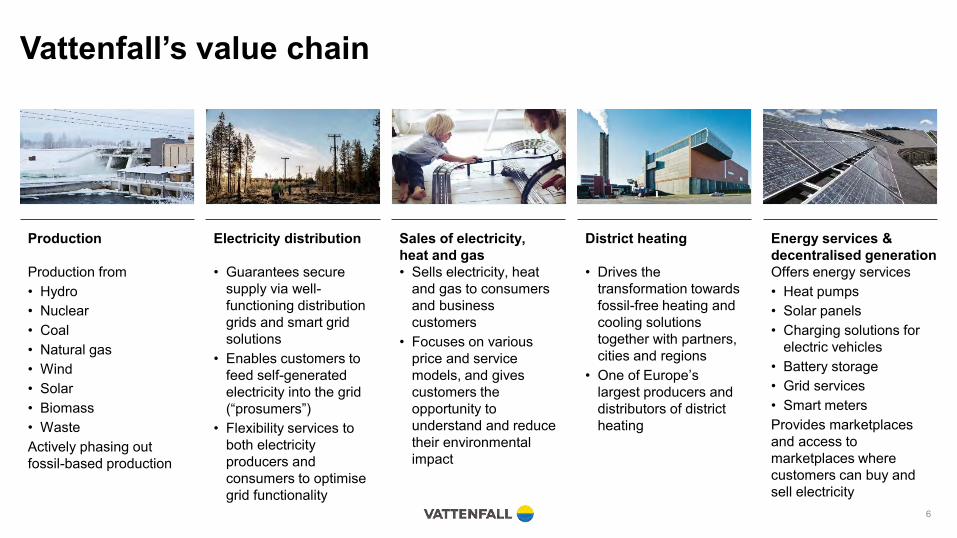
Financial characteristics per operating segment
9
Operating segment Key drivers for earnings Characteristics of earnings and cash flow
Customers & Solutions Difference in sourcing costs compared to sales price (gross margin) and development in the customer base
Track record of stable earnings
Power Generation A function of spot price, generation volume, hedge ratio and hedge level
Large outright power price exposure is offset by hedging activites, thereby reducing volatility
Wind A function of existing subsidies schemes rolling off, net new capacity added, the achieved power price rewarded to new capacity, technological development and synergies
Growing contribution on the back of new capacity
Heat Mainly fuel costs/spreads and temperature effects/weather
New, partly subsidized, assets replacing older ones and thereby increasing the availability in combination with increased hedging activities contribute to less volatility than seen in last couple of years.
Distribution Largely a function of regulatory asset base (RAB), regulatory WACC, and the efficiency of the operations
Stable

Our beliefs about the future
Sustainability is the business…
1Simple solutions
to customers needed in a
complex energy landscape…
2Demand for fossil-free
electricity and grids will increase
significantly…
3Digitalization of
the entire energy value chain is necessary…
4Cost efficiency
and competitiveness is paramount…
New competencies are
critical in the energy
transition…
…and leaders must have a positive
track record, extending beyond
climate
… and will be a sizeable business
opportunity
…and will require thoughtful
stakeholder management
…and is a key enabler for energy system flexibility
…and companies will compete for top
talent
…for being a winner in the
energy transition
65
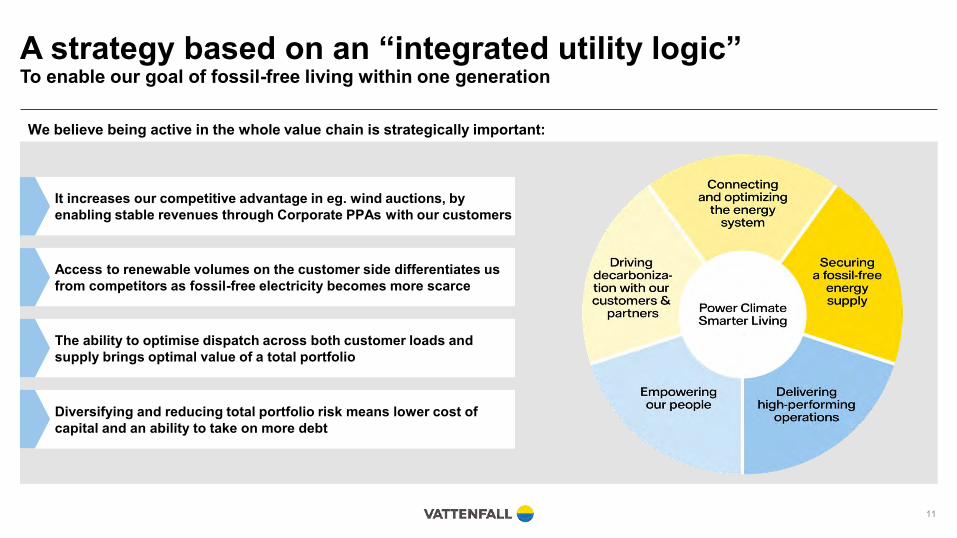
A strategy based on an “integrated utility logic” To enable our goal of fossil-free living within one generation
We believe being active in the whole value chain is strategically important:
11
It increases our competitive advantage in eg. wind auctions, by enabling stable revenues through Corporate PPAs with our customers
Access to renewable volumes on the customer side differentiates us from competitors as fossil-free electricity becomes more scarce
The ability to optimise dispatch across both customer loads and supply brings optimal value of a total portfolio
Diversifying and reducing total portfolio risk means lower cost of capital and an ability to take on more debt
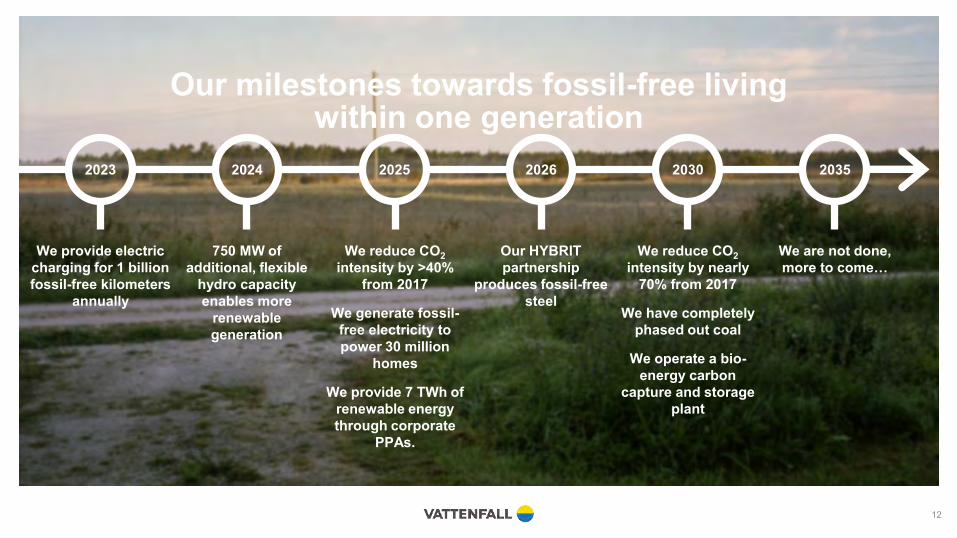
Our milestones towards fossil-free living within one generation
We provide electric charging for 1 billion fossil-free kilometers
annually
2023 2024 2025 2035
750 MW of additional, flexible
hydro capacity enables more
renewable generation
We reduce CO2intensity by >40%
from 2017
We generate fossil-free electricity to power 30 million
homes
We provide 7 TWh of renewable energy through corporate
PPAs.
We are not done, more to come…
2026
Our HYBRIT partnership
produces fossil-free steel
12
2030
We reduce CO2intensity by nearly
70% from 2017
We have completely phased out coal
We operate a bio-energy carbon
capture and storage plant
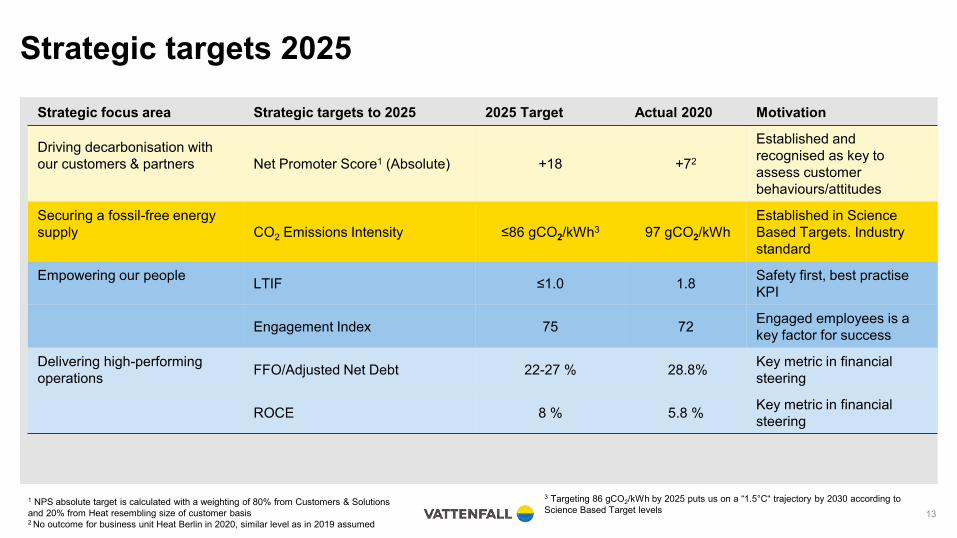
Strategic targets 2025
1 NPS absolute target is calculated with a weighting of 80% from Customers & Solutions and 20% from Heat resembling size of customer basis 2 No outcome for business unit Heat Berlin in 2020, similar level as in 2019 assumed
13
Strategic focus area Strategic targets to 2025 2025 Target Actual 2020 Motivation
Driving decarbonisation with our customers & partners Net Promoter Score1 (Absolute) +18 +72
Established and recognised as key to assess customer behaviours/attitudes
Securing a fossil-free energy supply CO2 Emissions Intensity ≤86 gCO2/kWh3 97 gCO2/kWh
Established in Science Based Targets. Industry standard
Empowering our people LTIF ≤1.0 1.8 Safety first, best practise KPI
Engagement Index 75 72 Engaged employees is a key factor for success
Delivering high-performing operations FFO/Adjusted Net Debt 22-27 % 28.8% Key metric in financial
steering
ROCE 8 % 5.8 % Key metric in financial steering
3 Targeting 86 gCO2/kWh by 2025 puts us on a “1.5°C“ trajectory by 2030 according to Science Based Target levels

Financial targets
14
Financial targetsTargets over a business cycle1 FY 2020 FY 2019 Comment
Profitability Return on capital employed: ≥8%2 5.8% 8.5%
Return on capital employed decreased to 5.8%,which is below the target of 8%, mainly owing toimpairment losses related to the Moorburg powerplant in Hamburg
Capital structureFFO/adjustednet debt:22%–27%
28.8% 26.5%FFO/adjusted net debt increased to 28.8% in 2020,mainly owing to lower adjusted net debt resultingfrom higher cash flow from operations
Dividend policyDividend:40%–70% of the year’s profit after tax
SEK 4.0 bn SEK 3.6 bnThe Board of Directors has proposed a dividend ofSEK 4 billion, corresponding to 62% of profit for theyear attributable to the owner of the Parent Company
1 5–7 years2 The key ratio is based on average capital employed

57%25%
18%
Growth, 32 bn SEK
Maintenance, 14 bn SEK
Replacement, 10 bn SEK
Empty
29%
28%
22%
11%
10%
Netherlands, 9 bn SEKDenmark, 9 bn SEKUK, 7 bn SEKSweden, 4 bn SEKGermany, 3 bn SEK
Empty
Investment plan 2021-2022
15
Total capex2021-2022
57bn SEK
71%
14%
9%6%
Wind power, 23 bn SEKElectricity distribution, 4bn SEKHeat supply, 3 bn SEKOther , 2 bn SEK
Empty
Growth capex per technology 2021-2022
32bn SEK
Growth capex per country 2021-2022
32bn SEK
1 Mainly charging solutions, solar and battery projects, decentralised solutions and the HYBRIT project
1
1 1
CAPEX by technology
19.5% 16.6%10.4% 5.7%
30.5%71.7%
39.6%5.5%
2015-16 2021-22Other Hydro Wind Fossil
SEK 30.8 bn SEK 33.9 bn
Electricity production mix
25.3% 41.2%22.8%
35.2%3.4%
9.6%48.6%20.1%
2015 2020Other Hydro Wind Fossil
112.8 TWh173.0 TWh
CO2 emissions
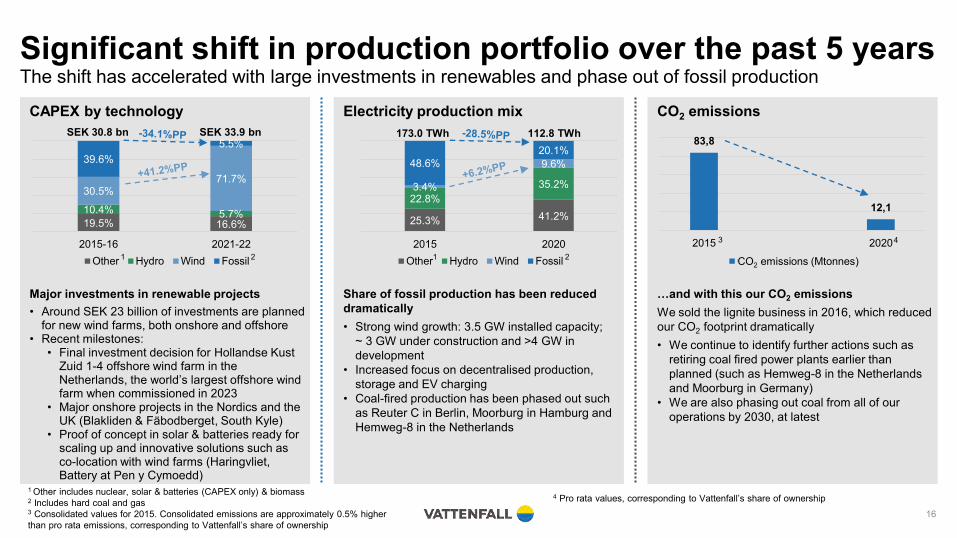
Significant shift in production portfolio over the past 5 yearsThe shift has accelerated with large investments in renewables and phase out of fossil production
1 Other includes nuclear, solar & batteries (CAPEX only) & biomass2 Includes hard coal and gas3 Consolidated values for 2015. Consolidated emissions are approximately 0.5% higher than pro rata emissions, corresponding to Vattenfall’s share of ownership
16
Major investments in renewable projects• Around SEK 23 billion of investments are planned
for new wind farms, both onshore and offshore• Recent milestones:
• Final investment decision for Hollandse Kust Zuid 1-4 offshore wind farm in the Netherlands, the world’s largest offshore wind farm when commissioned in 2023
• Major onshore projects in the Nordics and the UK (Blakliden & Fäbodberget, South Kyle)
• Proof of concept in solar & batteries ready for scaling up and innovative solutions such as co-location with wind farms (Haringvliet, Battery at Pen y Cymoedd)
Share of fossil production has been reduced dramatically• Strong wind growth: 3.5 GW installed capacity;
~ 3 GW under construction and >4 GW in development
• Increased focus on decentralised production, storage and EV charging
• Coal-fired production has been phased out such as Reuter C in Berlin, Moorburg in Hamburg and Hemweg-8 in the Netherlands
…and with this our CO2 emissions We sold the lignite business in 2016, which reduced our CO2 footprint dramatically• We continue to identify further actions such as
retiring coal fired power plants earlier than planned (such as Hemweg-8 in the Netherlands and Moorburg in Germany)
• We are also phasing out coal from all of our operations by 2030, at latest
4 Pro rata values, corresponding to Vattenfall’s share of ownership
2 21 1
83,8
12,1
2015 2020CO2 emissions (Mtonnes)
43
CO2 emissions (Mtonnes)
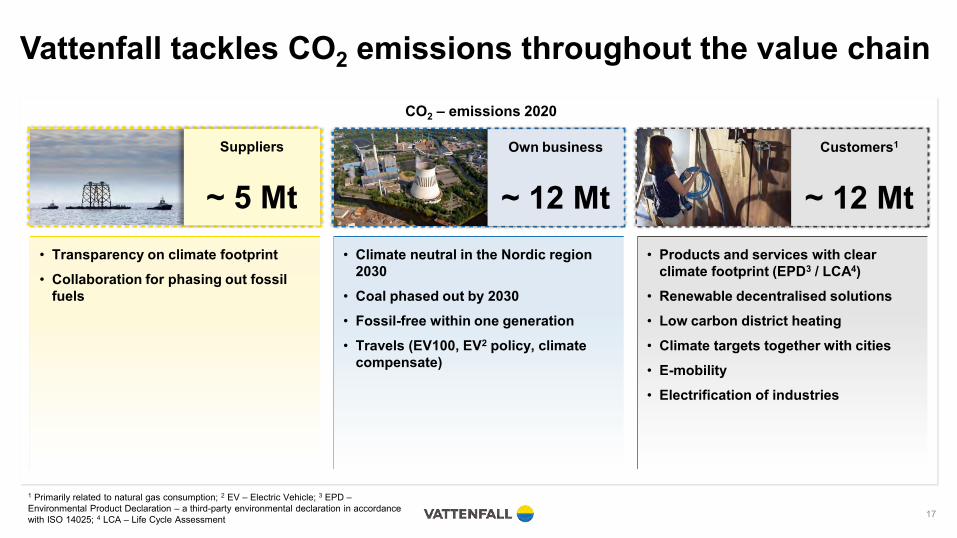
Vattenfall tackles CO2 emissions throughout the value chain
17
CO2 – emissions 2020
• Transparency on climate footprint• Collaboration for phasing out fossil
fuels
• Climate neutral in the Nordic region 2030
• Coal phased out by 2030• Fossil-free within one generation • Travels (EV100, EV2 policy, climate
compensate)
• Products and services with clear climate footprint (EPD3 / LCA4)
• Renewable decentralised solutions• Low carbon district heating• Climate targets together with cities• E-mobility• Electrification of industries
Suppliers
~ 5 MtOwn business
~ 12 MtCustomers1
~ 12 Mt
1 Primarily related to natural gas consumption; 2 EV – Electric Vehicle; 3 EPD –Environmental Product Declaration – a third-party environmental declaration in accordance with ISO 14025; 4 LCA – Life Cycle Assessment

Our commitments toward Net Zero
TODAY
Emission intensityreductionsince 2017
2030
Target for ownemission
reductions
2040
Emissions in our full value
chain
VA
TT
EN
FAL
L E
MIS
SIO
N IN
TE
NS
ITY
2017
-204
0 gC
O2e
/ kW
h

Raising our climate ambitionVattenfall’s emissions intensity target is now in line with the 1.5˚C climate trajectory
*Not considering future ownership structure of added wind and solar production 19
Our ambitions to reach our 2030 commitment
-50%CO2 reductions in
procurement of goods & services
2XElectricity distributed in our
grid
>125 TWhFossil-free electricity
produced*
25XMore e-mobility charge
points in operation
X4Commissioned solar & wind
capacity added
More customers with low or no carbon heat
+30%

Environmental, social and governance (ESG) ratingsVattenfall is assessed by several sustainability rating agencies on its ESG performance
20
We aim to be as open and transparent as possible in our sustainability reporting and we are proud to be highly ranked for our sustainability performance. The below table shows the agencies we actively engage with and our most recent rating scores
Rating Agency Rating focus Score Latest assessment
The leading system globally for disclosing environment data for investors, companies, cities, states and regions Score A: top 2% of all rated companies January 2021
An online platform that enables companies to monitor the CSR performance of their supply chains by providing supplier sustainability ratings
Platinum rating: top 1% of all rated companies and top 3% in the sector February 2021
ESG rating mainly for the investment community. The assessment spans a broad range of ESG issues that are analysed on the basis of up to 100 rating criteria, most of them sector specific
Score B “Prime”: highest decile of companies assessed in the sector May 2021
ESG rating mainly for the investment community. Uses a rules-based methodology to identify industry leaders and laggards. Ranks companies according to their ESG risk exposure and how well they manage those risks relative to peers.
Score AA “Leader”: meaning top 19% of companies assessed in the sector. May 2021
ESG rating mainly for the investment community. Uses a two-dimensional materiality framework that measures a company’s exposure to industry specific material risks and how well a company is managing those risks.
ESG risk rating: Medium 23.2 (strong management score and medium exposure). Top-8% of companies in subindustry
April 2021
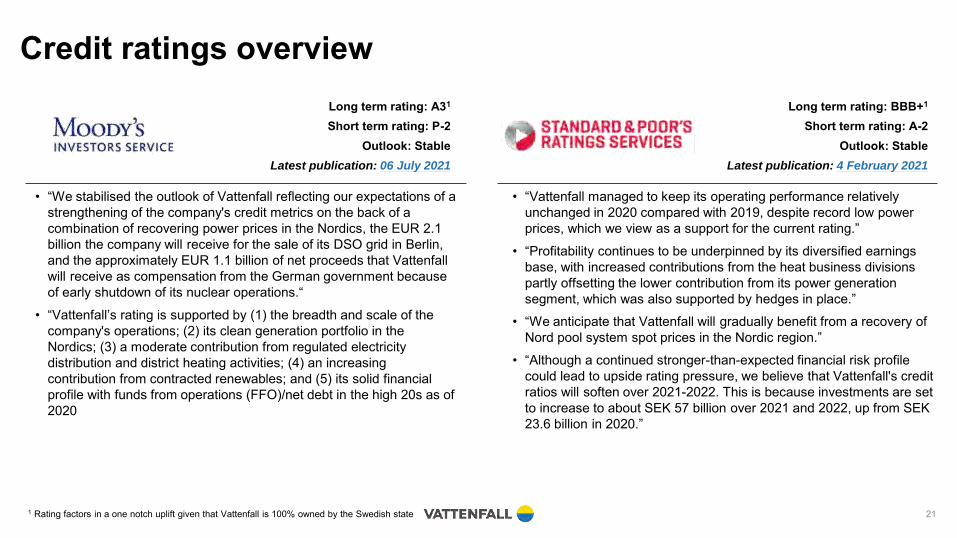
Credit ratings overview
1 Rating factors in a one notch uplift given that Vattenfall is 100% owned by the Swedish state 21
• “We stabilised the outlook of Vattenfall reflecting our expectations of a strengthening of the company's credit metrics on the back of a combination of recovering power prices in the Nordics, the EUR 2.1 billion the company will receive for the sale of its DSO grid in Berlin, and the approximately EUR 1.1 billion of net proceeds that Vattenfall will receive as compensation from the German government because of early shutdown of its nuclear operations.“
• “Vattenfall’s rating is supported by (1) the breadth and scale of the company's operations; (2) its clean generation portfolio in the Nordics; (3) a moderate contribution from regulated electricity distribution and district heating activities; (4) an increasing contribution from contracted renewables; and (5) its solid financial profile with funds from operations (FFO)/net debt in the high 20s as of 2020
• “Vattenfall managed to keep its operating performance relatively unchanged in 2020 compared with 2019, despite record low power prices, which we view as a support for the current rating.”
• “Profitability continues to be underpinned by its diversified earnings base, with increased contributions from the heat business divisions partly offsetting the lower contribution from its power generation segment, which was also supported by hedges in place.”
• “We anticipate that Vattenfall will gradually benefit from a recovery of Nord pool system spot prices in the Nordic region.”
• “Although a continued stronger-than-expected financial risk profile could lead to upside rating pressure, we believe that Vattenfall's credit ratios will soften over 2021-2022. This is because investments are set to increase to about SEK 57 billion over 2021 and 2022, up from SEK 23.6 billion in 2020.”
Long term rating: A31
Short term rating: P-2Outlook: Stable
Latest publication: 06 July 2021
Long term rating: BBB+1
Short term rating: A-2Outlook: Stable
Latest publication: 4 February 2021
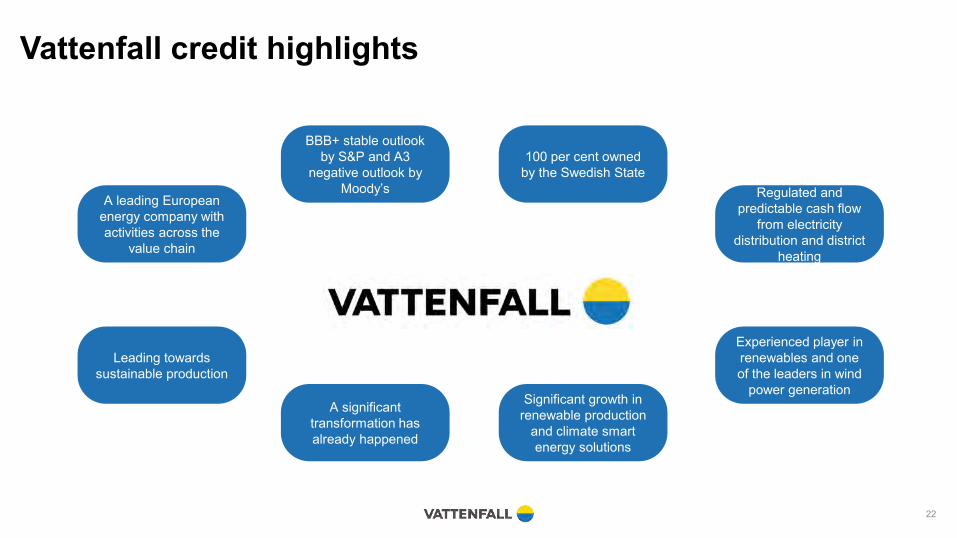
Vattenfall credit highlights
22
BBB+ stable outlook by S&P and A3
negative outlook by Moody’s
100 per cent owned by the Swedish State
Regulated and predictable cash flow
from electricity distribution and district
heating
Experienced player in renewables and one of the leaders in wind
power generationSignificant growth in
renewable production and climate smart energy solutions
A significant transformation has already happened
Leading towards sustainable production
A leading European energy company with activities across the
value chain
Green financing
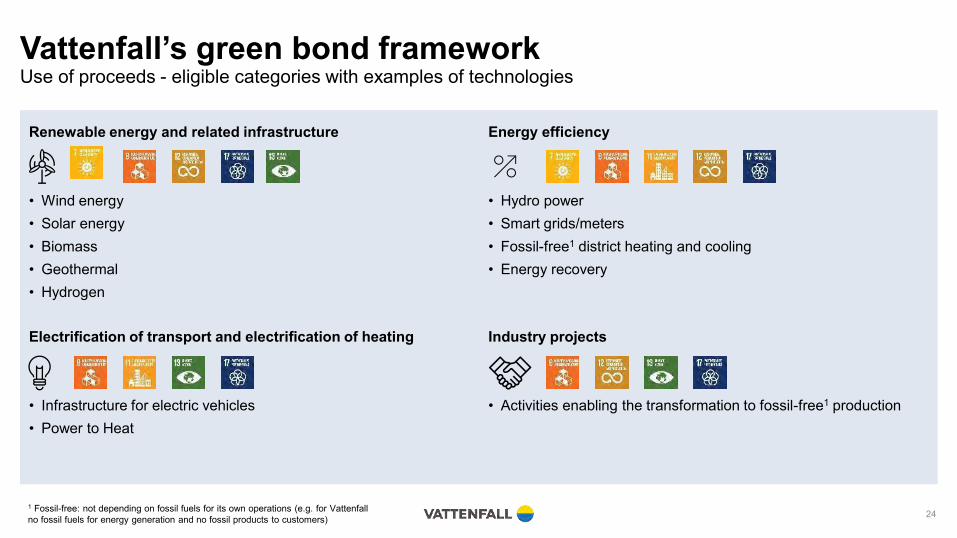
Vattenfall’s green bond frameworkUse of proceeds - eligible categories with examples of technologies
1 Fossil-free: not depending on fossil fuels for its own operations (e.g. for Vattenfall no fossil fuels for energy generation and no fossil products to customers) 24
Energy efficiency
• Hydro power• Smart grids/meters• Fossil-free1 district heating and cooling• Energy recovery
Renewable energy and related infrastructure
• Wind energy• Solar energy• Biomass• Geothermal• Hydrogen
Industry projects
• Activities enabling the transformation to fossil-free1 production
Electrification of transport and electrification of heating
• Infrastructure for electric vehicles• Power to Heat
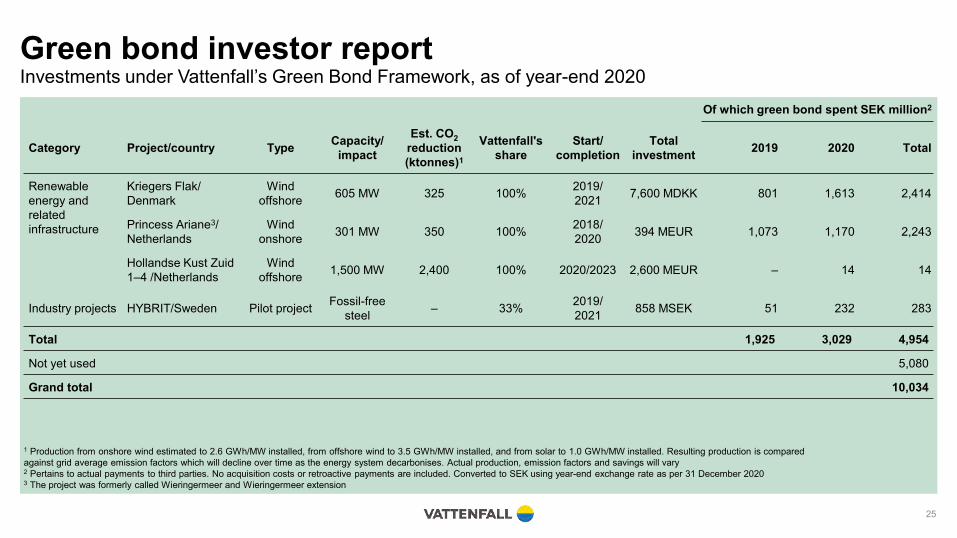
Green bond investor reportInvestments under Vattenfall’s Green Bond Framework, as of year-end 2020
25
Of which green bond spent SEK million2
Category Project/country Type Capacity/impact
Est. CO2reduction(ktonnes)1
Vattenfall'sshare
Start/completion
Totalinvestment 2019 2020 Total
Renewable energy and relatedinfrastructure
Kriegers Flak/Denmark
Wind offshore 605 MW 325 100% 2019/
2021 7,600 MDKK 801 1,613 2,414
Princess Ariane3/Netherlands
Wind onshore 301 MW 350 100% 2018/
2020 394 MEUR 1,073 1,170 2,243
Hollandse Kust Zuid 1–4 /Netherlands
Wind offshore 1,500 MW 2,400 100% 2020/2023 2,600 MEUR – 14 14
Industry projects HYBRIT/Sweden Pilot project Fossil-freesteel – 33% 2019/
2021 858 MSEK 51 232 283
Total 1,925 3,029 4,954
Not yet used 5,080
Grand total 10,034
1 Production from onshore wind estimated to 2.6 GWh/MW installed, from offshore wind to 3.5 GWh/MW installed, and from solar to 1.0 GWh/MW installed. Resulting production is comparedagainst grid average emission factors which will decline over time as the energy system decarbonises. Actual production, emission factors and savings will vary2 Pertains to actual payments to third parties. No acquisition costs or retroactive payments are included. Converted to SEK using year-end exchange rate as per 31 December 20203 The project was formerly called Wieringermeer and Wieringermeer extension

Dark green shading by CICERO
26
Governance: Excellent“Vattenfall is deeply committed to contribute to a green transition towards a low carbon society in the longer run. In addition to subscribing to UN Compact and other sustainability
Project categories“The Green Bond Principles are clearly fulfilled when it comes to the types of projects to be financed through the Green Bond, the selection process, the management of the proceeds and the reporting”
Categories Green shading
Renewable energy and related infrastructure Dark Green
Energy efficiency Medium to DarkGreen
Electrification of transport and heating Dark Green
Industry projects Dark Green
guidelines, Vattenfall has clear and ambitious targets when it comes to reducing energy consumption and CO2 emissions”

Kriegers Flak
1 Year end exchange rate as per 31 December 20202 Pertains to actual payments to third parties. No acquisition costs or retroactive payments are included. Converted to SEK using year-end exchange rate as per 31 December 2020 27
Key dataCapacity 605 MW
Country Denmark
Technology type Wind offshoreTurbine model Siemens Gamesa Turbines 8.4 MWOwnership 100% VattenfallTotal Investment (SEK million1) 10,200
Greenbond/spent(SEK million2)
2,414
Estimated CO2reduction3 325 ktonnes p.a.
Completion 2021
Overview• Danish Kriegers Flak is the latest and
largest of Vattenfall’s recent offshore projects in Denmark, located 15-40 km off the coast in the Baltic Sea
• The project is in construction and in May 2020 the first foundation was placed in the seabed
• When in full operation, scheduled by the end of 2021, this will be Denmark’s largest offshore wind farm with a capacity to cover the annual electricity consumption of approximately 600,000 Danish households
Kriegers Flak,Denmark
2016: Winning of tender
2018: Remaining tender packages signed
2021: Commissioning
2017: Siemens Gamesa wins the turbine tender
2019-2021: Construction and installation
Project Timeline
UN SDG’s
3 Production from offshore wind estimated to 3.5 GWh/MW installed. Actual production factors and savings will vary

Princess Ariane
1 Year end exchange rate as per 31 December 20202 Pertains to actual payments to third parties. No acquisition costs or retroactive payments are included. Converted to SEK using year-end exchange rate as per 31 December 2020 28
Key dataCapacity 301 MW
Country The Netherlands
Technology type Wind onshoreTurbine model Nordex N117 3.6 MWOwnership 100% VattenfallTotal Investment (SEK million1) 4,000
Greenbond/spent(SEK million2)
2, 243
Estimated CO2reduction3 350 ktonnes p.a.
Completion 2021
2017: Final Investment Decision
2018: Tenderpackages signed
2020: Commissioning
2018-2021: Construction and installation
Project Timeline
UN SDG’s
3 Production from offshore wind estimated to 3.5 GWh/MW installed. Actual production factors and savings will vary
Overview• Princess Ariane is the largest onshore wind
farm in the Netherlands• The project is completed in 2021• The electricity generated by the wind farm
is used to power a nearby data centre, saving approximately 350 ktonnes of CO2emissions per year
Princess Ariane,The Netherlands
2021: Handover O&M
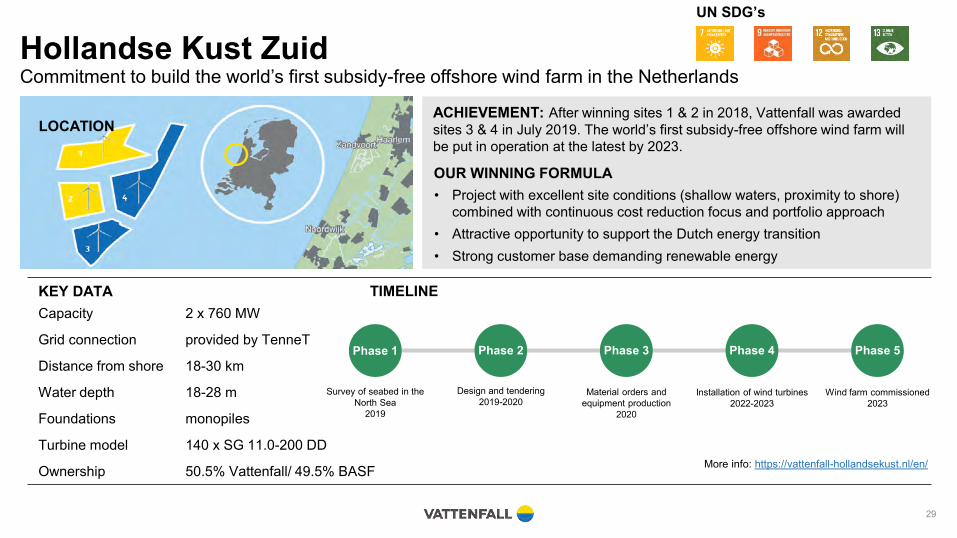
Hollandse Kust Zuid
29
Commitment to build the world’s first subsidy-free offshore wind farm in the Netherlands
• Project with excellent site conditions (shallow waters, proximity to shore) combined with continuous cost reduction focus and portfolio approach
• Attractive opportunity to support the Dutch energy transition• Strong customer base demanding renewable energy
OUR WINNING FORMULA
KEY DATA TIMELINE
LOCATIONACHIEVEMENT: After winning sites 1 & 2 in 2018, Vattenfall was awarded sites 3 & 4 in July 2019. The world’s first subsidy-free offshore wind farm will be put in operation at the latest by 2023.
Capacity 2 x 760 MW
Grid connection provided by TenneT
Distance from shore 18-30 km
Water depth 18-28 m
Foundations monopiles
Turbine model 140 x SG 11.0-200 DD
Ownership 50.5% Vattenfall/ 49.5% BASF More info: https://vattenfall-hollandsekust.nl/en/
Phase 1 Phase 2 Phase 3 Phase 4 Phase 5
Survey of seabed in the North Sea
2019
Design and tendering2019-2020
Material orders and equipment production
2020
Installation of wind turbines2022-2023
Wind farm commissioned2023
UN SDG’s

HYBRITHYBRIT – towards the world’s first fossil-free steel
30
What is HYBRIT?
• HYBRIT – short for Hydrogen Breakthrough Ironmaking Technology – is a joint venture between Vattenfall, SSAB (steel) and LKAB (mining and minerals)
• The aim is to replace coking coal, traditionally needed for ore-based steel making, with fossil-free hydrogen
• The result will be the world’s first fossil-free steel, with virtually no carbon footprint
Why is this important?• The steel industry is one of the highest CO2-emitting
industries, accounting for 7% of global and 10% of Swedish total CO2 emissions
• Steel demand is set to grow due to population and urbanisation → carbon footprint of the industry needs to be addressed
Main project phases2020 2025 2030 2035
2016–2017Pre-feasibility
Study
2018–2024Pilot Phase• 2018–2020 Pilot line design
and building phase• 2021–2024 Pilot line trials
2025–2035Demonstration Plant Trials
Financing and timeline
The total cost for the pilot phase is estimated to be SEK 1.4 billion. The Swedish Energy Agency will contribute more than SEK 500 million towards the pilot phase and the three owners, SSAB, LKAB and Vattenfall, will each contribute one third of the remaining costs. The Swedish Energy Agency has earlier contributed SEK 60 million to the pre-feasibility study and a four-year-long research project.
The pilot phase is planned to last until 2024, after which it will move to the demonstration phase in 2025-2035.
UN SDG’s

Project deep dive – HYBRITHYBRIT enables the decoupling of carbon dioxide and energy
31
Traditional ore-based steelmaking: Reduction reactions in ironmaking represent around 85 to 90 per cent of the total CO2emissions
HYBRIT: Iron metal is produced by using hydrogen gas as the main reductant. Hydrogen reacts with iron oxides to form water instead of CO2
The hydrogen used is green hydrogen i.e. produced by electrolysis of water using fossil-free electricity
Sustainability deep-dives

A strategy and purpose that reflects UN’s agenda 2030Vattenfall’s strategy is driving our contribution to the UN’s Global Sustainable Development Goals (SDGs)
33
Local
Global
Indirect
Vattenfall‘s contribution to the UN Sustainable Development Goals
Strategic SDGs with global impact
Responsible operations SDGs with local impact
Responsible supply chain SDGs with indirect impact
Vattenfall contributes to the goals through its commercial operations. Contributions to these goals have global impacts and are the result of implementing our strategy, in particular when it comes to climate change and consequences for the energy system.
Vattenfall contributes to the goals through its ways of working. Our responsible operations contribute locally, whether in the form of e.g., health & safety or internal diversity standards, or working to have a net positive contribution to biodiversity at our external operating sites.
Vattenfall contributes to the goals through its engagement and influence in the value chain via suppliers and partners. By engaging only with suppliers and partners who meet our social and environmental standards, we ensure that they make positive contributions to the goals that are most relevant for developing countries, as exemplified here.
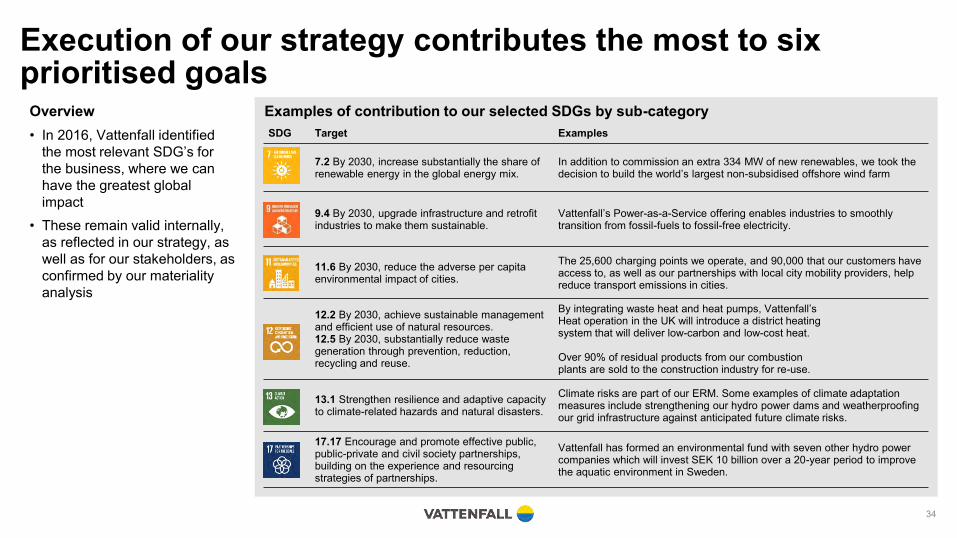
Execution of our strategy contributes the most to six prioritised goals
34
Overview• In 2016, Vattenfall identified
the most relevant SDG’s for the business, where we can have the greatest global impact
• These remain valid internally, as reflected in our strategy, as well as for our stakeholders, as confirmed by our materiality analysis
Examples of contribution to our selected SDGs by sub-categorySDG Target Examples
7.2 By 2030, increase substantially the share of renewable energy in the global energy mix.
In addition to commission an extra 334 MW of new renewables, we took the decision to build the world’s largest non-subsidised offshore wind farm
9.4 By 2030, upgrade infrastructure and retrofit industries to make them sustainable.
Vattenfall’s Power-as-a-Service offering enables industries to smoothly transition from fossil-fuels to fossil-free electricity.
11.6 By 2030, reduce the adverse per capita environmental impact of cities.
The 25,600 charging points we operate, and 90,000 that our customers have access to, as well as our partnerships with local city mobility providers, help reduce transport emissions in cities.
12.2 By 2030, achieve sustainable management and efficient use of natural resources.12.5 By 2030, substantially reduce waste generation through prevention, reduction, recycling and reuse.
By integrating waste heat and heat pumps, Vattenfall’sHeat operation in the UK will introduce a district heatingsystem that will deliver low-carbon and low-cost heat.
Over 90% of residual products from our combustionplants are sold to the construction industry for re-use.
13.1 Strengthen resilience and adaptive capacity to climate-related hazards and natural disasters.
Climate risks are part of our ERM. Some examples of climate adaptation measures include strengthening our hydro power dams and weatherproofing our grid infrastructure against anticipated future climate risks.
17.17 Encourage and promote effective public, public-private and civil society partnerships, building on the experience and resourcing strategies of partnerships.
Vattenfall has formed an environmental fund with seven other hydro power companies which will invest SEK 10 billion over a 20-year period to improve the aquatic environment in Sweden.
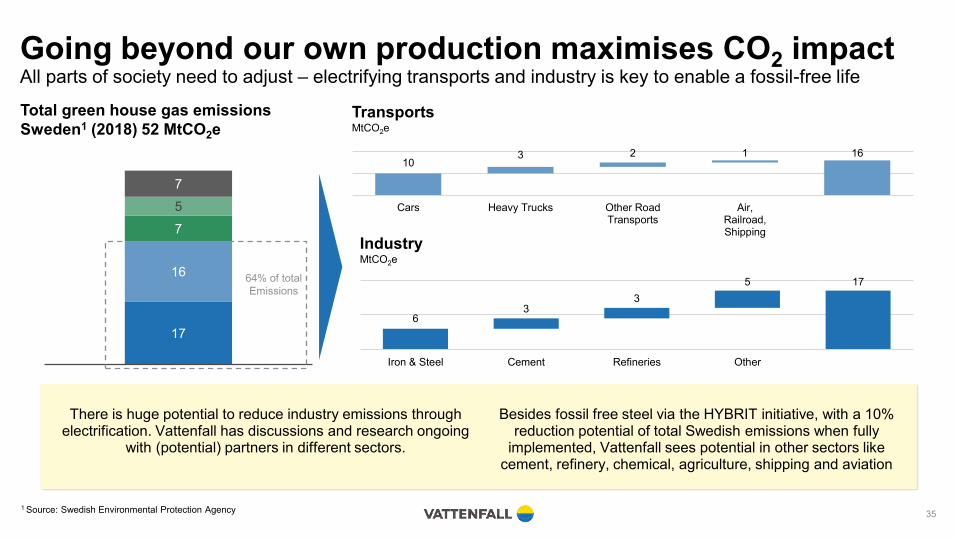
Going beyond our own production maximises CO2 impactAll parts of society need to adjust – electrifying transports and industry is key to enable a fossil-free life
1 Source: Swedish Environmental Protection Agency 35
17
16
757
IndustryMtCO2e
TransportsMtCO2e
63
35 17
Iron & Steel Cement Refineries Other
103 2 1 16
Cars Heavy Trucks Other RoadTransports
Air,Railroad,Shipping
Total green house gas emissions Sweden1 (2018) 52 MtCO2e
64% of total Emissions
There is huge potential to reduce industry emissions through electrification. Vattenfall has discussions and research ongoing
with (potential) partners in different sectors.
Besides fossil free steel via the HYBRIT initiative, with a 10% reduction potential of total Swedish emissions when fully
implemented, Vattenfall sees potential in other sectors like cement, refinery, chemical, agriculture, shipping and aviation

Electricity - from a power source to a source of innovationTogether with our partners, we pave the way for a new generation of transports, industries and materials
36
Developing the world’s first fossil-
free steel
Green guaranteed energy delivery
large customers, e.g.
Cooperation in large scale bio-diesel
production
Support of a major enterprise for
battery production in Sweden
Northern Europe’s largest charging
network for e-vehicles
The world’s first fossil-free motorcycle
Electrification of mines and smelters
Powering sustainable datacenters
Co-operation for e-mobility
Developing flexible solutions for grid
stability

Materiality matrix
Reducing CO2 emissions ✓ ✓ ✓ ✓ ✓ ✓
Providing affordable energy ✓ ✓
Investing in renewable energy ✓ ✓ ✓ ✓ ✓ ✓
Minimising non-CO2emissions ✓ ✓
Protecting nature and biodiversity ✓
Providing affordable, stable and flexible grid infrastructure ✓ ✓
Developing sustainable solutions for customers and partners
✓ ✓ ✓ ✓
Top 7 most material topics
Stakeholder materiality analysis supports strategic focusAccording to our stakeholders, Vattenfall’s core strategy is aligned with the areas of greatest potential impact
37
Between May and June 2020, over 2,900 stakeholders from Vattenfall’s main markets have rated the most material topics based on importance and significance of impact on the environment, society, or economy. Few take away things are mentioned below,• Vattenfall‘s strategy remains in line with stakeholder‘s expectations. Covid-19 has had little impact on expectations• Affordability, CO2 reduction and renewables remain top 3 important topics• Interview responses highlighted the importance of public acceptance to realise energy transition and engaging with local communities

Biodiversity – examples of actionsWe strive to minimise any direct and indirect negative impacts on biodiversity throughout our operations
38
Biotope restoration and species protection
Preserve and manage biodiversity and enhance recreation values
Identify new solutions to reduce environmental impact of hydro power production
Knowledge building activities includes both research and pilot studies
Hydro power
“Laxeleratorn” is a unique, large-scale laboratory for hydro power-related environmental and hydraulic experiments that was inaugurated in 2018. It combines knowledge of biology and hydraulics to find solutions that allow and attract fish to safely pass by the power plant with the smallest possible effect on operations. In 2019, the main projects focused on innovation for downstream fish migration such as bubble curtains and flexible nets to avoid turbine passage.
We are investigating how we can use machine learning to identify and count animal species and how environmental DNA (eDNA i.e. the residual DNA left in the ambient environment by plants and animals) can be used to quickly identify species in our hydro operations. This would be less resource-intensive than the process is today and make it easier to evaluate the effect of measures like fish compensation programmes.
Limit impacts on the marine environment
Reduce impact on and contribute to conservation of fauna
Offshore wind power
Many R&D projects are conducted at the European Offshore Wind Deployment Centre (EOWDC) located in Aberdeen Bay, Scotland. A first project was conducted during construction of the Aberdeen Bay offshore wind farm, where a new type of jacket foundation was used, so-called suction buckets. Instead of monopiles driven into the seabed, giant upside-down buckets paired with jacket substructures anchor the wind turbines to the seabed. The method is virtually noiseless, which reduces the disturbance to marine life.
Maintenance of habitats and protecting species
Power distribution
Clearance work for power lines opens meadow-like fields for threatened and rare species, like the butterfly marsh fritillary. With GIS mapping and field inventories performed during 2018, important biodiversity hotspots have been identified, and adjusted clearance plans have been developed accordingly. A pilot project outside Stockholm uses goats instead of machines to clear the landscape, which favours biodiversity.
Aim Business area Examples
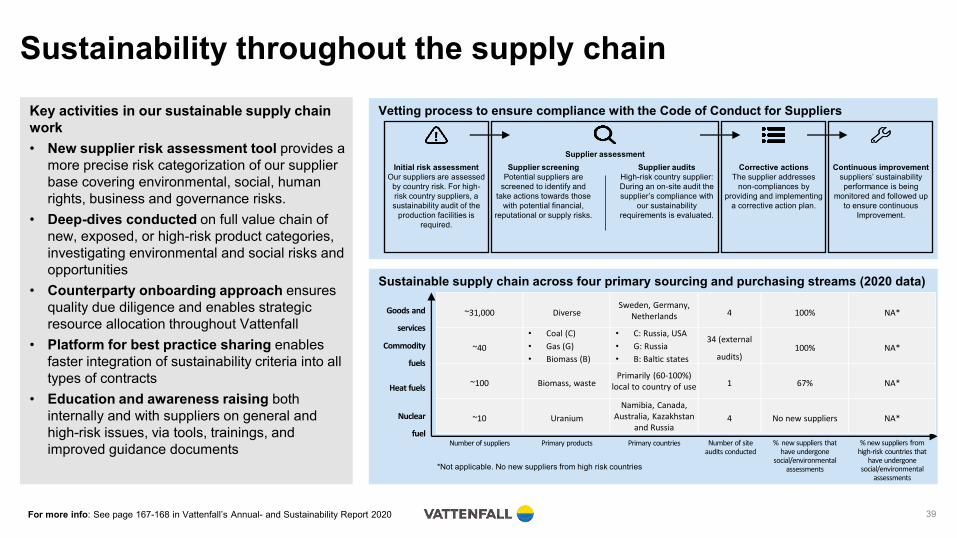
Sustainability throughout the supply chain
For more info: See page 167-168 in Vattenfall’s Annual- and Sustainability Report 2020 39
*Not applicable. No new suppliers from high risk countries
Nuclear
fuel
Heat fuels
Commodity
fuels
Goods and
services
Number of suppliers
~10
~100
~40
~31,000
Number of site audits conducted
4
1
34 (external
audits)
4
% new suppliers that have undergone
social/environmental assessments
No new suppliers
67%
100%
100%
% new suppliers from high-risk countries that
have undergone social/environmental
assessments
NA*
NA*
NA*
NA*
Primary products
Uranium
Biomass, waste
• Coal (C)
• Gas (G)
• Biomass (B)
Diverse
Primary countries
Namibia, Canada, Australia, Kazakhstan
and Russia
Primarily (60-100%) local to country of use
• C: Russia, USA
• G: Russia
• B: Baltic states
Sweden, Germany, Netherlands
Initial risk assessmentOur suppliers are assessed
by country risk. For high-risk country suppliers, a sustainability audit of the
production facilities is required.
Supplier assessmentCorrective actions
The supplier addresses non-compliances by
providing and implementing a corrective action plan.
Continuous improvementsuppliers’ sustainability performance is being
monitored and followed up to ensure continuous
Improvement.
Supplier screeningPotential suppliers are
screened to identify and take actions towards those
with potential financial, reputational or supply risks.
Supplier auditsHigh-risk country supplier: During an on-site audit the supplier’s compliance with
our sustainability requirements is evaluated.
Sustainable supply chain across four primary sourcing and purchasing streams (2020 data)
Vetting process to ensure compliance with the Code of Conduct for SuppliersKey activities in our sustainable supply chain work• New supplier risk assessment tool provides a
more precise risk categorization of our supplier base covering environmental, social, human rights, business and governance risks.
• Deep-dives conducted on full value chain of new, exposed, or high-risk product categories, investigating environmental and social risks and opportunities
• Counterparty onboarding approach ensures quality due diligence and enables strategic resource allocation throughout Vattenfall
• Platform for best practice sharing enables faster integration of sustainability criteria into all types of contracts
• Education and awareness raising both internally and with suppliers on general and high-risk issues, via tools, trainings, and improved guidance documents

Towards a circular economyWe are committed to enable sustainable use of resources and contribute to a circular economy
40
We offer new products and business models- We are developing new products and energy solutions, as-a-service based models and digital solutions to integrate small scale producers. We change unsustainable processes and sectors- We switch fuels, partner with industry to make materials more sustainable and fossil free (e.g. steel, cement, fuels), and work to electrify the transport sector.
✓
✓
We use resources in smarter ways - We use life cycle assessments to assess and manage environmental performance across the full value chain. We also work to design our assets and processes to reduce resource consumption, increase reuse and recycling, and extend the lifetime of our assets.
✓
We invest heavily in renewable energy - Our key role as an energy company is providing renewable energy to drive the circular economy.
✓
Examples of activitiesRecycling excess heat In the initiative Samenergi, Vattenfall collaborates with SME’s to help them recycle excess heat and utilise it in the district heating network. (Image from Lindvall’s coffee manufacturing site, a Samenergi partner.)Photographer: John Guthed
Phase-out of creosote polesIn a circular economy, hazardous substances must be kept out of material streams. Vattenfall is phasing out creosote poles from distribution grids. Alternative materials and methods are used and tested for new poles.Declaring life cycle impactsVattenfall provides transparent, verified and comparable information about the life-cycle resource utilisation and environmental impacts from our electricity generation through environmental product declarations®.
Vattenfall contributes to the circular economy:
A circular economy is based on the principles of keeping products and materials in use, designing out waste and pollution, and using regenerative natural systems. It is a sustainable alternative to the current ‘take-make-dispose’ linear economic system. The transition to a more circular economy is central to the Green Deal – EU’s policy road map towards a low-carbon, sustainable society. In circular systems, focus is on extending the life-time of products and materials, sharing and pooling of resources, repairing, reusing and recycling to create closed-loop systems, and utilizing smart designs to minimise resource input and the generation of waste, pollution and CO2 emissions.

Adaptation to climate changeWe continuously monitor, invest in and modernise our assets to ensure safety and resilience
1 For more info see page 69 in the Annual- and sustainability report 2020
41
▪ There is increasing urgency linked to climate change and the reduction of emissions needs to accelerate. Climate change affects Vattenfall through both physical effects on our assets and operations, and through changes associated with the transition to a fossil-free society. We are committed to our goal of enabling fossil-free living within one generation and have a high focus on adapting to change.
▪ Vattenfall supports the disclosure of climate related risks and opportunities in accordance with recommendations from the Task Force on Climate-related Financial Disclosures (TCFD)1.
Ensuring security of supply and resilient operationsIn 2019 an assessment of effects of climate change and status of adaptation was conducted for Vattenfall’s operations. It showed that there is a good general level of awareness and measures in place to reduce climate-related risks.
Examples of measures to ensure resilient operations are replacing overhead powerlines with underground cables, tree clearance, flood protection, investments to adapt hydropower dams to future higher flows, and improved monitoring. Vattenfall will continue to have strong focus on management of climate risks, through e.g. scenario analyses and increased focus on supply chain aspects.
Climate change affects VattenfallToday, the world is about 1 ºC warmer than preindustrial levels and it is rising. Climate change leads to physical changes in parameters such as temperature, rainfall and sea level. This will affect Vattenfall’s assets and operations.
As an example, changes in the frequency and magnitude of extreme weather events such as strong winds, flooding or forest fires can lead to infrastructure damage. Similarly, changes to rainfall and snowmelt affects river flows, which has relevance for our hydropower production, planning and dam safety aspects. Vattenfall continuously works to improve the safety and robustness of our operations.
Customers & Solutions

Customers & SolutionsProviding sustainable energy solutions and services to retail and business customers
1 Operating profit excluding items affecting comparability2 NPS is a tool for measuring customer loyalty and for gaining an understanding of customers’ perceptions of Vattenfall’s products and services
43
Overview• Strong incumbent positions in core
markets • A growing customer base with high loyalty • Strong expertise across the full energy
value chain means that we can offer simple integrated solutions to satisfy increasingly sophisticated customer needs
• Brand perception on positive trend according to several surveys
• Well-developed IT infrastructure keeps operations cost-effective
• Our e-mobility charging network -InCharge - is one of the largest in northern Europe
Key dataHighlights
10.2 million customer contracts in Europe
95.8 TWh of electricity sold in 2020
25,600 connected charging points for electric vehicles
FY 2020 FY 2019
Net sales (SEK bn) 86.3 89.9
External net sales (SEK bn) 84.7 87.3
Underlying EBIT1 (SEK bn) 2.1 1.3
Sales of electricity (TWh) 95.8 89.5
- of which, private customers 26.3 28.0
- of which, resellers 8.0 6.5
- of which, business customers 61.5 55.0
Sales of gas (TWh) 52.1 54.2
Net Promoter Score (NPS) relative2 +2 +1
8.3 8.4 8.7 9.7 10.2 10.1 10,2
0
2
4
6
8
10
12
2015 2016 2017 2018 2019 2020 H1 2021
Feenstra added
75%
20-25%
15%
B2C B2B
Sweden
15-20%20-25%
B2C B2B
35%
Germany
Customers & SolutionsMarket overview
1 Year-end 2020 numbers 44
8-12% 5-15%
B2C B2B
FinlandNetherlands
40%
35%
9%
2-5%
B2C B2B
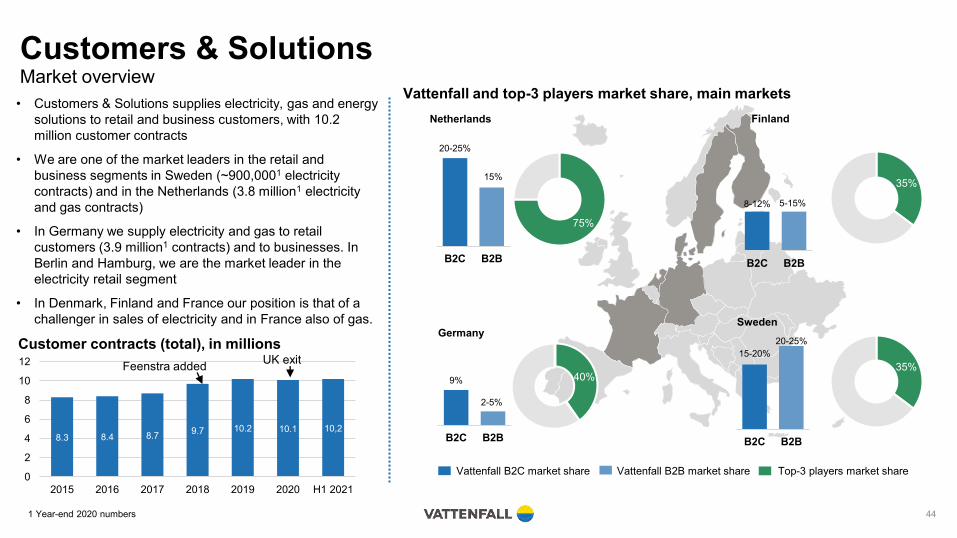
• Customers & Solutions supplies electricity, gas and energy solutions to retail and business customers, with 10.2 million customer contracts
• We are one of the market leaders in the retail and business segments in Sweden (~900,0001 electricity contracts) and in the Netherlands (3.8 million1 electricity and gas contracts)
• In Germany we supply electricity and gas to retail customers (3.9 million1 contracts) and to businesses. In Berlin and Hamburg, we are the market leader in the electricity retail segment
• In Denmark, Finland and France our position is that of a challenger in sales of electricity and in France also of gas.
Customer contracts (total), in millions
Vattenfall and top-3 players market share, main markets
Vattenfall B2C market share Vattenfall B2B market share Top-3 players market share
UK exit
Using digitalisation to enhance the customer experience
45
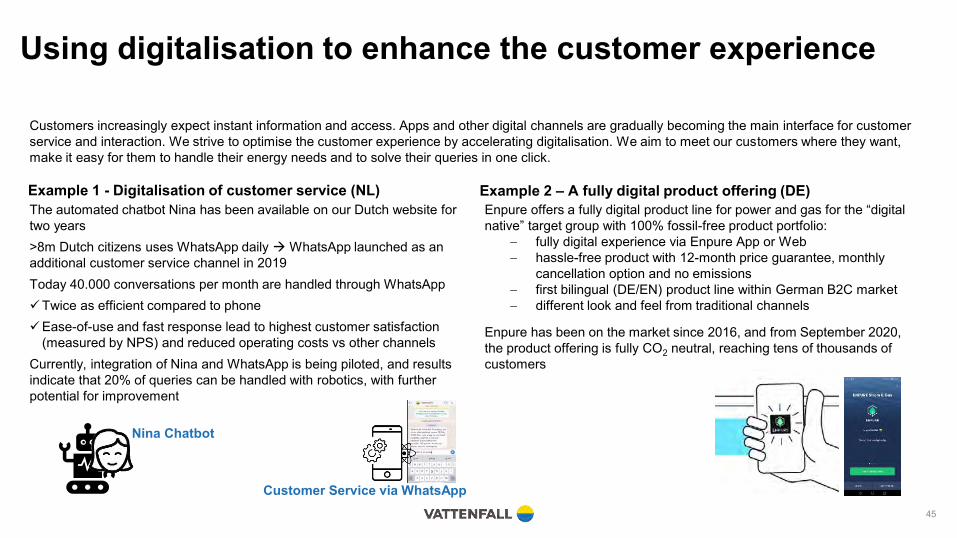
Customers increasingly expect instant information and access. Apps and other digital channels are gradually becoming the main interface for customer service and interaction. We strive to optimise the customer experience by accelerating digitalisation. We aim to meet our customers where they want, make it easy for them to handle their energy needs and to solve their queries in one click.
The automated chatbot Nina has been available on our Dutch website for two years>8m Dutch citizens uses WhatsApp daily → WhatsApp launched as an additional customer service channel in 2019Today 40.000 conversations per month are handled through WhatsApp✓Twice as efficient compared to phone✓Ease-of-use and fast response lead to highest customer satisfaction
(measured by NPS) and reduced operating costs vs other channelsCurrently, integration of Nina and WhatsApp is being piloted, and results indicate that 20% of queries can be handled with robotics, with further potential for improvement
Enpure offers a fully digital product line for power and gas for the “digital native” target group with 100% fossil-free product portfolio:
− fully digital experience via Enpure App or Web− hassle-free product with 12-month price guarantee, monthly
cancellation option and no emissions− first bilingual (DE/EN) product line within German B2C market− different look and feel from traditional channels
Enpure has been on the market since 2016, and from September 2020, the product offering is fully CO2 neutral, reaching tens of thousands of customers
Example 2 – A fully digital product offering (DE)Example 1 - Digitalisation of customer service (NL)
Nina Chatbot
Customer Service via WhatsApp

5.0
10.513.3
14.918.5
22,425,6
H1 2018 H2 2018 H1 2019 H2 2019 H1 2020 H2 2020 H1 2021
Number of charging points (thousand)
E-mobility – enabling the electrification of transportsInCharge offers everything from infrastructure and hardware installation to software and connected services
For more info: See page 34-35 in Vattenfall’s Annual- and Sustainability Report 2019 46
Partners (examples)
InCharge is fully owned by Vattenfall but grows together with our partners. We take care of all the details with end-to-end services, offering everything from infrastructure and hardware installation to software and connected services – all backed up with expertise and advice.
In close collaboration with government officials and planners, InCharge makes it easier for cities to become greener and cleaner. Businesses, large and small, housing associations and estates, as well as private homeowners all have flexible options to choose from our portfolio.
The e-mobility market is rapidly developing,and new players are shaping their roles in the value chain. Vattenfall therefore needs to be innovative and agile, taking advantage ofthe multitude of services our organisationas well as our partners can offer.
One example is Flexpower in Amsterdam where InCharge charging points are steered based on daily load curves from the grid operator and forecasts for local neighborhood solar panel production.
E-mobility markets

Power Generation

Power GenerationOne of Europe’s largest providers of fossil-free electricity
1 Operating profit excluding items affecting comparability 48
Overview• Largest segment by power production volume in
Vattenfall, contributing to our position as Europe’s second largest provider of fossil-free electricity
• Century-long roots in hydro power and a leading position in Sweden's hydro power development
• Major owner of nuclear power with vast experience of nuclear operations, decommissioning and management of radioactive waste and spent nuclear fuel
• One of the leading energy trading companies in Europe offering reliable, responsible and flexible access to all relevant commodity wholesale markets
• Sourcing of fuels and carbon credits for Vattenfall and third parties as well as optimising and managing risk and flexible assets of Vattenfall's fuel portfolio
• Proprietary trading within the risk mandate set by Vattenfall's Board of Directors
• Responsible for Sweden’s leading maintenance service business in the energy sector
Key dataFY 2020 FY 2019
Net sales (SEK bn) 90.1 102.4
External net sales (SEK bn) 36.6 38.4
Underlying EBIT1 (SEK bn) 14.7 15.4
Electricity generation (TWh) 79.0 89.2
- of which, nuclear 39.3 53.3
- of which, hydro 39.7 35.7
Customer sales of electricity (TWh) 20.0 27.0
- of which, resellers 17.9 22.8
- of which, business customers 2.1 4.2
Laxede power plant, Sweden
Highlights
5.5 GW nuclear power
11.5 GW hydro power
5.6 SEK bn services revenues
8 GW PPAs under management

Nuclear power
49
Nuclear Power Plant listNuclearPower Plant Country Installed
Capacity (MW)Vattenfall
ownership share Co-Owners CommissionYear
Final operating year Operation status Decommissioning status
Ringhals Sweden 3,967 70.4% Sydkraft Nuclear Power AB (29.6%)
Ringhals 1: 1976; Ringhals 2: 1975; Ringhals 3: 1981; Ringhals 4: 1983
Ringhals 2: 2019; Ringhals 1: 2020 In operation Ringhals 1 & 2: Shutdown, in pre-
decommissioning planning
Forsmark Sweden 3,271 66.0%E.ON (8.5%) and
Mellansvensk Kraftgrupp (25.5%)
Forsmark 1: 1980; Forsmark 2: 1981; Forsmark 3: 1985
- In operation -
Brunsbüttel Germany 771 66.7% E.ON (33.3%) 1977 2007 Offline Decommissioning modeKrümmel Germany 1,346 50.0% E.ON (50.0%) 1984 2011 Offline Planned to initiate
decommissioning in 2021Stade Germany 640 33.3% PreussenElektra
GmbH (66.7%) 1972 2003 Offline Undergoing decommissioning since Oct 2005
Brokdorf Germany 1,410 20.0% PreussenElektra GmbH (80.0%) 1986 31 Dec 2021 In Operation -
Vattenfall’s nuclear power plants• Vattenfall owns eleven nuclear reactors. Seven reactors are located in Sweden (four at Ringhals, three at
Forsmark), and three in Germany (Brunsbüttel, Krümmel and minority stakes in Brokdorf and Stade)• Five of our reactors are in commercial operation in Sweden and one reactor; Brokdorf, is in commercial operation
in Germany (to be closed by year-end 2021)• Vattenfall’s power generation in 2020 amounted to 39.3 TWh (53.3). Combined availability was 76.4 % (87.8%)
Offline
In operationSweden
Germany
Forsmark
Ringhals
Brunsbüttel
Krümmel
Stade
Brokdorf
Sweden
Germany
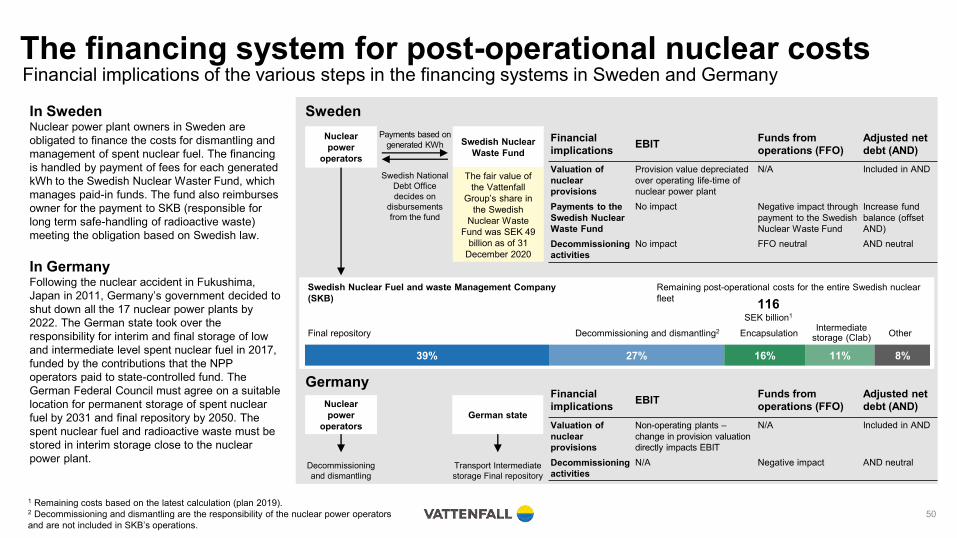
39% 27% 16% 11% 8%
Final repository Decommissioning and dismantling2 Encapsulation Intermediatestorage (Clab) Other
116SEK billion1
Remaining post-operational costs for the entire Swedish nuclear fleet
Swedish Nuclear Fuel and waste Management Company (SKB)
Nuclear power
operators
Swedish Nuclear Waste Fund
The fair value of the Vattenfall
Group’s share in the Swedish
Nuclear Waste Fund was SEK 49
billion as of 31 December 2020
Payments based on generated KWh
Swedish National Debt Office decides on
disbursements from the fund
Nuclear power
operators
Decommissioning and dismantling
German state
Transport Intermediate storage Final repository
The financing system for post-operational nuclear costsFinancial implications of the various steps in the financing systems in Sweden and Germany
1 Remaining costs based on the latest calculation (plan 2019).2 Decommissioning and dismantling are the responsibility of the nuclear power operators and are not included in SKB’s operations.
50
Financial implications EBIT Funds from
operations (FFO)Adjusted net debt (AND)
Valuation of nuclear provisions
Provision value depreciated over operating life-time of nuclear power plant
N/A Included in AND
Payments to the Swedish Nuclear Waste Fund
No impact Negative impact through payment to the Swedish Nuclear Waste Fund
Increase fund balance (offset AND)
Decommissioning activities
No impact FFO neutral AND neutral
In SwedenNuclear power plant owners in Sweden are obligated to finance the costs for dismantling and management of spent nuclear fuel. The financing is handled by payment of fees for each generated kWh to the Swedish Nuclear Waster Fund, which manages paid-in funds. The fund also reimburses owner for the payment to SKB (responsible for long term safe-handling of radioactive waste) meeting the obligation based on Swedish law.
In GermanyFollowing the nuclear accident in Fukushima, Japan in 2011, Germany’s government decided to shut down all the 17 nuclear power plants by 2022. The German state took over the responsibility for interim and final storage of low and intermediate level spent nuclear fuel in 2017, funded by the contributions that the NPP operators paid to state-controlled fund. The German Federal Council must agree on a suitable location for permanent storage of spent nuclear fuel by 2031 and final repository by 2050. The spent nuclear fuel and radioactive waste must be stored in interim storage close to the nuclear power plant.
Financial implications EBIT Funds from
operations (FFO)Adjusted net debt (AND)
Valuation of nuclear provisions
Non-operating plants –change in provision valuation directly impacts EBIT
N/A Included in AND
Decommissioning activities
N/A Negative impact AND neutral
Hydro power
51
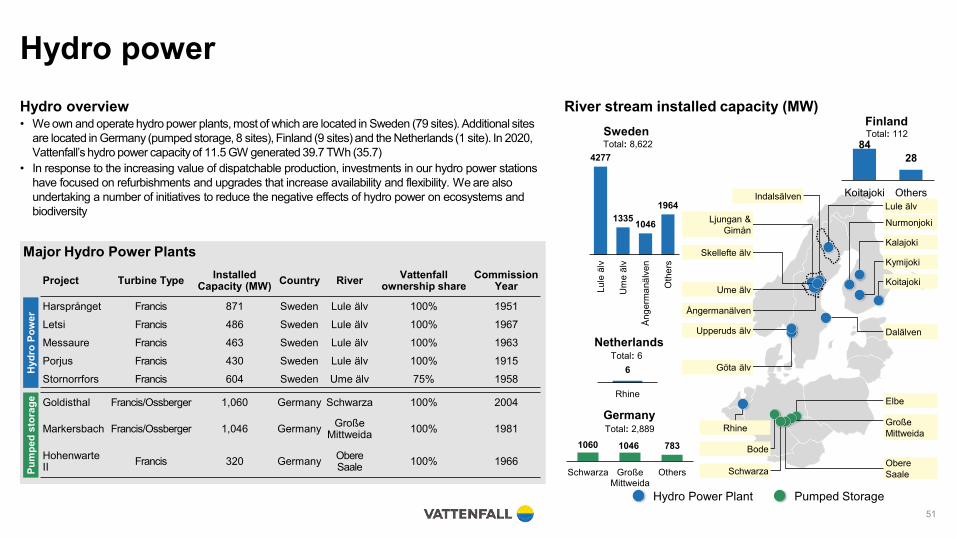
Hydro overview• We own and operate hydro power plants, most of which are located in Sweden (79 sites). Additional sites
are located in Germany (pumped storage, 8 sites), Finland (9 sites) and the Netherlands (1 site). In 2020, Vattenfall’s hydro power capacity of 11.5 GW generated 39.7 TWh (35.7)
• In response to the increasing value of dispatchable production, investments in our hydro power stations have focused on refurbishments and upgrades that increase availability and flexibility. We are also undertaking a number of initiatives to reduce the negative effects of hydro power on ecosystems and biodiversity
Project Turbine Type InstalledCapacity (MW) Country River Vattenfall
ownership shareCommission
Year
Harsprånget Francis 871 Sweden Lule älv 100% 1951Letsi Francis 486 Sweden Lule älv 100% 1967Messaure Francis 463 Sweden Lule älv 100% 1963Porjus Francis 430 Sweden Lule älv 100% 1915Stornorrfors Francis 604 Sweden Ume älv 75% 1958
Finland
Germany
Netherlands
Sweden
Kymijoki
Lule älv
Kalajoki
Nurmonjoki
Obere Saale
Indalsälven
Elbe
Große Mittweida
Dalälven
Koitajoki
Rhine
Bode
Schwarza
Ångermanälven
Göta älv
Ljungan & Gimån
Skellefte älv
Ume älv
Upperuds älv
River stream installed capacity (MW)
4277
1335 1046
1964
Lule
älv
Um
e äl
v
Ånge
rman
älve
n
Oth
ers
Total: 8,622 8428
Koitajoki Others
Total: 112
1060 1046 783
Schwarza GroßeMittweida
Others
Total: 2,889
6
Rhine
Total: 6
Hydro Power Plant Pumped Storage
Goldisthal Francis/Ossberger 1,060 Germany Schwarza 100% 2004
Markersbach Francis/Ossberger 1,046 Germany Große Mittweida 100% 1981
Hohenwarte II Francis 320 Germany Obere
Saale 100% 1966
Hydr
o Po
wer
Pum
ped
stor
age
Major Hydro Power Plants

The inherent flexibility of Vattenfall’s hydro power visualised
52
0
5000
10000
15000
20000
25000
1 13 25 37 49 61 73 85 97 109 121 133 145 157
MW
h/h Hydro
Nuclear
CHP*Wind
WEEK
Intrahourlyfluctuations
Hourlyfluctuations
Dailyfluctuations
Seasonalfluctuations
Yearlyfluctuations
Balancing and Intraday
Intraday & Day Aheadmarkets/ contracts Day Ahead markets/ contracts Forwards, markets for futures Forwards, markets for futures
Hydro Hydro Hydro Hydro HydroUp and
downward regulation
0
1000
2000
3000
4000
1 5 9 13 17 21 25 29 33 37 41 45 49
GW
h
YEAR
Hydro
Nuclear
CHP*Wind
Flexible hydro power plays an instrumental role in an energy system with more and more wind and solar powerThe intensified focus on climate change and CO2 emissions has contributed to significant growth in installed capacity of renewable energy sources. However, the intermittent nature of these energy sources makes it necessary to have back-up capacity. Flexible hydro power can offer its huge reservoirs of stored water as a giant “green” battery for the Nordic region and other markets (with the help of interconnectors)
*Combined heat and power plant (CHP)
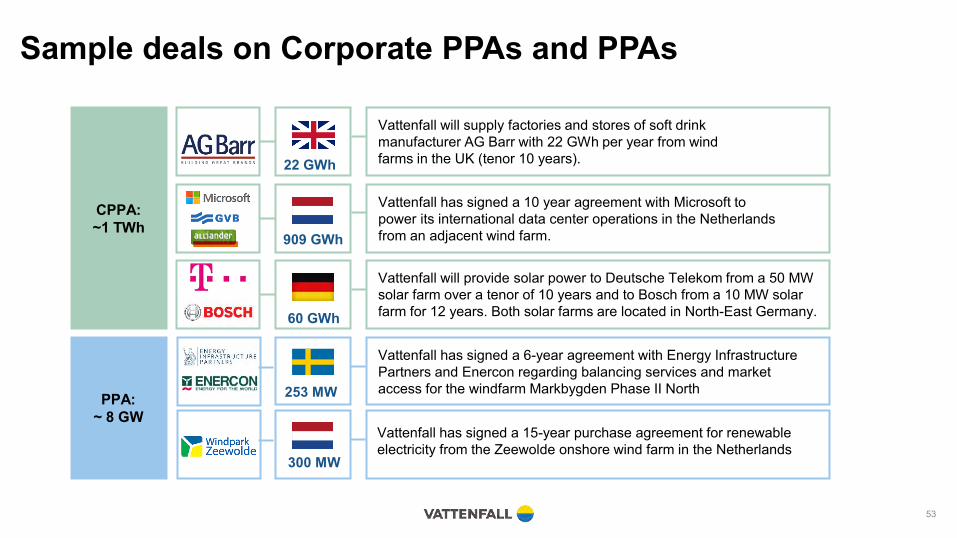
Sample deals on Corporate PPAs and PPAs
53
CPPA:~1 TWh
PPA:~ 8 GW
Vattenfall will supply factories and stores of soft drink manufacturer AG Barr with 22 GWh per year from wind farms in the UK (tenor 10 years).
Vattenfall has signed a 10 year agreement with Microsoft to power its international data center operations in the Netherlandsfrom an adjacent wind farm.
Vattenfall will provide solar power to Deutsche Telekom from a 50 MW solar farm over a tenor of 10 years and to Bosch from a 10 MW solar farm for 12 years. Both solar farms are located in North-East Germany.
22 GWh
909 GWh
60 GWh
253 MW
Vattenfall has signed a 15-year purchase agreement for renewable electricity from the Zeewolde onshore wind farm in the Netherlands
300 MW
Vattenfall has signed a 6-year agreement with Energy Infrastructure Partners and Enercon regarding balancing services and marketaccess for the windfarm Markbygden Phase II North
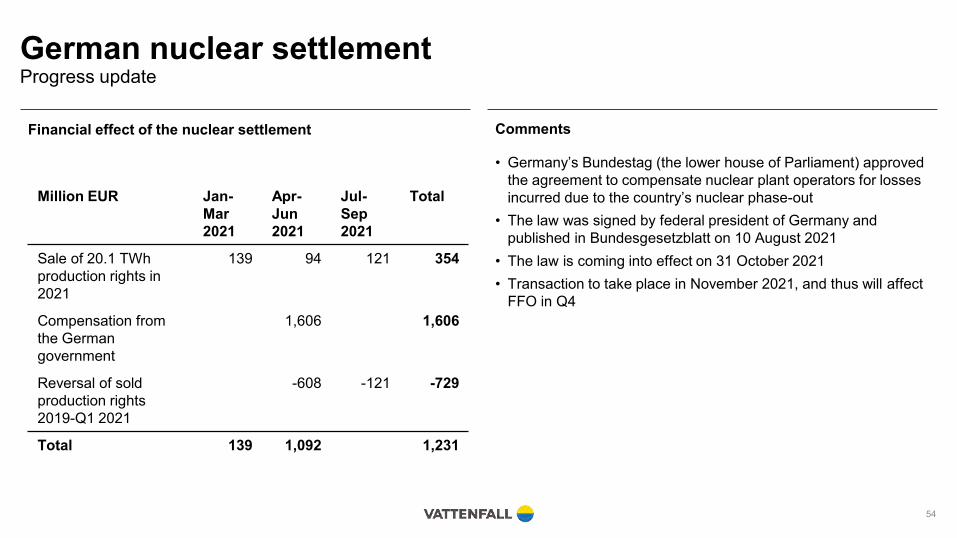
German nuclear settlementProgress update
54
Financial effect of the nuclear settlement Comments
• Germany’s Bundestag (the lower house of Parliament) approved the agreement to compensate nuclear plant operators for losses incurred due to the country’s nuclear phase-out
• The law was signed by federal president of Germany and published in Bundesgesetzblatt on 10 August 2021
• The law is coming into effect on 31 October 2021• Transaction to take place in November 2021, and thus will affect
FFO in Q4
Million EUR Jan-Mar 2021
Apr-Jun 2021
Jul-Sep2021
Total
Sale of 20.1 TWhproduction rights in 2021
139 94 121 354
Compensation from the German government
1,606 1,606
Reversal of sold production rights 2019-Q1 2021
-608 -121 -729
Total 139 1,092 1,231

Wind
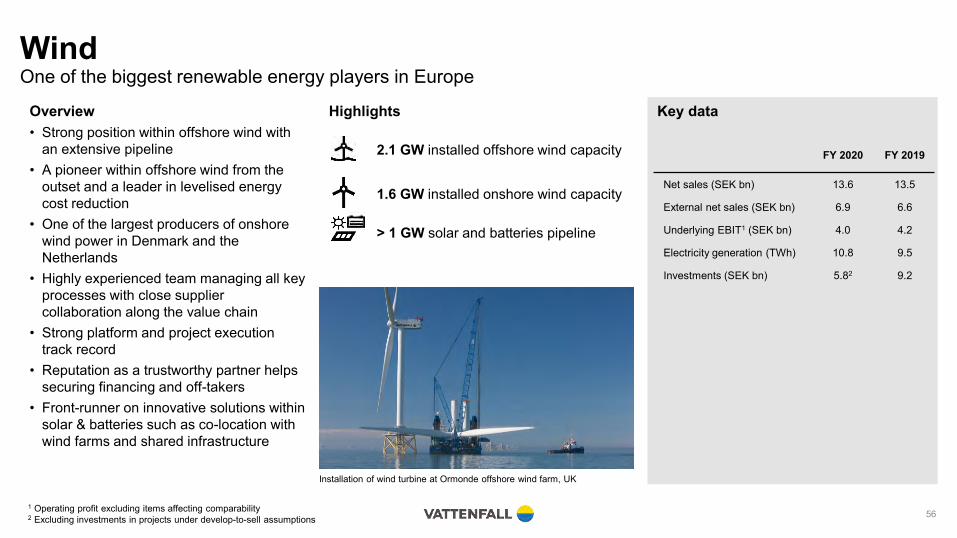
WindOne of the biggest renewable energy players in Europe
1 Operating profit excluding items affecting comparability2 Excluding investments in projects under develop-to-sell assumptions 56
Overview• Strong position within offshore wind with
an extensive pipeline• A pioneer within offshore wind from the
outset and a leader in levelised energy cost reduction
• One of the largest producers of onshore wind power in Denmark and the Netherlands
• Highly experienced team managing all key processes with close supplier collaboration along the value chain
• Strong platform and project execution track record
• Reputation as a trustworthy partner helps securing financing and off-takers
• Front-runner on innovative solutions within solar & batteries such as co-location with wind farms and shared infrastructure
Key data
Installation of wind turbine at Ormonde offshore wind farm, UK
Highlights
2.1 GW installed offshore wind capacity
1.6 GW installed onshore wind capacity
> 1 GW solar and batteries pipeline
FY 2020 FY 2019
Net sales (SEK bn) 13.6 13.5
External net sales (SEK bn) 6.9 6.6
Underlying EBIT1 (SEK bn) 4.0 4.2
Electricity generation (TWh) 10.8 9.5
Investments (SEK bn) 5.82 9.2
Geographical overview – we develop, construct and operate wind and solar PV farms in our core European markets1
Horns Rev 3Sandbank
Aberdeen Bay
Danish Kriegers Flak
Vesterhav
Norfolk Vanguard
Alpha Ventus
Kentish Flats Extension
LillgrundHorns Rev 1
Dan Tysk
Norfolk Boreas
Thanet
Kentish Flats
Ormonde
16
7
7
1
Hollandse Kust Zuid 1-4
Capacity of top 10 Global Offshore Players (GW)²
Under construction and pipeline1
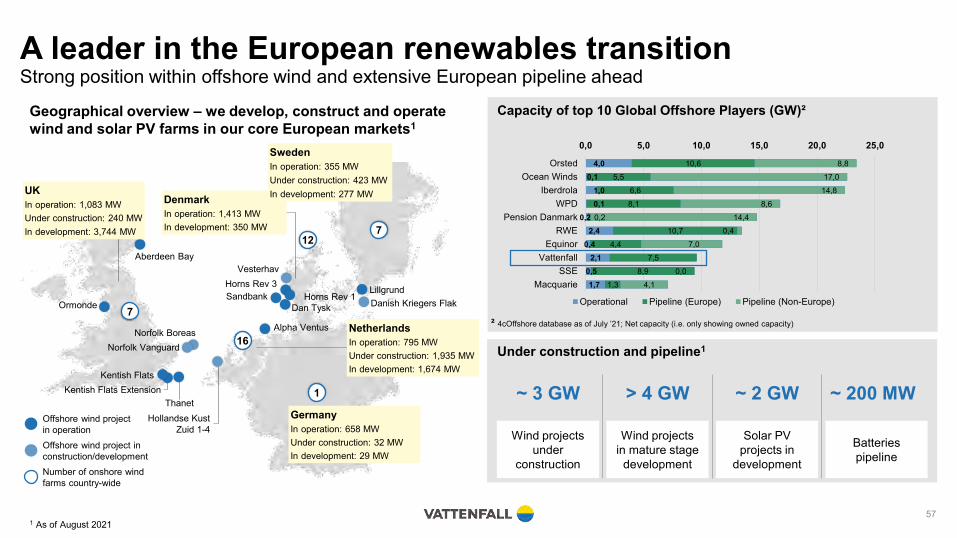
A leader in the European renewables transitionStrong position within offshore wind and extensive European pipeline ahead
1 As of August 202157
12
NetherlandsIn operation: 795 MWUnder construction: 1,935 MWIn development: 1,674 MW
~ 3 GW
Wind projects under
construction
> 4 GW
Wind projects in mature stage
development
~ 2 GW
Batteries pipeline
~ 200 MW
Solar PV projects in
development
Offshore wind project in operation
Number of onshore wind farms country-wide
Offshore wind project in construction/development
GermanyIn operation: 658 MWUnder construction: 32 MWIn development: 29 MW
DenmarkIn operation: 1,413 MWIn development: 350 MW
SwedenIn operation: 355 MWUnder construction: 423 MWIn development: 277 MWUK
In operation: 1,083 MWUnder construction: 240 MWIn development: 3,744 MW
1,70,5
2,10,4
2,40,2
0,11,0
0,14,0
1,38,9
7,54,4
10,70,2
8,16,6
5,510,6
4,10,0
7,00,4
14,48,6
14,817,0
8,8
0,0 5,0 10,0 15,0 20,0 25,0
MacquarieSSE
VattenfallEquinor
RWEPension Danmark
WPDIberdrola
Ocean WindsOrsted
Operational Pipeline (Europe) Pipeline (Non-Europe)
² 4cOffshore database as of July ’21; Net capacity (i.e. only showing owned capacity)

Europe continues to be a highly attractive growth marketDespite significant ramp-up in renewables, much more growth is expected in the coming decade
1 Source: Wood Mackenzie, cumulated capacity; Solar numbers extrapolated 27+2 ROW excludes China 58
Double-digit growth across renewable technologies until 20301Increasing demand and phase-out of coal gives plenty of room for growth in Europe
Today ~25 year horizon
Increased demand driven by electrification trend
Expected lifetime ~20-25 years
Significant phasing-out
Investment need
Offshore wind (GW) Onshore wind (GW) Solar PV (GW)
25
66
174
0
50
100
150
200
250
2020 2025 2030
39% 42% 44%
436
631
848
0
250
500
750
1000
2020 2025 2030
26% 21% 21%
491
1 100
1 727
0
700
1400
2100
2020 2025 2030
Europe ROW2
Europe 25 GW 47 GW 109 GW 194 GW 261 GW 318 GW 165 GW 298 GW 434 GW
ROW 0,4 GW 19 GW 65 GW 242 GW 370 GW 530 GW 326 GW 802 GW 1.293 GW

Pipeline of opportunities supports Vattenfall ambitionsSeveral upcoming offshore wind tenders in relevant markets
59
2022Name/Description : Brittany (Floating Offshore)Capacity: 250 MWSupport: Contract for Difference
2022Name/Description: Normandy(Offshore)Capacity: 1,000 MWSupport: Contract for Difference
2023Name/Description: Mediterranean(Floating Offshore)Capacity: 2 x 250 MWSupport: Contract for Difference (tbc)
2023Name/Description: Oléron(Offshore)Capacity: 1,000 MWSupport: Contract for Difference(tbc)
2021Name/Description: CfD Round 4Capacity: tbdSupport: Contract for Difference
2022Name/Description: Hollandse KustWest (Offshore)Capacity: 1,500 MWSupport: tbd
2023Name/Description: North of the Wadden Islands (Offshore)Capacity: 700 MWSupport: tbd
2022Name/Description: Central Tender (Offshore)Capacity: 950 MWSupport: tbd
2021Name/Description: Thor (Offshore)Capacity: 1,000 MWSupport: Contract for Difference / Price Premium
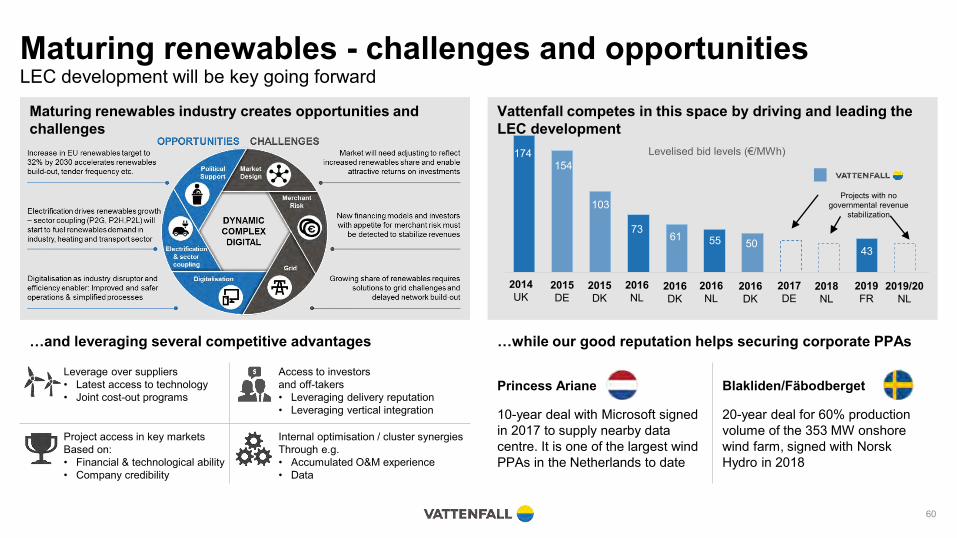
Maturing renewables - challenges and opportunitiesLEC development will be key going forward
60
Vattenfall competes in this space by driving and leading the LEC development
Maturing renewables industry creates opportunities and challenges
174154
103
7361 55 50
43
Levelised bid levels (€/MWh)
Projects with no governmental revenue
stabilization
2014UK
2015DE
2015DK
2016NL
2016DK
2016NL
2016DK
2017DE
2018NL
2019FR
2019/20NL
…and leveraging several competitive advantages …while our good reputation helps securing corporate PPAs
Project access in key marketsBased on:• Financial & technological ability• Company credibility
Leverage over suppliers• Latest access to technology• Joint cost-out programs
Internal optimisation / cluster synergiesThrough e.g.• Accumulated O&M experience • Data
Access to investorsand off-takers• Leveraging delivery reputation• Leveraging vertical integration
Princess Ariane Blakliden/Fäbodberget
10-year deal with Microsoft signed in 2017 to supply nearby data centre. It is one of the largest wind PPAs in the Netherlands to date
20-year deal for 60% production volume of the 353 MW onshore wind farm, signed with NorskHydro in 2018
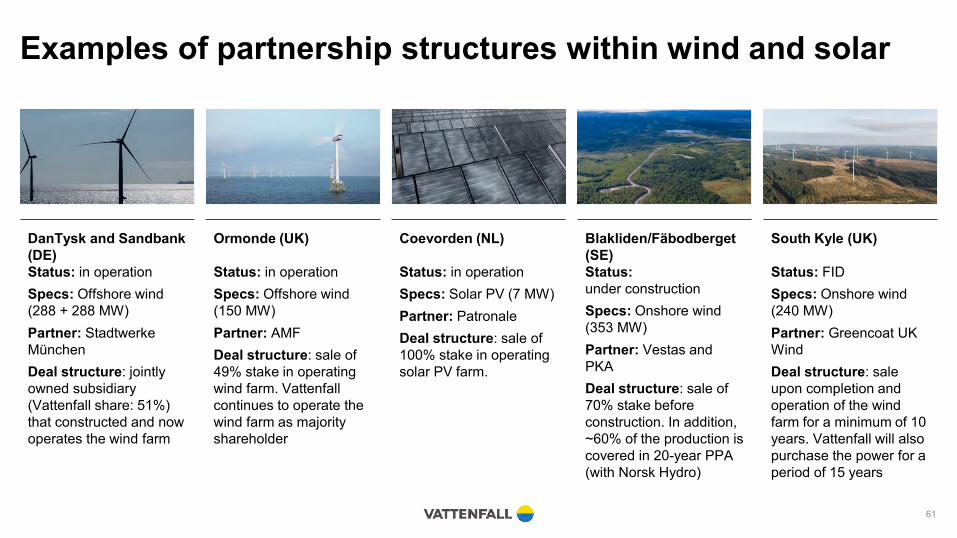
Examples of partnership structures within wind and solar
DanTysk and Sandbank (DE)
Ormonde (UK) Coevorden (NL) Blakliden/Fäbodberget (SE)
South Kyle (UK)
Status: in operationSpecs: Offshore wind(288 + 288 MW)Partner: StadtwerkeMünchenDeal structure: jointlyowned subsidiary (Vattenfall share: 51%) that constructed and now operates the wind farm
Status: in operationSpecs: Offshore wind(150 MW)Partner: AMFDeal structure: sale of49% stake in operating wind farm. Vattenfall continues to operate the wind farm as majority shareholder
Status: in operationSpecs: Solar PV (7 MW)Partner: PatronaleDeal structure: sale of100% stake in operating solar PV farm.
Status: under constructionSpecs: Onshore wind(353 MW)Partner: Vestas and PKA Deal structure: sale of70% stake beforeconstruction. In addition, ~60% of the production is covered in 20-year PPA (with Norsk Hydro)
Status: FIDSpecs: Onshore wind(240 MW)Partner: Greencoat UK WindDeal structure: sale upon completion and operation of the wind farm for a minimum of 10 years. Vattenfall will also purchase the power for a period of 15 years
61

Overview of regulatory regimes
62
Country Policyname
Founding year/ Status / Eligible technology Overview Time period
Contracts for Difference (CfD)
Founding year: -Status: In forceEligible technology:
• A settlement price is guaranteed for offshore power provider. The support is based on the difference between agreed and market price
• If market price is lower than the agreed price, the project owner receives the support. If the market price is higher than the agreed price, the profit is divided between the project owner and the government
• Maximum of 20 years (after the wind farm has been connected to the grid)
Feed-in premium tariffs (FIT)
Founding year: 2009Status: In forceEligible technology:
• The eligible producer receives premium from the TSO Energinet.dk equivalent to the difference between the spot market price and the fixed support income
• Depends on the type of technology and date of commissioning
Contracts for Difference (CfD)
Founding year: 2014Status: In forceEligible technology:
• A Contract for Difference (CfD) is a private law contract between a RES-E generator and the CfD Counterparty – Low Carbon Contracts Company (LCCC)
• The CfD is based on a difference between the market price and an agreed “strike price”• If Strike price > market price: Then CfD counterparty must pay the difference between to the two to RE generator• If Strike price < market price: Then RE generator must pay the difference to the CfD counterparty
• CfD contracts are awarded for a period of 15 years
ROC scheme
Founding year: 2002Status: In forceEligible technology:
• Under the Renewable obligation scheme, all the electricity suppliers in the UK have to source an increasing proportion of renewable energy. They can also buy Renewable Obligation Certificates from a renewable energy producer to meet the obligation
• Renewable Obligation Certificates are issued to renewable energy producers for every MWh of renewable electricity produced
• ROC is issued for a period of 20 years
• RO scheme is closed for generating capacity after 31st March 2017
MEP1/ SDE+ / SDE++
Founding year: 2011Status: In forceEligible technology2:
• Provides a feed-in-premium subsidy that covers the financial gap between the cost of the subsidised sustainable technology and the cost of the fossil alternative, for instance the difference between wholesale market prices of electricity and the cost of electricity from renewable sources
• The budget is based on an auction system, where the lowest bidder receives the premium• 2020 overall budget: SDE+ €4 billion and SDE++ €5 billion, 2021 overall budget: SDE++ €5 billion
• The premium is paid for a period of up to 15 years
• SDE++ will be further broadened with more differentiation in the current technologies and with other CO2abatement options
EEGFounding year: -Status: In forceEligible technology:
• Several models deployed over the years. Prior to 2017, FIT system. This has now been replaced with a tendering process (prices set by competitive auctions) where projects receive contracts to sell the produced electricity at the bid price
• Bids are based on floating market premium• Market Premium: reference value of the respective renewable energy plant minus its technology-specific market value
• Market premium is paid for a period of 20 years
The Electricity Certificate System
Founding year: 2003Status: In forceEligible technology:
• The demand for certificates is regulated by a quota system, which is fixed in proportion to total electricity use (energy intensive industry is exempted)
• The electricity producer receives a certificate for each MWh from renewable sources and sell it to electricity consumers in open market
• Sweden and Norway have shared common electricity certificates since 2012
• Aims to add 18TWh by 2030• Sweden officially plans to continue
the green certificate subsidy scheme until 2030, and is also considering to phase out onshore by 2021
1 Older version of the SDE+ scheme2 Including other renewable sources and CO2 abatement technologies such as biomass, geothermal, aqua thermal, CCS, heat pumps, e-boilers, hydrogen, etc

Pipeline of opportunities supports Vattenfall ambitionsMany projects in pipeline1 and several upcoming tenders in relevant marketsInstalled capacity, projects under construction and under development (GW)
3,7
2,9
6,4
YE 2020
6-8
26-’3021-’25
9-13
13.0
In construction
Installed base
In developmento Jaap Rodenburg 2
o South Kyle
o Hollandse Kust South
o Vesterhav projects
o Norfolk Projects
o Windplan Blauw
Highlights 21-30
→ More than doublingour capacity over thenext years
→ More than 3GW under construction
→ A constantly growingpipeline of more than 4GW as of today
1 Pipeline includes wind, solar and batteries

Wind & Solar - Installed capacity (MW1) Q2 2021
1 Capacity in operation: total capacity of the wind farms that Vattenfall has an ownership in. Minority shares included as 100%
64
Solar Onshore Offshore Total5 391 687 1.083 Thanet 300 Kriegers Flak 605 Princess Ariane 2980 237 1.170 1.407 Ormonde (51%) 150 Horns Rev 3 407 Princess Alexia 122
70 576 0 647 Aberdeen 97 Horns Rev 1 (60%) 158 Haringvliet 380 218 110 328 Kentish Flats 90 Klim (98%) 67 Slufterdam 293 19 636 658 Kentish Flats Extension 50 Nørrekær Enge 1 (99%) 30 Haringvliet 18
Total (MW) 78 1.442 2.603 4.122 Pen Y Cymoedd 228 Rejsby Hede 23 Eemmeerdijk 17Ray 54 Hagesholm 23 Irene Vorrink 17Edinbane 41 Nørre Økse Sø 17 Nieuwe Hemweg 13Clashindarroch 37 Tjæreborg Enge 17 Hoofdplaatpolder (70%) 10Swinford 22 Hollandsbjerg 17 Reyndersweg (50%) 9
Solar Parc Cynog 4 Bajlum (89%) 15 Echteld 8Onshore PV@Cynog 5 DræbyFed 9 Moerdijk 8Offshore Pendine 5 Ryå 8 De Bjirmen 6
1.083 Ejsing (97%) 7 Oom Kees (12%) 6Lyngmose 5 Oudendijk 5
1.407 Mariapolder 5Lillgrund 110 Hiddum Houw 4Stor-Rotliden 78 Eemshaven 6Högabjär-Kärsås (50%) 38 DanTysk (51%) 288 Velsen 2Höge Väg (50%) 37 Sandbank (51%) 288 Enkhuizen 2Hjuleberg (50%) 36 alpha ventus (26%) 60 Hemweg 2Juktan (50%) 29 Jänschwalde 12 Diemen 1
328 Westküste (20%) 7 Decentral Solar installations 21Decentral Solar installations 3 647
658
United KingdomDenmarkThe NetherlandsSwedenGermany
The Netherlands – MEP/SDE(+)
Installed capacity (MW)
United Kingdom – ROC scheme
Installed capacity (MW)
Sweden – certificate scheme
Denmark – FIT scheme
Installed capacity (MW)
Installed capacity (MW)
Germany – EEG scheme
Installed capacity (MW)
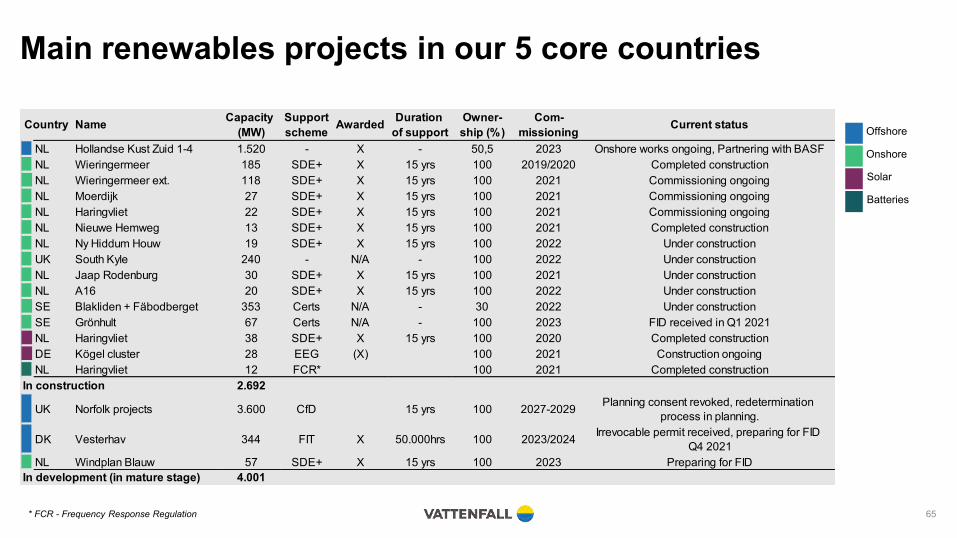
Main renewables projects in our 5 core countries
* FCR - Frequency Response Regulation 65
Offshore
Onshore
Solar
Batteries
Supportscheme
NL Hollandse Kust Zuid 1-4 1.520 - X - 50,5 2023 Onshore works ongoing, Partnering with BASFNL Wieringermeer 185 SDE+ X 15 yrs 100 2019/2020 Completed constructionNL Wieringermeer ext. 118 SDE+ X 15 yrs 100 2021 Commissioning ongoingNL Moerdijk 27 SDE+ X 15 yrs 100 2021 Commissioning ongoingNL Haringvliet 22 SDE+ X 15 yrs 100 2021 Commissioning ongoingNL Nieuwe Hemweg 13 SDE+ X 15 yrs 100 2021 Completed constructionNL Ny Hiddum Houw 19 SDE+ X 15 yrs 100 2022 Under constructionUK South Kyle 240 - N/A - 100 2022 Under constructionNL Jaap Rodenburg 30 SDE+ X 15 yrs 100 2021 Under constructionNL A16 20 SDE+ X 15 yrs 100 2022 Under constructionSE Blakliden + Fäbodberget 353 Certs N/A - 30 2022 Under constructionSE Grönhult 67 Certs N/A - 100 2023 FID received in Q1 2021NL Haringvliet 38 SDE+ X 15 yrs 100 2020 Completed constructionDE Kögel cluster 28 EEG (X) 100 2021 Construction ongoingNL Haringvliet 12 FCR* 100 2021 Completed construction
In construction 2.692
UK Norfolk projects 3.600 CfD 15 yrs 100 2027-2029 Planning consent revoked, redetermination process in planning.
DK Vesterhav 344 FIT X 50.000hrs 100 2023/2024 Irrevocable permit received, preparing for FID Q4 2021
NL Windplan Blauw 57 SDE+ X 15 yrs 100 2023 Preparing for FIDIn development (in mature stage) 4.001
Owner-ship (%)
Com-missioning Current statusCountry Name Capacity
(MW) Awarded Duration of support
Heat
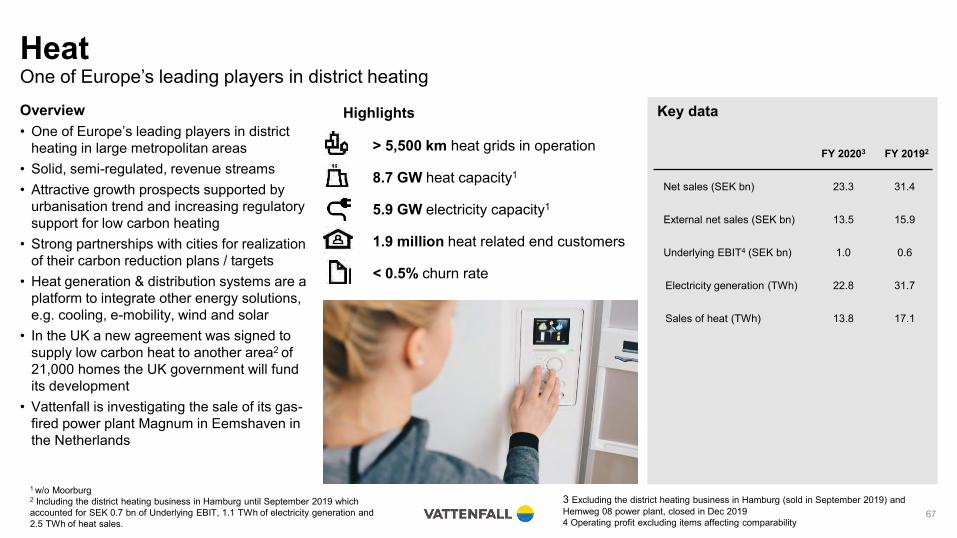
HeatOne of Europe’s leading players in district heating
1 w/o Moorburg2 Including the district heating business in Hamburg until September 2019 which accounted for SEK 0.7 bn of Underlying EBIT, 1.1 TWh of electricity generation and 2.5 TWh of heat sales.
67
Overview• One of Europe’s leading players in district
heating in large metropolitan areas • Solid, semi-regulated, revenue streams • Attractive growth prospects supported by
urbanisation trend and increasing regulatory support for low carbon heating
• Strong partnerships with cities for realization of their carbon reduction plans / targets
• Heat generation & distribution systems are a platform to integrate other energy solutions, e.g. cooling, e-mobility, wind and solar
• In the UK a new agreement was signed to supply low carbon heat to another area2 of 21,000 homes the UK government will fund its development
• Vattenfall is investigating the sale of its gas-fired power plant Magnum in Eemshaven in the Netherlands
Key data
FY 20203 FY 20192
Net sales (SEK bn) 23.3 31.4
External net sales (SEK bn) 13.5 15.9
Underlying EBIT4 (SEK bn) 1.0 0.6
Electricity generation (TWh) 22.8 31.7
Sales of heat (TWh) 13.8 17.1
Highlights
> 5,500 km heat grids in operation
8.7 GW heat capacity1
5.9 GW electricity capacity1
1.9 million heat related end customers
< 0.5% churn rate
3 Excluding the district heating business in Hamburg (sold in September 2019) and Hemweg 08 power plant, closed in Dec 20194 Operating profit excluding items affecting comparability
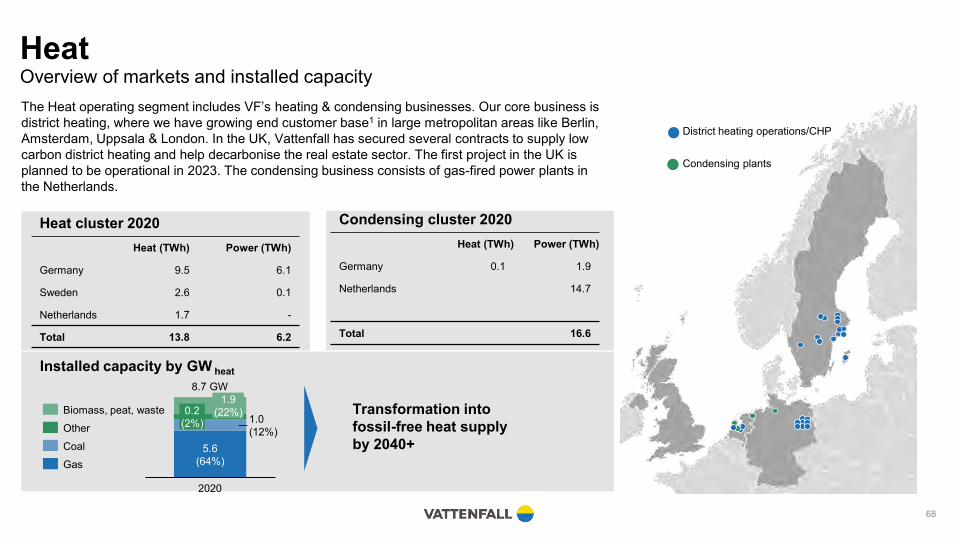
Heat cluster 2020Heat (TWh) Power (TWh)
Germany 9.5 6.1
Sweden 2.6 0.1
Netherlands 1.7 -
Total 13.8 6.2
HeatOverview of markets and installed capacity
68
Installed capacity by GW heat
Transformation intofossil-free heat supplyby 2040+
Condensing cluster 2020Heat (TWh) Power (TWh)
Germany 0.1 1.9
Netherlands 14.7
Total 16.6
The Heat operating segment includes VF’s heating & condensing businesses. Our core business is district heating, where we have growing end customer base1 in large metropolitan areas like Berlin, Amsterdam, Uppsala & London. In the UK, Vattenfall has secured several contracts to supply low carbon district heating and help decarbonise the real estate sector. The first project in the UK is planned to be operational in 2023. The condensing business consists of gas-fired power plants in the Netherlands.
District heating operations/CHP
Condensing plants
1.0(12%)
1.9(22%)0.2
(2%)
8.7 GW
5.6(64%)
2020
Biomass, peat, wasteOther
GasCoal
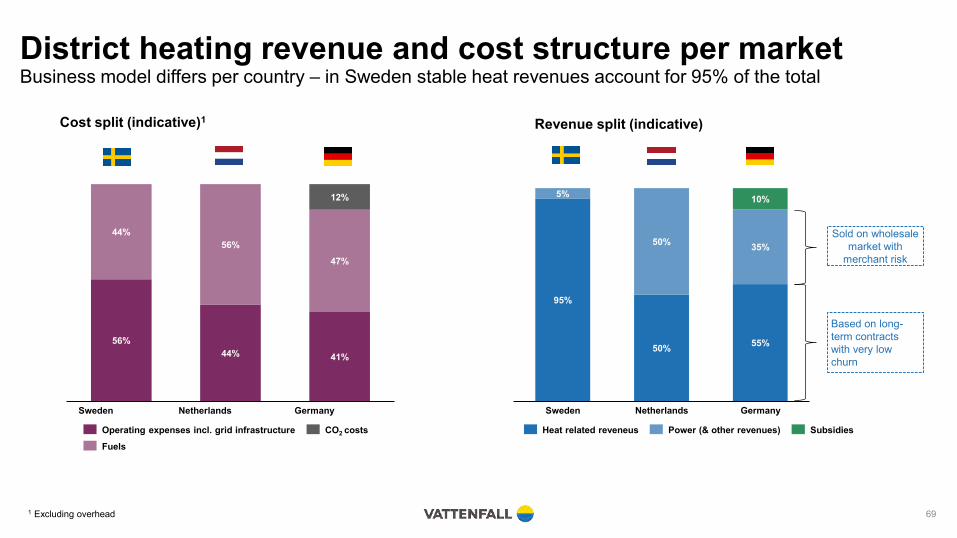
District heating revenue and cost structure per marketBusiness model differs per country – in Sweden stable heat revenues account for 95% of the total
1 Excluding overhead 69
Sold on wholesale market with
merchant risk
Based on long-term contracts with very low churn
Cost split (indicative)1 Revenue split (indicative)
56%44% 41%
44%56%
47%
12%
Sweden Netherlands Germany
Operating expenses incl. grid infrastructureFuels
CO2 costs
95%
50% 55%
5%
50% 35%
10%
Sweden Netherlands Germany
Heat related reveneus Power (& other revenues) Subsidies

Political support for district heat across our marketsDistrict heating is an attractive option for cities to decarbonise their building sectors
1 Referring to how established the technology is on the market and the future growth prospects 2 District heating market share of 30% in metropolitan areas follows governmental goal to reach low carbon heat supply by 17% district heating UK wide
70
Market maturity1 Political support Competitiveness Concession based Price setting (heat) Typical customer contract length
2030 climate target: -55% net GHG4 emission (compared to 1990 levels); 2050 target: EU-wide climate neutrality |
Increased requirements for heating/cooling and buildings sector: share of renewables, phase out coal, demand reduction/energy efficiency |energy system integration; CO2 pricing, power-to-heat, increased positive perception for DHC (details to be investigated); Hydrogen one priority area.
YoungLow carbon district heating market share 30% by 2030 in metropolitan areas2 (2% today)
Highly competitive once plans to mandate district heating for new build are put in place
Mainly yes,(e.g. for Brent Cross
South > 40 years)
Price escalation formula for heat 30 years
Mature +Transition to Green
Prolonged CHP production support / subsidiesGreen heat funding program by federal ministry in preparation
Highly competitive Low primary energy factor for new housesReliable and comfortable delivery of city heating
No Price escalation formula for heat up to10 years
Mature + Transition to Green
Natural gas phase out boosts renewable district heating. New subsidy schemes for connecting existing houses
Competitive pricing against natural gas due to Heat Act, but because of the connection costs it’s still cheaper today to stick to the gas boiler. Competitive in relation to heat pumps.
Mainly concession based, a typical term
is then 30 years3
Heat supply via district heating has to be
cheaper than pure gas-fueled boiler solutions. Other (maximum) tariffs are based on average
sector costs
15-25 years
Mature (already green)
Supportive but few special incentives
Competitive position that is being challenged by heat pumps No No heat price
regulation Until further notice
As of 2021-09-09
3 The other type of contract is the heat delivery contract. Contracts are then building-specific with a typical contract length of 10 years
„Fit for -55% package“tabled 14 July 2021
4 GHG: greenhouse gas emissions
”European Climate Law”

213
45%34%
20402020
31
District heating volumes set to increase significantly in Amsterdam and the UK…… with a stable trend in Berlin and Uppsala as population growth is offset by energy efficiency measures
1 Simplified to reflect connections in Amsterdam/Almere (= 70% of Heat Netherlands); Source for 2040: Study by Municipality of Amsterdam 2 Simplified reflecting Uppsala demand (= 42% of Heat Sweden supply) 71
5.5
18%
2020
74%
2040
5.6
Berlin Amsterdam1 London & Edinburgh
Government target to support district
heating4
Heat consumption (TWh) and district heating market share (%) by City, 2020 vs 2040
Assuming high renovation
rates realised
Electricity, Renewables & OtherDistrict Heat Fossil
Uppsala2
90%
2020
1.6
2040
90%
1.6
Rapid phase out of coal and totallyfossil free by 2040+
Total heat demand set to decreasedue to energy efficiency measures; district heating volumes stable withincreased market share
Gas boiler phase out set to spurdramatic increase in district heating
Stable total heat demand –population growth offset by energyefficiency meaures
Mature market with dominant market share of district heating
Stable heat demand – population growth offset by energy efficiencymeasures
Dramatic growth of district heatingexpected as market share increases to 30% in 2040
Stable heat demand – population growth offset by energy efficiencymeaures
20402%
91
2020
30%
91
3 Source: Feasibility study with City of Berlin (2019) here considering building efficiency increase of 1.5% p.a. 4 District heating market share of 30% in metropolitan areas follows governmental goal to reach low carbon heat supply by 17% district heating UK wide
Dominating fuel (districtheat)
Gas/coal/waste
Power to heat/green gas/biomass/TPI Gas/waste Power to heat/green
gas/waste Biomass/waste Biomass/waste Gas Power to heat/waste
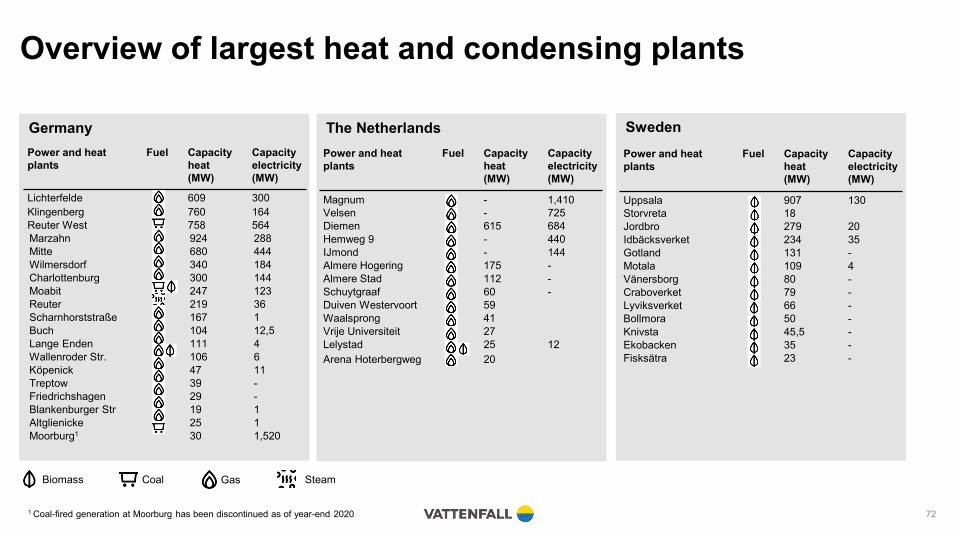
The Netherlands SwedenGermany
Overview of largest heat and condensing plants
1 Coal-fired generation at Moorburg has been discontinued as of year-end 2020 72
Power and heat plants
Fuel Capacity heat (MW)
Capacity electricity (MW)
Lichterfelde 609 300Klingenberg 760 164Reuter West 758 564Marzahn 924 288Mitte 680 444Wilmersdorf 340 184Charlottenburg 300 144Moabit 247 123Reuter 219 36Scharnhorststraße 167 1Buch 104 12,5Lange Enden 111 4Wallenroder Str. 106 6Köpenick 47 11Treptow 39 -Friedrichshagen 29 -Blankenburger Str 19 1Altglienicke 25 1Moorburg1 30 1,520
Power and heat plants
Fuel Capacity heat (MW)
Capacity electricity (MW)
Magnum - 1,410Velsen - 725Diemen 615 684Hemweg 9 - 440IJmond - 144Almere Hogering 175 -Almere Stad 112 -Schuytgraaf 60 -Duiven Westervoort 59Waalsprong 41Vrije Universiteit 27Lelystad 25 12Arena Hoterbergweg 20
Power and heat plants
Fuel Capacity heat (MW)
Capacity electricity (MW)
Uppsala 907 130Storvreta 18Jordbro 279 20Idbäcksverket 234 35Gotland 131 -Motala 109 4Vänersborg 80 -Craboverket 79 -Lyviksverket 66 -Bollmora 50 -Knivsta 45,5 -Ekobacken 35 -Fisksätra 23 -
Coal Gas SteamBiomass

Distribution

Leading owner and operator of electricity distribution grids in Sweden
1 Excluding the Berlin grid business which was sold on July 1, 20212 Operating profit excluding items affecting comparability3 SAIDI: System Average Interruption Duration Inde
Distribution
74
Overview• Largest operator of regional electricity
distribution grids in Sweden and top-3 position in local grids
• Regulated business with stable demand
• Enabler of the energy transition by connecting renewable production to the grid
• Demand set to grow – Vattenfall grids are located in areas with population growth and strong demand for industrial electrification
• High operational efficiency compared to industry average
• Our positioning across the whole energy value chain enables us to take advantage of our grids using both demand and supply side flexibility
Key data1Highlights1
900 000 household and business customers
>131,000 km of electricity grids
SEK 5.5 billion in investments 2020
SEK 53 billion RAB
FY 2020 FY 2019
Net sales (SEK bn) 12.0 11.8
External net sales (SEK bn) 11.4 11.3
Underlying EBIT1 (SEK bn) 4.3 3.9
Investments (SEK bn) 5.5 5.1
SAIDI2 (minutes/customer)
Sweden 148 4393
SAIFI4 (number/customer)
Sweden 2.0 2.4
RAB
Sweden 55.1 46.9
3 SAIDI in 2019 for was driven by the storm “Alfrida”4 SAIFI: System Average Interruption Frequency Index

DistributionMarket and business overview
1 Excluding Vattenfall’s subsidiaries Gotlands Elnät and Västerbergslagens Elnät2 Based on volume of transited energy excluding grid losses3 Based on number of contracts 75
In brief• Vattenfall’s Distribution business owns
and operates electricity distribution grids in Sweden.
• Approximately 900 000 business and household customers1
• A new business unit for operation and ownership of new grids in the UK was established in 2017. Vattenfall is one out of 14 established IDNOs4 in the UK
• On 1 July 2021, Vattenfall sold the electricity grid company Stromnetz Berlin GmbH to the State of Berlin
Customers local grids
Markets share regional grid2
Market share localgrid3
Vattenfall1 900,000 53% 16%
Ellevio 960,000 22% 17%
E.ON 1,030,000 23% 19%
Market shares, Sweden
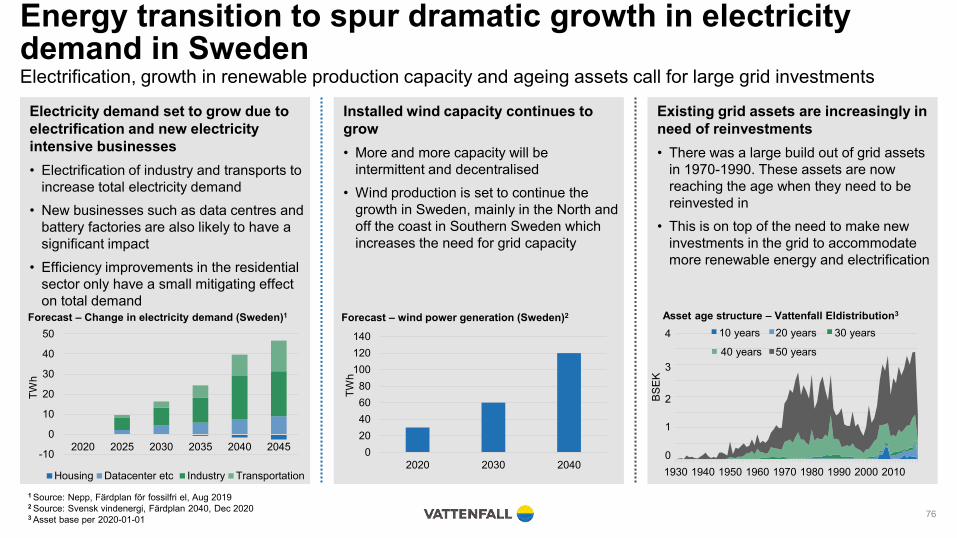
Energy transition to spur dramatic growth in electricity demand in SwedenElectrification, growth in renewable production capacity and ageing assets call for large grid investments
1 Source: Nepp, Färdplan för fossilfri el, Aug 20192 Source: Svensk vindenergi, Färdplan 2040, Dec 20203 Asset base per 2020-01-01 76
-10
0
10
20
30
40
50
2020 2025 2030 2035 2040 2045
TWh
Housing Datacenter etc Industry Transportation 1930 1940 1950 1960 1970 1980 1990 2000 2010
BSEK
4
3
2
1
0
10 years 20 years 30 years
40 years 50 years
Electricity demand set to grow due to electrification and new electricity intensive businesses• Electrification of industry and transports to
increase total electricity demand • New businesses such as data centres and
battery factories are also likely to have a significant impact
• Efficiency improvements in the residential sector only have a small mitigating effect on total demand
Installed wind capacity continues to grow• More and more capacity will be
intermittent and decentralised• Wind production is set to continue the
growth in Sweden, mainly in the North and off the coast in Southern Sweden which increases the need for grid capacity
Existing grid assets are increasingly in need of reinvestments• There was a large build out of grid assets
in 1970-1990. These assets are now reaching the age when they need to be reinvested in
• This is on top of the need to make new investments in the grid to accommodate more renewable energy and electrification
Forecast – wind power generation (Sweden)2Forecast – Change in electricity demand (Sweden)1 Asset age structure – Vattenfall Eldistribution3
020406080
100120140
2020 2030 2040
TWh
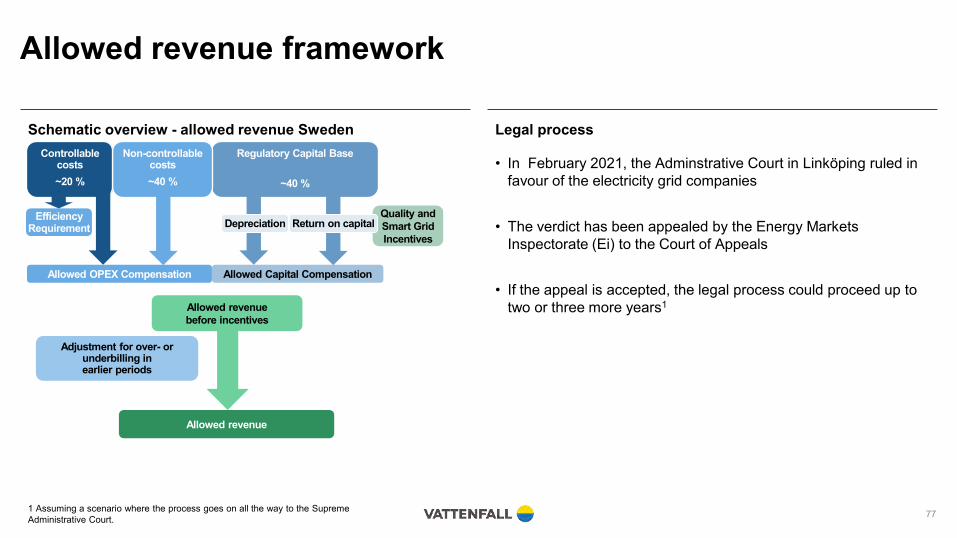
Allowed revenue framework
1 Assuming a scenario where the process goes on all the way to the SupremeAdministrative Court.
Schematic overview - allowed revenue Sweden Legal process
• In February 2021, the Adminstrative Court in Linköping ruled in favour of the electricity grid companies
• The verdict has been appealed by the Energy Markets Inspectorate (Ei) to the Court of Appeals
• If the appeal is accepted, the legal process could proceed up to two or three more years1
77
Regulatory Capital Base
~40 %
Non-controllablecosts~40 %
Controllablecosts~20 %
EfficiencyRequirement
Allowed OPEX Compensation Allowed Capital Compensation
Allowed revenuebefore incentives
Quality and Smart Grid Incentives
Allowed revenue
Adjustment for over- or underbilling inearlier periods
Depreciation Return on capital
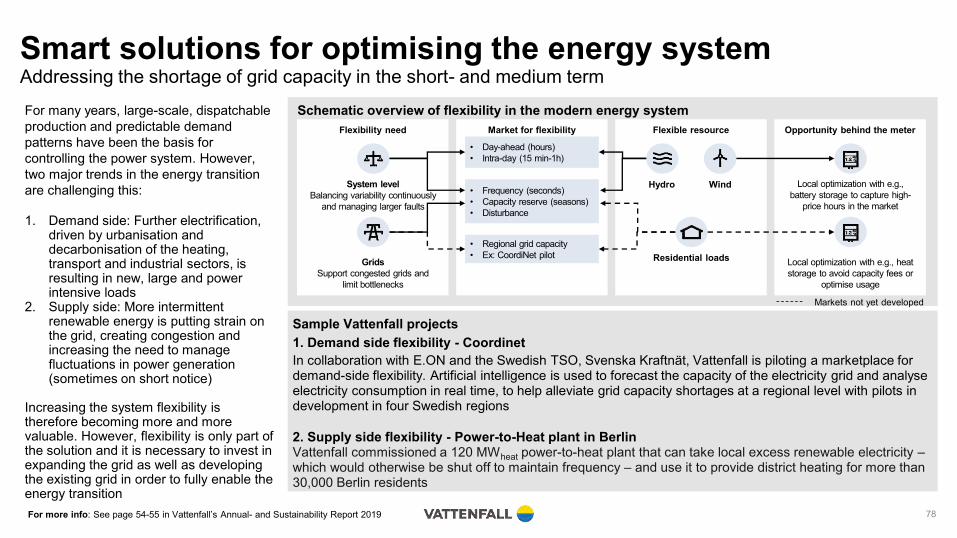
Smart solutions for optimising the energy systemAddressing the shortage of grid capacity in the short- and medium term
For more info: See page 54-55 in Vattenfall’s Annual- and Sustainability Report 2019 78
Schematic overview of flexibility in the modern energy system Flexibility need Market for flexibility Flexible resource Opportunity behind the meter
• Day-ahead (hours)• Intra-day (15 min-1h)
• Frequency (seconds)• Capacity reserve (seasons)• Disturbance
• Regional grid capacity• Ex: CoordiNet pilot
System levelBalancing variability continuously
and managing larger faults
GridsSupport congested grids and
limit bottlenecks
Residential loads
Hydro Wind
Local optimization with e.g., heat storage to avoid capacity fees or
optimise usage
Local optimization with e.g., battery storage to capture high-
price hours in the market
Markets not yet developed
Sample Vattenfall projects1. Demand side flexibility - CoordinetIn collaboration with E.ON and the Swedish TSO, Svenska Kraftnät, Vattenfall is piloting a marketplace for demand-side flexibility. Artificial intelligence is used to forecast the capacity of the electricity grid and analyseelectricity consumption in real time, to help alleviate grid capacity shortages at a regional level with pilots in development in four Swedish regions
2. Supply side flexibility - Power-to-Heat plant in BerlinVattenfall commissioned a 120 MWheat power-to-heat plant that can take local excess renewable electricity –which would otherwise be shut off to maintain frequency – and use it to provide district heating for more than 30,000 Berlin residents
For many years, large-scale, dispatchable production and predictable demand patterns have been the basis for controlling the power system. However, two major trends in the energy transition are challenging this:
1. Demand side: Further electrification, driven by urbanisation and decarbonisation of the heating, transport and industrial sectors, is resulting in new, large and power intensive loads
2. Supply side: More intermittent renewable energy is putting strain on the grid, creating congestion and increasing the need to manage fluctuations in power generation (sometimes on short notice)
Increasing the system flexibility is therefore becoming more and more valuable. However, flexibility is only part of the solution and it is necessary to invest in expanding the grid as well as developing the existing grid in order to fully enable the energy transition
Financial performanceH1 2021 numbers

Vattenfall H1 Results 2021Financial highlights
1 Last 12-month values
Key data Key developments
• Net sales increased by SEK 1.0 bn to SEK 80.5 bn due to higher spot prices and higher sales volumes in the Nordics and Germany
• Underlying EBIT increased by SEK 4.3 bn mainly due to increased earnings in segment Power Generation due to higher achieved prices in the Nordics, higher nuclear and hydro power generation and higher realised trading result. Highercontribution from Heat also had a positive impact, mainly due to the closure of Moorburg
• Profit for the period increased to SEK 23.6 bn, mainly due to the agreement on compensation for the closure of nuclear power in Germany. Profit in 2020 negatively affected by impairments (mainly Moorburg)
• ROCE increased to 14.5% mainly due to the agreement on compensation for the closure of nuclear power. ROCE H1 2020 negatively affected by impairments
• FFO/Adjusted net debt increased to 38.1%, mainly due to a significant decrease in adjusted net debt largely driven by a positive net change in margin calls for commodity hedging activities
80
SEK bn H1 2021 H1 2020
Net Sales 80.5 79.4
EBITDA 38.3 25.2
Underlying operating profit (EBIT) 17.3 13.0
EBIT 29.6 5.3
Profit for the period 23.6 -1.6
Funds from Operations (FFO) 21.4 16.7
Cash flow operating activities 35.2 7.4
Net debt 32.3 71.6
Adjusted net debt 104.5 140.3
Adjusted net debt/EBITDA1 (times) 1.8 3.0
Financial targets
ROCE1 (≥8%) 14.5 6.1
FFO/adjusted net debt1 (22-27%) 38.1 25.5

Development of underlying EBIT H1 2021Increase from Power Generation, Heat and Customers & Solutions partly offset by lower earnings in Distribution
Change in H1 2021 vs. H1 2020
• Customers & Solutions: increased customer base and lower average temperatures in the Netherlands and Germany
• Power Generation: higher achieved prices in the Nordics, higher nuclear and hydro power generation and a higher realised trading result
• Wind: higher electricity prices and new capacity offset by lower wind speeds
• Heat: closure of the Moorburg plant as well as higher sales of heat owing to lower temperatures and a growing customer base
• Distribution: lower gross margin in the Swedish operations, mainly due to price reductions in local networks, higher costs for the transmission networks and network losses caused by higher electricity prices
Highlights
81
H1 2021
1.5
1.4
Other
6.9
-0.8
2.0
1.9
H1 2020
0.6
2.9
10.3
2.1
2.5
-0.9
Customers & Solutions
Power Generation
Wind
Heat
Distribution
13.0
17.3
Net other effects
17.3Underling EBIT H1 2021
-0.5
Heat 1.0
Wind
Power Generation 3.4
Customers & Solutions
0.1
Distribution
0.5
Underlying EBIT H1 2020
-0.1
13.0
Breakdown per operating segmentSEK bn SEK bn

Cash flow development H1 2021Positive working capital development mainly related to changes in margin calls
Main effects• Change in working capital mainly related to a positive net change in margin calls for commodity hedging activities (SEK 23.6 bn) driven by increased market
prices. Seasonal effects in the Customers & Solutions and Heat operating segments (SEK -3.5 bn), increase in inventories (SEK -2.9 bn) and changes related to CO2 emission allowances (SEK -1.9 bn) had offsetting impact
• Other adjustments (SEK -13,1 bn) include non-cash items included in EBITDA, mainly the compensation for the closure of Nuclear power in Germany (expected to be received in Q4) and changes in fair value of commodity derivatives
• Growth investments mainly related to wind power82
-1.738.335.2
Cash flow before
financing activities
24.4
Maintenance and
replacement investments
Cash flow from operating activities
-3.713.7
Other Change in working capital
31.5
Free cash flow
-13.1
Capital gains/
losses, net
-7.0
Growth investments
0.1
0.0
FFOInterest paid/received,
net
EBITDA
-2.1
Tax paid
21.4
Divestments, net
SEK bn
Hedging, debt and fundingH1 2021 numbers
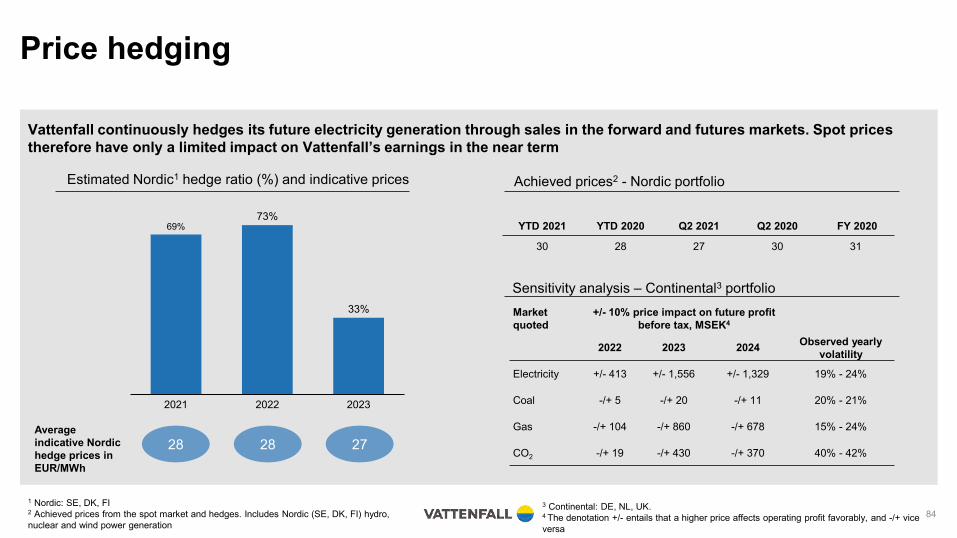
Price hedging
1 Nordic: SE, DK, FI2 Achieved prices from the spot market and hedges. Includes Nordic (SE, DK, FI) hydro, nuclear and wind power generation
Vattenfall continuously hedges its future electricity generation through sales in the forward and futures markets. Spot prices therefore have only a limited impact on Vattenfall’s earnings in the near term
84
Estimated Nordic1 hedge ratio (%) and indicative prices
69%73%
33%
2021 2022 2023
Average indicative Nordic hedge prices in EUR/MWh
28 28 27
Market quoted
+/- 10% price impact on future profit before tax, MSEK4
Observed yearly volatility2022 2023 2024
Electricity +/- 413 +/- 1,556 +/- 1,329 19% - 24%
Coal -/+ 5 -/+ 20 -/+ 11 20% - 21%
Gas -/+ 104 -/+ 860 -/+ 678 15% - 24%
CO2 -/+ 19 -/+ 430 -/+ 370 40% - 42%
Sensitivity analysis – Continental3 portfolio
YTD 2021 YTD 2020 Q2 2021 Q2 2020 FY 2020
30 28 27 30 31
Achieved prices2 - Nordic portfolio
3 Continental: DE, NL, UK. 4 The denotation +/- entails that a higher price affects operating profit favorably, and -/+ vice versa
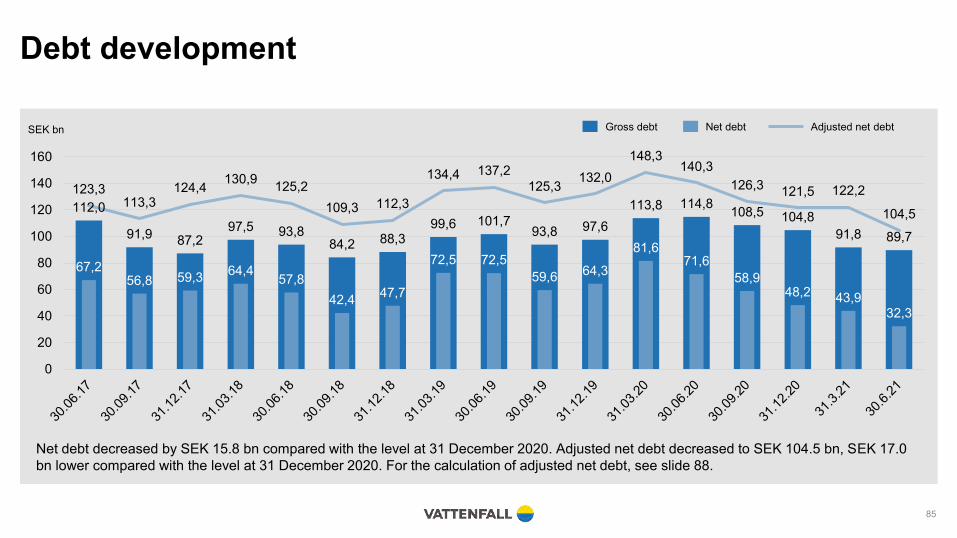
Debt development
112,0
91,9 87,297,5 93,8
84,2 88,399,6 101,7
93,8 97,6113,8 114,8 108,5 104,8
91,8 89,7
67,256,8 59,3 64,4 57,8
42,4 47,7
72,5 72,559,6 64,3
81,671,6
58,948,2 43,9
32,3
123,3113,3
124,4 130,9 125,2109,3 112,3
134,4 137,2125,3 132,0
148,3140,3
126,3 121,5 122,2
104,5
0
20
40
60
80
100
120
140
160
85
Net debtGross debt Adjusted net debt
Net debt decreased by SEK 15.8 bn compared with the level at 31 December 2020. Adjusted net debt decreased to SEK 104.5 bn, SEK 17.0 bn lower compared with the level at 31 December 2020. For the calculation of adjusted net debt, see slide 88.
SEK bn

Reported and adjusted net debt
86
Reported net debt(SEK bn)
30 Jun.2021
31 Dec.2020
Hybrid capital -20.0 -19.3
Bond issues and liabilities to credit institutions -43.4 -49.6
Commercial papers and Repos -4.5 -13.3
Liabilities to associated companies -1.0 -0.7
Liabilities to minority shareholders -11.0 -10.9
Lease liabilities -6.1 -6.0
Other liabilities -3.8 -4.9
Total interest-bearing liabilities -89.7 -104.8
Reported cash, cash equivalents & short-term investments 57.0 56.2
Loans to minority owners of foreign subsidiaries 0.4 0.4
Net debt -32.3 -48.2
Adjusted net debt(SEK bn)
30 Jun.2021
31 Dec.2020
Total interest-bearing liabilities -89.7 -104.8
50% of Hybrid capital 10.0 9.7
Present value of pension obligations -39.2 -43.8
Wind & other environmental provisions -11.2 -10.6
Provisions for nuclear power (net) -39.2 -37.8
Margin calls received 2.9 4.1
Liabilities to minority owners due to consortium agreements 11.0 10.9
Adjustment related to assets/liabilities held for sale -1.9 0.0
= Adjusted gross debt -157.2 -172.3
Reported cash, cash equivalents & short-term investments 57.0 56.2
Unavailable liquidity -4.3 -5.4
= Adjusted cash, cash equivalents & short-term investments 52.7 50.8
= Adjusted net debt -104.5 -121.5

Breakdown of gross debt
1 EMTN= Euro Medium Term Notes 87
• All public debt is issued by Vattenfall AB• The main part of debt portfolio has no currency exposure that
has an impact on the income statement. Debt in foreign currency is either swapped to SEK or booked as hedge against net foreign investments.
• No structural subordination
Total debt: SEK 89.7 bn (EUR 8.9 bn)External market debt: SEK 77.7 bn (EUR 7.7 bn)
Debt issuing programmes Size (EUR bn) Utilization (EUR bn)
EUR 10bn Euro MTN 10.0 3.4
EUR 4bn Euro CP 4.0 0.6
Total 14.0 4.0
Lease
EMTN
Hybrid capital
Bank loans
Commercial paper / Repo 5%
Loans from minority shareholders
Margin calls (CSA)
Other liabilities
Loans from associated companies
46%
22%
12%
7%
3%
2%
1%
1%
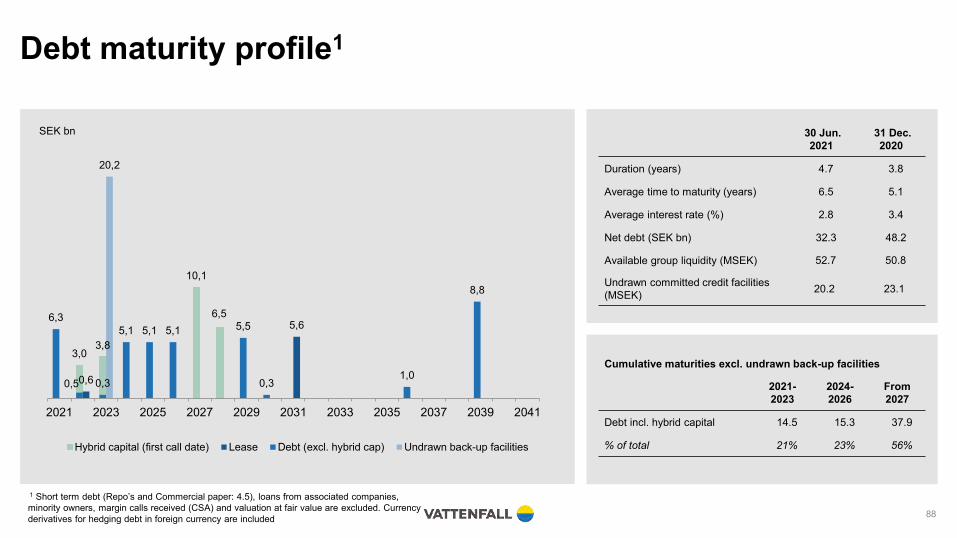
Debt maturity profile1
1 Short term debt (Repo’s and Commercial paper: 4.5), loans from associated companies, minority owners, margin calls received (CSA) and valuation at fair value are excluded. Currency derivatives for hedging debt in foreign currency are included 88
30 Jun. 2021
31 Dec. 2020
Duration (years) 4.7 3.8
Average time to maturity (years) 6.5 5.1
Average interest rate (%) 2.8 3.4
Net debt (SEK bn) 32.3 48.2
Available group liquidity (MSEK) 52.7 50.8
Undrawn committed credit facilities (MSEK) 20.2 23.1
Cumulative maturities excl. undrawn back-up facilities
2021-2023
2024-2026
From 2027
Debt incl. hybrid capital 14.5 15.3 37.9
% of total 21% 23% 56%
3,03,8
10,1
6,5
0,6
5,66,3
0,5 0,3
5,1 5,1 5,1 5,5
0,31,0
8,8
20,2
2021 2023 2025 2027 2029 2031 2033 2035 2037 2039 2041
Hybrid capital (first call date) Lease Debt (excl. hybrid cap) Undrawn back-up facilities
SEK bn

Liquidity position
1 German nuclear ”Solidarvereinbarung” 1.2 SEK bn, Margin calls paid (CSA) 2.2 SEK bn, Insurance “Provisions for claims outstanding” 0.8 SEK bn2 Excluding loans from minority owners and associated companies 89
Group liquidity SEK bn
Cash and cash equivalents 20.5
Short term investments 36.5
Reported cash, cash equivalents & short term investments
57.0
Unavailable liquidity1 -4.3
Available liquidity 52.7
Committed credit facilitiesFacility size,
EUR bn SEK bn
RCF (maturity Nov 2023) 2.0 20.2
Total undrawn 20.2
Debt maturities2 SEK bn
Within 90 days 2.0
Within 180 days 6.9
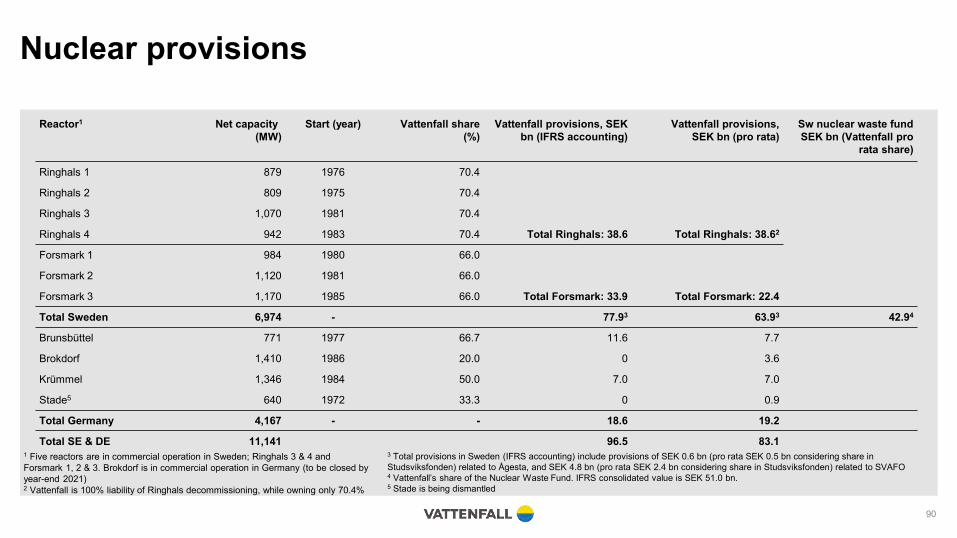
Nuclear provisions
90
Reactor1 Net capacity(MW)
Start (year) Vattenfall share (%)
Vattenfall provisions, SEK bn (IFRS accounting)
Vattenfall provisions, SEK bn (pro rata)
Sw nuclear waste fundSEK bn (Vattenfall pro
rata share)
Ringhals 1 879 1976 70.4
Ringhals 2 809 1975 70.4
Ringhals 3 1,070 1981 70.4
Ringhals 4 942 1983 70.4 Total Ringhals: 38.6 Total Ringhals: 38.62
Forsmark 1 984 1980 66.0
Forsmark 2 1,120 1981 66.0
Forsmark 3 1,170 1985 66.0 Total Forsmark: 33.9 Total Forsmark: 22.4
Total Sweden 6,974 - 77.93 63.93 42.94
Brunsbüttel 771 1977 66.7 11.6 7.7
Brokdorf 1,410 1986 20.0 0 3.6
Krümmel 1,346 1984 50.0 7.0 7.0
Stade5 640 1972 33.3 0 0.9
Total Germany 4,167 - - 18.6 19.2
Total SE & DE 11,141 96.5 83.11 Five reactors are in commercial operation in Sweden; Ringhals 3 & 4 and Forsmark 1, 2 & 3. Brokdorf is in commercial operation in Germany (to be closed by year-end 2021)2 Vattenfall is 100% liability of Ringhals decommissioning, while owning only 70.4%
3 Total provisions in Sweden (IFRS accounting) include provisions of SEK 0.6 bn (pro rata SEK 0.5 bn considering share in Studsviksfonden) related to Ågesta, and SEK 4.8 bn (pro rata SEK 2.4 bn considering share in Studsviksfonden) related to SVAFO4 Vattenfall’s share of the Nuclear Waste Fund. IFRS consolidated value is SEK 51.0 bn.5 Stade is being dismantled
Investor Relations contacts
91
Johan SahlqvistHead of Group control and Investor Relations
Tobias SjöbergInvestor Relations Officer
Emmi ÖstlundInvestor Relations Officer
+46 8 739 72 51
+46 8 739 60 63
+46 8 739 69 24
Investor webpage / Financial reports & presentations
Financial calendar28 October 2021 Interim report January-September 20213 February 2022 Year-end report 202129 March 2022 Annual- and Sustainability report 2021 (preliminary)
28 April 2022 Annual General Meeting29 April 2022 Interim report January-March 202222 July 2022 Interim report January-June 2022
Related Documents