© Vattenfall AB 29 July 2010 Vattenfall Q2 results 2010 Presentations by Øystein Løseth, CEO and Dag Andresen, CFO Conference call 29 July 2010

Welcome message from author
This document is posted to help you gain knowledge. Please leave a comment to let me know what you think about it! Share it to your friends and learn new things together.
Transcript

© Vattenfall AB
29 July 2010
Vattenfall Q2 results 2010
Presentations by
Øystein Løseth, CEO andDag Andresen, CFO
Conference call 29 July 2010

© Vattenfall AB 229 July 2010
19 .817 .1
12 .9
3 .75 .1
0
4
8
12
16
2 0
2 0 0 7 2 0 0 8 2 0 0 9 Q110 Q2 10
%
0
5
10
15
2 0
2 5SEK bn
Profit for the pe riod (RHS) RoE (LHS)
45.8 46.051.8
10.114.0
28.6 30.0 27.9
5.9 9.0
0
10
20
30
40
50
60
2007 2008 2009 Q209 Q210
SEK bn
0
50
100
150
200
250
SEK bn
EB IT D A (LH S) EB IT (LH S) N et sales (R H S)
• Increased earnings due to higher generation volumes.
• Higher spot prices had limited impact due to hedging.
• Higher heat sales due to colder weather.
• RoE below owner’s requirement.
• Review of Vattenfall’s strategy and structure initiated.
Highlights second quarter 2010
RoE and Profit for the period*
Key financial figures
Gross- and net debt development and credit metrics
1) Last 12-month values.
Business and financial highlights
*Profit for the period attributable to owners of the parent company
FY09 Q110 Q210
FFO interest cover (x) 4.8 4.7 8.1
FFO/net debt (%) 23.7 16.81) 24.41)
FFO/adj.net debt (%) 17.9 13.81) 20.51)
Adj. Net debt/Adj.EBITDA (x) 4.0 3.61) 3.01)
0
50
100
150
200
250
Gro ss D ebt N et D ebt
SEK bn
31/ 12-09 31/ 3-10 30/ 6-10

© Vattenfall AB 329 July 2010
Higher electricity prices
20
30
40
50
60
70
80
90
100
jan-07 apr-07 jul-07 okt-07 jan-08 apr-08 jul-08 okt-08 jan-09 apr-09 jul-09 okt-09 jan-10 apr-10 jul-10
EUR/MWh
NP 11 EEX 11 APX 11 NP 12 EEX 12 APX 12
• 32% higher spot prices in the Nordic region (Q2-10 vs. Q2-09).
– But 25% lower spot prices thanprevious quarter.
– The hydrological balance recoveredsomewhat in the second quarter –from -36TWh to -24TWh.
• 28% higher spot prices in Germanyand the Netherlands (Q2-10 vs. Q2-09).
– Supported by a cold spring and increasing industrial demand.
EUR/ M Wh
0
1020
3040
50
6070
8090
100NordPool EPEX APX PolPX
Mon
thly
Spot
Ave
rage
Dai
ly F
utur
eC
losi
ngPr
ices• Prices on the future markets in
Europe increased slightly in Q2, 2010.

© Vattenfall AB 429 July 2010
Significant higher electricity generation, +20.3%
Wind & Other incl. biomass and waste
• Increased hydro generation.– Good prices in Nordic.– Strong generation.
• Increased nuclear generation.– Less maintenance in Q2, 2010.
Will be carried out in Q3.– Forsmark 2 runs with reduced capacity
(appr. 30%). • Good contribution by fossile generation
plants.– Nuon contributed 2.3 TWh.– Less maintenance in German plants than
last year.– Better utilisation than expected.
• Wind– Increase pertains mainly to UK.– Less wind than normal.
0.8
20.4
12.3
7.97.0
10.8
16.1
0.50
5
10
15
20
25
Hydro Nuclear Fossil Wind & Other
Q2 2010: 41.4 TWh Q2 2009: 34.4 TWh
TWh

© Vattenfall AB 529 July 2010
Higher heat sales
0.4
4.8
2.5
3.7
1.9
0
1
2
3
4
5
6
Nordic Central Europe BeneluxQ2 2010: 7.7 TWh Q2 2009: 5.6TWh
TWh• Heat sales increased by 37.5%
– Increase mainly due to cold weather in April.
– Nuon contributed with 0.4 TWh.
• Gas sales amounted to 8.9 TWh – Virtually all gas sales pertains to
BG Benelux. Comparison figures forQ2 2009 are lacking.
Gas sales, TWh
Heat sales, TWh
8.9
0
2
4
6
8
10
Benelux
TWh
Q2 2010: 8.9 TWh Q2 2009: 0 TWh

© Vattenfall AB 629 July 2010
Nuclear update
• The Swedish parliament decided on 17 June to lift the ban on new build of nuclear power plants.
• The two German nuclear power plants, Brunsbüttel and Krümmel are still off-line.Not expected to be restarted during 2010
– Some remaining projects, followed by an extensive recommissioning programme.
• Estimated earnings impact (loss of revenues) for the standstills Q2 2010:– Nordic: SEK 400 million– Germany: SEK 950 million
• The German government has announced a new nuclear tax from 2011– Aim to raise EUR 2.3 billion net, annually, details are yet unclear. – Vattenfall’s share of total nuclear power capacity in Germany is approx. 7%.
• Vattenfall’s production quotas in German nuclear plant Stade sold for SEK 590 mn– Vattenfall’s ownership in Stade amounts to 1/3.
© Vattenfall AB 729 July 2010
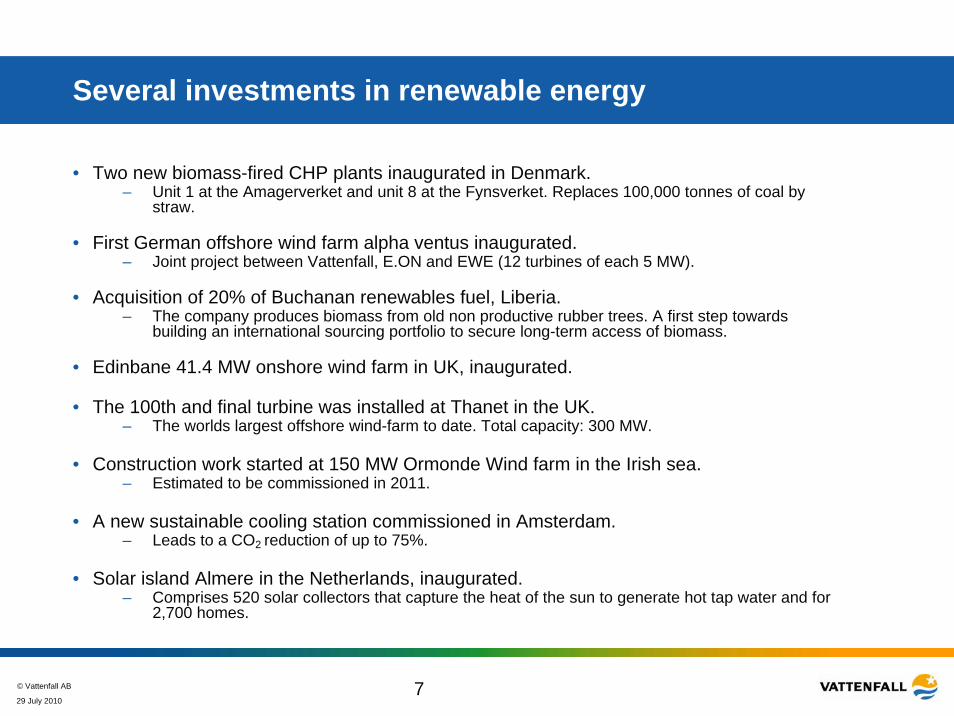
Several investments in renewable energy
• Two new biomass-fired CHP plants inaugurated in Denmark.– Unit 1 at the Amagerverket and unit 8 at the Fynsverket. Replaces 100,000 tonnes of coal by
straw.
• First German offshore wind farm alpha ventus inaugurated. – Joint project between Vattenfall, E.ON and EWE (12 turbines of each 5 MW).
• Acquisition of 20% of Buchanan renewables fuel, Liberia.– The company produces biomass from old non productive rubber trees. A first step towards
building an international sourcing portfolio to secure long-term access of biomass.
• Edinbane 41.4 MW onshore wind farm in UK, inaugurated.
• The 100th and final turbine was installed at Thanet in the UK. – The worlds largest offshore wind-farm to date. Total capacity: 300 MW.
• Construction work started at 150 MW Ormonde Wind farm in the Irish sea. – Estimated to be commissioned in 2011.
• A new sustainable cooling station commissioned in Amsterdam. – Leads to a CO2 reduction of up to 75%.
• Solar island Almere in the Netherlands, inaugurated. – Comprises 520 solar collectors that capture the heat of the sun to generate hot tap water and for
2,700 homes.

© Vattenfall AB 829 July 2010
Clarification of Vattenfall’s assignment
• On 3 June, 2010 Sweden’s parliament (Riksdag) passed the Government’s Bill regarding clarification of Vattenfall AB’s corporate assignment
“ The object for the Company’s activities is to generate a market rate of return by operating a commercial energy business that enables the company to be among the leaders in developing environmentally sustainable energy production”.
The Swedish original text: ” Föremål för bolagets verksamhet är att generera en marknadsmässig avkastning genom att affärsmässigt bedriva energiverksamhet så att bolaget tillhör ett av de bolag som leder utvecklingen mot en miljömässigt hållbar energiproduktion”.
• The Riksdag’s decision is being formally implemented through an amendment to Vattenfall AB’s articles of association. The amendment will be dealt with at an extraordinary shareholder’s meeting in Vattenfall AB on 23 August 2010.

© Vattenfall AB 929 July 2010
Review of Vattenfall’s strategy and structure initiated
• Starting point:Vattenfall’s current geographical presence and fuel mix provide a good platform to handle upcoming financial, environmental and regulatory challenges.
• We have initiated a review of existing strategy, including organizational structure, cost levels and performance. The outcome will be discussed with our shareholder and Vattenfall’s Board in the coming months. This may lead to restructuring costs and possibly impairment charges – among other things as a result of a review of future investments.
• Going forward Vattenfall must find the right balance between financial performance, security of supply and the environmental/regulatory agenda.
• We will return with more details later this year.

© Vattenfall AB
29 July 2010
Financials
Dag Andresen, CFO
© Vattenfall AB 1129 July 2010
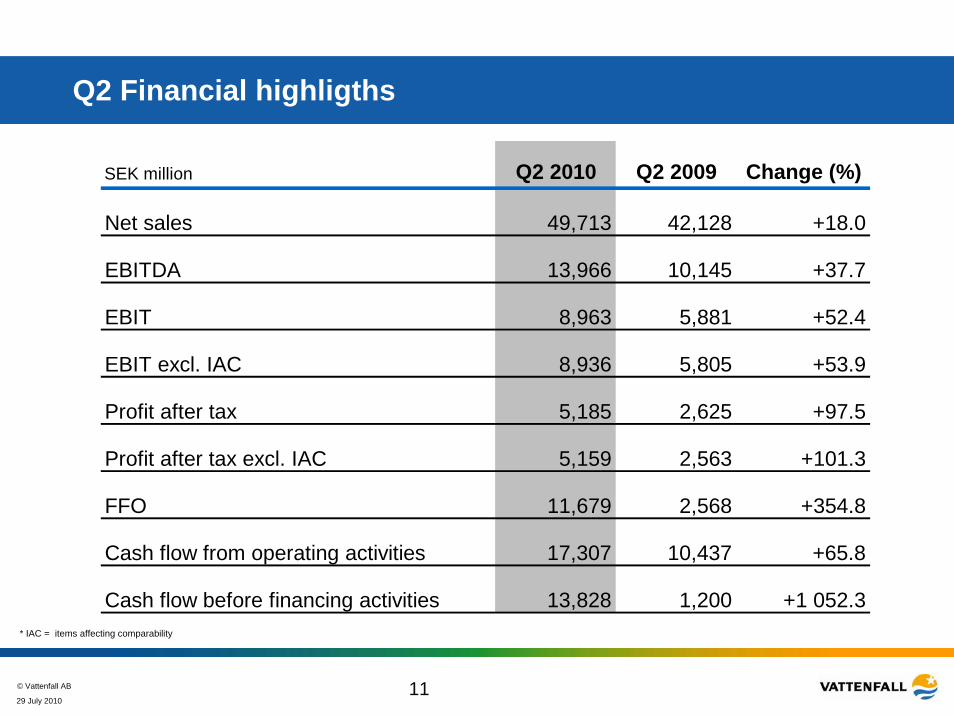
Q2 Financial highligths
* IAC = items affecting comparability
SEK million Q2 2010 Q2 2009 Change (%)
Net sales 49,713 42,128 +18.0
EBITDA 13,966 10,145 +37.7
EBIT 8,963 5,881 +52.4
EBIT excl. IAC 8,936 5,805 +53.9
Profit after tax 5,185 2,625 +97.5
Profit after tax excl. IAC 5,159 2,563 +101.3
FFO 11,679 2,568 +354.8
Cash flow from operating activities 17,307 10,437 +65.8
Cash flow before financing activities 13,828 1,200 +1 052.3

© Vattenfall AB 1229 July 2010
H1 Financial highligths
* IAC = items affecting comparability
SEK million H1 2010 H1 2009 Change (%)
Net sales 120,370 94,656 +27.2
EBITDA 29,443 27,294 +7.9
EBIT 19,078 18,741 +1.8
EBIT excl. IAC 24,312 18,662 +30.3
Profit after tax 8,972 10,716 -16.3
Profit after tax excl. IAC 14,204 10,655 +33.3
FFO 21,499 21,328 +0.8
Cash flow from operating activities 19,566 21,965 -10.9
Cash flow before financing activities 7,331 5,782 +26.8

© Vattenfall AB 1329 July 2010
Total interest-bearing liabilities (gross debt) decreased by
SEK 15 bn to SEK 199 bn compared with 31 Dec. 2009
Net debt decreased bySEK 3.9 bn to SEK 151 bn compared with 31 Dec. 2009
Return on Net Assets - incl. IAC: 8.6%* (FY 2009: 10.0%)- excl. IAC: 11.6%* (FY 2009: 11.4%)- target 11%
Return on Equity - incl. IAC: 8.7%* (FY 2009: 9.5%)- excl. IAC: 14.6%* (FY 2009: 11.4%)- long-term target 15%
* Last Twelve Months
H1 – Debt development & Key ratios

© Vattenfall AB 1429 July 2010
EBIT development, Q2 2010
5133 5133
74558435 8435 8547 8886
+77*+339+112-416+1 396
+2 321
-747
8 963
5 881
0
3 000
6 000
9 000
Q2 2009 Electricityprice
Electricityvolume
O&M Fuel Depr. Other EBITitems
N.V. NuonEnergy
Q2 2010
SEK million
* Excluding amortization of surplus value Nuon contributed with 500 million SEK.

© Vattenfall AB 1529 July 2010
EBIT development, Q2 2010 – by Product & Services
5881
7702 7702 8201 83718886
+77*+515
+170+498-228
+2 050
5 881
8 963
0
3 000
6 000
9 000
Q2 2009 Generation Heat Electricitynetworks
Supply &Trading
Other EBITitems
N.V. NuonEnergy
Q2 2010
SEK million
* Excluding amortization of surplus value Nuon contributed with 500 million SEK.
© Vattenfall AB 1629 July 2010
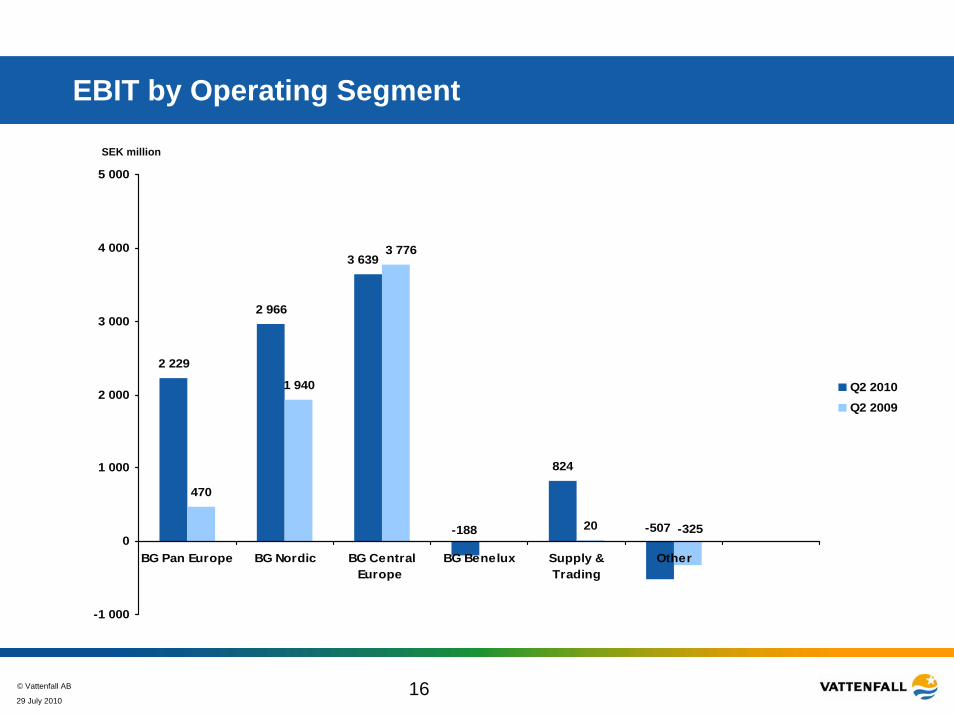
EBIT by Operating Segment
SEK million
2 229
2 966
824
470
1 940
20
3 639
-507-188
3 776
-325
-1 000
0
1 000
2 000
3 000
4 000
5 000
BG Pan Europe BG Nordic BG CentralEurope
BG Benelux Supply &Trading
Other
Q2 2010Q2 2009

© Vattenfall AB 1729 July 2010
Debt development H1 2010
135,4 135,4 137,4 137,4 139,8 151,1 151,1
198.5
151.1
+0.3+11.3+2.5-10.3+12.3-19.6
+47.5*
155.0
0
50
100
150
200
250
Net debt 31Dec, 2009
Cash flowfrom
operatingactivities
Cash flowfrom
investingactivities
Exchangerate
difference
Valuation atfair value
Changedcalculation of
net debt
Other Net debt 30June, 2010
Cash 30June, 2010
Gross debt30 June, 2010
SEK billion
*Includes loans to minority owners in foreign subsidiaries of SEK 1.8bn (excluded from liquidity calculation on slide 29)
© Vattenfall AB 1829 July 2010
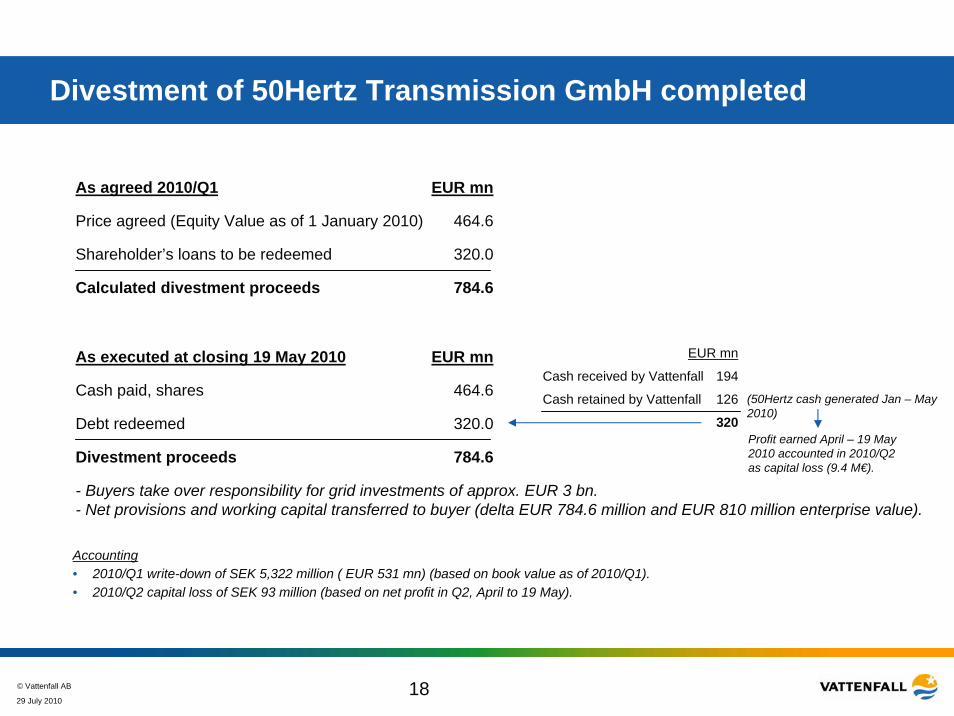
Divestment of 50Hertz Transmission GmbH completed
Accounting• 2010/Q1 write-down of SEK 5,322 million ( EUR 531 mn) (based on book value as of 2010/Q1).• 2010/Q2 capital loss of SEK 93 million (based on net profit in Q2, April to 19 May).
As agreed 2010/Q1
Price agreed (Equity Value as of 1 January 2010)
Shareholder’s loans to be redeemed
Calculated divestment proceeds
EUR mn
464.6
320.0
784.6
As executed at closing 19 May 2010
Cash paid, shares
Debt redeemed
Divestment proceeds
- Buyers take over responsibility for grid investments of approx. EUR 3 bn.- Net provisions and working capital transferred to buyer (delta EUR 784.6 million and EUR 810 million enterprise value).
EUR mn
464.6
320.0
784.6
Cash received by Vattenfall
Cash retained by Vattenfall
EUR mn
194
126
320
(50Hertz cash generated Jan – May 2010)
Profit earned April – 19 May 2010 accounted in 2010/Q2 as capital loss (9.4 M€).

© Vattenfall AB 1929 July 2010
84
59
41
94
67
27
0
10
20
30
40
50
60
70
80
90
100
2010
*
2011
2012
Nordic regionContinental Europe
Hedging position as of 30 June 2010% hedged of forecasted electricity generation.
EUR/MWh 2010* 2011
Nordic region 46 42 41
Continental Europe 57 56 56
2012
* remaining part of 2010

© Vattenfall AB 2029 July 2010
Key Ratio Targets
Return on Equity (ROE) 15% on average equity
3.5-4.5 times
Credit Rating Single A category ratingMoody’s: A2 Stable outlookS&P: A Negative outlook
40-60%
Cash flow interest coverage after maintenance investments
Dividend pay-out
Q2 2010
8.7%*14.6%* excl. IAC
4.1*
40.6%
Financial targets and outcome
* Last Twelve Months

© Vattenfall AB
29 July 2010
Q & A

© Vattenfall AB
29 July 2010
Back-up slides

© Vattenfall AB 2329 July 2010
84
52
36
90
51
16
0
10
20
30
40
50
60
70
80
90
100
2010
*
2011
2012
Nordic regionContinental Europe
Hedging position as of 30 June 2010% hedged of forecasted electricity generation.
EUR/MWh 2010* 2011
Nordic region 45 41 40
Continental Europe 58 57 55
2012
* remaining part of 2010

© Vattenfall AB 2429 July 2010
Consolidated income statement
* IAC = items affecting comparability
SEK million Q2 2010 Q2 2009 H1 2010 H1 2009 FY 2009 LTM
Net sales 49,713 42,128 120,370 94,656 205,407 231,121
Cost of products sold -36,343 -32,788 -87,215 -69,470 -162,564 -180,309
Gross profit 13,370 9,340 33,155 25,186 42,843 50,812
Operating profit 8,963 5,881 19,078 18,741 27,938 28,275
Operating profit, excl. IAC* 8,936 5,805 24,312 18,662 31,294 36,944
Financial income 295 415 861 1,102 2,814 2,573
Financal expenses -2,427 -2,823 -5,892 -5,613 -13,018 -13,297
Financial net -2,132 -2,408 -5,076 -4,511 -10,204 -10,724
Profit before taxes 6,831 3,473 14,047 14,230 17,734 17,551
Taxes -1,646 -848 -5,075 -3,514 -4,286 -5,847
Profit after tax 5,185 2,625 8,972 10,716 13,448 11,704

© Vattenfall AB 2529 July 2010
02 0004 0006 0008 000
10 00012 00014 00016 00018 00020 00022 00024 00026 00028 00030 00032 000
Q1 200
6Q2 2
006
Q3 200
6Q4 2
006
Q1 200
7Q2 2
007
Q3 200
7Q4 2
007
Q1 200
8Q2 2
008
Q3 200
8Q4 2
008
Q1 200
9Q2 2
009
Q3 200
9Q4 2
009
Q1 201
0Q2 2
010
Quarterly figures, SEK million
Quarterly figures in SEK million, excluding items affecting comparability
EBIT development last 5 years
Last 12 month figures in SEK million, excluding items affecting comparability

© Vattenfall AB 2629 July 2010
EBIT development, H1 2010
17870 17870 1894320556
16010 16010 1671818 741 19 078
-870 +1 072+1 614
+170
-4 717
+708
+2 360*
0
5 000
10 000
15 000
20 000
25 000
H1 2009 Electricityprice
Electricityvolume
O&M Fuel Depr. Other EBITitems
N.V. NuonEnergy
H1 2010
SEK million
* Excluding amortization of surplus value Nuon contributed 3 283 million SEK.

© Vattenfall AB 2729 July 2010
EBIT development, H1 2010 – by Product & Services
1874120564
16598 16598 16718 16718
+2 360*+85+205
-4 443
+447+1 823
18 741 19 078
0
5 000
10 000
15 000
20 000
25 000
H1 2009 Generation Heat Electricitynetworks
Supply &Trading
Other EBITitems
N.V. NuonEnergy
H1 2010
SEK million
* Excluding amortization of surplus value Nuon contributed 3 283 million SEK.

© Vattenfall AB 2829 July 2010
Consolidated cash flow statement
SEK million Q2 2010 Q2 2009 H1 2010 H1 2009 FY 2009 LTM
Funds from operations (FFO) 11,679 2,568 21,499 21,328 36,700 36,871
Change in working capital 5,628 7,869 -1,933 637 9,546 6,976
Cash flow from operating activities 17,307 10,437 19,566 21,965 46,246 43,847
Investment -8,973 -9,937 -17,908 -16,947 -102,989 -103,950
Divestment 5,785 675 5,964 737 5,542 10,769
Cash and cash equivalents in acquired/divested companies -291 27 -291 27 14,407 14,089
Cash flow from investing activites -3,479 -9,237 -12,235 -16,183 -83,040 -79,092
Free cash flow 14,288 5,594 13,231 14,049 27,566 26,748
Cash flow before financing activities 13,828 1,200 7,331 5,782 -36,794 -35,245
Cash flow from financing activities -347 20,363 3,286 55,559 27,822 -24,451
Cash flow for the period 13,481 21,563 10,617 61,341 -8,972 -59,696
Net debt at the end of the period -151,071 -63,478 -151,071 -63,478 -154,987 -151,071

© Vattenfall AB 2929 July 2010
Liquidity position
Debt maturities 2) (SEK million)
- within 90 days
- within 180 days
560
1 641
Group liquidity (SEK million)Cash and equivalents 21 279
Short term investments 24 365
Reported cash, cash equivalents & short term investments
45 644
Restricted cash 1) -9 326
Available cash 36 318
1) German nuclear ”Solidarvereinbarung” 3 234, Minority owner´s share of German nuclear subsidiaries cash position 3 610, Margin calls paid and others 2 482
Committed credit facilities Line size Amount available
RCF (maturity Feb 2013) EUR 1000 million SEK 9 501 million
Overdraft facility SEK 100 million SEK 100 million
Total undrawn SEK 9 601 million
Other credit lines unutilised SEK 7 925 million
As of 30 June 2010
2) Exluding loans from minority owners and associated companies

© Vattenfall AB 3029 July 2010
Subordinated Perpetual Capital Securities
5%
EMTN53%
Loans from associated companies
8%
Loans from minority shareholders
4%
NPV of liabilities to Nuon shareholders
23%
Bank loans and others7%
Funding programmes Size (EURm)
Utilization (EURm)
EUR 15 bn Euro MTN
EUR 2 bn Euro CP
SEK 15 bn Domestic CP
Total
10 60415 000
2 000
1 579
0
0
18 579 10 604
Breakdown of gross debt
Total debt 30 June 2010 1) :(SEK 198.5 bn / EUR 20.9 bn)
1) Of which external market debt: SEK 128.6 bn (65%)
• All public debt issued by Vattenfall AB• No currency exposure in the debt portfolio• No structural subordination
© Vattenfall AB 3129 July 2010
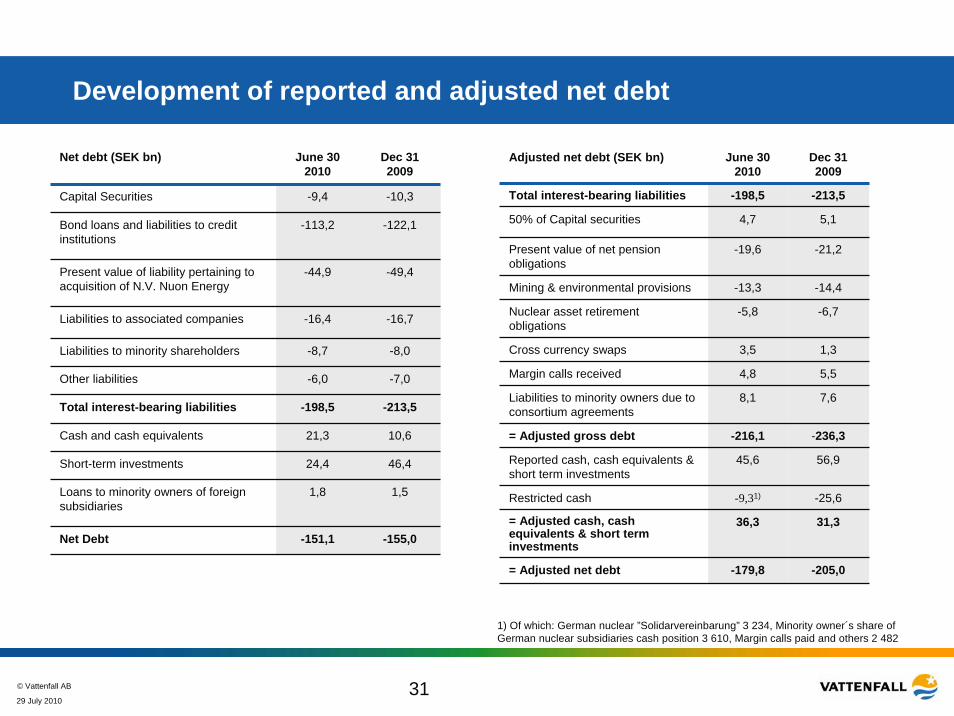
Development of reported and adjusted net debt
Net debt (SEK bn) June 30 2010
Dec 31 2009
-9,4
Bond loans and liabilities to credit institutions
-113,2 -122,1
Present value of liability pertaining to acquisition of N.V. Nuon Energy
-44,9 -49,4
Liabilities to associated companies -16,4 -16,7
Liabilities to minority shareholders -8,7 -8,0
Other liabilities -6,0 -7,0
Total interest-bearing liabilities -198,5 -213,5
Cash and cash equivalents 21,3 10,6
Short-term investments 24,4 46,4
1,8
-151,1
Capital Securities -10,3
Loans to minority owners of foreign subsidiaries
1,5
Net Debt -155,0
Adjusted net debt (SEK bn) June 30 2010
Dec 31 2009
-198,5
50% of Capital securities 4,7 5,1
Margin calls received 4,8 5,5
Liabilities to minority owners due to consortium agreements
8,1 7,6
Present value of net pension obligations
-19,6 -21,2
= Adjusted cash, cash equivalents & short term investments
36,3 31,3
= Adjusted net debt -179,8 -205,0
Mining & environmental provisions -13,3 -14,4
Nuclear asset retirement obligations
-5,8 -6,7
Cross currency swaps 3,5 1,3
= Adjusted gross debt -216,1 -236,3
Reported cash, cash equivalents & short term investments
45,6 56,9
-9,31)
Total interest-bearing liabilities -213,5
Restricted cash -25,6
1) Of which: German nuclear ”Solidarvereinbarung” 3 234, Minority owner´s share of German nuclear subsidiaries cash position 3 610, Margin calls paid and others 2 482

© Vattenfall AB 3229 July 2010
Vattenfall debt maturity profile
Capital Securities
0
5000
10000
15000
20000
25000
30000
35000
2010 2012 2014 2016 2018 2020 2022 2024 2026 2028 2030 2032 2034 2036 2038
2010 06 30
Undrawn back-up facilities
Excluding loans from associated companies and minority owners
SEK million
1) The duration in the liability portfolio was in the end of May 2009 prolonged from 2,5 to 4 years
2) Based on external debt, excluding Capital Securities. Including Capital Securities the Duration is 4.3, Average time to maturity 6.8, and Average interest rate 3.5.
2010-06-30 2009-06-30
Duration (years)1) 4.32) 4.0
Average time to maturity (years) 6.92) 9.2
Average interest rate (%) 3.42) 4.7
Net debt (SEK bn) 151.1 63.5

© Vattenfall AB 3329 July 2010
Oil, coal, gas and CO2 allowances
0
50
100
150
200
250
jan-
07
apr-0
7
jul-0
7
okt-0
7
jan-
08
apr-0
8
jul-0
8
okt-0
8
jan-
09
apr-0
9
jul-0
9
okt-0
9
jan-
10
apr-1
0
0
10
20
30
40
50
60
70
80
Oil (USD/bbl), Brent Front Month Coal (USD/t), API 2, Front Year Emission allowances CO2 (EUR/t), 2009/10 Gas (EUR/MWh), NBP, Front Year
USD EUR

© Vattenfall AB 3429 July 2010
Hydrological balance in Nordic region
-50
-40
-30
-20
-10
0
10
20
30
40
0
100
200
300
400
500
600
700
800
900
1000
System Price
Hydro Balance
SYSSEK/MWhTWh
1996 199919981997 2003200220012000 2004 2005 2006 2007 2008 2009

© Vattenfall AB 3529 July 2010
Audits 2010per/weeks MW
F1 978
F2 990
F3 1 170
R1 855
R2 866
R3 1 051
R4 936
A 500
B 500
D 500
E 500
F 500Boxberg P 500
A 800
B 800Lippendorf R 900Rostock A 553
LWE6 247
MK11-12 103
DM33 249
AL01-02 62/52
HW71-72 579
HW-8 650
PU-1 67
Velsen VN24-25 459/375
Oost BUGG 240
Ultrecht
Amsterdam
Gas and coal
Q3 Q4
Nuclear
Jänschwalde
Forsmark
Ringhals
Q2
Schwarz
e pumpe
Lignite/Coal pow
er plants

© Vattenfall AB 3629 July 2010
20 849
40 571
14 318
27 618
1 605
3 499
8 234
18 994
42 055
13 304
34 266
1 862
3 6106 132
PensionsNuclearMiningTaxesOtherPersonnelLegal
30 June 2010
SEK 120,223 million30 June 2009
SEK 116,694 million
Group provisions (IFRS)
Related Documents