9 AN OVERVIEW OF 2006 ACTIVITIES IN THE LSU AGCENTER SUGARCANE VARIETY DEVELOPMENT PROGRAM Kenneth Gravois Sugar Research Station The primary objective of the LSU AgCenter Sugarcane Variety Development Program is to contribute to the profitability of the Louisiana sugarcane industry by developing improved sugarcane varieties. Sugarcane variety development in the LSU AgCenter is carried out by a team of scientists (Table 1). The LSU AgCenter sugarcane breeding team and the United States Department of Agriculture (USDA) sugarcane breeding team work independently yet cooperatively to produce “L” and “HoCP or Ho” varieties, respectively. The best varieties from each program are brought together for evaluation at the nursery, infield, and outfield test locations. Outfield testing is conducted by personnel of the LSU AgCenter, the USDA, and the American Sugar Cane League. Seed increase is carried out by the American Sugar Cane League and begins when varieties are introduced to the outfield testing stage. The cooperative efforts of sugarcane breeding are done in accordance with the provisions of the “Three-Way Agreement of 2007.” After yield data for one crop cycle (plant-cane, first stubble, and second stubble) are collected in the outfield testing stage, those varieties that show promise are released for commercial production. Table 1. Members of the LSU AgCenter Sugarcane Variety Development Team in 2006. Team Member Budgetary Unit Responsibility Kenneth Gravois Sugar Research Station Program Leader Keith Bischoff Sugar Research Station Selection Collins Kimbeng Plant, Environmental & Soil Sciences Molecular Breeding Gene Reagan Entomology Insect Resistance Jeff Hoy Plant Pathology & Crop Physiology Disease Resistance Jim Griffin Plant, Environmental & Soil Sciences Herbicide Tolerance Sonny Viator Iberia Research Station Variety Testing Terry Bacon Sugar Research Station Variety Testing Gert Hawkins Sugar Research Station Sucrose Laboratory Chris LaBorde Sugar Research Station Photoperiod and Crossing Mike Duet Sugar Research Station Outfield Testing Todd Robert Sugar Research Station Variety Testing Joel Hebert Sugar Research Station Farm Manager A total of 79,395 seedlings from 72 crosses from the 2004 and 2005 crossing series were planted in the field in the spring of 2006. A total of 73,137 seedlings survived transplanting. In addition, 3,710 seedlings were planted in a cross appraisal trial. The majority of the seedlings

Welcome message from author
This document is posted to help you gain knowledge. Please leave a comment to let me know what you think about it! Share it to your friends and learn new things together.
Transcript

9
AN OVERVIEW OF 2006 ACTIVITIES IN THE LSU AGCENTER SUGARCANE VARIETY DEVELOPMENT PROGRAM
Kenneth Gravois
Sugar Research Station The primary objective of the LSU AgCenter Sugarcane Variety Development Program is to contribute to the profitability of the Louisiana sugarcane industry by developing improved sugarcane varieties. Sugarcane variety development in the LSU AgCenter is carried out by a team of scientists (Table 1). The LSU AgCenter sugarcane breeding team and the United States Department of Agriculture (USDA) sugarcane breeding team work independently yet cooperatively to produce “L” and “HoCP or Ho” varieties, respectively. The best varieties from each program are brought together for evaluation at the nursery, infield, and outfield test locations. Outfield testing is conducted by personnel of the LSU AgCenter, the USDA, and the American Sugar Cane League. Seed increase is carried out by the American Sugar Cane League and begins when varieties are introduced to the outfield testing stage. The cooperative efforts of sugarcane breeding are done in accordance with the provisions of the “Three-Way Agreement of 2007.” After yield data for one crop cycle (plant-cane, first stubble, and second stubble) are collected in the outfield testing stage, those varieties that show promise are released for commercial production. Table 1. Members of the LSU AgCenter Sugarcane Variety Development Team in 2006.
Team Member Budgetary Unit Responsibility
Kenneth Gravois Sugar Research Station Program Leader
Keith Bischoff Sugar Research Station Selection
Collins Kimbeng Plant, Environmental & Soil Sciences Molecular Breeding
Gene Reagan Entomology Insect Resistance
Jeff Hoy Plant Pathology & Crop Physiology Disease Resistance
Jim Griffin Plant, Environmental & Soil Sciences Herbicide Tolerance
Sonny Viator Iberia Research Station Variety Testing
Terry Bacon Sugar Research Station Variety Testing
Gert Hawkins Sugar Research Station Sucrose Laboratory
Chris LaBorde Sugar Research Station Photoperiod and Crossing
Mike Duet Sugar Research Station Outfield Testing
Todd Robert Sugar Research Station Variety Testing
Joel Hebert Sugar Research Station Farm Manager A total of 79,395 seedlings from 72 crosses from the 2004 and 2005 crossing series were
planted in the field in the spring of 2006. A total of 73,137 seedlings survived transplanting. In addition, 3,710 seedlings were planted in a cross appraisal trial. The majority of the seedlings

10
were from crosses of commercial varieties and elite experimental varieties. Selection will be carried out in 2007 when the seedlings are in the first stubble crop.
Photoperiod treatments to induce flowering began on May 31 and continued until
September 10. Flowering in 2006 was excellent, with 401 crosses being made. Relatively low August and September temperatures were conducive to flowering. Germination tests were conducted in December and January. Seed production for 2006 was more than adequate based on germination test results, with 279,777 true seed produced during 2006.
In the fall of 2006, individual selection was practiced on first stubble seedlings that represented the 2004 crossing series. The cross appraisal was evaluated and rated prior to selection. Family selection (top 60% in 2006) was utilized based on information from the cross appraisal results. Selection was done during the first through third weeks of September. The seedling populations were only slightly lodged. From this initial population, 2,296 clones were selected and planted to establish the first-line trials.
Established procedures were used to advance superior clones of the 2003 crossing series
from first-line trials to second-line trials (256 clones) and of the 2002 crossing series from second-line trials to increase trials (240 clones). Preliminary ratings for cane yield and plant type were done in August. Clones with acceptable ratings were further evaluated for lodging, broken tops, borer damage, diseases, pith/tube, and Brix/sugar per ton.
The best 40 experimental varieties from the 2001 crossing series were assigned
permanent variety designations in the fall of 2006. Newly assigned varieties were entered in replicated nursery trials at three locations (Sugar Research Station, USDA-ARS Ardoyne Farm, and Iberia Research Station). “L”, “HoCP, or Ho” varieties of the 2006 assignment series were exchanged in the fall of 2006 to plant cooperative infield and off-station nursery tests the following year.
Experimental varieties were replanted in infield and off-station nursery tests (15 varieties
of the 2005 series), introduced to the outfield tests (three varieties of the 2004 series), and planted in outfield tests (two experimental varieties of the 2001 assignment series; one experimental variety of the 2003 assignment series). Breeding personnel assisted Dr. Jeff Hoy and Dr. Gene Reagan in entering experimental varieties in the sugarcane smut and sugarcane borer resistance trials, respectively.
The Variety Release Committee met at the American Sugar Cane League Office on April 25, 2006 to consider the release of L 99-226 and L 99-233. The vote for release was unanimous. Seed was made available to growers by the American Sugar Cane League
The decision regarding the further testing and seed increase of candidate experimental varieties was determined at the Variety Advancement Committee meeting. The 2006 meeting was held on August 11, 2006, at the American Sugar Cane League office in Thibodaux, Louisiana. The distribution of “L” experimental clones through stages of testing in 2006 is presented in Table 2.

11
Progress in the LSU AgCenter Sugarcane Variety Development Program would not be possible without the financial support of state funds from the LSU AgCenter and the Louisiana sugar industry through the American Sugar Cane League.
Table 2. Number of “L” varieties by assignment series at the most advanced stage of testing in 2006. Series
Stage of Testing
Number of
experimental varieties
L 2001 Outfield – Replanted and harvested as plantcane and first stubble Off-station nurseries and infield – 3rd stubble harvested
2
L 2002 Outfield – Replanted and harvested as plantcane On-station nurseries - 3rd stubble harvested Off-station nurseries and infield – 2nd stubble harvested.
0
L 2003 Outfield – Planted On-station nurseries - 2nd stubble harvested Off-station nurseries and infield - 1st stubble harvested
1
L 2004 Outfield - Introduced On-station nurseries - 1st stubble harvested Off-station nurseries and infield - plantcane harvested.
3
L 2005 On-station nurseries - plantcane harvested Off-station nurseries and infield planted 15
L 2006 Assignment - On-station nurseries planted 40
In 2006, rust continued to be seen in high levels in LCP85-384 throughout the growing season, especially in the plant-cane crop. Smut disease was prevalent in 2006, whereas levels of pith and leaf scald in experimental varieties were somewhat below average compared to other years. Sugarcane borer infestations were extremely light at the Sugar Research Station. The weather in 2006 was good, although some of the western and northern portions of the sugarcane growing areas experienced drought.
12
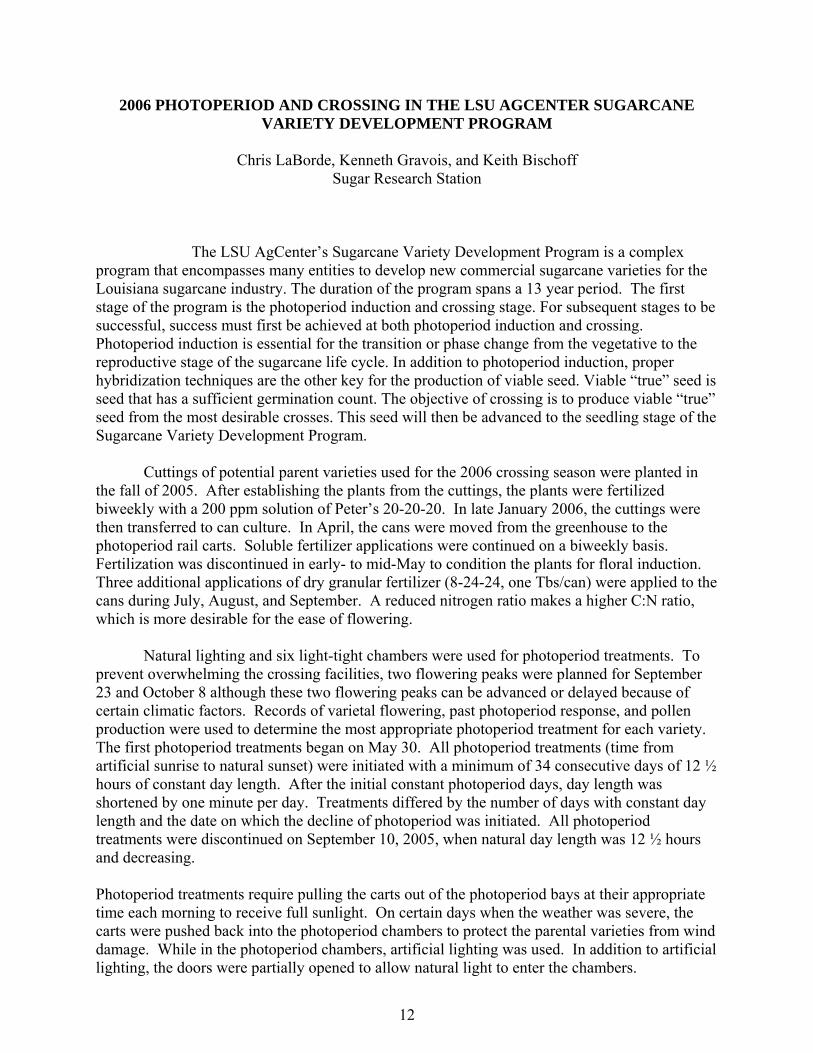
2006 PHOTOPERIOD AND CROSSING IN THE LSU AGCENTER SUGARCANE VARIETY DEVELOPMENT PROGRAM
Chris LaBorde, Kenneth Gravois, and Keith Bischoff
Sugar Research Station
The LSU AgCenter’s Sugarcane Variety Development Program is a complex program that encompasses many entities to develop new commercial sugarcane varieties for the Louisiana sugarcane industry. The duration of the program spans a 13 year period. The first stage of the program is the photoperiod induction and crossing stage. For subsequent stages to be successful, success must first be achieved at both photoperiod induction and crossing. Photoperiod induction is essential for the transition or phase change from the vegetative to the reproductive stage of the sugarcane life cycle. In addition to photoperiod induction, proper hybridization techniques are the other key for the production of viable seed. Viable “true” seed is seed that has a sufficient germination count. The objective of crossing is to produce viable “true” seed from the most desirable crosses. This seed will then be advanced to the seedling stage of the Sugarcane Variety Development Program.
Cuttings of potential parent varieties used for the 2006 crossing season were planted in the fall of 2005. After establishing the plants from the cuttings, the plants were fertilized biweekly with a 200 ppm solution of Peter’s 20-20-20. In late January 2006, the cuttings were then transferred to can culture. In April, the cans were moved from the greenhouse to the photoperiod rail carts. Soluble fertilizer applications were continued on a biweekly basis. Fertilization was discontinued in early- to mid-May to condition the plants for floral induction. Three additional applications of dry granular fertilizer (8-24-24, one Tbs/can) were applied to the cans during July, August, and September. A reduced nitrogen ratio makes a higher C:N ratio, which is more desirable for the ease of flowering.
Natural lighting and six light-tight chambers were used for photoperiod treatments. To
prevent overwhelming the crossing facilities, two flowering peaks were planned for September 23 and October 8 although these two flowering peaks can be advanced or delayed because of certain climatic factors. Records of varietal flowering, past photoperiod response, and pollen production were used to determine the most appropriate photoperiod treatment for each variety. The first photoperiod treatments began on May 30. All photoperiod treatments (time from artificial sunrise to natural sunset) were initiated with a minimum of 34 consecutive days of 12 ½ hours of constant day length. After the initial constant photoperiod days, day length was shortened by one minute per day. Treatments differed by the number of days with constant day length and the date on which the decline of photoperiod was initiated. All photoperiod treatments were discontinued on September 10, 2005, when natural day length was 12 ½ hours and decreasing.
Photoperiod treatments require pulling the carts out of the photoperiod bays at their appropriate time each morning to receive full sunlight. On certain days when the weather was severe, the carts were pushed back into the photoperiod chambers to protect the parental varieties from wind damage. While in the photoperiod chambers, artificial lighting was used. In addition to artificial lighting, the doors were partially opened to allow natural light to enter the chambers.

13
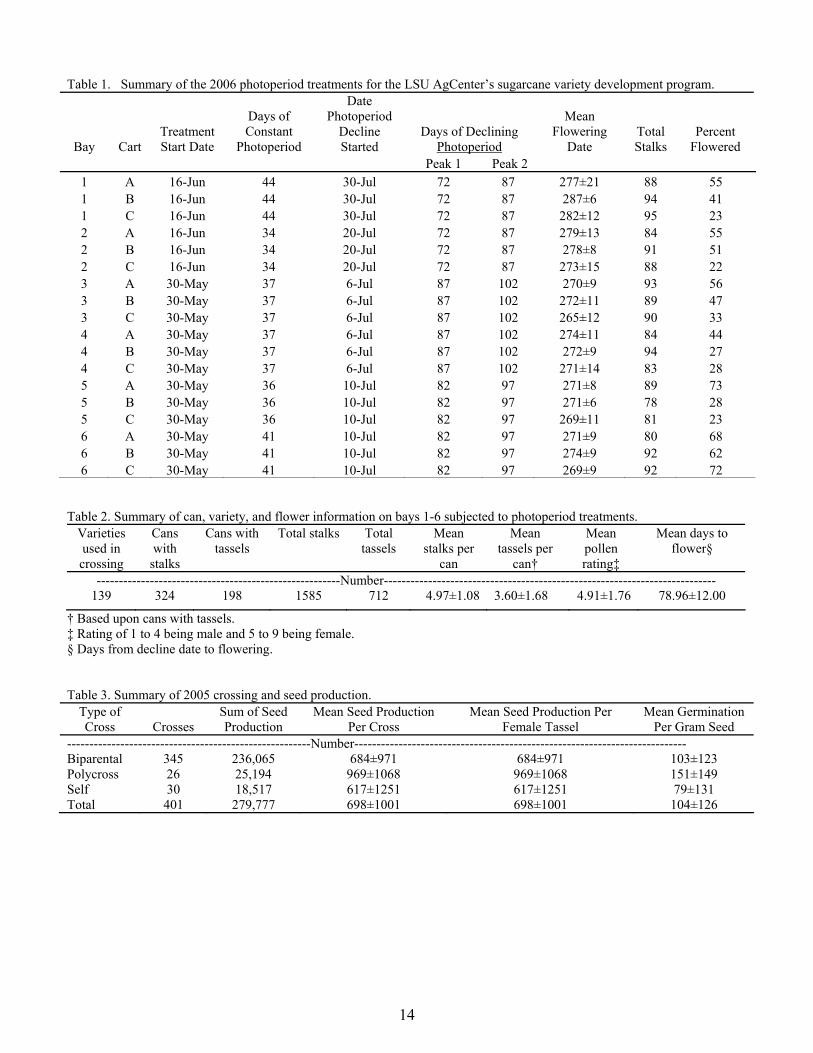
Flowering percentage of total stalks was average on the photoperiod carts in 2006 (Tables 1-2). Total flowering percentage for the six bays was 45%, which was comprised from 1,585 stalks. Although the flowering percentage was average in 2006, successful seed production is comprised of a multitude of factors. An adequate germination rate provided the Variety Development Program with sufficient seed production. In 2006 as in previous years, seedlings were produced from hybridization techniques that used sugarcane yield components, borer resistance, and disease resistance as some of the criteria to determine which breeding stocks were most compatible.
The flowering season in 2006 began during the second week of September. The normal
time frame for first flowering can be as early as the last week of August or as late as the second week of September. There can be a slight deviation on when the first flower does appear due to temperature during the photoperiod induction phase, varietal characteristics, and the photoperiod treatments. Crossing began on September 8 and ended on October 23, 2006. The end date was a true end date; there were no more flowers to be used for hybridization. This was an unusual year because of the early influx of flowers that were produced. Crossing usually extends well into November. A total of 712 tassels of 139 varieties were used to produce 401 crosses producing 279,777 viable seed with 236,065 seed produced from biparental crosses (Table 3). The germination rate is one of two components that measure the success of this stage in the crossing program. The other component is photoperiod induction. Close attention was made once again in maintaining high relative humidity within the crossing greenhouse; high relative humidity has been proven in past studies to increase seed set. High relative humidity is maintained with the use of a misting system that has been installed inside of the crossing greenhouse. High temperatures throughout the summer months can result in poor production of sugarcane flowering as is being speculated in 2006. Along with the hot summer months, high temperatures in September can also result in poor seed set. Although outside temperatures may be in the 90 degree range, greenhouse temperatures can be anywhere from 10 to 30 degrees hotter. To manage high temperatures the crossing greenhouse is white-washed at the beginning of the crossing season (late August). Along with the shading effect of the white-washed greenhouse, the misting system also has a cooling effect on the greenhouse environment.
14
Table 1. Summary of the 2006 photoperiod treatments for the LSU AgCenter’s sugarcane variety development program.
Bay Cart Treatment Start Date
Days of Constant
Photoperiod
Date Photoperiod
Decline Started
Days of Declining Photoperiod
Mean Flowering
Date Total Stalks
Percent Flowered
Peak 1 Peak 2 1 A 16-Jun 44 30-Jul 72 87 277±21 88 55 1 B 16-Jun 44 30-Jul 72 87 287±6 94 41 1 C 16-Jun 44 30-Jul 72 87 282±12 95 23 2 A 16-Jun 34 20-Jul 72 87 279±13 84 55 2 B 16-Jun 34 20-Jul 72 87 278±8 91 51 2 C 16-Jun 34 20-Jul 72 87 273±15 88 22 3 A 30-May 37 6-Jul 87 102 270±9 93 56 3 B 30-May 37 6-Jul 87 102 272±11 89 47 3 C 30-May 37 6-Jul 87 102 265±12 90 33 4 A 30-May 37 6-Jul 87 102 274±11 84 44 4 B 30-May 37 6-Jul 87 102 272±9 94 27 4 C 30-May 37 6-Jul 87 102 271±14 83 28 5 A 30-May 36 10-Jul 82 97 271±8 89 73 5 B 30-May 36 10-Jul 82 97 271±6 78 28 5 C 30-May 36 10-Jul 82 97 269±11 81 23 6 A 30-May 41 10-Jul 82 97 271±9 80 68 6 B 30-May 41 10-Jul 82 97 274±9 92 62 6 C 30-May 41 10-Jul 82 97 269±9 92 72
Table 2. Summary of can, variety, and flower information on bays 1-6 subjected to photoperiod treatments.
Varieties used in crossing
Cans with stalks
Cans with tassels
Total stalks Total tassels
Mean stalks per
can
Mean tassels per
can†
Mean pollen rating‡
Mean days to flower§
-------------------------------------------------------Number--------------------------------------------------------------------------- 139 324 198 1585 712 4.97±1.08 3.60±1.68 4.91±1.76 78.96±12.00
† Based upon cans with tassels. ‡ Rating of 1 to 4 being male and 5 to 9 being female. § Days from decline date to flowering. Table 3. Summary of 2005 crossing and seed production.
Type of Cross
Crosses
Sum of Seed Production
Mean Seed Production Per Cross
Mean Seed Production Per Female Tassel
Mean Germination Per Gram Seed
-------------------------------------------------------Number--------------------------------------------------------------------------- Biparental 345 236,065 684±971 684±971 103±123 Polycross 26 25,194 969±1068 969±1068 151±149 Self 30 18,517 617±1251 617±1251 79±131 Total 401 279,777 698±1001 698±1001 104±126

15
Table 4. Varietal flowering summary in 2006 in the photoperiod bays.
Variety Days of Constant
Photoperiod First Flower
Date Mean Days to Flower
Pollen Rating
Total Stalk Number
Total Flowers
Percent Flowering
Stalks CP79-348 38±1 . . . 14 . . CP83-644 41 282 98±3 6 22 4 18 Ho89-889 41 270 82±3 6±1 3 3 100 Ho91-572 38±2 . . 5 . . Ho95-988 39 261 88±2 5 18 18 100 HoCP00-905 41 268 81±4 5±2 15 2 13 HoCP00-927 44 235 25±1 5±1 13 3 23 HoCP00-930 40±2 282 77±2 4 9 5 56 HoCP00-931 34 289 88 3 1 1 100 HoCP00-933 36±2 237 68±12 5±1 11 5 45 HoCP00-950 37±1 261 83±2 7 22 17 77 HoCP00-951 41 270 79 7 1 1 100 HoCP01-517 39±1 . . . 9 . . HoCP01-523 37 275 94±2 5 15 4 27 HoCP01-561 37 275 93±5 6±2 4 2 50 HoCP02-610 38±1 265 78±1 4 18 15 83 HoCP02-618 42 268 80±1 3 16 8 50 HoCP02-620 41±1 268 81±2 6 10 8 80 HoCP02-623 40 272 86±1 5 17 14 82 HoCP02-652 34 272 77±2 4 6 6 100 HoCP03-704 37 263 79±2 7 6 6 100 HoCP03-708 40±1 275 88±3 4±1 8 5 63 HoCP03-716 39±1 . . . 8 . . HoCP03-720 44 296 85 5 4 1 25 HoCP03-743 37 . . . 11 . . HoCP03-744 34 . . . 4 . . HoCP04-803 41 258 70±1 4±1 10 5 50 HoCP04-807 41 270 85±2 3 6 6 100 HoCP04-809 41 251 63±1 5 5 5 100 HoCP04-810 41 263 75±1 5±1 5 5 100 HoCP04-814 37 . . . 6 . . HoCP04-821 37 . . . 5 . . HoCP04-823 37±1 . . . 8 . . HoCP04-824 41 263 76±1 4 12 11 92 HoCP04-827 36±2 272 84±1 6 7 4 57 HoCP04-829 37 256 73±1 5±1 5 5 100 HoCP04-836 41±2 275 83±3 3 7 5 71 HoCP04-837 37 . . . 3 . . HoCP04-838 34 237 36 3 12 2 17 HoCP04-843 37 251 71±2 6 6 6 100 HoCP04-847 44 . . . 6 . . HoCP04-853 44 291 83±3 5±2 4 2 50 HoCP04-854 44 . . . 6 . . HoCP04-855 44 235 24 3 7 1 14 HoCP04-856 44 . . . 5 . . HoCP85-845 41 268 85±4 3 36 6 17
16
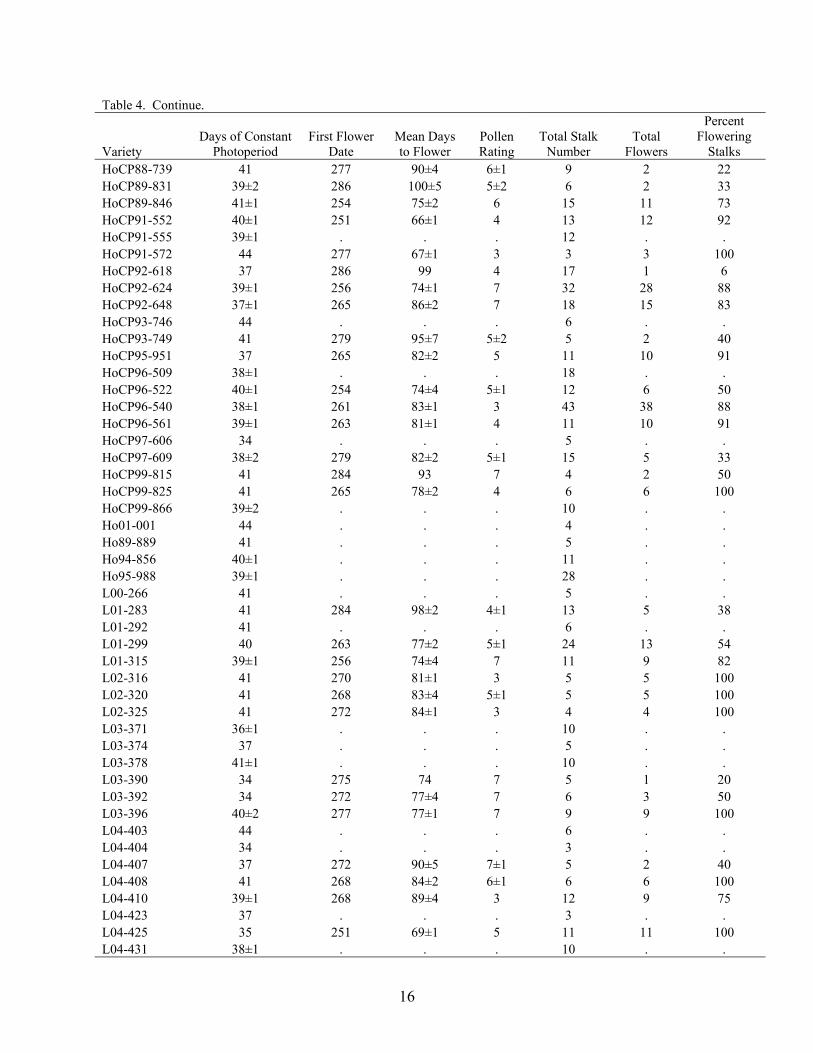
Table 4. Continue.
Variety Days of Constant
Photoperiod First Flower
Date Mean Days to Flower
Pollen Rating
Total Stalk Number
Total Flowers
Percent Flowering
Stalks HoCP88-739 41 277 90±4 6±1 9 2 22 HoCP89-831 39±2 286 100±5 5±2 6 2 33 HoCP89-846 41±1 254 75±2 6 15 11 73 HoCP91-552 40±1 251 66±1 4 13 12 92 HoCP91-555 39±1 . . . 12 . . HoCP91-572 44 277 67±1 3 3 3 100 HoCP92-618 37 286 99 4 17 1 6 HoCP92-624 39±1 256 74±1 7 32 28 88 HoCP92-648 37±1 265 86±2 7 18 15 83 HoCP93-746 44 . . . 6 . . HoCP93-749 41 279 95±7 5±2 5 2 40 HoCP95-951 37 265 82±2 5 11 10 91 HoCP96-509 38±1 . . . 18 . . HoCP96-522 40±1 254 74±4 5±1 12 6 50 HoCP96-540 38±1 261 83±1 3 43 38 88 HoCP96-561 39±1 263 81±1 4 11 10 91 HoCP97-606 34 . . . 5 . . HoCP97-609 38±2 279 82±2 5±1 15 5 33 HoCP99-815 41 284 93 7 4 2 50 HoCP99-825 41 265 78±2 4 6 6 100 HoCP99-866 39±2 . . . 10 . . Ho01-001 44 . . . 4 . . Ho89-889 41 . . . 5 . . Ho94-856 40±1 . . . 11 . . Ho95-988 39±1 . . . 28 . . L00-266 41 . . . 5 . . L01-283 41 284 98±2 4±1 13 5 38 L01-292 41 . . . 6 . . L01-299 40 263 77±2 5±1 24 13 54 L01-315 39±1 256 74±4 7 11 9 82 L02-316 41 270 81±1 3 5 5 100 L02-320 41 268 83±4 5±1 5 5 100 L02-325 41 272 84±1 3 4 4 100 L03-371 36±1 . . . 10 . . L03-374 37 . . . 5 . . L03-378 41±1 . . . 10 . . L03-390 34 275 74 7 5 1 20 L03-392 34 272 77±4 7 6 3 50 L03-396 40±2 277 77±1 7 9 9 100 L04-403 44 . . . 6 . . L04-404 34 . . . 3 . . L04-407 37 272 90±5 7±1 5 2 40 L04-408 41 268 84±2 6±1 6 6 100 L04-410 39±1 268 89±4 3 12 9 75 L04-423 37 . . . 3 . . L04-425 35 251 69±1 5 11 11 100 L04-431 38±1 . . . 10 . .

17
Table 4. Continue.
Variety Days of Constant
Photoperiod First Flower
Date Mean Days to Flower
Pollen Rating
Total Stalk Number
Total Flowers
Percent Flowering
Stalks L05-442 37 . . . 6 . . L05-445 41 256 73±6 7±1 9 4 44 L05-447 37 . . . 6 . . L05-448 38±1 263 73±1 3 10 10 100 L05-450 41 272 81 3 5 5 100 L05-451 41 258 75±5 5±1 6 6 100 L05-453 41 . . . 4 . . L05-460 37±1 258 72±1 6 12 11 92 L05-462 41 . . . 6 . . L05-471 44 . . . 5 . . L89-113 37 296 109 5 10 1 10 L91-255 39±1 . . . 16 . . L91-281 44 279 71±1 3 10 10 100 L92-312 41 272 84±2 3±1 4 4 100 L93-399 37 275 90±2 6 10 2 20 L94-424 40±1 . . . 13 . . L94-426 36 268 87±2 6 23 8 35 L94-428 39±1 263 82±3 6±1 21 10 48 L94-432 41 270 90±8 4±1 20 3 15 L94-433 40±1 282 99±3 6 24 9 38 L96-092 41 . . . 9 . . L97-128 40 258 76±1 7 49 36 73 L97-137 41 . . . 10 . . L98-197 37±2 237 74±6 5±1 9 8 89 L98-207 44 282 74±2 5 32 4 13 L98-209 41±4 265 83±5 7 19 2 11 L99-226 39 265 82±1 3 44 36 82 L99-233 38±1 254 70±1 4 41 26 63 LCP81-010 41±1 235 72±4 5 26 19 73 LCP82-089 41 275 90±3 5±1 11 5 45 LCP85-384 39±1 265 85±1 4 54 24 44 LCP86-454 41 258 71±3 6 24 3 13 LCP87-492 40±1 254 75±5 6 13 8 62 N27 37 . . . 12 . . TucCP77-042 38±1 237 86±6 6 23 15 65 US01-039 37 . . . 6 . . US01-040 37 275 93±4 4±1 6 3 50 US02-095 34 . . . 4 . . US05-9604 44 . . . 6 . . US79-010 34 277 76 3 10 1 10 US80-004 39±1 . . . 8 . . US90-018 41 . . . 5 . . US93-015 37 279 92 5 5 1 20 US96-002 34 279 83±5 7 5 3 60 US99-002 44 235 47±10 5±1 6 6 100 US99-004 44 286 78±2 5±1 4 3 75
18
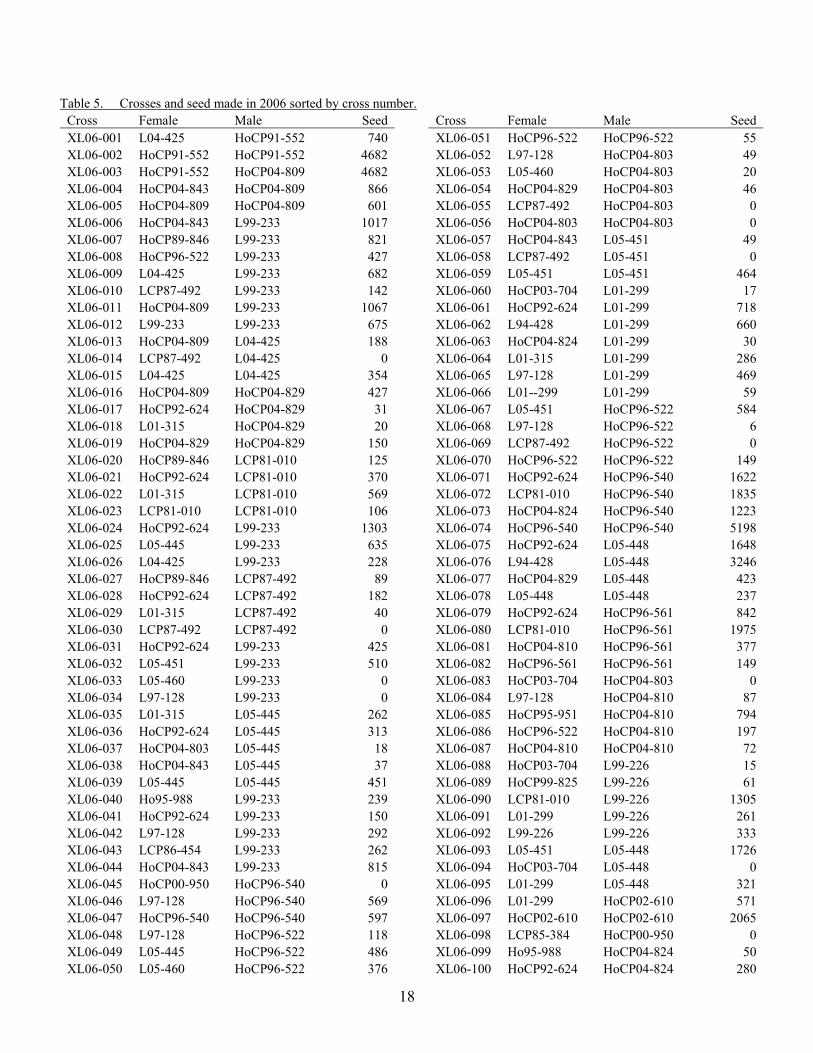
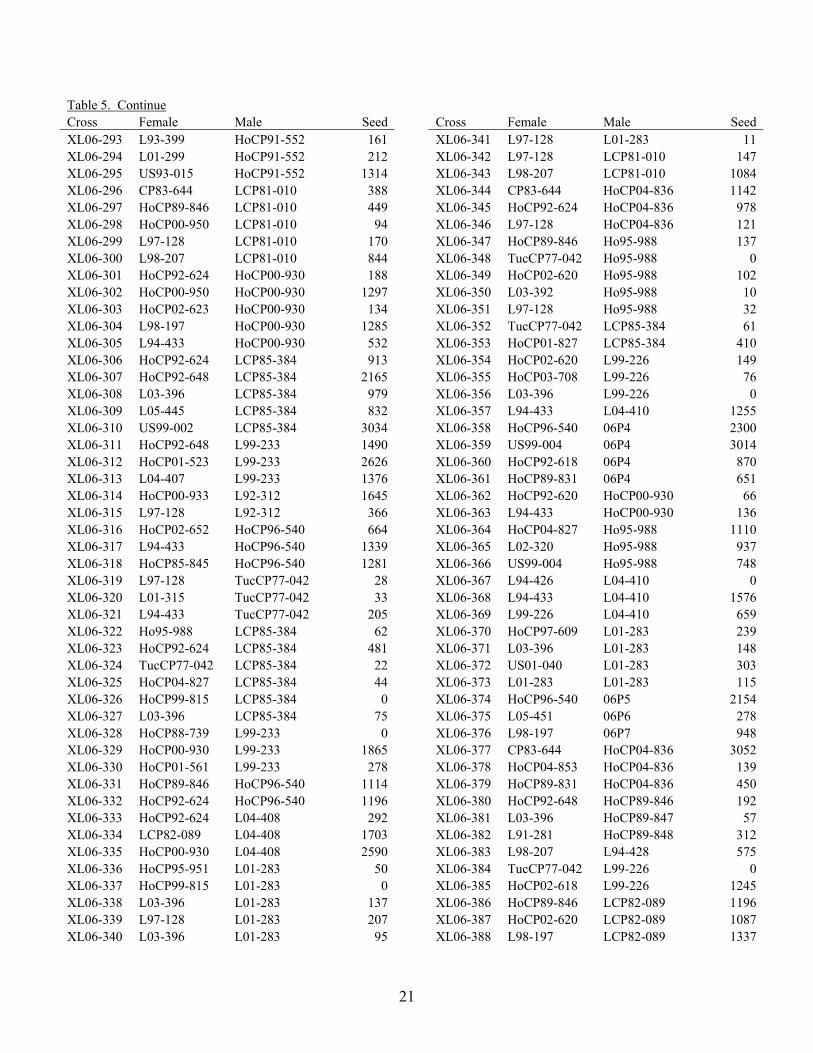
Table 5. Crosses and seed made in 2006 sorted by cross number. Cross Female Male Seed XL06-001 L04-425 HoCP91-552 740 XL06-002 HoCP91-552 HoCP91-552 4682 XL06-003 HoCP91-552 HoCP04-809 4682 XL06-004 HoCP04-843 HoCP04-809 866 XL06-005 HoCP04-809 HoCP04-809 601 XL06-006 HoCP04-843 L99-233 1017 XL06-007 HoCP89-846 L99-233 821 XL06-008 HoCP96-522 L99-233 427 XL06-009 L04-425 L99-233 682 XL06-010 LCP87-492 L99-233 142 XL06-011 HoCP04-809 L99-233 1067 XL06-012 L99-233 L99-233 675 XL06-013 HoCP04-809 L04-425 188 XL06-014 LCP87-492 L04-425 0 XL06-015 L04-425 L04-425 354 XL06-016 HoCP04-809 HoCP04-829 427 XL06-017 HoCP92-624 HoCP04-829 31 XL06-018 L01-315 HoCP04-829 20 XL06-019 HoCP04-829 HoCP04-829 150 XL06-020 HoCP89-846 LCP81-010 125 XL06-021 HoCP92-624 LCP81-010 370 XL06-022 L01-315 LCP81-010 569 XL06-023 LCP81-010 LCP81-010 106 XL06-024 HoCP92-624 L99-233 1303 XL06-025 L05-445 L99-233 635 XL06-026 L04-425 L99-233 228 XL06-027 HoCP89-846 LCP87-492 89 XL06-028 HoCP92-624 LCP87-492 182 XL06-029 L01-315 LCP87-492 40 XL06-030 LCP87-492 LCP87-492 0 XL06-031 HoCP92-624 L99-233 425 XL06-032 L05-451 L99-233 510 XL06-033 L05-460 L99-233 0 XL06-034 L97-128 L99-233 0 XL06-035 L01-315 L05-445 262 XL06-036 HoCP92-624 L05-445 313 XL06-037 HoCP04-803 L05-445 18 XL06-038 HoCP04-843 L05-445 37 XL06-039 L05-445 L05-445 451 XL06-040 Ho95-988 L99-233 239 XL06-041 HoCP92-624 L99-233 150 XL06-042 L97-128 L99-233 292 XL06-043 LCP86-454 L99-233 262 XL06-044 HoCP04-843 L99-233 815 XL06-045 HoCP00-950 HoCP96-540 0 XL06-046 L97-128 HoCP96-540 569 XL06-047 HoCP96-540 HoCP96-540 597 XL06-048 L97-128 HoCP96-522 118 XL06-049 L05-445 HoCP96-522 486 XL06-050 L05-460 HoCP96-522 376
Cross Female Male Seed XL06-051 HoCP96-522 HoCP96-522 55 XL06-052 L97-128 HoCP04-803 49 XL06-053 L05-460 HoCP04-803 20 XL06-054 HoCP04-829 HoCP04-803 46 XL06-055 LCP87-492 HoCP04-803 0 XL06-056 HoCP04-803 HoCP04-803 0 XL06-057 HoCP04-843 L05-451 49 XL06-058 LCP87-492 L05-451 0 XL06-059 L05-451 L05-451 464 XL06-060 HoCP03-704 L01-299 17 XL06-061 HoCP92-624 L01-299 718 XL06-062 L94-428 L01-299 660 XL06-063 HoCP04-824 L01-299 30 XL06-064 L01-315 L01-299 286 XL06-065 L97-128 L01-299 469 XL06-066 L01--299 L01-299 59 XL06-067 L05-451 HoCP96-522 584 XL06-068 L97-128 HoCP96-522 6 XL06-069 LCP87-492 HoCP96-522 0 XL06-070 HoCP96-522 HoCP96-522 149 XL06-071 HoCP92-624 HoCP96-540 1622 XL06-072 LCP81-010 HoCP96-540 1835 XL06-073 HoCP04-824 HoCP96-540 1223 XL06-074 HoCP96-540 HoCP96-540 5198 XL06-075 HoCP92-624 L05-448 1648 XL06-076 L94-428 L05-448 3246 XL06-077 HoCP04-829 L05-448 423 XL06-078 L05-448 L05-448 237 XL06-079 HoCP92-624 HoCP96-561 842 XL06-080 LCP81-010 HoCP96-561 1975 XL06-081 HoCP04-810 HoCP96-561 377 XL06-082 HoCP96-561 HoCP96-561 149 XL06-083 HoCP03-704 HoCP04-803 0 XL06-084 L97-128 HoCP04-810 87 XL06-085 HoCP95-951 HoCP04-810 794 XL06-086 HoCP96-522 HoCP04-810 197 XL06-087 HoCP04-810 HoCP04-810 72 XL06-088 HoCP03-704 L99-226 15 XL06-089 HoCP99-825 L99-226 61 XL06-090 LCP81-010 L99-226 1305 XL06-091 L01-299 L99-226 261 XL06-092 L99-226 L99-226 333 XL06-093 L05-451 L05-448 1726 XL06-094 HoCP03-704 L05-448 0 XL06-095 L01-299 L05-448 321 XL06-096 L01-299 HoCP02-610 571 XL06-097 HoCP02-610 HoCP02-610 2065 XL06-098 LCP85-384 HoCP00-950 0 XL06-099 Ho95-988 HoCP04-824 50 XL06-100 HoCP92-624 HoCP04-824 280
19
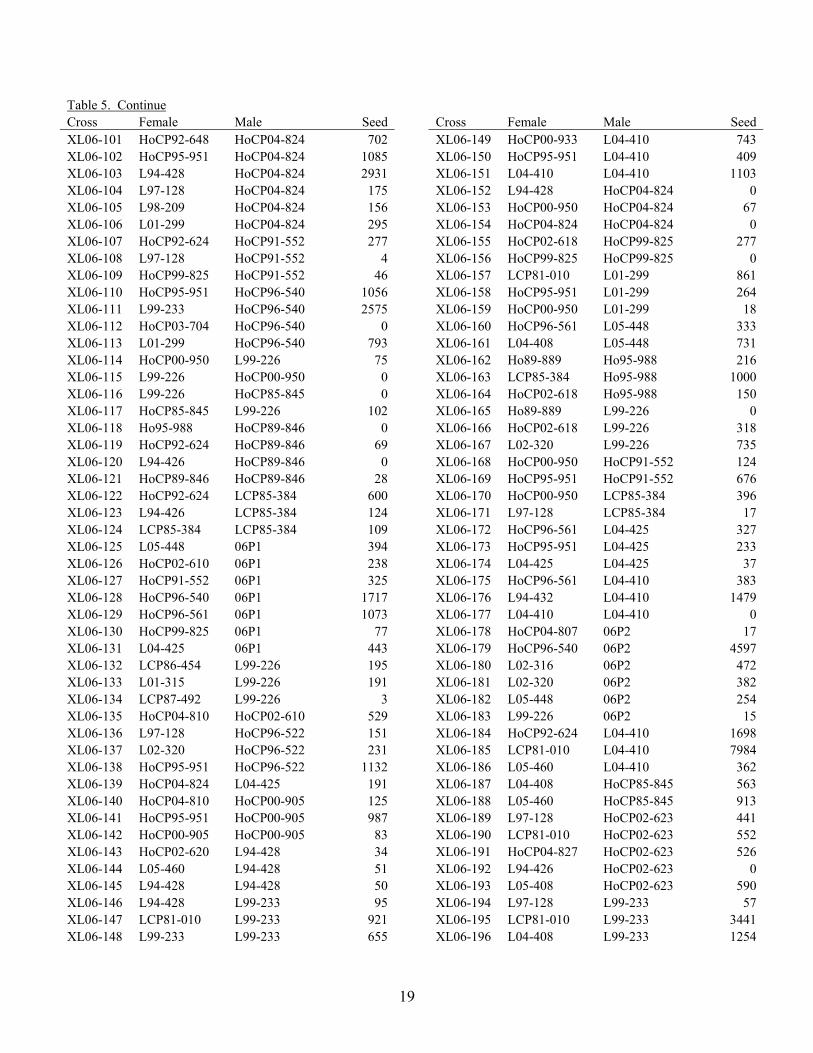
Table 5. Continue Cross Female Male Seed XL06-101 HoCP92-648 HoCP04-824 702 XL06-102 HoCP95-951 HoCP04-824 1085 XL06-103 L94-428 HoCP04-824 2931 XL06-104 L97-128 HoCP04-824 175 XL06-105 L98-209 HoCP04-824 156 XL06-106 L01-299 HoCP04-824 295 XL06-107 HoCP92-624 HoCP91-552 277 XL06-108 L97-128 HoCP91-552 4 XL06-109 HoCP99-825 HoCP91-552 46 XL06-110 HoCP95-951 HoCP96-540 1056 XL06-111 L99-233 HoCP96-540 2575 XL06-112 HoCP03-704 HoCP96-540 0 XL06-113 L01-299 HoCP96-540 793 XL06-114 HoCP00-950 L99-226 75 XL06-115 L99-226 HoCP00-950 0 XL06-116 L99-226 HoCP85-845 0 XL06-117 HoCP85-845 L99-226 102 XL06-118 Ho95-988 HoCP89-846 0 XL06-119 HoCP92-624 HoCP89-846 69 XL06-120 L94-426 HoCP89-846 0 XL06-121 HoCP89-846 HoCP89-846 28 XL06-122 HoCP92-624 LCP85-384 600 XL06-123 L94-426 LCP85-384 124 XL06-124 LCP85-384 LCP85-384 109 XL06-125 L05-448 06P1 394 XL06-126 HoCP02-610 06P1 238 XL06-127 HoCP91-552 06P1 325 XL06-128 HoCP96-540 06P1 1717 XL06-129 HoCP96-561 06P1 1073 XL06-130 HoCP99-825 06P1 77 XL06-131 L04-425 06P1 443 XL06-132 LCP86-454 L99-226 195 XL06-133 L01-315 L99-226 191 XL06-134 LCP87-492 L99-226 3 XL06-135 HoCP04-810 HoCP02-610 529 XL06-136 L97-128 HoCP96-522 151 XL06-137 L02-320 HoCP96-522 231 XL06-138 HoCP95-951 HoCP96-522 1132 XL06-139 HoCP04-824 L04-425 191 XL06-140 HoCP04-810 HoCP00-905 125 XL06-141 HoCP95-951 HoCP00-905 987 XL06-142 HoCP00-905 HoCP00-905 83 XL06-143 HoCP02-620 L94-428 34 XL06-144 L05-460 L94-428 51 XL06-145 L94-428 L94-428 50 XL06-146 L94-428 L99-233 95 XL06-147 LCP81-010 L99-233 921 XL06-148 L99-233 L99-233 655
Cross Female Male Seed XL06-149 HoCP00-933 L04-410 743 XL06-150 HoCP95-951 L04-410 409 XL06-151 L04-410 L04-410 1103 XL06-152 L94-428 HoCP04-824 0 XL06-153 HoCP00-950 HoCP04-824 67 XL06-154 HoCP04-824 HoCP04-824 0 XL06-155 HoCP02-618 HoCP99-825 277 XL06-156 HoCP99-825 HoCP99-825 0 XL06-157 LCP81-010 L01-299 861 XL06-158 HoCP95-951 L01-299 264 XL06-159 HoCP00-950 L01-299 18 XL06-160 HoCP96-561 L05-448 333 XL06-161 L04-408 L05-448 731 XL06-162 Ho89-889 Ho95-988 216 XL06-163 LCP85-384 Ho95-988 1000 XL06-164 HoCP02-618 Ho95-988 150 XL06-165 Ho89-889 L99-226 0 XL06-166 HoCP02-618 L99-226 318 XL06-167 L02-320 L99-226 735 XL06-168 HoCP00-950 HoCP91-552 124 XL06-169 HoCP95-951 HoCP91-552 676 XL06-170 HoCP00-950 LCP85-384 396 XL06-171 L97-128 LCP85-384 17 XL06-172 HoCP96-561 L04-425 327 XL06-173 HoCP95-951 L04-425 233 XL06-174 L04-425 L04-425 37 XL06-175 HoCP96-561 L04-410 383 XL06-176 L94-432 L04-410 1479 XL06-177 L04-410 L04-410 0 XL06-178 HoCP04-807 06P2 17 XL06-179 HoCP96-540 06P2 4597 XL06-180 L02-316 06P2 472 XL06-181 L02-320 06P2 382 XL06-182 L05-448 06P2 254 XL06-183 L99-226 06P2 15 XL06-184 HoCP92-624 L04-410 1698 XL06-185 LCP81-010 L04-410 7984 XL06-186 L05-460 L04-410 362 XL06-187 L04-408 HoCP85-845 563 XL06-188 L05-460 HoCP85-845 913 XL06-189 L97-128 HoCP02-623 441 XL06-190 LCP81-010 HoCP02-623 552 XL06-191 HoCP04-827 HoCP02-623 526 XL06-192 L94-426 HoCP02-623 0 XL06-193 L05-408 HoCP02-623 590 XL06-194 L97-128 L99-233 57 XL06-195 LCP81-010 L99-233 3441 XL06-196 L04-408 L99-233 1254
20
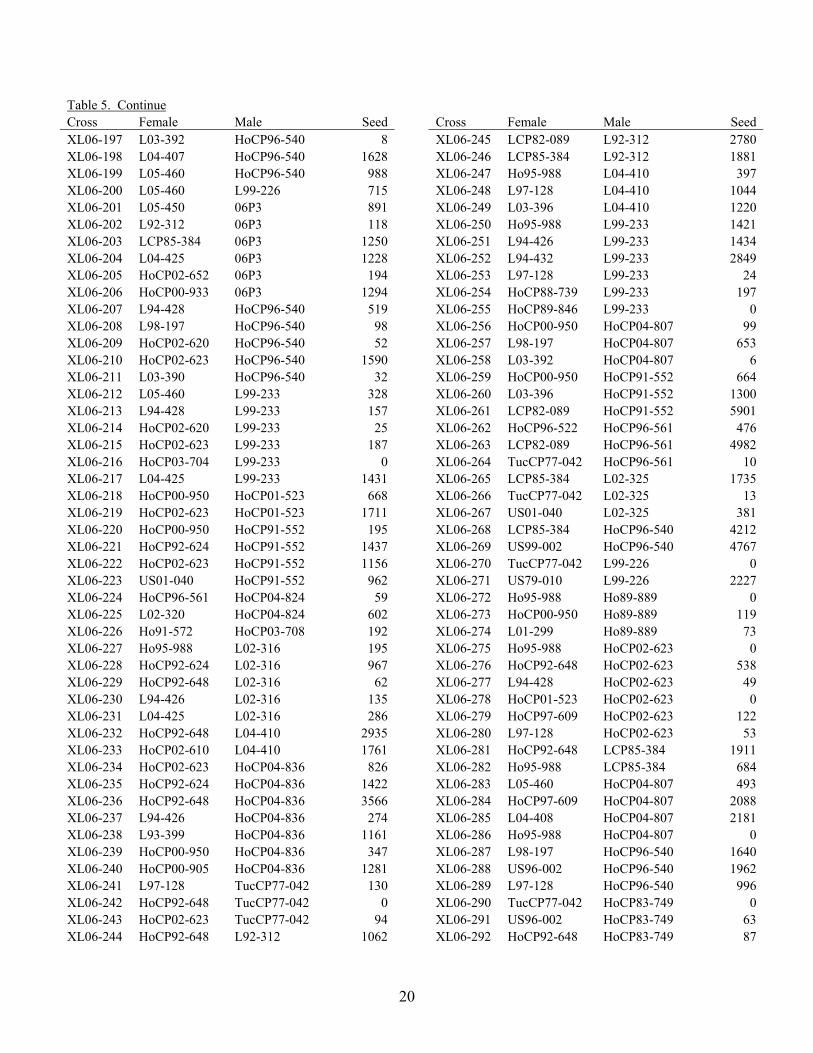
Table 5. Continue Cross Female Male Seed XL06-197 L03-392 HoCP96-540 8 XL06-198 L04-407 HoCP96-540 1628 XL06-199 L05-460 HoCP96-540 988 XL06-200 L05-460 L99-226 715 XL06-201 L05-450 06P3 891 XL06-202 L92-312 06P3 118 XL06-203 LCP85-384 06P3 1250 XL06-204 L04-425 06P3 1228 XL06-205 HoCP02-652 06P3 194 XL06-206 HoCP00-933 06P3 1294 XL06-207 L94-428 HoCP96-540 519 XL06-208 L98-197 HoCP96-540 98 XL06-209 HoCP02-620 HoCP96-540 52 XL06-210 HoCP02-623 HoCP96-540 1590 XL06-211 L03-390 HoCP96-540 32 XL06-212 L05-460 L99-233 328 XL06-213 L94-428 L99-233 157 XL06-214 HoCP02-620 L99-233 25 XL06-215 HoCP02-623 L99-233 187 XL06-216 HoCP03-704 L99-233 0 XL06-217 L04-425 L99-233 1431 XL06-218 HoCP00-950 HoCP01-523 668 XL06-219 HoCP02-623 HoCP01-523 1711 XL06-220 HoCP00-950 HoCP91-552 195 XL06-221 HoCP92-624 HoCP91-552 1437 XL06-222 HoCP02-623 HoCP91-552 1156 XL06-223 US01-040 HoCP91-552 962 XL06-224 HoCP96-561 HoCP04-824 59 XL06-225 L02-320 HoCP04-824 602 XL06-226 Ho91-572 HoCP03-708 192 XL06-227 Ho95-988 L02-316 195 XL06-228 HoCP92-624 L02-316 967 XL06-229 HoCP92-648 L02-316 62 XL06-230 L94-426 L02-316 135 XL06-231 L04-425 L02-316 286 XL06-232 HoCP92-648 L04-410 2935 XL06-233 HoCP02-610 L04-410 1761 XL06-234 HoCP02-623 HoCP04-836 826 XL06-235 HoCP92-624 HoCP04-836 1422 XL06-236 HoCP92-648 HoCP04-836 3566 XL06-237 L94-426 HoCP04-836 274 XL06-238 L93-399 HoCP04-836 1161 XL06-239 HoCP00-950 HoCP04-836 347 XL06-240 HoCP00-905 HoCP04-836 1281 XL06-241 L97-128 TucCP77-042 130 XL06-242 HoCP92-648 TucCP77-042 0 XL06-243 HoCP02-623 TucCP77-042 94 XL06-244 HoCP92-648 L92-312 1062
Cross Female Male Seed XL06-245 LCP82-089 L92-312 2780 XL06-246 LCP85-384 L92-312 1881 XL06-247 Ho95-988 L04-410 397 XL06-248 L97-128 L04-410 1044 XL06-249 L03-396 L04-410 1220 XL06-250 Ho95-988 L99-233 1421 XL06-251 L94-426 L99-233 1434 XL06-252 L94-432 L99-233 2849 XL06-253 L97-128 L99-233 24 XL06-254 HoCP88-739 L99-233 197 XL06-255 HoCP89-846 L99-233 0 XL06-256 HoCP00-950 HoCP04-807 99 XL06-257 L98-197 HoCP04-807 653 XL06-258 L03-392 HoCP04-807 6 XL06-259 HoCP00-950 HoCP91-552 664 XL06-260 L03-396 HoCP91-552 1300 XL06-261 LCP82-089 HoCP91-552 5901 XL06-262 HoCP96-522 HoCP96-561 476 XL06-263 LCP82-089 HoCP96-561 4982 XL06-264 TucCP77-042 HoCP96-561 10 XL06-265 LCP85-384 L02-325 1735 XL06-266 TucCP77-042 L02-325 13 XL06-267 US01-040 L02-325 381 XL06-268 LCP85-384 HoCP96-540 4212 XL06-269 US99-002 HoCP96-540 4767 XL06-270 TucCP77-042 L99-226 0 XL06-271 US79-010 L99-226 2227 XL06-272 Ho95-988 Ho89-889 0 XL06-273 HoCP00-950 Ho89-889 119 XL06-274 L01-299 Ho89-889 73 XL06-275 Ho95-988 HoCP02-623 0 XL06-276 HoCP92-648 HoCP02-623 538 XL06-277 L94-428 HoCP02-623 49 XL06-278 HoCP01-523 HoCP02-623 0 XL06-279 HoCP97-609 HoCP02-623 122 XL06-280 L97-128 HoCP02-623 53 XL06-281 HoCP92-648 LCP85-384 1911 XL06-282 Ho95-988 LCP85-384 684 XL06-283 L05-460 HoCP04-807 493 XL06-284 HoCP97-609 HoCP04-807 2088 XL06-285 L04-408 HoCP04-807 2181 XL06-286 Ho95-988 HoCP04-807 0 XL06-287 L98-197 HoCP96-540 1640 XL06-288 US96-002 HoCP96-540 1962 XL06-289 L97-128 HoCP96-540 996 XL06-290 TucCP77-042 HoCP83-749 0 XL06-291 US96-002 HoCP83-749 63 XL06-292 HoCP92-648 HoCP83-749 87
21
Table 5. Continue Cross Female Male Seed XL06-293 L93-399 HoCP91-552 161 XL06-294 L01-299 HoCP91-552 212 XL06-295 US93-015 HoCP91-552 1314 XL06-296 CP83-644 LCP81-010 388 XL06-297 HoCP89-846 LCP81-010 449 XL06-298 HoCP00-950 LCP81-010 94 XL06-299 L97-128 LCP81-010 170 XL06-300 L98-207 LCP81-010 844 XL06-301 HoCP92-624 HoCP00-930 188 XL06-302 HoCP00-950 HoCP00-930 1297 XL06-303 HoCP02-623 HoCP00-930 134 XL06-304 L98-197 HoCP00-930 1285 XL06-305 L94-433 HoCP00-930 532 XL06-306 HoCP92-624 LCP85-384 913 XL06-307 HoCP92-648 LCP85-384 2165 XL06-308 L03-396 LCP85-384 979 XL06-309 L05-445 LCP85-384 832 XL06-310 US99-002 LCP85-384 3034 XL06-311 HoCP92-648 L99-233 1490 XL06-312 HoCP01-523 L99-233 2626 XL06-313 L04-407 L99-233 1376 XL06-314 HoCP00-933 L92-312 1645 XL06-315 L97-128 L92-312 366 XL06-316 HoCP02-652 HoCP96-540 664 XL06-317 L94-433 HoCP96-540 1339 XL06-318 HoCP85-845 HoCP96-540 1281 XL06-319 L97-128 TucCP77-042 28 XL06-320 L01-315 TucCP77-042 33 XL06-321 L94-433 TucCP77-042 205 XL06-322 Ho95-988 LCP85-384 62 XL06-323 HoCP92-624 LCP85-384 481 XL06-324 TucCP77-042 LCP85-384 22 XL06-325 HoCP04-827 LCP85-384 44 XL06-326 HoCP99-815 LCP85-384 0 XL06-327 L03-396 LCP85-384 75 XL06-328 HoCP88-739 L99-233 0 XL06-329 HoCP00-930 L99-233 1865 XL06-330 HoCP01-561 L99-233 278 XL06-331 HoCP89-846 HoCP96-540 1114 XL06-332 HoCP92-624 HoCP96-540 1196 XL06-333 HoCP92-624 L04-408 292 XL06-334 LCP82-089 L04-408 1703 XL06-335 HoCP00-930 L04-408 2590 XL06-336 HoCP95-951 L01-283 50 XL06-337 HoCP99-815 L01-283 0 XL06-338 L03-396 L01-283 137 XL06-339 L97-128 L01-283 207 XL06-340 L03-396 L01-283 95
Cross Female Male Seed XL06-341 L97-128 L01-283 11 XL06-342 L97-128 LCP81-010 147 XL06-343 L98-207 LCP81-010 1084 XL06-344 CP83-644 HoCP04-836 1142 XL06-345 HoCP92-624 HoCP04-836 978 XL06-346 L97-128 HoCP04-836 121 XL06-347 HoCP89-846 Ho95-988 137 XL06-348 TucCP77-042 Ho95-988 0 XL06-349 HoCP02-620 Ho95-988 102 XL06-350 L03-392 Ho95-988 10 XL06-351 L97-128 Ho95-988 32 XL06-352 TucCP77-042 LCP85-384 61 XL06-353 HoCP01-827 LCP85-384 410 XL06-354 HoCP02-620 L99-226 149 XL06-355 HoCP03-708 L99-226 76 XL06-356 L03-396 L99-226 0 XL06-357 L94-433 L04-410 1255 XL06-358 HoCP96-540 06P4 2300 XL06-359 US99-004 06P4 3014 XL06-360 HoCP92-618 06P4 870 XL06-361 HoCP89-831 06P4 651 XL06-362 HoCP92-620 HoCP00-930 66 XL06-363 L94-433 HoCP00-930 136 XL06-364 HoCP04-827 Ho95-988 1110 XL06-365 L02-320 Ho95-988 937 XL06-366 US99-004 Ho95-988 748 XL06-367 L94-426 L04-410 0 XL06-368 L94-433 L04-410 1576 XL06-369 L99-226 L04-410 659 XL06-370 HoCP97-609 L01-283 239 XL06-371 L03-396 L01-283 148 XL06-372 US01-040 L01-283 303 XL06-373 L01-283 L01-283 115 XL06-374 HoCP96-540 06P5 2154 XL06-375 L05-451 06P6 278 XL06-376 L98-197 06P7 948 XL06-377 CP83-644 HoCP04-836 3052 XL06-378 HoCP04-853 HoCP04-836 139 XL06-379 HoCP89-831 HoCP04-836 450 XL06-380 HoCP92-648 HoCP89-846 192 XL06-381 L03-396 HoCP89-847 57 XL06-382 L91-281 HoCP89-848 312 XL06-383 L98-207 L94-428 575 XL06-384 TucCP77-042 L99-226 0 XL06-385 HoCP02-618 L99-226 1245 XL06-386 HoCP89-846 LCP82-089 1196 XL06-387 HoCP02-620 LCP82-089 1087 XL06-388 L98-197 LCP82-089 1337

22
Table 5. Continue Cross Female Male Seed XL06-389 HoCP93-749 HoCP02-618 433 XL06-390 HoCP96-540 HoCP02-618 3344 XL06-391 LCP81-010 L01-283 1151 XL06-392 HoCP00-950 L01-283 50 XL06-393 LCP87-492 L01-283 96 XL06-394 US99-004 LCP85-384 1665
Cross Female Male Seed XL06-395 CP83-644 HoCP89-846 305 XL06-396 Ho95-988 HoCP89-846 13 XL06-397 HoCP92-648 HoCP89-846 76 XL06-398 HoCP92-624 LCP85-384 452 XL06-399 HoCP00-950 LCP85-384 249 XL06-400 L94-426 HoCP04-836 36 XL06-401 L97-128 HoCP04-836 278 Total 279777

23
SELECTIONS, ADVANCEMENTS, AND ASSIGNMENTS OF THE LSU AGCENTER’S SUGARCANE VARIETY DEVELOPMENT PROGRAM FOR 2006
Keith Bischoff, Kenneth Gravois, Mike Duet, Terry Bacon, Gert Hawkins, and Todd Robert
Sugar Research Station SUMMARY
In the selection phase of the LSU AgCenter’s Sugarcane Variety Development Program, superior clones are advanced through the single stool, first line, second line, and increase stages of the breeding program. In the first stubble crop of the second-line trials, those clones with acceptable breeding or commercial value are assigned a permanent variety number. A total of 79,395 seedlings from 128 crosses were planted in the field in the spring of 2006. The majority of these seedlings are progeny of crosses among commercial and elite experimental varieties. In the fall of 2006, family selection was practiced on the 76,377 stubble seedlings surviving the winter. This selection resulted in the planting of 2,334 first-line trial plots. At the same time, superior clones were also selected and advanced through subsequent stages (248 to second line trials, 232 to the increase stage). Assignments of permanent “L06” numbers were given to the 40 best clones of the 2001 crossing series. PROCEDURES
In the selection stage of the LSU AgCenter’s Sugarcane Variety Development Program, single stools are established from seed generated in the crossing stage. After evaluating and selecting the families for cane yield potential in the cross appraisal studies, clones with desirable phenotypes are selected and advanced through single stool, first line, second line, and increase stages. In the first stubble crop of the second-line trials, clones judged to have breeding or commercial value are assigned a permanent variety number and advanced to the nursery stage of testing. RESULTS AND DISCUSSION
A total of 79,395 seedlings from 128 crosses of the 2005 crossing series were planted to the field in the spring of 2006 (Table 1). Many of these seedlings were progeny of crosses among commercial and superior experimental varieties. In the fall of 2006, individual selection was practiced on the 76,377 stubble single stools of the 2004 crossing series that survived the winter. The 2,334 clones selected and advanced from the single stools were planted in 8-foot first-line trial plots. Dates of planting and harvesting of all plots in the selection phase of the program can be found in Table 2.
The 1,548 first-line trial plots of the 2003 crossing series were rated for cane yield and pest resistance in August of 2006 (Table 3). After screening for cane yield rating, acceptable clones were further evaluated for pest resistance (diseases and borer injury) stalk quality, and Brix (Table 3). This second stage of advancement was concluded with the planting of 248 clones in single row 16-foot second line trials plots.
Stalk counts were made on the 601 plant-cane second line trial plots of the 2002 crossing
series in August 2006. Based on these counts and sucrose lab data collected in 2005, 232 clones were planted in two single row 16-foot plots representing the increase stage of the program

24
(Table 4). One replication was planted in light soil and the other in heavy soil. These clones will be candidates for assignment in 2007. Of the 287 candidates from the first stubble crop of the second line trial plots, the best 40 clones from the 2001 crossing series were assigned permanent “L06” numbers (Table 5). These newly assigned “L06” varieties were then planted in replicated nursery trials at three on station locations (Sugar Research Station, Iberia Research Station, USDA-ARS Ardoyne Farm).
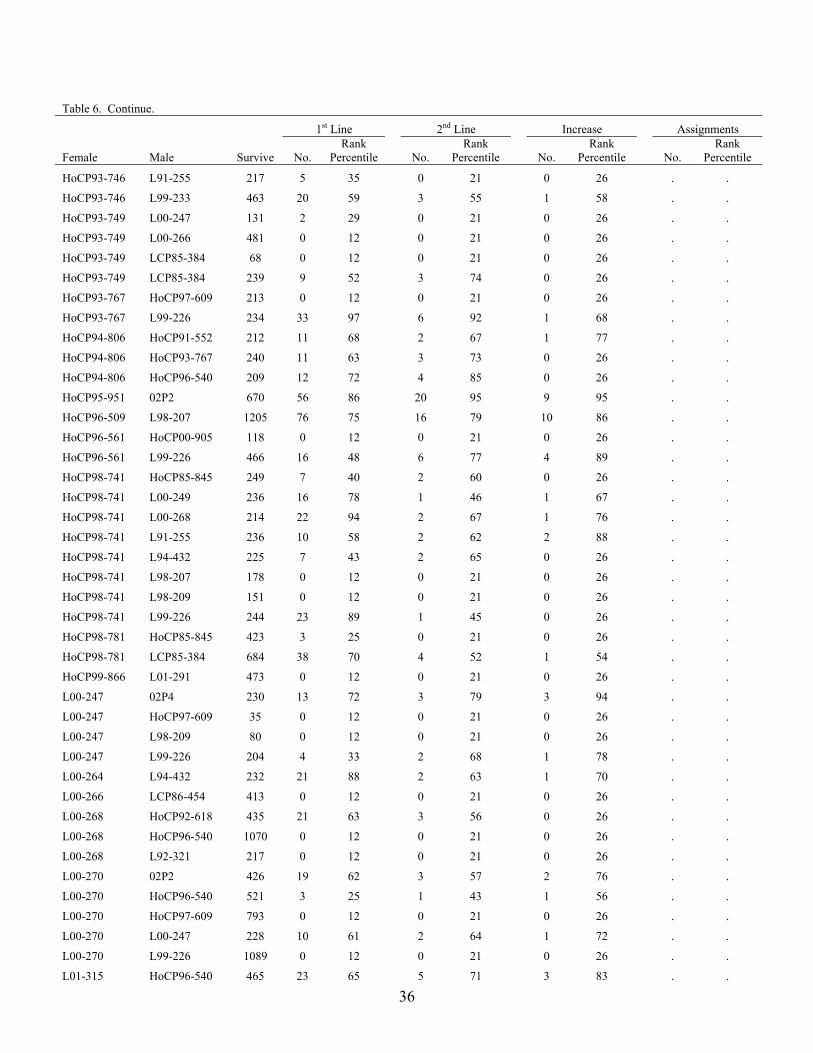
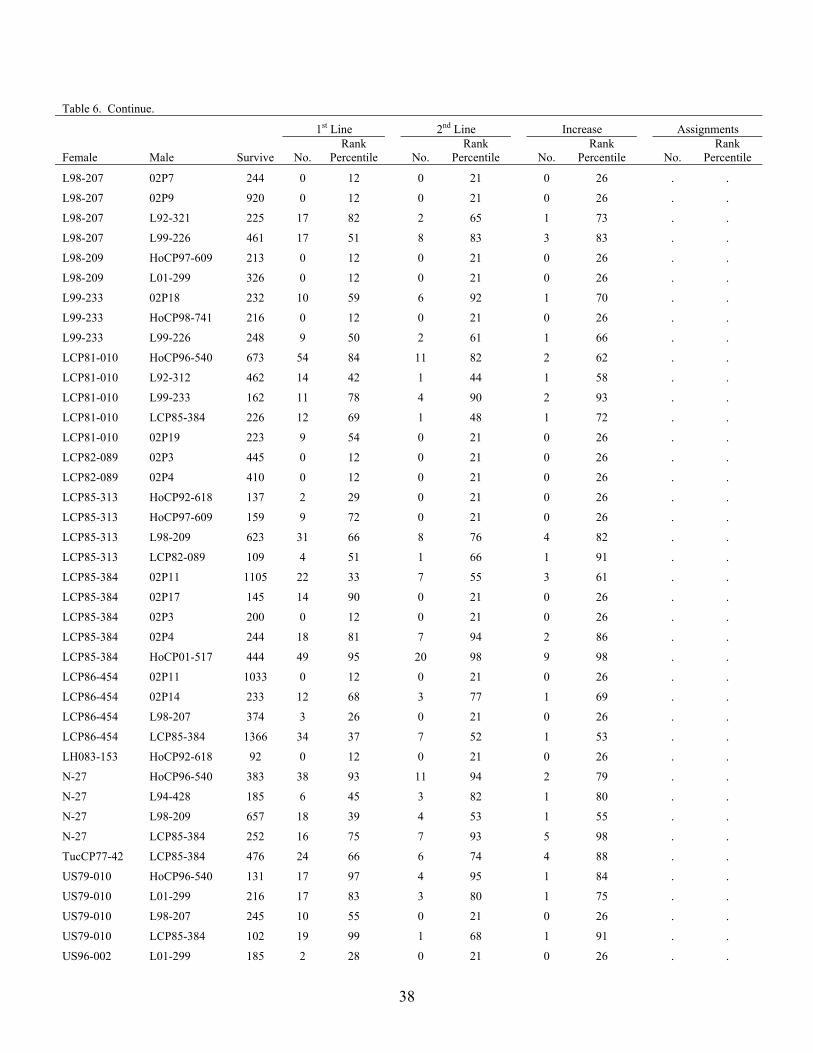
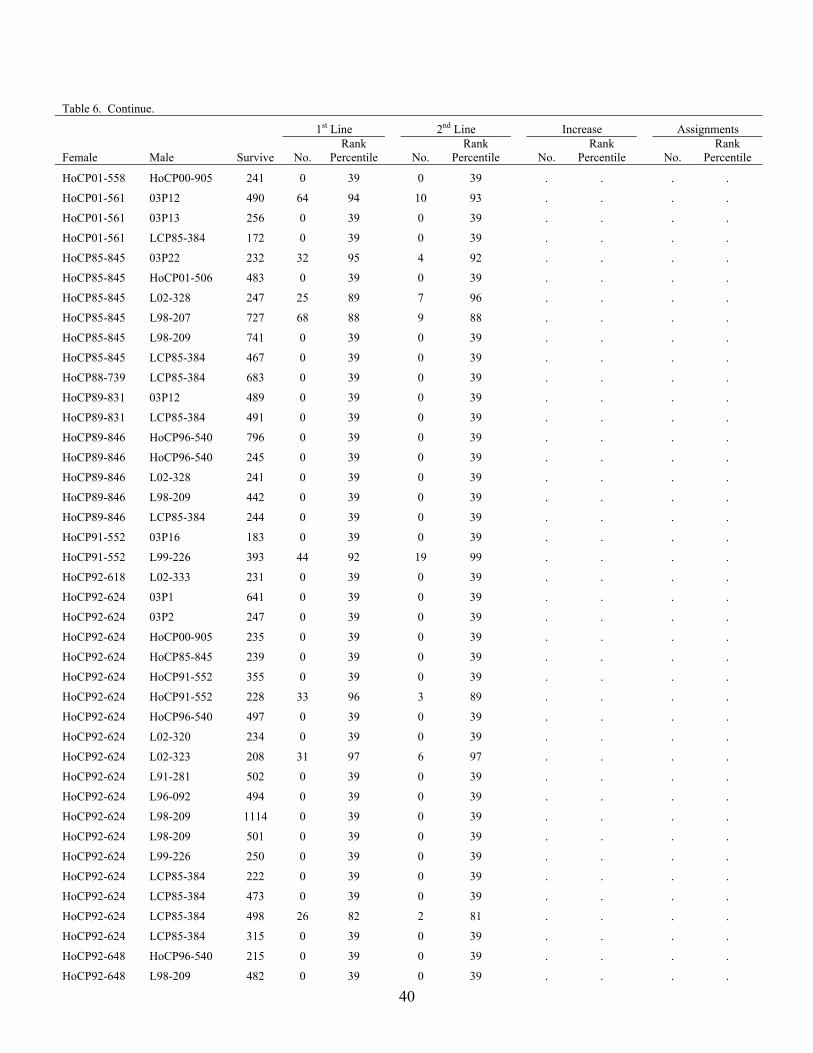
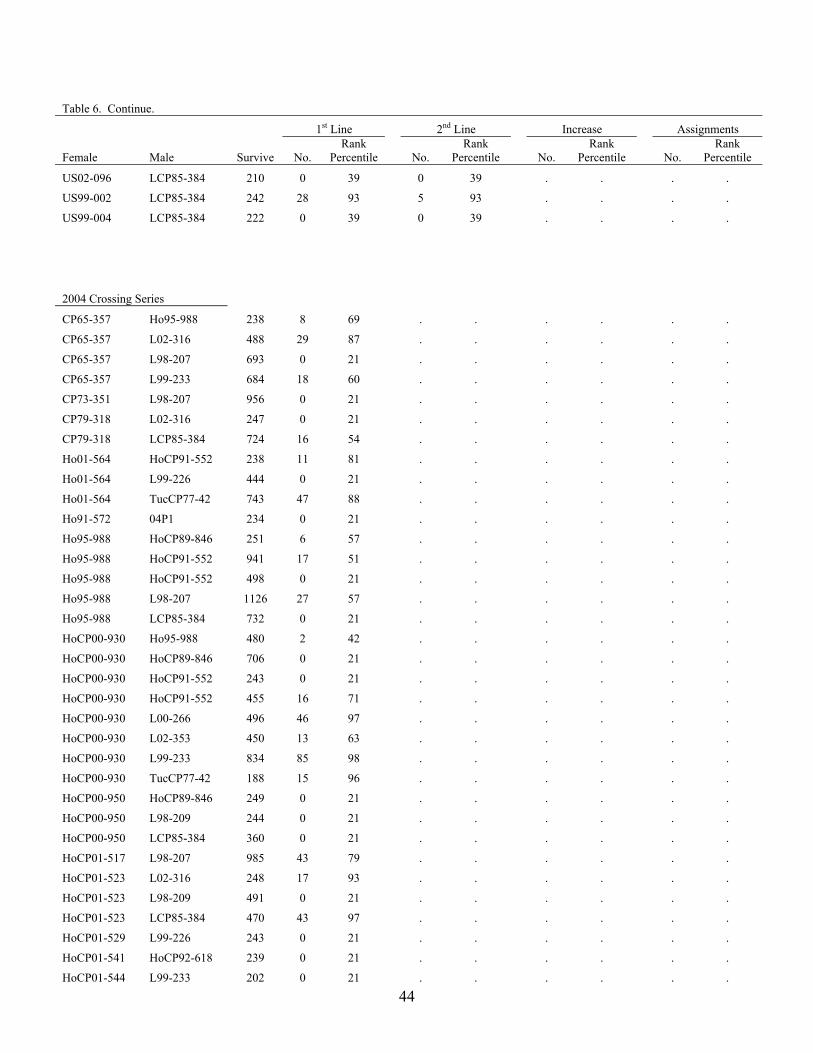
The advancement summary of clones from crosses made in 2001 through 2005 is shown in Table 6. Crosses are sorted by female parent in ascending order, with the percentile ranking given for each cross in each stage of the program. The results of the 2004 crossing series cross appraisal in 2006 are presented in Table 7. Table 1. Summary of selections, advancements and assignments made during 2006 by the
Louisiana, “L,” Sugarcane Variety Development Program’s personnel. Crosses Advanced to Crossing series
Progeny test
Selection program
Plants surviving
transplanting
Over-wintered
plants
1st line
2nd line
Increase On-station Nurseries (L06 Assignments)
------------------------ number of clones ------------------------------ X01 218 247 93019 46325 2902 773 287 40 X02 200 192 72061 50951 2742 601 232 X03 134 211 92598 70910 1548 248 X04 67 194 93490 76377 2334 X05 60 128 79395

25
Table 2. Dates of seedling and line trials planted or harvested in 2006. Crossing Series Test Crop Date Planted Date Harvested
X05 Seedlings Planted 4/17 – 4/21/06
X05 Progeny Test Planted 4/21/06
X04 Seedlings First Stubble 4/08 -4/18/05
X04 Progeny Test First Stubble 4/18/05 12/11/06
X04 First Line Trials Planted 9/08 – 9/22/06
X03 First Line Trials Plant-cane 9/30/05
X02 First Line Trials First Stubble 9/10/04 10/30/06
X03 Second Line Trials Planted 9/26/06
X02 Second Line Trials Plant-cane 10/10/05 11/27/06
X01 Second Line Trials First Stubble 9/22/04 10/08/06
X00 Second Line Trials Second Stubble 10/01/03 10/10/06
X02 Light Soil Increase Planted 10/03/06
X01 Light Soil Increase Plant-cane 10/19/05 10/15/06
X00 Light Soil Increase First Stubble 9/28/04 11/07/06
X99 Light Soil Increase Second Stubble 10/02/03 10/10/06
X02 Heavy Soil Increase Planted 10/03/06
X01 Heavy Soil Increase Plant-cane 10/19/05 11/01/06
X00 Heavy Soil Increase First Stubble 9/28/04 11/30/06
X99 Heavy Soil Increase Second Stubble 10/02/03 10/10/06

26
Table 3. Numbers of experimental clones dropped for identified faults in the 2003 crossing series first-line trials. Fault
Trait Frequency Percent ------------------------- 1548 clones enter first round of evaluation ------------------------------ Initial Selection (Rating) 931 60.1 ------------------------ 617 clones enter second round of evaluation ---------------------------- Lodged 27 1.7 Pith / Tube 86 5.6 Short 39 2.5 Diameter 3 0.2 Smut 9 0.6 Other 8 0.5
---------------------------------------- 1103 clones dropped ---------------------------------------- ----------------------------445 clones enter third round of evaluation ---------------------------
Brix 197 12.7 Clones advanced 248 16.1 Table 4. Number of experimental clones dropped for identified faults in the 2002 crossing series of the plant-cane second line trial prior to advancement to the increase stage. Fault Trait Frequency Percent
---------------------------- 601 clones enter first round of evaluation ----------------------------- Stalk count <75 per plot 230 38.3 Lodged 96 16.0 Pith / Tube 14 2.3 Diameter 2 0.3 Smut 18 3.0 Rust 2 0.3 Short 5 0.8 Other 2 0.3
------------------------------------------- 369 clones dropped --------------------------------------- Clones advanced to Increase stage 232 38.7
27
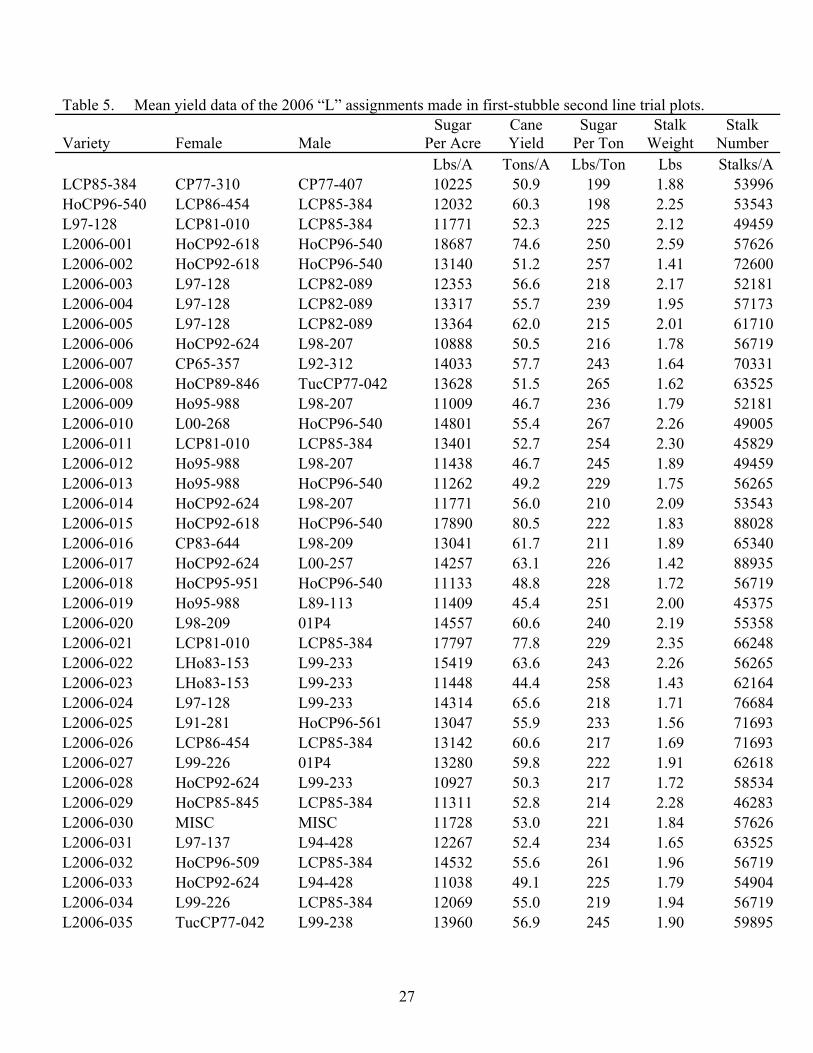
Table 5. Mean yield data of the 2006 “L” assignments made in first-stubble second line trial plots.
Variety Female Male Sugar
Per Acre Cane Yield
Sugar Per Ton
Stalk Weight
Stalk Number
Lbs/A Tons/A Lbs/Ton Lbs Stalks/ALCP85-384 CP77-310 CP77-407 10225 50.9 199 1.88 53996HoCP96-540 LCP86-454 LCP85-384 12032 60.3 198 2.25 53543L97-128 LCP81-010 LCP85-384 11771 52.3 225 2.12 49459L2006-001 HoCP92-618 HoCP96-540 18687 74.6 250 2.59 57626L2006-002 HoCP92-618 HoCP96-540 13140 51.2 257 1.41 72600L2006-003 L97-128 LCP82-089 12353 56.6 218 2.17 52181L2006-004 L97-128 LCP82-089 13317 55.7 239 1.95 57173L2006-005 L97-128 LCP82-089 13364 62.0 215 2.01 61710L2006-006 HoCP92-624 L98-207 10888 50.5 216 1.78 56719L2006-007 CP65-357 L92-312 14033 57.7 243 1.64 70331L2006-008 HoCP89-846 TucCP77-042 13628 51.5 265 1.62 63525L2006-009 Ho95-988 L98-207 11009 46.7 236 1.79 52181L2006-010 L00-268 HoCP96-540 14801 55.4 267 2.26 49005L2006-011 LCP81-010 LCP85-384 13401 52.7 254 2.30 45829L2006-012 Ho95-988 L98-207 11438 46.7 245 1.89 49459L2006-013 Ho95-988 HoCP96-540 11262 49.2 229 1.75 56265L2006-014 HoCP92-624 L98-207 11771 56.0 210 2.09 53543L2006-015 HoCP92-618 HoCP96-540 17890 80.5 222 1.83 88028L2006-016 CP83-644 L98-209 13041 61.7 211 1.89 65340L2006-017 HoCP92-624 L00-257 14257 63.1 226 1.42 88935L2006-018 HoCP95-951 HoCP96-540 11133 48.8 228 1.72 56719L2006-019 Ho95-988 L89-113 11409 45.4 251 2.00 45375L2006-020 L98-209 01P4 14557 60.6 240 2.19 55358L2006-021 LCP81-010 LCP85-384 17797 77.8 229 2.35 66248L2006-022 LHo83-153 L99-233 15419 63.6 243 2.26 56265L2006-023 LHo83-153 L99-233 11448 44.4 258 1.43 62164L2006-024 L97-128 L99-233 14314 65.6 218 1.71 76684L2006-025 L91-281 HoCP96-561 13047 55.9 233 1.56 71693L2006-026 LCP86-454 LCP85-384 13142 60.6 217 1.69 71693L2006-027 L99-226 01P4 13280 59.8 222 1.91 62618L2006-028 HoCP92-624 L99-233 10927 50.3 217 1.72 58534L2006-029 HoCP85-845 LCP85-384 11311 52.8 214 2.28 46283L2006-030 MISC MISC 11728 53.0 221 1.84 57626L2006-031 L97-137 L94-428 12267 52.4 234 1.65 63525L2006-032 HoCP96-509 LCP85-384 14532 55.6 261 1.96 56719L2006-033 HoCP92-624 L94-428 11038 49.1 225 1.79 54904L2006-034 L99-226 LCP85-384 12069 55.0 219 1.94 56719L2006-035 TucCP77-042 L99-238 13960 56.9 245 1.90 59895

28
Table 5. Continue.
Variety Female Male Sugar
Per Acre Cane Yield
Sugar Per Ton
Stalk Weight
Stalk Number
Lbs/A Tons/A Lbs/Ton Lbs Stalks/AL2006-036 LCP85-313 HoCP96-509 13159 55.9 235 2.44 45829L2006-037 LCP86-454 L99-233 10867 53.6 203 1.75 61256L2006-038 HoCP92-624 L99-233 16881 74.6 226 2.63 56719L2006-039 L99-226 LCP85-384 12450 47.6 261 1.81 52635L2006-040 LCP81-010 LCP85-384 12175 48.4 252 1.87 51728

29
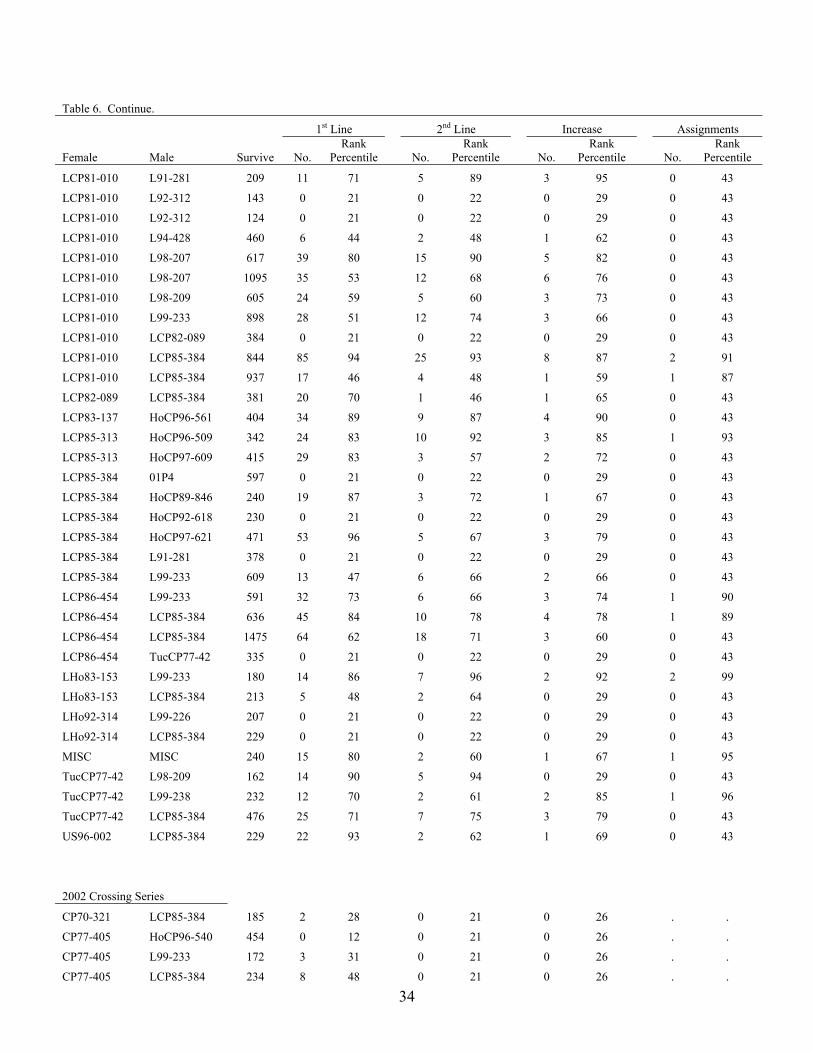
Table 6. Advancement summary of crosses in the 2001 through 2004 crossing series. 1st Line 2nd Line Increase Assignment
Female Male Survive No. Rank
Percentile
No. Rank
Percentile
No. Rank
Percentile
No. Rank
Percentile
2001 Crossing Series
CP65-357 L92-312 240 10 61 3 72 2 84 1 95
CP77-405 L98-207 187 0 21 0 22 0 29 0 43
CP77-405 LCP85-384 394 0 21 0 22 0 29 0 43
CP78-317 HoCP91-552 191 0 21 0 22 0 29 0 43
CP79-318 L98-209 229 0 21 0 22 0 29 0 43
CP79-318 L98-209 225 0 21 0 22 0 29 0 43
CP83-644 HoCP96-540 430 15 57 9 86 3 80 0 43
CP83-644 HoCP96-561 210 7 54 1 51 0 29 0 43
CP83-644 HoCP97-621 218 0 21 0 22 0 29 0 43
CP83-644 HoCP98-778 212 0 21 0 22 0 29 0 43
CP83-644 L98-209 402 24 77 8 85 1 64 1 93
CP83-644 L99-226 398 0 21 0 22 0 29 0 43
CP83-644 L99-238 175 0 21 0 22 0 29 0 43
CP89-846 HoCP97-621 229 0 21 0 22 0 29 0 43
CP89-846 L98-209 385 0 21 0 22 0 29 0 43
Ho89-889 HoCP85-845 219 11 68 1 50 0 29 0 43
Ho89-889 HoCP96-561 69 0 21 0 22 0 29 0 43
Ho89-889 L99-233 235 0 21 0 22 0 29 0 43
Ho95-988 HoCP96-540 930 45 64 11 70 5 76 1 88
Ho95-988 HoCP96-561 237 12 69 3 73 1 68 0 43
Ho95-988 HoCP97-609 419 17 60 7 79 2 72 0 43
Ho95-988 L89-113 452 19 61 7 77 2 69 1 90
Ho95-988 L98-207 625 65 95 28 98 10 96 2 94
Ho95-988 L99-226 464 0 21 0 22 0 29 0 43
Ho95-988 L99-238 197 11 74 3 76 1 74 0 43
Ho95-988 LCP85-384 432 49 96 20 98 8 98 0 43
Ho95-988 TucCP77-42 424 9 47 4 64 2 71 0 43
HoCP85-845 Ho95-988 197 10 69 4 85 0 29 0 43
HoCP85-845 HoCP96-540 955 31 53 6 55 1 58 0 43
HoCP85-845 HoCP97-609 228 12 71 4 81 0 29 0 43
HoCP85-845 L96-092 215 0 21 0 22 0 29 0 43
HoCP85-845 L98-207 1325 41 51 16 70 8 78 0 43
HoCP85-845 L99-233 208 11 71 2 65 2 89 0 43
HoCP85-845 LCP85-384 656 39 76 6 63 4 78 1 89
HoCP88-739 LCP85-384 208 15 85 8 95 2 89 0 43
HoCP89-846 HoCP98-741 167 17 95 1 55 1 77 0 43
HoCP89-846 LCP85-384 203 2 44 1 52 0 29 0 43
HoCP89-846 LCP85-384 178 4 48 0 22 0 29 0 43
HoCP90-941 L97-137 226 7 51 4 81 1 69 0 43
HoCP90-941 LCP85-384 223 0 21 0 22 0 29 0 43

30
Table 6. Continue.
1st Line 2nd Line Increase Assignment
Female Male Survive No. Rank
Percentile
No. Rank
Percentile
No. Rank
Percentile
No. Rank
Percentile
HoCP91-552 01P1 456 15 54 1 46 0 29 0 43
HoCP91-552 HoCP96-540 543 12 48 4 58 0 29 0 43
HoCP91-552 HoCP97-609 90 0 21 0 22 0 29 0 43
HoCP91-555 HoCP00-955 200 0 21 0 22 0 29 0 43
HoCP91-555 HoCP96-509 210 10 64 0 22 0 29 0 43
HoCP91-555 HoCP96-540 198 0 21 0 22 0 29 0 43
HoCP91-555 HoCP96-540 723 22 50 4 54 2 65 0 43
HoCP91-555 HoCP98-776 149 9 77 1 56 0 29 0 43
HoCP91-555 L99-226 429 38 91 6 74 1 63 0 43
HoCP91-555 LCP85-384 203 0 21 0 22 0 29 0 43
HoCP91-555 LCP86-454 195 0 21 0 22 0 29 0 43
HoCP92-618 HoCP96-540 709 32 63 13 82 6 84 3 95
HoCP92-618 LCP85-384 429 0 21 0 22 0 29 0 43
HoCP92-618 TucCP77-42 430 0 21 0 22 0 29 0 43
HoCP92-624 HoCP00-961 232 19 88 2 61 0 29 0 43
HoCP92-624 HoCP91-552 219 0 21 2 63 0 29 0 43
HoCP92-624 HoCP96-540 242 12 68 2 60 1 67 0 43
HoCP92-624 HoCP96-561 373 24 80 3 58 2 75 0 43
HoCP92-624 L00-257 442 21 64 7 78 4 86 1 91
HoCP92-624 L89-113 231 14 78 5 87 3 94 0 43
HoCP92-624 L94-426 181 0 21 0 22 0 29 0 43
HoCP92-624 L94-428 218 4 46 2 64 1 71 1 97
HoCP92-624 L98-207 560 18 53 9 78 3 75 2 94
HoCP92-624 L98-209 468 35 86 1 45 1 61 0 43
HoCP92-624 L99-226 232 0 21 0 22 0 29 0 43
HoCP92-624 L99-233 401 37 92 13 95 9 99 2 98
HoCP92-624 LCP85-384 144 12 88 3 86 2 94 0 43
HoCP92-648 HoCP96-540 369 18 66 7 83 3 83 0 43
HoCP92-648 HoCP96-561 210 12 75 1 51 0 29 0 43
HoCP92-648 HoCP97-609 222 0 21 0 22 0 29 0 43
HoCP92-648 HoCP97-621 196 0 21 0 22 0 29 0 43
HoCP92-648 L99-226 345 0 21 0 22 0 29 0 43
HoCP92-648 L99-226 175 6 56 0 22 0 29 0 43
HoCP92-648 L99-234 238 0 21 0 22 0 29 0 43
HoCP92-648 LCP85-384 455 60 98 13 92 7 96 0 43
HoCP92-648 LCP85-384 198 20 94 8 97 3 95 0 43
HoCP94-806 HoCP97-621 72 0 21 0 22 0 29 0 43
HoCP94-806 L99-226 245 0 21 0 22 0 29 0 43
HoCP94-806 L99-233 236 14 76 4 80 1 68 0 43
HoCP95-951 CP79-348 420 54 98 18 97 4 87 0 43
HoCP95-951 HoCP96-540 422 22 70 10 88 3 81 0 43

31
Table 6. Continue.
1st Line 2nd Line Increase Assignments
Female Male Survive No. Rank
Percentile
No. Rank
Percentile
No. Rank
Percentile
No. Rank
Percentile
HoCP95-951 HoCP96-540 232 10 62 6 91 4 97 1 96
HoCP95-951 L97-137 465 33 84 8 80 1 61 0 43
HoCP95-951 LCP82-089 450 28 79 7 77 5 92 0 43
HoCP96-509 HoCP96-561 368 25 82 3 59 0 29 0 43
HoCP96-509 L92-312 243 0 21 0 22 0 29 0 43
HoCP96-509 L99-226 226 0 21 0 22 0 29 0 43
HoCP96-509 LCP85-384 184 17 92 6 95 3 97 1 98
HoCP96-522 HoCP89-846 225 12 71 3 73 2 85 0 43
HoCP96-522 HoCP96-561 184 6 54 2 67 0 29 0 43
HoCP96-522 L91-255 207 11 71 1 51 0 29 0 43
HoCP96-522 L98-209 410 20 66 3 57 1 63 0 43
HoCP96-522 LCP85-384 203 7 56 1 52 0 29 0 43
HoCP96-540 HoCP89-846 623 0 21 0 22 0 29 0 43
HoCP96-540 HoCP96-561 237 0 21 0 22 0 29 0 43
HoCP96-540 L89-113 190 0 21 0 22 0 29 0 43
HoCP96-540 L91-255 371 0 21 0 22 0 29 0 43
HoCP96-540 L99-226 449 0 21 0 22 0 29 0 43
HoCP96-540 LCP85-384 392 0 21 0 22 0 29 0 43
HoCP96-561 HoCP85-845 452 14 51 5 68 0 29 0 43
HoCP97-606 L96-092 237 7 50 3 73 0 29 0 43
HoCP97-609 Ho91-572 207 0 21 0 22 0 29 0 43
HoCP97-609 HoCP97-621 167 0 21 0 22 0 29 0 43
HoCP97-609 HoCP98-741 231 0 21 0 22 0 29 0 43
HoCP97-609 L89-113 250 0 21 0 22 0 29 0 43
HoCP97-609 L99-226 417 0 21 0 22 0 29 0 43
HoCP97-609 L99-233 142 4 49 2 75 0 29 0 43
HoCP97-609 LCP82-089 448 31 82 8 82 1 63 0 43
HoCP97-621 L98-207 452 0 21 0 22 0 29 0 43
HoCP98-741 HoCP92-618 236 0 21 0 22 0 29 0 43
HoCP98-741 L94-432 239 0 21 0 22 0 29 0 43
HoCP98-741 LCP85-384 413 43 95 8 84 3 82 0 43
HoCP98-776 CP79-348 210 2 44 0 22 0 29 0 43
HoCP98-776 HoCP96-540 177 0 21 0 22 0 29 0 43
HoCP98-776 L91-255 203 9 62 6 93 2 90 0 43
HoCP98-776 L99-226 236 0 21 0 22 0 29 0 43
HoCP98-776 L99-233 218 6 49 1 50 0 29 0 43
HoCP98-778 CP79-318 219 0 21 0 22 0 29 0 43
HoCP98-778 HoCP97-621 93 0 21 0 22 0 29 0 43
HoCP98-781 HoCP96-540 442 38 90 5 69 0 29 0 43
HoCP99-825 L91-281 217 0 21 0 22 0 29 0 43
HoCP99-833 L98-209 180 13 85 2 68 0 29 0 43

32
Table 6. Continue.
1st Line 2nd Line Increase Assignments
Female Male Survive No. Rank
Percentile
No. Rank
Percentile
No. Rank
Percentile
No. Rank
Percentile
L00-249 L94-432 236 0 21 0 22 0 29 0 43
L00-254 HoCP97-609 430 0 21 0 22 0 29 0 43
L00-254 L98-209 244 0 21 0 22 0 29 0 43
L00-254 LCP85-384 416 0 21 0 22 0 29 0 43
L00-260 HoCP97-621 232 0 21 0 22 0 29 0 43
L00-260 L99-233 400 0 21 0 22 0 29 0 43
L00-264 L94-432 145 0 21 0 22 0 29 0 43
L00-264 LCP85-384 226 7 51 2 62 0 29 0 43
L00-264 LCP85-384 202 7 57 0 22 0 29 0 43
L00-268 HoCP96-540 971 63 81 25 91 11 92 1 87
L00-271 HoCP96-540 194 11 75 1 53 1 75 0 43
L00-273 LCP82-089 198 0 21 0 22 0 29 0 43
L91-255 HoCP96-509 141 0 21 0 22 0 29 0 43
L91-255 L98-207 427 0 21 0 22 0 29 0 43
L91-255 LCP85-384 386 18 63 1 46 0 29 0 43
L91-281 HoCP96-540 240 21 90 3 72 2 84 0 43
L91-281 HoCP96-561 442 53 97 12 92 4 86 1 91
L91-281 L97-137 246 12 66 4 79 3 93 0 43
L91-281 L99-234 218 12 73 5 88 1 71 0 43
L91-281 LCP85-384 226 0 21 0 22 0 29 0 43
L93-386 HoCP96-540 363 0 21 0 22 0 29 0 43
L93-391 L98-209 215 0 21 0 22 0 29 0 43
L93-391 L99-226 206 0 21 0 22 0 29 0 43
L93-391 LCP85-384 97 0 21 0 22 0 29 0 43
L93-399 HoCP85-845 176 0 21 0 22 0 29 0 43
L93-399 HoCP85-845 326 12 58 0 22 0 29 0 43
L93-399 LCP85-384 171 0 21 0 22 0 29 0 43
L94-426 HoCP97-621 174 0 21 0 22 0 29 0 43
L94-426 L99-233 185 7 58 1 53 0 29 0 43
L94-426 LCP85-384 224 11 66 1 49 1 70 0 43
L94-426 LCP85-384 184 22 97 9 99 2 91 0 43
L94-426 LHo92-314 234 0 21 0 22 0 29 0 43
L94-428 HoCP96-540 354 32 91 11 94 6 97 0 43
L94-428 MISC 178 8 63 2 69 0 29 0 43
L94-432 HoCP96-540 209 36 99 4 83 2 88 0 43
L94-432 L89-113 208 0 21 0 22 0 29 0 43
L94-432 L91-281 195 0 21 0 22 0 29 0 43
L94-432 L98-207 337 0 21 0 22 0 29 0 43
L94-432 LCP85-384 194 0 21 0 22 0 29 0 43
L94-432 TucCP77-42 383 13 56 3 58 0 29 0 43
L96-040 HoCP92-618 228 22 93 9 96 0 29 0 43

33
Table 6. Continue.
1st Line 2nd Line Increase Assignments
Female Male Survive No. Rank
Percentile
No. Rank
Percentile
No. Rank
Percentile
No. Rank
Percentile
L96-040 HoCP96-540 227 13 75 1 49 0 29 0 43
L96-040 L99-233 211 0 21 0 22 0 29 0 43
L96-040 L99-233 393 26 81 6 76 1 64 0 43
L97-128 HoCP85-845 224 14 80 2 63 0 29 0 43
L97-128 L91-281 174 15 90 1 54 1 77 0 43
L97-128 L99-233 228 25 96 12 99 5 99 1 97
L97-128 LCP82-089 416 29 83 10 89 6 95 3 99
L97-128 LHo92-314 205 0 21 0 22 0 29 0 43
L97-128 TucCP77-42 191 32 99 8 97 4 98 0 43
L97-137 HoCP94-806 219 13 76 4 82 2 87 0 43
L97-137 L94-428 406 20 66 7 80 5 93 1 92
L98-197 HoCP00-961 227 0 21 0 22 0 29 0 43
L98-207 01P5 473 2 43 0 22 0 29 0 43
L98-207 CP79-318 388 0 21 0 22 0 29 0 43
L98-207 HoCP85-845 736 45 78 18 90 5 80 0 43
L98-209 01P4 416 38 92 4 65 3 82 1 92
L98-209 HoCP97-621 474 17 58 3 55 1 60 0 43
L98-209 HoCP98-741 205 0 21 0 22 0 29 0 43
L98-209 L92-312 182 0 21 0 22 0 29 0 43
L98-209 LHo92-314 457 18 59 3 56 0 29 0 43
L98-209 TucCP77-42 427 24 74 9 87 3 80 0 43
L99-214 HoCP97-621 235 0 21 0 22 0 29 0 43
L99-214 L99-233 207 17 88 4 84 2 89 0 43
L99-221 HoCP96-540 433 0 21 0 22 0 29 0 43
L99-226 01P4 676 12 46 2 47 1 59 1 88
L99-226 HoCP92-618 436 0 21 0 22 0 29 0 43
L99-226 HoCP96-540 757 0 21 0 22 0 29 0 43
L99-226 L89-113 204 0 21 0 22 0 29 0 43
L99-226 L99-233 754 5 43 3 48 2 65 0 43
L99-226 LCP82-089 464 19 60 4 61 1 62 0 43
L99-226 LCP85-384 843 42 68 10 70 6 81 2 91
L99-226 TucCP77-42 621 11 46 2 47 1 60 0 43
L99-231 HoCP85-845 195 3 45 1 53 1 74 0 43
L99-231 HoCP97-621 194 0 21 0 22 0 29 0 43
L99-231 L92-312 147 0 21 0 22 0 29 0 43
L99-233 HoCP97-621 173 0 21 0 22 0 29 0 43
L99-233 L94-428 205 16 86 5 90 2 90 0 43
L99-234 HoCP96-540 216 0 21 0 22 0 29 0 43
L99-234 L98-207 365 0 21 0 22 0 29 0 43
L99-238 L94-432 220 0 21 0 22 0 29 0 43
LCP81-010 L89-113 208 0 21 0 22 0 29 0 43
34
Table 6. Continue.
1st Line 2nd Line Increase Assignments
Female Male Survive No. Rank
Percentile
No. Rank
Percentile
No. Rank
Percentile
No. Rank
Percentile
LCP81-010 L91-281 209 11 71 5 89 3 95 0 43
LCP81-010 L92-312 143 0 21 0 22 0 29 0 43
LCP81-010 L92-312 124 0 21 0 22 0 29 0 43
LCP81-010 L94-428 460 6 44 2 48 1 62 0 43
LCP81-010 L98-207 617 39 80 15 90 5 82 0 43
LCP81-010 L98-207 1095 35 53 12 68 6 76 0 43
LCP81-010 L98-209 605 24 59 5 60 3 73 0 43
LCP81-010 L99-233 898 28 51 12 74 3 66 0 43
LCP81-010 LCP82-089 384 0 21 0 22 0 29 0 43
LCP81-010 LCP85-384 844 85 94 25 93 8 87 2 91
LCP81-010 LCP85-384 937 17 46 4 48 1 59 1 87
LCP82-089 LCP85-384 381 20 70 1 46 1 65 0 43
LCP83-137 HoCP96-561 404 34 89 9 87 4 90 0 43
LCP85-313 HoCP96-509 342 24 83 10 92 3 85 1 93
LCP85-313 HoCP97-609 415 29 83 3 57 2 72 0 43
LCP85-384 01P4 597 0 21 0 22 0 29 0 43
LCP85-384 HoCP89-846 240 19 87 3 72 1 67 0 43
LCP85-384 HoCP92-618 230 0 21 0 22 0 29 0 43
LCP85-384 HoCP97-621 471 53 96 5 67 3 79 0 43
LCP85-384 L91-281 378 0 21 0 22 0 29 0 43
LCP85-384 L99-233 609 13 47 6 66 2 66 0 43
LCP86-454 L99-233 591 32 73 6 66 3 74 1 90
LCP86-454 LCP85-384 636 45 84 10 78 4 78 1 89
LCP86-454 LCP85-384 1475 64 62 18 71 3 60 0 43
LCP86-454 TucCP77-42 335 0 21 0 22 0 29 0 43
LHo83-153 L99-233 180 14 86 7 96 2 92 2 99
LHo83-153 LCP85-384 213 5 48 2 64 0 29 0 43
LHo92-314 L99-226 207 0 21 0 22 0 29 0 43
LHo92-314 LCP85-384 229 0 21 0 22 0 29 0 43
MISC MISC 240 15 80 2 60 1 67 1 95
TucCP77-42 L98-209 162 14 90 5 94 0 29 0 43
TucCP77-42 L99-238 232 12 70 2 61 2 85 1 96
TucCP77-42 LCP85-384 476 25 71 7 75 3 79 0 43
US96-002 LCP85-384 229 22 93 2 62 1 69 0 43
2002 Crossing Series
CP70-321 LCP85-384 185 2 28 0 21 0 26 . .
CP77-405 HoCP96-540 454 0 12 0 21 0 26 . .
CP77-405 L99-233 172 3 31 0 21 0 26 . .
CP77-405 LCP85-384 234 8 48 0 21 0 26 . .
35
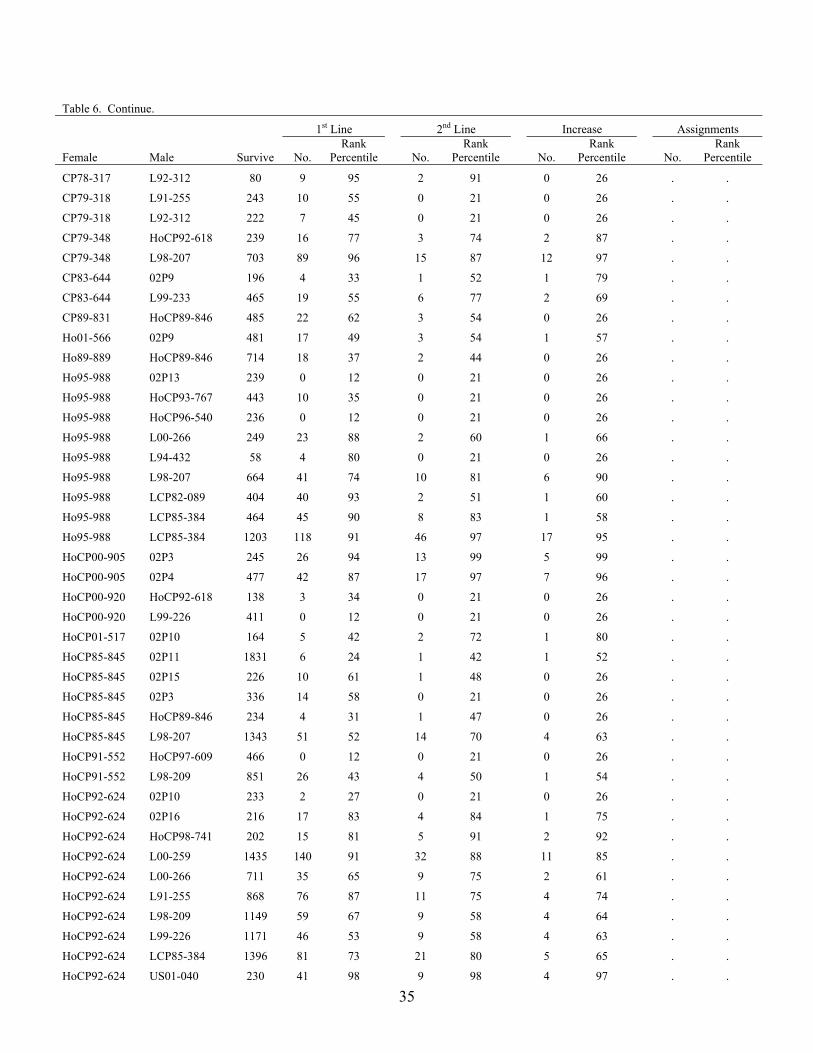
Table 6. Continue.
1st Line 2nd Line Increase Assignments
Female Male Survive No. Rank
Percentile
No. Rank
Percentile
No. Rank
Percentile
No. Rank
Percentile
CP78-317 L92-312 80 9 95 2 91 0 26 . .
CP79-318 L91-255 243 10 55 0 21 0 26 . .
CP79-318 L92-312 222 7 45 0 21 0 26 . .
CP79-348 HoCP92-618 239 16 77 3 74 2 87 . .
CP79-348 L98-207 703 89 96 15 87 12 97 . .
CP83-644 02P9 196 4 33 1 52 1 79 . .
CP83-644 L99-233 465 19 55 6 77 2 69 . .
CP89-831 HoCP89-846 485 22 62 3 54 0 26 . .
Ho01-566 02P9 481 17 49 3 54 1 57 . .
Ho89-889 HoCP89-846 714 18 37 2 44 0 26 . .
Ho95-988 02P13 239 0 12 0 21 0 26 . .
Ho95-988 HoCP93-767 443 10 35 0 21 0 26 . .
Ho95-988 HoCP96-540 236 0 12 0 21 0 26 . .
Ho95-988 L00-266 249 23 88 2 60 1 66 . .
Ho95-988 L94-432 58 4 80 0 21 0 26 . .
Ho95-988 L98-207 664 41 74 10 81 6 90 . .
Ho95-988 LCP82-089 404 40 93 2 51 1 60 . .
Ho95-988 LCP85-384 464 45 90 8 83 1 58 . .
Ho95-988 LCP85-384 1203 118 91 46 97 17 95 . .
HoCP00-905 02P3 245 26 94 13 99 5 99 . .
HoCP00-905 02P4 477 42 87 17 97 7 96 . .
HoCP00-920 HoCP92-618 138 3 34 0 21 0 26 . .
HoCP00-920 L99-226 411 0 12 0 21 0 26 . .
HoCP01-517 02P10 164 5 42 2 72 1 80 . .
HoCP85-845 02P11 1831 6 24 1 42 1 52 . .
HoCP85-845 02P15 226 10 61 1 48 0 26 . .
HoCP85-845 02P3 336 14 58 0 21 0 26 . .
HoCP85-845 HoCP89-846 234 4 31 1 47 0 26 . .
HoCP85-845 L98-207 1343 51 52 14 70 4 63 . .
HoCP91-552 HoCP97-609 466 0 12 0 21 0 26 . .
HoCP91-552 L98-209 851 26 43 4 50 1 54 . .
HoCP92-624 02P10 233 2 27 0 21 0 26 . .
HoCP92-624 02P16 216 17 83 4 84 1 75 . .
HoCP92-624 HoCP98-741 202 15 81 5 91 2 92 . .
HoCP92-624 L00-259 1435 140 91 32 88 11 85 . .
HoCP92-624 L00-266 711 35 65 9 75 2 61 . .
HoCP92-624 L91-255 868 76 87 11 75 4 74 . .
HoCP92-624 L98-209 1149 59 67 9 58 4 64 . .
HoCP92-624 L99-226 1171 46 53 9 58 4 63 . .
HoCP92-624 LCP85-384 1396 81 73 21 80 5 65 . .
HoCP92-624 US01-040 230 41 98 9 98 4 97 . .
36
Table 6. Continue.
1st Line 2nd Line Increase Assignments
Female Male Survive No. Rank
Percentile
No. Rank
Percentile
No. Rank
Percentile
No. Rank
Percentile
HoCP93-746 L91-255 217 5 35 0 21 0 26 . .
HoCP93-746 L99-233 463 20 59 3 55 1 58 . .
HoCP93-749 L00-247 131 2 29 0 21 0 26 . .
HoCP93-749 L00-266 481 0 12 0 21 0 26 . .
HoCP93-749 LCP85-384 68 0 12 0 21 0 26 . .
HoCP93-749 LCP85-384 239 9 52 3 74 0 26 . .
HoCP93-767 HoCP97-609 213 0 12 0 21 0 26 . .
HoCP93-767 L99-226 234 33 97 6 92 1 68 . .
HoCP94-806 HoCP91-552 212 11 68 2 67 1 77 . .
HoCP94-806 HoCP93-767 240 11 63 3 73 0 26 . .
HoCP94-806 HoCP96-540 209 12 72 4 85 0 26 . .
HoCP95-951 02P2 670 56 86 20 95 9 95 . .
HoCP96-509 L98-207 1205 76 75 16 79 10 86 . .
HoCP96-561 HoCP00-905 118 0 12 0 21 0 26 . .
HoCP96-561 L99-226 466 16 48 6 77 4 89 . .
HoCP98-741 HoCP85-845 249 7 40 2 60 0 26 . .
HoCP98-741 L00-249 236 16 78 1 46 1 67 . .
HoCP98-741 L00-268 214 22 94 2 67 1 76 . .
HoCP98-741 L91-255 236 10 58 2 62 2 88 . .
HoCP98-741 L94-432 225 7 43 2 65 0 26 . .
HoCP98-741 L98-207 178 0 12 0 21 0 26 . .
HoCP98-741 L98-209 151 0 12 0 21 0 26 . .
HoCP98-741 L99-226 244 23 89 1 45 0 26 . .
HoCP98-781 HoCP85-845 423 3 25 0 21 0 26 . .
HoCP98-781 LCP85-384 684 38 70 4 52 1 54 . .
HoCP99-866 L01-291 473 0 12 0 21 0 26 . .
L00-247 02P4 230 13 72 3 79 3 94 . .
L00-247 HoCP97-609 35 0 12 0 21 0 26 . .
L00-247 L98-209 80 0 12 0 21 0 26 . .
L00-247 L99-226 204 4 33 2 68 1 78 . .
L00-264 L94-432 232 21 88 2 63 1 70 . .
L00-266 LCP86-454 413 0 12 0 21 0 26 . .
L00-268 HoCP92-618 435 21 63 3 56 0 26 . .
L00-268 HoCP96-540 1070 0 12 0 21 0 26 . .
L00-268 L92-321 217 0 12 0 21 0 26 . .
L00-270 02P2 426 19 62 3 57 2 76 . .
L00-270 HoCP96-540 521 3 25 1 43 1 56 . .
L00-270 HoCP97-609 793 0 12 0 21 0 26 . .
L00-270 L00-247 228 10 61 2 64 1 72 . .
L00-270 L99-226 1089 0 12 0 21 0 26 . .
L01-315 HoCP96-540 465 23 65 5 71 3 83 . .

37
Table 6. Continue.
1st Line 2nd Line Increase Assignments
Female Male Survive No. Rank
Percentile
No. Rank
Percentile
No. Rank
Percentile
No. Rank
Percentile
L01-315 HoCP96-561 232 4 31 0 21 0 26 . .
L01-315 HoCP98-741 487 20 55 5 69 3 81 . .
L01-315 HoCP99-825 78 2 38 0 21 0 26 . .
L01-315 L94-428 188 0 12 0 21 0 26 . .
L01-315 LCP86-454 240 8 46 1 46 0 26 . .
L01-315 US01-040 244 0 12 0 21 0 26 . .
L89-113 LCP85-384 250 20 84 6 89 2 85 . .
L91-255 HoCP00-905 82 2 36 0 21 0 26 . .
L91-281 L99-226 761 45 73 6 59 2 60 . .
L92-312 02P2 442 0 12 0 21 0 26 . .
L92-312 US80-004 101 0 12 0 21 0 26 . .
L93-363 L00-259 579 15 38 4 56 2 64 . .
L93-363 L91-255 208 31 98 4 86 1 77 . .
L93-363 L99-226 144 12 85 3 86 0 26 . .
L93-365 L99-233 242 7 41 0 21 0 26 . .
L93-365 LCP85-384 236 8 48 0 21 0 26 . .
L93-399 L98-209 229 8 49 2 63 1 71 . .
L93-399 L98-209 394 17 59 0 21 0 26 . .
L94-426 HoCP96-540 122 0 12 0 21 0 26 . .
L94-426 HoCP97-609 225 15 77 1 48 0 26 . .
L94-426 L98-207 117 2 31 1 62 1 89 . .
L94-428 02P12 214 2 27 1 50 0 26 . .
L94-428 HoCP96-540 482 31 76 11 88 3 82 . .
L94-428 HoCP97-609 41 0 12 0 21 0 26 . .
L94-428 L00-259 442 21 63 4 66 2 73 . .
L94-428 L98-207 943 48 67 18 85 4 67 . .
L94-433 HoCP92-618 174 11 75 0 21 0 26 . .
L94-433 L94-428 189 0 12 0 21 0 26 . .
L94-433 L99-226 1280 41 45 6 50 2 55 . .
L96-040 HoCP97-609 490 0 12 0 21 0 26 . .
L96-040 L00-268 240 8 46 0 21 0 26 . .
L96-040 L99-226 664 0 12 0 21 0 26 . .
L96-092 LCP85-384 463 13 40 5 71 1 58 . .
L97-128 HoCP91-951 186 5 39 0 21 0 26 . .
L97-128 HoCP96-540 246 18 80 8 96 3 92 . .
L97-128 L94-428 146 6 55 0 21 0 26 . .
L97-128 L98-207 133 7 69 0 21 0 26 . .
L97-128 L99-233 87 6 80 1 72 0 26 . .
L97-128 LCP85-384 69 0 12 0 21 0 26 . .
L98-197 HoCP99-866 226 0 12 0 21 0 26 . .
L98-207 02P10 1009 96 89 24 89 13 94 . .
38
Table 6. Continue.
1st Line 2nd Line Increase Assignments
Female Male Survive No. Rank
Percentile
No. Rank
Percentile
No. Rank
Percentile
No. Rank
Percentile
L98-207 02P7 244 0 12 0 21 0 26 . .
L98-207 02P9 920 0 12 0 21 0 26 . .
L98-207 L92-321 225 17 82 2 65 1 73 . .
L98-207 L99-226 461 17 51 8 83 3 83 . .
L98-209 HoCP97-609 213 0 12 0 21 0 26 . .
L98-209 L01-299 326 0 12 0 21 0 26 . .
L99-233 02P18 232 10 59 6 92 1 70 . .
L99-233 HoCP98-741 216 0 12 0 21 0 26 . .
L99-233 L99-226 248 9 50 2 61 1 66 . .
LCP81-010 HoCP96-540 673 54 84 11 82 2 62 . .
LCP81-010 L92-312 462 14 42 1 44 1 58 . .
LCP81-010 L99-233 162 11 78 4 90 2 93 . .
LCP81-010 LCP85-384 226 12 69 1 48 1 72 . .
LCP81-010 02P19 223 9 54 0 21 0 26 . .
LCP82-089 02P3 445 0 12 0 21 0 26 . .
LCP82-089 02P4 410 0 12 0 21 0 26 . .
LCP85-313 HoCP92-618 137 2 29 0 21 0 26 . .
LCP85-313 HoCP97-609 159 9 72 0 21 0 26 . .
LCP85-313 L98-209 623 31 66 8 76 4 82 . .
LCP85-313 LCP82-089 109 4 51 1 66 1 91 . .
LCP85-384 02P11 1105 22 33 7 55 3 61 . .
LCP85-384 02P17 145 14 90 0 21 0 26 . .
LCP85-384 02P3 200 0 12 0 21 0 26 . .
LCP85-384 02P4 244 18 81 7 94 2 86 . .
LCP85-384 HoCP01-517 444 49 95 20 98 9 98 . .
LCP86-454 02P11 1033 0 12 0 21 0 26 . .
LCP86-454 02P14 233 12 68 3 77 1 69 . .
LCP86-454 L98-207 374 3 26 0 21 0 26 . .
LCP86-454 LCP85-384 1366 34 37 7 52 1 53 . .
LH083-153 HoCP92-618 92 0 12 0 21 0 26 . .
N-27 HoCP96-540 383 38 93 11 94 2 79 . .
N-27 L94-428 185 6 45 3 82 1 80 . .
N-27 L98-209 657 18 39 4 53 1 55 . .
N-27 LCP85-384 252 16 75 7 93 5 98 . .
TucCP77-42 LCP85-384 476 24 66 6 74 4 88 . .
US79-010 HoCP96-540 131 17 97 4 95 1 84 . .
US79-010 L01-299 216 17 83 3 80 1 75 . .
US79-010 L98-207 245 10 55 0 21 0 26 . .
US79-010 LCP85-384 102 19 99 1 68 1 91 . .
US96-002 L01-299 185 2 28 0 21 0 26 . .

39
Table 6. Continue.
1st Line 2nd Line Increase Assignments
Female Male Survive No. Rank
Percentile
No. Rank
Percentile
No. Rank
Percentile
No. Rank
Percentile
2003 Crossing Series
CP65-357 Ho95-988 238 0 39 0 39 . . . .
CP65-357 LCP85-384 1235 0 39 0 39 . . . .
CP65-357 LCP85-384 964 0 39 0 39 . . . .
CP73-351 HoCP96-540 457 0 39 0 39 . . . .
CP77-310 HoCP91-552 231 0 39 0 39 . . . .
CP83-644 HoCP97-606 244 0 39 0 39 . . . .
Ho01-564 L99-226 425 29 84 5 87 . . . .
Ho01-564 LCP85-384 238 0 39 0 39 . . . .
Ho89-889 L98-209 209 0 39 0 39 . . . .
Ho95-988 L99-226 182 0 39 0 39 . . . .
Ho95-988 L99-233 274 0 39 0 39 . . . .
Ho95-988 LCP85-384 243 27 91 3 87 . . . .
HoCP00-905 HoCP00-930 154 28 99 11 99 . . . .
HoCP00-905 HoCP92-618 175 0 39 0 39 . . . .
HoCP00-905 HoCP96-540 222 0 39 0 39 . . . .
HoCP00-905 HoCP97-609 248 0 39 0 39 . . . .
HoCP00-905 L91-281 500 0 39 0 39 . . . .
HoCP00-905 L94-432 377 56 97 18 98 . . . .
HoCP00-905 LCP85-384 251 0 39 0 39 . . . .
HoCP00-905 LCP85-384 452 0 39 0 39 . . . .
HoCP00-930 HoCP91-552 478 36 86 10 94 . . . .
HoCP00-930 HoCP96-540 490 0 39 0 39 . . . .
HoCP00-942 L00-266 242 0 39 0 39 . . . .
HoCP00-946 LCP85-384 236 0 39 0 39 . . . .
HoCP00-950 HoCP01-506 212 24 92 6 96 . . . .
HoCP00-950 HoCP01-506 228 0 39 0 39 . . . .
HoCP00-950 HoCP91-552 668 6 79 1 80 . . . .
HoCP00-950 HoCP91-552 446 0 39 0 39 . . . .
HoCP00-950 HoCP96-540 934 71 87 12 89 . . . .
HoCP00-950 L00-266 249 0 39 0 39 . . . .
HoCP00-950 L99-226 240 23 89 2 85 . . . .
HoCP01-523 Ho91-572 240 0 39 0 39 . . . .
HoCP01-523 LCP85-384 234 0 39 0 39 . . . .
HoCP01-523 LCP85-384 243 16 84 2 84 . . . .
HoCP01-525 03P12 235 0 39 0 39 . . . .
HoCP01-525 HoCP01-506 244 26 90 4 91 . . . .
HoCP01-525 LCP85-384 213 31 96 5 95 . . . .
HoCP01-528 03P15 175 0 39 0 39 . . . .
HoCP01-541 HoCP96-540 153 0 39 0 39 . . . .
HoCP01-544 L98-197 244 0 39 0 39 . . . .
40
Table 6. Continue.
1st Line 2nd Line Increase Assignments
Female Male Survive No. Rank
Percentile
No. Rank
Percentile
No. Rank
Percentile
No. Rank
Percentile
HoCP01-558 HoCP00-905 241 0 39 0 39 . . . .
HoCP01-561 03P12 490 64 94 10 93 . . . .
HoCP01-561 03P13 256 0 39 0 39 . . . .
HoCP01-561 LCP85-384 172 0 39 0 39 . . . .
HoCP85-845 03P22 232 32 95 4 92 . . . .
HoCP85-845 HoCP01-506 483 0 39 0 39 . . . .
HoCP85-845 L02-328 247 25 89 7 96 . . . .
HoCP85-845 L98-207 727 68 88 9 88 . . . .
HoCP85-845 L98-209 741 0 39 0 39 . . . .
HoCP85-845 LCP85-384 467 0 39 0 39 . . . .
HoCP88-739 LCP85-384 683 0 39 0 39 . . . .
HoCP89-831 03P12 489 0 39 0 39 . . . .
HoCP89-831 LCP85-384 491 0 39 0 39 . . . .
HoCP89-846 HoCP96-540 796 0 39 0 39 . . . .
HoCP89-846 HoCP96-540 245 0 39 0 39 . . . .
HoCP89-846 L02-328 241 0 39 0 39 . . . .
HoCP89-846 L98-209 442 0 39 0 39 . . . .
HoCP89-846 LCP85-384 244 0 39 0 39 . . . .
HoCP91-552 03P16 183 0 39 0 39 . . . .
HoCP91-552 L99-226 393 44 92 19 99 . . . .
HoCP92-618 L02-333 231 0 39 0 39 . . . .
HoCP92-624 03P1 641 0 39 0 39 . . . .
HoCP92-624 03P2 247 0 39 0 39 . . . .
HoCP92-624 HoCP00-905 235 0 39 0 39 . . . .
HoCP92-624 HoCP85-845 239 0 39 0 39 . . . .
HoCP92-624 HoCP91-552 355 0 39 0 39 . . . .
HoCP92-624 HoCP91-552 228 33 96 3 89 . . . .
HoCP92-624 HoCP96-540 497 0 39 0 39 . . . .
HoCP92-624 L02-320 234 0 39 0 39 . . . .
HoCP92-624 L02-323 208 31 97 6 97 . . . .
HoCP92-624 L91-281 502 0 39 0 39 . . . .
HoCP92-624 L96-092 494 0 39 0 39 . . . .
HoCP92-624 L98-209 1114 0 39 0 39 . . . .
HoCP92-624 L98-209 501 0 39 0 39 . . . .
HoCP92-624 L99-226 250 0 39 0 39 . . . .
HoCP92-624 LCP85-384 222 0 39 0 39 . . . .
HoCP92-624 LCP85-384 473 0 39 0 39 . . . .
HoCP92-624 LCP85-384 498 26 82 2 81 . . . .
HoCP92-624 LCP85-384 315 0 39 0 39 . . . .
HoCP92-648 HoCP96-540 215 0 39 0 39 . . . .
HoCP92-648 L98-209 482 0 39 0 39 . . . .

41
Table 6. Continue.
1st Line 2nd Line Increase Assignments
Female Male Survive No. Rank
Percentile
No. Rank
Percentile
No. Rank
Percentile
No. Rank
Percentile
HoCP92-648 L98-209 487 0 39 0 39 . . . .
HoCP92-648 L99-233 437 49 92 10 94 . . . .
HoCP92-648 LCP85-384 1199 0 39 0 39 . . . .
HoCP92-648 LCP85-384 256 0 39 0 39 . . . .
HoCP92-648 LCP85-384 247 0 39 0 39 . . . .
HoCP93-746 HoCP85-845 438 0 39 0 39 . . . .
HoCP93-746 LCP85-384 437 0 39 0 39 . . . .
HoCP93-749 L99-226 246 0 39 0 39 . . . .
HoCP95-951 03P1 254 21 87 2 84 . . . .
HoCP96-540 03P11 1587 0 39 0 39 . . . .
HoCP96-540 03P12 474 0 39 0 39 . . . .
HoCP96-540 03P18 195 0 39 0 39 . . . .
HoCP96-540 03P19 200 0 39 0 39 . . . .
HoCP96-540 03P6 251 0 39 0 39 . . . .
HoCP96-540 03P8 249 0 39 0 39 . . . .
HoCP96-540 03P9 1376 0 39 0 39 . . . .
HoCP96-540 HoCP01-506 674 0 39 0 39 . . . .
HoCP96-540 L02-316 1218 0 39 0 39 . . . .
HoCP96-540 L98-209 435 0 39 0 39 . . . .
HoCP96-540 L99-226 1435 0 39 0 39 . . . .
HoCP96-561 03P19 247 43 98 4 91 . . . .
HoCP96-561 L02-341 306 0 39 0 39 . . . .
HoCP97-606 HoCP96-540 592 0 39 0 39 . . . .
HoCP97-606 L98-209 239 0 39 0 39 . . . .
HoCP97-609 03P13 365 0 39 0 39 . . . .
HoCP97-609 03P15 247 0 39 0 39 . . . .
HoCP97-609 HoCP96-540 805 0 39 0 39 . . . .
HoCP98-741 L02-320 383 0 39 0 39 . . . .
HoCP98-781 03P9 438 0 39 0 39 . . . .
HoCP98-781 L98-207 481 0 39 0 39 . . . .
HoCP98-781 LCP85-384 208 0 39 0 39 . . . .
L01-281 03P9 428 0 39 0 39 . . . .
L01-283 HoCP91-552 476 15 79 3 83 . . . .
L01-283 LCP85-384 160 0 39 0 39 . . . .
L01-299 LCP85-384 646 0 39 0 39 . . . .
L01-299 LCP85-384 677 0 39 0 39 . . . .
L02-233 L96-092 241 23 88 3 88 . . . .
L02-319 HoCP96-540 407 0 39 0 39 . . . .
L02-320 HoCP85-845 229 0 39 0 39 . . . .
L02-320 HoCP96-540 487 0 39 0 39 . . . .
L02-320 L99-226 243 12 81 4 92 . . . .

42
Table 6. Continue.
1st Line 2nd Line Increase Assignments
Female Male Survive No. Rank
Percentile
No. Rank
Percentile
No. Rank
Percentile
No. Rank
Percentile
L02-322 HoCP85-845 240 0 39 0 39 . . . .
L02-322 HoCP96-540 132 0 39 0 39 . . . .
L02-322 L99-226 211 0 39 0 39 . . . .
L02-328 Ho91-572 223 0 39 0 39 . . . .
L02-328 HoCP91-552 224 0 39 0 39 . . . .
L02-328 HoCP91-552 204 0 39 0 39 . . . .
L02-328 L99-226 896 53 83 8 86 . . . .
L02-328 L99-233 711 0 39 0 39 . . . .
L02-333 HoCP96-540 748 0 39 0 39 . . . .
L02-336 POLY 227 0 39 0 39 . . . .
L02-341 HoCP91-552 381 42 90 12 97 . . . .
L02-341 HoCP91-552 208 10 80 3 90 . . . .
L02-341 HoCP96-540 428 0 39 0 39 . . . .
L02-351 LCP85-384 242 0 39 0 39 . . . .
L91-255 HoCP96-540 471 0 39 0 39 . . . .
L91-255 L00-266 437 0 39 0 39 . . . .
L91-255 LCP85-384 245 0 39 0 39 . . . .
L94-426 HoCP91-552 356 0 39 0 39 . . . .
L94-428 HoCP96-540 246 0 39 0 39 . . . .
L94-432 03P24 458 0 39 0 39 . . . .
L94-432 LCP85-384 419 0 39 0 39 . . . .
L94-433 Ho91-572 460 0 39 0 39 . . . .
L94-433 LCP85-384 1087 54 81 6 83 . . . .
L96-040 HoCP00-905 241 0 39 0 39 . . . .
L96-040 L94-432 477 0 39 0 39 . . . .
L96-040 L99-226 1105 0 39 0 39 . . . .
L96-040 LCP85-384 212 0 39 0 39 . . . .
L97-128 Ho91-572 186 0 39 0 39 . . . .
L97-128 HoCP91-552 207 0 39 0 39 . . . .
L97-128 HoCP91-552 166 0 39 0 39 . . . .
L97-128 L98-197 166 0 39 0 39 . . . .
L97-128 L98-207 435 31 85 7 90 . . . .
L97-128 L98-209 153 23 98 5 98 . . . .
L97-128 L99-226 74 0 39 0 39 . . . .
L97-128 LCP85-384 188 0 39 0 39 . . . .
L97-128 POLY 371 0 39 0 39 . . . .
L97-137 L94-432 440 0 39 0 39 . . . .
L97-137 L96-092 486 0 39 0 39 . . . .
L98-207 HoCP01-553 721 0 39 0 39 . . . .
L98-209 HoCP91-552 362 0 39 0 39 . . . .
L98-209 HoCP96-540 229 0 39 0 39 . . . .

43
Table 6. Continue.
1st Line 2nd Line Increase Assignments
Female Male Survive No. Rank
Percentile
No. Rank
Percentile
No. Rank
Percentile
No. Rank
Percentile
L98-209 L98-207 1190 0 39 0 39 . . . .
L99-226 03P10 233 0 39 0 39 . . . .
L99-226 03P13 238 0 39 0 39 . . . .
L99-226 HoCP92-618 850 44 82 7 84 . . . .
L99-226 HoCP96-540 764 64 87 8 87 . . . .
L99-226 L98-197 1172 0 39 0 39 . . . .
L99-226 L99-233 920 0 39 0 39 . . . .
L99-233 L96-092 396 0 39 0 39 . . . .
LCP02-337 03P14 243 0 39 0 39 . . . .
LCP02-337 03P18 342 0 39 0 39 . . . .
LCP02-337 HoCP96-540 440 0 39 0 39 . . . .
LCP02-337 L99-226 1160 0 39 0 39 . . . .
LCP02-344 HoCP96-540 395 0 39 0 39 . . . .
LCP02-345 HoCP96-540 450 0 39 0 39 . . . .
LCP02-345 L99-226 190 0 39 0 39 . . . .
LCP81-010 03P15 1323 0 39 0 39 . . . .
LCP81-010 Ho91-572 487 0 39 0 39 . . . .
LCP81-010 HoCP91-552 242 13 83 1 82 . . . .
LCP81-010 L02-320 226 0 39 0 39 . . . .
LCP81-010 L98-197 786 0 39 0 39 . . . .
LCP81-010 L98-207 238 0 39 0 39 . . . .
LCP81-010 L98-207 694 0 39 0 39 . . . .
LCP81-010 L98-207 1152 83 85 4 81 . . . .
LCP81-010 LCP85-384 908 0 39 0 39 . . . .
LCP81-010 LCP85-384 956 0 39 0 39 . . . .
LCP82-089 LCP85-384 708 0 39 0 39 . . . .
LCP85-384 03P10 866 37 80 1 79 . . . .
LCP85-384 03P22 95 0 39 0 39 . . . .
LCP85-384 03P24 248 0 39 0 39 . . . .
LCP85-384 03P8 666 0 39 0 39 . . . .
LCP86-454 03P8 246 0 39 0 39 . . . .
MISC MISC 489 0 39 0 39 . . . .
N-27 Ho95-988 233 30 94 1 82 . . . .
N27 03P22 466 66 95 12 95 . . . .
TucCP77-42 POLY 245 0 39 0 39 . . . .
US01-039 Ho91-572 481 0 39 0 39 . . . .
US01-039 HoCP96-540 444 0 39 0 39 . . . .
US01-039 LCP85-384 489 58 93 1 80 . . . .
US01-039 LCP85-384 150 11 86 0 39 . . . .
US01-040 Ho91-572 172 0 39 0 39 . . . .
US02-096 HoCP01-553 230 42 99 2 86 . . . .
44
Table 6. Continue.
1st Line 2nd Line Increase Assignments
Female Male Survive No. Rank
Percentile
No. Rank
Percentile
No. Rank
Percentile
No. Rank
Percentile
US02-096 LCP85-384 210 0 39 0 39 . . . .
US99-002 LCP85-384 242 28 93 5 93 . . . .
US99-004 LCP85-384 222 0 39 0 39 . . . .
2004 Crossing Series
CP65-357 Ho95-988 238 8 69 . . . . . .
CP65-357 L02-316 488 29 87 . . . . . .
CP65-357 L98-207 693 0 21 . . . . . .
CP65-357 L99-233 684 18 60 . . . . . .
CP73-351 L98-207 956 0 21 . . . . . .
CP79-318 L02-316 247 0 21 . . . . . .
CP79-318 LCP85-384 724 16 54 . . . . . .
Ho01-564 HoCP91-552 238 11 81 . . . . . .
Ho01-564 L99-226 444 0 21 . . . . . .
Ho01-564 TucCP77-42 743 47 88 . . . . . .
Ho91-572 04P1 234 0 21 . . . . . .
Ho95-988 HoCP89-846 251 6 57 . . . . . .
Ho95-988 HoCP91-552 941 17 51 . . . . . .
Ho95-988 HoCP91-552 498 0 21 . . . . . .
Ho95-988 L98-207 1126 27 57 . . . . . .
Ho95-988 LCP85-384 732 0 21 . . . . . .
HoCP00-930 Ho95-988 480 2 42 . . . . . .
HoCP00-930 HoCP89-846 706 0 21 . . . . . .
HoCP00-930 HoCP91-552 243 0 21 . . . . . .
HoCP00-930 HoCP91-552 455 16 71 . . . . . .
HoCP00-930 L00-266 496 46 97 . . . . . .
HoCP00-930 L02-353 450 13 63 . . . . . .
HoCP00-930 L99-233 834 85 98 . . . . . .
HoCP00-930 TucCP77-42 188 15 96 . . . . . .
HoCP00-950 HoCP89-846 249 0 21 . . . . . .
HoCP00-950 L98-209 244 0 21 . . . . . .
HoCP00-950 LCP85-384 360 0 21 . . . . . .
HoCP01-517 L98-207 985 43 79 . . . . . .
HoCP01-523 L02-316 248 17 93 . . . . . .
HoCP01-523 L98-209 491 0 21 . . . . . .
HoCP01-523 LCP85-384 470 43 97 . . . . . .
HoCP01-529 L99-226 243 0 21 . . . . . .
HoCP01-541 HoCP92-618 239 0 21 . . . . . .
HoCP01-544 L99-233 202 0 21 . . . . . .
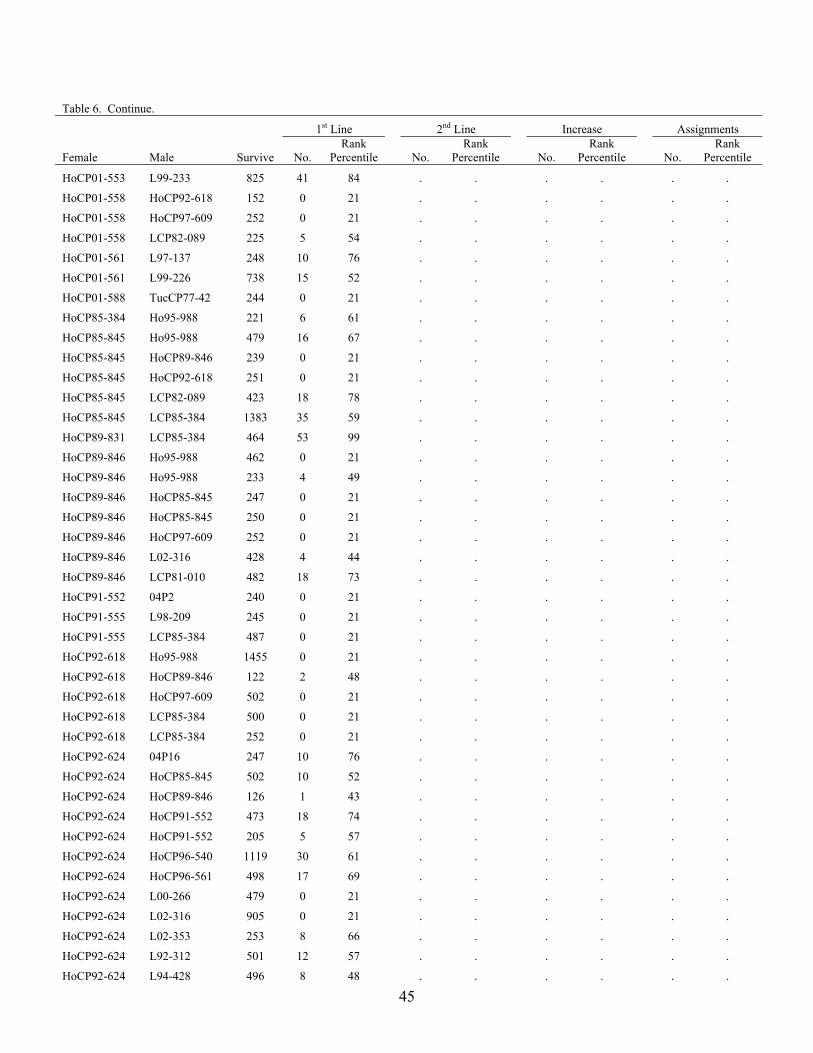
45
Table 6. Continue.
1st Line 2nd Line Increase Assignments
Female Male Survive No. Rank
Percentile
No. Rank
Percentile
No. Rank
Percentile
No. Rank
Percentile
HoCP01-553 L99-233 825 41 84 . . . . . .
HoCP01-558 HoCP92-618 152 0 21 . . . . . .
HoCP01-558 HoCP97-609 252 0 21 . . . . . .
HoCP01-558 LCP82-089 225 5 54 . . . . . .
HoCP01-561 L97-137 248 10 76 . . . . . .
HoCP01-561 L99-226 738 15 52 . . . . . .
HoCP01-588 TucCP77-42 244 0 21 . . . . . .
HoCP85-384 Ho95-988 221 6 61 . . . . . .
HoCP85-845 Ho95-988 479 16 67 . . . . . .
HoCP85-845 HoCP89-846 239 0 21 . . . . . .
HoCP85-845 HoCP92-618 251 0 21 . . . . . .
HoCP85-845 LCP82-089 423 18 78 . . . . . .
HoCP85-845 LCP85-384 1383 35 59 . . . . . .
HoCP89-831 LCP85-384 464 53 99 . . . . . .
HoCP89-846 Ho95-988 462 0 21 . . . . . .
HoCP89-846 Ho95-988 233 4 49 . . . . . .
HoCP89-846 HoCP85-845 247 0 21 . . . . . .
HoCP89-846 HoCP85-845 250 0 21 . . . . . .
HoCP89-846 HoCP97-609 252 0 21 . . . . . .
HoCP89-846 L02-316 428 4 44 . . . . . .
HoCP89-846 LCP81-010 482 18 73 . . . . . .
HoCP91-552 04P2 240 0 21 . . . . . .
HoCP91-555 L98-209 245 0 21 . . . . . .
HoCP91-555 LCP85-384 487 0 21 . . . . . .
HoCP92-618 Ho95-988 1455 0 21 . . . . . .
HoCP92-618 HoCP89-846 122 2 48 . . . . . .
HoCP92-618 HoCP97-609 502 0 21 . . . . . .
HoCP92-618 LCP85-384 500 0 21 . . . . . .
HoCP92-618 LCP85-384 252 0 21 . . . . . .
HoCP92-624 04P16 247 10 76 . . . . . .
HoCP92-624 HoCP85-845 502 10 52 . . . . . .
HoCP92-624 HoCP89-846 126 1 43 . . . . . .
HoCP92-624 HoCP91-552 473 18 74 . . . . . .
HoCP92-624 HoCP91-552 205 5 57 . . . . . .
HoCP92-624 HoCP96-540 1119 30 61 . . . . . .
HoCP92-624 HoCP96-561 498 17 69 . . . . . .
HoCP92-624 L00-266 479 0 21 . . . . . .
HoCP92-624 L02-316 905 0 21 . . . . . .
HoCP92-624 L02-353 253 8 66 . . . . . .
HoCP92-624 L92-312 501 12 57 . . . . . .
HoCP92-624 L94-428 496 8 48 . . . . . .

46
Table 6. Continue.
1st Line 2nd Line Increase Assignments
Female Male Survive No. Rank
Percentile
No. Rank
Percentile
No. Rank
Percentile
No. Rank
Percentile
HoCP92-624 L97-128 218 0 21 . . . . . .
HoCP92-624 L98-207 1462 70 82 . . . . . .
HoCP92-624 L98-209 842 43 85 . . . . . .
HoCP92-624 L99-226 1184 67 87 . . . . . .
HoCP92-624 L99-226 482 18 73 . . . . . .
HoCP92-624 L99-233 1206 38 66 . . . . . .
HoCP92-624 L99-233 1196 57 82 . . . . . .
HoCP92-624 LCP82-089 876 20 55 . . . . . .
HoCP92-624 LCP85-384 1294 98 95 . . . . . .
HoCP92-648 HoCP89-846 447 0 21 . . . . . .
HoCP92-648 HoCP91-552 243 7 63 . . . . . .
HoCP92-648 L00-266 480 31 90 . . . . . .
HoCP92-648 L02-316 503 8 48 . . . . . .
HoCP92-648 L97-137 117 0 21 . . . . . .
HoCP92-648 L99-233 457 13 62 . . . . . .
HoCP92-648 LCP85-384 174 7 76 . . . . . .
HoCP92-648 LCP85-384 256 19 94 . . . . . .
HoCP95-951 L02-325 463 11 57 . . . . . .
HoCP95-951 L99-233 433 0 21 . . . . . .
HoCP96-509 CP77-310 244 3 46 . . . . . .
HoCP96-509 L00-266 229 15 91 . . . . . .
HoCP96-509 L02-316 245 0 21 . . . . . .
HoCP96-509 LCP85-384 471 0 21 . . . . . .
HoCP96-540 04P3 679 7 45 . . . . . .
HoCP96-540 04P5 966 0 21 . . . . . .
HoCP96-540 04P7 1078 0 21 . . . . . .
HoCP96-540 HoCP91-552 224 0 21 . . . . . .
HoCP96-540 L02-325 471 0 21 . . . . . .
HoCP96-540 L99-233 469 0 21 . . . . . .
HoCP96-549 HoCP01-517 232 0 21 . . . . . .
HoCP96-561 L99-226 242 0 21 . . . . . .
HoCP97-609 Ho95-988 206 0 21 . . . . . .
HoCP97-609 HoCP91-552 343 10 63 . . . . . .
HoCP97-609 HoCP92-618 241 6 59 . . . . . .
HoCP97-609 LCP85-384 239 0 21 . . . . . .
HoCP85-845 HoCP91-552 254 0 21 . . . . . .
HoCP96-540 OP13 221 0 21 . . . . . .
L01-281 04P3 484 20 77 . . . . . .
L01-283 LCP81-010 415 8 51 . . . . . .
L01-299 04P3 233 17 94 . . . . . .
L01-299 HoCP91-552 247 11 80 . . . . . .

47
Table 6. Continue.
1st Line 2nd Line Increase Assignments
Female Male Survive No. Rank
Percentile
No. Rank
Percentile
No. Rank
Percentile
No. Rank
Percentile
L01-299 L97-128 227 8 71 . . . . . .
L01-299 LCP85-384 248 0 21 . . . . . .
L02-316 Ho95-988 465 0 21 . . . . . .
L02-316 HoCP91-552 243 5 53 . . . . . .
L02-320 LCP85-384 370 0 21 . . . . . .
L02-325 Ho95-988 689 0 21 . . . . . .
L02-325 HoCP91-552 804 0 21 . . . . . .
L02-325 HoCP92-618 468 0 21 . . . . . .
L02-325 LCP81-010 221 0 21 . . . . . .
L02-336 TucCP77-42 241 26 98 . . . . . .
L02-342 Ho95-988 234 12 85 . . . . . .
L02-342 HoCP92-618 252 0 21 . . . . . .
L02-342 L98-209 237 0 21 . . . . . .
L02-353 HoCP91-552 233 16 93 . . . . . .
L02-353 HoCP92-618 244 0 21 . . . . . .
L02-353 L98-209 236 15 89 . . . . . .
L02-353 LCP85-384 195 13 91 . . . . . .
L89-113 LCP85-384 249 0 21 . . . . . .
L91-281 HoCP85-845 499 0 21 . . . . . .
L91-281 L02-325 495 35 93 . . . . . .
L91-281 L99-226 404 9 54 . . . . . .
L94-426 HoCP89-846 243 10 77 . . . . . .
L94-426 L99-233 453 8 51 . . . . . .
L94-426 LCP85-384 233 8 69 . . . . . .
L94-428 HoCP89-846 464 0 21 . . . . . .
L94-428 LCP85-384 249 0 21 . . . . . .
L94-432 04P16 225 0 21 . . . . . .
L94-432 L02-316 246 9 73 . . . . . .
L94-433 TucCP77-42 474 40 96 . . . . . .
L97-128 04P10 466 24 86 . . . . . .
L97-128 HoCP85-845 228 2 44 . . . . . .
L97-128 HoCP89-846 443 22 84 . . . . . .
L97-128 L01-299 242 0 21 . . . . . .
L97-128 L91-255 236 0 21 . . . . . .
L97-128 L98-209 475 30 88 . . . . . .
L97-128 L99-226 231 14 88 . . . . . .
L97-128 L99-226 927 34 73 . . . . . .
L97-128 L99-233 1356 46 69 . . . . . .
L97-128 LCP81-010 453 12 60 . . . . . .
L97-128 LCP85-384 941 45 82 . . . . . .
L97-128 LCP85-384 367 24 90 . . . . . .
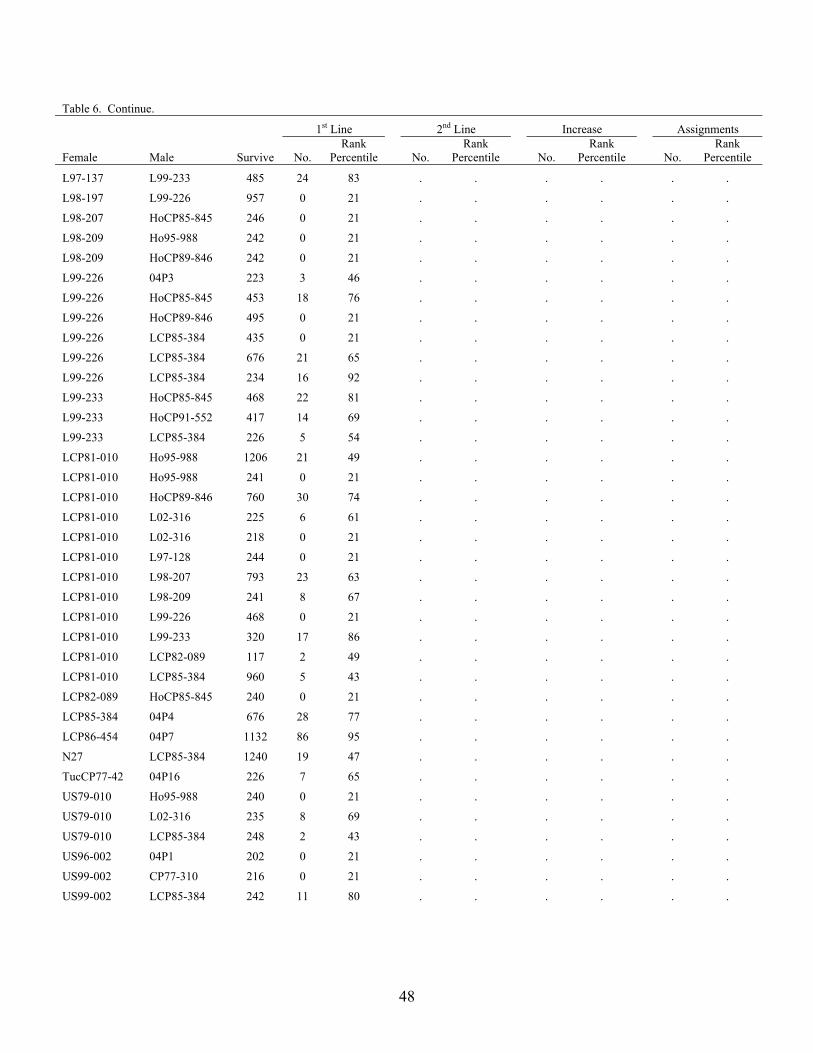
48
Table 6. Continue.
1st Line 2nd Line Increase Assignments
Female Male Survive No. Rank
Percentile
No. Rank
Percentile
No. Rank
Percentile
No. Rank
Percentile
L97-137 L99-233 485 24 83 . . . . . .
L98-197 L99-226 957 0 21 . . . . . .
L98-207 HoCP85-845 246 0 21 . . . . . .
L98-209 Ho95-988 242 0 21 . . . . . .
L98-209 HoCP89-846 242 0 21 . . . . . .
L99-226 04P3 223 3 46 . . . . . .
L99-226 HoCP85-845 453 18 76 . . . . . .
L99-226 HoCP89-846 495 0 21 . . . . . .
L99-226 LCP85-384 435 0 21 . . . . . .
L99-226 LCP85-384 676 21 65 . . . . . .
L99-226 LCP85-384 234 16 92 . . . . . .
L99-233 HoCP85-845 468 22 81 . . . . . .
L99-233 HoCP91-552 417 14 69 . . . . . .
L99-233 LCP85-384 226 5 54 . . . . . .
LCP81-010 Ho95-988 1206 21 49 . . . . . .
LCP81-010 Ho95-988 241 0 21 . . . . . .
LCP81-010 HoCP89-846 760 30 74 . . . . . .
LCP81-010 L02-316 225 6 61 . . . . . .
LCP81-010 L02-316 218 0 21 . . . . . .
LCP81-010 L97-128 244 0 21 . . . . . .
LCP81-010 L98-207 793 23 63 . . . . . .
LCP81-010 L98-209 241 8 67 . . . . . .
LCP81-010 L99-226 468 0 21 . . . . . .
LCP81-010 L99-233 320 17 86 . . . . . .
LCP81-010 LCP82-089 117 2 49 . . . . . .
LCP81-010 LCP85-384 960 5 43 . . . . . .
LCP82-089 HoCP85-845 240 0 21 . . . . . .
LCP85-384 04P4 676 28 77 . . . . . .
LCP86-454 04P7 1132 86 95 . . . . . .
N27 LCP85-384 1240 19 47 . . . . . .
TucCP77-42 04P16 226 7 65 . . . . . .
US79-010 Ho95-988 240 0 21 . . . . . .
US79-010 L02-316 235 8 69 . . . . . .
US79-010 LCP85-384 248 2 43 . . . . . .
US96-002 04P1 202 0 21 . . . . . .
US99-002 CP77-310 216 0 21 . . . . . .
US99-002 LCP85-384 242 11 80 . . . . . .

49
Table 7. Plant weight and rank summary statistics from the 2004 crossing series first stubble cross appraisal test at the Sugar Research Station in 2006. Cross Female Male Plant Weight kg/Plant Pcnt’l XL04-141 LCP81-010 L02-316 9.88 98 XL04-371 US79-010 04P16 8.94 97 ST99-233 8.75 96 XL04-319 L01-283 LCP81-010 8.62 95 XL04-181 Ho01-564 HoCP91-552 8.62 93 XL04-160 HoCP92-624 L99-226 8.56 92 XL04-026 L01-299 L02-353 8.52 91 XL04-150 HoCP01-544 L99-233 8.48 90 XL04-161 HoCP01-523 LCP85-384 8.31 89 XL04-108 HoCP00-930 L99-233 8.27 87 XL04-377 Ho01-564 TucCP77-042 8.26 86 XL04-327 HoCP89-846 L02-316 8.22 85 XL04-307 HoCP00-950 LCP85-384 8.16 84 XL04-116 LCP81-010 L99-226 8.14 83 XL04-304 L02-353 L98-209 8.09 81 XL04-239 L94-432 L02-316 7.93 80 XL04-391 HoCP01-529 L98-209 7.85 79 XL04-188 HoCP92-648 L00-266 7.74 78 XL04-187 HoCP92-624 L00-266 7.72 77 XL04-182 HoCP00-930 HoCP91-552 7.70 75 XL04-061 L01-299 04P3 7.69 74 XL04-236 HoCP00-930 HoCP91-552 7.66 73 XL04-194 US79-010 Ho95-988 7.65 72 XL04-139 CP65-357 L02-316 7.62 71 XL04-244 HoCP00-950 LCP85-384 7.60 69 XL04-396 L97-128 L99-226 7.56 68 XL04-221 HoCP01-558 L97-128 7.53 67 XL04-173 CP79-318 L02-316 7.50 66 XL04-262 L01-299 LCP81-010 7.47 65 XL04-394 HoCP01-561 L99-226 7.41 63 XL04-117 Ho01-564 L99-226 7.41 62 XL04-249 US79-010 LCP85-384 7.41 61 XL04-157 L02-325 HoCP91-552 7.39 60 XL04-315 US99-002 LCP85-384 7.39 59 XL04-231 L02-353 HoCP92-618 7.32 57 XL04-144 HoCP01-523 L02-316 7.30 56 XL04-024 HoCP00-930 L02-353 7.25 55 XL04-167 L97-128 HoCP95-951 7.22 54 XL04-235 L02-353 HoCP91-552 7.22 53 XL04-140 HoCP92-624 L02-316 7.22 51 XL04-149 HoCP01-553 L99-233 7.18 50 XL04-217 L91-281 L02-325 7.14 49
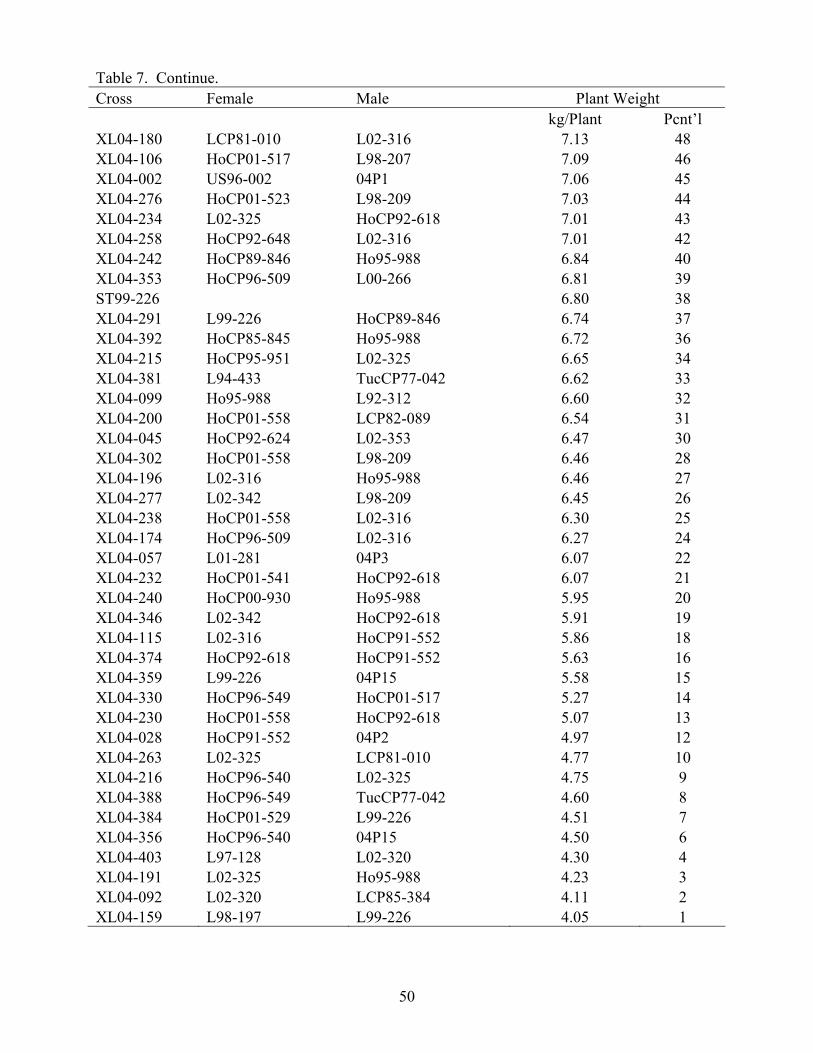
50
Table 7. Continue. Cross Female Male Plant Weight kg/Plant Pcnt’l XL04-180 LCP81-010 L02-316 7.13 48 XL04-106 HoCP01-517 L98-207 7.09 46 XL04-002 US96-002 04P1 7.06 45 XL04-276 HoCP01-523 L98-209 7.03 44 XL04-234 L02-325 HoCP92-618 7.01 43 XL04-258 HoCP92-648 L02-316 7.01 42 XL04-242 HoCP89-846 Ho95-988 6.84 40 XL04-353 HoCP96-509 L00-266 6.81 39 ST99-226 6.80 38 XL04-291 L99-226 HoCP89-846 6.74 37 XL04-392 HoCP85-845 Ho95-988 6.72 36 XL04-215 HoCP95-951 L02-325 6.65 34 XL04-381 L94-433 TucCP77-042 6.62 33 XL04-099 Ho95-988 L92-312 6.60 32 XL04-200 HoCP01-558 LCP82-089 6.54 31 XL04-045 HoCP92-624 L02-353 6.47 30 XL04-302 HoCP01-558 L98-209 6.46 28 XL04-196 L02-316 Ho95-988 6.46 27 XL04-277 L02-342 L98-209 6.45 26 XL04-238 HoCP01-558 L02-316 6.30 25 XL04-174 HoCP96-509 L02-316 6.27 24 XL04-057 L01-281 04P3 6.07 22 XL04-232 HoCP01-541 HoCP92-618 6.07 21 XL04-240 HoCP00-930 Ho95-988 5.95 20 XL04-346 L02-342 HoCP92-618 5.91 19 XL04-115 L02-316 HoCP91-552 5.86 18 XL04-374 HoCP92-618 HoCP91-552 5.63 16 XL04-359 L99-226 04P15 5.58 15 XL04-330 HoCP96-549 HoCP01-517 5.27 14 XL04-230 HoCP01-558 HoCP92-618 5.07 13 XL04-028 HoCP91-552 04P2 4.97 12 XL04-263 L02-325 LCP81-010 4.77 10 XL04-216 HoCP96-540 L02-325 4.75 9 XL04-388 HoCP96-549 TucCP77-042 4.60 8 XL04-384 HoCP01-529 L99-226 4.51 7 XL04-356 HoCP96-540 04P15 4.50 6 XL04-403 L97-128 L02-320 4.30 4 XL04-191 L02-325 Ho95-988 4.23 3 XL04-092 L02-320 LCP85-384 4.11 2 XL04-159 L98-197 L99-226 4.05 1

51
2006 LOUISIANA SUGARCANE VARIETY DEVELOPMENT PROGRAM NURSERY AND INFIELD VARIETY TRIALS
Terry. L. Bacon¹, Keith Bischoff¹, Kenneth Gravois¹,
Gert Hawkins¹, Mike Duet¹, and Sonny Viator² ¹Sugar Research Station and ²Iberia Research Station
Edwis Dufrene and Tom Tew
USDA-ARS Sugarcane Research Unit Five years after the initial hybridization of parents, clones that have met or exceeded criteria for desired characteristics at previous selection stages are assigned permanent numbers by each of the Louisiana Sugarcane Variety Development Programs. The LSU program assigns variety designations of “L,” and the USDA program assigns variety designations of “Ho” and “HoCP.” These varieties are planted in replicated nursery and infield tests at locations across the southern Louisiana sugarcane-growing areas. One objective of the nursery and infield stages is to identify and select varieties that will perform well across the range of environments a commercial variety will encounter in Louisiana. Nursery tests are initially planted at three on-station locations (USDA-ARS - Ardoyne Farm, Iberia Research Station, and Sugar Research Station) during the year of assignment, and four to five additional and different off-station locations are planted the year after assignment. There are three off-station nurseries, Newton Cane, Inc. (Bunkie), D & N Farm (Cecelia), and Landry Farms (Paincourtville), along with the two infield trial locations at Blackberry Farms (Vacherie) and Sugarland Acres, Inc. (Youngsville). Both the LSU and USDA varieties were planted at each location with the exception of D & N Farm which only contains LSU varieties. The locations, soil types, dates of planting and dates of harvest are listed in Table 1. The on-station nursery trials were planted in single row (6-foot centers), 16-foot-long plots with 4-foot alleys. The off-station nurseries were planted in single row, 20-foot plots with 4-foot alleys. The infield tests were planted in two-row, 25-foot plots with 5-foot alleys. The experimental design for both nursery and infield tests was a randomized complete block with two replications per location. Four commercial check varieties, LCP85-384, HoCP96-540, L97-128, and L99-226 were planted in all nursery and infield tests for comparison. Millable stalk counts for both nursery and infield tests were made in late July and August. A combine harvester and weigh wagon system was used to cut and weigh plots, respectively, for the infield tests. During the harvest season, 10-stalk samples were harvested by hand and stripped of leaves for the nursery tests. For the two infield tests, a 10-stalk sample was taken to the USDA Ardoyne Farm and analyzed for fiber content using the pre-breaker press method. Samples were weighed and milled at the sucrose laboratory to obtain a juice sample for analysis. Brix and pol readings were used to estimate theoretical recoverable sugar per ton as estimated by the Winter-Carp formula as reported by Gravois and Milligan (1992). Cane yield for the nursery tests was estimated as the product of stalk weight and stalk number. Cane yield for the infield tests was determined from the plot weights and reduced 14 percent to account for extraneous trash. Sugar per acre was calculated as the product of sugar per ton and cane yield.
52
The 2006 sugarcane crop experienced a wide range of growing conditions. Many parts of the northern and western sugarcane growing areas in Louisiana experienced a summer drought. The planting season had fairly normal rainfall with all experiments planted in a timely manner. The harvest was relatively wet, which contributed to average maturity. The crop was lodged, but cane tonnage was higher than the 2004 and 2005 crops. The sugarcane crop experienced below freezing temperatures from December 5 through December 9. The majority of the Louisiana crop was harvested before the deleterious effects of the freeze were experienced. All experimental locations were harvested before any freezing temperatures occurred. Recommended cultural practices were followed at all test locations. LCP85-384 has been the leading variety in Louisiana since 1998. Approximately 73% of Louisiana’s harvested sugarcane acreage was in LCP85-384 for 2006. The second leading variety grown in Louisiana in 2006 was HoCP96-540. Because of its increasing popularity, HoCP96-540 was used as a standard for comparison and is highlighted in the tables. To adjust for missing data, the statistical analysis calculated least square means (SAS 9 Proc Mixed). Mean separation used least square means probability differences where P=0.05. Varieties that are significantly higher or lower than HoCP96-540 are denoted by a plus (+) or minus (-), respectively, next to the value for each trait. References: Gravois, K.A. and S.B. Milligan. 1992. Genetic relationships between fiber and sugarcane yield components. Crop Sci. 32: 62-66.

53
Table 1. 2006 Location, soil texture, and planting and harvest dates for the nursery and infield tests. Harvest
Date Varieties
Series Location† Stage Soil
Texture Planting
Date
2006 No.
PlantedNo.
Harvested2001 Blackberry Farms Infield Commerce silt loam 08/27/02 11/03/06 38 2 2001 Newton Cane, Inc. Nursery Moreland silt loam 08/21/02 10/05/06 38 2 2001 D & N Farm Nursery Baldwin silty clay 08/22/02 10/05/06 12 2 2001 Sugarland Acres, Inc. Infield Coteau silt loam 08/09/02 10/05/06 38 2 2002 Blackberry Farms Infield Commerce silt loam 08/20/03 11/03/06 41 1 2002 Newton Cane, Inc. Nursery Moreland silt loam 08/15/03 10/05/06 41 1 2002 Sugarland Acres, Inc. Infield Coteau silt loam 08/19/03 11/16/06 41 1 2002 Landry Farms Nursery Commerce silt loam 08/21/03 10/10/06 41 1 2003 Ardoyne Farm-U.S.D.A Nursery Commerce silt loam 10/16/03 10/25/06 35 1 2003 Iberia Research Station Nursery Baldwin silty clay 10/21/03 11/02/06 35 1 2003 Sugar Research Station Nursery Sharkey clay 10/09/03 10/12/06 35 1 2003 Blackberry Farms Infield Commerce silt loam 08/17/04 12/04/06 40 2 2003 Newton Cane, Inc. Nursery Moreland silt loam 08/31/04 10/11/06 40 2 2003 D & N Farm Nursery Baldwin silty clay 08/26/04 10/05/06 14 1 2003 Sugarland Acres, Inc. Infield Coteau silt loam 08/19/04 11/16/06 40 2 2003 Landry Farms Nursery Commerce silt loam 08/18/04 11/14/06 40 2 2004 Ardoyne Farm-U.S.D.A Nursery Commerce silt loam 10/19/04 11/30/06 37 3 2004 Iberia Research Station Nursery Baldwin silty clay 10/27/04 12/04/06 37 3 2004 Sugar Research Station Nursery Commerce silt loam 10/18/04 11/06/06 37 3 2004 Blackberry Farms Infield Commerce silt loam 08/12/05 12/07/06 50 13 2004 Landry Farms Nursery Commerce silt loam 08/18/05 12/07/06 50 13 2004 Sugarland Acres, Inc. Infield Coteau silt loam 08/19/05 12/04/06 50 13 2004 Newton Cane, Inc. Nursery Moreland silt loam 08/25/05 12/11/06 50 13 2005 Sugar Research Station Nursery Commerce silt loam 10/25/05 12/05/06 35 15 2005 Ardoyne Farm-U.S.D.A Nursery Commerce silt loam 10/26/05 12/13/06 35 15 2005 Iberia Research Station Nursery Baldwin silty clay 10/28/05 12/04/06 35 15 2006 Sugarland Acres, Inc. Infield Coteau silt loam 08/15/06 2006 Blackberry Farms Infield Commerce silt loam 08/16/06 2006 Newton Cane, Inc. Nursery Moreland silt loam 08/22/06 2006 Justin Frederick Farms Nursery Baldwin silty clay 08/24/06 2006 Landry Farms Nursery Commerce silt loam 09/29/06 2006 Sugar Research Station Nursery Sharkey clay 10/10/06 2006 Ardoyne Farm-U.S.D.A Nursery Commerce silt loam 10/25/06 2006 Iberia Research Station Nursery Baldwin silty clay 11/01/06
† Ardoyne-U.S.D.A. Ardoyne Farm (Chacahoula), Blackberry Farms (Vacherie), Iberia Research Station (Jeanerette), Newton Cane, Inc. (Bunkie), Sugar Research Station (St. Gabriel), D & N Farm (Cecelia), Sugarland Acres Inc. (Youngsville), Landry Farms (Paincourtville).

54
Table 2. Infield third-stubble means of the 2001 “HoCP” and “L” assignment series on a Commerce silt loam soil at Blackberry Farms in Vacherie, Louisiana in 2006. Sugar Cane Sugar Stalk Stalk Variety per Acre Yield Per Ton Weight Number Fiber (lbs/A) (tons/A) (lbs/ton) (lbs) (stalks/A) (%)
LCP85-384 7712 29.3 265 1.57 38230 11.6 HoCP85-845 245 1.94 14.4 +HoCP91-555 9295 + 35.2 264 1.42 50368 12.7 L01-283 12419 + 45.7 + 272 1.55 59432 11.3 L01-299 13610 + 47.8 + 285 1.94 49488 11.7
Table 3. Nursery third-stubble means of the 2001 “HoCP” and “L” assignment series on a Moreland silt loam soil at Newton Cane, Inc. in Bunkie, Louisiana in 2006.
Table 4. Nursery third-stubble means of the 2001 “L” assignment series on a Baldwin silty clay soil at D& N Farm in Cecilia, Louisiana in 2006.
Table 5. Infield third-stubble means of the 2001 “HoCP” and “L” assignment series on a Coteau silt loam soil at Sugarland Acres, Inc. in Youngsville, Louisiana in 2006. Sugar Cane Sugar Stalk Stalk Variety per Acre Yield Per Ton Weight Number Fiber (lbs/A) (tons/A) (lbs/ton) (lbs) (stalks/A) (%)
LCP85-384 5549 30.6 182 1.31 47410 11.3 HoCP85-845 6267 32.0 196 1.47 43609 12.5 +HoCP91-555 5366 28.4 189 1.37 42269 11.9 +L01-283 8602 + 41.6 + 207 1.53 54559 11.4 L01-299 9198 + 46.2 + 201 1.99 46524 12.2 +
Sugar Cane Sugar Stalk Stalk Variety per Acre Yield Per Ton Weight Number (lbs/A) (tons/A) (lbs/ton) (lbs) (stalks/A)
LCP85-384 5835 29.1 202 1.30 44286 HoCP85-845 9315 44.8 + 206 1.83 48824 HoCP91-555 7205 34.9 201 1.51 45738 L01-283 11675 53.6 + 217 1.75 60984 + L01-299 10907 52.8 + 206 1.56 67881 +
Sugar Cane Sugar Stalk Stalk Variety per Acre Yield Per Ton Weight Number (lbs/A) (tons/A) (lbs/ton) (lbs) (stalks/A)
LCP85-384 3933 24.7 160 1.06 46464 HoCP85-845 2796 16.3 - 170 0.91 35756 HoCP91-555 3666 21.3 171 1.10 38841 L01-283 4973 25.0 199 1.09 46101 L01-299 3846 22.9 167 0.91 50639
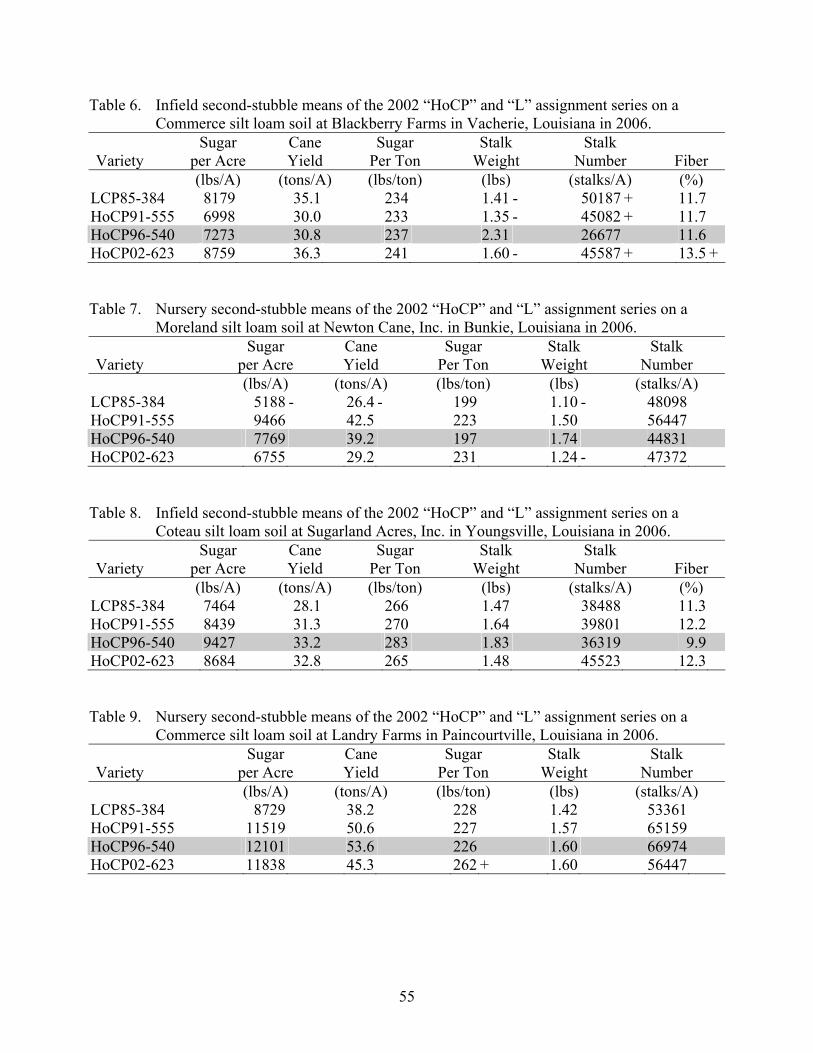
55
Table 6. Infield second-stubble means of the 2002 “HoCP” and “L” assignment series on a Commerce silt loam soil at Blackberry Farms in Vacherie, Louisiana in 2006. Sugar Cane Sugar Stalk Stalk Variety per Acre Yield Per Ton Weight Number Fiber (lbs/A) (tons/A) (lbs/ton) (lbs) (stalks/A) (%)
LCP85-384 8179 35.1 234 1.41 - 50187 + 11.7 HoCP91-555 6998 30.0 233 1.35 - 45082 + 11.7 HoCP96-540 7273 30.8 237 2.31 26677 11.6 HoCP02-623 8759 36.3 241 1.60 - 45587 + 13.5 +
Table 7. Nursery second-stubble means of the 2002 “HoCP” and “L” assignment series on a Moreland silt loam soil at Newton Cane, Inc. in Bunkie, Louisiana in 2006. Sugar Cane Sugar Stalk Stalk Variety per Acre Yield Per Ton Weight Number (lbs/A) (tons/A) (lbs/ton) (lbs) (stalks/A)
LCP85-384 5188 - 26.4 - 199 1.10 - 48098 HoCP91-555 9466 42.5 223 1.50 56447 HoCP96-540 7769 39.2 197 1.74 44831 HoCP02-623 6755 29.2 231 1.24 - 47372
Table 8. Infield second-stubble means of the 2002 “HoCP” and “L” assignment series on a Coteau silt loam soil at Sugarland Acres, Inc. in Youngsville, Louisiana in 2006. Sugar Cane Sugar Stalk Stalk Variety per Acre Yield Per Ton Weight Number Fiber (lbs/A) (tons/A) (lbs/ton) (lbs) (stalks/A) (%)
LCP85-384 7464 28.1 266 1.47 38488 11.3 HoCP91-555 8439 31.3 270 1.64 39801 12.2 HoCP96-540 9427 33.2 283 1.83 36319 9.9 HoCP02-623 8684 32.8 265 1.48 45523 12.3
Table 9. Nursery second-stubble means of the 2002 “HoCP” and “L” assignment series on a Commerce silt loam soil at Landry Farms in Paincourtville, Louisiana in 2006.
Sugar Cane Sugar Stalk Stalk Variety per Acre Yield Per Ton Weight Number (lbs/A) (tons/A) (lbs/ton) (lbs) (stalks/A)
LCP85-384 8729 38.2 228 1.42 53361 HoCP91-555 11519 50.6 227 1.57 65159 HoCP96-540 12101 53.6 226 1.60 66974 HoCP02-623 11838 45.3 262 + 1.60 56447

56
Table 10. Infield first-stubble means of the 2003 “HoCP” and “L” assignment series on a Commerce silt loam soil at Blackberry Farms in Vacherie, Louisiana in 2006. Sugar Cane Sugar Stalk Stalk Variety per Acre Yield Per Ton Weight Number Fiber (lbs/A) (tons/A) (lbs/ton) (lbs) (stalks/A) (%)
LCP85-384 9366 37.2 250 1.88 39589 11.0 HoCP91-555 8851 33.9 261 1.94 34983 12.7 +Ho95-988 10064 40.0 252 2.31 34940 12.1 +HoCP96-540 11095 44.1 252 2.54 34694 10.9 L97-128 10251 39.6 259 2.32 34318 12.1 +L03-371 10114 38.3 263 2.21 34873 10.0 - HoCP03-743 8202 29.1 281 2.28 25473 10.6 Table 11. Nursery first-stubble means of the 2003 “HoCP” and “L” assignment series on a Moreland silt loam soil at Newton Cane, Inc. in Bunkie, Louisiana in 2006. Sugar Cane Sugar Stalk Stalk Variety per Acre Yield Per Ton Weight Number (lbs/A) (tons/A) (lbs/ton) (lbs) (stalks/A)
LCP85-384 5225 19.2 273 1.35 28496 HoCP91-555 9227 36.7 251 1.64 45012 Ho95-988 9548 36.6 262 1.65 44286 HoCP96-540 9200 36.6 251 1.57 46646 L97-128 8023 29.5 272 1.70 35211 L03-371 9208 32.0 288 1.78 35393 HoCP03-743 7286 27.5 262 1.57 34667 Table 12. Nursery first-stubble means of the 2003 “L” assignment series on a Baldwin silty clay soil at D & N Farm in Cecilia, Louisiana in 2006. Sugar Cane Sugar Stalk Stalk Variety per Acre Yield Per Ton Weight Number (lbs/A) (tons/A) (lbs/ton) (lbs) (stalks/A)
LCP85-384 3207 16.5 194 1.21 27407 HoCP91-555 4122 19.9 202 1.13 34848 Ho95-988 4708 24.2 194 1.33 36300 HoCP96-540 5893 30.4 195 1.60 37752 L97-128 5437 24.0 226 1.40 34304 L03-371 5621 29.0 196 1.79 32307
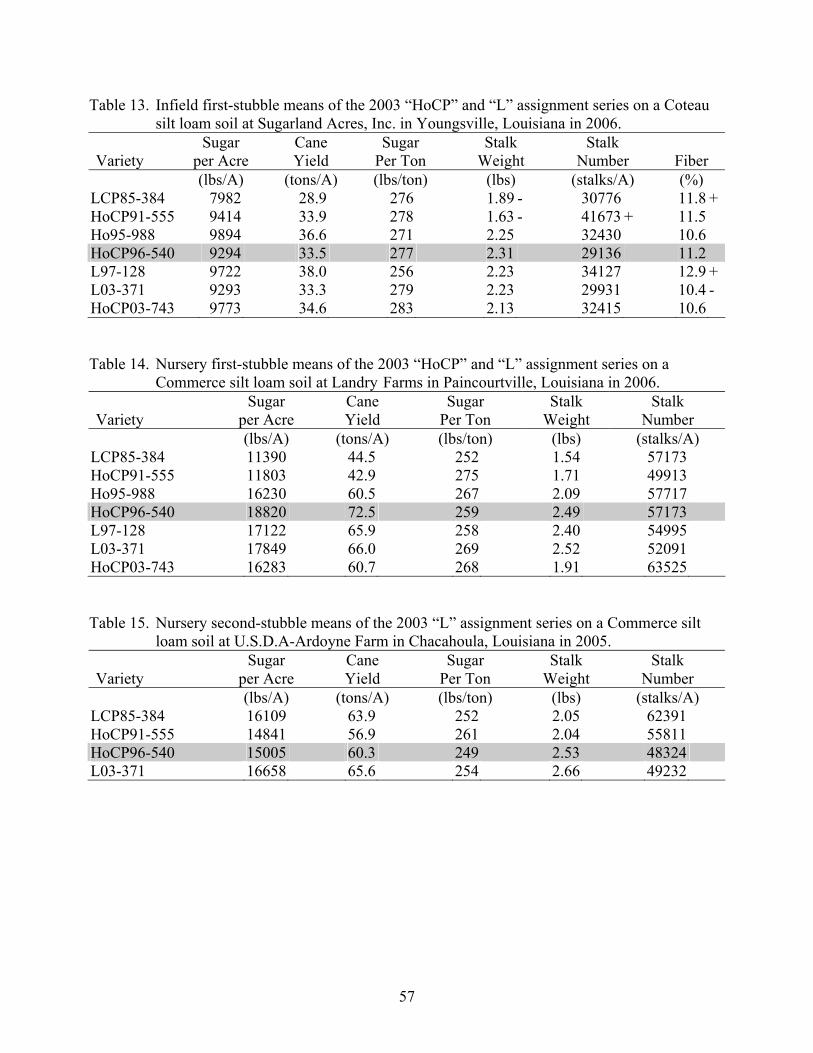
57
Table 13. Infield first-stubble means of the 2003 “HoCP” and “L” assignment series on a Coteau silt loam soil at Sugarland Acres, Inc. in Youngsville, Louisiana in 2006. Sugar Cane Sugar Stalk Stalk Variety per Acre Yield Per Ton Weight Number Fiber (lbs/A) (tons/A) (lbs/ton) (lbs) (stalks/A) (%)
LCP85-384 7982 28.9 276 1.89 - 30776 11.8 +HoCP91-555 9414 33.9 278 1.63 - 41673 + 11.5 Ho95-988 9894 36.6 271 2.25 32430 10.6 HoCP96-540 9294 33.5 277 2.31 29136 11.2 L97-128 9722 38.0 256 2.23 34127 12.9 +L03-371 9293 33.3 279 2.23 29931 10.4 - HoCP03-743 9773 34.6 283 2.13 32415 10.6 Table 14. Nursery first-stubble means of the 2003 “HoCP” and “L” assignment series on a Commerce silt loam soil at Landry Farms in Paincourtville, Louisiana in 2006. Sugar Cane Sugar Stalk Stalk Variety per Acre Yield Per Ton Weight Number (lbs/A) (tons/A) (lbs/ton) (lbs) (stalks/A)
LCP85-384 11390 44.5 252 1.54 57173 HoCP91-555 11803 42.9 275 1.71 49913 Ho95-988 16230 60.5 267 2.09 57717 HoCP96-540 18820 72.5 259 2.49 57173 L97-128 17122 65.9 258 2.40 54995 L03-371 17849 66.0 269 2.52 52091 HoCP03-743 16283 60.7 268 1.91 63525
Table 15. Nursery second-stubble means of the 2003 “L” assignment series on a Commerce silt loam soil at U.S.D.A-Ardoyne Farm in Chacahoula, Louisiana in 2005. Sugar Cane Sugar Stalk Stalk Variety per Acre Yield Per Ton Weight Number (lbs/A) (tons/A) (lbs/ton) (lbs) (stalks/A)
LCP85-384 16109 63.9 252 2.05 62391 HoCP91-555 14841 56.9 261 2.04 55811 HoCP96-540 15005 60.3 249 2.53 48324 L03-371 16658 65.6 254 2.66 49232
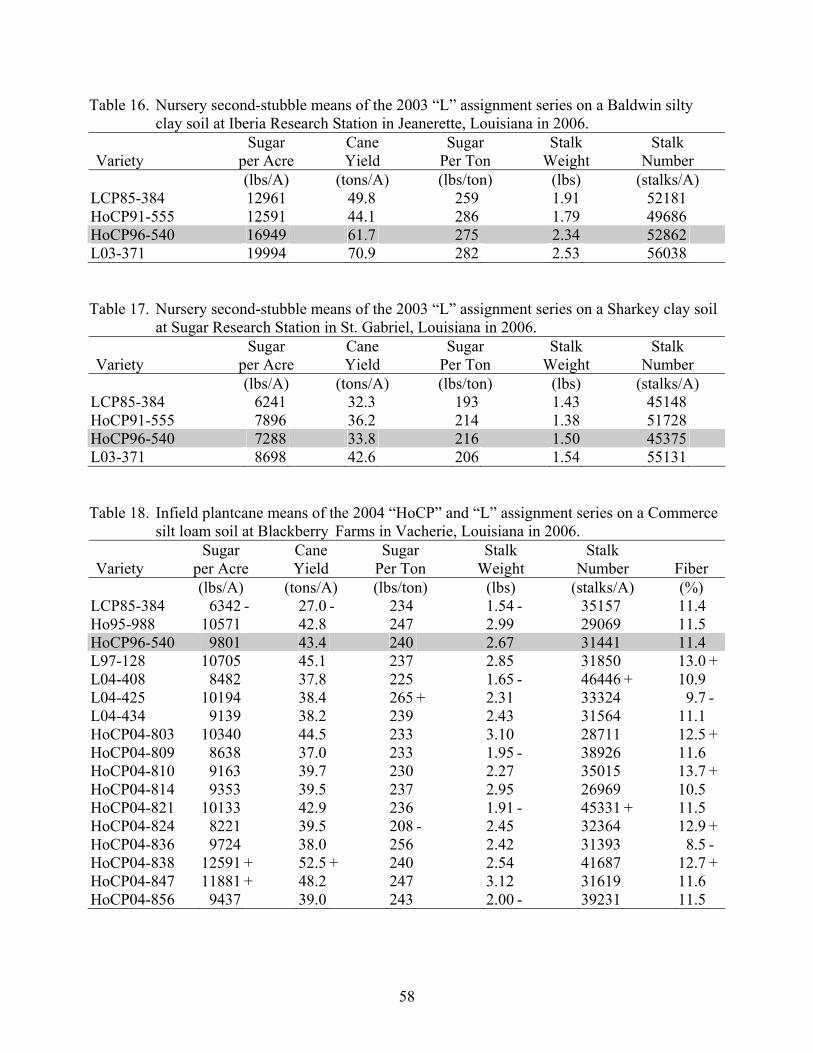
58
Table 16. Nursery second-stubble means of the 2003 “L” assignment series on a Baldwin silty clay soil at Iberia Research Station in Jeanerette, Louisiana in 2006. Sugar Cane Sugar Stalk Stalk Variety per Acre Yield Per Ton Weight Number (lbs/A) (tons/A) (lbs/ton) (lbs) (stalks/A)
LCP85-384 12961 49.8 259 1.91 52181 HoCP91-555 12591 44.1 286 1.79 49686 HoCP96-540 16949 61.7 275 2.34 52862 L03-371 19994 70.9 282 2.53 56038 Table 17. Nursery second-stubble means of the 2003 “L” assignment series on a Sharkey clay soil at Sugar Research Station in St. Gabriel, Louisiana in 2006. Sugar Cane Sugar Stalk Stalk Variety per Acre Yield Per Ton Weight Number (lbs/A) (tons/A) (lbs/ton) (lbs) (stalks/A)
LCP85-384 6241 32.3 193 1.43 45148 HoCP91-555 7896 36.2 214 1.38 51728 HoCP96-540 7288 33.8 216 1.50 45375 L03-371 8698 42.6 206 1.54 55131 Table 18. Infield plantcane means of the 2004 “HoCP” and “L” assignment series on a Commerce silt loam soil at Blackberry Farms in Vacherie, Louisiana in 2006. Sugar Cane Sugar Stalk Stalk Variety per Acre Yield Per Ton Weight Number Fiber (lbs/A) (tons/A) (lbs/ton) (lbs) (stalks/A) (%)
LCP85-384 6342 - 27.0 - 234 1.54 - 35157 11.4 Ho95-988 10571 42.8 247 2.99 29069 11.5 HoCP96-540 9801 43.4 240 2.67 31441 11.4 L97-128 10705 45.1 237 2.85 31850 13.0 +L04-408 8482 37.8 225 1.65 - 46446 + 10.9 L04-425 10194 38.4 265 + 2.31 33324 9.7 - L04-434 9139 38.2 239 2.43 31564 11.1 HoCP04-803 10340 44.5 233 3.10 28711 12.5 +HoCP04-809 8638 37.0 233 1.95 - 38926 11.6 HoCP04-810 9163 39.7 230 2.27 35015 13.7 +HoCP04-814 9353 39.5 237 2.95 26969 10.5 HoCP04-821 10133 42.9 236 1.91 - 45331 + 11.5 HoCP04-824 8221 39.5 208 - 2.45 32364 12.9 +HoCP04-836 9724 38.0 256 2.42 31393 8.5 - HoCP04-838 12591 + 52.5 + 240 2.54 41687 12.7 +HoCP04-847 11881 + 48.2 247 3.12 31619 11.6 HoCP04-856 9437 39.0 243 2.00 - 39231 11.5
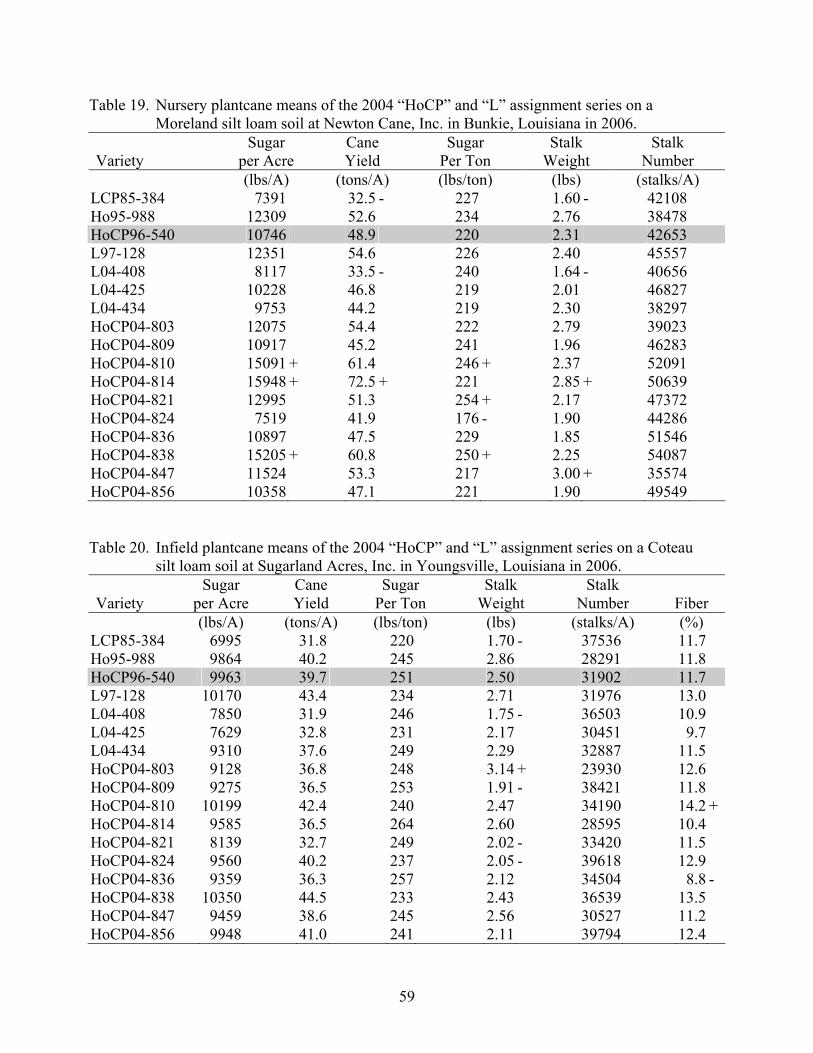
59
Table 19. Nursery plantcane means of the 2004 “HoCP” and “L” assignment series on a Moreland silt loam soil at Newton Cane, Inc. in Bunkie, Louisiana in 2006. Sugar Cane Sugar Stalk Stalk Variety per Acre Yield Per Ton Weight Number (lbs/A) (tons/A) (lbs/ton) (lbs) (stalks/A)
LCP85-384 7391 32.5 - 227 1.60 - 42108 Ho95-988 12309 52.6 234 2.76 38478 HoCP96-540 10746 48.9 220 2.31 42653 L97-128 12351 54.6 226 2.40 45557 L04-408 8117 33.5 - 240 1.64 - 40656 L04-425 10228 46.8 219 2.01 46827 L04-434 9753 44.2 219 2.30 38297 HoCP04-803 12075 54.4 222 2.79 39023 HoCP04-809 10917 45.2 241 1.96 46283 HoCP04-810 15091 + 61.4 246 + 2.37 52091 HoCP04-814 15948 + 72.5 + 221 2.85 + 50639 HoCP04-821 12995 51.3 254 + 2.17 47372 HoCP04-824 7519 41.9 176 - 1.90 44286 HoCP04-836 10897 47.5 229 1.85 51546 HoCP04-838 15205 + 60.8 250 + 2.25 54087 HoCP04-847 11524 53.3 217 3.00 + 35574 HoCP04-856 10358 47.1 221 1.90 49549 Table 20. Infield plantcane means of the 2004 “HoCP” and “L” assignment series on a Coteau silt loam soil at Sugarland Acres, Inc. in Youngsville, Louisiana in 2006. Sugar Cane Sugar Stalk Stalk Variety per Acre Yield Per Ton Weight Number Fiber (lbs/A) (tons/A) (lbs/ton) (lbs) (stalks/A) (%)
LCP85-384 6995 31.8 220 1.70 - 37536 11.7 Ho95-988 9864 40.2 245 2.86 28291 11.8 HoCP96-540 9963 39.7 251 2.50 31902 11.7 L97-128 10170 43.4 234 2.71 31976 13.0 L04-408 7850 31.9 246 1.75 - 36503 10.9 L04-425 7629 32.8 231 2.17 30451 9.7 L04-434 9310 37.6 249 2.29 32887 11.5 HoCP04-803 9128 36.8 248 3.14 + 23930 12.6 HoCP04-809 9275 36.5 253 1.91 - 38421 11.8 HoCP04-810 10199 42.4 240 2.47 34190 14.2 +HoCP04-814 9585 36.5 264 2.60 28595 10.4 HoCP04-821 8139 32.7 249 2.02 - 33420 11.5 HoCP04-824 9560 40.2 237 2.05 - 39618 12.9 HoCP04-836 9359 36.3 257 2.12 34504 8.8 - HoCP04-838 10350 44.5 233 2.43 36539 13.5 HoCP04-847 9459 38.6 245 2.56 30527 11.2 HoCP04-856 9948 41.0 241 2.11 39794 12.4

60
Table 21. Nursery plantcane means of the 2004 “HoCP” and “L” assignment series on a Commerce silt loam soil at Landry Farms in Paincourtville, Louisiana in 2006. Sugar Cane Sugar Stalk Stalk Variety per Acre Yield Per Ton Weight Number (lbs/A) (tons/A) (lbs/ton) (lbs) (stalks/A)
LCP85-384 12477 - 50.3 248 2.12 - 47735 Ho95-988 14332 54.9 261 2.18 - 50276 + HoCP96-540 15969 60.5 264 2.88 42108 L97-128 17425 69.4 251 3.03 45738 L04-408 10082 - 38.4 - 262 1.76 - 43560 L04-425 13364 55.2 244 2.54 43379 L04-434 10947 - 43.0 - 255 2.15 - 40112 HoCP04-803 17104 66.0 259 3.26 40475 HoCP04-809 13393 49.0 274 1.92 - 51002 + HoCP04-810 11674 - 46.5 - 251 1.87 - 49913 + HoCP04-814 14467 61.1 238 2.99 41564 HoCP04-821 12237 - 45.5 - 274 1.77 - 51002 + HoCP04-824 16153 60.7 266 2.14 - 57354 + HoCP04-836 10385 - 47.7 - 217 2.04 - 47190 HoCP04-838 16253 61.6 263 2.27 54632 + HoCP04-847 17003 67.6 252 3.06 44105 HoCP04-856 12649 47.1 - 268 1.81 - 52090 + Table 22. Nursery first-stubble means of the 2004 “L” assignment series on a Commerce silt loam soil at U.S.D.A-Ardoyne Farm in Chacahoula, Louisiana in 2006. Sugar Cane Sugar Stalk Stalk Variety per Acre Yield Per Ton Weight Number (lbs/A) (tons/A) (lbs/ton) (lbs) (stalks/A)
LCP85-384 16456 65.1 252 2.03 64659 Ho95-988 21369 81.9 260 2.68 61256 HoCP96-540 23787 90.2 264 3.04 59441 L97-128 20175 74.4 271 3.21 46283 L04-408 15377 58.0 264 1.83 63071 L04-425 16570 67.2 245 2.54 53089 L04-434 15124 57.1 257 2.38 46283
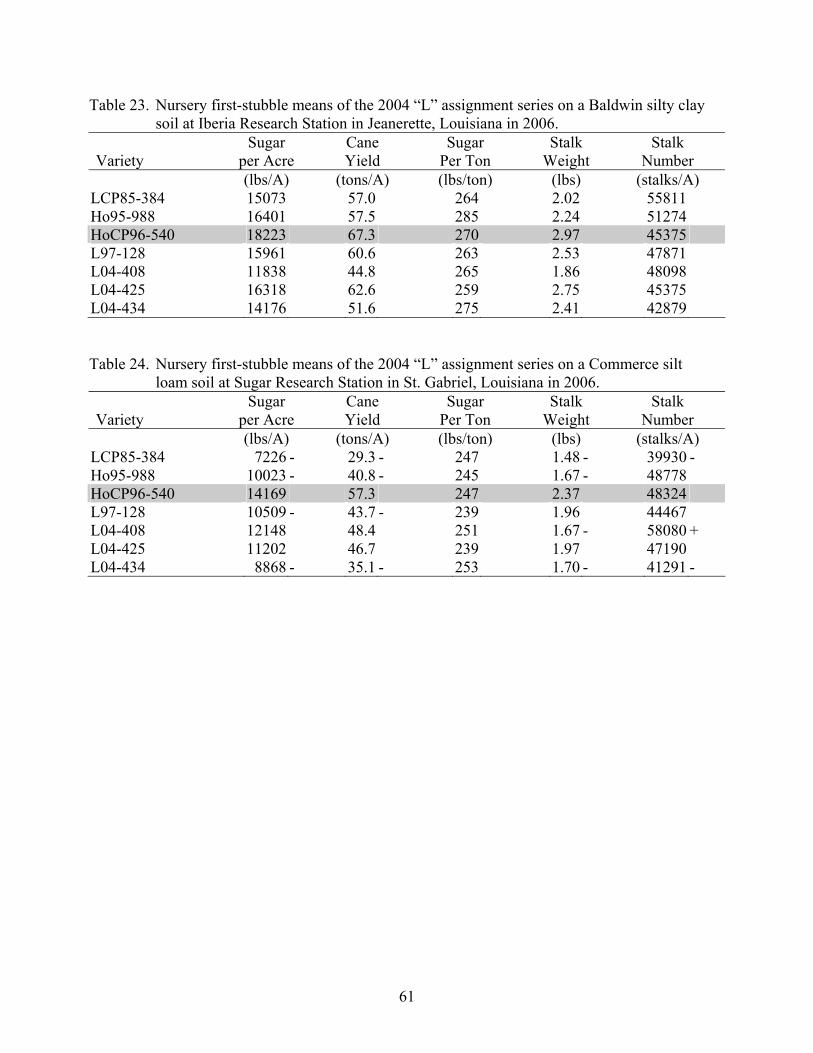
61
Table 23. Nursery first-stubble means of the 2004 “L” assignment series on a Baldwin silty clay soil at Iberia Research Station in Jeanerette, Louisiana in 2006. Sugar Cane Sugar Stalk Stalk Variety per Acre Yield Per Ton Weight Number (lbs/A) (tons/A) (lbs/ton) (lbs) (stalks/A)
LCP85-384 15073 57.0 264 2.02 55811 Ho95-988 16401 57.5 285 2.24 51274 HoCP96-540 18223 67.3 270 2.97 45375 L97-128 15961 60.6 263 2.53 47871 L04-408 11838 44.8 265 1.86 48098 L04-425 16318 62.6 259 2.75 45375 L04-434 14176 51.6 275 2.41 42879 Table 24. Nursery first-stubble means of the 2004 “L” assignment series on a Commerce silt loam soil at Sugar Research Station in St. Gabriel, Louisiana in 2006. Sugar Cane Sugar Stalk Stalk Variety per Acre Yield Per Ton Weight Number (lbs/A) (tons/A) (lbs/ton) (lbs) (stalks/A)
LCP85-384 7226 - 29.3 - 247 1.48 - 39930 - Ho95-988 10023 - 40.8 - 245 1.67 - 48778 HoCP96-540 14169 57.3 247 2.37 48324 L97-128 10509 - 43.7 - 239 1.96 44467 L04-408 12148 48.4 251 1.67 - 58080 + L04-425 11202 46.7 239 1.97 47190 L04-434 8868 - 35.1 - 253 1.70 - 41291 -

62
Table 25. Nursery plantcane means of the 2005 “L” assignment series on a Commerce silt loam soil at U.S.D.A-Ardoyne Farm in Chacahoula, Louisiana in 2006. Sugar Cane Sugar Stalk Stalk Variety per Acre Yield Per Ton Weight Number Fiber (lbs/A) (tons/A) (lbs/ton) (lbs) (stalks/A) (%)
LCP85-384 15333 60.9 252 2.50 48551 12.4 Ho95-988 15406 66.2 233 2.65 50366 10.7 HoCP96-540 15162 65.2 232 3.16 41291 11.8 L97-128 16095 67.5 237 3.10 43560 13.2 L05-441 12838 51.7 249 2.13 49232 12.9 L05-442 12501 46.7 268 + 2.25 41518 12.0 L05-445 14034 54.5 257 + 2.47 44241 12.7 L05-447 13057 54.8 238 2.33 46963 14.1 +L05-448 16172 69.3 233 3.05 45829 13.5 +L05-450 16418 73.9 222 3.27 45148 13.8 +L05-451 14699 60.0 245 2.69 44694 11.3 L05-453 14232 58.8 244 2.78 42199 11.7 L05-456 13809 58.8 235 2.32 50593 12.7 L05-457 14360 60.8 237 2.49 48778 14.2 +L05-459 13991 59.9 233 2.28 52635 11.7 L05-460 14863 54.8 271 + 2.27 48324 10.9 L05-466 13159 53.6 245 2.57 41745 13.3 L05-470 11055 45.7 241 2.22 41291 12.2 L05-474 10779 52.5 204 - 2.40 43787 11.7

63
Table 26. Nursery plantcane means of the 2005 “L” assignment series on a Baldwin silty clay soil at Iberia Research Station in Jeanerette, Louisiana in 2006. Sugar Cane Sugar Stalk Stalk Variety per Acre Yield Per Ton Weight Number (lbs/A) (tons/A) (lbs/ton) (lbs) (stalks/A)
LCP85-384 10222 38.8 264 1.86 41518 Ho95-988 12674 47.5 268 2.22 43106 HoCP96-540 11271 42.7 264 2.26 37888 L97-128 11593 43.0 270 2.20 39023 L05-441 9262 34.9 266 1.75 39930 L05-442 10765 38.7 279 1.93 40157 L05-445 8944 33.8 265 1.90 35619 L05-447 9099 33.6 269 1.52 44241 L05-448 11551 45.5 254 2.38 38342 L05-450 12062 48.6 248 2.70 36300 L05-451 10493 38.9 270 2.01 39023 L05-453 7832 33.1 234 1.60 41291 L05-456 8245 32.3 257 1.60 40384 L05-457 14148 57.1 251 1.89 59895 + L05-459 10859 43.3 251 1.89 45829 L05-460 9461 31.8 298 1.65 38569 L05-466 10849 42.0 260 1.88 44241 L05-470 8863 32.8 270 1.46 45148 L05-474 11054 47.4 234 2.32 41064
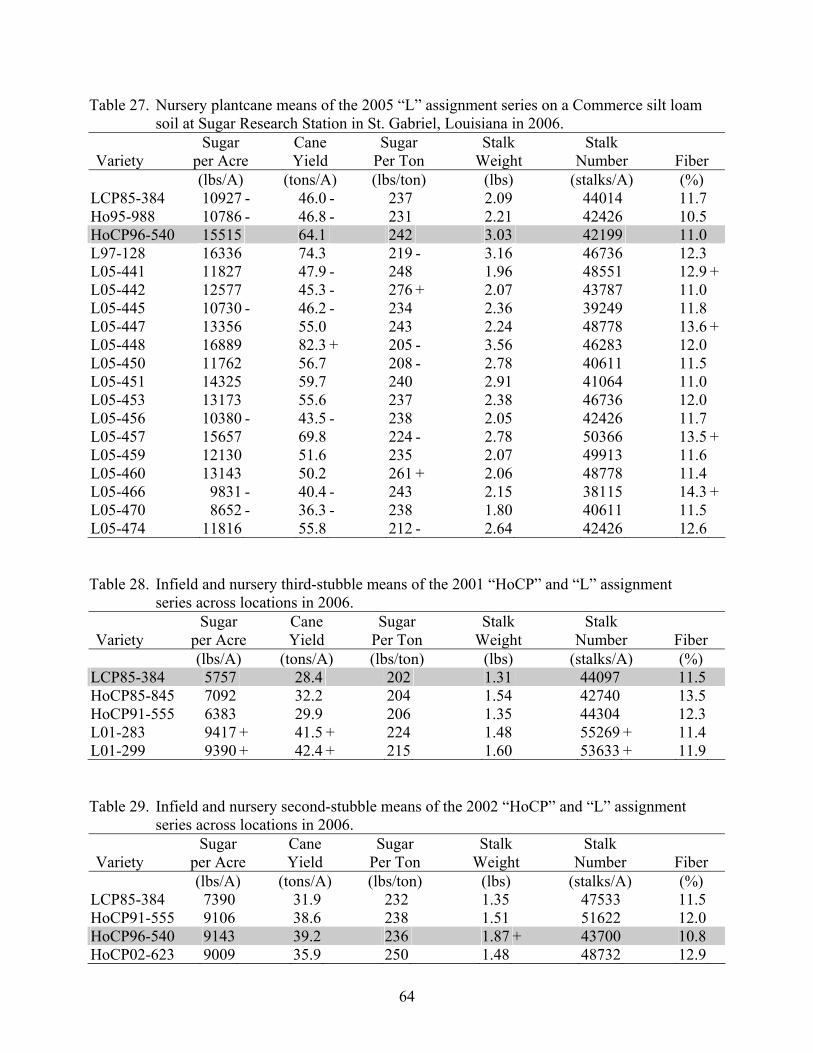
64
Table 27. Nursery plantcane means of the 2005 “L” assignment series on a Commerce silt loam soil at Sugar Research Station in St. Gabriel, Louisiana in 2006. Sugar Cane Sugar Stalk Stalk Variety per Acre Yield Per Ton Weight Number Fiber (lbs/A) (tons/A) (lbs/ton) (lbs) (stalks/A) (%)
LCP85-384 10927 - 46.0 - 237 2.09 44014 11.7 Ho95-988 10786 - 46.8 - 231 2.21 42426 10.5 HoCP96-540 15515 64.1 242 3.03 42199 11.0 L97-128 16336 74.3 219 - 3.16 46736 12.3 L05-441 11827 47.9 - 248 1.96 48551 12.9 +L05-442 12577 45.3 - 276 + 2.07 43787 11.0 L05-445 10730 - 46.2 - 234 2.36 39249 11.8 L05-447 13356 55.0 243 2.24 48778 13.6 +L05-448 16889 82.3 + 205 - 3.56 46283 12.0 L05-450 11762 56.7 208 - 2.78 40611 11.5 L05-451 14325 59.7 240 2.91 41064 11.0 L05-453 13173 55.6 237 2.38 46736 12.0 L05-456 10380 - 43.5 - 238 2.05 42426 11.7 L05-457 15657 69.8 224 - 2.78 50366 13.5 +L05-459 12130 51.6 235 2.07 49913 11.6 L05-460 13143 50.2 261 + 2.06 48778 11.4 L05-466 9831 - 40.4 - 243 2.15 38115 14.3 +L05-470 8652 - 36.3 - 238 1.80 40611 11.5 L05-474 11816 55.8 212 - 2.64 42426 12.6 Table 28. Infield and nursery third-stubble means of the 2001 “HoCP” and “L” assignment series across locations in 2006. Sugar Cane Sugar Stalk Stalk Variety per Acre Yield Per Ton Weight Number Fiber (lbs/A) (tons/A) (lbs/ton) (lbs) (stalks/A) (%)
LCP85-384 5757 28.4 202 1.31 44097 11.5 HoCP85-845 7092 32.2 204 1.54 42740 13.5 HoCP91-555 6383 29.9 206 1.35 44304 12.3 L01-283 9417 + 41.5 + 224 1.48 55269 + 11.4 L01-299 9390 + 42.4 + 215 1.60 53633 + 11.9
Table 29. Infield and nursery second-stubble means of the 2002 “HoCP” and “L” assignment series across locations in 2006. Sugar Cane Sugar Stalk Stalk Variety per Acre Yield Per Ton Weight Number Fiber (lbs/A) (tons/A) (lbs/ton) (lbs) (stalks/A) (%)
LCP85-384 7390 31.9 232 1.35 47533 11.5 HoCP91-555 9106 38.6 238 1.51 51622 12.0 HoCP96-540 9143 39.2 236 1.87 + 43700 10.8 HoCP02-623 9009 35.9 250 1.48 48732 12.9
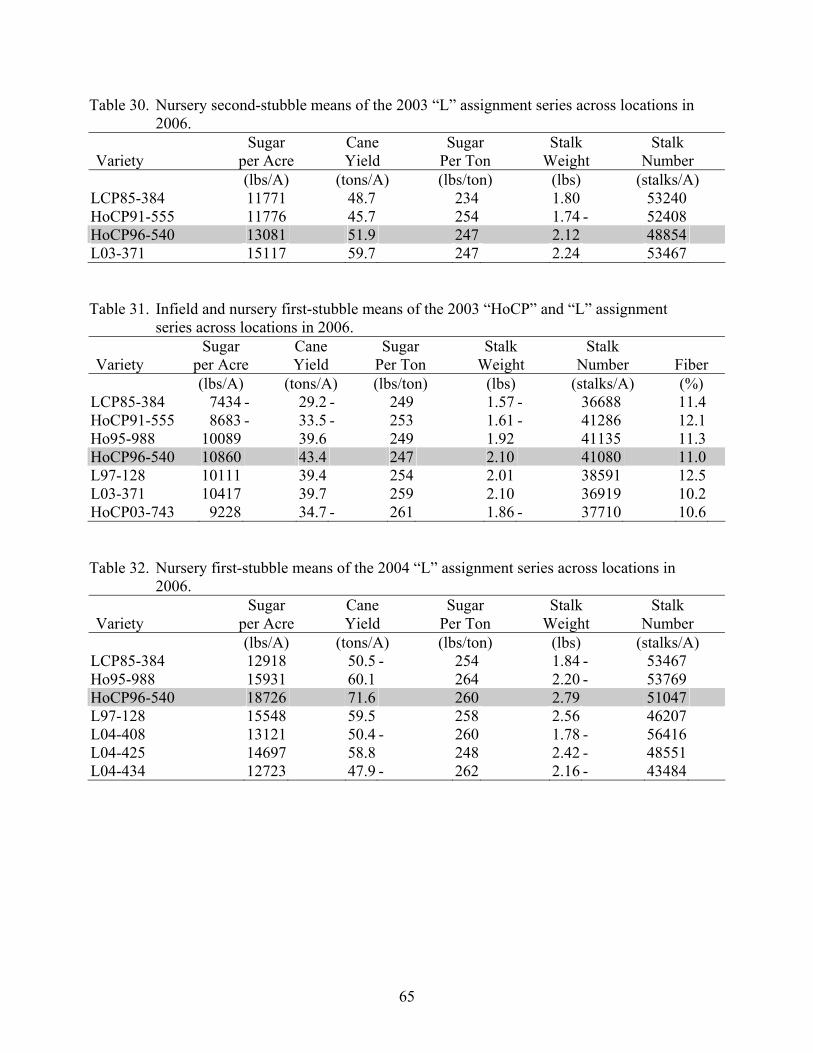
65
Table 30. Nursery second-stubble means of the 2003 “L” assignment series across locations in 2006. Sugar Cane Sugar Stalk Stalk Variety per Acre Yield Per Ton Weight Number (lbs/A) (tons/A) (lbs/ton) (lbs) (stalks/A)
LCP85-384 11771 48.7 234 1.80 53240 HoCP91-555 11776 45.7 254 1.74 - 52408 HoCP96-540 13081 51.9 247 2.12 48854 L03-371 15117 59.7 247 2.24 53467
Table 31. Infield and nursery first-stubble means of the 2003 “HoCP” and “L” assignment series across locations in 2006. Sugar Cane Sugar Stalk Stalk Variety per Acre Yield Per Ton Weight Number Fiber (lbs/A) (tons/A) (lbs/ton) (lbs) (stalks/A) (%)
LCP85-384 7434 - 29.2 - 249 1.57 - 36688 11.4 HoCP91-555 8683 - 33.5 - 253 1.61 - 41286 12.1 Ho95-988 10089 39.6 249 1.92 41135 11.3 HoCP96-540 10860 43.4 247 2.10 41080 11.0 L97-128 10111 39.4 254 2.01 38591 12.5 L03-371 10417 39.7 259 2.10 36919 10.2 HoCP03-743 9228 34.7 - 261 1.86 - 37710 10.6 Table 32. Nursery first-stubble means of the 2004 “L” assignment series across locations in
2006. Sugar Cane Sugar Stalk Stalk Variety per Acre Yield Per Ton Weight Number (lbs/A) (tons/A) (lbs/ton) (lbs) (stalks/A)
LCP85-384 12918 50.5 - 254 1.84 - 53467 Ho95-988 15931 60.1 264 2.20 - 53769 HoCP96-540 18726 71.6 260 2.79 51047 L97-128 15548 59.5 258 2.56 46207 L04-408 13121 50.4 - 260 1.78 - 56416 L04-425 14697 58.8 248 2.42 - 48551 L04-434 12723 47.9 - 262 2.16 - 43484
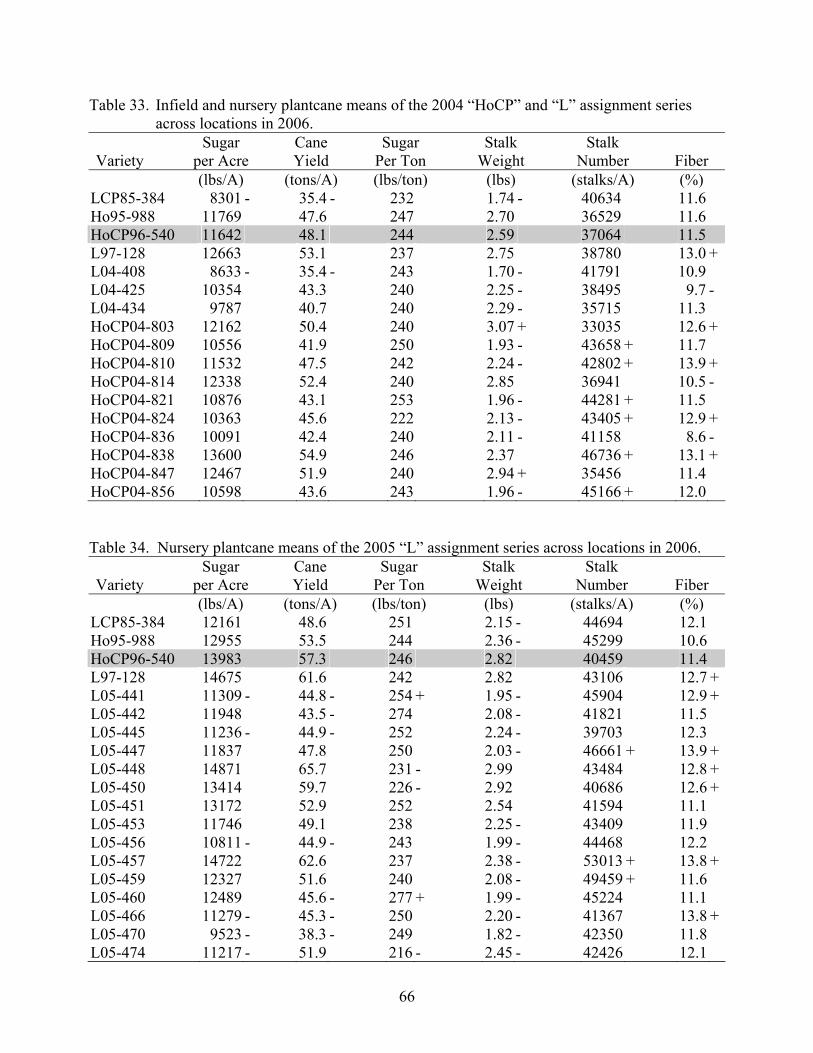
66
Table 33. Infield and nursery plantcane means of the 2004 “HoCP” and “L” assignment series across locations in 2006. Sugar Cane Sugar Stalk Stalk Variety per Acre Yield Per Ton Weight Number Fiber (lbs/A) (tons/A) (lbs/ton) (lbs) (stalks/A) (%)
LCP85-384 8301 - 35.4 - 232 1.74 - 40634 11.6 Ho95-988 11769 47.6 247 2.70 36529 11.6 HoCP96-540 11642 48.1 244 2.59 37064 11.5 L97-128 12663 53.1 237 2.75 38780 13.0 +L04-408 8633 - 35.4 - 243 1.70 - 41791 10.9 L04-425 10354 43.3 240 2.25 - 38495 9.7 - L04-434 9787 40.7 240 2.29 - 35715 11.3 HoCP04-803 12162 50.4 240 3.07 + 33035 12.6 +HoCP04-809 10556 41.9 250 1.93 - 43658 + 11.7 HoCP04-810 11532 47.5 242 2.24 - 42802 + 13.9 +HoCP04-814 12338 52.4 240 2.85 36941 10.5 - HoCP04-821 10876 43.1 253 1.96 - 44281 + 11.5 HoCP04-824 10363 45.6 222 2.13 - 43405 + 12.9 +HoCP04-836 10091 42.4 240 2.11 - 41158 8.6 - HoCP04-838 13600 54.9 246 2.37 46736 + 13.1 +HoCP04-847 12467 51.9 240 2.94 + 35456 11.4 HoCP04-856 10598 43.6 243 1.96 - 45166 + 12.0 Table 34. Nursery plantcane means of the 2005 “L” assignment series across locations in 2006. Sugar Cane Sugar Stalk Stalk Variety per Acre Yield Per Ton Weight Number Fiber (lbs/A) (tons/A) (lbs/ton) (lbs) (stalks/A) (%)
LCP85-384 12161 48.6 251 2.15 - 44694 12.1 Ho95-988 12955 53.5 244 2.36 - 45299 10.6 HoCP96-540 13983 57.3 246 2.82 40459 11.4 L97-128 14675 61.6 242 2.82 43106 12.7 +L05-441 11309 - 44.8 - 254 + 1.95 - 45904 12.9 +L05-442 11948 43.5 - 274 2.08 - 41821 11.5 L05-445 11236 - 44.9 - 252 2.24 - 39703 12.3 L05-447 11837 47.8 250 2.03 - 46661 + 13.9 +L05-448 14871 65.7 231 - 2.99 43484 12.8 +L05-450 13414 59.7 226 - 2.92 40686 12.6 +L05-451 13172 52.9 252 2.54 41594 11.1 L05-453 11746 49.1 238 2.25 - 43409 11.9 L05-456 10811 - 44.9 - 243 1.99 - 44468 12.2 L05-457 14722 62.6 237 2.38 - 53013 + 13.8 +L05-459 12327 51.6 240 2.08 - 49459 + 11.6 L05-460 12489 45.6 - 277 + 1.99 - 45224 11.1 L05-466 11279 - 45.3 - 250 2.20 - 41367 13.8 +L05-470 9523 - 38.3 - 249 1.82 - 42350 11.8 L05-474 11217 - 51.9 216 - 2.45 - 42426 12.1
67
2006 LOUISIANA “HoCP” NURSERY & INFIELD VARIETY TRIALS Edwis Dufrene, Thomas Tew, and William White USDA-ARS, SRRC, SUGARCANE RESEARCH UNIT Houma, Louisiana
Three years after selection from single stools in the seedling stages, experimental
varieties advanced for further testing are assigned permanent “HoCP” or “Ho” numbers. These newly assigned varieties are routinely planted in replicated nursery trials at three locations (Ardoyne Farm in Schriever, Iberia Research Station in Jeanerette, and Sugar Research Station in St. Gabriel). During the year after assignment, varieties advanced for further testing are replanted in nursery trials located on three commercial sugarcane farms representing various regions of the sugarcane belt. Two years after assignment, active varieties are replanted in three infield tests (Ardoyne Farm and two additional farms). In addition, two years after assignment, varieties are introduced to outfield locations and primary stations.
USDA nursery test plots are planted during the year of assignment and consist of two
replications with sixteen-foot, single-row plots. There is a four-foot alleyway between plots. A minimum of three commercial varieties (LCP 85-384, HoCP 96-540, Ho 95-988, L 97-128 or L 99-226) are planted in each test for comparison purposes. Besides experimental commercial varieties, clones from the USDA Recurrent Selection for Borers (RSB) program are included in nursery trials. Yield data collected on RSB clones give breeders needed agronomic information to aid in deciding what crosses should be made with these borer-resistant clones. The year after assignment, varieties from the USDA program are combined with varieties from the LSU program and planted in nurseries on commercial farms. Plot length in these tests is 20 ft.
Nursery test plots are routinely rated for agronomic traits in the spring and summer each year. Stalk counts of mature, millable stalks are made in July or August. A 10-stalk sample is hand-cut from each plot during the harvest season. Samples from USDA nurseries are taken to the Juice and Milling Quality Laboratory at the USDA Ardoyne Farm, where they are weighed and processed for sucrose analysis. Brix and pol are used to estimate the yield of theoretical recoverable sugar (TRS) per ton of cane. Results from these analyses, combined with mature millable stalk counts and mean stalk weight, are used to calculate yield of sugar per acre, yield of cane per acre, and number of stalks per acre. Varieties with acceptable yields (both tonnage and sugar per ton) and disease and insect resistance are advanced for further testing.
Infield variety tests are planted at three locations (Ardoyne Farm & two commercial
farms) two years after assignment. Tests on commercial farms are conducted cooperatively with the LSU AgCenter sugarcane variety program. Infield tests are planted in a randomized complete block design with two replications, and include a minimum of four commercial varieties (LCP 85-384, Ho 95-988, HoCP 96-540, L 97-128, or L 99-226) for use as checks. Plot size in infield tests are two rows wide (twelve feet) by twenty-five feet long. A 10-stalk sample is hand-cut from each plot just prior to harvesting and sent to the sucrose lab at Ardoyne Farm for processing for sucrose and fiber analysis. Plots are weighed with a tractor-pulled weigh-wagon equipped with electronic load cells mounted in the axles and hitch. Plot weights and sucrose analysis are used

68
to estimate sugar per acre, tons of cane per acre, sugar per ton of cane, mean stalk weight, and number of stalks per acre. An estimate of fiber percentage is also obtained.
Planting and harvest dates of USDA infield and nursery tests can be found in Table 1.
Results from infield and nursery trials can be found in Tables 2 to 15. Statistical analyses were conducted for each test and for each series using PROC MIXED procedures in SAS (version 9.1). For purposes of comparison, HoCP 96-540 is highlighted in each table. Yield values which are significantly higher or lower (P=0.05) than values for HoCP 96-540 are noted with a “+” or “-“ respectively.
Table 1. 2006 Planting and harvest dates of “HoCP” nursery & infield tests. Harvest Dates
Series Location2/ Soil Texture 3/ Test type Planting Date 2004 2005 20062002 AFH Sc Infield 8/24/04 11/16 10/18 2003 AFL Csl Nursery 10/20/03 12/06 11/10 10/17 2003 IRS Bsc Nursery 10/21/03 11/19 11/18 11/01 2003 STG Sc Nursery 10/17/03 12/13 11/17 11/29 2003 AFH Sc Infield 9/14/05 11/07 2004 AFL Csl Nursery 10/20/04 11/22 10/26 2004 IRS Bsc Nursery 10/27/04 11/28 11/28 2004 STG Sc Nursery 10/21/04 12/01 11/29 2004 AFH Sc Infield 10/05/06 2005 AFL Csl Nursery 10/26/05 12/01 2005 IRS Bsc Nursery 10/28/05 12/08 2005 STG Sc Nursery 10/27/05 12/12 2006 AFL Csl Nursery 10/25/06 2006 IRS Bsc Nursery 11/01/06 2006 STG Sc Nursery 11/14/06
2/ AFH = Ardoyne Farm heavy soil, AFL = Ardoyne Farm Light soil in Schriever, IRS = Iberia Research Station in Jeanerette, STG = Sugar Research Station in St. Gabriel.
3/ Bsc = Baldwin silty clay, Csl = Commerce silt loam, Sc = Sharkey clay

69
Table 2. Infield first-stubble means of the 2002 “HoCP” assignment series on a Sharkey clay soil at Ardoyne Farm in Schriever, Louisiana in 2006. Sugar/ Tons/ Sugar/ Weight/ Stalks/ Variety acre acre ton stalk acre Fiber (lbs.) (tons) (lbs.) (lbs.) (no.) (%) LCP 85-384 8328 + 39.2 + 213 1.72 46346 11.2 HoCP 91-555 6988 31.8 220 1.45 - 44419 11.3 Ho 95-988 9433 + 41.7 + 226 2.13 39306 11.5 HoCP 96-540 7021 33.7 208 1.86 36246 11.0 L 97-128 7947 + 32.1 247 + 1.92 33508 12.1 HoCP 02-623 8139 + 35.5 229 + 1.66 42879 12.4
Table 3. Nursery second-stubble means of the 2003 “HoCP” assignment series on a Commerce silt loam soil at Ardoyne Farm in Schriever, Louisiana in 2006. Sugar/ Tons/ Sugar/ Weight/ Stalks/ Variety acre acre ton stalk acre (lbs.) (tons) (lbs.) (lbs.) (no.) LCP 85-384 13872 59.2 234 1.98 59895 + HoCP 91-555 16931 + 61.5 275 + 1.87 - 65794+ HoCP 96-540 11947 55.0 217 2.20 50139 HoCP 03-743 14667 + 55.5 264 + 1.92 - 57853 + US 90-18 7453 - 32.3 - 232 1.81 - 35846 - US 01-40 9221 - 54.3 170 - 2.37 45829 US 02-98 9775 39.9 - 245 2.10 38115 -
Table 4. Nursery second-stubble means of the 2003 “HoCP” assignment series on a Baldwin silty clay soil at Iberia Research Station in Jeanerette, Louisiana in 2006. Sugar/ Tons/ Sugar/ Weight/ Stalks/ Variety acre acre ton stalk acre (lbs.) (tons) (lbs.) (lbs.) (no.) LCP 85-384 15002 52.9 283 1.87 56719 HoCP 91-555 17042 56.8 300 1.79 63752 + HoCP 96-540 16512 57.2 288 2.14 53543 HoCP 03-743 18837 62.4 303 2.10 59214 US 90-18 7241 - 27.7 - 262 1.29 - 43106 - US 01-40 13286 60.9 220 - 2.46 49459 US 02-98 7738 - 29.8 - 258- 1.60 - 37434 -
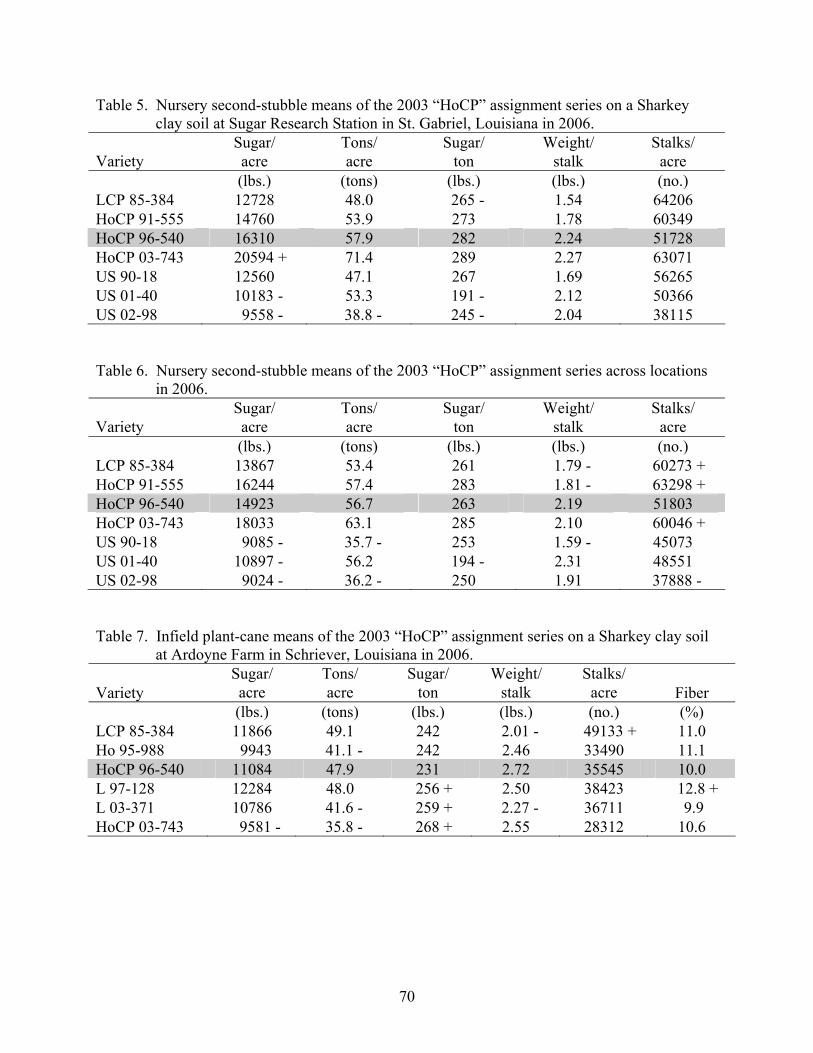
70
Table 5. Nursery second-stubble means of the 2003 “HoCP” assignment series on a Sharkey clay soil at Sugar Research Station in St. Gabriel, Louisiana in 2006. Sugar/ Tons/ Sugar/ Weight/ Stalks/ Variety acre acre ton stalk acre (lbs.) (tons) (lbs.) (lbs.) (no.) LCP 85-384 12728 48.0 265 - 1.54 64206 HoCP 91-555 14760 53.9 273 1.78 60349 HoCP 96-540 16310 57.9 282 2.24 51728 HoCP 03-743 20594 + 71.4 289 2.27 63071 US 90-18 12560 47.1 267 1.69 56265 US 01-40 10183 - 53.3 191 - 2.12 50366 US 02-98 9558 - 38.8 - 245 - 2.04 38115
Table 6. Nursery second-stubble means of the 2003 “HoCP” assignment series across locations in 2006. Sugar/ Tons/ Sugar/ Weight/ Stalks/ Variety acre acre ton stalk acre (lbs.) (tons) (lbs.) (lbs.) (no.) LCP 85-384 13867 53.4 261 1.79 - 60273 + HoCP 91-555 16244 57.4 283 1.81 - 63298 + HoCP 96-540 14923 56.7 263 2.19 51803 HoCP 03-743 18033 63.1 285 2.10 60046 + US 90-18 9085 - 35.7 - 253 1.59 - 45073 US 01-40 10897 - 56.2 194 - 2.31 48551 US 02-98 9024 - 36.2 - 250 1.91 37888 - Table 7. Infield plant-cane means of the 2003 “HoCP” assignment series on a Sharkey clay soil at Ardoyne Farm in Schriever, Louisiana in 2006. Sugar/ Tons/ Sugar/ Weight/ Stalks/ Variety acre acre ton stalk acre Fiber (lbs.) (tons) (lbs.) (lbs.) (no.) (%) LCP 85-384 11866 49.1 242 2.01 - 49133 + 11.0 Ho 95-988 9943 41.1 - 242 2.46 33490 11.1 HoCP 96-540 11084 47.9 231 2.72 35545 10.0 L 97-128 12284 48.0 256 + 2.50 38423 12.8 + L 03-371 10786 41.6 - 259 + 2.27 - 36711 9.9 HoCP 03-743 9581 - 35.8 - 268 + 2.55 28312 10.6

71
Table 8. Nursery first-stubble means of the 2004 “HoCP” assignment series on a Commerce silt loam soil at Ardoyne Farm in Schriever, Louisiana in 2006. Sugar/ Tons/ Sugar/ Weight/ Stalks/ Variety acre acre ton stalk acre (lbs.) (tons) (lbs.) (lbs.) (no.) LCP 85-384 13747 55.7 246 2.21 - 50366 HoCP 91-555 15902 61.8 258 + 2.35 - 52635 Ho 95-988 16861 63.6 266 + 2.57 49459 HoCP 96-540 15551 69.0 226 2.95 47190 L 97-128 16431 63.9 257 + 2.64 48551 HoCP 04-803 17812 70.7 252 + 3.06 46283 HoCP 04-809 19389 69.5 279 + 2.48 - 56038 HoCP 04-810 16704 66.4 252 + 2.40 - 55584 HoCP 04-814 16666 67.9 245 3.14 43333 HoCP 04-821 16137 58.2 277 + 1.89 - 61710 + HoCP 04-824 12906 56.2 228 2.37 - 47417 HoCP 04-836 11771 56.6 210 2.22 - 50820 HoCP 04-838 18968 67.2 282 + 2.34 - 56946 + HoCP 04-847 17100 65.4 262 + 2.71 48324 HoCP 04-856 16304 59.3 275 + 2.08 - 57173 + Table 9. Nursery first-stubble means of the 2004 “HoCP” assignment series on a Baldwin silty clay soil at Iberia Research Station in Jeanerette, Louisiana in 2006. Sugar/ Tons/ Sugar/ Weight/ Stalks/ Variety acre acre ton stalk acre (lbs.) (tons) (lbs.) (lbs.) (no.) LCP 85-384 13648 48.0 281 1.84 - 51274 HoCP 91-555 16902 57.8 292 1.93 - 60122 + Ho 95-988 21183 + 71.4 297 2.52 56492 + HoCP 96-540 15820 56.0 283 2.61 42879 L 97-128 17387 64.2 271 2.80 45602 HoCP 04-803 11536 41.1 280 2.47 33351 HoCP 04-809 12827 45.1 284 1.78 - 51274 HoCP 04-810 19803 68.2 290 2.39 57173 + HoCP 04-814 16762 59.5 281 2.82 42199 HoCP 04-821 16616 56.4 295 2.13 - 52862 HoCP 04-824 13544 50.7 267 - 1.99 - 51047 HoCP 04-836 13447 50.2 268 2.22 45148 HoCP 04-838 15713 55.1 284 2.20 50593 HoCP 04-847 12842 46.9 274 2.46 38342 HoCP 04-856 13474 46.9 287 1.74 - 53996 US 04-9601 10028 - 45.4 221 - 1.91 - 47644 US 04-9602 12304 49.6 250 - 2.12 - 46509 US 04-9603 14451 56.4 256 - 1.95 - 57853 +

72
Table 10. Nursery first-stubble means of the 2004 “HoCP” assignment series on a Sharkey clay soil at Sugar Research Station in St. Gabriel, Louisiana in 2006. Sugar/ Tons/ Sugar/ Weight/ Stalks/ Variety acre acre ton stalk acre (lbs.) (tons) (lbs.) (lbs.) (no.) LCP 85-384 14539 52.1 279 2.06 - 50820 HoCP 91-555 15064 54.6 276 1.98 - 55358 Ho 95-988 11438 41.3 277 2.01 - 41291 HoCP 96-540 18526 66.3 278 2.51 52862 L 97-128 15439 55.3 279 2.52 44014 HoCP 04-803 14047 53.1 263 2.69 39249 HoCP 04-809 14758 50.0 295 + 1.68 - 59441 HoCP 04-810 14263 51.4 276 1.88 - 53316 HoCP 04-814 14805 52.5 281 2.36 44921 HoCP 04-821 12014 42.0 278 1.83 - 44241 HoCP 04-824 11503 45.9 251 - 1.98 - 46736 HoCP 04-836 10703 38.9 275 2.02 - 39023 HoCP 04-838 15509 53.1 291 2.05 - 50820 HoCP 04-847 13768 48.8 282 2.21 44241 HoCP 04-856 13294 47.7 279 1.69 - 56492 US 04-9601 12528 62.0 202 - 1.99 - 62391 US 04-9602 16015 64.7 248 - 2.32 55811 US 04-9603 16685 67.5 248 - 2.12 - 63752
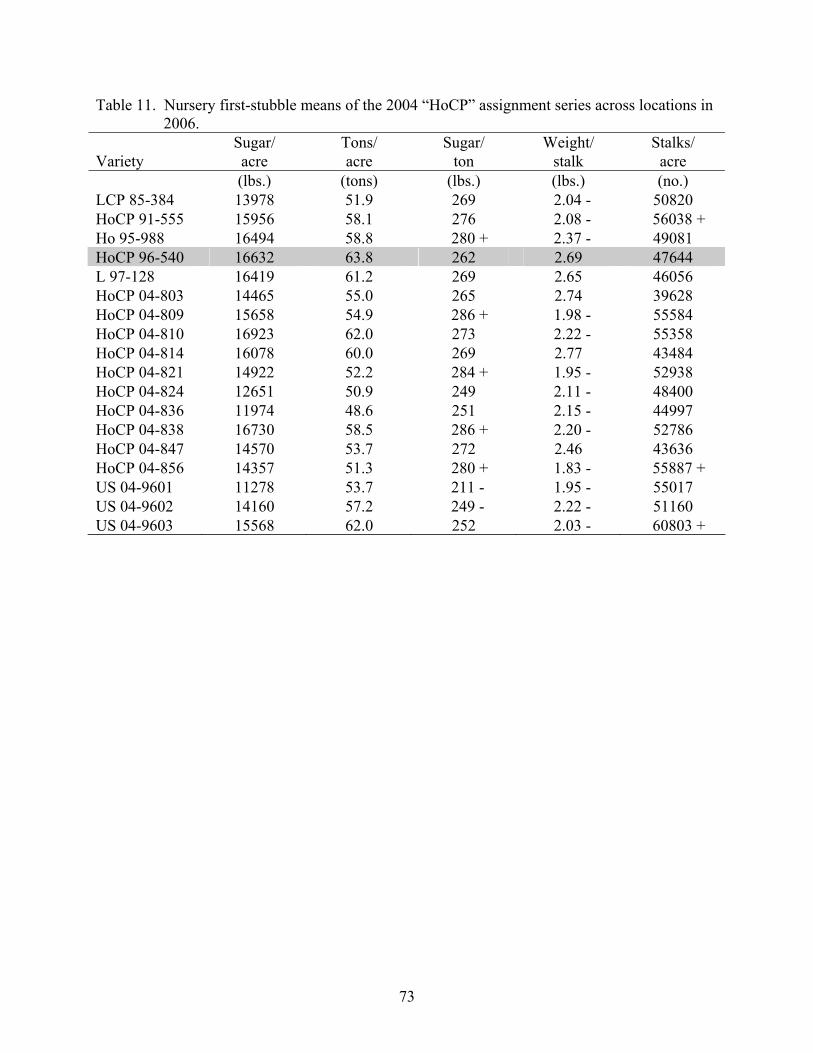
73
Table 11. Nursery first-stubble means of the 2004 “HoCP” assignment series across locations in 2006. Sugar/ Tons/ Sugar/ Weight/ Stalks/ Variety acre acre ton stalk acre (lbs.) (tons) (lbs.) (lbs.) (no.) LCP 85-384 13978 51.9 269 2.04 - 50820 HoCP 91-555 15956 58.1 276 2.08 - 56038 + Ho 95-988 16494 58.8 280 + 2.37 - 49081 HoCP 96-540 16632 63.8 262 2.69 47644 L 97-128 16419 61.2 269 2.65 46056 HoCP 04-803 14465 55.0 265 2.74 39628 HoCP 04-809 15658 54.9 286 + 1.98 - 55584 HoCP 04-810 16923 62.0 273 2.22 - 55358 HoCP 04-814 16078 60.0 269 2.77 43484 HoCP 04-821 14922 52.2 284 + 1.95 - 52938 HoCP 04-824 12651 50.9 249 2.11 - 48400 HoCP 04-836 11974 48.6 251 2.15 - 44997 HoCP 04-838 16730 58.5 286 + 2.20 - 52786 HoCP 04-847 14570 53.7 272 2.46 43636 HoCP 04-856 14357 51.3 280 + 1.83 - 55887 + US 04-9601 11278 53.7 211 - 1.95 - 55017 US 04-9602 14160 57.2 249 - 2.22 - 51160 US 04-9603 15568 62.0 252 2.03 - 60803 +

74
Table 12. Nursery plantcane means of the 2005 “HoCP” assignment series on a Commerce silt loam soil at Ardoyne Farm in Schriever, Louisiana in 2006. Sugar/ Tons/ Sugar/ Weight/ Stalks/ Variety acre acre ton stalk acre (lbs.) (tons) (lbs.) (lbs.) (no.) LCP 85-384 12610 50.2 249 2.47 40611 Ho 95-988 18975 66.6 285 3.25 41064 HoCP 96-540 14193 53.0 266 2.75 38342 L 97-128 17988 63.4 284 3.08 41064 HoCP 05-902 17469 71.4 + 246 3.31 44468 HoCP 05-903 18372 70.4 261 3.26 43333 HoCP 05-904 21913 + 82.2 + 266 3.50 + 46963 HoCP 05-905 15050 61.5 247 2.38 51728 + HoCP 05-906 15767 62.3 253 2.45 51274 + HoCP 05-909 16857 65.4 258 2.47 53316 + HoCP 05-911 17268 69.5 247 3.07 45375 HoCP 05-912 14176 59.8 236 2.85 41745 HoCP 05-915 11876 60.7 198 - 2.65 45829 HoCP 05-917 13822 50.7 273 2.45 41518 HoCP 05-918 15563 63.6 242 2.73 46963 HoCP 05-919 11232 49.1 228 2.46 39930 HoCP 05-920 16291 61.7 262 2.40 51728 + HoCP 05-922 15988 63.6 251 2.87 44241 HoCP 05-923 18883 69.9 269 3.10 44921 HoCP 05-927 16948 65.2 260 2.74 47871 HoCP 05-930 16733 65.4 256 2.82 46509 HoCP 05-931 19165 70.0 272 2.88 48778 + HoCP 05-933 10238 42.7 240 1.83 - 46736 HoCP 05-935 9899 43.6 229 1.92 - 45602 HoCP 05-936 12924 67.5 189 - 2.62 51501 + HoCP 05-937 19399 70.2 276 2.55 55131 + HoCP 05-939 14978 59.7 250 2.92 41291 HoCP 05-948 18320 73.6 + 248 3.40 43333 HoCP 05-953 17361 65.5 265 2.29 57626 + HoCP 05-957 14204 51.0 279 2.44 41972 HoCP 05-958 12363 54.5 229 2.69 40384 HoCP 05-961 19424 69.6 279 2.91 47871 US 05-9300 15795 64.0 245 2.20 57853 + US 05-9604 11029 53.2 207 - 1.89 - 56492 + US 05-9605 9989 50.4 199 - 2.57 39249 US 05-9606 11968 58.7 204 - 1.63 - 72373 +

75
Table 13. Nursery plantcane means of the 2005 “HoCP” assignment series on a Baldwin silty clay soil at Iberia Research Station in Jeanerette, Louisiana in 2006. Sugar/ Tons/ Sugar/ Weight/ Stalks/ Variety acre acre ton stalk acre (lbs.) (tons) (lbs.) (lbs.) (no.) LCP 85-384 8716 - 33.4 - 261 1.79 - 37434 Ho 95-988 14872 54.5 273 2.24 48551 + HoCP 96-540 12280 44.9 274 2.46 36754 L 97-128 11849 44.1 268 2.26 39023 HoCP 05-902 12707 51.4 249 - 1.99 - 51501 + HoCP 05-903 13682 49.3 278 2.54 38796 HoCP 05-904 14381 53.4 269 2.56 41972 HoCP 05-905 8063 - 30.2 - 267 1.69 - 35619 HoCP 05-906 9584 40.6 236 - 1.90 - 42879 HoCP 05-909 10848 40.5 268 1.89 - 42879 HoCP 05-911 12209 48.7 250 - 2.48 39249 HoCP 05-912 12576 48.5 259 2.48 39249 HoCP 05-915 14555 52.2 279 2.51 41972 HoCP 05-917 8005 - 29.4 - 269 2.04 28813 - HoCP 05-918 13945 50.9 274 2.32 44014 HoCP 05-919 11727 46.5 250 - 2.55 36300 HoCP 05-920 13993 53.2 264 2.32 45829 + HoCP 05-922 11060 43.1 257 2.33 36981 HoCP 05-923 11594 45.4 255 2.35 39023 HoCP 05-927 11255 44.4 255 2.00 44241 HoCP 05-930 9970 38.2 262 2.00 38115 HoCP 05-931 10104 37.1 273 2.27 32670 HoCP 05-933 11964 42.0 285 2.04 41291 HoCP 05-935 11732 43.9 267 1.72 - 51274 + HoCP 05-936 5995 - 25.7 - 230 - 2.02 24276 - HoCP 05-937 12876 47.5 272 2.16 44014 HoCP 05-939 10082 40.4 249 - 2.10 38342 HoCP 05-948 11879 45.5 262 2.38 38342 HoCP 05-953 13452 49.2 274 1.90 - 52181 + HoCP 05-957 10766 39.1 275 1.99 - 39249 HoCP 05-958 13265 49.9 266 2.46 41064 HoCP 05-961 13594 49.3 276 2.22 44468 + US 05-9300 10538 40.1 263 1.78 - 44921 + US 05-9604 9966 38.8 256 1.49 - 51954 + US 05-9605 8709 - 37.5 233 - 2.21 34031 US 05-9606 7303 - 32.0 - 229 - 1.12 - 57173 +
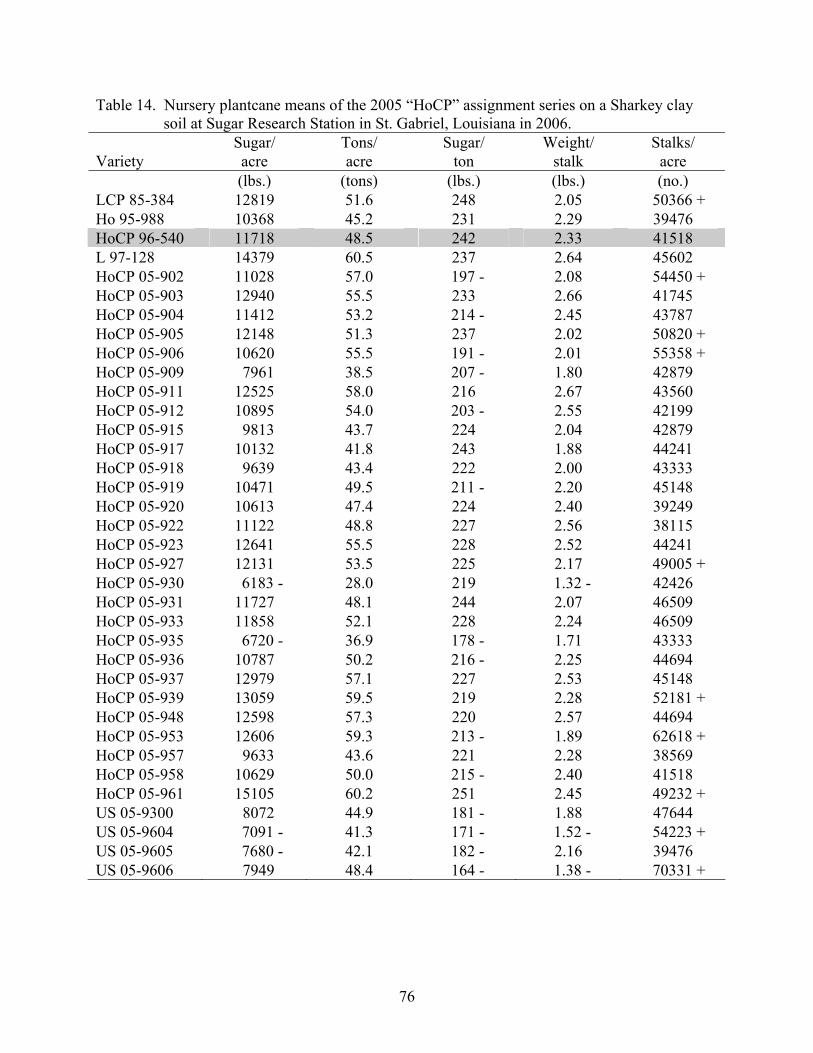
76
Table 14. Nursery plantcane means of the 2005 “HoCP” assignment series on a Sharkey clay soil at Sugar Research Station in St. Gabriel, Louisiana in 2006. Sugar/ Tons/ Sugar/ Weight/ Stalks/ Variety acre acre ton stalk acre (lbs.) (tons) (lbs.) (lbs.) (no.) LCP 85-384 12819 51.6 248 2.05 50366 + Ho 95-988 10368 45.2 231 2.29 39476 HoCP 96-540 11718 48.5 242 2.33 41518 L 97-128 14379 60.5 237 2.64 45602 HoCP 05-902 11028 57.0 197 - 2.08 54450 + HoCP 05-903 12940 55.5 233 2.66 41745 HoCP 05-904 11412 53.2 214 - 2.45 43787 HoCP 05-905 12148 51.3 237 2.02 50820 + HoCP 05-906 10620 55.5 191 - 2.01 55358 + HoCP 05-909 7961 38.5 207 - 1.80 42879 HoCP 05-911 12525 58.0 216 2.67 43560 HoCP 05-912 10895 54.0 203 - 2.55 42199 HoCP 05-915 9813 43.7 224 2.04 42879 HoCP 05-917 10132 41.8 243 1.88 44241 HoCP 05-918 9639 43.4 222 2.00 43333 HoCP 05-919 10471 49.5 211 - 2.20 45148 HoCP 05-920 10613 47.4 224 2.40 39249 HoCP 05-922 11122 48.8 227 2.56 38115 HoCP 05-923 12641 55.5 228 2.52 44241 HoCP 05-927 12131 53.5 225 2.17 49005 + HoCP 05-930 6183 - 28.0 219 1.32 - 42426 HoCP 05-931 11727 48.1 244 2.07 46509 HoCP 05-933 11858 52.1 228 2.24 46509 HoCP 05-935 6720 - 36.9 178 - 1.71 43333 HoCP 05-936 10787 50.2 216 - 2.25 44694 HoCP 05-937 12979 57.1 227 2.53 45148 HoCP 05-939 13059 59.5 219 2.28 52181 + HoCP 05-948 12598 57.3 220 2.57 44694 HoCP 05-953 12606 59.3 213 - 1.89 62618 + HoCP 05-957 9633 43.6 221 2.28 38569 HoCP 05-958 10629 50.0 215 - 2.40 41518 HoCP 05-961 15105 60.2 251 2.45 49232 + US 05-9300 8072 44.9 181 - 1.88 47644 US 05-9604 7091 - 41.3 171 - 1.52 - 54223 + US 05-9605 7680 - 42.1 182 - 2.16 39476 US 05-9606 7949 48.4 164 - 1.38 - 70331 +
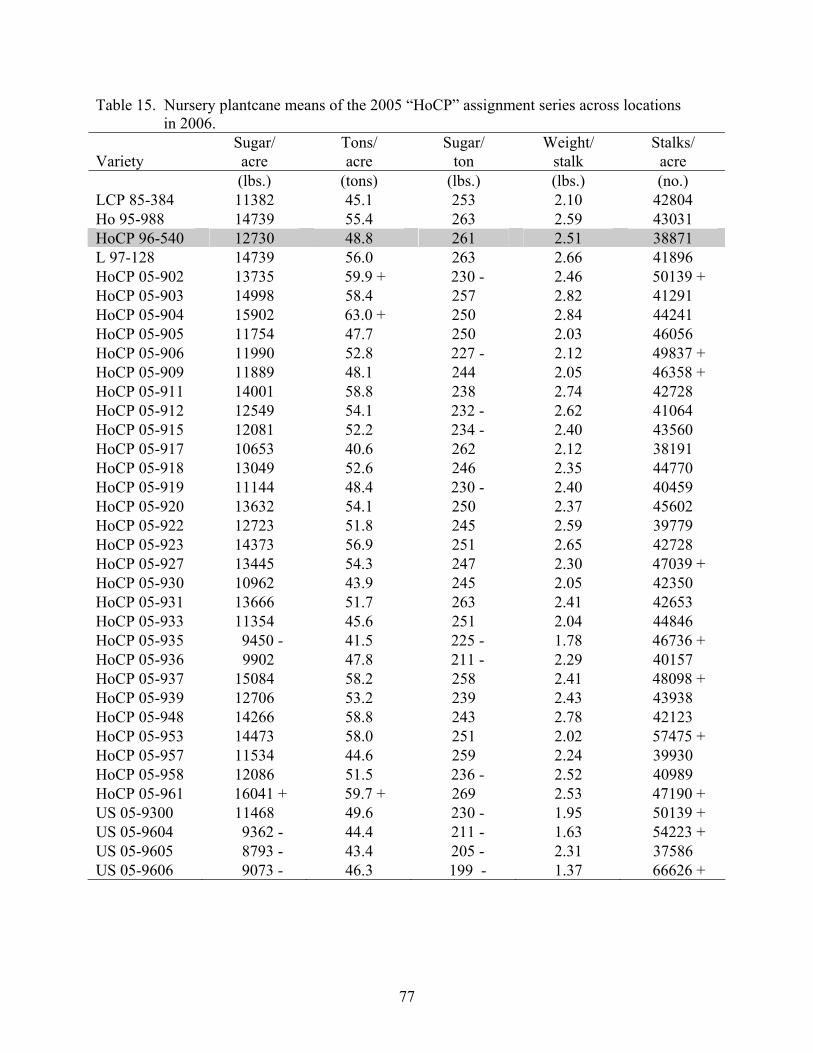
77
Table 15. Nursery plantcane means of the 2005 “HoCP” assignment series across locations in 2006. Sugar/ Tons/ Sugar/ Weight/ Stalks/ Variety acre acre ton stalk acre (lbs.) (tons) (lbs.) (lbs.) (no.) LCP 85-384 11382 45.1 253 2.10 42804 Ho 95-988 14739 55.4 263 2.59 43031 HoCP 96-540 12730 48.8 261 2.51 38871 L 97-128 14739 56.0 263 2.66 41896 HoCP 05-902 13735 59.9 + 230 - 2.46 50139 + HoCP 05-903 14998 58.4 257 2.82 41291 HoCP 05-904 15902 63.0 + 250 2.84 44241 HoCP 05-905 11754 47.7 250 2.03 46056 HoCP 05-906 11990 52.8 227 - 2.12 49837 + HoCP 05-909 11889 48.1 244 2.05 46358 + HoCP 05-911 14001 58.8 238 2.74 42728 HoCP 05-912 12549 54.1 232 - 2.62 41064 HoCP 05-915 12081 52.2 234 - 2.40 43560 HoCP 05-917 10653 40.6 262 2.12 38191 HoCP 05-918 13049 52.6 246 2.35 44770 HoCP 05-919 11144 48.4 230 - 2.40 40459 HoCP 05-920 13632 54.1 250 2.37 45602 HoCP 05-922 12723 51.8 245 2.59 39779 HoCP 05-923 14373 56.9 251 2.65 42728 HoCP 05-927 13445 54.3 247 2.30 47039 + HoCP 05-930 10962 43.9 245 2.05 42350 HoCP 05-931 13666 51.7 263 2.41 42653 HoCP 05-933 11354 45.6 251 2.04 44846 HoCP 05-935 9450 - 41.5 225 - 1.78 46736 + HoCP 05-936 9902 47.8 211 - 2.29 40157 HoCP 05-937 15084 58.2 258 2.41 48098 + HoCP 05-939 12706 53.2 239 2.43 43938 HoCP 05-948 14266 58.8 243 2.78 42123 HoCP 05-953 14473 58.0 251 2.02 57475 + HoCP 05-957 11534 44.6 259 2.24 39930 HoCP 05-958 12086 51.5 236 - 2.52 40989 HoCP 05-961 16041 + 59.7 + 269 2.53 47190 + US 05-9300 11468 49.6 230 - 1.95 50139 + US 05-9604 9362 - 44.4 211 - 1.63 54223 + US 05-9605 8793 - 43.4 205 - 2.31 37586 US 05-9606 9073 - 46.3 199 - 1.37 66626 +

78
2006 LOUISIANA SUGARCANE VARIETY DEVELOPMENT PROGRAM OUTFIELD VARIETY TRIALS
Todd Robert, Mike Duet, and Kenneth Gravois Sugar Research Station
Donnie Garrison
USDA-ARS, Sugarcane Research Laboratory
Windell Jackson and Herman Waguespack, Jr. American Sugar Cane League
The outfield variety trials are the final stage of testing experimental varieties for their potential commercial production in Louisiana. Results from these trials are used in both variety advancement and crossing decisions. The outfield variety trials are cooperatively conducted at 10 commercial locations throughout the Louisiana Sugarcane Belt by the LSU AgCenter, the USDA-ARS, and the American Sugar Cane League. To be considered for release, an experimental variety must equal or exceed the performance of commercial varieties with regard to yield and harvestability across locations, crops, and years. Accurate varietal evaluation requires overall yield performance information in addition to performance under adverse harvest conditions. The objective of this report is to provide overall and specific location yield data by crop for the 2006 outfield tests. Included are multi-year yield analyses for appropriate test varieties (tables 3-33). The experimental design used at each outfield location was a randomized complete block design with three replications per location. Test plots were two rows wide and 50 feet long with a 5-foot alley between plots. To reflect industry practices, all locations were harvested with a combine harvester. Each plot was weighed with a weigh wagon fitted with load cells mounted on each axle and hitch. A 15-stalk, whole-stalk sample, not stripped of leaves, was taken from each plot and sent to the USDA-ARS sucrose laboratory. Samples were hand cut for all tests. The samples were weighed, milled, and the juice analyzed for Brix and pol. Pounds of theoretical recoverable sugar per ton of cane are reported. Cane yield for each plot was estimated by plot weight, less 14% to adjust for leaf-trash weight and 10% for harvester efficiency. Stalk number was calculated by dividing adjusted cane yield by stalk weight. Adjustments made to cane yield resulted in lower estimated stalk numbers than those achieved by growers.
Interpreting one year of yield data can be misleading because varieties may differ in relative performance from year to year. Across location means can likewise be misleading since a variety, experimental or commercial, may not perform consistently at all locations. Multi-year and multi–location testing solves these problems by averaging the inconsistent performances. LCP85-384 has been the leading variety in Louisiana since 1998 with 73% of the sugarcane acreage in 2006 grown to this variety. The second leading variety grown in Louisiana in 2006 was HoCP96-540. It comprised 35% of the sugarcane planted in 2006, which is the largest increase for any of the new varieties. Accordingly for comparison, HoCP96-540 is now

79
used as the check variety in all comparisons and is highlighted in the tables. To adjust for missing data, the SAS analysis calculated least square means (v 9.0, Proc Mixed). Mean separation used least square mean probability differences (P=0.05). Varieties that are significantly higher or lower than HoCP96-540 are denoted by a plus (+) or minus (-), respectively, next to the value for each trait.
Twelve experimental varieties representing the 2004 assignment series were introduced to outfield locations for seed increase in 2006 (Table 1). Seven experimental and six commercial varieties were planted at nine outfield locations. Three new locations were added to the outfield testing stage in 2006. Only seed increases of both commercial and experimental varieties were planted at these locations. Twenty-one tests were harvested in 2006 including seven plantcane, six first-stubble, five second-stubble, and three third-stubble crops (Table 2). Variety yields are reported by crop and trait with overall means and individual location data in the same table (Table 3-22) and in summary tables by crop (Tables 23-26). Tables 27-33 provide combined analysis of plantcane, first-stubble, second-stubble, and third-stubble crops averaged over several years that is used to evaluate commercial and experimental varieties. Better growing conditions were experienced in 2006, although the northern and western areas of the sugar belt experienced drought during the summer growing season. In contrast to 2005, tropical storm activity was minimal in 2006. The weather during planting was near optimal with good conditions experienced at all sites. The harvest of 2006 was marked by higher than average rainfall. Some outfield test sites were not harvested due to extended wet conditions.
L99-226 and L99-233 continued to perform well in outfield testing in 2006 based on plantcane, first-stubble, second-stubble, and third-stubble data. On April 25, 2006, L99-226 and L99-233 were released to growers. Seed was made available by the American Sugar Cane League from the secondary seed increase stations.
HoCP00-950 was included in plantcane, first stubble, and second stubble tests in 2006
and produced high levels of sugar per acre and sugar per ton of cane in each crop. Seed of HoCP00-950 was expanded again on secondary increase stations in 2006. This variety will be eligible for release in 2007.
Two experimental varieties of the 2001 assignment series were tested in the plantcane
trials: L01-283 and L01-299. Each of these varieties performed well in the plantcane and first-stubble outfield tests. L01-283 was sent from the primary seed increase stations to the secondary seed increase stations. L01-299 was replanted on the primary seed increase stations. L01-283 and L01-299 will be eligible for release in 2008 and 2009, respectively.
HoCP02-623 was harvested in plantcane tests in 2006. The variety produced
significantly less sugar per acre and cane yield than HoCP96-540. CP89-2143 is a commercial variety from Florida. The variety is being made available by
the Kleentek Co. and many growers have planted the variety on sandy ridges and have harvested

80
it late so as to allow for sufficient maturity. Many growers have been well pleased with CP89-2143 managed under these conditions. In the outfield trials, CP89-2143 had significantly lower sugar per acre, cane yield, and sugar per ton of cane than HoCP96-540. ______________
Data were obtained through a cooperative effort of personnel from the LSU AgCenter, USDA-ARS, Sugarcane Research Laboratory, and the American Sugar Cane League in accordance to the provisions of the “Three-way Agreement of 2007.” Outfield testing would not be possible without the full cooperation of the growers at each outfield location.
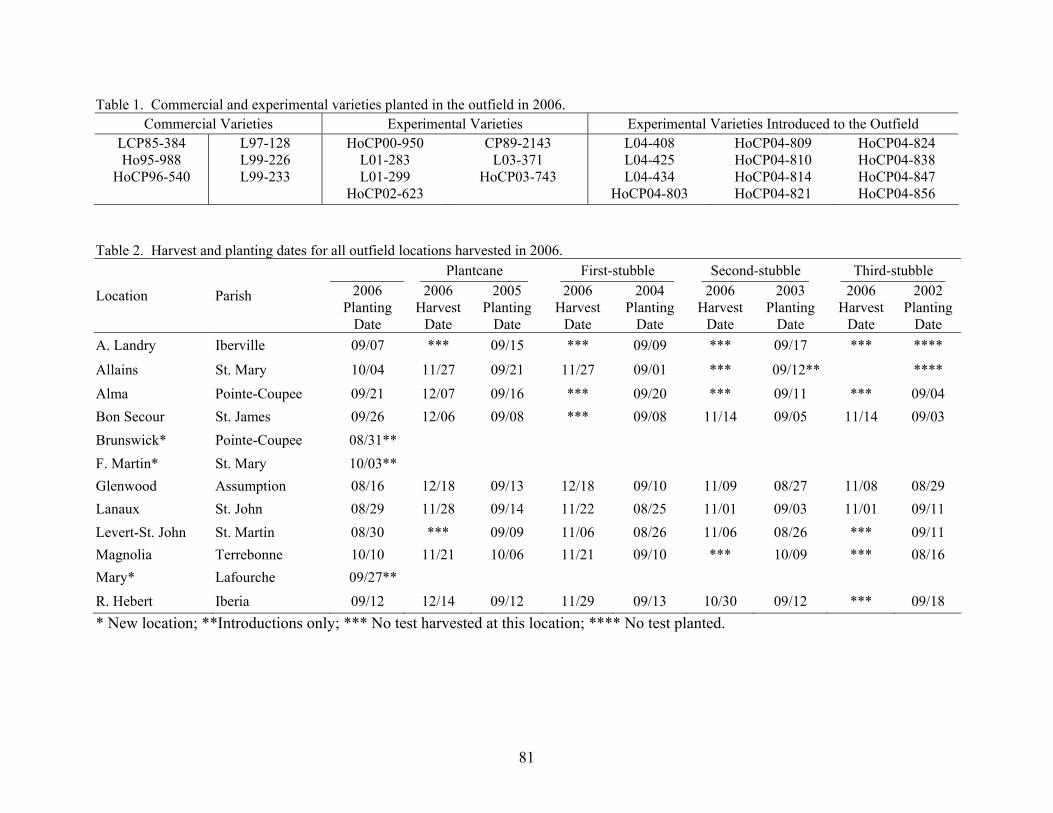
81
Table 1. Commercial and experimental varieties planted in the outfield in 2006. Commercial Varieties Experimental Varieties Experimental Varieties Introduced to the Outfield
LCP85-384 Ho95-988
HoCP96-540
L97-128 L99-226 L99-233
HoCP00-950 L01-283 L01-299
HoCP02-623
CP89-2143 L03-371
HoCP03-743
L04-408 L04-425 L04-434
HoCP04-803
HoCP04-809 HoCP04-810 HoCP04-814 HoCP04-821
HoCP04-824 HoCP04-838 HoCP04-847 HoCP04-856
Table 2. Harvest and planting dates for all outfield locations harvested in 2006.
Plantcane First-stubble Second-stubble Third-stubble
Location Parish 2006 Planting
Date
2006 Harvest
Date
2005 Planting
Date
2006 Harvest
Date
2004 Planting
Date
2006 Harvest
Date
2003 Planting
Date
2006 Harvest
Date
2002 Planting
Date A. Landry Iberville 09/07 *** 09/15 *** 09/09 *** 09/17 *** ****
Allains St. Mary 10/04 11/27 09/21 11/27 09/01 *** 09/12** **** Alma Pointe-Coupee 09/21 12/07 09/16 *** 09/20 *** 09/11 *** 09/04 Bon Secour St. James 09/26 12/06 09/08 *** 09/08 11/14 09/05 11/14 09/03 Brunswick* Pointe-Coupee 08/31** F. Martin* St. Mary 10/03** Glenwood Assumption 08/16 12/18 09/13 12/18 09/10 11/09 08/27 11/08 08/29 Lanaux St. John 08/29 11/28 09/14 11/22 08/25 11/01 09/03 11/01 09/11 Levert-St. John St. Martin 08/30 *** 09/09 11/06 08/26 11/06 08/26 *** 09/11 Magnolia Terrebonne 10/10 11/21 10/06 11/21 09/10 *** 10/09 *** 08/16 Mary* Lafourche 09/27** R. Hebert Iberia 09/12 12/14 09/12 11/29 09/13 10/30 09/12 *** 09/18 * New location; **Introductions only; *** No test harvested at this location; **** No test planted.

82
Table 3. Plantcane sugar per acre for six commercial and five experimental varieties at seven outfield locations in 2006. Heavy Light
Variety Allains Magnolia Alma Bon Secour Glenwood Lanaux R. Hebert Mean (lbs/A)
CP85-384 8659 9493 4621 - 7712 - 9803 - 8862 7697 8121 - CP89-2143 8697 8482 7028 - 9674 - 9529 - 8855 7656 8560 - Ho95-988 8887 10155 7624 11503 11325 10286 8884 9809 HoCP96-540 11241 10390 8475 11860 11774 12194 7978 10559 L97-128 9688 8845 7880 11287 11209 11468 9685 10009 L99-226 10969 11162 9249 13455 11942 11481 9776 11148 L99-233 10526 11970 6504 - 10946 11280 11325 9827 10340 HoCP00-950 9572 9280 9366 14279+ 12603 11686 8579 10767 L01-283 8866 9112 8092 12846 11543 9974 9384 9974 L01-299 9975 9805 8226 11800 12475 10109 8447 10119 HoCP02-623 8445 10597 7846 11031 10445 9716 9391 9639 - Table 4. Plantcane cane yield for six commercial and five experimental varieties at seven outfield locations in 2006. Heavy Light
Variety Allains Magnolia Alma Bon Secour Glenwood Lanaux R. Hebert Mean (tons/A)
LCP85-384 31.7 34.8 18.2 - 29.3- 33.2 34.2 29.9 30.2- CP89-2143 34.5 31.3 27.7 - 44.1 37.1 33.6 31.7 34.3- Ho95-988 33.5 37.1 29.3 41.9 39.5 39.7 35.7 36.7 HoCP96-540 42.2 33.8 32.3 45.0 40.0 45.7 32.5 38.8 L97-128 37.1 34.5 33.6 43.9 38.0 44.4 38.0+ 38.5 L99-226 40.3 38.2 32.4 44.9 38.5 40.5 37.9+ 39.0 L99-233 38.8 39.9 28.7 - 41.7 40.8 43.1 39.4+ 38.9 HoCP00-950 31.1 34.4 33.6 49.0 41.5 39.0 30.2 37.0 L01-283 30.8 36.5 30.5 46.7 40.9 35.4 36.4 36.7 L01-299 36.2 34.4 32.6 43.7 40.2 37.7 31.2 36.6 HoCP02-623 30.6 34.7 31.6 40.0- 35.5 38.5 37.0 35.4-
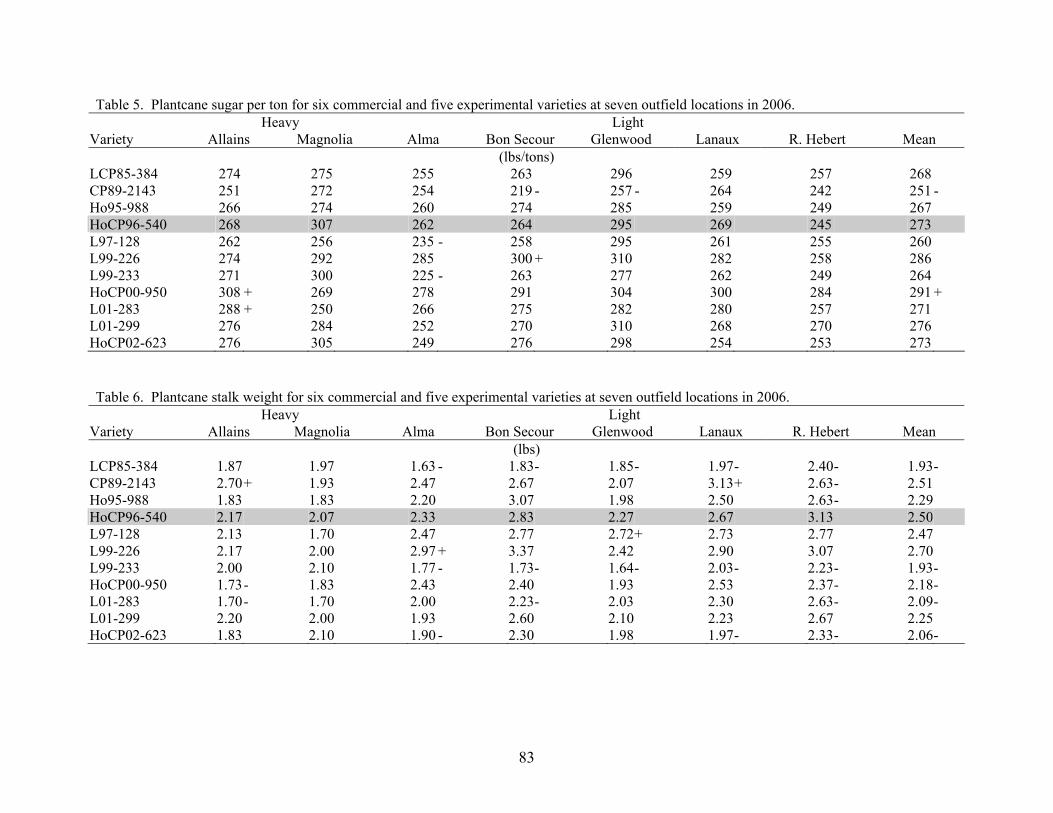
83
Table 5. Plantcane sugar per ton for six commercial and five experimental varieties at seven outfield locations in 2006. Heavy Light
Variety Allains Magnolia Alma Bon Secour Glenwood Lanaux R. Hebert Mean (lbs/tons)
LCP85-384 274 275 255 263 296 259 257 268 CP89-2143 251 272 254 219 - 257 - 264 242 251 - Ho95-988 266 274 260 274 285 259 249 267 HoCP96-540 268 307 262 264 295 269 245 273 L97-128 262 256 235 - 258 295 261 255 260 L99-226 274 292 285 300 + 310 282 258 286 L99-233 271 300 225 - 263 277 262 249 264 HoCP00-950 308 + 269 278 291 304 300 284 291 + L01-283 288 + 250 266 275 282 280 257 271 L01-299 276 284 252 270 310 268 270 276 HoCP02-623 276 305 249 276 298 254 253 273 Table 6. Plantcane stalk weight for six commercial and five experimental varieties at seven outfield locations in 2006. Heavy Light
Variety Allains Magnolia Alma Bon Secour Glenwood Lanaux R. Hebert Mean (lbs)
LCP85-384 1.87 1.97 1.63 - 1.83- 1.85 - 1.97- 2.40- 1.93- CP89-2143 2.70 + 1.93 2.47 2.67 2.07 3.13+ 2.63- 2.51 Ho95-988 1.83 1.83 2.20 3.07 1.98 2.50 2.63- 2.29 HoCP96-540 2.17 2.07 2.33 2.83 2.27 2.67 3.13 2.50 L97-128 2.13 1.70 2.47 2.77 2.72 + 2.73 2.77 2.47 L99-226 2.17 2.00 2.97 + 3.37 2.42 2.90 3.07 2.70 L99-233 2.00 2.10 1.77 - 1.73- 1.64 - 2.03- 2.23- 1.93- HoCP00-950 1.73 - 1.83 2.43 2.40 1.93 2.53 2.37- 2.18- L01-283 1.70 - 1.70 2.00 2.23- 2.03 2.30 2.63- 2.09- L01-299 2.20 2.00 1.93 2.60 2.10 2.23 2.67 2.25 HoCP02-623 1.83 2.10 1.90 - 2.30 1.98 1.97- 2.33- 2.06-

84
Table 7. Plantcane stalk number for six commercial and five experimental varieties at seven outfield locations in 2006. Heavy Light
Variety Allains Magnolia Alma Bon Secour Glenwood Lanaux R. Hebert Mean (stalks/A)
LCP85-384 34583 35772 22360- 32110 35678 34976 25251 31533 CP89-2143 25558 32806 22584- 34238 37039 21537- 24964 28389 Ho95-988 36409 40511 26622 27334 40173 32030 27246+ 32904 HoCP96-540 39184 33596 27688 32110 35787 35242 20883 32070 L97-128 34905 41124 27256 32158 28182- 32472 27537+ 31948 L99-226 36800 39866 22049- 26804 32200 27874 24950 30077 L99-233 38816 38317 33569+ 49306+ 50203+ 42014 35291+ 41074+ HoCP00-950 36345 37904 27725 40873 43283+ 31110 25569 34687 L01-283 36659 43316 30793 43045+ 40594 30526 27794+ 36104 L01-299 33239 34576 33848+ 33909 38445 33899 23516 33062 HoCP02-623 33347 34285 33238+ 36153 36749 39134 31676+ 34933 Table 8. First-stubble sugar per acre for seven commercial and three experimental varieties at six outfield locations in 2006. Heavy Light
Variety Allains Magnolia Glenwood Lanaux R. Hebert St. John Mean (lbs/A)
LCP85-384 8312 5614 - 6311 10751 7415 - 5885 7381 - HoCP91-555 8578 5405 - 7365 10098 10589 6520 8092 Ho95-988 8605 6657 8473 10093 10745 7429 8667 HoCP96-540 8977 7165 7775 9984 11732 6693 8721 L97-128 8399 5262 - 7567 10686 9723 - 7855 + 8249 L99-226 10943 + 9181 + 9913 + 11598 12317 8314 + 10378+ L99-233 8485 7332 7409 11573 10924 6800 8754 HoCP00-950 8365 5814 8586 9922 11202 8585 + 8746 L01-283 8515 7013 10827+ 12817 13584+ 8489 + 10207+ L01-299 9323 5797 10953+ 11877 13718+ 8626 + 10049+

85
Table 9. First-stubble cane yield for seven commercial and three experimental varieties at six outfield locations in 2006. Heavy Light
Variety Allains Magnolia Glenwood Lanaux R. Hebert St. John Mean (tons/A)
LCP85-384 30.1 19.8 24.6 37.5 27.1- 24.2 27.2- HoCP91-555 30.4 18.5- 28.1 36.2 37.9- 24.8 29.3 Ho95-988 31.3 24.5 33.4+ 35.1 38.5 28.2 31.8 HoCP96-540 33.0 23.3 27.5 35.0 44.8 26.6 31.7 L97-128 28.7 20.5 28.5 38.8 35.9- 29.2 30.3 L99-226 37.3 28.9+ 32.4+ 37.7 41.1 30.0 34.6 L99-233 31.2 25.3 29.2 43.2 37.8- 26.7 32.2 HoCP00-950 28.1 - 19.5 31.8 32.0 38.0- 30.5+ 30.0 L01-283 28.6 24.4 37.3+ 44.7 47.2 32.0+ 35.7+ L01-299 34.9 23.7 41.6+ 42.6 48.2 34.4+ 37.6+ Table 10. First-stubble sugar per ton for seven commercial and three experimental varieties at six outfield locations in 2006. Heavy Light
Variety Allains Magnolia Glenwood Lanaux R. Hebert St. John Mean (lbs/ton)
LCP85-384 276 283 256 - 286 273 + 243 270 HoCP91-555 282 292 261 279 280 + 263 276 Ho95-988 275 272 254 - 287 279 + 264 272 HoCP96-540 272 305 282 285 262 252 276 L97-128 293 + 258 - 266 276 272 269 272 L99-226 293 + 317 305 307 + 299 + 277 + 300 + L99-233 271 291 253 - 268 - 289 + 255 271 HoCP00-950 298 + 297 269 310 + 295 + 281 + 291 + L01-283 298 + 289 290 287 288 + 265 286 L01-299 267 244 - 263 279 285 + 251 265
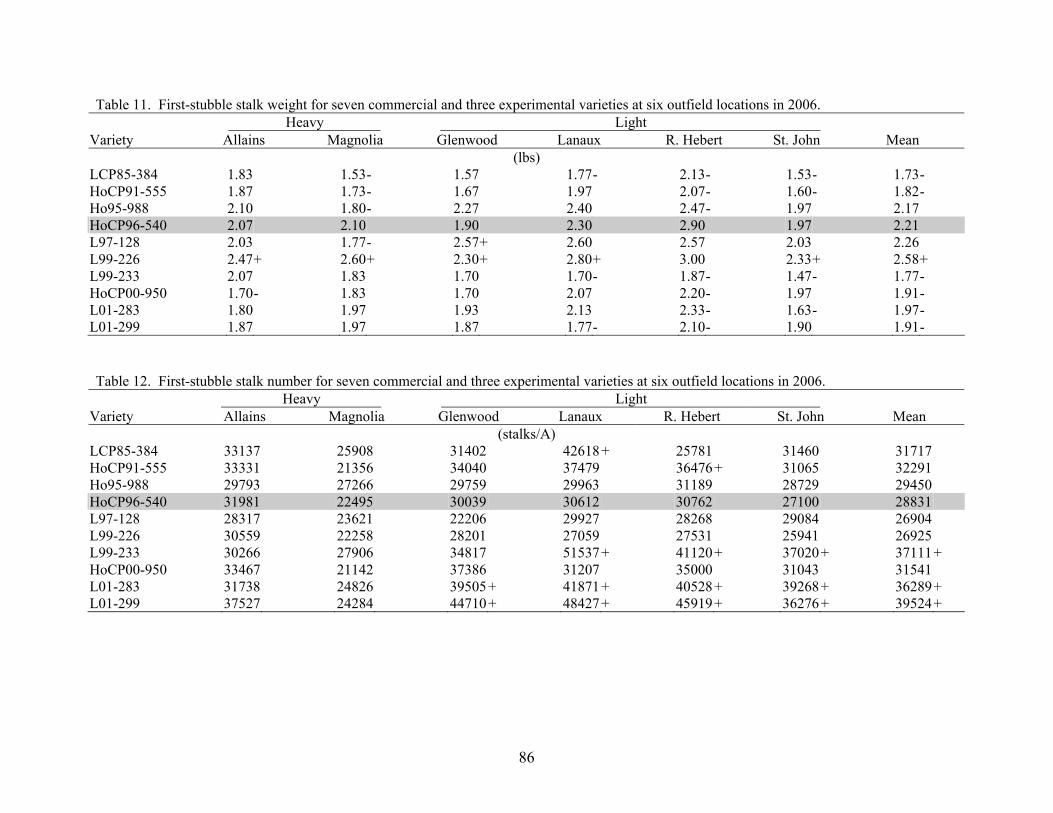
86
Table 11. First-stubble stalk weight for seven commercial and three experimental varieties at six outfield locations in 2006. Heavy Light
Variety Allains Magnolia Glenwood Lanaux R. Hebert St. John Mean (lbs)
LCP85-384 1.83 1.53- 1.57 1.77- 2.13- 1.53- 1.73- HoCP91-555 1.87 1.73- 1.67 1.97 2.07- 1.60- 1.82- Ho95-988 2.10 1.80- 2.27 2.40 2.47- 1.97 2.17 HoCP96-540 2.07 2.10 1.90 2.30 2.90 1.97 2.21 L97-128 2.03 1.77- 2.57+ 2.60 2.57 2.03 2.26 L99-226 2.47 + 2.60+ 2.30+ 2.80+ 3.00 2.33+ 2.58+ L99-233 2.07 1.83 1.70 1.70- 1.87- 1.47- 1.77- HoCP00-950 1.70 - 1.83 1.70 2.07 2.20- 1.97 1.91- L01-283 1.80 1.97 1.93 2.13 2.33- 1.63- 1.97- L01-299 1.87 1.97 1.87 1.77- 2.10- 1.90 1.91- Table 12. First-stubble stalk number for seven commercial and three experimental varieties at six outfield locations in 2006. Heavy Light
Variety Allains Magnolia Glenwood Lanaux R. Hebert St. John Mean (stalks/A)
LCP85-384 33137 25908 31402 42618+ 25781 31460 31717 HoCP91-555 33331 21356 34040 37479 36476+ 31065 32291 Ho95-988 29793 27266 29759 29963 31189 28729 29450 HoCP96-540 31981 22495 30039 30612 30762 27100 28831 L97-128 28317 23621 22206 29927 28268 29084 26904 L99-226 30559 22258 28201 27059 27531 25941 26925 L99-233 30266 27906 34817 51537+ 41120+ 37020+ 37111+ HoCP00-950 33467 21142 37386 31207 35000 31043 31541 L01-283 31738 24826 39505+ 41871+ 40528+ 39268+ 36289+ L01-299 37527 24284 44710+ 48427+ 45919+ 36276+ 39524+
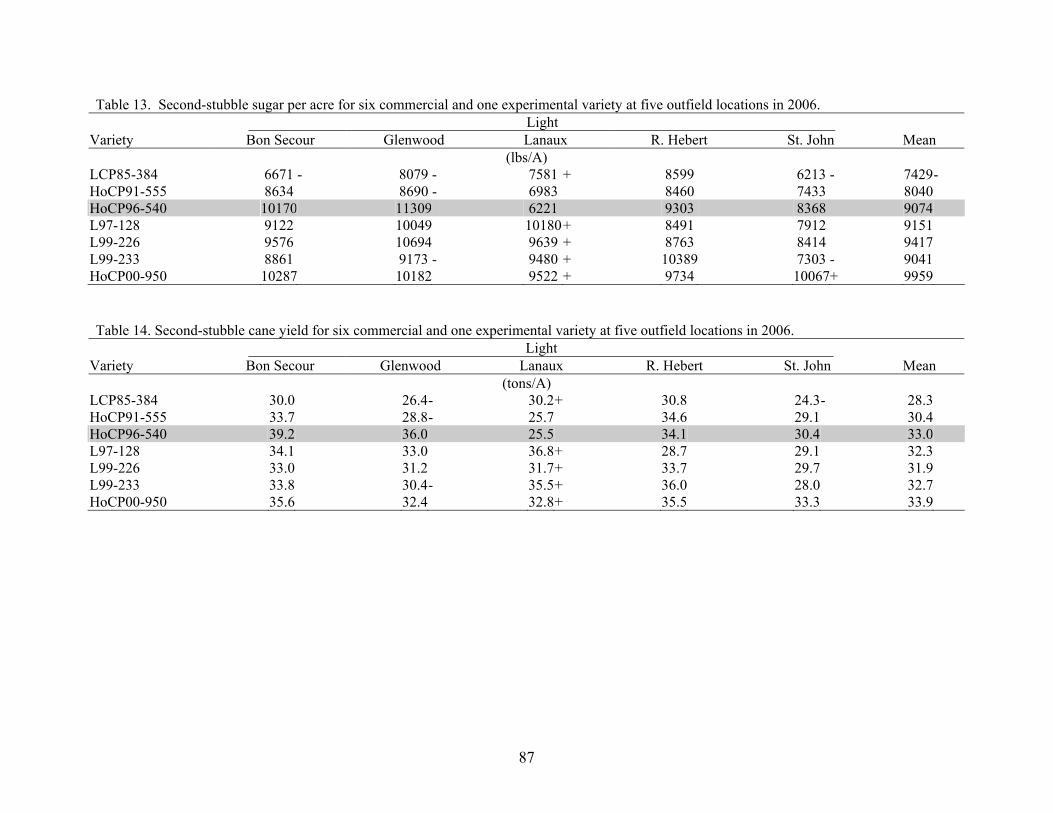
87
Table 13. Second-stubble sugar per acre for six commercial and one experimental variety at five outfield locations in 2006. Light
Variety Bon Secour Glenwood Lanaux R. Hebert St. John Mean (lbs/A)
LCP85-384 6671 - 8079 - 7581 + 8599 6213 - 7429- HoCP91-555 8634 8690 - 6983 8460 7433 8040 HoCP96-540 10170 11309 6221 9303 8368 9074 L97-128 9122 10049 10180+ 8491 7912 9151 L99-226 9576 10694 9639 + 8763 8414 9417 L99-233 8861 9173 - 9480 + 10389 7303 - 9041 HoCP00-950 10287 10182 9522 + 9734 10067+ 9959 Table 14. Second-stubble cane yield for six commercial and one experimental variety at five outfield locations in 2006. Light
Variety Bon Secour Glenwood Lanaux R. Hebert St. John Mean (tons/A)
LCP85-384 30.0 26.4- 30.2+ 30.8 24.3- 28.3 HoCP91-555 33.7 28.8- 25.7 34.6 29.1 30.4 HoCP96-540 39.2 36.0 25.5 34.1 30.4 33.0 L97-128 34.1 33.0 36.8+ 28.7 29.1 32.3 L99-226 33.0 31.2 31.7+ 33.7 29.7 31.9 L99-233 33.8 30.4- 35.5+ 36.0 28.0 32.7 HoCP00-950 35.6 32.4 32.8+ 35.5 33.3 33.9
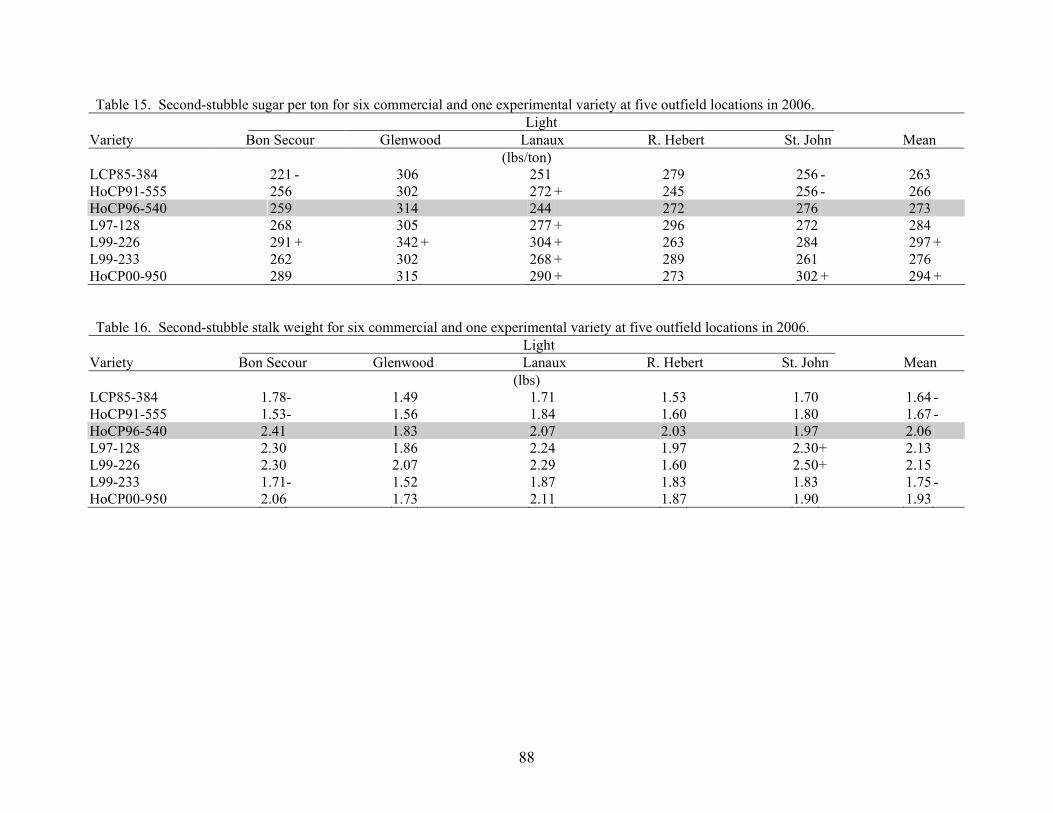
88
Table 15. Second-stubble sugar per ton for six commercial and one experimental variety at five outfield locations in 2006. Light
Variety Bon Secour Glenwood Lanaux R. Hebert St. John Mean (lbs/ton)
LCP85-384 221 - 306 251 279 256 - 263 HoCP91-555 256 302 272 + 245 256 - 266 HoCP96-540 259 314 244 272 276 273 L97-128 268 305 277 + 296 272 284 L99-226 291 + 342 + 304 + 263 284 297 + L99-233 262 302 268 + 289 261 276 HoCP00-950 289 315 290 + 273 302 + 294 + Table 16. Second-stubble stalk weight for six commercial and one experimental variety at five outfield locations in 2006. Light
Variety Bon Secour Glenwood Lanaux R. Hebert St. John Mean (lbs)
LCP85-384 1.78 - 1.49 1.71 1.53 1.70 1.64 - HoCP91-555 1.53 - 1.56 1.84 1.60 1.80 1.67 - HoCP96-540 2.41 1.83 2.07 2.03 1.97 2.06 L97-128 2.30 1.86 2.24 1.97 2.30+ 2.13 L99-226 2.30 2.07 2.29 1.60 2.50+ 2.15 L99-233 1.71 - 1.52 1.87 1.83 1.83 1.75 - HoCP00-950 2.06 1.73 2.11 1.87 1.90 1.93

89
Table 17. Second-stubble stalk number for six commercial and one experimental variety at five outfield locations in 2006. Light
Variety Bon Secour Glenwood Lanaux R. Hebert St. John Mean (stalks/A)
LCP85-384 33887 35473 36647 45073 28688 35954 HoCP91-555 45468+ 37060 28632 43308 32597 37413 HoCP96-540 32927 39822 24842 35432 31153 32835 L97-128 29574 35484 33070 29150 25302 30516 L99-226 28588 30745 29077 44138 23775- 31265 L99-233 40269 40106 38311 39711 30553 37790 HoCP00-950 34951 38646 31774 38730 35553 35931 Table 18. Third-stubble sugar per acre for seven commercial varieties at three outfield locations in 2006.
Light Variety Bon Secour Glenwood Lanaux Mean
(tons/A) LCP85-384 7471 7393 8419 7761 HoCP85-845 8449 10333 7113 8632 HoCP91-555 7924 8245 7926 8031 HoCP96-540 9286 8093 8013 8464 L97-128 9178 9676 10108 9654 L99-226 8903 8434 8888 8741 L99-233 10221 8682 9997 9634

90
Table 19. Third-stubble cane yield for seven commercial varieties at three outfield locations in 2006. Light
Variety Bon Secour Glenwood Lanaux Mean (tons/A)
LCP85-384 30.6 - 30.2 32.4 31.1 HoCP85-845 33.2 - 40.0 29.6 34.3 HoCP91-555 29.1 - 32.1 29.6 30.3 HoCP96-540 37.8 32.1 33.0 34.3 L97-128 35.2 40.0 38.3 37.8 L99-226 32.8 - 30.8 30.9 31.5 L99-233 38.5 37.4 38.5 38.2 Table 20. Third-stubble sugar per ton for seven commercial varieties at three outfield locations in 2006. Light
Variety Bon Secour Glenwood Lanaux Mean (tons/A)
LCP85-384 244 245 260 249 HoCP85-845 254 255 241 250 HoCP91-555 271 257 267 265 + HoCP96-540 246 252 241 247 L97-128 261 242 264 256 L99-226 271 272 288+ 277 + L99-233 265 233 260 253 Table 21. Third-stubble stalk weight for seven commercial varieties at three outfield locations in 2006. Light
Variety Bon Secour Glenwood Lanaux Mean (tons/A)
LCP85-384 1.63 - 1.50- 1.53 - 1.55- HoCP85-845 2.36 1.80- 1.52 - 1.89- HoCP91-555 1.65 1.77- 1.75 - 1.72- HoCP96-540 2.18 2.27 2.33 2.26 L97-128 2.59 2.19 2.10 2.29 L99-226 2.45 2.31 2.43 2.39 L99-233 1.89 1.48- 1.92 - 1.76- Table 22. Third-stubble stalk number for seven commercial varieties at three outfield locations in 2006. Light
Variety Bon Secour Glenwood Lanaux Mean (tons/A)
LCP85-384 37615 40616 42573 40268+ HoCP85-845 29261 44546 39231 37679 HoCP91-555 35993 36395 34421 35603 HoCP96-540 35104 28391 28665 30720 L97-128 27189 37038 36512 33580 L99-226 27062 26771 25624 26485 L99-233 41019 53115 40236 44790+

91
Table 23. Plantcane means from seven outfield locations in 2006: Allains, Alma, Bon Secour, Glenwood, Lanaux, Magnolia, and R. Hebert farms.
Variety Sugar per Acre Cane Yield Sugar per Ton Stalk Weight Stalk Number (lbs/A) (tons/A) (lbs/ton) (lbs) (stalks/A)
LCP85-384 8121 - 30.2- 268 1.93 - 31533 CP89-2143 8560 - 34.3- 251- 2.51 28389 Ho95-988 9809 36.7 267 2.29 32904 HoCP96-540 10559 38.8 273 2.50 32070 L97-128 10009 38.5 260 2.47 31948 L99-226 11148 39.0 286 2.70 30077 L99-233 10340 38.9 264 1.93 - 41074+ HoCP00-950 10767 37.0 291+ 2.18 - 34687 L01-283 9974 36.7 271 2.09 - 36104 L01-299 10119 36.6 276 2.25 33062 HoCP02-623 9639 - 35.4- 273 2.06 - 34933 Table 24. First-stubble means from six outfield locations in 2006: Allains, Glenwood, Lanaux,
Magnolia, R. Hebert and St. John farms. Variety Sugar per Acre Cane Yield Sugar per Ton Stalk Weight Stalk Number
(lbs/A) (tons/A) (lbs/ton) (lbs) (stalks/A) LCP85-384 7381 - 27.2- 270 1.73 - 31717 HoCP91-555 8092 29.3 276 1.82 - 32291 Ho95-988 8667 31.8 272 2.17 29450 HoCP96-540 8721 31.7 276 2.21 28831 L97-128 8249 30.3 272 2.26 26904 L99-226 10378 + 34.6 300+ 2.58 + 26925 L99-233 8754 32.2 271 1.77 - 37111+ HoCP00-950 8746 30.0 291+ 1.91 - 31541 L01-283 10207 + 35.7+ 286 1.97 - 36289+ L01-299 10049 + 37.6+ 265 1.91 - 39524+ Table 25. Second-stubble means from five outfield locations in 2006: Bon Secour, Glenwood, Lanaux,
R. Hebert and St. John farms. Variety Sugar per Acre Cane Yield Sugar per Ton Stalk Weight Stalk Number
(lbs/A) (tons/A) (lbs/ton) (lbs) (stalks/A) LCP85-384 7429- 28.3 263 1.64 - 35954 HoCP91-555 8040 30.4 266 1.67 - 37413 HoCP96-540 9074 33.0 273 2.06 32835 L97-128 9151 32.3 284 2.13 30516 L99-226 9417 31.9 297+ 2.15 31265 L99-233 9041 32.7 276 1.75 - 37790 HoCP00-950 9959 33.9 294+ 1.93 35931

92
Table 26. Third-stubble means from three outfield locations in 2006: Bon Secour, Glenwood and Lanaux farms.
Variety Sugar per Acre Cane Yield Sugar per Ton Stalk Weight Stalk Number (lbs/A) (tons/A) (lbs/ton) (lbs) (stalks/A)
LCP85-384 7761 31.1 249 1.55 - 40268+ HoCP85-845 8632 34.3 250 1.89 - 37679 HoCP91-555 8031 30.3 265+ 1.72 - 35603 HoCP96-540 8464 34.3 247 2.26 30720 L97-128 9654 37.8 256 2.29 33580 L99-226 8741 31.5 277+ 2.39 26485 L99-233 9634 38.2 253 1.76 - 44790+ Table 27. Combined plantcane means across outfield locations from 2003 to 2006. Variety Sugar per Acre Cane Yield Sugar per Ton Stalk Weight Stalk Number
(lbs/A) (tons/A) (lbs/ton) (lbs) (stalks/A) LCP85-384 7490 - 27.6 - 271 - 1.89 - 29841 HoCP96-540 9217 33.2 278 2.43 28297 L97-128 8591 - 31.3 - 276 2.38 26583 L99-226 9844 + 33.6 293 + 2.74+ 25292- L99-233 9010 33.2 271 - 1.90 - 35949+ Table 28. Combined plantcane means across outfield locations from 2004 to 2006. Variety Sugar per Acre Cane Yield Sugar per Ton Stalk Weight Stalk Number
(lbs/A) (tons/A) (lbs/ton) (lbs) (stalks/A) LCP85-384 7396 - 27.3 - 271 - 1.80 - 30665 HoCP96-540 9456 33.8 280 2.33 29533 L97-128 8651 - 31.4 - 276 2.35 26987- L99-226 10065 + 34.3 294 + 2.69+ 26076- L99-233 9204 33.7 272 - 1.86 - 36840+ HoCP00-950 9567 32.1 - 298 + 2.07 - 31344 Table 29. Combined plantcane means across outfield locations from 2005 to 2006. Variety Sugar per Acre Cane Yield Sugar per Ton Stalk Weight Stalk Number
(lbs/A) (tons/A) (lbs/ton) (lbs) (stalks/A) LCP85-384 7507 - 27.7 - 270 - 1.77 - 31506 Ho95-988 9005 - 33.5 269 - 2.22 30559 HoCP96-540 9712 34.8 280 2.26 31273 L97-128 8720 - 33.0 264 - 2.32 28729 - L99-226 10362 + 35.3 293 + 2.59 + 27821 - L99-233 9423 35.3 266 - 1.83 - 39025 + HoCP00-950 9615 32.8 293 + 2.03 - 32581 L01-283 9473 33.9 279 2.00 - 34354 + L01-299 8866 - 32.8 268 - 2.07 - 32036

93
Table 30. Combined first-stubble means across outfield locations from 2004 to 2006. Variety Sugar per Acre Cane Yield Sugar per Ton Stalk Weight Stalk Number
(lbs/A) (tons/A) (lbs/ton) (lbs) (stalks/A) LCP85-384 6903 - 25.4 - 272 - 1.57 - 32733 + HoCP91-555 7890 27.8 283 1.75 - 32099 + HoCP96-540 8152 29.2 280 2.00 29502 L97-128 7760 27.8 - 279 2.05 27407 - L99-226 9120 + 30.5 299 + 2.35+ 26154 - L99-233 8073 29.3 276 1.64 - 36488 + Table 31. Combined first-stubble means across outfield locations from 2005 to 2006. Variety Sugar per Acre Cane Yield Sugar per Ton Stalk Weight Stalk Number
(lbs/A) (tons/A) (lbs/ton) (lbs) (stalks/A) LCP85-384 7075 - 26.2 - 270 - 1.56 - 34209+ HoCP91-555 8046 28.7 280 1.74 - 33286+ HoCP96-540 8461 30.0 282 2.01 30522 L97-128 7906 - 28.9 273 - 2.07 28351 L99-226 9506 + 32.0 + 296 + 2.39+ 27199- L99-233 8184 30.2 271 - 1.64 - 37829+ HoCP00-950 8588 28.9 297 + 1.79 - 32706 Table 32. Combined second-stubble means across outfield locations from 2005 to 2006. Variety Sugar per Acre Cane Yield Sugar per Ton Stalk Weight Stalk Number
(lbs/A) (tons/A) (lbs/ton) (lbs) (stalks/A) LCP85-384 6635 - 24.8 - 268 1.49 - 33935 HoCP91-555 6832 - 25.4 - 270 1.50 - 33657 HoCP96-540 7639 28.0 272 1.84 30420 L97-128 7834 28.2 276 1.87 30105 L99-226 8577 + 28.6 299 + 2.05+ 28571 L99-233 8108 29.9 270 1.54 - 38947+ Table 33. Combined third-stubble means across outfield locations from 2006. Variety Sugar per Acre Cane Yield Sugar per Ton Stalk Weight Stalk Number
(lbs/A) (tons/A) (lbs/ton) (lbs) (stalks/A) LCP85-384 7761 31.1 249 1.55- 40268+ HoCP85-845 8632 34.3 250 1.89- 37679 HoCP91-555 8031 30.3 265+ 1.72- 35603 HoCP96-540 8464 34.3 247 2.26 30720 L97-128 9654 37.8 256 2.29 33580 L99-226 8741 31.5 277+ 2.39 26485 L99-233 9634 38.2 253 1.76- 44790+

94
SUGAR RESEARCH STATION SUCROSE LABORATORY
Gert Hawkins and Kenneth Gravois Sugar Research Station
More than 3,500 samples were processed at the Sugar Research Station Sucrose Laboratory during the 2006 harvest season (Table 1). Standard laboratory procedures, which include use of Octapol® clarifier, were used to measure the Brix and pol of the juice. The pol was analyzed using an autopol 880 model that could read dark samples. The juice was extracted via a three-roller mill for 3,404 samples. Fiber analysis was done on 124 samples using a pre-breaker to shred the sample. The computer program used for the sucrose laboratory assigns a sample identification number to each set processed; in addition, it indicated the number of samples analyzed in that set. The program was designed to automatically calculate sucrose and theoretical recoverable sugar based on the Brix and pol numbers. The laboratory numbers were recorded on the sample tags and returned to the researchers, along with the computer file that contains Brix, pol and theoretical recoverable sugar per ton of cane. The sucrose laboratory processed samples from September 2006 to December 2006. Table 1. Number of sugarcane samples processed at the Sugar Sucrose Laboratory during the
2006 harvest season. Project Area Leader Number of Samples Agronomy James Griffin 12 Chuck Kennedy 554 Collins Kimbeng 351 Magdi Selim 12 Jim Wang 32 Iberia Research Station Howard Viator 240 Plant Pathology and Crop Physiology Jeff Hoy 412 Clayton Hollier 35 LCES Ben Legendre 504 Variety Development Line Trials 584 Increase 158 Nursery 248 Nursery (fiber) 76 Genetics (fiber) 48 Other 42 Contract Services 220 TOTAL 3528
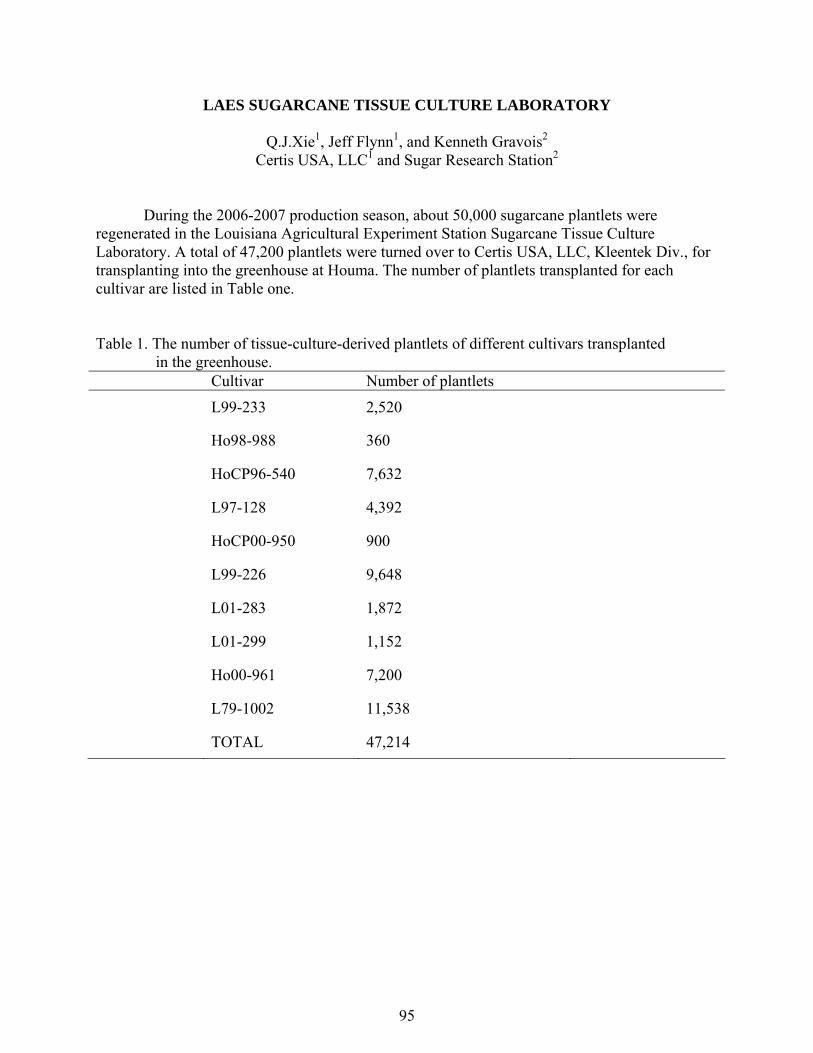
95
LAES SUGARCANE TISSUE CULTURE LABORATORY
Q.J.Xie1, Jeff Flynn1, and Kenneth Gravois2
Certis USA, LLC1 and Sugar Research Station2
During the 2006-2007 production season, about 50,000 sugarcane plantlets were regenerated in the Louisiana Agricultural Experiment Station Sugarcane Tissue Culture Laboratory. A total of 47,200 plantlets were turned over to Certis USA, LLC, Kleentek Div., for transplanting into the greenhouse at Houma. The number of plantlets transplanted for each cultivar are listed in Table one.
Table 1. The number of tissue-culture-derived plantlets of different cultivars transplanted in the greenhouse. Cultivar Number of plantlets
L99-233 2,520
Ho98-988 360
HoCP96-540 7,632
L97-128 4,392
HoCP00-950 900
L99-226 9,648
L01-283 1,872
L01-299 1,152
Ho00-961 7,200
L79-1002 11,538
TOTAL 47,214
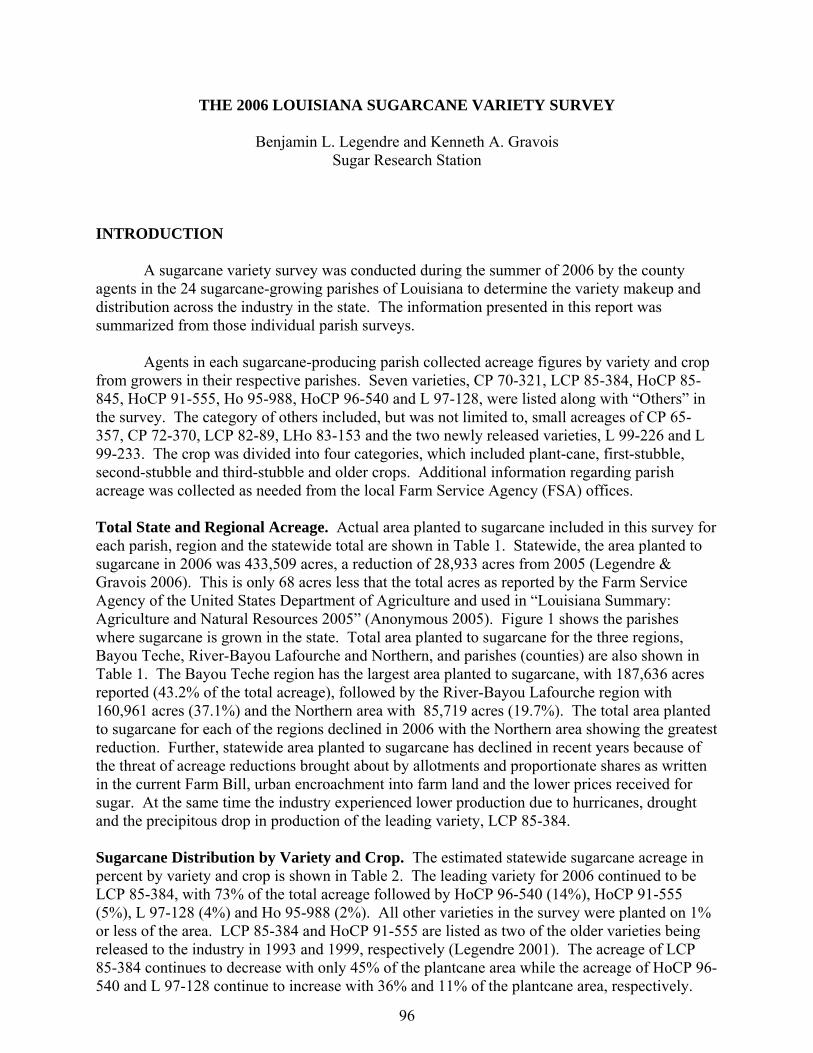
96
THE 2006 LOUISIANA SUGARCANE VARIETY SURVEY Benjamin L. Legendre and Kenneth A. Gravois
Sugar Research Station
INTRODUCTION A sugarcane variety survey was conducted during the summer of 2006 by the county agents in the 24 sugarcane-growing parishes of Louisiana to determine the variety makeup and distribution across the industry in the state. The information presented in this report was summarized from those individual parish surveys. Agents in each sugarcane-producing parish collected acreage figures by variety and crop from growers in their respective parishes. Seven varieties, CP 70-321, LCP 85-384, HoCP 85-845, HoCP 91-555, Ho 95-988, HoCP 96-540 and L 97-128, were listed along with “Others” in the survey. The category of others included, but was not limited to, small acreages of CP 65-357, CP 72-370, LCP 82-89, LHo 83-153 and the two newly released varieties, L 99-226 and L 99-233. The crop was divided into four categories, which included plant-cane, first-stubble, second-stubble and third-stubble and older crops. Additional information regarding parish acreage was collected as needed from the local Farm Service Agency (FSA) offices. Total State and Regional Acreage. Actual area planted to sugarcane included in this survey for each parish, region and the statewide total are shown in Table 1. Statewide, the area planted to sugarcane in 2006 was 433,509 acres, a reduction of 28,933 acres from 2005 (Legendre & Gravois 2006). This is only 68 acres less that the total acres as reported by the Farm Service Agency of the United States Department of Agriculture and used in “Louisiana Summary: Agriculture and Natural Resources 2005” (Anonymous 2005). Figure 1 shows the parishes where sugarcane is grown in the state. Total area planted to sugarcane for the three regions, Bayou Teche, River-Bayou Lafourche and Northern, and parishes (counties) are also shown in Table 1. The Bayou Teche region has the largest area planted to sugarcane, with 187,636 acres reported (43.2% of the total acreage), followed by the River-Bayou Lafourche region with 160,961 acres (37.1%) and the Northern area with 85,719 acres (19.7%). The total area planted to sugarcane for each of the regions declined in 2006 with the Northern area showing the greatest reduction. Further, statewide area planted to sugarcane has declined in recent years because of the threat of acreage reductions brought about by allotments and proportionate shares as written in the current Farm Bill, urban encroachment into farm land and the lower prices received for sugar. At the same time the industry experienced lower production due to hurricanes, drought and the precipitous drop in production of the leading variety, LCP 85-384. Sugarcane Distribution by Variety and Crop. The estimated statewide sugarcane acreage in percent by variety and crop is shown in Table 2. The leading variety for 2006 continued to be LCP 85-384, with 73% of the total acreage followed by HoCP 96-540 (14%), HoCP 91-555 (5%), L 97-128 (4%) and Ho 95-988 (2%). All other varieties in the survey were planted on 1% or less of the area. LCP 85-384 and HoCP 91-555 are listed as two of the older varieties being released to the industry in 1993 and 1999, respectively (Legendre 2001). The acreage of LCP 85-384 continues to decrease with only 45% of the plantcane area while the acreage of HoCP 96-540 and L 97-128 continue to increase with 36% and 11% of the plantcane area, respectively.

97
Growers, concerned with the decline in yield of LCP 85-384, are switching to the newer varieties, especially HoCP 96-540 until other varieties are developed and released to the industry. The two remaining new varieties, Ho 95-988 and L 97-128, occupied most of the remaining plantcane area in 2006. Of the older varieties, other than LCP 85-384, HoCP 91-555 was planted on only 3% of the planted area. HoCP 85-845 continued to decline across crop years with 3% in third-and older stubble crops and only 1% in the plant-cane crop. CP 70-321, the leading variety prior to the release of LCP 85-384 in 1993, occupied less than 1% of the total acreage in 2006. Two new varieties, L 99-226 and L 99-233, were released to the industry in the fall of 2006 with only limited acreage on the secondary increase stations. Most of the seed cane on the secondary stations was distributed to the industry for planting. There are four additional varieties on the secondary increase stations that will be candidates for commercial release during the next several years. They are HoCP 00-950, L 01-283 and L 01-299 and CP 89-2143, a commercial variety in Florida being tested for adaptability in Louisiana. The majority of the Louisiana sugarcane crop has been harvested by cane combine since 2000 when over 70% of the crop was planted to LCP 85-384 (Legendre & Gravois 2006), presumably to take advantage of the superior yield potential of the variety. However, with the lower yields experienced since 2003, especially in the older stubble crops, approximately 20% of the State’s growers have switched back to the whole-stalk “soldier” system for harvesting their crops because of lower costs of operating the equipment. The yield of LCP 85-384 rebounded somewhat in 2006; however, the superior yield potential of the newer varieties, especially HoCP 96-540, gave growers optimism for the future. Sugarcane Distribution by Region and Crop. With the prominence of LCP 85-384, there had been a trend to plant less cane each year and keep more acres in older stubble crops; however, because of the poor performance of LCP 85-384, especially in the older stubble crops, that trend changed in 2004 and continued into 2006 when more acres were replanted in all regions than had been seen in previous years (Table 3). In 2006, there was an increase in plantcane acreage to 29.8% while the acreage of third and older stubble decreased to only 16.7%. As recently as 2003, the acreage in second and older stubble was over 50% of the total acreage; now it is only 41.8%. For the current survey, the Northern region, which has routinely kept older stubble, had only 22.0 % in third and older stubble in 2006 (Table 3). On the other hand, the percentage in plantcane was 27.6%. The River-Bayou Lafourche region tends to plant more cane each year, with less of its area devoted to stubble crops. In this region, there was only 15.2% of the acreage in third- and older stubble crops and 30.9% in the plant-cane crop in 2006. The trend for less stubble and more plantcane was also evident for the Bayou Teche region. With increased planting, the amount of older stubble decreased from 20.6% in 2005 to 15.6% in 2006 while plantcane increased from 29.2% in 2005 to 29.7% in 2006.
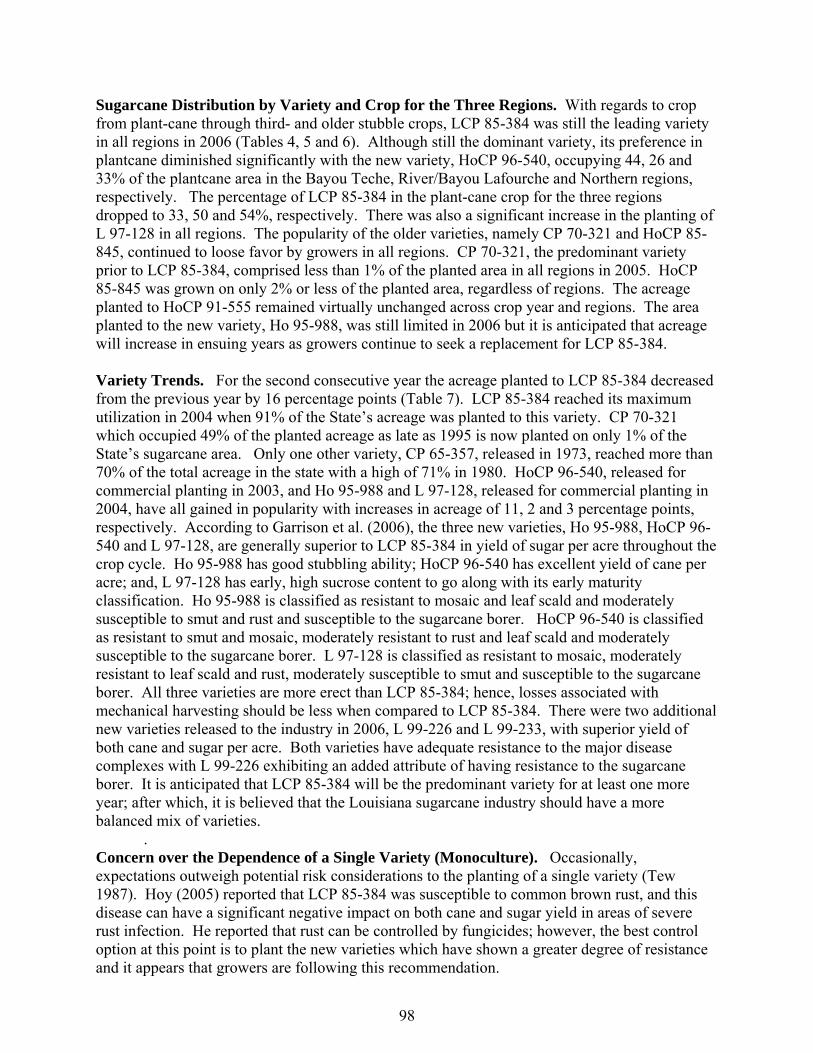
98
Sugarcane Distribution by Variety and Crop for the Three Regions. With regards to crop from plant-cane through third- and older stubble crops, LCP 85-384 was still the leading variety in all regions in 2006 (Tables 4, 5 and 6). Although still the dominant variety, its preference in plantcane diminished significantly with the new variety, HoCP 96-540, occupying 44, 26 and 33% of the plantcane area in the Bayou Teche, River/Bayou Lafourche and Northern regions, respectively. The percentage of LCP 85-384 in the plant-cane crop for the three regions dropped to 33, 50 and 54%, respectively. There was also a significant increase in the planting of L 97-128 in all regions. The popularity of the older varieties, namely CP 70-321 and HoCP 85-845, continued to loose favor by growers in all regions. CP 70-321, the predominant variety prior to LCP 85-384, comprised less than 1% of the planted area in all regions in 2005. HoCP 85-845 was grown on only 2% or less of the planted area, regardless of regions. The acreage planted to HoCP 91-555 remained virtually unchanged across crop year and regions. The area planted to the new variety, Ho 95-988, was still limited in 2006 but it is anticipated that acreage will increase in ensuing years as growers continue to seek a replacement for LCP 85-384. Variety Trends. For the second consecutive year the acreage planted to LCP 85-384 decreased from the previous year by 16 percentage points (Table 7). LCP 85-384 reached its maximum utilization in 2004 when 91% of the State’s acreage was planted to this variety. CP 70-321 which occupied 49% of the planted acreage as late as 1995 is now planted on only 1% of the State’s sugarcane area. Only one other variety, CP 65-357, released in 1973, reached more than 70% of the total acreage in the state with a high of 71% in 1980. HoCP 96-540, released for commercial planting in 2003, and Ho 95-988 and L 97-128, released for commercial planting in 2004, have all gained in popularity with increases in acreage of 11, 2 and 3 percentage points, respectively. According to Garrison et al. (2006), the three new varieties, Ho 95-988, HoCP 96-540 and L 97-128, are generally superior to LCP 85-384 in yield of sugar per acre throughout the crop cycle. Ho 95-988 has good stubbling ability; HoCP 96-540 has excellent yield of cane per acre; and, L 97-128 has early, high sucrose content to go along with its early maturity classification. Ho 95-988 is classified as resistant to mosaic and leaf scald and moderately susceptible to smut and rust and susceptible to the sugarcane borer. HoCP 96-540 is classified as resistant to smut and mosaic, moderately resistant to rust and leaf scald and moderately susceptible to the sugarcane borer. L 97-128 is classified as resistant to mosaic, moderately resistant to leaf scald and rust, moderately susceptible to smut and susceptible to the sugarcane borer. All three varieties are more erect than LCP 85-384; hence, losses associated with mechanical harvesting should be less when compared to LCP 85-384. There were two additional new varieties released to the industry in 2006, L 99-226 and L 99-233, with superior yield of both cane and sugar per acre. Both varieties have adequate resistance to the major disease complexes with L 99-226 exhibiting an added attribute of having resistance to the sugarcane borer. It is anticipated that LCP 85-384 will be the predominant variety for at least one more year; after which, it is believed that the Louisiana sugarcane industry should have a more balanced mix of varieties. . Concern over the Dependence of a Single Variety (Monoculture). Occasionally, expectations outweigh potential risk considerations to the planting of a single variety (Tew 1987). Hoy (2005) reported that LCP 85-384 was susceptible to common brown rust, and this disease can have a significant negative impact on both cane and sugar yield in areas of severe rust infection. He reported that rust can be controlled by fungicides; however, the best control option at this point is to plant the new varieties which have shown a greater degree of resistance and it appears that growers are following this recommendation.

99
Another disease was found in LCP 85-384 in recent years, sugarcane yellow leaf disease (Grisham et al. 2001); it appears that the variety is tolerant to this disease at least for the moment. However, it is entirely possible that this new virus is also taking its toll on yield of this variety. In a continuing effort to lessen the dependence of the industry on one variety, the Louisiana variety development program has developed three new high yielding varieties in recent years, namely, Ho 95-988, HoCP 96-540 and L 97-128. The two newest varieties, L 99-226 and L 99-233, should further reduce the future prospect of a monoculture again. Millhollon and Legendre (1996) found that the annual use of glyphosate as a ripener will usually increase the yield of sugar per ton of cane and per acre; however, the magnitude of the increase depended on the tolerance of the variety to the treatment. They found that LCP 85-384 is very sensitive to glyphosate, especially at rates higher than generally recommended and the treatment was shown to cause a significant reduction in cane yield in the subsequent stubble crops. Glyphosate is now used on approximately 75% of the total area planted to sugarcane for enhancing maturity of the crop and increasing yield of sugar per ton of cane and per acre. With LCP 85-384 as the major variety, there is the possibility that part of the yield decline experienced in the older stubble crops was caused, in part, by the sensitivity of LCP 85-384 to glyphosate brought on because of the earlier factory starts in the month of September. This is another reason why the industry might want to consider diversifying into other varieties. The older varieties, namely HoCP 85-845 and HoCP 91-555, are not as sensitive to annual applications of glyphosate as LCP 85-384. In 2006, HoCP 96-540 was found to be very sensitive to residue carryover following green cane harvesting where the cane was treated with glyphosate (Ryan Viator, unpublished data). In these studies, the yield of sugar per acre for HoCP 96-540 was significantly reduced where the cane had been treated with glyphosate and the residue was allowed to remain in the fields. However, with the removal of the residue, it did not appear that glyphosate reduced yield in the subsequent stubble crop. ACKNOWLEDGMENTS We acknowledge the assistance of the county agents for soliciting the sugarcane variety information published in this survey. We also want to thank the sugarcane growers who took the time and effort to respond to the survey from their agents. We would also like to acknowledge the assistance of the various USDA-FSA offices in the sugarcane parishes for certified acreage figures. REFERENCES Anonymous. 2005. Louisiana Summary: Agriculture and Natural Resources 2005. Louisiana State University Agricultural Center, Louisiana Cooperative Extension Service, Pub. 2382.
100
Grisham, M.P., Pan, Y.-B., Legendre, B.L., Godshall, M.A. and Eggleston, G. 2001. Effect of sugarcane yellow leaf virus on sugarcane yield and juice quality. Proc. Int. Soc. Sugar Cane Technol. 24:434-438. Hoy, Jeff. 2005. Impact of Rust on LCP 85-384. Sugar Bull. 84(1):12-13. Legendre, B.L. 2001. Sugarcane Production Handbook – 2001. Louisiana State University Agric. Center Pub. 2859. Legendre, B.L. and Gravois, K.A. 2006. The 2005 Louisiana Variety Survey. Sugar Bull. 84(9):28-31. Millhollon, R.W. and Legendre, B.L. 1996. Sugarcane yield as affected by annual glyphosate ripener treatments. J. Amer. Soc. Sugar Cane Technol. 16:7-16. Garrison, D.D., Waguespack, H.L., Jackson, W.R., Robert, T.J. and Gravois, K.A. 2006. A Report on the 2005 Outfield Variety Tests. Sugar Bull. 84(10):21-24. Tew, T. L. 1987. New varieties. In: Don J. Heinz (Ed.): Sugarcane Improvements through Breeding. Developments in Crop Science 11, Elsevier, Amsterdam, pp. 559-594.
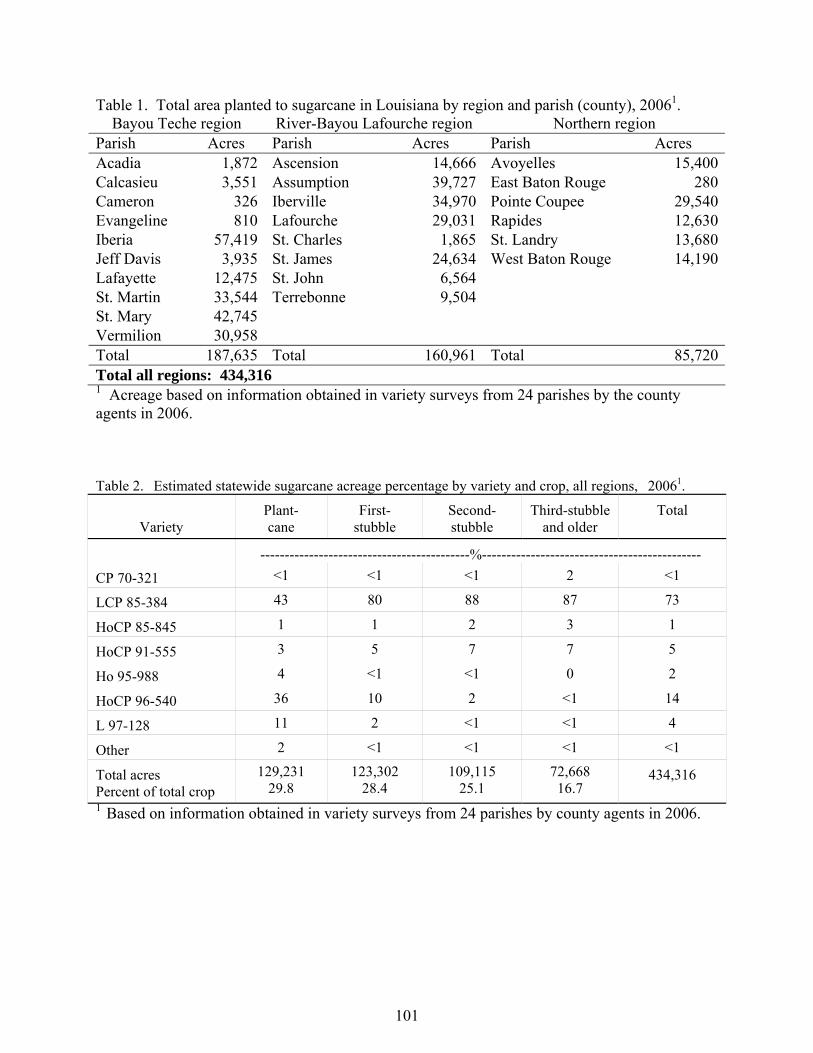
101
Table 1. Total area planted to sugarcane in Louisiana by region and parish (county), 20061. Bayou Teche region River-Bayou Lafourche region Northern region
Parish Acres Parish Acres Parish Acres Acadia 1,872 Ascension 14,666 Avoyelles 15,400Calcasieu 3,551 Assumption 39,727 East Baton Rouge 280Cameron 326 Iberville 34,970 Pointe Coupee 29,540Evangeline 810 Lafourche 29,031 Rapides 12,630Iberia 57,419 St. Charles 1,865 St. Landry 13,680Jeff Davis 3,935 St. James 24,634 West Baton Rouge 14,190Lafayette 12,475 St. John 6,564 St. Martin 33,544 Terrebonne 9,504 St. Mary 42,745 Vermilion 30,958 Total 187,635 Total 160,961 Total 85,720Total all regions: 434,316 1 Acreage based on information obtained in variety surveys from 24 parishes by the county agents in 2006. Table 2. Estimated statewide sugarcane acreage percentage by variety and crop, all regions, 20061.
Variety
Plant- cane
First- stubble
Second- stubble
Third-stubble and older
Total
-------------------------------------------%--------------------------------------------- CP 70-321 <1 <1 <1 2 <1
LCP 85-384 43 80 88 87 73
HoCP 85-845 1 1 2 3 1
HoCP 91-555 3 5 7 7 5
Ho 95-988 4 <1 <1 0 2
HoCP 96-540 36 10 2 <1 14
L 97-128 11 2 <1 <1 4
Other 2 <1 <1 <1 <1
Total acres Percent of total crop
129,231 29.8
123,302 28.4
109,115 25.1
72,668 16.7
434,316
1 Based on information obtained in variety surveys from 24 parishes by county agents in 2006.

102
Table 3. Estimated sugarcane distribution by region and crop, 20061.
1 Based on information obtained in variety surveys from 24 parishes by county agents in 2006. Table 4. Estimated area planted to sugarcane in percent by variety and crop for the Bayou Teche region, 20061.
Variety
Plant-cane crop (%)
First-stubble crop (%)
Second-stubble crop
(%)
Third-stubble crop & older
(%)
Total (%)
CP 70-321 0 <1 2 3 1 LCP 85-384 33 75 83 79 65 HoCP 85-845 1 1 1 4 2 HoCP 91-555 4 8 11 12 8 Ho 95-988 3 <1 0 0 1 HoCP 96-540 44 11 2 <1 17 L 97-128 12 2 <1 <1 4 Others 2 <1 <1 2 1 Totals 100 100 100 100 100
1 Based on information obtained in variety surveys from 24 parishes by county agents in 2006.
Crop Bayou Teche River-Bayou Lafourche
Northern State Total
Plant-cane Area (acres) Percent (%)
55,771 29.7
49,809 30.9
23,652 27.6
129,231 29.8
First-stubble Area (acres) Percent (%)
55,055 29.3
45,877 28.5
22,371
26.1
123,301
28.4
Second-stubble Area (acres) Percent (%)
47,508 25.3
40,778 25.3
20,829
24.3
109,115
25.1
Third-stubble and older Area (acres) Percent (%)
29,303 15.7
24,499 15.3
18,868
22.0
72,669 16.7
Total area (acres) Percent (%)
187,636 43.2
160,961 37.1
85,719 19.7 434,316
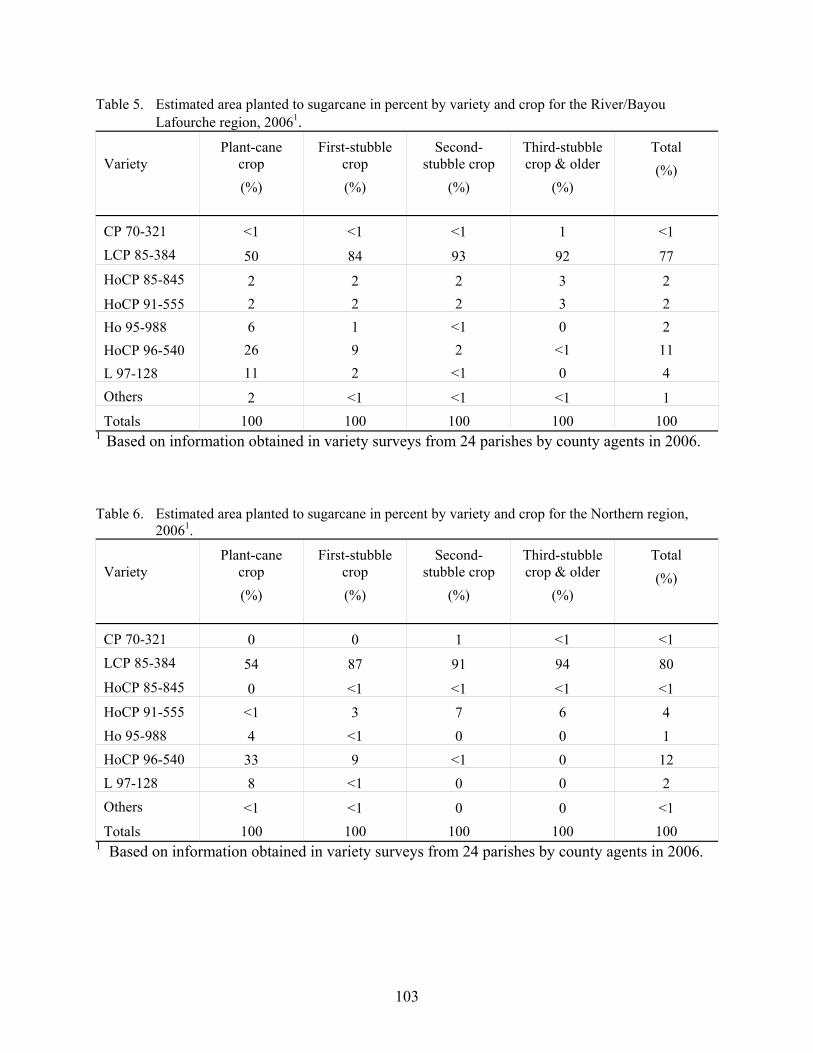
103
Table 5. Estimated area planted to sugarcane in percent by variety and crop for the River/Bayou Lafourche region, 20061.
Variety
Plant-cane crop (%)
First-stubble crop (%)
Second-stubble crop
(%)
Third-stubble crop & older
(%)
Total (%)
CP 70-321 <1 <1 <1 1 <1 LCP 85-384 50 84 93 92 77 HoCP 85-845 2 2 2 3 2 HoCP 91-555 2 2 2 3 2 Ho 95-988 6 1 <1 0 2 HoCP 96-540 26 9 2 <1 11 L 97-128 11 2 <1 0 4 Others 2 <1 <1 <1 1 Totals 100 100 100 100 100
1 Based on information obtained in variety surveys from 24 parishes by county agents in 2006. Table 6. Estimated area planted to sugarcane in percent by variety and crop for the Northern region, 20061.
Variety
Plant-cane crop (%)
First-stubble crop (%)
Second-stubble crop
(%)
Third-stubble crop & older
(%)
Total (%)
CP 70-321 0 0 1 <1 <1 LCP 85-384 54 87 91 94 80 HoCP 85-845 0 <1 <1 <1 <1 HoCP 91-555 <1 3 7 6 4 Ho 95-988 4 <1 0 0 1 HoCP 96-540 33 9 <1 0 12 L 97-128 8 <1 0 0 2 Others <1 <1 0 0 <1 Totals 100 100 100 100 100
1 Based on information obtained in variety surveys from 24 parishes by county agents in 2006.

104
Table 7. Louisiana sugarcane variety trends, by variety and years, all regions, 2002-20061. Area planted to sugarcane by variety and years (%)
Variety
2002
2003
2004
2005
2006
1 yr. Change
CP 70-321 5 3 2 1 <1 -1LCP 85-384 85 88 91 89 73 -16HoCP 85-845 6 4 3 2 1 -1
HoCP 91-555 3 4 3 4 5 +1Ho 95-988 0 0 <1 <1 2 +2HoCP 96-540 0 <1 1 3 14 +11L 97- 128 0 0 <1 1 4 +3Others <1 <1 <1 <1 <1 0Totals 100 100 100 100 100 1 Based on annual variety surveys from 24 parishes by county agents, 2002-2006.
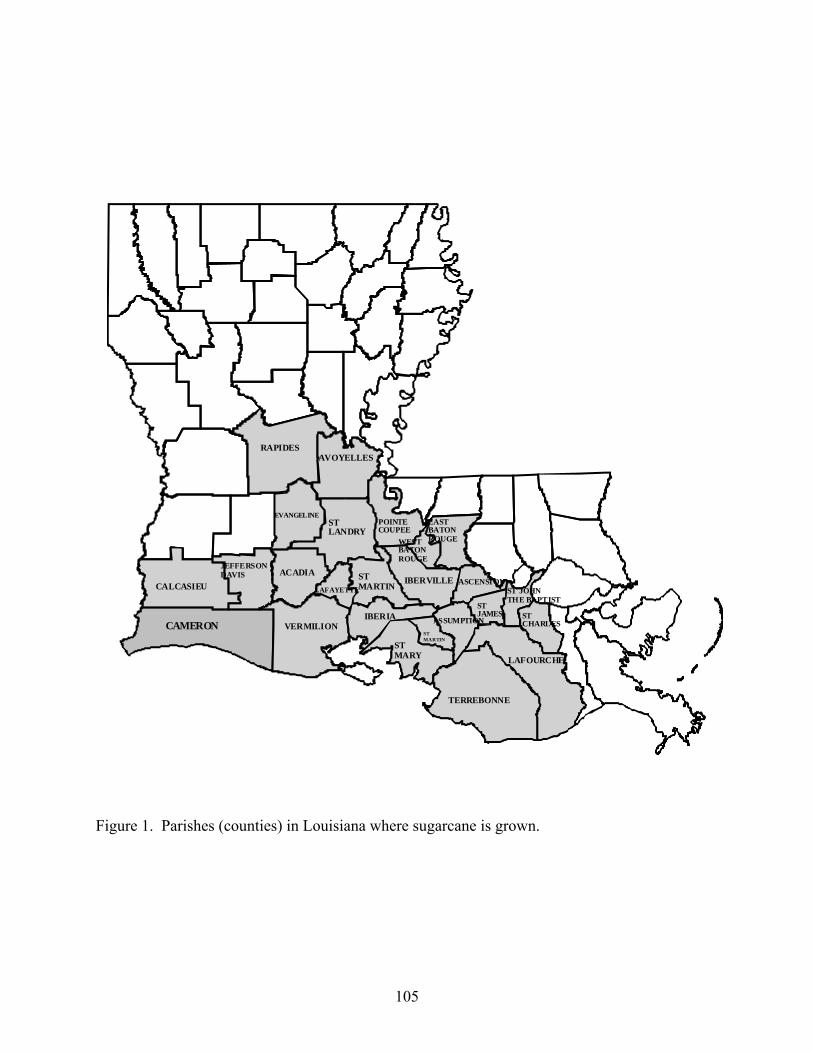
105
Figure 1. Parishes (counties) in Louisiana where sugarcane is grown.
STLANDRY
AVOYELLES
STMARTIN
STMARTIN
ACADIA
VERMILIONIBERIA
STMARY
TERREBONNE
LAFOURCHE
STCHARLES
ST JOHNTHE BAPTIST
STJAMES
ASSUMPTION
ASCENSIONIBERVILLE
EASTBATONROUGEWEST
BATONROUGE
POINTECOUPEE
JEFFERSONDAVIS
CALCASIEU LAFAYETTE
RAPIDES
EVANGELINE
CAMERON

106
LINKAGE MAPPING AND GENOME ANALYSIS IN A SACCHARUM INTERSPECIFIC CROSS USING AFLP, SRAP AND TRAP MARKERS
Sreedhar Alwala1, Collins A. Kimbeng1*, John C. Veremis2, Kenneth A. Gravois3
1School of Plant, Environmental and Soil Sciences, Louisiana State University
Agricultural Center, Baton Rouge, LA 70803
2USDA-ARS, SRRC, Sugarcane Research Unit, 5883 USDA Road, Houma, LA 70360
3Sugar Research Station, Louisiana Agricultural Experiment Station, Louisiana
State University Agricultural Center, St. Gabriel, LA 70776
*Corresponding author: [email protected] Abstract: Framework genetic linkage maps of two progenitor species of cultivated sugarcane, Saccharum officinarum ‘La Striped’ (2n=80) and S. spontaneum ‘SES 147B’ (2n=64) were constructed using amplified fragment length polymorphism (AFLP), sequence related amplified polymorphism (SRAP) and target region amplification polymorphism (TRAP) markers. The mapping population comprised of 100 F1 progeny derived from the Saccharum interspecific cross. A total of 344 polymorphic markers were generated from the female (S. officinarum) parent out of which 247 (72%) were single dose (segregating in a 1:1 ratio) and 33 (10%) were double dose (segregating in a 3.3:1 ratio) markers. Sixty-four (18%) markers deviated from Mendelian segregation ratios. Likewise, in the S. spontaneum genome, out of a total of 306 markers, 221 (72%) were single dose and 43 (14%) were double dose markers whereas 42 markers (14%) deviated from Mendelian segregation ratios. Linkage maps with Kosambi map distances were constructed using a LOD score of > 5.0 and a recombination threshold of 0.45. In Saccharum officinarum, 146 markers were linked to form 49 linkage groups (LG) spanning 1732 cM whereas in S. spontaneum, 121 markers were linked to form 45 LG spanning 1491 cM. The estimated genome size of S. officinarum ‘La Striped’ was 2487 cM whereas that of S. spontaneum ‘SES 147B’ was 3232 cM. The genome covered was found to be 69% in S. officinarum and 46% in S. spontaneum. The S. officinarum parent ‘La Striped’ behaved like an auto-allopolyploid whereas S. spontaneum ‘SES 147B’ behaved like a true autopolyploid. Although a huge amount of disparity appear to exist between the two genomes, the existence of simple duplex markers, which are heterozygous in both parents and segregate 3:1 in the progeny, in the population tends to affirm that pairing and recombination can occur between the two genomes. The study also revealed that, compared to AFLP, the SRAP and TRAP markers appear less effective as tools for rapidly generating a large number of genome-wide markers for linkage mapping. However, SRAP and TRAP markers can be useful for QTL mapping because of their ability to target gene rich regions of the genome and that is the focus of our subsequent study. Keywords: Saccharum – AFLP – SRAP – TRAP markers – linkage map – segregation distortion

107
INTRODUCTION
Sugarcane belongs to the genus Saccharum of the grass family Poaceae. Modern sugarcane cultivars (2n=100 -140) are highly heterozygous and complex aneuploids. They were derived from interspecific crosses between the domesticated species S. officinarum and it wild relative S. spontaneum. The initial interspecific hybrids were repeatedly backcrossed to S. officinarum. This process, termed as ‘nobilization’, retained the high sugar producing ability of S. officinarum and minimized the negative effects of S. spontaneum (Roach, 1972; Sreenivasan et al., 1987). The nobilization process also resulted in improved cane yields, ratooning ability and increased resistance to biotic and abiotic stresses. During nobilization the progeny inherited 2n gametes from the S. officinarum parent (Bhat and Gill, 1985; Bremer, 1961). Consequently, the genome composition of current sugarcane cultivars is approximately 80 % S. officinarum, 15 % S. spontaneum with 5% recombinant chromosomes (D’Hont et al., 1996).
S. officinarum clones are characterized by their thick stalks, high sucrose and low fiber content. Chromosome numbers have consistently been reported as 2n = 80 with x = 10 as the basic chromosome number (Sreenivasan et al., 1987; Daniels and Roach, 1987; D’Hont et al., 1998). S. spontaneum clones, on the other hand, are characterized by thin stalks, low sucrose, high fiber, profuse flowering, good ratooning ability, and high levels of disease and insect resistance. Chromosome numbers have been reported to range from 2n = 40 to 128 (Panje and Babu, 1960) with x = 8 as the basic chromosome number (Al-Janabi et al., 1993; da Silva et al., 1993; D’Hont et al., 1998).
Limited progress has been made in improving sugar content in most sugarcane breeding
programs especially in the last decade (Jackson, 2005). One reason that has been proposed for the lack of progress is the narrow genetic base of sugarcane cultivars. Most of the present day cultivars around the world can be traced back to a few progenitors used in the initial interspecific hybridizations during nobilization (Berding and Roach, 1987; Deren, 1995). In most sugarcane breeding programs, crosses are made among existing improved clones followed by clonal selections. Following the success of nobilization, only sporadic efforts were made by a few breeding programs to utilize new sources of wild germplasm for sugarcane improvement (Berding and Roach, 1987). There is renewed interest among sugarcane breeders to explore wild germplasm for novel sources of genes that could be useful in sugarcane breeding programs.
Molecular markers can play a pivotal role in tracking favorable alleles from wild species as well as ascertaining their introgression into the cultivated background (Edmé et al., 2006). Genetic linkage maps generated from molecular markers have facilitated gene tagging, map based cloning and QTL mapping in many crops. They have also been useful for studying genome architecture and evolution, especially in interspecific crosses (deVicente and Tanksley, 1993).
The earliest molecular genetic linkage maps of the progenitors of modern sugarcane were
developed in S. spontaneum using RFLP (da Silva et al., 1993; Ming et al., 1998) and RAPD markers (Al-Janabi et al., 1993) and in S. officinarum using RAPD (Mudge et al., 1996), and RFLP markers (Ming et al., 1998). Recently, Edmé et al. (2006) developed a S. spontaneum and S. officinarum map using SSR markers. AFLP markers have so far been used to construct genetic linkage maps of commercial sugarcane (Hoarau et al., 2001; Aitken et al., 2005; Reffay et al., 2005).

108
Molecular markers such as RFLP, RAPD, AFLP and SSR are ideal for genetic
fingerprinting and construction of linkage maps. However, they do not use prior gene sequence information and produce polymorphisms randomly across the genome. Two new PCR-based markers namely, SRAP (sequence related amplified polymorphism) and TRAP (target region amplification polymorphism) which amplify intragenic polymorphism have been reported. SRAP markers are arbitrarily designed with an AT- and GC-rich motif to anneal to intron and exons, respectively (Li and Quiros, 2001). Sequenced SRAP amplicons from Brassica (Li and Quiros, 2001) and Cucurbita (Ferriol et al., 2003) when used in BLAST searches revealed significant similarities to reported gene sequences found in Genebank databases. With TRAP markers, a forward or fixed primer is designed using gene/EST sequence information, whereas the reverse primer is similar to a SRAP primer (Hu and Vick, 2003). Using TRAP primers designed from resistance gene analogs, Miklas et al. (2006) reported that some of the polymorphisms produced on a preexisting common bean (Phaseolus vulgaris L.) mapping population mapped to the vicinity of resistance gene QTLs. In sugarcane, BLAST searches using sequenced TRAP amplicons from a S. spontaneum clone revealed high homology with known gene sequences from other grass species. Remarkably, the search also pulled up the S. officinarum GenBank accession from which the fixed TRAP primer was designed (Alwala et al., 2006a). SRAP markers have been integrated into genetic linkage maps of brassica (Li and Quiros, 2001) and TRAP markers have been integrated into maps of wheat (Liu et al., 2005) and common bean (Miklas et al., 2006). In sugarcane, SRAP and TRAP markers are being used to characterize parental and wild germplasm collections (Alwala et al., 2006a, 2006b; Suman and Kimbeng, 2007) but their potential for linkage and QTL mapping is yet to be ascertained.
The objective in this study was to construct molecular linkage maps of sugarcane using AFLP in conjunction with SRAP and TRAP markers. The maps were based on an F1 cross between two progenitor species of modern sugarcane namely, S. officinarum ‘La Striped’ and S. spontaneum ‘SES 147B’. These framework linkage maps would foster our understanding of genome architecture and organization in the two species and lay the ground work for subsequent QTL studies. MATERIAL AND METHoDS Plant Material and DNA extraction
The mapping population consisted of 100 clones derived from a S. officinarum (La Striped, 2n=80) X S. spontaneum (SES 147B, 2n=64) cross made at the Sugarcane Research Unit, USDA-ARS, Houma, Louisiana. Leaf tissue from F1 seedlings was collected, immediately frozen and later ground to powder in liquid nitrogen. Genomic DNA was extracted using Plant DNeasy Mini Kit (Qiagen, Valencia, CA) following the manufacturer’s protocol. The concentration of DNA was estimated using known concentration of Lambda DNA in 1% (w/v) agarose gel. AFLP protocol
Genomic DNA (50 ng) was digested with EcoR I (6bp cutter) and Mse I (4bp cutter) restriction enzymes. Following the protocol of Vos et al. (1995), the digested DNA was ligated to EcoR I and Mse I adapters. Pre-amplifications were done using EcoR I + A and Mse I + C primers followed by selective amplifications using two selective nucleotides. Following a similar protocol, the AFLP procedure was also carried out using Pst I (6 bp cutter) and Mse I restriction

109
enzymes. EcoR I and Pst I are methylation insensitive and sensitive, respectively. The PCR was carried out in a reaction volume of 10 µL consisting of 1 µL of 10X reaction buffer, 1.5 µL of 25 mM MgCl2, 1 µL of 10 mM dNTPs, 1 µL of 1 µM of E-ANN (IR-Dye labeled) and 1 µL of 10 µM forward primer and 0.2 µL of 5U Taq polymerase (Promega, Madison, WI). The reactions were run on an i-cycler (BioRad Labs, Hercules, CA). The PCR conditions for selective amplifications were as follows: initial denaturing step at 94 oC for 3 min followed by initial 12 cycles at 94 oC for 30 s, 65 oC for 30 s (with 1 oC decrement every cycle) and 72 oC for 1 min, then followed by 23 cycles at 94 oC for 30 s, 56 oC for 30 s, and 72 oC for 1 min with a final extension step at 72 oC for 7 min. A total of 20 EcoR I-Mse I and 15 Pst I-Mse I selective amplification primer combinations were used. SRAP protocol
The sequences of the forward and reverse SRAP primers used in this study are given in Table 1. The forward primers were unlabeled whereas the reverse primers were labeled with either IR-700 or IR-800 dyes. PCR amplifications were carried out in a 10 µL reaction volume containing 1.5 µL of 10X PCR buffer, 1.0 µL of 25 mM MgCl2, 1.0 µL each of 10 mM forward and IR-700 and IR-800 dye labeled reverse primers, 1.0 µL of 10 mM dNTPs (Promega, Madison, WI), 0.2 µL of 5U Taq polymerase (Promega, Madison, WI) and 1.0 µL of 50 to 80 ng genomic DNA. The conditions for PCR were as follows: an initial denaturing step was performed at 94 oC for 4 min followed by 5 cycles at 94 oC for 45 s, 35 oC for 45 s and 72 oC for 1 min, followed by 35 cycles at 94 oC for 45 s, 53 oC for 45 s, and 72 oC for 1 min with a final extension step at 72 oC for 7 min. All the PCR reactions were performed on an i-cycler (BioRad Labs, Hercules, CA). A total of 32 SRAP primer combinations were used. TRAP protocol
The TRAP, like SRAP, is also a two primer PCR marker technique. The design of fixed/forward primers used in this study was previously described in Alwala et al. (2006a). In brief, three forward primers were designed using the gene/EST sequences of sucrose synthase (SuSy), soluble acid invertase (SAI) and calcium dependent protein kinase (CDPK). The genes SuSy and SAI are associated with sucrose metabolism whereas CDPK is believed to be associated with cold tolerance. The forward primer sequences are listed in Table 2. The reverse primers employed were the same as the labeled SRAP primers (Table 1). PCR amplifications were performed as described by Alwala et al. (2006a). A total of 17 TRAP primer combinations were used. Marker scoring
The PCR amplified products were run on a LI-COR 4300 sequencer (LI-COR Inc., Lincoln, NE). The gels were saved onto a computer and scored manually and independently by two people. Ambiguous data that could not be resolved between the two scorers were discarded. A pseudo test cross strategy was followed to score the polymorphisms (Grattapaglia and Sederoff, 1994). The bands were scored for presence or absence when heterozygous in one parent, null in the other and segregating in the F1 population. The bands were divided into two groups, as S. officinarum and S. spontaneum bands, based on their parental origin. The polymorphic bands were then tested for 1:1 (single dose, SD) and 3.3:1 (double dose, DD) segregation ratios using χ2- analysis. If Saccharum were a disomic polyploid, the double dose segregation would be 3:1. On the other hand, if it were a polysomic polyploid, the double dose ratio would be 7:2 for Saccharum officinarum (x=10) and 11:3 for S. spontaneum (x=8). To overcome this complexity, we used a segregation ratio of ≤3.3:1 (√3x3.6:1) as it gives equal χ2

110
value for 3:1, 7:2 and 11:3 ratios (Mather, 1957). The markers which did not fit into either single or double dose ratios were treated as segregation distorted markers. In addition, bands present in both parents and segregating in a 3:1 fashion (simple duplex) in the F1 population were retained for consensus linkage map construction. Linkage map construction
The mapping software JoinMap ver 3.0 (van Ooijen and Voorrips, 2001) was used for map construction. Two genetic linkage maps, one for S. officinarum and one for S. spontaneum, were constructed at a LOD score of > 5.0. The Kosambi mapping function was employed with a recombination fraction of 0.45 to form LG. First the maps were constructed using SD and DD markers. Then, markers showing segregation distortion were included in the final map. None of the distorted markers altered the final order of markers on the linkage group. Tests for type of ploidy
Two tests, detection of repulsion phase linkages and χ2 segregation ratios, were used in an attempt to infer ploidy type (polysomic vs disomic polyploid) in the S. officinarum and S. spontaneum parents.
To detect repulsion phase linkages, SD markers were inverted and combined with the original set of SD markers. Linkage maps were re-constructed using the new set of doubled SD markers. Presence of repulsion phase linkage is indicated by co-localization of the original SD marker with its corresponding inverted marker. The χ2 tests were performed using single dose and double dose markers to further confirm the ploidy behavior in the two parents as described by da Silva et al. (1993). Estimation of Genome size and Genome coverage
For each parental species, the genome size was estimated based on Hulbert et al. (1987) and the genome coverage was estimated based on Bishop et al. (1983) methods. RESULTS Comparison among marker systems
Combined across the two parental species, 35 AFLP primer combinations produced a total of 409 polymorphic bands out of which 318 (77%) were SD markers and 50 (17%) were DD and 41 (6%) deviated from Mendelian ratios (i. e., distorted markers). The polymorphic AFLP bands varied from 4 to 29 with an average of 11.68 bands per primer combination (Table 3). Among the AFLP primers, 20 EcoR I-Mse I primer combinations produced a total of 249 polymorphic bands out of which 198 (79%) were SD, 13 (5%) were DD and 38 (16%) were distorted markers. The 15 Pst I - Mse I primer combinations produced a total of 160 polymorphic bands out of which 120 (75%) were SD, 37 (23%) were DD markers and 3 (2%) were distorted markers (Table 4).
Combined across the two parents, the 32 SRAP primer combinations produced a total of
160 polymorphic bands out of which 92 (58%) were SD, 21 (13%) were DD and 47 (29%) were distorted markers. The total number of polymorphic SRAP bands varied from 1 to 10 with an average of 5 bands per primer combination (Table 3).
111
Likewise, the 17 TRAP primer combinations produced a total of 81 polymorphic bands out of which 59 (71%) were SD and 5 (7%) were DD markers. Seventeen (22%) markers deviated from Mendelian segregation ratios. The total number of polymorphic TRAP bands ranged from 1 to 12 with an average of 4.76 bands per primer combination (Table 3).
Marker segregation
Combined across the AFLP, SRAP and TRAP techniques, a total of 344 markers were heterozygous in S. officinarum ‘La Striped’ of which 247 (72%) were SD and 33 (10%) were DD markers. Sixty four (18%) markers deviated from Mendelian segregation ratios. In S. spontaneum ‘SES 147B’, 306 markers were heterozygous of which 221 (72%) were SD, 43 (14%) were DD and 42 (14%) were distorted markers. In both parental species, segregation distortion was highest in the SRAP markers followed by the TRAP and lowest in the AFLP markers (Table 4). Map construction
The female parent S. officinarum ‘La Striped’ map comprised of 146 linked markers spread over 49 linkage groups (LG) (Fig 1). The cumulative genome length covered was found to be 1732 cM. The LG length varied from 13 to 108 cM with an average of 12 cM between any two adjacent markers. The number of loci forming LGs varied from 2-13 with the more dense LGs (L1, L3, L15) being formed almost exclusively by AFLP markers. A majority of the 146 linked markers were AFLP (74%) with only 20% of SRAP and 6% of TRAP markers. Among the 108 AFLP markers, 92 were EcoR I –Mse I and 16 were Pst I- Mse I based markers.
The male parent S. spontaneum ‘SES147B’ linkage map comprised of 121 linked markers spanning 45 LGs with a cumulative genome length of 1491 cM (Fig 2). The length of the LGs varied from 2 to 85 cM with an average of 12 cM between any two adjacent markers. The number of loci forming LGs varied from 2-12 with the densest LGs (S1) being formed almost exclusively by AFLP markers. Of the 121 linked markers, 65% were AFLP, 25% were SRAP and 10% were TRAP markers. Among the AFLP markers, 55 were generated by the EcoR I –Mse I and 24 by the Pst I- Mse I primer combinations. Ploidy type
No repulsion phase linkages were detected in S. officinarum ‘La Striped’, suggesting that it could be an autopolyploid. However, the χ2- test results could not confirm the autoploidy behavior as significant estimates were observed in both the autoploidy and alloploidy tests suggesting it is not a strict autopolyploid (Table 5).
On the other hand, for the S. spontaneum ‘SES 147B’, the non detection of repulsion phase linkages and the non significant χ2 estimates for autoploidy strongly suggest it to be an autopolyploid (Table 5). Genome size and genome coverage
Three estimates of genome size were calculated at 10, 20 and 30 cM intervals (Hulbert et al., 1987). For S. officinarum, using 32 (10 cM), 97 (20 cM) and 161 (30 cM) paired markers, the weighted genome size estimate was found to be 4897 cM . Likewise, for S. spontaneum, using 16, 53 and 90 paired markers, the weighted genome size estimate was found to be 6464 cM. However, as no repulsion phase linkages were observed, the estimates were divided by 2 (da
112
Silva et al., 1993) giving rise to 2487 cM and 3232 cM genome size for S. officinarum and S. spontaneum, respectively. The computations indicated that approximately 69 % (1732 / 2487) of the S. officinarum genome and 46% (1491 / 3232) of the S. spontaneum has been covered.
From the Bishop et al. (1983) estimation, it was observed that there is 76% probability in S. officinarum and 63% in S. spontaneum to place a new marker (onto the constructed map) within a distance of 30 cM. DISCUSSION Comparison among markers
Two relatively new marker techniques, TRAP and SRAP, were used in conjunction with the AFLP marker technique for linkage mapping and analysis of an F1 population derived from a cross between two progenitor species, S. officinarum (La Striped, 2n=80) and S. spontaneum (SES 147B, 2n=64)), of modern sugarcane. The polymorphic fragments amplified by all three techniques were scored as dominant markers although Li and Quiros (2003) detected 20 % of codominant SRAP markers in a diploid brassica cross and Miklas et al. (2006) found 10 % of TRAP markers in a diploid common bean cross to be co-dominant. Due to the possibility of 2n + n transmission, F1 hybrids from a S. officinarum x S. spontaneum cross can harbor double the copy of homologous chromosomes from S. officinarum and variable copies of homeologous chromosomes from S. spontaneum (Bremer, 1961; D’Hont et al., 1996; Edmé et al., 2006). The difficulty of distinguishing multiple alleles from homologous and homoeologous chromosomes impedes the ability to determine homozygosity or heterozygosity and to designate co-dominant markers at any one locus. Therefore, methods for mapping in polyploid crops, such as sugarcane, have been developed which employ SD markers that are present in the simplex condition and segregate 1:1 irrespective of the ploidy level (Wu et al., 1992).
Single dose markers usually make up about 70 % of polymorphic loci detected in
sugarcane mapping studies (Wu et al., 1992; da Silva et al., 1993; Hoarau et al., 2001; Aitken et al., 2005; Edmé et al., 2006; Garcia et al., 2006). These results are corroborated in this study by the frequency of SD markers reported for AFLP and TRAP but not for SRAP markers, which amplified only 58 % SD markers. Mapping in a complex polyploid, with large genome size such as sugarcane, requires substantially more markers and progeny than it would for a diploid. This makes SD markers the more important. Because of their relative abundance, SD markers facilitate mapping in polyploids by allowing the identification of alleles even in relatively small populations (Wu et al., 1992). Deviations from the expected frequency of SD markers, especially in a small population, could seriously bias the outcome of linkage analysis. However, as pointed out by da Silva et al. (1993), the proportion of SD polymorphism detected is not a function of the source of DNA used to detect the locus but rather that of the segregation at each locus according to the dosage of alleles at the locus. Therefore, it is less likely that SRAP markers possess an innate inability to amplify SD markers and rather coincidental that some of the SRAP primers used in this study did not align with SD loci in the population.
The TRAP and SRAP techniques target coding regions of the genome (Li and Quiros, 2003; Hu and Vick, 2003; Miklas et al., 2006) whereas, the AFLP technique was conceived to amplify a large number of random loci in a single assay (Vos et al., 1995). Therefore, as expected, the AFLP was by far the most superior marker technique for linkage mapping and analysis in a genome as large and complicated as that of sugarcane. The AFLP technique

113
produced the most number of polymorphic bands and linked markers on the map and the least number of distorted markers. Similar to reports in other crop species (van Heusden et al., 2000; Young et al., 2004; Mignouna et al., 2005a, b), the methylation sensitive Pst I – Mse I proved to be less robust compared to its methylation insensitive counterpart, EcoR I – Mse I, in generating data for linkage mapping. It has been suggested that DNA sequences are transcribed more readily from methylation sensitive regions of the genome (Cedar, 1988). The TRAP, SRAP and Pst-I – Mse I markers were included in this study for their potential to be associated with gene rich regions of the genome (Li and Quiros, 2003; Hu and Vick, 2003; Miklas et al., 2006; Cedar, 1988) as a prelude to our future goal of mapping QTLs associated with agronomic traits in these progenitor species. However, these markers have proved to be less efficient as tools for rapidly generating a large number of markers for linkage mapping, especially in genomes as large as that of sugarcane, because of the high throughput tools that would be needed to amplify numerous loci that are uniformly distributed across the genome. Miklas et al. (2006) and Li and Quiros (2003) utilized TRAP and SRAP markers, respectively, for QTL mapping by placing them onto pre-existing core maps. Most of the TRAP markers for disease resistance placed on the core map by Miklas et al. (2006) mapped to the exact same location. Liu et al. (2005) successfully used TRAP markers for linkage mapping in wheat only after lowering the initial annealing temperature. The authors conceded that the reverse primer, acting as a random primer, may have amplified fragments from various other regions in conjunction with itself. In preliminary trials, we found no tendency for TRAP primers to behave like RAPDs for the annealing temperature used in this study. Map construction
The pseudo-test cross strategy, based on an F1 mapping population derived from crossing between two heterozygous parents, has been proposed for mapping outcrossing diploid and polyploid species for which inbred lines cannot be readily developed (Grattapaglia and Sederoff, 1994). This strategy has been widely used along with SD markers for mapping in polyploid species including sugarcane (Wu et al., 1992; da Silva et al., 1993; Mudge et al., 1996; Hoarau et al., 2001; Garcia et al., 2006; Edmé et al., 2006). Single dose markers, as earlier mentioned, can be detected in high frequencies even in relatively small populations. For example, irrespective of the ploidy level (i.e., 2n = 4X, 6X, 8X and 10X), a population size of 75 individuals is considered large enough to detect SD loci at high confidence levels (Wu et al., 1992). The appropriate frequency (> 70%) of SD markers was detected in this study using a progeny size of 100 individuals. Appropriate levels of SD markers have been reported in other sugarcane mapping studies using a progeny sizes of 84 (Mudge et al., 1996), 88 (da Silva et al., 1993) and 100 (Guimaraes et al., 1999; Garcia et al., 2006) individuals.
The pseudo-test cross strategy allows two sets of SD markers, each set specific only to one parent, to be identified resulting in two parental maps (Grattapaglia and Sederoof, 1994; Maliepaard et al., 1998). Using this strategy, several female and male linkage maps have been constructed in Saccharum interspecific crosses. Using RAPD markers, Mudge et al. (1996) published a map of S. officinarum with 51 LG spanning 1152 cM, that of Ming et al. (1998) using RFLPs included 72 LG spanning 2304 cM, whereas the map of Edmé et al. (2006) using SSRs had 25 LG covering 1180 cM. All these studies involved interspecific crosses in which S. officinarum was used as the female parent. Used as the male parent, the S. spontaneum maps from a S. officinarum ‘Green German’ x S. spontaneum ‘IND81-146’cross published by Ming et al. (1998) and Edmé et al. (2006) contained 69 LG spanning 1303 cM and 11 LG spanning 614 cM, respectively. Comparable number of LG and map length were found in the female

114
(S..officinarum ‘ La Striped’; 49 LG with 1732 cM) and male (S. spontaneum ‘SES 147B’; 45 LG with 1491 cM) maps in our study. In addition, to our knowledge, this is only the first attempt to use either or combination of AFLP, SRAP and TRAP markers for constructing linkage maps in these progenitor species of sugarcane.
The two framework maps in this study are unsaturated and cover only about 69 % and 46 % of the female and male genomes, respectively. This was quite evident from the size of some LG (2 markers) and the substantial amount (60 %) of unlinked markers. Similar percentage of unlinked markers were reported by Garcia et al., (2005) in a sugarcane mapping population containing 100 individuals in contrast to the maps of Hoarau et al. (2001), Aitken et al. (2005) and Reffay et al. (2005) who reported about 15 % of unlinked markers using populations exceeding 200 individuals. The relatively small population size and stringent LOD score (> 5.0) used in our study were probably exacerbated by the complex genetic system inherent with interspecific crosses of sugarcane, leading to the high number of unlinked markers. However, although unsaturated, the stringent LOD score (> 5.0) employed and the relatively high proportion of SD compared to non-SD markers we used in building the maps provide two levels of confidence about the robustness of the maps, leaving little opportunity for spurious linkages. In fact, some of the small LG may actually be parts of larger groups which remained unconnected (Garcia et al., 2006). Our mapping population is being reconstituted to include more individuals and markers in an effort to saturate these framework maps for future use in QTL discovery. Segregation analyses
Although the two framework maps are far from saturated, marker segregation in the mapping population can be useful to unravel the genomic constitution and chromosomal behavior following hybridization of these two important progenitor species of modern sugarcane. For example, although not used for map construction, about 10 % of markers were simple duplex markers which are heterozygous in both parents and segregate 3:1 in the progeny. Although less informative for mapping, this class of markers may actually represent the degree of relatedness between the two mapping parents (Fig 3) and could be useful as a locus bridge to form homology groups (Grattapaglia and Sederoff, 1994; Malliepaard et al., 1998). This class of markers also portends the possibility that pairing and recombination can occur between chromosomes of the two species. In fact, S. spontaneum has been implicated in the ancestry of S. officinarum (Daniels et al., 1975) and S. officinarum genomes have been observed to contain S. spontaneum segments (Jannoo et al., 1998; D’Hont et al., 1989). Furthermore, using genomic in situ hybridization (GISH), Piperidis and D’Hont (2001) observed that between 5 to 17 % of the chromosomes in modern sugarcane cultivars had undergone recombination between the two progenitor species.
However, disparities exist between the two genomes and this can be inferred from the high proportion of distorted markers (18 % in S. officinarum and 14% in S. spontaneum) observed in this study since segregation distortion is a reflection of species relatedness or divergence (Tanksley and Nelson, 1996). Disparities exist between these two progenitor species in ploidy levels, chromosome numbers and genome size (Edmé et al., 2006; D’Hont et al., 1989). The possibility of 2n + n transmission in the progeny only serves as an added layer of complication. All of these factors can act independently or together to effect segregation distortion. In our study, the level of distortion was similar for both parents whereas using a similar type of population, Edmé et al. (2006) reported twice as much distortion (22%) with the

115
female parent (S. officinarum ‘Green German’) and Ming et al. (1998) reported twice as much distortion (26%) with the male parent (S. spontaneum ‘IND81-146’).
Distorted markers may have biological significance if they are linked to lethal genes or loci with high genetic load causing inbreeding depression (Kuramoto et al., 1997; Barreneche et al., 1998). Maping may help unravel genomic regions which have high propensity for segregation distortion in sugarcane (Edmé et al., 2006). In pine (Kubisiak et al., 1995) and oak (Barreneche et al., 1998) tree maps, distorted markers tended to cluster in particular LG. In sugarcane, Edmé et al. (2006) found evidence of clustering only for one linkage group and since the distorted markers were mostly in high dosage (non-SD), they postulated a possible role for double reduction in influencing distortion in that region of the genome. In this study, adding distorted markers onto the frame work maps, acquired one (L2) and two (S18 and S34) new LG in the S. officinarum and S. spontaneum maps, respectively, which were formed exclusively from distorted markers. Distorted markers also formed new LG with previously unlinked markers (L8, L 48, S2, S42, and S45) and a few of them mapped onto two preexisting LG (L1 and L3). However, non-biological factors such as small population size and fragment-complexes consisting of non-allelic co-migrating fragments can also effect segregation distortion. At least 30 % of the distorted AFLP alleles in a conifer cross was said to have resulted from fragment-complexes (Nikaido et al., 2000). More markers and possibly a larger population size would be necessary to accurately pin point, if present, loci harboring distorted markers and ascertain if such loci have biological significance in sugarcane.
The results from segregation and linkage analyses strongly suggest that the male parent S. spontaneum ‘SES 147B’ is an autopolyploid with chromosomes undergoing random pairing (polysomic segregation). This hypothesis has held true in all the studies attempted with S. spontaneum so far (da Silva et al., 1993; Al-Janabi et. al., 1993; Edmé et al., 2006). For the female parent, S. officinarum ‘La Striped’, linkage analysis failed to detect markers linked in repulsion phase but segregation analysis concluded that the genome was neither undergoing strict polysomic nor disomic segregation, thereby, concurring with previous evidence that S. officinarum could be an autoalloploid. Several authors (Mudge et al., 1996; Al-Janabi et al., 1994; Guimaraes et al., 1999; Edmé et al., 2006) have found evidence of repulsion phase linkages in S officinarum, some using populations smaller than that used in this study.
In summary, framework linkage maps of the two main progenitor species (S. officinarum
and S. spontaneum) of modern sugarcane were constructed using AFLP with SRAP and TRAP markers. This is only the first report using either one or a combination of AFLP, SRAP and TRAP markers to construct linkage maps in these species. SRAP and TRAP markers appear to be less effective, as compared to AFLP, as tools for rapidly generating a large number of markers for linkage mapping because of the high number of PCRs and high-throughput tools that would be required to amplify numerous loci genome-wide. However, SRAP and TRAP markers are attractive because of their potential for candidate gene analysis of QTLs, although that remains to be seen in sugarcane and is the subject of our subsequent study. Although the maps were incomplete, allele segregation in the mapping population allowed us to decipher genomic constitution and chromosomal behavior following hybridization of these two gene rich progenitor species upon which genetic improvement in sugarcane depends. Although the results revealed huge disparities in the two genomes, there seem to be enough similarity to support some level of pairing and recombination between chromosomes of the two species. Future studies are
116
planned to include more individuals and markers to ensure better coverage of the genome in preparation for marker-assisted selection.
References: Aitken, K. S., Jackson, P. A., and McIntyre, C. L. 2005. A combination of AFLP and SSR markers provide extensive map coverage and identification of homo(eo)logous linkage groups in a sugarcane cultivar. Theor. Appl. Genet. 110: 789-801 Al-Janabi, S. M., Honeycutt, R. J., McClelland, M., and Sobral, B. W. S. 1993. A genetic linkage map pf Saccharum spontaneum L. ‘SES 208’. Genetics 134: 1249-1260 Alwala, S., Suman, A., Arro, J. A., Veremis, J. C and Kimbeng, C. A. 2006a. Target Region Amplification Polymorphism (TRAP) for assessing genetic diversity in sugarcane germplasm collections. Crop Sci. 46:448–455. Alwala, S., Kimbeng, C. A., Gravois, K. A., and Bischoff, K. P. 2006b. TRAP, a new tool for sugarcane breeding: comparison with AFLP and coefficient of parentage. Sugar Cane Intern. 24: 11-21 Barreneche, T., Bodenes, C. , Lexer, C. , Trontin, J. F. , Fluch, S. , Streiff, R. , Plomion, C. , Roussel, G. , Steinkellner, H. , Burg, K. , Favre, J. M. , Glössl, J. , and Kremer, A. 1998. A genetic linkage map of Quercus robur L. (pedunculate oak) based on RAPD, SCAR, microsatellite, minisatellite, isozyme and 55 rDNA markers. Theor. Appl. Genet. 97: 1090-1103 Berding, N., and Roach, B. T. 1987. Germplasm, collection, maintenance and use. P. 143-210. In D. J. Heinz (ed.) Sugarcane improvement through breeding. Elsevier, Amsterdam Bhat, S.R., and Gill, B. S. 1985. The implication of 2n egg gametes in nobilisation and breeding of sugarcane. Euphytica 34:377–384. Bishop , D. T., Cannings, C., Skolnick, M., and Williamson, J. A. 1983. The number of polymorphic clones required to map the human genome, pp. 118- 200 in Statistical Analysis of DNA Sequence Data, edited by B. S. WEIR. Marcel Dekker, New York. Bremer, G. 1961. Problems in breeding and cytology of sugarcane. Euphytica 10:59–78. Cedar, H. 1988. DNA methylation and gene activity. Cell 53:3-4 D’ Hont, A., Ison D, Alix K, Roux, C., and Glazmann, J. C. 1998. Determination of basic chromosome numbers in tha genus Saccharum by physical mapping of ribosomal RNA genes. Genome 41: 221-225 da Silva, J. A. G., Sorrells, M. E., Burnquist, W., and Tanksley, S. D. 1993. RFLP linkage map and genome analysis of Saccharum spontaneum. Genome 36: 782–791. Daniels, J., and Roach, B. T. 1987. Taxonomy and evolution in sugarcane. p. 7–84. In D.J. Heinz (ed.) Sugarcane improvement through breeding. Elsevier, Amsterdam.

117
Deren, C.W. 1995. Genetic base of U.S. mainland sugarcane. Crop Sci. 35:1195-1199 deVicente, M. C., and Tanksley, S. D. 1993. QTL analysis of transgressive segregation in an interspecific tomato cross. Genetics 134: 585-596 D'Hont, A., Grivet, L. , Feldmann, P. , Rao, S. , Berding, N., and Glaszmann, J. C. 1996. Characterisation of the double genome structure of modern sugarcane cultivars (Saccharum spp.) by molecular cytogenetics. Mol.Gen.Genet. 250: 405-413 Edmé´, S. J., Glynn, N. G., and Comstock, J. C. 2006. Genetic segregation of microsatellite markers in Saccharum officinarum and S. spontaneum. Heredity 97: 366-375 Edmé´ S. J., Comstock, J. C., Miller, J. D., and Tai, P. Y. P. 2005. Determination of DNA content and genome size in field grown sugarcane interspecific hybrids and genotypes. J Amer. Soc. Sugar Cane Technol. 5: 1–7 Ferriol, M., Picó, B., and Nuez, F. 2003. Genetic diversity of a germplasm collection of Cucurbita pepo using SRAP and AFLP markers. Theor. Appl. Genet. 107: 271-282 Garcia, A. A. F., Kido, E. A., Meza,A. N., Souza, H. M. B., Pinto, L. R., Pastina, M. M., Leite, C. S., da Silva, J. A. G., Ulian, E. C., Figueira, A., and Souza, A. P. 2005. Development of an integrated genetic map of a sugarcane (Saccharum spp.) commercial cross, based on a maximum-likelihood approach for estimation of linkage and linkage phases Theor. Appl. Genet. 112: 298-314 Grattapaglia, D., and Sederoff, R. 1994. Genetic linkage maps of Eucalyptus grandis and Eucalyptus urophylla using a pseudo-testcross: mapping strategy and RAPD markers. Genetics 137: 1121-1137 Guimarães, C. T., Honeycutt, R. J., Sills, G. R., and Sobral, B. W. S. 1999. Genetic maps of Saccharum officinarum L. and Saccharum robustum Brandes & Jew. Ex Grassl.. Genet. Mol.Biol. 22: 125-132 Guimarães, C.T., Sills, G.R., and Sobral, B.W.S. 1997. Comparative mapping of Andropogoneae: Saccharum L. (sugarcane) and its relation to sorghum and maize. Proc. Natl. Acad. Sci. 94: 14261–14266. Hoarau, J.Y., Offmann, B., D’Hont, A., Risterucci, A.M., Roques, D., Glaszmann, J.C., and Grivet, L. 2001. Genetic dissection of a modern sugarcane cultivar (Saccharum spp.). I. Genome mapping with AFLP markers. Theor. Appl. Genet. 103:84–97 Hu, J.G., and Vick, B. A. 2003. Target region amplification polymorphism: A novel marker technique for plant genotyping. Plant Mol. Biol. Rep. 21:289–294. Hulbert, S. H., Ilot, T. W., Egg, E. J.L., Lincolne, S. E., Lander, S., and Michelmore, R. W. 1987.Genetic analysis of the fungus Bremia lactucae using restriction fragment length polymorphisms. Genetics 120: 947-958.
118
Jackson, P. A. 2005. Breeding for improved sugar content in sugarcane. Field Crops Research. 92: 277-290 Jannoo, N., Grivet, L., Dookun, A., D’Hont, A., and Glazzmann, J. C. 1999. Linkage disequilibrium among modern sugarcane cultivars. Theor. Appl. Genet. 99: 1053-1060 Kubisiak, T. L., Nelson, C. D., Nance, W. L., and Stine, M. 1995. RAPD linkage mapping in a longleaf pine x slash pine F1 family. Theor. Appl. Genet. 90: 1119-1127. Kuramoto, N., Tomaru, N., Murai, M., and Ohba, K. 1997. Linkage analysis of isozyme and dwarf loci, and detection of lethal genes in sugi (Cryptomeria japonica D. Don). Breeding Science 47: 259-266 Li, G., and Quiros, C. F. 2001. Sequence related amplified polymorphism (SRAP), a new marker system based on a simple PCR reaction: Its application to mapping and gene tagging in Brassica. Theor. Appl. Genet. 103:455–461. Liu, Z. H., Anderson, J. A., Hu, J., Friesen, T. L., Rasmussen, J. B., and Faris, J. D. 2005. A wheat intervarietal genetic linkage map based on microsatellite and target region amplified polymorphism markers and its utility for detecting quantitative trait loci Theor. Appl. Genet. 111: 782-794 Maliepaard, C. , Alston, F. H. , Arkel, G. van , Brown, L. M. , Chevreau, E. , Dunemann, F. , Evans, K. M. , Gardiner, S. , Guilford, P. , Heusden, A. W. van , Janse, J. , Laurens, F. , Lynn, J. R. , Manganaris, A. G. , Nijs, A. P. M. den , Periam, N. , Rikkerink, E. , Roche, P. , Ryder, C. , Sansavini, S. , Schmidt, H. , Tartarini, S. , Verhaegh, J. J. , Vrielink-van Ginkel, M., and King, G. J. 1998. Aligning male and female linkage maps of apple (Malus pumila Mill.) using multi-allelic markers. Theor. Appl. Genet. 97: 60-73 Mather, K. (1957). The measurement of linkage in heredity. Methuen, London. Mignouna, H. D. , Mank, R. A. , Ellis, T. H. N. , Bosch, N. van den , Asiedu, R. , Ng, S. Y. C. , and Peleman, J. 2002a. A genetic linkage map of Guinea yam (Dioscorea rotundata Poir.) based on AFLP markers. Theor. Appl. Genet. 105: 716-725 Mignouna, H. D., Mank, R, A., Ellis, T. H. N. , van den Bosch, N.,, Asiedu, R. , Abang, M. M. , and Peleman, J 2002b. A genetic linkage map of water yam (Dioscorea alata L.) based on AFLP markers and QTL analysis for anthracnose resistance. Theor. Appl. Genet. 105: 726-735 Miklas, P. N., Hu, J., Grünwald, N. J., and K. M. Larsen. 2006. Potential application of TRAP (Targeted Region Amplified Polymorphism) markers for mapping and tagging disease resistance traits in common bean Crop Sci 2006 46: 910-916. Ming, R., Liu, S. C., Lin, Y. R., da Silva, J. A. G., Wilson, W., Braga, D., van Deynze, A., Wenslaff, T.F., Wu, K. K., Moore, P. H., Burnquist, W., Sorrells, M. E., Irvine, J. E., and Paterson, A. H. 1998. Detailed alignment of Saccharum and Sorghum chromosomes: comparative organization of closely related diploid and polyploid genomes. Genetics 150:1663–1682

119
Mudge, J., Andersen, W. R. , Kehrer, R. L. , and Fairbanks, D. J. 1996. A RAPD genetic map of Saccharum officinarum. Crop Sci. 36:1362-1366 Nikaido, A. M., Ujino, T., Iwata, H. , Yoshimura, K. , Yoshimura, H. , Suyama, Y. , Murai, M. , Nagasaka, K. , and Tsumura, Y. 2000. AFLP and CAPS linkage maps of Cryptomeria japonica. Theor. Appl. Genet. 100: 825-831 Panje, R. R., and Babu, C. N. 1960. Studies in Saccharum spontaneum distribution and geographical association of chromosome numbers. Cytologia 25: 152-172. Reffay, N., Jackson, P.A., Aitken, K.S, Hoarau, J.Y., D’Hont, A., Besse, P., and McIntyre, C. L. 2005. Characterisation of genome regions incorporated from an important wild relative into Australian sugarcane. Mol. Breed. 15: 367–381. Roach, B.T. 1972. Nobilization of sugarcane. Proc. Int. Soc. Sugar Cane Technol. 14:206–216 Sreenivasan, T.V., Ahloowalia, B. S., and Heinz, D.J. 1987. Cytogenetics. p. 211–253. In D.J. Heinz (ed.) Sugarcane improvement through breeding. Elsevier, Amsterdam. Suman A and Kimbeng, C. A. 2007. Molecular diversity among ancestral species of Saccharum and the proportion of diversity represented in major Louisiana commercial breeding clones. ASA Southern Branch 2007 Annual Meeting February 4-6, 2007 Mobile, AL. Tanksley, S. D., and Nelson, J. C. 1996. Advanced backcross QTL analysis: a method for the simultaneous discovery and transfer of valuable QTLs from unadapted germplasm into elite breeding lines. Theor. Appl. Genet. 92: 191-203 van Heusden, A. W. , Ooijen, J. W. van , Vrielink-van Ginkel, R. , Verbeek, W. H. J. , Wietsma, W. A. , and Kik, C. 2000. A genetic map of an interspecific cross in Allium based on amplified fragment length polymorphism (AFLP™) markers. Theor. Appl. Genet. 100: 118-126 Van Ooijen, J. W., and Voorrips, R. E. 2001. JOINMAP 3.0. Software for the calculation of genetic linkage maps. Plant Research International, Wageningen, The Netherlands. Vos, P., Hogers, R., Bleeker, M., Reijans, M., van de Lee, T., Hornes, M., Freijters, A., Pot, J., Peleman, J., Kuiper, M., and Zabeau. M 1995. AFLP: A new technique for DNA fingerprinting. Nucl. Acid Res. 23:4407–4414. Wu, K.K., Burnquist, W., Sorrells, M.E., Tew, T.L., Moore, P.H., and Tanksley, S.D. 1992. The detection and estimation of linkage in polyploids using single-dose restriction fragments. Theor. Appl. Genet. 83: 294–300. Young, W. P., Schupp, J. M. , and Keim, P. 1999. DNA methylation and AFLP marker distribution in the soybean genome. Theor. Appl. Genet. 99: 785-792
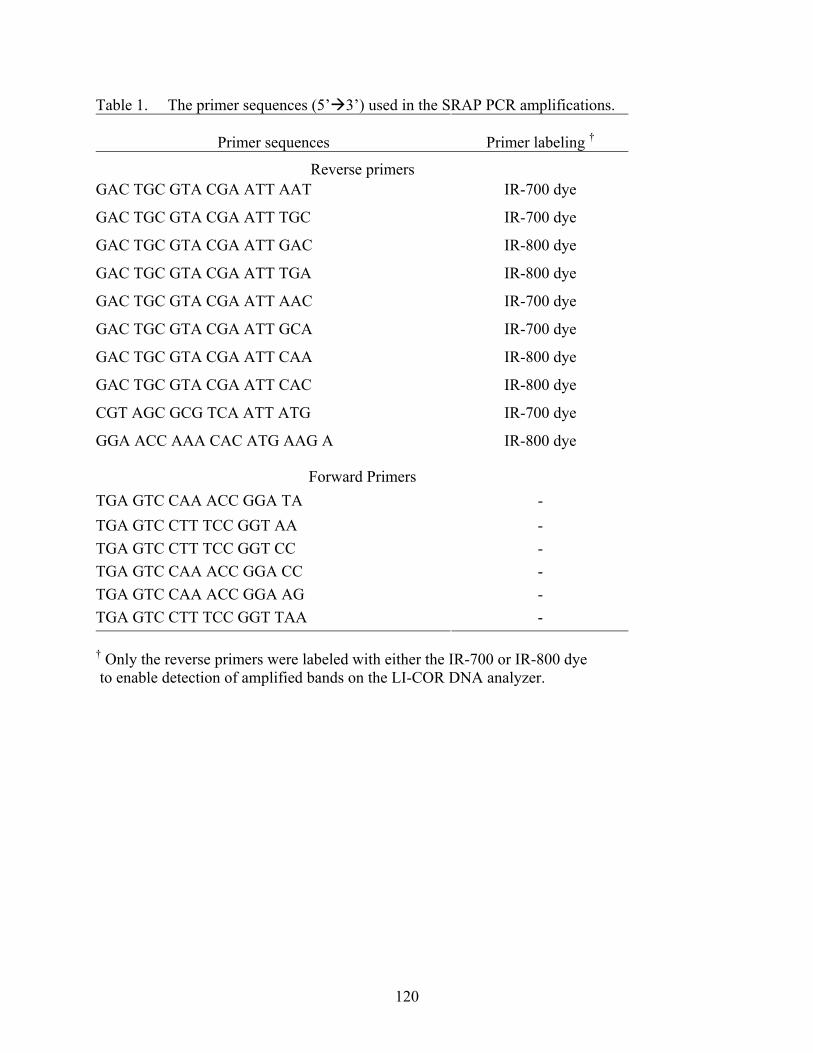
120
Table 1. The primer sequences (5’ 3’) used in the SRAP PCR amplifications.
Primer sequences
Primer labeling †
Reverse primers GAC TGC GTA CGA ATT AAT IR-700 dye
GAC TGC GTA CGA ATT TGC IR-700 dye
GAC TGC GTA CGA ATT GAC IR-800 dye
GAC TGC GTA CGA ATT TGA IR-800 dye
GAC TGC GTA CGA ATT AAC IR-700 dye
GAC TGC GTA CGA ATT GCA IR-700 dye
GAC TGC GTA CGA ATT CAA IR-800 dye
GAC TGC GTA CGA ATT CAC IR-800 dye
CGT AGC GCG TCA ATT ATG IR-700 dye
GGA ACC AAA CAC ATG AAG A IR-800 dye
Forward Primers TGA GTC CAA ACC GGA TA - TGA GTC CTT TCC GGT AA - TGA GTC CTT TCC GGT CC - TGA GTC CAA ACC GGA CC - TGA GTC CAA ACC GGA AG - TGA GTC CTT TCC GGT TAA - † Only the reverse primers were labeled with either the IR-700 or IR-800 dye to enable detection of amplified bands on the LI-COR DNA analyzer.

121
Table 2. The fixed/forward primer sequences (5’ 3’) used in the TRAP PCR amplifications.
Gene/EST Fixed primer sequence NCBI GenBank accession number†
Sucrose Synthase (SuSy) GGAGGAGCTGAGTGTTTC AF263384
Soluble Acid Invertase (SAI)
AGGACGAGACCACACTCT AF062735
Calcium Dependent Protein Kinase (CDPK)
ACAGAACCACCAAAGGAG CF572977
† The fixed primers were designed from gene/EST sequences obtained from the NCBI GeneBank. The reverse primers were similar to SRAP reverse primers listed in Table 1. Table 3. Summary statistics of AFLP, SRAP and TRAP polymorphic markers segregating in the single dose (1:1) and double dose (3.3:1) ratios, and that deviated from these ratios (distorted markers) in the mapping population.†
Polymorphic markers
Single dose markers
Double dose markers
Distorted markers
35 AFLP primer combinations Total 409 318(78) 50(12) 41(10) Range 4-29 3-15 0-6 0-7
Average 11.68 9.05 1.42 1.17
32 SRAP primer combinations
Total 160 92(58) 21(13) 47(29) Range 1-10 0-8 0-2 0-4
Average 5 2.87 0.65 1.46
17 TRAP primer combinations
Total 81 59(73) 5(6) 17(21) Range 1-12 0-8 0-1 0-3
Average 4.76 3.47 0.29 1.00 † Values in parenthesis indicate percentages

122
Table 4. Summary of AFLP, SRAP and TRAP polymorphic markers segregating in the single dose (1:1) and double dose (3.3:1) ratios, and that deviated from these ratios (distorted markers) in the two Saccharum parental species. †
Marker type
Polymorphic
markers
Single dose
markers
Double dose
markers
Distorted
markers
S. officinarum
AFLP 233 183 (78) 20 (9) 30 (13)
EcoR I-Mse I 155 122 (79) 5 (3) 28 (18)
Pst I-Mse I 78 61 (78) 15 (19) 2 (3)
SRAP 75 37 (49) 11 (15) 27 (36)
TRAP 36 27 (74) 2 (6) 7 (20)
Total 344 247 (72) 33 (9) 64 (19)
S. spontaneum
AFLP 176 135 (77) 30 (17) 11 (6)
EcoR I-Mse I 94 76 (81) 8 (9) 10 (10)
Pst I-Mse I 82 59 (72) 22 (27) 1 (1)
SRAP 85 54 (64) 10 (12) 21 (25)
TRAP 45 32 (71) 3 (7) 10 (22)
Total 306 221 (72) 43 (14) 42 (14)
† Values in parenthesis indicate percentages

123
Table 5. Results from χ2 tests to detect the type of ploidy in S. officinarum and S. spontaneum parents used in the study.
Expected Marker class
Observed
Autoploid Alloploid
S. officinarum
Single dose markers 247 218 (0.78) 210 (0.75)
Double dose markers 33 62 (0.22) 70 (0.25)
Total 280 0.00001* 0.000001*
S. spontaneum
Single dose markers 221 209 (0.79) 198 (0.75)
Double dose markers 43 55 (0.21) 66 (0.25)
Total 264 0.068NS 0.001* *, NS Indicates significance and non-significance at P = 0.05, respectively.

124
AF58150
AF58149AF58814AF5811*19AF581224AF5817*29AF581035AF58741
45AF571948AF571454
AF571763AF5822*67
L1
AF582*0
AF583*23
L2
AF77100
AF7711*16AF77821
AF771729AF77435AF771640AF7715*46
AF771253
AF773*61
AF77968
L3
AF128110
AF1271623
AF1271544
L4
AF48110
AF481012
AF48926
AF48843
L5
AF12860
AF128818
AF118635
AF118255
L6
AF4770
AF47929
L7
AF475*0
AF47613
L8
AF4730
AF48730
L9
sr2250
sai2618
L10
AF2880
AF28923
L11
AF2760
AF27930
L12
AF12790
AF137831
L13
AF15810
AF158229
L14
AF117160
AF1172212AF1171413
AF1172123
AF1171532AF1171938
AF118447
AF118759AF118563
AF1171774
AF1171889
sr158108
L15
AF9860
AF98729
L16
AF14870
AF148312
AF148431
AF147652
AF1481262
L17
AF14850
AF148226
AF147248
L18
sr5330
sr52125
L19
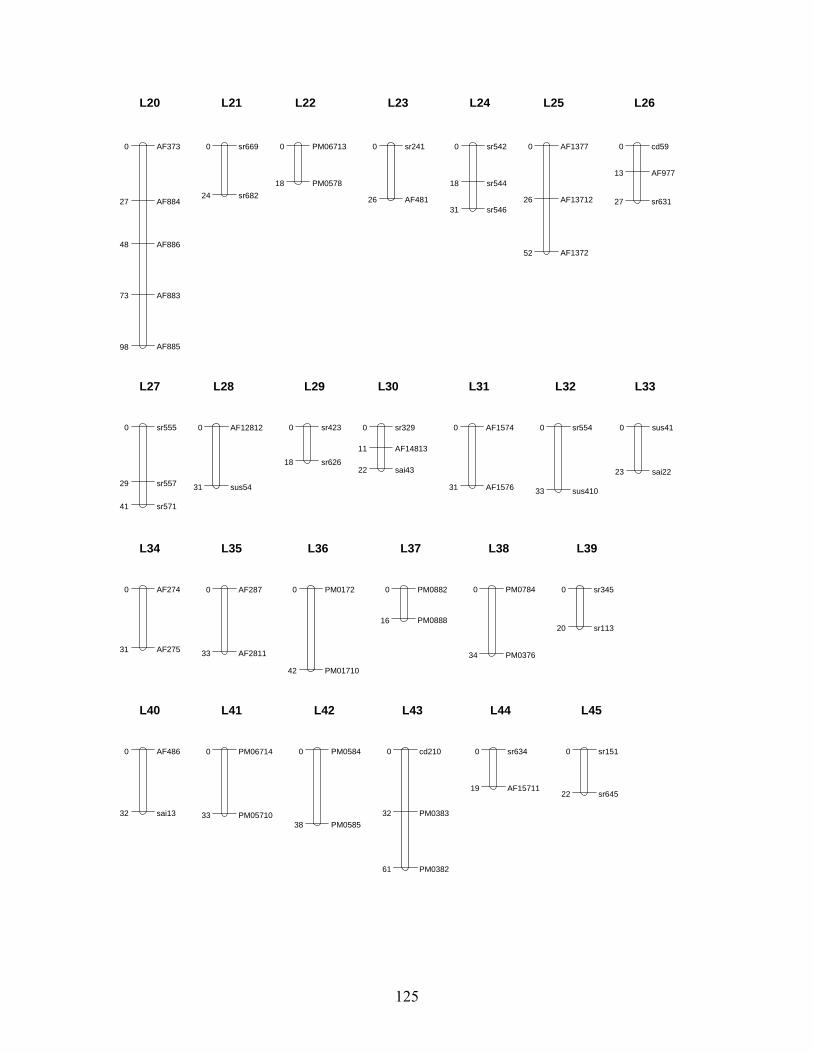
125
AF3730
AF88427
AF88648
AF88373
AF88598
L20
sr6690
sr68224
L21
PM067130
PM057818
L22
sr2410
AF48126
L23
sr5420
sr54418
sr54631
L24
AF13770
AF1371226
AF137252
L25
cd590
AF97713
sr63127
L26
sr5550
sr55729
sr57141
L27
AF128120
sus5431
L28
sr4230
sr62618
L29
sr3290
AF1481311
sai4322
L30
AF15740
AF157631
L31
sr5540
sus41033
L32
sus410
sai2223
L33
AF2740
AF27531
L34
AF2870
AF281133
L35
PM01720
PM0171042
L36
PM08820
PM088816
L37
PM07840
PM037634
L38
sr3450
sr11320
L39
AF4860
sai1332
L40
PM067140
PM0571033
L41
PM05840
PM058538
L42
cd2100
PM038332
PM038261
L43
sr6340
AF1571119
L44
sr1510
sr64522
L45
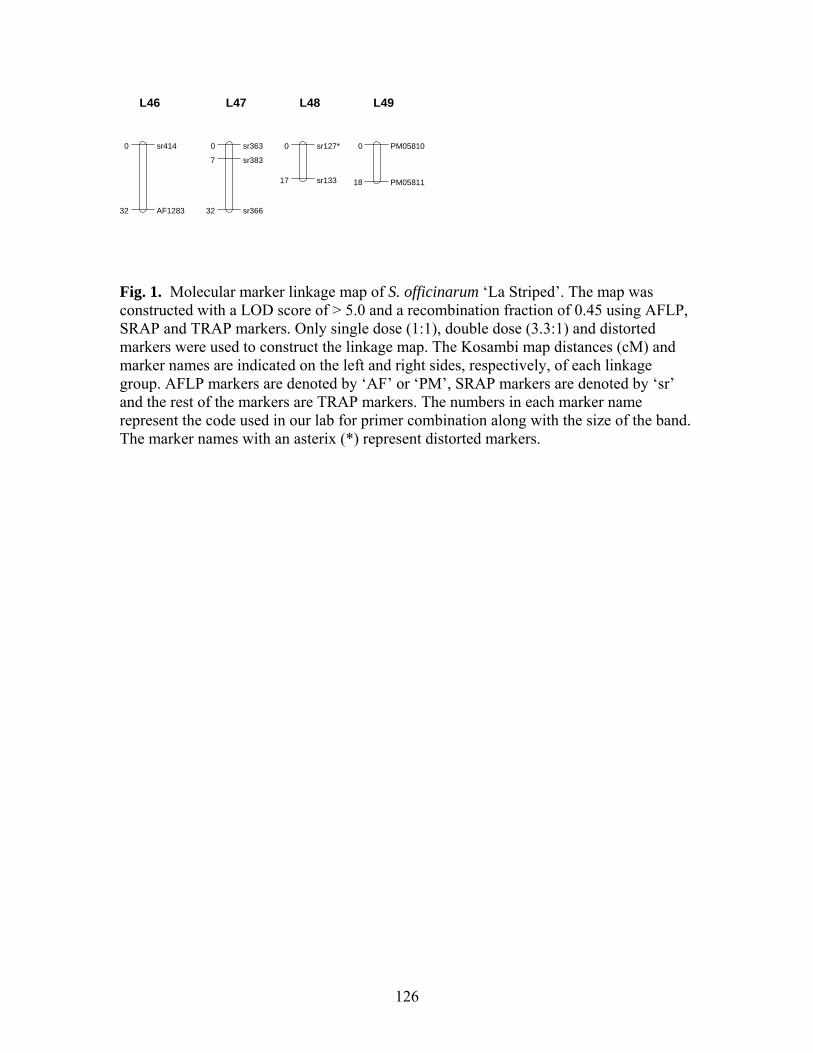
126
Fig. 1. Molecular marker linkage map of S. officinarum ‘La Striped’. The map was constructed with a LOD score of > 5.0 and a recombination fraction of 0.45 using AFLP, SRAP and TRAP markers. Only single dose (1:1), double dose (3.3:1) and distorted markers were used to construct the linkage map. The Kosambi map distances (cM) and marker names are indicated on the left and right sides, respectively, of each linkage group. AFLP markers are denoted by ‘AF’ or ‘PM’, SRAP markers are denoted by ‘sr’ and the rest of the markers are TRAP markers. The numbers in each marker name represent the code used in our lab for primer combination along with the size of the band. The marker names with an asterix (*) represent distorted markers.
sr4140
AF128332
L46
sr3630
sr3837
sr36632
L47
sr127*0
sr13317
L48
PM058100
PM0581118
L49

127
AF11720
AF117714
AF117627AF1171134AF1171340
AF117352 AF117954 AF1172057AF1171064
AF117475
AF1171285
S1 AF573*0
AF57424
S2 AF888*0
AF88226
AF87343
AF88758
S3cd550
PM0371115
sr32831
S4PM09810
PM098216
PM097428
PM097240PM098348
PM098474
S5AF14790
AF14710*16
AF271148
AF127578
S6
AF9850
sus2325
S7 AF5750
AF57623AF57931 AF57733
AF58945
AF581671
S8 sr3140sr3579PM0381116
AF1371127
S9 AF4850
AF87818
AF1371641
PM027667
S10AF97110
AF97625
AF971448
AF97371
S11sr416 0
sr315 22
S12 sr3120sr4137
sr66834
S13
AF2810
cd14533
S14 sr3260
AF27833
S15 cd5120 sus3319
AF147433
S16 AF127140
AF1271724
AF1271246
sr123*0
sr125*23
S18PM08760
PM087734
S19 sr361
sr36526
S20
sr4240
PM0371025
S21 PM027140
PM0281336
S22 AF4840
cd14232
S23sr3440 cd262
S24sr3430
sr12615
S25sr2270sr1559
S26AF8810
AF571626
S27
AF2820
AF28531
S28 AF8720 cd2814
S29 AF9790
AF971031
S30 sr4210*0
AF88933
S31sr4310 cd312
S32AF14770
AF147832
S33sus56*0
cd57*40
S34
PM08860
PM078228
S35 PM07810
PM077419
S36 PM06860
PM067423
S37PM03750
PM037736
S38sr3250 sr3322
S39sr3330
AF1371822
S40

128
Fig. 2. Molecular marker linkage map of S. spontaneum ‘SES 147B’. The map was constructed with a LOD score of > 0.5 and a recombination fraction of 0.45 using AFLP, SRAP and TRAP markers. Only single dose (1:1), double dose (3.3:1) and distorted markers were used to construct the linkage map. The Kosambi map distances (cM) and marker names are indicated on left and right sides, respectively of each linkage group. AFLP markers are denoted by ‘AF’ or ‘PM’, SRAP markers are denoted by ‘sr’ and the rest of the markers are TRAP markers. The numbers in each marker name represent the code used in our lab for primer combination along with size of the band. The marker names with an asterix (*) represent distorted markers.
AF3720
cd3334
S41 sr1530
sr154*21
S42 PM028100
PM0281138
S43 sr4420
sr34116
S44sr412*0
sr661235
S45

129
Fig. 3. An example of simple duplex markers mapping in Saccharum species. Simple duplex markers (common to both parents and segregate in 3:1 ratio in progeny) along with single dose (1:1), double dose (3.3:1) and distorted markers were used to construct the F1 consensus linkage map and parental maps. So and Ss are linkage groups from the Saccharum officinarum and S. spontaneum maps, respectively, whereas F1 is a linkage group from a consensus map of the two parents. The black lines represent the simple duplex markers common to both parents.
AF14720
AF148213
AF147121
AF147531
AF148139
AF147750
AF148765
AF148883
F1
AF14710
AF147512
AF148122
AF147739
AF147851
Ss
AF14880
AF148718
AF148142
AF147551
AF147162
AF148272
AF147283
So
Related Documents