US CLIVAR VARIATIONS US CLIVAR VARIATIONS • Winter 2016 • Vol. 14, No. 1 1 IN THIS ISSUE Observing the Intra-Americas Sea climate: Existing and emerging technologies Yolande Serra 1 , John Braun 2 , and David Adams 3 1 University of Washington 2 University Corporation for Atmospheric Research 3 Universidad Nacional Autónoma de México VARIATIONS Winter 2016 • Vol. 14, No. 1 US CLIVAR C l i m a t e V a ria b ilit y & P r e d ic t a b i l i t y Observing the Intra-Americas Sea climate: Existing and emerging technologies ...................................... 1 Ocean mesoscale variability in the Gulf of Mexico.................................................................................. 10 The Intra-American midsummer drought: Variability and open questions................................................. 15 Seasonal prediction of US tornadoes during late spring and early summer ............................................ 21 Past and future climate variability in the Intra-Americas Sea and its impact on the marine ecosystem and fisheries ........................................................................................................................................... 27 The Intra-Americas Seas: Vital to regional climate & extreme events Guest Editors: Vasu Misra 1 & Chunzai Wang 2 1 Florida State University 2 NOAA AOML The series of five articles in this issue clearly attest to the vital role of the Intra-Americas Sea (IAS) in climate variations of the surrounding North American continental region stretching from the Caribbean to the Mesoamerica and across the Midwest Plains to the northeast US. And yet, the IAS is one of the poorly observed ocean regions of the world, and one where almost all climate models display large bias. The heat fluxes off the rather warm upper ocean of the IAS in the boreal summer and fall provide fuel for some of the most destructive weather and climate extremes in North America like tornadoes, tropical cyclones, droughts, and floods that often produce debilitating collateral damage and grim picture of human mortality. The IAS also influences the Hadley circulation with implications on the regulation of sea surface temperature in the remote but important region of the tropical southeastern Pacific. IAS variability also seems to play a role in the larger Atlantic meridional overturning circulation. The IAS is a primordial soup of a spectrum of important scales 1 T he Intra-Americas Sea (IAS) is generally defined as the Gulf of Mexico and Caribbean Sea, and more broadly includes the far western tropical North Atlantic and far eastern tropical North Pacific oceans. The IAS is encircled by 29 Caribbean nations, seven Central American nations, Mexico and the United States to the north, and Colombia and Venezuela to the south. The large-scale processes and climatic features affecting the IAS region include the seasonal north-south migration of the intertropical convergence zone (ITCZ), the seasonal and longer term variability of the Atlantic warm pool (AWP), the Atlantic multi-decadal oscillation (AMO), the El Niño southern oscillation (ENSO) and the Madden-Julian oscillation (MJO), among others (Aguilar et al. 2005; Amador et al. 2006; Barlow and Salstein 2006; Poveda et al. 2006; Wang et al. 2008; Méndez and Magaña 2010). On more regional scales, IAS weather is strongly modulated by low-level wind jets, the mid-summer drought (MSD), tropical easterly waves, tropical cyclones (TCs) (Magaña et al. 1999; Amador 2006; Small et al. 2007; Méndez and Magaña 2010; Serra et al. 2010; Hidalgo et al. 2015), and the diurnal cycle (Garreaud and Wallace

Welcome message from author
This document is posted to help you gain knowledge. Please leave a comment to let me know what you think about it! Share it to your friends and learn new things together.
Transcript
U S C L I V A R V A R I A T I O N S
US CLIVAR VARIATIONS • Winter 2016 • Vol. 14, No. 1 1
IN THIS ISSUE
Observing the Intra-Americas Sea climate: Existing and emerging technologies
Yolande Serra1, John Braun2, and David Adams3
1University of Washington2University Corporation for Atmospheric Research
3Universidad Nacional Autónoma de México
VARIATIONS Winter 2016 • Vol. 14, No. 1
US CLIVARClimate Variability & Predictabilit
y
Observing the Intra-Americas Sea climate: Existing and emerging technologies ...................................... 1
Ocean mesoscale variability in the Gulf of Mexico .................................................................................. 10
The Intra-American midsummer drought: Variability and open questions ................................................. 15
Seasonal prediction of US tornadoes during late spring and early summer ............................................ 21
Past and future climate variability in the Intra-Americas Sea and its impact on the marine ecosystem
and fisheries ........................................................................................................................................... 27
The Intra-Americas Seas: Vital to regional climate &
extreme events
Guest Editors:Vasu Misra1 & Chunzai Wang2
1Florida State University2NOAA AOML
The series of five articles in this issue clearly attest to the vital role of the Intra-Americas Sea (IAS) in climate variations of the surrounding North American continental region stretching from the Caribbean to the Mesoamerica and across the Midwest Plains to the northeast US. And yet, the IAS is one of the poorly observed ocean regions of the world, and one where almost all climate models display large bias.
The heat fluxes off the rather warm upper ocean of the IAS in the boreal summer and fall provide fuel for some of the most destructive weather and climate extremes in North America like tornadoes, tropical cyclones, droughts, and floods that often produce debilitating collateral damage and grim picture of human mortality. The IAS also influences the Hadley circulation with implications on the regulation of sea surface temperature in the remote but important region of the tropical southeastern Pacific. IAS variability also seems to play a role in the larger Atlantic meridional overturning circulation.
The IAS is a primordial soup of a spectrum of important scales
1
The Intra-Americas Sea (IAS) is generally defined as the Gulf of Mexico and Caribbean Sea, and more broadly includes the far western tropical North
Atlantic and far eastern tropical North Pacific oceans. The IAS is encircled by 29 Caribbean nations, seven Central American nations, Mexico and the United States to the north, and Colombia and Venezuela to the south. The large-scale processes and climatic features affecting the IAS region include the seasonal north-south migration of the intertropical convergence zone (ITCZ), the seasonal and longer term variability of the Atlantic warm pool (AWP), the Atlantic multi-decadal oscillation (AMO), the El Niño southern oscillation (ENSO) and the Madden-Julian oscillation (MJO), among others (Aguilar et al. 2005; Amador et al. 2006; Barlow and Salstein 2006; Poveda et al. 2006; Wang et al. 2008; Méndez and Magaña 2010). On more regional scales, IAS weather is strongly modulated by low-level wind jets, the mid-summer drought (MSD), tropical easterly waves, tropical cyclones (TCs) (Magaña et al. 1999; Amador 2006; Small et al. 2007; Méndez and Magaña 2010; Serra et al. 2010; Hidalgo et al. 2015), and the diurnal cycle (Garreaud and Wallace
U S C L I V A R V A R I A T I O N S
US CLIVAR VARIATIONS • Winter 2016 • Vol. 14, No. 1 22
of variation. This is manifested by land processes through significant freshwater discharge from major rivers (Orinoco and Amazon) that influence the formation of the ocean barrier layers, dynamic ocean circulations in the Caribbean Sea and Gulf of Mexico, and the significant role of atmospheric fluxes to spin off climate and weather extremes. The numerical models across generations of development have found this amalgamation of the land-ocean-atmosphere processes quite challenging.
There is great potential to realize useful predictability from the IAS across timescales of climate and weather predictions, such as recent studies that have shown useful short-term (seasonal) predictions from the North American Multi-Model Ensemble. Furthermore, the large density of vulnerable human population around the IAS region, burgeoning coastal development, and increasing attention on food production and security lead us to strongly believe that the value of understanding the IAS and its roles in climate and extreme events will gain further importance. Investments in sustained and expanded monitoring, research into mechanisms influencing variability, and modeling to advance predictions will underpin the development of usable climate information to address societal needs in the region.
U S CL I VA RVA R I AT I O N S
Editors: Mike Patterson and Kristan Uhlenbrock
US CLIVAR Project Office1201 New York Ave NW, Suite 400
Washington, DC 20005202-787-1682 www.usclivar.org
© 2015 US CLIVAR
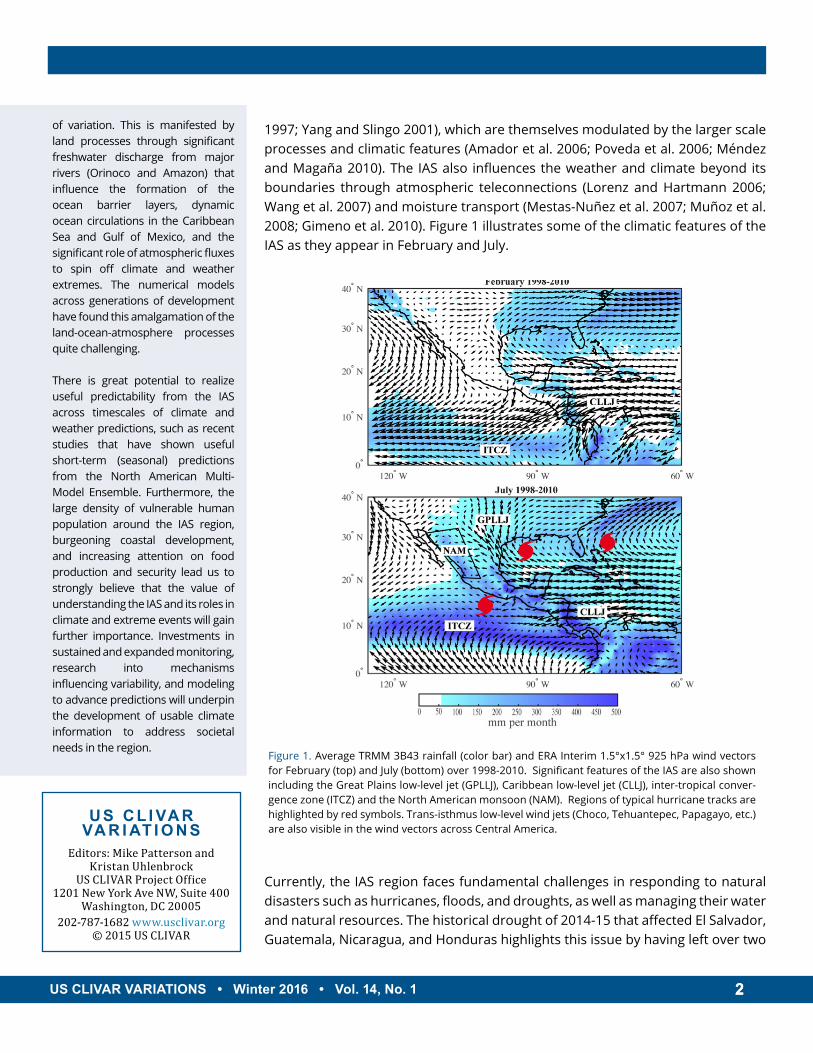
1997; Yang and Slingo 2001), which are themselves modulated by the larger scale processes and climatic features (Amador et al. 2006; Poveda et al. 2006; Méndez and Magaña 2010). The IAS also influences the weather and climate beyond its boundaries through atmospheric teleconnections (Lorenz and Hartmann 2006; Wang et al. 2007) and moisture transport (Mestas-Nuñez et al. 2007; Muñoz et al. 2008; Gimeno et al. 2010). Figure 1 illustrates some of the climatic features of the IAS as they appear in February and July.
Currently, the IAS region faces fundamental challenges in responding to natural disasters such as hurricanes, floods, and droughts, as well as managing their water and natural resources. The historical drought of 2014-15 that affected El Salvador, Guatemala, Nicaragua, and Honduras highlights this issue by having left over two
Figure 1. Average TRMM 3B43 rainfall (color bar) and ERA Interim 1.5°x1.5° 925 hPa wind vectors for February (top) and July (bottom) over 1998-2010. Significant features of the IAS are also shown including the Great Plains low-level jet (GPLLJ), Caribbean low-level jet (CLLJ), inter-tropical conver-gence zone (ITCZ) and the North American monsoon (NAM). Regions of typical hurricane tracks are highlighted by red symbols. Trans-isthmus low-level wind jets (Choco, Tehuantepec, Papagayo, etc.) are also visible in the wind vectors across Central America.
U S C L I V A R V A R I A T I O N S
US CLIVAR VARIATIONS • Winter 2016 • Vol. 14, No. 1 3
million impoverished people in need of international food assistance across the region (WFP 2015). This same region is additionally projected to experience strong warming and drying under climate change (Taylor et al. 2011; Maloney et al. 2014). The current scientific understanding of the modes of rainfall variability in the IAS and their potential for improving predictability on subseasonal and longer time scales, as well as secular projections, is inadequate. The ability to address both the important scientific questions of the region, and provide resources for water resource management and disaster preparedness, hinges significantly on the modernization of observational networks within the region, as well as strengthening of institutional and human resource capacity of local institutions.
Ideally an observing system for the IAS would provide continuous profiles of the atmosphere and ocean on sub-daily time scales and on 100-500 km spatial scales in order to capture the significant physical processes in the region. But there are over 30 independent nations that comprise the land areas surrounding the IAS whose varying economic conditions pose a challenge for maintaining such an observing system. These countries also have differing policies on the sharing of data. Despite these difficulties, the physical processes that are important to the region span these political boarders and thus require an integrated effort in order to advance our understanding of them. This article reviews the current status of in situ ocean, land, and atmospheric observations available in the IAS region, summarizes some new and proposed observations, and highlights critical gaps in the IAS observational networks.
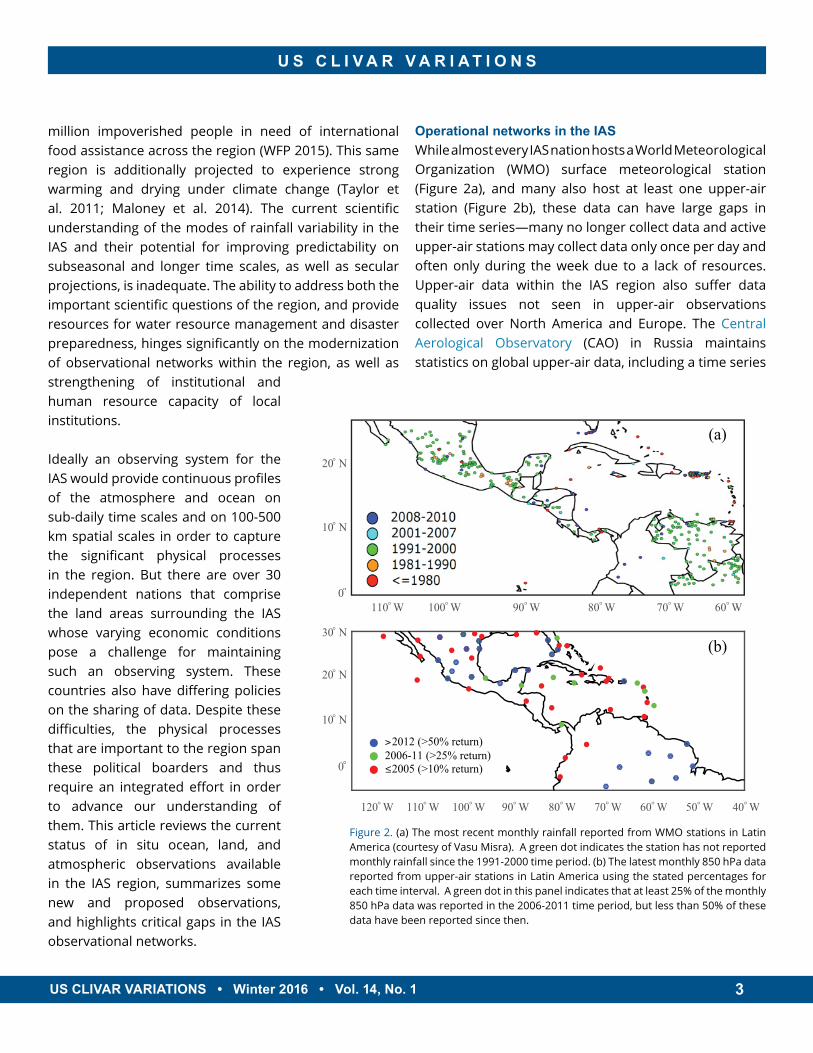
Operational networks in the IASWhile almost every IAS nation hosts a World Meteorological Organization (WMO) surface meteorological station (Figure 2a), and many also host at least one upper-air station (Figure 2b), these data can have large gaps in their time series—many no longer collect data and active upper-air stations may collect data only once per day and often only during the week due to a lack of resources. Upper-air data within the IAS region also suffer data quality issues not seen in upper-air observations collected over North America and Europe. The Central Aerological Observatory (CAO) in Russia maintains statistics on global upper-air data, including a time series
120° W 110° W 100° W 90° W 80° W 70° W 60° W 50° W 40° W
0°00
10° N
20° N
30° N
≤2005 (>10% return)2006-11 (>25% return)>2012 (>50% return)
(b)
(a)
0°00 100° W 80° W 60° W 90° W 70° W 110° W
20° N
10° N
Figure 2. (a) The most recent monthly rainfall reported from WMO stations in Latin America (courtesy of Vasu Misra). A green dot indicates the station has not reported monthly rainfall since the 1991-2000 time period. (b) The latest monthly 850 hPa data reported from upper-air stations in Latin America using the stated percentages for each time interval. A green dot in this panel indicates that at least 25% of the monthly 850 hPa data was reported in the 2006-2011 time period, but less than 50% of these data have been reported since then.
U S C L I V A R V A R I A T I O N S
US CLIVAR VARIATIONS • Winter 2016 • Vol. 14, No. 1 4
of monthly average sounding height for 0000 UTC and 1200 UTC launches by station, revealing some of these issues. The lack of sustained surface and upper-air station measurements impacts the fidelity of satellite estimates of atmospheric water vapor and temperature profiles and integrated water vapor over the region. It additionally impacts constraints on global and regional model forecasts and reanalyses, and, ultimately, limits progress in understanding modes of atmospheric variability over the region on sub-daily to decadal timescales.
The World Ocean Database integrates global ocean temperature and salinity profile data collected from buoys, ships, gliders, and other platforms. By 2007 routine in situ ocean observations around the globe have been primarily provided by Argo floats (e.g., Roemmich and Owens 2000). Argo floats telemeter profiles of ocean temperature and salinity to 2000 m depth daily via satellite. These observations contribute to our understanding of ocean processes on seasonal to decadal timescales. However, Argo measurements are coarse in both time and space and can therefore alias high-frequency regional signals and be more affected by mesoscale ocean eddies (von Schuckmann et al. 2014). The IAS is a region of strong diurnal variations in sea surface temperature (SST) and significant mesoscale eddy activity (Sturges 1992; Sheng and Tang 2003; Jouanno et al. 2012), suggesting Argo observations may have significant biases in this region. In addition, the IAS currently has a low density of Argo floats compared to other regional seas. Ocean mesoscale eddies and their associated upper ocean heat content have been shown to play an important role in the intensification and tracks of Atlantic hurricanes across the IAS (Lin et al. 2012). Thus, surface and upper ocean observations of sufficient density in time and space are needed to better understand and forecast hurricane activity in this region.
The National Buoy Data Center (NDBC) provides hourly observations from a network of buoys and Coastal Marine Automated Network (C-MAN) stations around the globe. All stations measure wind speed, direction, and gust; barometric pressure; and air temperature.
In addition, all buoy stations and some C-MAN stations measure SST and wave height and period. Conductivity and water current are also measured at select stations. NDBC also maintains a database of marine surface observations and deep-ocean assessment and reporting of tsunamis (DART) bottom pressure observations for the early detection, measurement, and real-time reporting of tsunamis in the open ocean. A high density of moored and C-MAN observations are collected in the Gulf of Mexico, however they are concentrated along the North American coastline with few open-ocean measurements in the Gulf of Mexico or Caribbean Sea. NDBC stations in the IAS lack subsurface measurements, thus limiting these observations to studies of the air-sea interface and its variability.
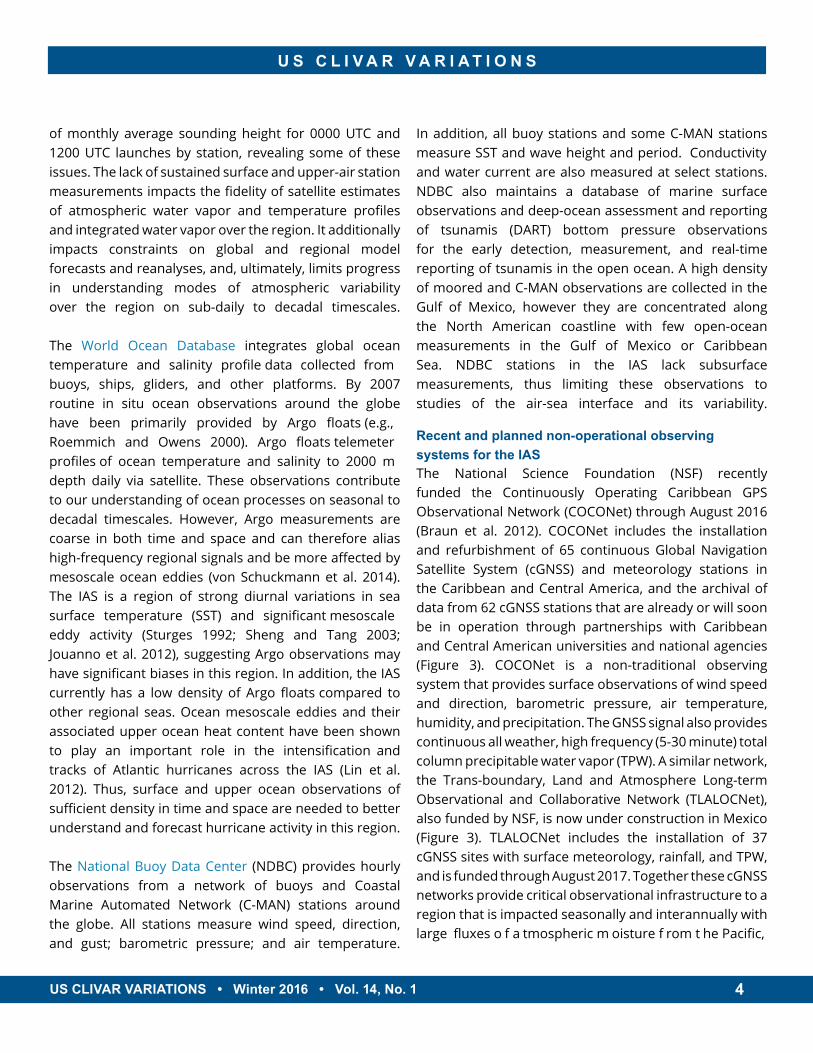
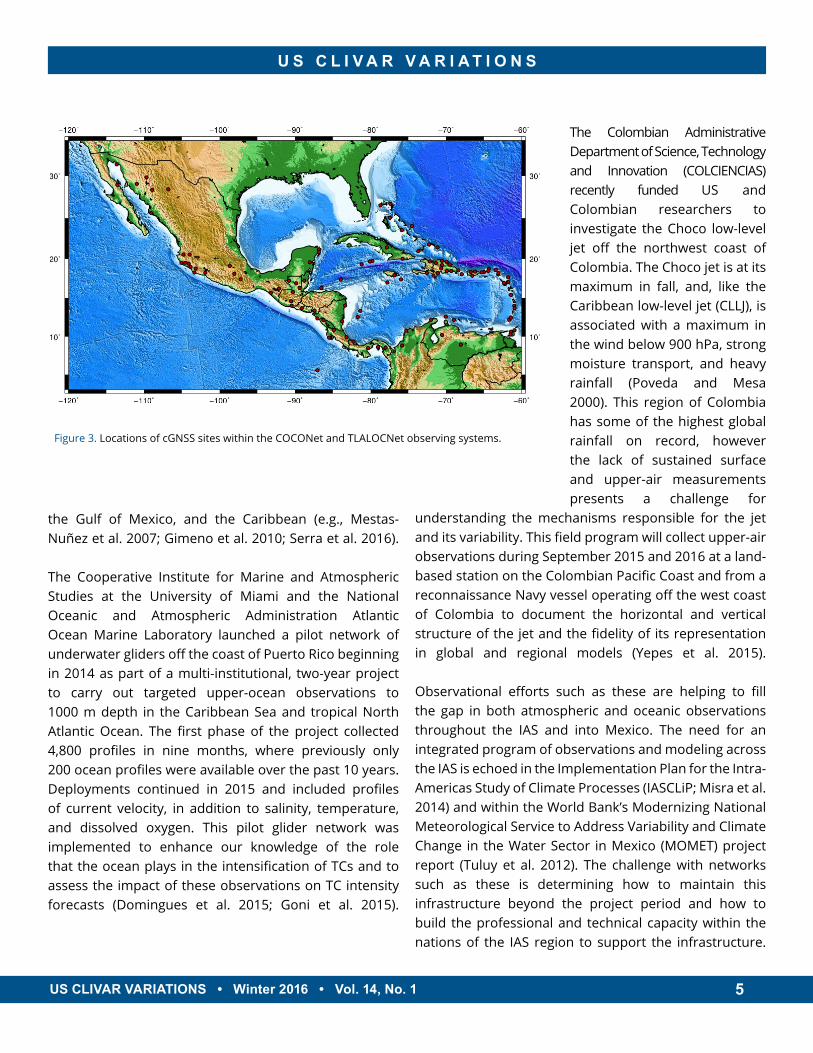
Recent and planned non-operational observing systems for the IASThe National Science Foundation (NSF) recently funded the Continuously Operating Caribbean GPS Observational Network (COCONet) through August 2016 (Braun et al. 2012). COCONet includes the installation and refurbishment of 65 continuous Global Navigation Satellite System (cGNSS) and meteorology stations in the Caribbean and Central America, and the archival of data from 62 cGNSS stations that are already or will soon be in operation through partnerships with Caribbean and Central American universities and national agencies (Figure 3). COCONet is a non-traditional observing system that provides surface observations of wind speed and direction, barometric pressure, air temperature, humidity, and precipitation. The GNSS signal also provides continuous all weather, high frequency (5-30 minute) total column precipitable water vapor (TPW). A similar network, the Trans-boundary, Land and Atmosphere Long-term Observational and Collaborative Network (TLALOCNet), also funded by NSF, is now under construction in Mexico (Figure 3). TLALOCNet includes the installation of 37 cGNSS sites with surface meteorology, rainfall, and TPW, and is funded through August 2017. Together these cGNSS networks provide critical observational infrastructure to a region that is impacted seasonally and interannually with large fluxes o f a tmospheric m oisture f rom t he Pacific,
U S C L I V A R V A R I A T I O N S
US CLIVAR VARIATIONS • Winter 2016 • Vol. 14, No. 1 5
the Gulf of Mexico, and the Caribbean (e.g., Mestas-Nuñez et al. 2007; Gimeno et al. 2010; Serra et al. 2016).
The Cooperative Institute for Marine and Atmospheric Studies at the University of Miami and the National Oceanic and Atmospheric Administration Atlantic Ocean Marine Laboratory launched a pilot network of underwater gliders off the coast of Puerto Rico beginning in 2014 as part of a multi-institutional, two-year project to carry out targeted upper-ocean observations to 1000 m depth in the Caribbean Sea and tropical North Atlantic Ocean. The first phase of the project collected 4,800 profiles in nine months, where previously only 200 ocean profiles were available over the past 10 years. Deployments continued in 2015 and included profiles of current velocity, in addition to salinity, temperature, and dissolved oxygen. This pilot glider network was implemented to enhance our knowledge of the role that the ocean plays in the intensification of TCs and to assess the impact of these observations on TC intensity forecasts (Domingues et al. 2015; Goni et al. 2015).
The Colombian Administrative Department of Science, Technology and Innovation (COLCIENCIAS) recently funded US and Colombian researchers to investigate the Choco low-level jet off the northwest coast of Colombia. The Choco jet is at its maximum in fall, and, like the Caribbean low-level jet (CLLJ), is associated with a maximum in the wind below 900 hPa, strong moisture transport, and heavy rainfall (Poveda and Mesa 2000). This region of Colombia has some of the highest global rainfall on record, however the lack of sustained surface and upper-air measurements presents a challenge for
understanding the mechanisms responsible for the jet and its variability. This field program will collect upper-air observations during September 2015 and 2016 at a land-based station on the Colombian Pacific Coast and from a reconnaissance Navy vessel operating off the west coast of Colombia to document the horizontal and vertical structure of the jet and the fidelity of its representation in global and regional models (Yepes et al. 2015).
Observational efforts such as these are helping to fill the gap in both atmospheric and oceanic observations throughout the IAS and into Mexico. The need for an integrated program of observations and modeling across the IAS is echoed in the Implementation Plan for the Intra-Americas Study of Climate Processes (IASCLiP; Misra et al. 2014) and within the World Bank’s Modernizing National Meteorological Service to Address Variability and Climate Change in the Water Sector in Mexico (MOMET) project report (Tuluy et al. 2012). The challenge with networks such as these is determining how to maintain this infrastructure beyond the project period and how to build the professional and technical capacity within the nations of the IAS region to support the infrastructure.
Figure 3. Locations of cGNSS sites within the COCONet and TLALOCNet observing systems.
U S C L I V A R V A R I A T I O N S
US CLIVAR VARIATIONS • Winter 2016 • Vol. 14, No. 1 6
Opportunities to advance IAS science and monitoring capabilitiesThere are several opportunities for observations to address important and outstanding scientific issues and help diagnose atmospheric and ocean model errors within the IAS and surrounding land areas. In some cases these opportunities could be realized through exploitation of existing observing systems, while others would require expansion of existing observing systems, a process study or new technologies.
One important outstanding scientific issue is the significant cold bias in IAS SST during boreal summer and fall that has persisted over several model development cycles of the Coupled Model Intercomparison Project (CMIP), resulting in an underestimate of the strength of the AWP (Liu et al. 2012; Kozer and Misra 2013; Liu et al. 2013). There are several theories for this bias including inadequate ocean model resolution, which does not resolve ocean eddies important to heat transport in the region (Gent et al. 2010; Patricola et al. 2012; Kirtman et al. 2012; Small et al. 2014); a bias in low clouds over the IAS (Liu et al. 2012), shown to be important to IAS SST variability (Misra et al. 2012); and remote effects of equatorial Atlantic biases related to the slope of the equatorial thermocline, weak easterly wind stress, and low cloud bias over the eastern Atlantic (e.g., Davey et al. 2002; Huang et al. 2007; Richter et al. 2012). The Prediction and Research Moored Array in the Atlantic (PIRATA) collects ocean temperature and salinity measurements to 500 m depth, surface meteorology, rainfall, and, at select sites, ocean currents and radiative fluxes. Extending this mooring capability into the IAS, with perhaps three moorings located along 15°N at roughly 50°W, 60°W and 75°W and two moorings along 25°N at 75°W and 90°W, to fully capture air-sea fluxes and upper ocean structure across the equatorial Atlantic and into the IAS region, together with coordinated modeling efforts, would serve to advance progress on the IAS cold bias issue.
Another outstanding issue is the need to advance the seasonal predictive skill for rainfall and surface temperature over North America, which is currently
limited to one month (Yuan et al. 2011). Studies suggest that the AWP modulates the summer climate of the Western Hemisphere, including circulations affecting the North American monsoon and Central Great Plains (Wang et al. 2007). In addition, the atmosphere over the eastern Pacific side of the Western Hemisphere warm pool exhibits strong intraseasonal variability in rainfall on both roughly 40-day and 20-day timescales (Jiang and Waliser 2008; Maloney et al. 2008; Jiang and Waliser 2009; Rydbeck et al. 2013). These modes have been shown to modulate the gap winds across Central America and Mexico (Maloney and Esbensen 2003), El Niño development (Vintzileos et al. 2005), North American monsoon precipitation (Higgins and Shi 2001; Lorenz and Hartmann 2006), Caribbean precipitation (Martin and Schumacher 2011), the MSD (Magaña et al. 1999; Small et al. 2007), eastern Pacific easterly wave activity (Crosbie and Serra 2014; Rydbeck and Maloney 2014), and TC development (Maloney and Hartmann 2000a,b; Higgins and Shi 2001; Jiang et al. 2012). All of these studies rely on global reanalyses to evaluate the variability of the atmosphere-ocean system in the IAS region. Uncertainty in air-sea fluxes is an issue for these products, and in situ marine observations are lacking to fully diagnose these errors over the tropical oceans (Brunke et al. 2011; Chaudhuri et al. 2013). While the existing NDBC network provides surface meteorology and ocean surface temperatures along the coastline in the IAS, extension of this buoy network into the open waters of the IAS would help reduce uncertainties in air-sea heat, moisture, momentum, and radiative fluxes. Improving the consistency of existing upper-air observations across the land areas of the IAS, in addition to assimilating zenith total delay or TPW from COCONet and TLALOCNet stations, would also help to constrain model analyses and potentially improve model predictive skill over North America on seasonal to intraseasonal timescales.
The low-level jets (e.g., Caribbean, Great Plains, Choco) play an important role in moisture transport (Poveda and Mesa 2000; Mestas-Nuñez et al. 2007; Gimeno et al. 2010), have critical interactions with the mean flow and large-scale features of the IAS (Wang et al. 2007; Poveda et al. 2014), and are a potential source of instability
U S C L I V A R V A R I A T I O N S
US CLIVAR VARIATIONS • Winter 2016 • Vol. 14, No. 1 7
for easterly wave and TC development (Molinari et al. 1997, 2000; Molinari and Vollaro 2000; Maloney and Hartmann 2001; Serra et al. 2010). Representation of the CLLJ and its extension into the eastern Pacific across Costa Rica differs among reanalysis products, resulting in uncertainty in our understanding of the jet instability and its importance to wave and TC growth (Amador et al. 2006; Serra et al. 2010), as well as in the representation of jet interactions with the mean flow and IAS large-scale seasonal climate. Therefore, the diagnosis of low-level jet biases is highlighted to be critical to examine the fidelity of model simulations of the IAS region. The current upper-air network across Central America is insufficient to meet this need.
The diurnal cycles of precipitation, water vapor, and low-level winds (including sea breeze circulations) over southern Mexico and Central America, as well as along the northern coast of South America at sea level and higher elevations, have been identified as important features of the continental hydroclimate around the IAS (Garreaud and Wallace 1997; Yang and Slingo 2001; Zuluaga and Houze 2015). Therefore, systematic analysis of model bias with regard to their diurnal variability is desired. Surface stations with rain gauges exist over the land areas that surround the IAS, and satellites can provide a climatological diurnal cycle in rainfall over land and ocean at coarse spatial scales (~25 km). However, in situ measurements at higher elevations are lacking, and the time series at many sites have significant gaps due to lack of resources. The existing infrastructure in the IAS includes COCONet and TLALOCNet GPS-Met stations that provide
rainfall and TPW at high time resolution. These data provide additional density to the long-standing regional surface meteorological network at several key locations, including small islands, coastal sites, and in elevated terrain. They not only are invaluable for documenting and understanding the diurnal cycle in rainfall throughout the region, but also for improving satellite rainfall estimates, particularly at higher elevations. Continuation of these observations beyond the scheduled project termination dates will be important for providing data in these critical regions, as the community explores ways to improve the surface meteorological network throughout Central America and the Caribbean.
These are just some of the many opportunities that exist for addressing important scientific issues in the IAS and beyond with the current observational network and possible extensions to this network. IASCLiP will engage with other observational efforts within this region including the Gulf of Mexico Coastal Ocean Observing System (GCOOS), the Caribbean Coastal Observing System (CaribCOOS), the Tropical Pacific Observing System (TPOS), and AtlantOS programs. Coordination among these groups is important for assessing the needs for long-term observations across the tropical Pacific, IAS, and Atlantic related to key science questions for the coming decades. A well-coordinated effort would expand the capabilities of these individual programs by assuring consistency in defining critical overlapping scientific issues among the regions and through shared resources to address these issues.
References
Aguilar, E., and Coauthors, 2005: Changes in precipitation and temperature extremes in Central America and northern South America, 1961–2003. J. Geophys. Res.-Atmos., 110, D23107, doi:10.1029/2005JD006119.
Amador, J. A., E. J. Alfaro, O. G. Lizano, and V. O. Magaña, 2006: Atmospheric forcing of the eastern tropical Pacific: A review. Prog. Oceanogr., 69, 101–142, doi:10.1016/j.pocean.2006.03.007.
Barlow, M., and D. Salstein, 2006: Summertime influence of the Madden-Julian Oscillation on daily rainfall over Mexico and Central America. Geophys. Res. Lett, 33, L21708, doi:10.1029/2006GL027738.
Braun, J., and Coauthors, 2012: Focused study of interweaving hazards across the Caribbean. Eos, Trans. Amer. Geophys. Union, 93, 89–90, doi:10.1029/2012EO090001.
Brunke, M. A., Z. Wang, X. Zeng, M. Bosilovich, and C.-L. Shie, 2011: An assessment of the uncertainties in ocean surface turbulent fluxes in 11 reanalysis, satellite-derived, and combined global datasets. J. Climate, 24, 5469–5493, doi:10.1175/2011JCLI4223.1.
Chaudhuri, A. H., R. M. Ponte, G. Forget, and P. Heimbach, 2013: A comparison of atmospheric reanalysis surface products over the ocean and implications for uncertainties in air–sea boundary forcing. J. Climate, 26, 153–170, doi:10.1175/JCLI-D-12-00090.1.
U S C L I V A R V A R I A T I O N S
US CLIVAR VARIATIONS • Winter 2016 • Vol. 14, No. 1 8
Crosbie, E., and Y. Serra, 2014: Intra-seasonal modulation of synoptic scale disturbances and tropical cyclone genesis in the eastern North Pacific. J. Climate, 27, 5724–5745, doi:10.1175/JCLI-D-13-00399.1.
Davey, M., M. and Coauthors, 2002: STOIC: a study of coupled model climatology and variability in tropical ocean regions. Climate Dyn., 18, 403–420, doi:10.1007/s00382-001-0188-6.
Domingues, R. and Coauthors, 2015: Upper ocean response to Hurricane Gonzalo (2014): Salinity effects revealed by targeted and sustained underwater glider observations. Geophys. Res. Lett., 42, 7131–7138, doi:10.1002/2015GL065378.
Garreaud, R. D., and J. M. Wallace, 1997: The diurnal march of convective cloudiness over the Americas. Mon. Wea. Rev, 125, 3157–3171, doi: /10.1175/1520-0493(1997)125<3157:TDMOCC>2.0.CO;2.
Gent, P. R., S. G. Yeager, R. B. Neale, S. Levis, and D. A. Bailey, 2010: Improvements in a half degree atmosphere/land version of the CCSM. Climate Dyn., 34, 819–833, doi:10.1007/s00382-009-0614-8.
Gimeno, L., A. Drumond, R. Nieto, R. M. Trigo, and A. Stohl, 2010: On the origin of continental precipitation. Geophys. Res. Lett, 37, L13804, doi:10.1029/2010GL043712.
Goni, G. J., J. A. Knaff, and I.-I. Lin, 2015: Tropical cyclone heat potential. State of the Climate in 2014, J. Blunden and D. S. Arndt, Eds., Bull. Amer. Meteor. Soc., 96, S121–S122, http://ametsoc.org/SOC-2014.pdf.
Hidalgo, H. G., A. M. Durán-Quesada, J. A. Amador, and E. J. Alfaro, 2015: The Caribbean low-level jet, the inter-tropical convergence zone and precipitation patterns in the Intra-Americas Sea: A proposed dynamical mechanism. Geografiska Annaler: Series A, Phys. Geogr., 97, 41–59, doi:10.1111/geoa.12085.
Higgins, R. W., and W. Shi, 2001: Intercomparison of the principal modes of interannual and intraseasonal variability of the North American monsoon system. J. Climate, 14, 403–417, doi:10.1175/1520-0442(2001)014<0403:IOTPMO>2.0.CO;2.
Huang, B., Z.-Z. Hu, B. Jha, 2007: Evolution of model systematic errors in the tropical Atlantic basin from coupled climate hindcasts. Climate Dyn., 28, 661–682, doi:10.1007/s00382-006-0223-8.
Jiang, X., and D. E. Waliser, 2008: Northward propagation of the subseasonal variability over the eastern Pacific warm pool. Geophys. Res. Lett, 35, L09814, doi:10.1029/2008GL033723.
Jiang, X., and D. E. Waliser, 2009: Two dominant subseasonal variability modes of the eastern Pacific ITCZ. Geophys. Res. Lett, 36, L04704, doi:10.1029/2008GL036820.
Jiang, X., and Coauthors, 2012: Simulation of the intraseasonal variability over the Eastern Pacific ITCZ in climate models. Climate Dyn, 39, 617–636, doi:10.1007/s00382-011-1098-x.
Jouanno, J., J. Sheinbaum, B. Barnier, J. M. Molines, and J. Candela, 2012: Seasonal and interannual modulation of the eddy kinetic energy in the Caribbean Sea. J. Phys. Oceanogr, 42, 2041–2055, doi:10.1175/JPO-D-12-048.1.
Kirtman, B. P., and Coauthors, 2012: Impact of ocean model resolution on CCSM climate simulations. Climate Dyn., 39, 1303–1328, doi:10.1007/s00382-012-1500-3.
Kozar, M. E., and V. Misra, 2013: Evaluation of twentieth-century Atlantic Warm Pool simulations in historical CMIP5 runs. Climate Dyn, 41, 2375–2391, doi:10.1007/s00382-012-1604-9.
Lin, I. I., G. J. Goni, J. A. Knaff, C. Forbes, and M. M. Ali, 2012: Ocean heat content for tropical cyclone intensity forecasting and its impact on storm surge. Nat. Hazards, 66, 1481–1500, doi:10.1007/s11069-012-0214-5.
Liu, H., C. Wang, S.-K. Lee, and D. Enfield, 2012: Atlantic warm-pool variability in the IPCC AR4 CGCM simulations. J. Climate, 25, 5612–5628, doi:10.1175/JCLI-D-11-00376.1.
Liu, H., C. Wang, S.-K. Lee, and D. Enfield, 2013: Atlantic warm pool variability in the CMIP5 simulations. J. Climate, 26, 5317–5336, doi:10.1175/JCLI-D-12-00556.1.
Lorenz, D. J., and D. L. Hartmann, 2006: The effect of the MJO on the North American monsoon. J. Climate, 19, 333–343, doi:10.1175/JCLI3684.1.
Magaña, V., J. Amador, and S. Medina, 1999: The midsummer drought over Mexico and Central America. J. Climate, 12, 1577–1588, doi:10.1175/1520-0442(1999)012<1577:TMDOMA>2.0.CO;2.
Maloney, E., and D. Hartmann, 2000a: Modulation of eastern North Pacific hurricanes by the Madden-Julian oscillation. J. Climate, 13, 1451–1460, doi:10.1175/1520-0442(2000)013<1451:MOENPH>2.0.CO;2.
Maloney, E., and D. Hartmann, 2000b: Modulation of hurricane activity in the Gulf of Mexico by the Madden-Julian oscillation. Science, 287, 2002–2004, doi:10.1126/science.287.5460.2002.
Maloney, E. D., and D. L. Hartmann, 2001: The Madden–Julian oscillation, barotropic dynamics, and North Pacific tropical cyclone formation. Part I: Observations. J. Atmos. Sci, 58, 2545–2558, doi:10.1175/1520-0469(2001)058<2545:TMJOBD>2.0.CO;2.
Maloney, E., and S. Esbensen, 2003: The amplification of east Pacific Madden-Julian oscillation convection and wind anomalies during June-November. J. Climate, 16, 3482–3497, doi:10.1175/1520-0442(2003)016<3482:TAOEPM>2.0.CO;2.
Maloney, E. D., D. B. Chelton, and S. K. Esbensen, 2008: Subseasonal SST variability in the tropical eastern North Pacific during boreal summer. J. Climate, 21, 4149–4167, doi:10.1175/2007JCLI1856.1.
Maloney, E. D., and Coauthors, 2014: North American climate in CMIP5 experiments: Part III: Assessment of twenty-first-century projections. J. Climate, 27, 2230–2270, doi:10.1175/JCLI-D-13-00273.1.
Martin, E. R., and C. Schumacher, 2011: Modulation of Caribbean precipitation by the Madden–Julian oscillation. J. Climate, 24, 813–824, doi:10.1175/2010JCLI3773.1.
Méndez, M., and V. Magaña, 2010: Regional aspects of prolonged meteorological droughts over Mexico and Central America. J. Climate, 23, 1175–1188, doi:10.1175/2009JCLI3080.1.
Mestas-Nuñez, A. M., D. B. Enfield, and C. Zhang, 2007: Water vapor fluxes over the Intra-Americas Sea: Seasonal and interannual variability and associations with rainfall. J. Climate, 20, 1910–1922, doi:10.1175/JCLI4096.1.
Misra, V., A. Stroman, and S. DiNapoli, 2012: The rendition of the Atlantic warm pool in the reanalyses. Climate Dyn., 41, 517–532, doi:10.1007/s00382-012-1503-0.
Misra, V., C. Wang, S.-K. Lee, D. Enfield and A. Douglas, 2014: IASCLiP Implementation Strategy. Available at https://www.eol.ucar.edu/projects/iasclip/documentation/IASCLIP-CLIVAR2014-live.pdf.
Molinari, J., D. Knight, M. Dickinson, D. Vollaro, and S. Skubis, 1997: Potential vorticity, easterly waves, and eastern Pacific tropical cyclogenesis. Mon. Wea. Rev, 125, 2699–2708, doi:10.1175/1520-0493(1997)125<2699:PVEWAE>2.0.CO;2.
Molinari, J., and D. Vollaro, 2000: Planetary- and synoptic-scale influences on eastern Pacific tropical cyclogenesis. Mon. Wea. Rev, 128, 3296–3307, doi:10.1175/1520-0493(2000)128<3296:PASSIO>2.0.CO;2.
Molinari, J., D. Vollaro, S. Skubis, and M. Dickinson, 2000: Origins and mechanisms of eastern Pacific tropical cyclogenesis: A case study. Mon. Wea. Rev, 128, 125–139, doi:10.1175/1520-0493(2000)128<0125:OAMOEP>2.0.CO;2.
U S C L I V A R V A R I A T I O N S
US CLIVAR VARIATIONS • Winter 2016 • Vol. 14, No. 1 9
Muñoz, E., A. J. Busalacchi, S. Nigam, and A. Ruiz-Barradas, 2008: Winter and summer structure of the Caribbean low-level jet. J. Climate, 21, 1260–1276, doi:10.1175/2007JCLI1855.1.
Patricola, C.M., M. Li, X. Zhao, P. Chang, R. Saravanan, J.-S. Hsieh, 2012: An investigation of the tropical Atlantic bias problem using a high-resolution coupled regional climate model Climate Dyn., 39, 2443–2463, doi:10.1007/s00382-012-1320-5.
Poveda, G., and O. J. Mesa, 2000: On the existence of Lloró (the rainiest locality on Earth): Enhanced ocean-land-atmosphere interaction by a low level jet. Geophys. Res. Lett, 27, 1675–1678, doi:10.1029/1999GL006091.
Poveda, G., P. R. Waylen, and R. S. Pulwarty, 2006: Annual and inter-annual variability of the present climate in northern South America and southern Mesoamerica. Palaeogeogr., Palaeoclim., Palaeoecol., 234, 3–27, doi:10.1016/j.palaeo.2005.10.031.
Poveda, G., L. Jaramillo, and L. F. Vallejo, 2014: Seasonal precipitation patterns along pathways of South American low-level jets and aerial rivers. Water Resour. Res., 50, 98–118, doi:10.1002/2013WR014087.
Richter, I., S.-P. Xie, A.T. Wittenberg, Y. Masumoto, 2012: Tropical Atlantic biases and their relation to surface wind stress and terrestrial precipitation. Climate Dyn., 38, 985–1001, doi:10.1007/s00382-011-1038-9.
Roemmich, D., and W. B. Owens, 2000: The Argo Program: Observing the global ocean with profiling floats. Oceanogr., 13, 45–50, doi:10.5670/oceanog.2009.36.
Rydbeck, A. V., E. D. Maloney, S.-P. Xie, J. Hafner, and J. Shaman, 2013: Remote forcing versus local feedback of East Pacific intraseasonal variability during boreal summer. J. Climate, 26, 3575–3596, doi:10.1175/JCLI-D-12-00499.1.
Rydbeck, A. V., and E. D. Maloney, 2014: Energetics of East Pacific easterly waves during intraseasonal events. J. Climate, 27, 7603–7621, doi:10.1175/JCLI-D-14-00211.1.
Serra, Y. L., G. N. Kiladis, and K. I. Hodges, 2010: Tracking and mean structure of easterly waves over the Intra-Americas Sea. J. Climate, 23, 4823–4840, doi:10.1175/2010JCLI3223.1.
Serra, Y.L., and Coauthors, 2016: The North American monsoon GPS transect experiment 2013. Bull. Amer. Meteor. Soc., submitted.
Sheng, J., and L. Tang, 2003: A numerical study of circulation in the western Caribbean Sea. J. Phys. Oceanogr, 33, 2049–2069, doi:10.1175/1520-0485(2003)033<2049:ANSOCI>2.0.CO;2.
Small, R. J. O., S. P. de Szoeke, and S.-P. Xie, 2007: The Central American midsummer drought: Regional aspects and large-scale forcing*. J. Climate, 20, 4853–4873, doi:10.1175/JCLI4261.1.
Small, R.J., and Coauthors, 2014: A new synoptic scale resolving global climate simulation using the Community Earth System Model. J. Adv. Model. Earth Syst., 6, 1065–1094, doi:10.1002/2014MS000363.
Sturges, W., 1992: The spectrum of loop current variability from gappy data. J. Phys. Oceanogr, 22, 1245–1256, doi:10.1175/1520-0485(1992)022<1245:TSOLCV>2.0.CO;2.
Taylor, M. A., T. S. Stephenson, and A. Owino, 2011: Tropical gradient influences on Caribbean rainfall. J. Geophys. Res.-Atmos, 116, D00Q08, doi:10.1029/2010JD015580.
Tuluy, H. A., G. M. Grandolini, E. J. Ijjasz-Vasquez, K. E. Kemper, and J. Zuleta, 2012: Project Appraisal Document on a Proposed Loan in the Amount of US$105,263,157.89 to the United Mexican States for the Modernization of the National Meteorological Service for Improved Climate Adaptation Project. World Bank, Report No. 67971-MX, pp. 77, Available at http://www-wds.worldbank.org/external/default/WDSContentServer/WDSP/IB/2012/04/30/000350881_20120430093034/Rendered/PDF/679710PAD0P12600Offcial0Use0Only090.pdf.
Vintzileos, A., M. M. Rienecker, M. J. Suarez, S. D. Schubert, and S. K. Miller, 2005: Local versus remote wind forcing of the equatorial Pacific surface temperature in July 2003. Geophys. Res. Lett., 32, L05702, doi:10.1029/2004GL021972.
von Schuckmann, K., J.-B. Sallee, D. Chambers, P. Y. Le Traon, C. Cabanes, F. Gaillard, S. Speich, and M. Hamon, 2014: Consistency of the current global ocean observing systems from an Argo perspective. Ocean Sci, 10, 547–557, doi:10.5194/os-10-547-2014.
Wang, C., S.-K. Lee, and D. B. Enfield, 2007: Impact of the Atlantic warm pool on the summer climate of the Western Hemisphere. J. Climate, 20, 5021–5040, doi:10.1175/JCLI4304.1.
Wang, C., S.-K. Lee, and D. B. Enfield, 2008: Atlantic warm pool acting as a link between Atlantic multidecadal oscillation and Atlantic tropical cyclone activity. Geochem. Geophy. Geosys., 9, Q05V03, doi:10.1029/2007GC001809.
WFP, 2015: Central America Drought: Restoring Food Security and Livelihoods Through Assistance for Vulnerable Groups Affected by Recurrent Shocks. World Food Program, Situation Report #3, November 2015. Available at http://documents.wfp.org/stellent/groups/Public/documents/ep/WFP279327.pdf.
Yang, G.-Y., and J. Slingo, 2001: The diurnal cycle in the Tropics. Mon. Wea. Rev, 129, 784–801, doi:10.1175/1520-0493(2001)129<0784:TDCITT>2.0.CO;2.
Yepes, J., J. F. Mejia, and G. Poveda, 2015: Choco and Caribbean low-level jets: observations and sensitivity analysis in regional climate models. Observing and Modeling Climate Variability in the Intra-Americas Seas and Impacts on the Continental Americas and the Caribbean, virtual workshop, 9-11 September 2015, US CLIVAR. Available at https://usclivar.org/sites/default/files/meetings/2015-iasclip-posters/Poster%20USClivar.pdf.
Yuan, X., E. F. Wood, L. Luo, and M. Pan, 2011: A first look at Climate Forecast System version 2 (CFSv2) for hydrological seasonal prediction. Geophys. Res. Lett, 38, L13402, doi:10.1029/2011GL047792.
Zuluaga, M. D., and R. A. Houze Jr, 2015: Extreme convection of the near-equatorial Americas, Africa, and adjoining oceans as seen by TRMM. Mon. Wea. Rev, 143, 298–316, doi:10.1175/MWR-D-14-00109.1.
U S C L I V A R V A R I A T I O N S
US CLIVAR VARIATIONS • Winter 2016 • Vol. 14, No. 1 10
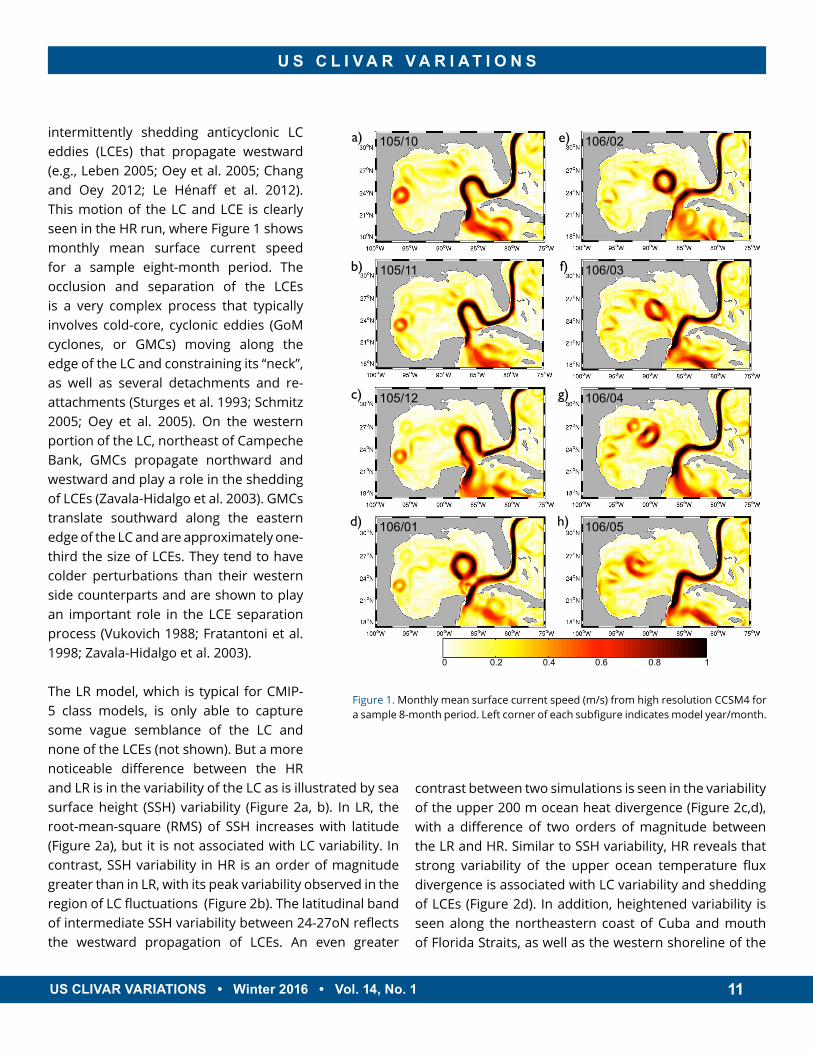
Mesoscale features dominate the circulation in the Gulf of Mexico (GoM). These features are on a
spatial scale order of 10-100 km and include the Loop Current (LC), anticyclonic LC eddies, cyclonic frontal eddies, and filaments. Dynamics of these currents are not well understood, and CMIP-5 (Coupled Model Intercomparison Project, 5th phase) class climate models cannot simulate them because of insufficient spatial resolution. At the same time, mesoscale currents can play a fundamentally important role on modulating climate extremes over North America. For instance, warm core eddies in the GoM can drift for months, forming a heat reservoir that supports and sustains hurricane activity, such as the case for Hurricane Opal in 1995 (Shay et al. 2000). Heat advection by currents and eddies can influence the distribution of heat anomalies associated with the Atlantic warm pool (AWP), which in turn affects the rainfall pattern over the Caribbean and the US (Wang and Lee 2007). Previous studies have demonstrated that surface heat fluxes are paramount for AWP formation (Enfield 2005; Lee et al. 2007), which is strongly linked to enhancing moisture content in the Great Plains low-level jet in the summer and bringing increased precipitation over the GoM and continental US (Wang et al. 2007). However, it is still unclear what the contribution of ocean heat flux to AWP is. In a study by Lee et al. (2007), the authors found that advective heat flux divergence plays a relatively minor role in the GoM. However, the authors note that due to the coarse resolution of the climate model used,
the LC and its variability was not well captured, and thus its impact on heat anomaly distribution over the GoM could not be fairly evaluated.
It is imperative that these mesoscale features and variability in the GoM be well represented in climate models if we are to gain a better understanding of the processes at this scale that can exert control over climate extremes in North America. The focus of this study is to highlight ocean mesoscale variability in the GoM as seen in a global coupled climate models and view the implications on heat anomaly distribution in the GoM. Therefore, two 54-year simulations of the Community Climate System Model (CCSM4) are compared. They both have the same atmospheric and land models with a half-degree spatial resolution, but differ in the resolution of the ocean and sea-ice components: The first has a one-tenth degree ocean and sea-ice component (high resolution; HR) and the second has a one-degree ocean and sea-ice (low resolution; LR). Additional details for both model configurations can be found in Kirtman et al. (2012).
The LC originates from the Caribbean Sea, where the warm Caribbean Current enters the GoM through the Yucatan Channel, continues as the LC in the GoM and exits via the Florida Straits as the Florida Current (Figure 1a). Observations as well as eddy-resolving ocean-modeling studies have shown that the LC has high variability, constantly moving in the north-south direction from an extended to a retracted position and
Ocean mesoscale variability in the Gulf of MexicoDian Putrasahan1,2, Igor Kamenkovich1, Ben Kirtman1, and Lynn K. Shay1
1University of Miami2Max-Planck Institute for Meteorology, Germany
U S C L I V A R V A R I A T I O N S
US CLIVAR VARIATIONS • Winter 2016 • Vol. 14, No. 1 11
intermittently shedding anticyclonic LC eddies (LCEs) that propagate westward (e.g., Leben 2005; Oey et al. 2005; Chang and Oey 2012; Le Hénaff et al. 2012). This motion of the LC and LCE is clearly seen in the HR run, where Figure 1 shows monthly mean surface current speed for a sample eight-month period. The occlusion and separation of the LCEs is a very complex process that typically involves cold-core, cyclonic eddies (GoM cyclones, or GMCs) moving along the edge of the LC and constraining its “neck”, as well as several detachments and re-attachments (Sturges et al. 1993; Schmitz 2005; Oey et al. 2005). On the western portion of the LC, northeast of Campeche Bank, GMCs propagate northward and westward and play a role in the shedding of LCEs (Zavala-Hidalgo et al. 2003). GMCs translate southward along the eastern edge of the LC and are approximately one-third the size of LCEs. They tend to have colder perturbations than their western side counterparts and are shown to play an important role in the LCE separation process (Vukovich 1988; Fratantoni et al. 1998; Zavala-Hidalgo et al. 2003).
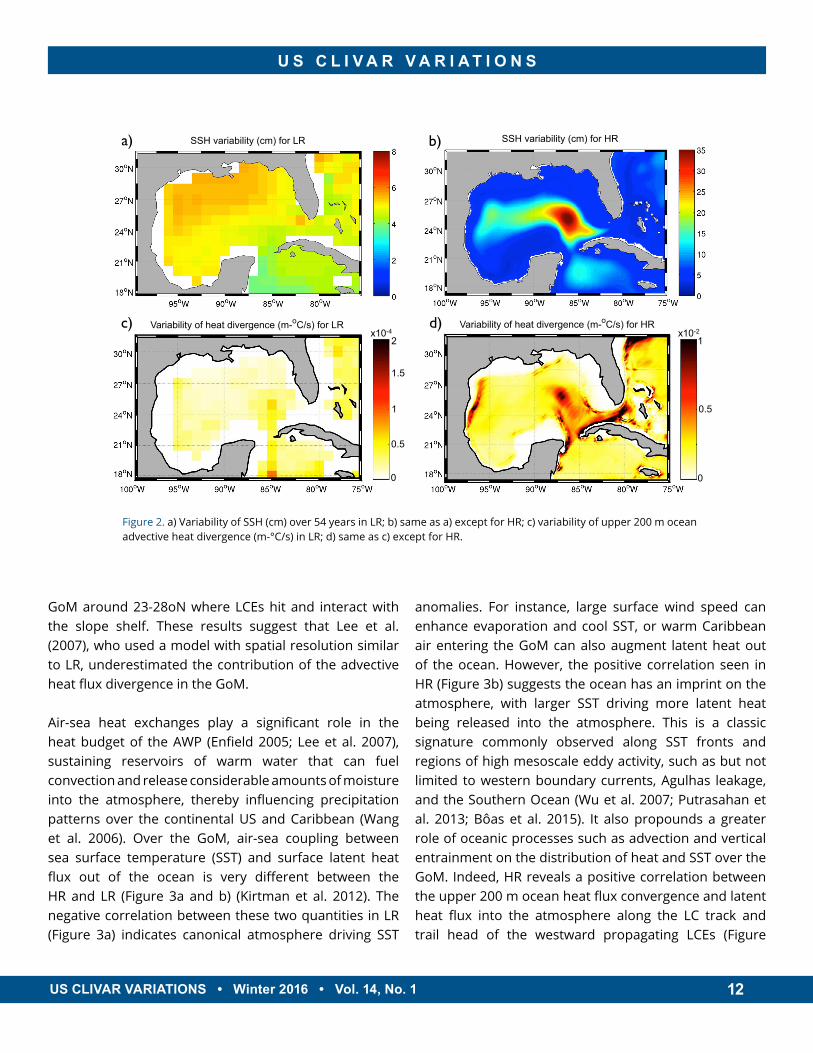
The LR model, which is typical for CMIP-5 class models, is only able to capture some vague semblance of the LC and none of the LCEs (not shown). But a more noticeable difference between the HR and LR is in the variability of the LC as is illustrated by sea surface height (SSH) variability (Figure 2a, b). In LR, the root-mean-square (RMS) of SSH increases with latitude (Figure 2a), but it is not associated with LC variability. In contrast, SSH variability in HR is an order of magnitude greater than in LR, with its peak variability observed in the region of LC fluctuations (Figure 2b). The latitudinal band of intermediate SSH variability between 24-27oN reflects the westward propagation of LCEs. An even greater
contrast between two simulations is seen in the variability of the upper 200 m ocean heat divergence (Figure 2c,d), with a difference of two orders of magnitude between the LR and HR. Similar to SSH variability, HR reveals that strong variability of the upper ocean temperature flux divergence is associated with LC variability and shedding of LCEs (Figure 2d). In addition, heightened variability is seen along the northeastern coast of Cuba and mouth of Florida Straits, as well as the western shoreline of the
106/05
0 0.2 0.4 0.6 0.8 1
106/01
105/12
105/11
105/10 106/02
106/03
106/04
a)
b)
c)
d)
e)
f)
g)
h)
Figure 1. Monthly mean surface current speed (m/s) from high resolution CCSM4 for a sample 8-month period. Left corner of each subfigure indicates model year/month.
U S C L I V A R V A R I A T I O N S
US CLIVAR VARIATIONS • Winter 2016 • Vol. 14, No. 1 12
GoM around 23-28oN where LCEs hit and interact with the slope shelf. These results suggest that Lee et al. (2007), who used a model with spatial resolution similar to LR, underestimated the contribution of the advective heat flux divergence in the GoM.
Air-sea heat exchanges play a significant role in the heat budget of the AWP (Enfield 2005; Lee et al. 2007), sustaining reservoirs of warm water that can fuel convection and release considerable amounts of moisture into the atmosphere, thereby influencing precipitation patterns over the continental US and Caribbean (Wang et al. 2006). Over the GoM, air-sea coupling between sea surface temperature (SST) and surface latent heat flux out of the ocean is very different between the HR and LR (Figure 3a and b) (Kirtman et al. 2012). The negative correlation between these two quantities in LR (Figure 3a) indicates canonical atmosphere driving SST
anomalies. For instance, large surface wind speed can enhance evaporation and cool SST, or warm Caribbean air entering the GoM can also augment latent heat out of the ocean. However, the positive correlation seen in HR (Figure 3b) suggests the ocean has an imprint on the atmosphere, with larger SST driving more latent heat being released into the atmosphere. This is a classic signature commonly observed along SST fronts and regions of high mesoscale eddy activity, such as but not limited to western boundary currents, Agulhas leakage, and the Southern Ocean (Wu et al. 2007; Putrasahan et al. 2013; Bôas et al. 2015). It also propounds a greater role of oceanic processes such as advection and vertical entrainment on the distribution of heat and SST over the GoM. Indeed, HR reveals a positive correlation between the upper 200 m ocean heat flux convergence and latent heat flux into the atmosphere along the LC track and trail head of the westward propagating LCEs (Figure
Figure 2. a) Variability of SSH (cm) over 54 years in LR; b) same as a) except for HR; c) variability of upper 200 m ocean advective heat divergence (m-°C/s) in LR; d) same as c) except for HR.
0
0.5
1
1.5
2x10⁻⁴
0
0.5
1x10⁻²
Variability of heat divergence (m-oC/s) for LR Variability of heat divergence (m-oC/s) for HR
SSH variability (cm) for HRSSH variability (cm) for LRa)
c)
b)
d)

U S C L I V A R V A R I A T I O N S
US CLIVAR VARIATIONS • Winter 2016 • Vol. 14, No. 1 13
3c), implying that the contribution of ocean advection, in supplying and distributing heat over the GoM, is substantial. This purports the importance of mesoscale advection and variability to the heat budget of the GoM by providing a conduit for heat transport into the GoM.
This brief study suggests that the distribution of heat anomalies in the GoM is in large part controlled by the LC advection and mesoscale variability rather than being solely determined by the atmosphere. Most of the CMIP-5 models still have cold SST bias in the AWP region, even though it is already an improvement from its predecessor, CMIP-3 (Liu et al. 2013). Part of the cold bias in CMIP-5 models can be attributed to high-level cloud radiative forcing (Liu et al. 2013), but the full cause of this cold bias is still open to debate. Could the lack of ocean resolution in current generation climate models lead to a deficit of warm tropical waters advecting into the AWP, thus causing the cold SST bias? In light of the results presented here, it will be interesting to see if there is any
improvement to the SST bias from resolving mesoscale features and variability, and what the contribution from oceanic processes is.
The distribution of heat anomalies over the GoM in turn affects the amount of moisture and heat released into the overlying atmosphere and can potentially influence local and surrounding rainfall patterns (Wang et al. 2006; Lee et al. 2007). Ongoing studies are currently conducted to understand the mechanisms that relate LC/LCEs variability to atmospheric circulation and processes, with the goal of improving rainfall predictions over the Caribbean and continental US.
Figure 3. a) Pointwise correlation between latent heat flux (LHF) and SST for LR; b) same as a) except for HR; c) pointwise correlation between LHF and upper 200 m ocean heat flux convergence.
Acknowledgments
This study was supported by the NOAA grant NA12OAR4310073.
Need mask! Use colormap jet or dredblue
Correlation of LHF with SST for LR Correlation of LHF with SST for HR
Correlation of LHF with ocean heat convergence for HR
a) b)
c)

U S C L I V A R V A R I A T I O N S
US CLIVAR VARIATIONS • Winter 2016 • Vol. 14, No. 1 14
References
Bôas, a B. V., O. T. Sato, A. Chaigneau, and G. P. Castelão, 2015: The signature of mesoscale eddies on the air-sea turbulent heat fluxes in the South Atlantic Ocean. Geophy. Res. Lett., 42, 1–7, doi:10.1002/2015GL063105.1.
Chang, Y. L., and L. Y. Oey, 2012: Why does the Loop Current tend to shed more eddies in summer and winter? Geophys. Res. Lett., 39, L05605, doi:10.1029/2011gl050773.
Enfield, D., 2005: The heat balance of the Western Hemisphere warm pool. J. Climate, 18, 2662–2681, doi:10.1175/JCLI3427.1.
Fratantoni, P. S., T. N. Lee, G. P. Podesta, and F. Muller-Karger, 1998: The influence of Loop Current perturbations on the formation and evolution of Tortugas eddies in the southern Straits of Florida. J. Geophys. Res., 103, 24759, doi:10.1029/98JC02147.
Le Hénaff, M., V. H. Kourafalou, Y. Morel, and A. Srinivasan, 2012: Simulating the dynamics and intensification of cyclonic Loop Current Frontal Eddies in the Gulf of Mexico. J. Geophys. Res. Ocean., 117, 1–20, doi:10.1029/2011JC007279.
Kirtman, B. P. and Coauthors, 2012: Impact of ocean model resolution on CCSM climate simulations. Climate Dyn., 39, 1303–1328, doi:10.1007/s00382-012-1500-3.
Leben, R. R., 2005: Altimeter-derived Loop Current metrics. Circ. Gulf Mex. Obs. Model., 181–201, doi:10.1029/161GM15.
Lee, S.-K., D. B. Enfield, and C. Wang, 2007: What drives the seasonal onset and decay of the Western Hemisphere warm pool? J. Climate, 20, 2133–2146, doi:10.1175/JCLI4113.1.
Liu, H., C. Wang, S. K. Lee, and D. Enfield, 2013: Atlantic warm pool variability in the CMIP5 simulations. J. Climate, 26, 5315–5336, doi:10.1175/JCLI-D-12-00556.1.
Oey, L., T. Ezer, and H. Lee, 2005: Loop Current, rings and related circulation in the Gulf of Mexico: A review of numerical models and future challenges. Circ. Gulf Mex. Obs. Model., 161, 31–56, doi: 10.1029/161GM04.
Putrasahan, D. A., A. J. Miller, and H. Seo, 2013: Isolating mesoscale coupled ocean–atmosphere interactions in the Kuroshio Extension region. Dyn. Atmos. Ocean., 63, 60–78, doi:10.1016/j.dynatmoce.2013.04.001.
Schmitz, W. J., 2005: Cyclones and westward propagation in the shedding of anticyclonic rings from the Loop Current. Circulation in the Gulf of Mexico: Observations and Models, W. Sturges and A. Lugo-Fernandez, Eds., American Geophysical Union, 241-261, doi: 10.1029/161GM18.
Shay, L. K., G. J. Goni, and P. G. Black, 2000: Effects of a warm oceanic feature on Hurricane Opal. Mon. Weather Rev., 128, 1366–1383, doi:10.1175/1520-0493.
Sturges, W., J. C. Evans, S. Welsh, and W. Holland, 1993: Separation of warm-core rings in the Gulf of Mexico. J. Phys. Oceanogr., 23, 250–268, doi:10.1175/1520-0485.
Vukovich, F. M., 1988: Loop Current boundary variations. J. Geophys. Res. Ocean., 93, doi:10.1029/JC093iC12p15585.
Wang, C., and S. K. Lee, 2007: Atlantic warm pool, Caribbean low-level jet, and their potential impact on Atlantic hurricanes. Geophys. Res. Lett., 34, 1–5, doi:10.1029/2006GL028579.
Wang, C., D. B. Enfield, S. K. Lee, and C. W. Landsea, 2006: Influences of the Atlantic warm pool on western hemisphere summer rainfall and Atlantic hurricanes. J. Climate, 19, 3011–3028, doi:10.1175/JCLI3770.1.
Wang, C., S. Lee, and D. B. Enfield, 2007: Impact of the Atlantic Warm Pool on the Summer Climate of the Western Hemisphere. J. Clim., 20, 5021–5040, doi:10.1175/JCLI4304.1.
Wu, R., B. P. Kirtman, and K. Pegion, 2007: Surface latent heat flux and its relationship with sea surface temperature in the National Centers for Environmental Prediction Climate Forecast System simulations and retrospective forecasts. Geophys. Res. Lett., 34, 1–6, doi:10.1029/2007GL030751.
Zavala-Hidalgo, J., S. L. Morey, and J. J. O’Brien, 2003: Cyclonic eddies northeast of the Campeche Bank from altimetry data. J. Phys. Oceanogr., 33, 623–629, doi: 10.1175/1520-0485(2003)033<0623:CENOTC>2.0.CO;2.
Abstracts Due March 15
18-25 September 2016 Qingdao, China
Join the international climate community to review the state of the science, prioritize international research
plans, and initiate new collaborations.
U S C L I V A R V A R I A T I O N S
US CLIVAR VARIATIONS • Winter 2016 • Vol. 14, No. 1 15
The Intra-American midsummer drought: Variability and open questions
Kristopher B. Karnauskas1 and Scott Curtis2
1University of Colorado Boulder2East Carolina University
The climatological seasonal cycle of precipitation in the Intra-Americas region including the Caribbean,
Mexico and Central America spans roughly May through October, although the exact beginning and end dates vary significantly by location. Long known to agriculturally based societies across the global tropics, within the rainy season is a temporary break from monsoon rains. This so–called midsummer drought (MSD), known regionally as la canícula or veranillo, is such an important feature of the climatological rainy season that seeding and growing practices of farmers have been tailored specifically to leverage a biannual monsoon (Gianini et al. 2009). While the MSD is a recurring dry spell in an otherwise rainy season, empirical evidence suggests that this paradigm is exactly what farmers associate with drought. In a study by Campbell et al. (2011), 45% of Jamaican farmers surveyed associated drought with no rainfall in the rainy season, while 15% identified it with a lack of resources (“when there is not enough water for plants”) and only 10% with a direct impact on their productivity (“when plants dry up”).
There is much uncertainty about the strength and timing of local and remote forcings that cause the MSD. Interestingly, many studies have treated the Caribbean MSD and Pacific MSD separately, and thus different theories have been proposed to explain the generation of this bimodal precipitation signal. Furthermore, there is some debate as to whether the MSD is itself a feature of the climate system or merely a byproduct of
the timing of the early and late rainy seasons. While the MSD has been recognized for some time in the scientific literature (e.g., Portig 1961; Hastenrath 1967), Magaña et al. (1999) revived interest in the MSD and proposed a primarily radiative and thermodynamic explanation for the MSD along the Pacific coast of Mexico and Central America. They suggested that once early summer convection builds over the western hemisphere warm pool, the enhanced cloud cover blocks downwelling solar radiation, cooling the surface temperatures. This, in turn, inhibits rainfall in July-August until the removal of cloud shadowing is sufficient to return the system to pre-MSD conditions through a build up of sea surface temperature (SST) and convection. Recently, Karnauskas et al. (2013) modified the Magaña et al. (1999) hypothesis and showed that the MSD for the Pacific coast of Central America can be explained by the propagating solar declination (SD). Karnauskas et al. (2013) demonstrated the latitudinal dependence of the two climatological precipitation maxima to the biannual crossing of the SD drives two peaks in convective instability and hence rainfall. In addition to this underlying local mechanism, a number of remote processes tend to peak during the MSD, including the North American Monsoon, the Caribbean Low–Level Jet (CLLJ), and the North Atlantic Subtropical High (NASH), which may also act to suppress rainfall along the Pacific coast of Central America and generate interannual variability in the strength or timing of the MSD. Alternatively, mechanisms for the Caribbean MSD have focused on the NASH and CLLJ. Rather than
U S C L I V A R V A R I A T I O N S
US CLIVAR VARIATIONS • Winter 2016 • Vol. 14, No. 1 16
a latitudinal dependence on the MSD, there appears to be a longitudinal dependence due to the building of the NASH into the Caribbean during the mid-summer (Curtis and Gamble 2007). Local enhancements of the MSD in the western Caribbean may be due to variations in the CLLJ around Jamaica (Curtis and Gamble 2007; Gamble and Curtis 2008). Needless to say, mechanisms for the MSD appear to be regional in nature despite its prevalence across much of the global tropics.
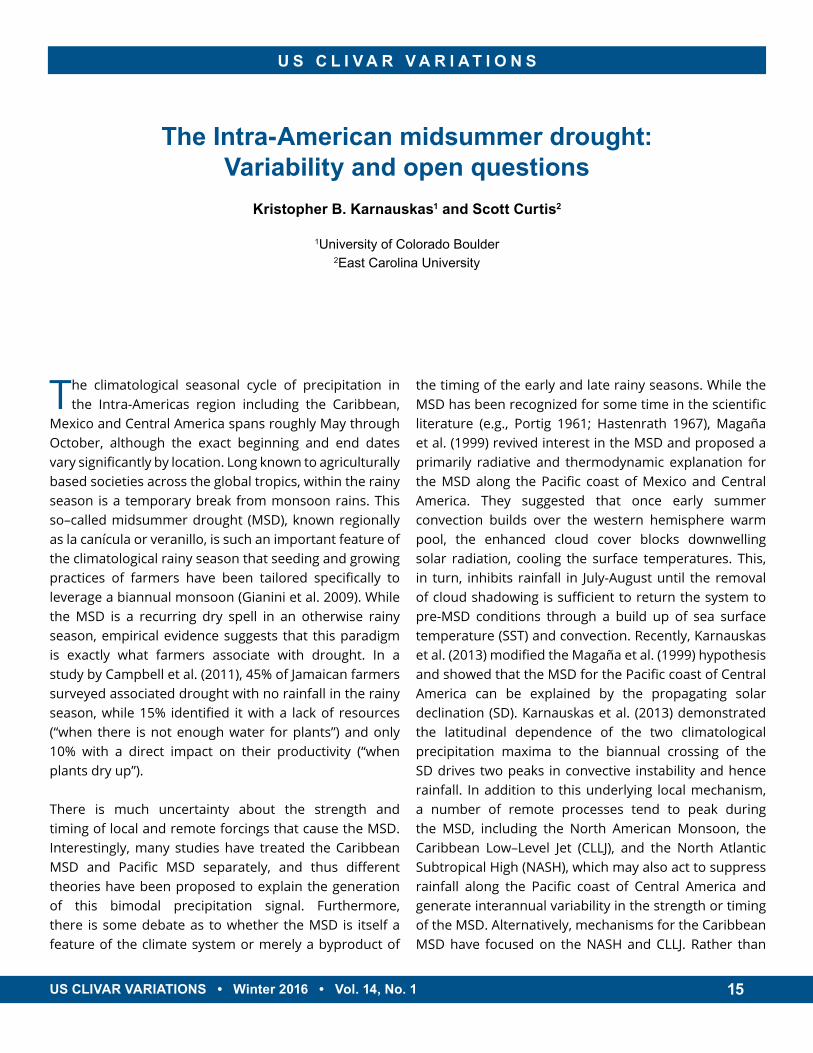
Impacts of the midsummer droughtWhile the MSD is a feature of the annual cycle, there is strong interannual variability in its severity. This problem is well illustrated in three annual cycles of daily rainfall amounts from Cancún, Mexico (Figure 1): one for the climatology and one for two different years within the same decade. Although Cancún exhibits a modest climatological midsummer drought, a given year may be marked by a remarkably strong MSD, while the next year may bring the extreme opposite.
This interannual variability can also be seen in remotely sensed estimates of vegetation vigor (Allen et al. 2010). It is not surprising then that farmers in the region appreciate and attempt to account for the variability of the MSD (Gamble et al. 2010). In Jamaica, July is the most risky, yet critical month for agriculture yields. During the MSD, farmers plant “quick crops” across the MSD for the tourism market in the hopes of earning enough capital to sustain their primary farming activities. In a weak MSD year, farmers can “catch a crop” and invest in their farming operations. However, a particularly strong MSD can lead to farm abandonment. Zaragoza, Mexico experienced a near-complete crop failure in 2009 due in part to a severe MSD (Roge et al. 2014).
Observed temporal variability of the midsummer drought
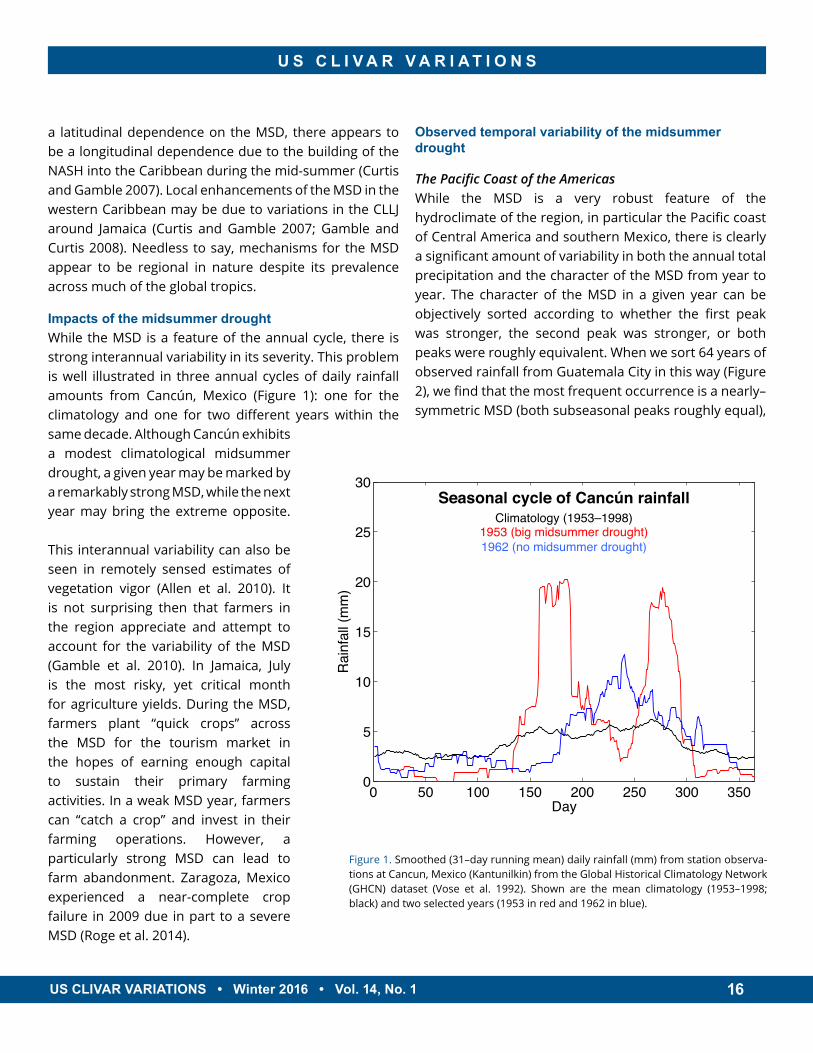
The Pacific Coast of the AmericasWhile the MSD is a very robust feature of the hydroclimate of the region, in particular the Pacific coast of Central America and southern Mexico, there is clearly a significant amount of variability in both the annual total precipitation and the character of the MSD from year to year. The character of the MSD in a given year can be objectively sorted according to whether the first peak was stronger, the second peak was stronger, or both peaks were roughly equivalent. When we sort 64 years of observed rainfall from Guatemala City in this way (Figure 2), we find that the most frequent occurrence is a nearly–symmetric MSD (both subseasonal peaks roughly equal),
0 50 100 150 200 250 300 3500
5
10
15
20
25
30
Day
Rai
nfal
l (m
m)
Seasonal cycle of Cancún rainfallClimatology (1953–1998)
1953 (big midsummer drought)1962 (no midsummer drought)
Figure 1. Smoothed (31–day running mean) daily rainfall (mm) from station observa-tions at Cancun, Mexico (Kantunilkin) from the Global Historical Climatology Network (GHCN) dataset (Vose et al. 1992). Shown are the mean climatology (1953–1998; black) and two selected years (1953 in red and 1962 in blue).

U S C L I V A R V A R I A T I O N S
US CLIVAR VARIATIONS • Winter 2016 • Vol. 14, No. 1 17
and that an early–biased MSD is quite rare. Furthermore, there is no apparent relationship between early vs. late–biased structure and whether the MSD was stronger vs. weaker than normal.
It is possible to explore whether there is inherent predictability in the MSD by evaluating interannual relationships between total annual precipitation, precipitation during the peak months, and precipitation during the height of the MSD. For example, there is a significant correlation (r=0.5, 99%) between precipitation during the first peak in the seasonal cycle at 91°W, 14°N and during the driest month of the MSD (r=0.5, 99%). Large–scale drivers of interannual climate variability (e.g., El Niño–Southern Oscillation or ENSO) likely play an important role in this apparent potential predictability.
Several studies have linked ENSO to the strength of the early and late precipitation peaks in the greater Caribbean region (e.g., Covey and Hastenrath 1978). During the build up of an El Niño event (year 0), there is a decrease in the second summer peak (August-October). This response
stems from higher than average SSTs in the eastern Pacific, which alters the Walker circulation—anomalously low pressure, ascending air, and copious precipitation in the eastern Pacific balanced by high pressure, subsidence, and dry conditions in the Caribbean. During the waning year of an El Niño (year +1), there is an increase in precipitation in the first summer peak (May-July), which is attributed to an atmospheric bridge mechanism via a Pacific/North American teleconnection pattern (PNA)—weaker NASH, weaker trades, and higher SST (see Curtis and Hastenrath 1995). Curtis (2002) was the first study to examine ENSO’s impact on the complete bimodal character of rainfall (May to October) over Central America and he found that the MSD was stronger during
year 0 of El Niño compared to La Niña or neutral years. The North Atlantic Oscillation (NAO) has also been implicated in the strength of the MSD (Giannini et al. 2001). The positive phase of the NAO would mean a stronger NASH, enhanced trades, evaporative cooling, and diminished rainfall. Generally, the NAO has the largest affect in the spring season, but can extend into the summer. Giannini et al. (2001) demonstrate that the NAO can either enhance or interfere with the May-July year +1 El Niño signal, although they argue that without El Niño, the NAO affect is limited to spring. Recent work has suggested that a late NAO event, peaking in March, can still contribute to the strength of the MSD in the Caribbean, regardless of ENSO phase.
The Caribbean RegionThe Madden Julian Oscillation (MJO) acts on a similar intraseasonal time scale as the MSD (30-60 days), however the MJO is not tied to the annual cycle the same way the MSD is. Therefore, the MJO cannot explain the existence of the MSD, but recent work has suggested that the MJO can impact the interannual variability of the MSD.
2 4 6 8 10 120
5
10
15
20
25
Prec
(mm
/day
)
Early−biased & strong MSD
2 4 6 8 10 120
5
10
15
20
25
Prec
(mm
/day
)
Centered & strong MSD
2 4 6 8 10 120
5
10
15
20
25
Prec
(mm
/day
)
Late−biased & strong MSD
2 4 6 8 10 120
5
10
15
20
25
Prec
(mm
/day
)
Early−biased & weak MSD
2 4 6 8 10 120
5
10
15
20
25
Prec
(mm
/day
)
Centered & weak MSD
2 4 6 8 10 120
5
10
15
20
25
Prec
(mm
/day
)
Late−biased & weak MSD
Figure 2. 63 individual years (1948-2010) of monthly average rainfall (mm/day) at Guatemala City (91°W, 14°N) from NOAA Precipitation Reconstruction over Land (PREC/L) dataset (Chen et al. 2002) sorted according to temporal structure of annual cycle.

U S C L I V A R V A R I A T I O N S
US CLIVAR VARIATIONS • Winter 2016 • Vol. 14, No. 1 18
For example, Martin and Schumacher (2011) report that when the MJO is in certain phases (i.e., locations around the equatorial tropics) Caribbean precipitation anomalies can be up to 50% above or below the annual mean. They attribute the precipitation anomalies to changes in the CLLJ. Another hypothesis is that the strength and phase of the MJO may be related to the development of ENSO and the NAO in such a way as to have a combined impact on Caribbean precipitation. Several observational and modeling studies have argued that the MJO can trigger an El Niño event (e.g., Kessler and Kleeman 2000). Most recently, Lin et al. (2015) shows that the interannual variability of the MJO could affect the wintertime NAO through a circumglobal teleconnection pattern that resembles the PNA.
The MJO can be represented by the Real-Time Multivariate MJO (RMM) index at the daily time scale (see Wheeler and Hendon 2004). The RMM is divided into eight phases. During December-January-February (DJF) from 1980 to 2015, we summed the RMM when it appeared in each phase to create eight power indices. Next, we correlated each power time series with June-July-August precipitation over the greater Caribbean. Only during phase 5 (when the MJO is centered over the Maritime Continent) is there spatially consistent high correlation, which is field significant at less than 2%. This remote forcing is likely communicated first through the development of the positive phase of the NAO, and then through the initiation of El Niño, which can be surmised from the evolution of SST correlations during the course of the year (Figure 3). Figure 3 suggests that an active MJO over the Maritime Continent in DJF leads to a significant increase in temperature in the Gulf of Mexico and points eastward and a decrease in temperature from the Caribbean to the coast of Africa from March to June. Also, beginning in June an El Niño develops in the Niño 3.4 region and lasts through the end of the year (plot ends in October). Thus, the positive NAO and strong NASH lead to a cooling and drying of the Caribbean and the El Niño in year 0 and contributes to a drying of the Caribbean through an adjustment of the Walker circulation mentioned earlier. Finally, the overlap between the two
Figure 3. Correlations significant at the 90% level or greater between the RMM5 power index in December-January-February and HadISST1 reconstructed sea surface temperature from January to October.

U S C L I V A R V A R I A T I O N S
US CLIVAR VARIATIONS • Winter 2016 • Vol. 14, No. 1 19
signals is likely strongest in the summer months. This study is only preliminary and will be elaborated in a forthcoming publication.
The future of the midsummer droughtDespite biases in overall summertime rainfall amounts, the CMIP5 multi-model mean captures the essence of the MSD over much of the Inter-Americas region. Similar to CMIP3 results, the MSD is not an enigmatic challenge to global models. Out of the 23 individual CMIP5 models analyzed here and included in the multi-model mean, roughly half do a reasonably good job simulating the MSD on an individual basis, with a handful performing very well (Sheffield et al. 2013). Significant differences in the location and strength of the MSD between various observational datasets preclude a definitive evaluation of the CMIP5 multi-model mean, but it is clear that the strength of the MSD is underestimated in some regions, including along the Pacific coast of Central America, the western Caribbean, the major Caribbean islands and Florida. Consistent with seasonal rainfall projections, the CMIP5 multi-model mean provides a very robust projection of a stronger MSD for most regions that
experience an MSD today (Figure 4; Maloney et al. 2014). This is related to seasonally dependent changes in mean precipitation rates. During each of the summertime months, the east Pacific intertropical convergence zone (ITCZ) is projected to shift southward in concert with a drying over the East Pacific warm pool (EPWP), Central America/southern Mexico, and the Caribbean with enhanced drying over the major Caribbean islands of Cuba, Hispaniola, and Jamaica. The strongest drying is projected to occur during July and August, which are the months during which the MSD occurs in many regions throughout the Inter-Americas region. Western Mexico is projected to experience wetter conditions during the late summer (September).
Outlook: research challenges and opportunitiesThe CMIP5 projections of the future strength of the MSD are fairly uniform and robust, but what is the mechanism, and what does it depend on? Reliable future projections of seasonal rainfall including the MSD likely depend on the CMIP5 model accurately projecting the future mean state of tropical Pacific SST. Along the Pacific coast of the Americas, the seasonal evolution of the MSD may
Figure 4. CMIP5 multi-model mean projection of the strength of the MSD (mm/day) averaged over the historical experiment, the RCP4.5 forcing experiment (2080-2099), and the RCP8.5 forcing experiment (2080-2099). The numbers of models included in the analyses are 23, 17, and 20 for Historical, RCP4.5, and RCP8.5, respectively. The MSD metric mapped here quantifies the midsummer dip in rainfall relative to the mean amplitude of the two adjacent peaks. Figure reproduced from Maloney et al. (2014). ©American Meteorological Society. Used with permission.
U S C L I V A R V A R I A T I O N S
US CLIVAR VARIATIONS • Winter 2016 • Vol. 14, No. 1 20
References
also be leveraged to evaluate potential predictability on the seasonal–to–interannual time scale, as it was shown in Karnauskas et al. (2013) that the MSD propagates northward along the Pacific coast of Central America into southern Mexico at the Tropic of Cancer, then returns along the coast toward the equator. Future research may need to incorporate subsurface ocean observations to understand the role of the Intra-Americas Seas warm pool in the MSD including any thermodynamic feedbacks such as those suggested by Magaña et al. (1999). Longer-term perspectives would also be invaluable, such as those that may become available through dendrochronological
studies of tropical rainforests in Central America and the Caribbean.
Acknowledgments
Karnauskas gratefully acknowledges funding from the NOAA Climate Program Office (CPO) Modeling, Analysis, Predictions, and Projections (MAPP) Program, under award NA10OAR0110239 to the Woods Hole Oceanographic Institution.
Allen, T. L., S. Curtis, and D. W. Gamble, 2010: The mid-summer dry spell’s impact on vegetation in Jamaica. J. Appl. Meteoro. Clima., 49, 1590-1595, doi:10.1175/2010JAMC2422.1.
Campbell, D. D. Barker, and D. McGregor, 2011: Dealing with drought: Small farmers and environmental hazards in southern St. Elizabeth, Jamaica. Appl. Geogr., 31, 146-158, doi:10.1016/j.apgeog.2010.03.007.
Chen, M., P. Xie, J. E. Janowiak, and P. A. Arkin, 2002: Global land precipitation: A 50-yr monthly analysis based on gauge observations. J. Hydrometeor., 3, 249–266, doi:10.1175/1525-7541(2002)003<0249:GLPAYM>2.0.CO;2.
Covey, D. L., and S. Hastenrath, 1978: The Pacific El Niño phenomenon and the Atlantic circulation. Mon. Wea. Rev., 106, 1280-1287, doi: 10.1175/1520-0493(1978)106<1280:TPENPA>2.0.CO;2.
Curtis, S., 2002: Interannual variability of the bimodal distribution of summertime rainfall over Central America and tropical storm activity in the far-eastern Pacific. Climate Res., 22, 141-146, doi:10.3354/cr022141.
Curtis, S., and D. W. Gamble, 2007: Regional variations of the Caribbean mid-summer drought. Theor. Appl. Clima., 94, 25-34, doi:10.1007/s00704-007-0342-0.
Curtis, S., and S. Hastenrath, 1995: Forcing of anomalous sea surface temperature evolution in the tropical Atlantic during Pacific warm events. J. Geophys. Res.-Oceans, 100, 15835-15847, doi:10.1029/95JC01502.
Gamble, D. W., D. Campbell, T. L. Allen, D. Barker, S. Curtis, D. F. M. McGregor, and E. J. Popke, 2010: Climate change, drought, and Jamaican agriculture: Local knowledge and the climate record. Ann. Assoc. Amer. Geogr., 100, 880-893, doi: 10.1080/00045608.2010.497122.
Gamble, D. W., and S. Curtis, 2008: Caribbean precipitation: review, model, and prospect. Prog. Phys. Geogr., 32, 265-276, doi:10.1177/0309133308096027.
Gamble, D. W., D. B. Parnell, and S. Curtis, 2008: Spatial variability of the Caribbean mid-summer drought and relation to the north Atlantic high circulation. Int. J. Climatol., 28, 343-350, doi:10.1002/joc.1600.
Giannini, A., M. A. Cane, and Y. Kushnir, 2001: Interdecadal changes in the ENSO teleconnection to the Caribbean region and the North Atlantic Oscillation. J. Climate, 14, 2867-2879, doi:10.1175/1520-0442(2001)014<2867:ICITET>2.0.CO;2.
Giannini, A., and Coauthors, 2009: Designing index–based weather insurance for farmers in Central America. Final Report to the World Bank Commodity Risk Management Group, ARD, IRI Technical Report 09–01, International Research Institute for Climate and Society, 78 pp., http://hdl.handle.net/10022/AC:P:8907.
Hastenrath, S. 1967: Rainfall distribution and regime in Central America. Arch. Meteor. Geophys. Bioklimatol, 22, 347-356, doi:10.1007/BF02243853.
Karnauskas, K. B., A. Giannini, R. Seager, and A. J. Busalacchi, 2013: A simple mechanism for the climatological midsummer drought along the Pacific coast of Central America. Atmósfera, 26, 261–281, ISSN:0187-6236.
Kessler, W. S., and R. Kleeman, 2000: Rectification of the Madden-Julian Oscillation into the ENSO cycle. J. Climate, 13, 3560-3575, doi:10.1175/1520-0442(2000)013<3560%3AROTMJO>2.0.CO%3B2.
Lin, H., G. Brunet, and B. Yu, 2015: Interannual variability of the Madden-Julian Oscillation and its impact on the North Atlantic Oscillation in boreal winter. Geophys. Res. Lett., 42, 5571-5576, doi:10.1002/2015GL064547.
Magaña V., J. A. Amador, and S. Medina, 1999: The midsummer drought over Mexico and Central America. J Climate, 12, 1577–1588, doi:10.1175/1520-0442(1999)012<1577:TMDOMA>2.0.CO;2.
Maloney, E., and Coauthors, 2014: North American climate in CMIP5 experiments: Part III: Assessment of Twenty–First Century projections. J. Climate, 27, 2230–2270, doi:10.1175/JCLI-D-13-00273.1.
Martin, E. R., and C. Schumacher, 2011: Modulation of Caribbean precipitation by the Madden-Julian Oscillation. J. Climate, 24, 813-824, doi:10.1175/2010JCLI3773.1.
Portig W. H., 1961: Some climatological data of Salvador, Central America. Weather, 16, 103-112, doi:10.1002/j.1477-8696.1961.tb01900.x.

U S C L I V A R V A R I A T I O N S
US CLIVAR VARIATIONS • Winter 2016 • Vol. 14, No. 1 21
Roge, P., A. R. Friedman, M. Astier, and M. A. Altieri, 2014: Farmer strategies for dealing with climatic variability: A case study from the Mixteca Alta region of Oaxaca, Mexico. Agroecol. Sustain. Food Syst., 38, 786-811, doi:0.1080/21683565.2014.900842.
Sheffield, J., and Coauthors, 2013: North American climate in CMIP5 experiments. Part II: Evaluation of historical simulations of intraseasonal to decadal variability. J. Climate, 26, 9247–9290, doi:10.1175/JCLI-D-12-00593.1.
Vose, R. S., R. L. Schmoyer, P. M. Steurer, T. C. Peterson, R. Heim, T. R. Karl, and J. Eischeid, 1992: The global historical climatology network: long-term monthly temperature, precipitation, sea level pressure, and station pressure data. ORNL/CDIAC-53, NDP-041. Carbon Dioxide Information Analysis Center, Oak Ridge National Laboratory, doi:10.3334/CDIAC/cli.ndp041.
Wheeler, M., and H. Hendon, 2004: An all-season real-time multivariate MJO index: Development of an index for monitoring and prediction. Mon, Wea. Rev., 132, 1917-1932, doi:10.1175/1520-0493(2004)132<1917:AARMMI>2.0.CO;2.
Seasonal prediction of US tornadoes during late spring and early summer
Eunsil Jung and Ben P. Kirtman
University of Miami
High-impact weather events, such as tornadoes, threaten lives and cost billions of dollars in property
damage throughout the US every year. The frequency of tornadoes has increased in recent years, and it is expected to continue to increase in the future (e.g., Trapp et al. 2007; van Klooster and Roebber 2009), suggesting that any predictive capability is of great societal benefit. While it is well recognized that predicting individual tornado events is only possible a few hours in advance, the large-scale background atmospheric conditions that influence the likelihood of tornado events may be predictable on longer time scales (Tippet et al. 2012; Allen et al. 2015). Here we use the NCAR Community Climate System Model version 4.0 (CCSM4, Gent et al. 2011) forecasts (Kirtman et al. 2014) and North American Regional Reanalysis (NARR, Mesinger et al. 2006) for the period of 1982-2011 to examine whether we can predict the seasonal changes in the likelihood of a tornado event in the US. It is known that El Niño–Southern Oscillation (ENSO) influences tornado activity in the US during early spring (Allen et al. 2015), this study, however, highlights that the influence of
ENSO on US tornado activity is weak during May-July (MJJ). Instead, warm water in the Gulf of Mexico is a potential predictor for forecasting US tornado activity during MJJ. Considering our current ability to predict SST in the Gulf of Mexico, compared with the difficulty of predicting the seasonal outlook of tornado activity in the US, the findings provide evidence for the seasonal prediction of high-impact weather in the US.
Within one season or one month, individual extreme weather events are not predictable. However, the large-scale atmospheric conditions upon which severe weather is superimposed may be more likely predictable on longer time scales. In fact, the large-scale atmospheric conditions have been used to establish relationships between severe weather occurrence and the associated favorable environments (e.g., Gray 1979; Brooks et al. 1994, 2003b; Craven and Brooks 2004; Shepherd et al. 2009; Tippet et al. 2012, 2014; Allen et al. 2015). For example, Tippet et al. (2012, 2014) showed that the number of US tornadoes (monthly climatology) was well

U S C L I V A R V A R I A T I O N S
US CLIVAR VARIATIONS • Winter 2016 • Vol. 14, No. 1 22
described by the combination of the monthly climatology of convective precipitation with 0-3 km storm relative helicity.
In this study, we use convective available potential energy (CAPE) as the background state in which changes produce conditions that are more or less favorable for severe weather. This approach is, in part, motivated by the colocation of CAPE and the geographical distribution of tornadoes in the US during MJJ (not shown). There are also direct physical relationships that motivate the use of variations in CAPE as a predictor of increased or decreased probability of tornado events in the US. CAPE is a measure of the vertically integrated buoyant energy available for storm formation, and indeed, severe storms occur most readily when CAPE and vertical wind shear are both large in a local environment (Rasmussen and Blanchard 1998; Craven and Brooks 2004; Brooks and Dotzek 2007). In terms of the annual cycle, large values of CAPE (in both climatology and variation) first emerge along the Gulf Coast in March. The areas of high CAPE then extend north and northeastward through August (e.g., Gensini and Ashley 2011). The evolution of CAPE is very similar to observed convective precipitation and further agrees with the geographical distribution of tornadoes (not shown). On the other hand, the areas of relatively strong shear, which is the other ingredient of severe storms, migrate northward during warm months. As a result, weak shear (both climatology and variation) prevails in the US during MJJ with a minor contribution to the tornado activities in the US during MJJ (not shown).
In Figure 1a, tornado activity in the US varies widely from year to year. For example, the year 2011 was an
exceptionally destructive year for tornadoes. In contrast, tornadic activity during 1988 remained mostly below average. Consistent with these tornado activities in the US, CAPE in 2011 was anomalously large, suggesting a higher chance of an active tornado year (Figure 1b). In contrast, CAPE in 1988 was less than climatology, suggesting 1988 would have a reduced probability for tornadoes as was observed.
Motivated by the fact that CAPE appears to be closely related to tornado activity, we ask: can we predict seasonal variability of CAPE in the US during MJJ? We choose to use actual climate forecasts so that one-to-one comparisons with observational estimates are possible. In this study, the 10 ensemble members of CCSM4 are initialized every May 1st and forecasted until the following April 30th over
Figure 1. Accumulated CAPE and accumulated number of tornadoes in the US for 1982-2011. The lavender shading represents (a) tornado numbers and (b) CAPE for each year, and the climatology is shown as a bold solid black line. Accumulated MJJ (May-June-July) CAPE versus accumulated MJJ tornado numbers are shown in (c). Individ-ual years 2011 (red) and 1988 (blue) are shown as dashed lines. CAPE is obtained from NARR. Tornado data is obtained from Severe Weather Database from NOAA. Numbers are counted for tornadoes F0 or greater on Fujita-Person scale.

U S C L I V A R V A R I A T I O N S
US CLIVAR VARIATIONS • Winter 2016 • Vol. 14, No. 1 23
the period 1982-2011. The model is currently being used for routine real-time predictions as part of the North American Multi-Model Ensemble (NMME) (Kirtman et al. 2014). Since May is the peak month for tornado activity in the US (e.g., Tippett et al. 2012; Brooks et al. 2003a), this study focuses on MJJ. The goal here is to assess whether we can accurately forecast the MJJ large-scale environment that is favorable for high-impact weather such as tornado activity in the US.
Since relatively high CAPE emerges in the Gulf of Mexico in early spring, and then expands north and northeastward during the primary tornado outbreak period, we correlate CAPE anomalies in the US to SST anomalies in the Gulf of Mexico. The linear relationship between them is examined by introducing CAPE and GoM indices, which are area-averaged CAPE anomalies in the US and SST anomalies in the Gulf of Mexico (20-30°N, 82°W-98°W), respectively. SST is detrended and ocean (land)-only grids are used to calculate GoM (CAPE) index.
In Figure 2a,b, as SST in the Gulf of Mexico becomes anomalously warmer, CAPE in the US tends to become higher in both the forecasts and the observational estimates. Correlations are slightly higher in the CCSM4 predictions than in the observational estimates; correlations are higher in the Southeast US (SE CAPE) where the strongest MJJ CAPE variation is found. The same analysis is performed with seasonal mean CAPE, and also with the combinations
of CAPE and shear, and the results are robust (not shown). Figure 2c,d further shows that US CAPE does not have contemporaneous relations with SST in the Niño 3.4 region.
Figure 2. (a-d) Scatter diagrams of CAPE indices (J/kg) with GoM (a, b) and Niño 3.4 (c, d) indices (°C) during MJJ from forecasts and observational estimates. The CAPE indices are calculated by averaging daily CAPE anomalies in the US (US CAPE) and in the southeast US (SE CAPE; 30-40°N, 85-100°W). The GoM index and Niño 3.4 index are each an area-av-eraged SST anomaly in their representative regions (20-30°N, 82-98°W; 120-170°W and 5oS-5oN). Individual forecast ensemble members are shown as sky-blue asterisks, the ensemble mean as purple dots, and NARR as black dots. The correlations between two indices are shown in the upper right corner in each box, CCSM4 (NARR). (e) Contemporane-ous and antecedent ENSO influence on the Gulf of Mexico SST. Correlations are calculated first from all years 1982-2011 and second by excluding strong ENSO years. Strong ENSO years used are: 1982/1983, 1988/1989, 1997/1998, 2011/2012. Three-month mean values are used to calculate the correlation, for example, correlation shown in May (M) is calcu-lated from SST anomalies during May-July months. CAPE anomalies and GoM indices are calculated from NARR (observational estimates) and CCSM4 (forecasts). The Niño index is calculated from AVHRR SST dataset
U S C L I V A R V A R I A T I O N S
US CLIVAR VARIATIONS • Winter 2016 • Vol. 14, No. 1 24
The apparent lack of a relationship between Niño 3.4 SST and US CAPE requires further discussion. In particular, ENSO phase is recognized to play a role in the tornado activities in the US (e.g., Cook and Schaefer 2008; Lee et al. 2013; Allen et al. 2015). In the study of Cook and Schaefer (2008), intense tornado activity was found in a southwest–northeast band from Louisiana to Michigan during La Niña winters. In contrast, tornado activity was restricted to areas immediately adjacent to the Gulf of Mexico during El Niño winters. However, the overall tornado activities were the most intense during the neutral years. Lee et al. (2013) also showed a weak correlation between US tornadoes and the Niño 3.4 index. They identified an optimal ENSO pattern (positive TransNiño) that relates to the top 10 extreme tornado years in the US during April-May 1950-2010. However, the number of intense tornadoes did not decrease during the negative phase of TransNiño. We note that, consistent with our results, the SST in the Gulf of Mexico in their study was warmer than normal during the active tornado years (e.g., Figure 7 from Lee et al. 2013). More recently, Allen et al. (2015) showed the ENSO influence on hail and tornado frequencies in the US during March-May. The relationship between ENSO and US spring tornado activity in their study was because the winter ENSO conditions often persisted into early spring.
Figure 2 does not show any correlations between US CAPE and ENSO during MJJ. However, it is possible that there are antecedent winter (DJF) ENSO influences on MJJ US CAPE as shown in Allen et al. (2015). In Figure 2e, however, MJJ is found to be the months in which antecedent winter ENSO has the least influence on SST in the Gulf of Mexico and thus CAPE in the US (red dashed). In contrast, the influence of antecedent winter ENSO on the Gulf of Mexico SST is the strongest during February-April (red), and it becomes weaker if strong ENSO years are excluded from the analysis (orange). The antecedent winter ENSO possibly could affect one or both ingredients of tornadoes (CAPE and shear) in the US during those months through SST and shear variability. The more frequently observed stronger tornadoes (i.e., larger E/F
scale) during late winter and spring (not shown) could be related to ENSO.
Motivated by the results in Figure 2, which show a linear relationship between SST anomaly in the GoM and CAPE in the US, we examine the spatial patterns associated with this correlation (not shown). When the GoM SST is anomalously warm, positive CAPE anomalies are found in the US. (Similarly, cold GoM SST is associated with reduced CAPE over the US.) The maximum positive CAPE anomalies are detected along the Gulf Coast, Tornado Alley, and Florida, where relatively high CAPE variance and high frequency of tornadoes are found, implying that CAPE anomalies in the US are contemporaneously related to the SST anomalies in the GoM during MJJ. The forecasts show similar patterns to the observational estimates, but notably do not extend as far north into the US.
The possible mechanisms for the correlation between GoM SST and US CAPE anomalies are examined by computing the composite maps of low-level moisture, meridional-winds, and northward moisture transport anomalies. The positive GoM index years are characterized by increased low-level moisture and southerlies as well as increased low-level northward moisture transports to the east of the Rockies. On the other hand, the negative GoM index years are associated with decreased low-level moisture, northerlies, and reduced GoM to US moisture transports (not shown). The results suggest that moisture transports from the GoM to US under the warmer GoM SST conditions are associated with an increase in US CAPE. The results agree with previous studies in that the Gulf of Mexico is viewed as a source of moisture for US (Hastenrath 1966; Rasmusson 1967; Mo et al. 1995; Bosilovich and Schubert 2002; Mestas-Nuñez et al. 2007; Muñoz and Enfield 2011; Lee et al. 2013; Dirmeyer et al. 2014) and in that the Intra-Americas low-level jets play roles in the high-impact weather in the US (e.g., Mo et al. 1995; Hu and Feng 2001; Mestas-Nuñez et al. 2005, 2007; Muñoz and Enfield 2011; Lee et al. 2013).

U S C L I V A R V A R I A T I O N S
US CLIVAR VARIATIONS • Winter 2016 • Vol. 14, No. 1 25
Given the importance of SST in the Gulf of Mexico, how well can the SST anomaly in the Gulf of Mexico be predicted? The seasonal prediction skill is assessed by the correlation between predicted and observed SST anomalies in the Gulf of Mexico. Figure 3a shows that the point correlations are relatively high (higher than 0.3, 90% statistically significant) except for regions from the Yucatan Peninsula to Tallahassee, Florida. The overall correlation between forecasts and observational estimates is about 0.42. The correlation between the observed and the predicted GoM-index is 0.51 (Figure 3b).
Considering our current ability to predict SST in the Gulf of Mexico compared with the difficulty of predicting high-impact weather in the US, the findings are promising for the seasonal prediction of enhanced or decreased
tornado activity in the US during MJJ using the GoM SST. This study further emphasizes that the influence of ENSO (contemporaneous as well as antecedent winter ENSO) on the GoM SST (and ultimately tornado activity in the US) is weak during MJJ, and thus, there is no clear relationship between US CAPE and ENSO during MJJ.
Acknowledgments
This research was supported by NOAA grants NA14OAR4830127, NA12OAR4310089, NA150AR4320064, and NA10OAR4320143.
Figure 3. Seasonal prediction skill of SST in the Gulf of Mexico. (a) Point-correlation between observed and predicted SST anomalies. The stippled areas are statistically significant at the 90% confidence level. (b) Scatter diagram of observed and predicted GoM index (area-averaged SST anomalies in the Gulf of Mexico, °C). The area used for calculating the GoM index is shown as a box in (a). Standard deviations of the individual forecast ensemble members are shown as red horizontal bars, and the ensemble mean is shown as black dots. The correlation between the two indices is shown in the upper right corner.

U S C L I V A R V A R I A T I O N S
US CLIVAR VARIATIONS • Winter 2016 • Vol. 14, No. 1 26
References
Allen, J. T., M. K. Tippett, and A. H. Sobel, 2015: Influence of the El Niño/Southern Oscillation on tornado and hail frequency in the United States. Nat. Geosci., 8, 278–283, doi:10.1038/ngeo2385.
Bosilovich, M., and S. Schubert, 2002: Water vapor tracers as diagnostics of the regional hydrologic cycle. J. Hydrometeor., 3, 149–165, doi:10.1175/1525-7541(2002)003<0149:WVTADO>2.0.CO;2.
Brooks, H. E., and N. Dotzek, 2007: The spatial distribution of severe convective storms and an analysis of their secular changes. Climate Extremes and Society. H. F. Diaz and R. Murnane, Eds., Cambridge University Press, 35-53, doi:10.1017/CBO9780511535840.006.
Brooks, H. E., C. A. Doswell III, and J. Cooper, 1994: On the environments of tornadic and nontornadic mesocyclones. Wea. Forecasting, 9, 606–618, doi:10.1175/1520-0434(1994)009<0606:OTEOTA>2.0.CO;2.
Brooks, H. E., C. A. Doswell III, and M. Kay, 2003a: Climatological estimates of local daily tornado probability for the United States. Wea. Forecasting, 18, 626–40, doi:10.1175/1520-0434(2003)018<0626:CEOLDT>2.0.CO;2.
Brooks, H. E., J. W. Lee, and J. P. Craven, 2003b: The spatial distribution of severe thunderstorm and tornado environments from global reanalysis data. Atmos. Res., 67-68, 73–94, doi:10.1016/S0169-8095(03)00045-0.
Cook, A. R., and J. T. Schaefer, 2008: The relation of El Niño–Southern Oscillation (ENSO) to winter tornado outbreaks. Mon. Wea. Rev., 136, 3121–3137, doi:10.1175/2007MWR2171.1.
Craven, J., and H. Brooks, 2004: Baseline climatology of sounding derived parameters associated with deep, moist convection. Natl. Wea. Dig., 28, 13–24.
Dirmeyer, P. A., J. Wei, M. G. Bosilovich, and D. M. Mocko, 2014: Comparing evaporative sources of terrestrial precipitation and their extremes in MERRA using relative entropy. J. Hydrometeor., 15, 102–116, doi:10.1175/JHM-D-13-053.1.
Gensini, V. A., and W. S. Ashley, 2011: Climatology of potentially severe convective environments from the North American Regional Reanalysis. Electron. J. Severe Storms Meteor., 6, 1-40.
Gent, P. R., and Coauthors, 2011: The Community Climate System Model Version 4. J. Climate, 24, 4973–4991, doi:10.1175/2011JCLI4083.1.
Gray, W. M., 1979: Hurricanes: Their formation, structure, and likely role in the tropical circulation. Meteorology Over the Tropical Oceans, D. B. Shaw, Ed., Royal Meteorological Society, 155–218.
Hastenrath, S. L., 1966: The flux of atmospheric water vapor over the Caribbean Sea and the Gulf of Mexico. J. Appl. Meteor. Climatol., 5, 778–788, doi:10.1175/1520-0450(1966)005<0778:TFOAWV>2.0.CO;2.
Hu, Q., and S. Feng, 2001: Climatic role of the southerly flow from the Gulf of Mexico in interannual variations in summer rainfall in the central United States. J. Climate, 14, 3156–3170, doi:10.1175/1520-0442(2001)014<3156:CROTSF>2.0.CO;2.
Kirtman, B. P., and Coauthors, 2014: The North American Multimodel Ensemble: Phase-1 seasonal-to-interannual prediction; Phase-2 toward developing intraseasonal Prediction. Bull. Amer. Meteor. Soc., 95, 585–601, doi:10.1175/BAMS-D-12-00050.1.
Lee, S.-K., R. Atlas, D. Enfield, C. Wang, and H. Liu, 2013: Is there an optimal ENSO pattern that enhances large-scale atmospheric processes conducive to tornado outbreaks in the United States? J. Climate, 26, 1626–1642, doi:10.1175/JCLI-D-12-00128.1.
Mesinger, F., and Coauthors, 2006: North American regional reanalysis. Bull. Amer. Meteor. Soc., 87, 343–360, doi:10.1175/BAMS-87-3-343.
Mestas-Nuñez, A., C. Zhang, and D. Enfield, 2005: Uncertainties in estimating moisture fluxes over the Intra-Americas Sea. J. Hydrometeor., 6, 696–709, doi:10.1175/JHM442.1.
Mestas-Nuñez, A., D. Enfield, and C. Zhang, 2007: Water vapor fluxes over the Intra-Americas Sea: seasonal and interannual variability and associations with rainfall. J. Climate, 20, 1910–1922, doi:10.1175/JCLI4096.1.
Mo, K. C., J. Nogues-Paegle, and J. Paegle, 1995: Physical mechanisms of the 1993 floods. J. Atmos. Sci., 52, 879–895, doi:10.1175/1520-0469(1995)052<0879%3APMOTSF>2.0.CO%3B2.
Muñoz, E., and D. Enfield, 2011: The boreal spring variability of the Intra-Americas low-level jet and its relation with precipitation and tornadoes in the eastern United States. Climate Dyn., 36, 247–259, doi:10.1007/s00382-009-0688-3.
Rasmussen, E., and D. Blanchard, 1998: A baseline climatology of sounding-derived supercell and tornado forecast parameters. Wea. Forecasting, 13, 1148–1164, doi:10.1175/1520-0434(1998)013<1148:ABCOSD>2.0.CO;2.
Rasmusson, E. M., 1967: Atmospheric water vapor transport and the water balance of North America: Part I. Characteristics of the water vapor flux field. Mon. Wea. Rev., 95, 403–426, doi:10.1175/1520-0493(1967)095<0403:AWVTAT>2.3.CO;2.
Reynolds, R. W., T. M. Smith, C. Liu, D. B. Chelton, K.S. Casey, and M. G. Schlax, 2007: Daily high-resolution-blended analyses for sea surface temperature. J. Climate, 20, 5473–5496, doi:10.1175/2007JCLI1824.1.
Shepherd, M., D. Niyogi, and T. Mote, 2009: A seasonal-scale climatological analysis correlating spring tornadic activity with antecedent fall-winter drought in the southeastern United States. Environ. Res. Lett., 4, 024012, doi:10.1088/1748-9326/4/2/024012.
Tippett, M. K., A. H. Sobel, and S. J. Camargo, 2012: Association of U.S. tornado occurrence with monthly environmental parameters. Geophys. Res. Lett., 39, L02801, doi:10.1029/2011GL050368.
Tippett, M. K., A. H. Sobel, and S. J. Camargo, and J. T. Allen, 2014: An empirical relation between U.S. tornado activity and monthly environmental parameters. J. Climate, 27, 2983–2999, doi:10.1175/JCLI-D-13-00345.1.
Trapp, R. J., N. S. Diffenbaugh, H. E. Brooks, M. E. Baldwin, E. D. Robinson, and J. S. Pal, 2007: Changes in severe thunderstorm environment frequency during the 21st century caused by anthropogenically enhanced global radiative forcing. Proc. Natl. Acad. Sci. USA., 104, 19719–19723, doi:10.1073/pnas.0705494104.
van Klooster, S., and P. Roebber, 2009: Surface-based convective potential in the contiguous United States in a business-as-usual future climate. J. Climate, 22, 3317–3330, doi:10.1175/2009JCLI2697.1.

U S C L I V A R V A R I A T I O N S
US CLIVAR VARIATIONS • Winter 2016 • Vol. 14, No. 1 27
Past and future climate variability in the Intra-Americas Sea and its impact on the marine ecosystem and fisheries
Yanyun Liu1,2, Sang-Ki Lee1,2, David B. Enfield1, Barbara A. Muhling3,John T. Lamkin4, Frank E. Muller-Karger5, and Mitchell A. Roffer6
1 University of Miami2 Atlantic Oceanographic and Meteorological Laboratory, NOAA
3 Princeton University4 Southeast Fisheries Science Center, NOAA
5 University of South Florida6 Roffer’s Ocean Fishing Forecasting Service
The Intra-Americas Sea (IAS) refers to semi-enclosed waters of the western tropical Atlantic Ocean including
the Gulf of Mexico (GoM) and Caribbean Sea (CBN). The water mass characteristics and general circulation in the IAS can significantly affect the weather and climate of the US due to their influence on moisture transport to the US, the Gulf Stream, and hurricane development/intensification. It is also one of the most ecologically diverse and economically productive marginal seas and strongly influenced by changing climate. The Coupled Model Inter-comparison Project phase-3 (CMIP3) and -5 (CMIP5) climate model simulations project a greater than 2°C increase in upper ocean temperatures in the IAS (Liu et al. 2012, 2015) and a 20-25% slowing down of the Atlantic Meridional Overturning Circulation (AMOC; e.g., Cheng et al. 2013) by 2100, due to increasing greenhouse gas (GHG) emissions (Liu et al. 2012, 2015). These changes may substantially affect the physical and biogeochemical properties of the seawater, with important consequences for marine ecosystems and fishery species in the IAS. However, the global CMIP3/CMIP5 climate models have a typical spatial resolution of about 1°, which is too coarse to properly resolve the strength, position, and eddy shedding characteristics of the Western Boundary
Current (WBC) systems such as the Caribbean Current, Yucatan Current, and Loop Current (LC; Oey et al. 2005). Thus, the global climate models cannot be used to address the future changes in the WBC system of the IAS despite the importance of the WBC system on the upper ocean thermal processes.
To address this issue, Liu et al. (2012) used the Miami Isopycnic Coordinate Ocean Model (MICOM) to dynamically downscale global CMIP3 climate models to the GoM region. The MICOM model was interactively coupled to an Atmospheric Mixed Layer model (AML; Seager et al. 1995) to better simulate the heat and freshwater exchanges at the air-sea interface. The spatial resolution of the coupled model was 0.1° in the GoM, decreasing linearly to 0.25° for the rest of the North Atlantic Ocean. The downscaled simulations predicted that the LC would be reduced by up to 20-25% during the 21st century (Liu et al. 2012). The downscaled simulations further showed that the projected LC reduction and associated weakening of warm LC eddies could suppress the surface warming in the GoM, particularly in the northern deep basin. The low-resolution global climate models underestimated the projected reduction of LC

U S C L I V A R V A R I A T I O N S
US CLIVAR VARIATIONS • Winter 2016 • Vol. 14, No. 1 28
and its impact of suppressing the surface warming in the GoM. Thus, the low-resolution global climate models produced excessive 21st century warming in the GoM in comparison to the high-resolution downscaled model simulations. Here, we briefly review the most recent state of knowledge of projected climate changes in the IAS based on the high-resolution downscaled ocean model simulations, focusing on temperature and salinity variability, and their impacts on marine ecosystems and fisheries in the IAS.
Basin-averaged sea surface temperature increases in the GoM and CBN during the 21st centuryThe downscaled model has been updated to use the CMIP5 climate model outputs as boundary and initial conditions under historical and two future climate change scenarios (RCP4.5 for medium-low emission scenario and RCP8.5 for high emission scenario, Taylor et al. 2012) and the Modular Ocean Model version 4.1 (MOM4.1; Griffies et al. 2004; Gnanadesikan et al. 2006) for the downscaling (Liu et al. 2015). The 20th century warming and natural climate variability in the IAS is explored first using the downscaled MOM4.1 since the GHG-induced SST increase in the IAS could be amplified or reduced due to natural variability. As Figures 1a and 1c show, the downscaled model reproduced basin-averaged SST variability in the GoM and CBN during the 20th century reasonably well. Under RCP8.5, the annual average sea surface temperatures
(SSTs) in the GoM are projected to increase from 26°C in the late 20th century to slightly above 29°C by 2100, and the average SSTs in the CBN will increase from 27.5°C in the late 20th century to about 31°C by 2100 (Figures 1b and 1d). The standard deviation (STD) of the SST anomalies in the GoM/CBN for the 20th century is calculated (STD = 0.21 for GoM and 0.30 for CBN) and added to the future projections for both scenarios (light blue and pink color regions in Figure 1b and 1d) as a measure of uncertainty. The uncertainty of future projection due to natural climate variability is quite large. Under RCP4.5 (RCP8.5), a trend of SST in the GoM shorter than 26 (13) years cannot be used to distinguish the GHG effect from natural variability.
(a)
(b)
()
()
(c)
(d)
))
((
Figure 1. (a) Time series of annual mean SST anomalies averaged over the GoM (100°W-82°W, 21°N-30°N) during 1900-2008 obtained from downscaled MOM4.1 (EXP_20CR) and HadISST. (b) Time series of the annual mean SSTs averaged over the GoM during 1900-2098 obtained from downscaled MOM4.1 simulations (EXP_HIS (black), EXP_4.5 (blue) and EXP_8.5 (red)). The standard deviation (STD) of the SST anomalies in the GoM for the period of 1900-2008 (EXP_20CR) is calculated (STD = 0.21) and the ± 0.21°C is added to each time point of the future SST projections (light color regions). (c) and (d) are same as (a) and (b), except for the CBN (85°W-60°W, 10°N-20°N). The STD (± 0.30°C) is added to each time point of the future SST projections. The unit is °C. Modified from Liu et al. (2015).

U S C L I V A R V A R I A T I O N S
US CLIVAR VARIATIONS • Winter 2016 • Vol. 14, No. 1 29
GHG-induced warming pattern of the IAS during the 21st centuryThe CMIP5 models project that the IAS can warm up by 1.2 ~ 2ºC (3ºC or more) under RCP4.5 (RCP8.5) by 2100. The projected warming is particularly large in the northern deep GoM, which is a spawning ground for many economically important fish species, including Atlantic bluefin tuna. In the downscaled MOM4.1 simulations, the IAS also shows extensive warming (Figure 2a). However, the spatial pattern of the warming is quite different from the CMIP5 model projections (Figure 2b), especially during the boreal spring months of April, May, and June (AMJ). During AMJ, the simulated SST increase in the northern deep GoM is only about 1.4°C (2.8°C), much less than the CMIP5 SST increase of 1.8°C (3.4°C) under RCP4.5 (RCP8.5). In fact, the northern deep GoM is characterized as the region of minimum warming, whereas it is the region of maximum warming in the CMIP5 model projections.
The SST increases in the western GoM and Straits of Florida region are also greatly reduced compared to those in the CMIP5 (Figure 2a and 2b). A potential cause for this difference between the CMIP5 and downscaling projections may be the weakening of the LC and the associated reduction in the warm water transport through the Yucatan Channel, which are not well simulated in low-resolution models such as the CMIP5 models (e.g., Lee et al. 2007; Liu et al. 2012, 2015). The effect of the LC in the present climate is to warm the GoM. Therefore, the reduced LC and the associated weakening of the warm transient LC eddies can cause less warming in the GoM. This effect is particularly large in the northern deep basin during AMJ, in agreement with the previous result from the CMIP3 downscaling simulation (Liu et al. 2012) in which a heat budget analysis was performed to show that the reduced LC is mainly responsible for the projected reduced warming in the northern deep GoM during AMJ.
(a) SST (MOM4)
(b) SST (CMIP5)
(c) SSS (MOM4)
SST and SSS differences between late 20C and late 21C (RCP8.5)
(d) SSS (CMIP5)
Figure 2. SST differences in the IAS between the late 21st century (2090 ~ 2098) and late 20th century (1990 ~ 1998) during the boreal spring months of April, May, and June (AMJ) obtained from (a) the downscaled MOM4.1 simulation and (b) the weighted ensemble of 18 CMIP5 models simulations. (c) and (d) are same as (a) and (b), except for the boreal summer months of August, September, and October (ASO). Annual mean SSS difference in the IAS between the late 21st century and late 20th century obtained from (e) the downscaled MOM4.1 simulation and (f) the weighted ensemble of 18 CMIP5 models simulations. The units for temperature and salinity are °C and psu, respectively.

U S C L I V A R V A R I A T I O N S
US CLIVAR VARIATIONS • Winter 2016 • Vol. 14, No. 1 30
In contrast to the reduced warming in the northern deep GoM, the downscaled model predicts an enhanced warming in the shallow (< 200 m) northeastern Gulf Coast region, especially during the boreal summer months of August, September, and October (ASO) (Liu et al. 2015). As shown in Figure 2c and 2d, the projected SST increase in the northeastern Gulf Coast for ASO is about 4.0°C in the downscaled model under RCP8.5, while the CMIP5 SST increase is about 3.5°C. In the shallow northeastern Gulf Coast region, the surface ocean circulation is quite weak and dynamically detached from the LC in the deep GoM. Therefore, the increased surface heating over the shallow northeastern Gulf Coast region cannot be damped by vertical mixing with the deeper ocean or by horizontal advection of the relatively cooler interior ocean. Therefore, it is highly likely that the increased summertime warming in the shallow northeastern Gulf is due to the lack of any mechanism to damp the projected increase in the GHG-induced surface heating. The enhanced summertime warming over the northeastern Gulf Coast could greatly increase the chance for rapid intensification of hurricanes making landfall across the northeastern Gulf Coast in the 21st century. The downscaled MOM4.1 simulations also project intense summertime warming along the South American coast in the southern Caribbean Sea (Figure 2c), which may lead to more frequent coral bleaching events in the 21st century. The intense warming off the South American coast is linked to the relaxation of the thermocline slope across the Caribbean Current (CC) and thus leads to the reduced CC (Liu et al. 2015).
Sea surface salinity changes in the IAS during the 21st century As shown in Figure 2e, the sea surface salinity (SSS) is greatly increased almost everywhere in the IAS during the 21st century (up to 1 psu by 2100 under RCP8.5), consistent with the CMIP5 projected SSS changes as shown in Figure 2f (Terray et al. 2012). This is largely due to the increased evaporation minus precipitation (E-P) in the IAS during the 21st century (not shown). In the warming climate, the atmosphere can hold more moisture with the increasing atmospheric temperature, which should lead
to a reduction of rainfall in the future (Held and Soden 2006). Additionally, in the North Atlantic, the slowing down of AMOC and associated suppressed warming of the tropical North Atlantic could also contribute to the projected reduced rainfall in the IAS (Lee et al. 2011).
Projected reduction of AMOC and its impact on IAS during the 21st century The downscaled MOM4.1 simulations indicate that the projected reductions of the LC and CC in the 21st century play important roles in the regional warming pattern in the IAS. Therefore, it is important to understand what processes are responsible for the projected reductions of the LC and CC. Figure 3a shows the time series of the simulated annual mean volume transport across the Yucatan Channel for the period of 1900-2098 under the historical and two future scenarios (RCP4.5 and RCP8.5). The volume transport across the Yucatan Channel is reduced drastically during the 21st century. The reduction is about 25% of the mean under RCP8.5. The CC is also reduced during the late 21st century (Figure 3b). As shown in Figure 3c, the AMOC at 30°N is significantly reduced during the 21st century under both scenarios. Figure 3d-f further shows that the AMOC is highly reduced at all latitudes by the late 21st century (Liu et al. 2012; Cheng et al. 2013). Since the WBC system in the IAS, including the LC and CC, is an important pathway of the AMOC, it is likely that the reduced LC and CC during the 21st century are driven by the projected deceleration of the AMOC (Liu et al. 2012, 2015).
Implications for marine ecosystems and fisheries in the IASIncreasing water temperatures due to climate change will likely have significant impacts on marine ecosystems and fisheries in the IAS. For example, coral reefs in the CBN are sensitive to increasing upper ocean temperature; thus, coral bleaching events are expected to increase in frequency and severity as the climate changes (Hoegh-Guldberg 2007; Baker et al. 2008). As the downscaled MOM4.1 simulations can better resolve regional ocean features that could greatly influence thermal coral bleaching, the downscaled model outputs are used for calculating the onset of annual severe bleaching

U S C L I V A R V A R I A T I O N S
US CLIVAR VARIATIONS • Winter 2016 • Vol. 14, No. 1 31
in the CBN (van Hooidonk et al. 2015). As summarized in van Hooidonk et al. (2015), the onset of annual coral bleaching conditions in the CBN are computed using three projections (ensemble of CMIP5 climate models, dynamic-downscaled model, and statistical-downscaling method). Their results show that the average year for the onset of annual severe bleaching is 2040–2047 for all three projections. However, the dynamic-downscaled projections suggest an earlier onset of annual severe bleaching in the IAS regions where regional currents
are predicted to decline. This feature is not resolved in coarse CMIP5 climate models (van Hooidonk et al. 2015).
The increasing water temperatures in the IAS may also substantially affect the distributions and life histories of Atlantic tunas (Muhling et al. 2011). Muhling et al. (2015) applied the projections of temperature fields obtained from downscaled MOM4.1 simulations (Liu et al. 2015) to habitat suitability models constructed for two life stages (adults and larvae) of two tuna species within the IAS: one tropical (skipjack tuna) and one temperate (bluefin tuna). Results showed marked temperature-induced habitat losses for both adult and larval bluefin tuna on their northern GoM spawning grounds. However, the habitat degradation was somewhat mitigated by the projected slowing down of the WBC system. This result was only evident in the high-resolution downscaled simulations,
highlighting the importance of using regionally downscaled ocean model simulations to assess the impact of climate changes on regional marine ecosystems and fisheries. In contrast to bluefin tuna, habitat suitability for both life stages of skipjack tuna tended to increase as temperatures warmed, suggesting that influences of climate change on highly migratory Atlantic tuna species are likely to be substantial, but strongly species-specific (Muhling et al. 2015).
Figure 3. Time series of the simulated annual mean volume transport (Sv) (a) across the Yucatan Channel, (b) in the Caribbean Current, and (c) the AMOC at 30oN, all for the period 1900-2098 obtained from EXP_HIS, EXP_4.5 and EXP_8.5. Time-averaged AMOC (Sv) in (d) the late 20th centu-ry and (e) the late 21st century under RCP4.5 and (f) RCP8.5 scenarios obtained from downscaled MOM4.1 simulations. Depth (1000-4000) is in meters. Modified from Liu et al. (2015).
(a) Yucatan Current Transport
(b) Caribbean Current Transport
(c) AMOC at 30N
MOM4
(d) Late 20C (EXP_HIS)
(e) Late 21C (EXP_4.5)
(f) Late 21C (EXP_8.5)

U S C L I V A R V A R I A T I O N S
US CLIVAR VARIATIONS • Winter 2016 • Vol. 14, No. 1 32
Future works In this work, we used only dynamic ocean models to study the potential impact of GHG-induced warming on the IAS. In the future, our regional ocean modeling work will incorporate biogeochemical components (MOM-TOPAZ; Dunne et al. 2013) to study the impact of GHG-induced warming on the ocean ecosystem, ocean acidification, and fisheries in the IAS. The future study will also benefit from the development of regional coupled atmosphere-ocean-biogeochemistry models.
Acknowledgments
The authors would like to acknowledge the support and encouragement provided through the NASA Applied Sciences Biodiversity and Ecological Forecasting program (NNH10ZDA001N-BIOCLIM, NNX09AV24G) and the National Marine Sanctuaries as Sentinel Sites for a Demonstration Marine Biodiversity Observation Network (NNX14AP62A). This work was also supported partially by a grant from NSF/Chemical Oceanography (OCE-1259043), a grant from the NOAA Ocean Acidification Program, and the base funding of NOAA Atlantic Oceanographic and Meteorological Laboratory.
References
Baker, A. C., P. W. Glynn, and B. Riegl, 2008; Climate change and coral reef bleaching: An ecological assessment of long-term impacts, recovery trends and future outlook. Estuar. Coast. Shelf Sci., 80, 435-471, doi:10.1016/j.ecss.2008.09.003.
Cheng, W., J. C. H. Chiang, and D. Zhang, 2013: Atlantic Meridional Overturning Circulation (AMOC) in CMIP5 models: RCP and historical simulations. J. Climate, 26, 7187–7197, doi:10.1175/JCLI-D-12-00496.1.
Dunne, J.P., and Coauthors, 2013: GFDL's ESM2 global coupled climate-carbon Earth System Models Part II: Carbon system formulation and baseline simulation characteristics. J. Climate, 26, 2247–2267, doi:10.1175/JCLI-D-12-00150.1.
Gnanadesikan, A., and Coauthors, 2006: GFDL's CM2 global coupled climate models. Part II: the baseline ocean simulation. J. Climate, 19, 675–697, doi:10.1175/JCLI3630.1.
Griffies, S. M., M. . Harrison, R. C. Pacanowski, and A. Rosati, 2004; A technical guide to MOM4, GFDL ocean group technical report No. 5, Princeton, NJ: NOAA/Geophysical Fluid Dynamics Laboratory, 342 pp., http://www.gfdl.noaa.gov/bibliography/related_files/smg0301.pdf.
Held, I. M. and B. J. Soden, 2006: Robust responses of the hydrological cycle to global warming. J. Climate, 19, 5686–5699, doi:10.1175/JCLI3990.1.
Hoegh-Guldberg, O., and Coauthors, 2007: Coral reefs under rapid climate change and ocean acidification. Science, 318, 1737–1742, doi:10.1126/science.1152509.
Lee, S.-K., D. B. Enfield, and C. Wang, 2007: What drives seasonal onset and decay of the Western Hemisphere warm pool? J. Climate, 20, 2133-2146, doi:10.1175/JCLI4113.1.
Lee, S.-K., D. B. Enfield, and C. Wang, 2011: Future impact of differential inter-basin ocean warming on Atlantic hurricanes. J. Climate, 24, 1264-1275, doi:10.1175/2010JCLI3883.1.
Liu, Y., S.-K. Lee, B. A. Muhling, J. T. Lamkin, and D. B. Enfield, 2012: Significant reduction of the Loop Current in the 21st century and its impact on the Gulf of Mexico. J. Geophys. Res., 117, C05039, doi:10.1029/2011JC007555.
Liu, Y., S.-K. Lee, D. B. Enfield, B. A. Muhling, J. T. Lamkin, F. E. Muller-Karger, and M. A. Roffer, 2015: Potential impact of climate change on the Intra-Americas Sea: Part-1. A dynamic downscaling of the CMIP5 model projections. J. Mar. Syst. 148, 56-59, doi:10.1016/j.jmarsys.2015.01.007.
Muhling, B.A., S.-K. Lee, J.T. Lamkin, and Y. Liu, 2011. Predicting the effects of climate change on bluefin tuna (Thunnus thynnus) spawning habitat in the Gulf of Mexico, ICES J. Mar. Sci., 68, 1051–1062, doi:10.1093/icesjms/fsr008.
Muhling, B. A., Y. Liu, S.-K. Lee, J. T. Lamkin, M. A. Roffer, F. Muller-Karger, and J. F. Walter, 2015: Impact of global warming on the Intra-Americas Seas: Part-2. Implications for Atlantic bluefin tuna and skipjack tuna adult and larval habitats. J. Mar. Syst. 148, 1–13, doi:10.1016/j.jmarsys.2015.01.010.
Oey, L.-Y., T. Ezer, and H. C. Lee, 2005: Loop Current, rings and related circulation in the Gulf of Mexico: A review of numerical models and future challenges, Circulation in the Gulf of Mexico: Observations and Models, W. Sturges and A. Lugo-Fernandez, Eds., Amer. Geophys. Union, 31-56, doi:10.1029/161GM04.
Seager, R., M. B. Blumenthal, and Y. Kushnir, 1995: An advective atmospheric mixed layer model for ocean modeling purposes: Global simulation of surface heat fluxes, J. Climate, 8, 1951–1964, doi:10.1175/1520-0442(1995)008<1951:AAAMLM>2.0.CO;2.
Taylor, K. E., R. J. Stouffer, and G. A. Meehl, 2012: An overview of CMIP5 and the experiment design. Bull. Amer. Meteor. Soc., 93, 485–498, doi:10.1175/BAMS-D-11-00094.1.
Terray, L., L. Corre, S. Cravatte, T. Delcroix, G. Reverdin, and A. Ribes, 2012: Near-surface salinity as nature’s rain gauge to detect human influence on the tropical water cycle. J. Climate, 25, 958–977, doi:10.1175/JCLI-D-10-05025.1.
van Hooidonk, R., J. A. Maynard, Y. Liu, and S.-K. Lee, 2015: Downscaled projections of Caribbean coral bleaching that can inform conservation planning. Global Change Biol., 21: 3389–3401, doi:10.1111/gcb.12901.
U S C L I V A R V A R I A T I O N S
US CLIVAR VARIATIONS • Winter 2016 • Vol. 14, No. 1 33
Dufour et al. (2015) write in the last edition of the joint US CLIVAR and OCB newsletter about carbon and
heat uptake in the Southern Ocean and ask the important question, “Will it remain a major sink in the future?” They “provide an overview of recent breakthroughs and ongoing work in understanding Southern Ocean heat and carbon uptake.” However, they do not discuss some recent work about how the simulation of heat and carbon uptake in the Southern Ocean can be improved in non-eddy-resolving resolution ocean components of climate models.
Dufour et al. (2015) discuss the role of mesoscale eddies in the Southern Ocean circulation saying, “Transport induced by eddies opposes the wind-driven circulation, thus reducing the rate at which deep waters are exposed to the surface.” They also suggest that the weakening of Southern Ocean carbon uptake from the 1980s to 2000s is “attributed to the intensification of westerly winds associated with positive phases of the Southern Annular Mode, which strengthens upwelling and thus brings cold waters rich in carbon to the surface at a higher rate. This exposure of carbon-rich waters results in enhanced outgassing of carbon, which opposes the increasing uptake of carbon from anthropogenic emissions, hence reducing the rate of uptake of total carbon.” Can these changes in ocean circulation and carbon uptake due to stronger westerly winds be simulated correctly in the non-eddy-resolving ocean component
of a climate model, in which the effects of mesoscale eddies are parameterized rather than being resolved?
All ocean models show that the equatorward surface Ekman flow increases quite linearly in response to an increase in the imposed westerly zonal wind stress maximum in the Southern Hemisphere. This increases the mean meridional overturning circulation (MOC) in the Southern Ocean, which subducts water north, and upwells water to the south, of the Antarctic Circumpolar Current. Eddy-resolving ocean models show that the eddy energy increases with the stronger zonal wind stress, and so does the eddy MOC, which opposes the mean MOC. If this eddy response is to be captured in non-eddy-resolving ocean models, then the coefficient in the eddy parameterization cannot be set as a constant. It must be dependent on aspects of the ocean circulation such that the coefficient increases when the applied zonal wind stress is increased. Farneti and Gent (2011) showed that this is exactly what happens in the GFDL CM2.1 climate model, providing that there is no artificial cap applied to the eddy parameterization coefficient. Gent and Danabasoglu (2011) showed that the eddy coefficient in the ocean component of the CCSM4 climate model also responds, and that it increases when the zonal wind stress increases. Therefore, what has come to be known as “eddy compensation” can be simulated to some degree in climate models. Whether the degree of eddy compensation in these two climate
This article is a supplement to the joint US CLIVAR Variations Fall 2015 edition and OCB Newsletter.
Update to “Anthropogenic carbon and heat uptake by the ocean: Will the Southern Ocean remain a major sink?”
Peter R. Gent
National Center for Atmospheric Research

U S C L I V A R V A R I A T I O N S
US CLIVAR VARIATIONS • Winter 2016 • Vol. 14, No. 1 34
models is correct is still an open question, but they both show a significant eddy compensation effect. The fact that the non-eddy-resolving ocean components that use a variable formulation of the eddy coefficient produce a more realistic simulation over 1958 – 2007 than those with a constant coefficient has been nicely documented by Farneti et al. (2015).
Now the question is: Do climate models with a varying eddy coefficient have a different future outlook for carbon uptake in the Southern Ocean than those using a constant coefficient? Two recent papers show that the answer to this question is an emphatic yes. Lovenduski et al. (2013) use the CCSM4 ocean component forced by atmospheric observations over the period 1958 – 2007. They conclude that had a degree of eddy compensation of the increased mean MOC over this period not occurred in this model, then the rate of total carbon uptake would have reduced more strongly and by the exact mechanism outlined above and in Dufour et al. (2015). Swart et al. (2014) ran the University of Victoria climate model using both a constant and varying eddy coefficient. They showed that the reduction in Southern Ocean carbon dioxide uptake over the past 30 years using a variable coefficient is only about 40% of the reduction when a constant eddy coefficient is used. These two papers clearly show that a climate model using a constant eddy coefficient or a coefficient strongly capped at a small value in the ocean component will greatly overestimate the reduction in Southern Ocean carbon dioxide uptake in response to an increase in the Southern Hemisphere zonal wind stress.
The significant increase in the Southern Hemisphere westerlies over the past 50 years is thought to be due to increasing atmospheric carbon dioxide and the development of the Southern Hemisphere ozone hole, both of which tend to strengthen the westerlies. “As the stratosphere ozone hole recovers over the next 50 years, it is expected that the Southern Hemisphere zonal winds will not increase nearly so rapidly as they have over the past 30 years (Polvani et al. 2011). Therefore, I conclude that it is not at all certain that the effectiveness of the
Southern Ocean carbon dioxide sink will decrease over the next 40 – 50 years.” This quote is from a review I have written entitled “Effects of Southern Hemisphere wind changes on the MOC in ocean models” to be published in volume 8 of the Annual Reviews of Marine Science in January 2016. It is my opinion that, to paraphrase Mark Twain, reports of the future demise of the Southern Ocean carbon sink have been greatly exaggerated by climate models that use a constant ocean eddy coefficient.
References
Dufour, C. O., I. Frenger, T. L. Frolicher, A. R. Gray, S. M. Griffies, A. K. Morrison, J. L. Sarmiento, and S. A. Schlunegger, 2015: Anthropogenic carbon and heat uptake by the ocean: Will the Southern Ocean remain a major sink? US CLIVAR Variations, 13, No 4, 1-7, http://usclivar.org/sites/default/files/documents/2015/Variations2015Fall_0.pdf and OCB News, 13, No 3, http://www.us-ocb.org/publications/newsletters.html.
Farneti, R., and P. R. Gent, 2011: The effects of the eddy-induced advection coefficient in a coarse-resolution coupled climate model. Ocean Modell., 39, 135-145, doi:10.1016/j.ocemod.2011.02.005.
Farneti, R., and Coauthors, 2015: An assessment of Antarctic Circumpolar Current and Southern Ocean meridional overturning circulation during 1958 – 2007 in a suite of interannual CORE-II simulations. Ocean Modell., 93, 84-120, doi:10.1016/j.ocemod.2015.07.009.
Gent, P. R., and G. Danabasoglu, 2011: Response to increasing Southern Hemisphere winds in CCSM4. J. Climate, 24, 4992-4998, doi:10.1175/JCLI-D-10-05011.1.
Gent, P. R., 2016: Effects of Southern Hemisphere wind changes on the meridional overturning circulation in models. Annu. Rev. Mar. Sci., 8, in press, doi:10.1146/annurev-marine-122414-033929.
Lovenduski, N. S., M. C. Long, P. R. Gent, and K. Lindsay, 2013: Multi-decadal trends in the advection and mixing of natural carbon in the Southern Ocean. Geophys. Res. Lett., 40, 139-142, doi:10.1029/2012GL054483.
Polvani, L. M., M. Previdi, and C. Deser, 2011: Large cancellation, due to ozone recovery, of future Southern Hemisphere atmospheric circulation trends. Geophys. Res. Lett., 38, L04707, doi:10.1029/2011GL046712.
Swart, N. C., J. C. Fyfe, O. A. Saenko, and M. Eby, 2014: Wind-driven changes in the ocean carbon sink. Biogeosciences, 11, 6107-6117, doi:10.5194/bg-11-6107-2014.
US CLIVAR VARIATIONS • Winter 2016 • Vol. 14, No. 1 35
ANNOUNCEMENTS
Welcome new US CLIVAR Panel members and SSC co-chair
US Climate Variability and Predictability(CLIVAR) Program1201 New York Ave. NW, Suite 400Washington, DC 20005(202) 787-1682
US CLIVARClimate Variability & Predictabilit
y
US CLIVAR acknowledges support from these US agencies:
This material was developed with federal support of NASA, NSF, and DOE (AGS-1502208), and NOAA (NA11OAR4310213).
Any opinions, findings, conclusions, or recommendations expressed in this material are those of the authors and do not necessarily reflect the views of the sponsoring agencies.
[email protected]/usclivar
US CLIVAR welcomes the following new members, who will help science planning and implementation of program goals. These new members bring a broad range of expertise acrss disciplines and research methods that complement and balance the current Panel membership.
Scientific Steering Committee Co-ChairDaniel Vimont, University of Wisconsin-Madison
Phenomena, Observations, and Synthesis PanelAlison Macdonald, Woods Hole Oceanographic Institution
James Morison, University of WashingtonYolande Serra, University of Washington
Samantha Stevenson, NCAR and University of Hawaii
Process Study and Model Improvement PanelGregory Foltz, NOAA Atlantic Oceanographic and Meteorological Laboratory
Taka Ito, Georgia Institute of TechnologyHyodae Seo, Woods Hole Oceanographic InstitutionJanet Sprintall, Scripps Institution of Oceanography
Predictability, Prediction, and Applications Interface Panel
Emily Becker, NOAA Climate Prediction CenterRobert Burgman, Florida International University
Adam Clark, NOAA National Severe Storm LabJohn Nielsen-Gammon, Texas A&M University
Related Documents


