Variations in Streamflow Response to Large Hurricane-Season Storms in a Southeastern U.S. Watershed XING CHEN,MUKESH KUMAR, AND BRIAN L. MCGLYNN Nicholas School of the Environment, Duke University, Durham, North Carolina (Manuscript received 6 March 2014, in final form 19 July 2014) ABSTRACT Floods caused by hurricane storms are responsible for tremendous economic and property losses in the United States. To minimize flood damages associated with large hurricane-season storms, it is important to be able to predict streamflow amount in response to storms for a range of hydroclimatological conditions. However, this is challenging considering that streamflow response exhibits appreciable variability even for hurricane-season storms that deliver similar precipitation amounts. As such, better estimates of event re- sponses require refined understanding of the causes of flood response variability. Here, a physically based, distributed hydrologic model and supporting hydrologic datasets are used to identify and evaluate dominant hydrologic controls on streamflow amount variability. The analysis indicates that variability in flood response in the Lake Michie watershed is primarily driven by antecedent soil moisture conditions near the land surface and evapotranspiration during postevent streamflow recession periods, which in turn is a function of pre- cipitation history and prevailing vegetation and meteorological conditions. Presented results and ensuing analyses could help prioritize measurements during observation campaigns and could aid in risk management by providing look-up diagrams to quickly evaluate flood responses given prior information about hurricane storm size. 1. Introduction Hurricanes and tropical storms are major geophysical disaster-causing agents, which account for billions of dollars in annual property damages (Changnon 2009; Dale et al. 2001; Emanuel et al. 2008; Emanuel 1987; Saunders et al. 2000). In the United States alone, aver- age annual losses caused by these storms exceeded $2.6 billion per year for the period 1949–2006 (Changnon 2009; Changnon and Changnon 1992). Most of these storms originate in the Atlantic Ocean between June and November (Changnon 2009) and cause extensive losses in the southeastern states including Louisiana, Florida, Georgia, South Carolina, and North Carolina. In North Carolina, where approximately 350 hurricanes have hit since 1667 (NCDC 2014; SCONC 2014a; Hardy and Carney 1963; Carney and Hardy 1967), these storms have caused hundreds of fatalities and billions of dollars in property damages (Blake et al. 2007; NOAA 2013a,b). A large percentage of these losses have been due to flooding from intense storms (Ashley and Ashley 2008; NOAA 2013a). To the dismay of water resource and risk managers, risks associated with remnant hurricanes and tropical storms are expected to increase in the future, as global warming is predicted to result in an increased in- tensity of tropical disturbances (Easterling et al. 2000; Elsner 2007; Goldenberg et al. 2001; Knutson and Tuleya 2004; Landsea 2007; Mann and Emanuel 2006; Pielke et al. 2005; Salinger 2005; Webster et al. 2005). Flooding-related damages due to hurricane or other tropical-disturbance storms can be considerably re- duced if accurate prediction of streamflow response to these storms can be made. Prediction of flood responses to precipitation is nontrivial because they reflect more than just rain event size. For example, streamflow data from the Lake Michie watershed (LMW) in North Carolina (Fig. 1, Table 1) shows that streamflow response to large, similar-magnitude (in terms of precipitation amount) hurricane-season storms can be significantly different. Note that hurricane-season storms in this paper indicate storms that have hurricane or other tropical-disturbance origins and happen between June and November. Events are defined to span from the start Corresponding author address: Mukesh Kumar, Nicholas School of the Environment, Duke University, 450 Research Dr., LSRC A207A, Durham, NC 27708. E-mail: [email protected] FEBRUARY 2015 CHEN ET AL. 55 DOI: 10.1175/JHM-D-14-0044.1 Ó 2015 American Meteorological Society

Welcome message from author
This document is posted to help you gain knowledge. Please leave a comment to let me know what you think about it! Share it to your friends and learn new things together.
Transcript
Variations in Streamflow Response to Large Hurricane-Season Storms in aSoutheastern US Watershed
XING CHEN MUKESH KUMAR AND BRIAN L MCGLYNN
Nicholas School of the Environment Duke University Durham North Carolina
(Manuscript received 6 March 2014 in final form 19 July 2014)
ABSTRACT
Floods caused by hurricane storms are responsible for tremendous economic and property losses in the
United States Tominimize flood damages associated with large hurricane-season storms it is important to be
able to predict streamflow amount in response to storms for a range of hydroclimatological conditions
However this is challenging considering that streamflow response exhibits appreciable variability even for
hurricane-season storms that deliver similar precipitation amounts As such better estimates of event re-
sponses require refined understanding of the causes of flood response variability Here a physically based
distributed hydrologic model and supporting hydrologic datasets are used to identify and evaluate dominant
hydrologic controls on streamflow amount variability The analysis indicates that variability in flood response
in the LakeMichie watershed is primarily driven by antecedent soil moisture conditions near the land surface
and evapotranspiration during postevent streamflow recession periods which in turn is a function of pre-
cipitation history and prevailing vegetation and meteorological conditions Presented results and ensuing
analyses could help prioritize measurements during observation campaigns and could aid in risk management
by providing look-up diagrams to quickly evaluate flood responses given prior information about hurricane
storm size
1 Introduction
Hurricanes and tropical storms are major geophysical
disaster-causing agents which account for billions of
dollars in annual property damages (Changnon 2009
Dale et al 2001 Emanuel et al 2008 Emanuel 1987
Saunders et al 2000) In the United States alone aver-
age annual losses caused by these storms exceeded $26
billion per year for the period 1949ndash2006 (Changnon
2009 Changnon and Changnon 1992) Most of these
storms originate in the Atlantic Ocean between June
and November (Changnon 2009) and cause extensive
losses in the southeastern states including Louisiana
Florida Georgia South Carolina and North Carolina
In North Carolina where approximately 350 hurricanes
have hit since 1667 (NCDC 2014 SCONC 2014a Hardy
and Carney 1963 Carney and Hardy 1967) these storms
have caused hundreds of fatalities and billions of dollars
in property damages (Blake et al 2007 NOAA 2013ab)
A large percentage of these losses have been due to
flooding from intense storms (Ashley and Ashley 2008
NOAA 2013a) To the dismay of water resource and risk
managers risks associated with remnant hurricanes and
tropical storms are expected to increase in the future as
global warming is predicted to result in an increased in-
tensity of tropical disturbances (Easterling et al 2000
Elsner 2007 Goldenberg et al 2001 Knutson and Tuleya
2004 Landsea 2007 Mann and Emanuel 2006 Pielke
et al 2005 Salinger 2005 Webster et al 2005)
Flooding-related damages due to hurricane or other
tropical-disturbance storms can be considerably re-
duced if accurate prediction of streamflow response to
these storms can be made Prediction of flood responses
to precipitation is nontrivial because they reflect more
than just rain event size For example streamflow data
from the Lake Michie watershed (LMW) in North
Carolina (Fig 1 Table 1) shows that streamflow response
to large similar-magnitude (in terms of precipitation
amount) hurricane-season storms can be significantly
different Note that hurricane-season storms in this
paper indicate storms that have hurricane or other
tropical-disturbance origins and happen between June
andNovember Events are defined to span from the start
Corresponding author addressMukesh Kumar Nicholas School
of the Environment Duke University 450 Research Dr LSRC
A207A Durham NC 27708
E-mail mukeshkumardukeedu
FEBRUARY 2015 CHEN ET AL 55
DOI 101175JHM-D-14-00441
2015 American Meteorological Society
of precipitation to the time after which there is no rainfall
for at least 6 h The terms lsquolsquoevent sizersquorsquo and lsquolsquostorm sizersquorsquo
have been used interchangeably throughout the paper
and refer to the amount of precipitation delivered during
the storm event Enormous variability in streamflow re-
sponse is highlighted by dots falling within the vertical
shaded bar in Fig 1 where storms of size of approxi-
mately 007m are observed to generate streamflow with
magnitudes varying by as much as 250 around the
mean Additional details of these events are in rows 2 5
13 and 19 in Table 1 (identified by asterisks) The flow
magnitude in response to an event (in Fig 1) is defined as
the total flow amount from the beginning of an event to
the time when the recession limb flattens after the end of
that single storm The observed variability of flood re-
sponse suggests that in addition to storm event size
other transient controls such as evolving land surface
characteristics and hydrologic states may have a signifi-
cant influence on flow responses to storm events While
previous studies have investigated contributing factors to
streamflow generation during and immediately after
isolated hurricane storms (Castillo et al 2003 Elsenbeer
et al 1995 Sturdevant-Rees et al 2001 Tramblay et al
2010 Wood 1976) their influence on the variability of
flood response from one large hurricane-season storm to
the other both intra- and interannually has gone largely
unreported This gap in knowledge is partially attribut-
able to the challenge associated with measurement of
multiple hydrologic states over long periods of time
Because hurricanes and tropical storms are not a year-
wise phenomenon tracking the role of controls on re-
sponse variability would require multiyear datasets and
detailed investigations This is expected to be a resource-
intensive task as understanding of the influence of con-
trols on the variability of flood response would ideally
require collocated observations within a watershed that
track partitioning across the hydrologic continuum in-
cluding surface flow evapotranspiration et vadose zone
soil moisture and groundwater response across multiple
hurricane-season storms
The goal of this paper is to identify the causes of
variability in flood response amount to large hurricane-
season storms Variability in response from one event to
another even if the events deliver similar precipitation
amounts is caused mainly by differences in transient
controls such as meteorological and antecedent hydro-
logical conditions Therefore we specifically evaluate
controls on streamflow variability from one storm event
to next The streamflow response discussed in this paper
refers to the total discharge amount rather than the
peak discharge Our case study utilizes publicly avail-
able observation data in synergy with a physically based
numerical watershed model and demonstrates the wide
applicability of the approach in data-poor regions
2 Data and methods
a Study area and datasets
We selected the Lake Michie watershed in North
Carolina as the study site to analyze the causes of vari-
ability in flood response to large hurricane-season
storms LMW is frequently struck by hurricane-season
storms originating from the Atlantic Ocean The wa-
tershed area is 4328 km2 and is part of the Neuse River
basin Streamflow output from the watershed is de-
livered into the LakeMichie reservoir which has served
as the primary water supply for the city of Durham
(population of 279 641 in 2012) since 1929 (Weaver
1994) Varied streamflow response to hurricane-season
storms poses a significant challenge for effective reser-
voir management water resource allocation and risk
assessment in the watershed and thus underscores the
need for better understanding of flood response
The LMW is characterized by northwest-to-southeast-
oriented valleys with elevation ranging from 87 to 270m
MSL (Fig 2d) Most of the watershed consists of gentle
to moderately rolling hills with some steep narrow
valleys immediately upstream of the Lake Michie res-
ervoir (Weaver 1994) Upland slopes range from 08 to368 We used 30-m-resolution digital elevation model
grid data from the US Geological Survey (USGS http
nationalmapgovviewerhtml) for analyses Climate in
the watershed is characterized by long hot humid
summers and short mild winters with transitional
FIG 1 Observed streamflow responses due to large hurricane-season
events (magnitude larger than 0016m)
56 JOURNAL OF HYDROMETEOROLOGY VOLUME 16
seasons (Kopec and Clay 1975) During the years
1985ndash2012 average monthly temperature in the wa-
tershed ranged from 58C in January to 358C in July
while annual precipitation ranged from 802 to 1577mm
with over half of the precipitation occurring during hur-
ricane season (JunendashNovember) Annual runoff ratios
(evaluated as the ratio of annual streamflow discharge and
precipitation amount) for this period ranged from 011
to 046 Here we used hourly climate data (including pre-
cipitation temperature relative humidity wind velocity
solar radiation and vapor pressure) from the North
American Land Data Assimilation System phase 2
(NLDAS-2) meteorological forcings dataset (Xia et al
2012) Spatial resolution of all the aforementioned forc-
ing data is 188 or approximately 95 km in LMW (Mitchell
et al 2004) The watershed consists of 15 land cover types
based on National Land Cover Data (MRLC 2013) and
56 of the watershed is covered by forest while 34 of
the total area is covered by shrubs Forests in the water-
shed include deciduous evergreen and mixed conifer
trees while shrubs include scrub hay grassland and
crops The percentage of developed area in the watershed
TABLE 1 Named 42 largest hurricane-season storms in North Carolina during 1985ndash2012 In the second column asterisks identify
events that have been highlighted by shading in Fig 1 In the last column variables d and et identify the dominant control on streamflow
response to large hurricane-season storms
No Event name Event date
Event
size (m)
Streamflow
response size (m)
Antecedent
soil moisture
Dominant
control
1 Tropical Storm Juan 30 Oct 1985 0108 0033 021 d
2 (C) Tropical Storm Kate 20 Nov 1985 0067 0044 076 d
3 Hurricane Charley 16 Aug 1986 0092 0022 031 et
4 Tropical Depression Nine 3 Sep 1987 0098 0027 003 d
5 Tropical Depression Chris 28 Aug 1988 0067 0008 001 d
6 Tropical Storm Isaac 2 Oct 1988 0061 0007 011 d
7 Tropical Storm Barry 15 Jul 1989 0052 0006 020 et
8 (B) Hurricane Klaus 10 Oct 1990 0101 0018 009 d
9 Hurricane Lili 22 Oct 1990 0083 0043 047 d
10 Tropical Storm Ana 24 Sep 1991 0076 0015 017 d
11 Tropical Depression Two 25 Jul 1994 0064 0001 022 et
12 Hurricane Allison 9 Jun 1995 0052 0015 046 et
13 (D) Tropical Depression Jerry 25 Aug 1995 0067 0009 050 et
14 Hurricane Opal 3 Oct 1995 0073 0013 014 d
15 Tropical Storm Sebastien 20 Oct 1995 0054 0018 030 d
16 Hurricane Fran 3 Sep 1996 0063 0001 009 d
17 Hurricane Danny 22 Jul 1997 0060 0004 011 d
18 Major Hurricane Erika 9 Sep 1997 0064 0010 000 d
19 Hurricane Earl 3 Sep 1998 0068 0006 005 d
20 Hurricane Dennis 25 Aug 1999 0055 0003 005 d
21 Hurricane Dennis 4 Sep 1999 0149 0071 017 d
22 Hurricane Floyd 14 Sep 1999 0115 0060 031 et
23 (A) Tropical Storm Harvey 27 Sep 1999 0102 0036 043 d
24 Tropical Storm Gustav 29 Aug 2002 0074 0014 035 et
25 Tropical Storm Kyle 10 Oct 2002 0140 0077 006 d
26 Tropical Depression Bill 1 Jul 2003 0054 0019 049 et
27 Hurricane Isabel 18 Sep 2003 0055 0010 021 d
28 Hurricane Juan 22 Sep 2003 0053 0023 055 et
29 Tropical Storm Bonnie 13 Aug 2004 0062 0007 038 et
30 Tropical Depression Gaston 29 Aug 2004 0060 0017 019 et
31 Tropical Storm Alberto 13 Jun 2006 0051 0016 041 et
32 Tropical Storm Ernesto 30 Aug 2006 0073 0006 001 d
33 Hurricane Isaac 5 Oct 2006 0052 0014 030 d
34 Hurricane Noel 24 Oct 2007 0119 0026 006 d
35 Major Hurricane Gustav 25 Aug 2008 0131 0049 004 d
36 Hurricane Hanna 5 Sep 2008 0109 0075 025 et
37 Tropical Depression One 4 Jun 2009 0072 0015 015 et
38 Hurricane Ida 10 Nov 2009 0139 0058 035 d
39 Hurricane Igor 26 Sep 2010 0151 0048 002 d
40 Hurricane Irene 5 Sep 2011 0061 0010 001 d
41 Tropical Storm Debby 9 Jul 2012 0057 0008 017 et
42 Hurricane Sandy 17 Sep 2012 0061 0004 008 d
FEBRUARY 2015 CHEN ET AL 57
is approximately 9 of the total area Soil Survey Geo-
graphic (SSURGO)data (Soil Survey Staff 2013) indicate
that the watershed consists of 33 soil composition types
with majority of the area covered with loamy soils
b Model description
A physically based spatially distributed hydrologic
model Penn State Integrated Hydrologic Model (PIHM
Kumar 2009 Kumar et al 2009b Qu andDuffy 2007) was
used here to perform long-term integrated hydrologic
simulations of streamflow and other coupled hydrologic
states PIHM employs a semidiscrete finite volume for-
mulation to locally integrate partial differential equations
of hydrologic processes to ordinary differential equations
(ODEs) on each unstructuredmesh element (Fig 2d) The
system of ODEs defined on all mesh elements were as-
sembled and solved simultaneouslywith a stiffODEsolver
using an implicit NewtonndashKrylov integrator An adaptive
time-stepping scheme is used for capturing model dy-
namics during a period of rapid changes in states triggered
usually by precipitation pulse The control volume ele-
ments used to discretize the domain include triangular-
and linear-shaped units which represent land surface
elements and rivers respectively These elements are
projected downward to the bedrock (for land surface
elements) or to the river bed (for river elements) to form
prismatic or cuboidal elements respectively in 3D (Kumar
2009) The model was implemented on an unstructured
mesh decomposition of the LMW (Fig 2d) with 399 land
elements (3D prismatic units) and 77 river segments (3D
cuboidal units) Each land element was discretized into
three layers a top relatively thin unsaturated zone with
thickness of 025m an intermediate unsaturated zone
that extends from 025m to groundwater level and
a groundwater layer The two lower layers have variable
dimensions as they depend on the evolving groundwater
table depthGWEach river unit was vertically discretized
into two layers with flowing river on the top and a
groundwater zone below it Processes simulated in
PIHM include snowmelt evapotranspiration (Penmanndash
Monteith equation) interception (Rutter model) over-
land flow (2Ddiffusion wave equations) unsaturated zone
infiltration (1D approximation of the Richards equation)
groundwater flow (3DRichards equation) and streamflow
(1D diffusive wave)
c Model parameterization calibration andvalidation
A tightly coupled GIS framework PIHMgis (Bhatt
et al 2008 2014) was used to parameterize the model
FIG 2 (a) North Carolina county map with LMW location (shown by black dot) (b) Precipitation (July 2002) (c) temperature (July
2002) (d) elevation (e) land cover and (f) soil map of LMW
58 JOURNAL OF HYDROMETEOROLOGY VOLUME 16
domain using the aforementioned datasets (see section
2a) This includes defining relations between hydro-
graphic units and their physical properties For more
details about the processes parameters and topology of
domain discretization readers are referred to Kumar
et al (2009a 2010)
PIHM simulations were performed for 28 years
(1985ndash2012) for which streamflow data are available for
validation Streamflow calibration was performed against
observed hourly streamflow data at USGS site ID
2085500 (Fig 2d) which lies 128 km above the Lake
Michie reservoir The calibration was performed for
the year 2002 which received an annual precipitation
of 1139mm the same as the average precipitation for
the entire simulation period The calibration process
involved nudging hydrogeological parameters uni-
formly across the model domain (Refsgaard and Storm
1996) to match the baseflow magnitude and ground-
water head distribution during dry periods and the
rate of hydrograph decay during recession Two cali-
bration periods were chosen 1) a summer period with
no appreciable recharge (from late April to early June)
and 2) a wet cold period with substantial streamflow
response to precipitation and relatively low evapo-
transpiration (from November to December) The
calibration process involved first initializing PIHM
with the water table at the land surface and then letting
the model relax with no precipitation input until
streamflow approaches zero The simulated relaxation
hydrograph was compared with observed streamflow
during the first calibration period (identified above)
Streamflow during this period was mostly dominated
by base flow which in turn was controlled by sub-
surface properties of the model domain The goal of
this initial model calibration step was to identify sets
of hydrogeological properties such as van Genuchten
coefficients macro andmatrix porosities and hydraulic
conductivities which would allow a reasonable match
between modeled and observed base flow and ground-
water head distributions The second calibration step
involved comparing the simulated relaxation rates
with the observed values Streamflow calibration re-
sults and corresponding model efficiencies in the cali-
bration year are shown in Fig 3a The dynamics of
streamflow variation between observed and modeled
results are in reasonable agreement and are considered
acceptable Similar modeled and observed runoff ra-
tios of 0219 and 0214 respectively (Table 2) also
indicate reliable partitioning of the water budget
Furthermore annual et estimation of 660mm in this
watershed is in good agreement with estimated results
from a nearby heavily vegetated site (areal distance of
265 km from Lake Michie reservoir) in Duke Forest
where et was reported to range from 580 to 740mm
annually (Stoy et al 2006)
Results of streamflow validation for 1985ndash2012 (Fig 3b)
show a NashndashSutcliffe efficiency of 068 and coefficient
of determination R2 of 083 for daily data 080 and 090
for monthly data and 072 and 089 for yearly data It is
to be noted that the watershed does not have any op-
erationally active groundwater wells within it that can
be used to validate the temporal dynamics of ground-
water This level of data scarcity is neither surprising
nor unusual and is typical for watersheds of this size
In fact the density of USGS groundwater observation
wells in the contiguous United States is less than one well
per 6150km2 (httpwaterdatausgsgovnwisinventory)
However single-instance groundwater depth data do
exist at 36 locations within the watershed Modeled
groundwater elevation heads are compared to the ob-
served data for respective dates to evaluate the ability
of the model in capturing the spatial distribution of
groundwater level (Jones et al 2008) The results show
good agreement between simulated and observed
groundwater elevation heads with R2 5 089 (Fig 3c)
indicating that the distribution of modeled total
groundwater heads reasonably matches the observed
data Notably the target metrics of the calibration
strategymdashthe rate of hydrograph decay during cold
period and the magnitude of base flow and spatial dis-
tribution of groundwater table depth during summermdash
differ from the validation metrics such as the match
between simulated and observed streamflow time series
and static groundwater table depths The goal was to
avoid simply fitting parameters to match observed data
while attempting to best represent the underlying be-
havior and response dynamics of the watershed Since
no soil moisture monitoring stations exist within the
watershed soil moisture data from the nearest Envi-
ronment and Climate Observing Network (ECONet)
site (SCONC 2014b) in Durham which is 13 km south
of the watershed were used for validation Because of
the similarity in both timing and magnitude of the
precipitation at the soil moisture site and that within the
LMW it is reasonable to expect that soil moisture dy-
namics at the ECONet site should show similar patterns
to that in the LMW especially at locations within the
watershed that have the same land cover and soil type
It is to be noted the landscape slope was also very
similar (458) at the two comparison sites Modeled
soil moisture deficits d at these locations (with same
land cover and soil type as at the soil moisture moni-
toring site) within LMWare compared to observed data
at the ECONet site for 2009ndash10 (Fig 3d) The soil
moisture deficit is defined as the fraction of pore space
in the top 025m of the subsurface that needs to be filled
FEBRUARY 2015 CHEN ET AL 59
by moisture before saturation occurs Similar variations
and ranges of moisture deficit between modeled and
observed data suggest that the model was able to cap-
ture soil moisture dynamics to an acceptable degree It
is to be noted that soil moisture data after 2010 were not
included in this analyses because of changes in in-
strument setup at the site and outstanding recalibration
needs
Since the focus of this paper is on the variability of
streamflow response to large hurricane-season storms
FIG 3 Comparison of modeled and observed (a) discharge during calibration period (b) discharge during the
entire simulation period (1985ndash2012) (c) groundwater heads at 36 locations in LMW and (d) soil moisture deficit at
the ECONet site (soil moisture deficit 5 1 2 soil saturation)
60 JOURNAL OF HYDROMETEOROLOGY VOLUME 16
further confidence in themodel result in this context was
built by evaluating the ability of the model to simulate
the order sequence of streamflow responses corre-
sponding to large hurricane-season storms Rank cor-
relation coefficient of modeled and observed streamflow
amounts rccQ corresponding to the top 50 hurricane-
season storms (in terms of size) for the period 1985ndash2012
was calculated For each event streamflow amount un-
der the hydrograph was calculated from the start of the
event until the recession limb flattened Flattening of the
recession limb was identified by a flow difference of less
than 80m3 in an hour which is approximately 1 of the
average flow rate from the watershed during hurricane
season Because some of these large events were im-
mediately followed by other precipitation events at close
time intervals making it difficult to account for the
streamflow response explicitly due to an event in con-
sideration rccQ was calculated only for events where
streamflow contribution could be quantified without the
convolved influence of following precipitation events
Rank correlation for these events was estimated to be
equal to 081 This suggests that the PIHM simulations
also reasonably captured the relative variability in
streamflow response across multiple events
The aforementioned validation results of streamflow
groundwater soil moisture and et at scales ranging
from events to seasons to decades establishes sufficient
confidence in the model performance for it to be used in
evaluation of the role of controls on streamflow re-
sponse variability to large hurricane-season storms
d Understanding the role of controls on variableflood response from model results
Variability in flood response to hurricane-season
storms can be due to either differences in meteorologi-
cal forcings or changes in watershed-response dynamics
across different events For events that deliver similar
precipitation amounts variations in hydrologic response
(streamflow amount) can be caused by differences in
transient controls such as antecedent hydrologic states
andor evolving watershed properties such as seasonal
variation in ecohydrologic functions (eg transpiration
and interception loss) of vegetation and meteorological
forcings To identify the controls on variability in flood
response arising from large hurricane-season storms we
first quantified the streamflow contribution due to an
event and then compared the hydrologic process con-
tributions between events of similar sizes but consider-
ably different responses The first step was not trivial
considering that an observed streamflow discharge time
series was often also composed of flow due to sub-
sequent events that happened well before the influence
of previous events on the streamflow hydrograph had
subsided To isolate the flow response generated only
because of a particular precipitation event we con-
ducted event-scale PIHM simulations in addition to the
long-term PIHM simulation (which was presented in
section 2c) The event streamflow simulations were run
from the start of the precipitation event to the time by
which the generated streamflow recession limb flat-
tened Event simulations used observed meteorological
forcings as inputs while antecedent hydrologic condi-
tions were set based on the results of the long-term
simulation Figure 4 shows simulated discharge obtained
from the event simulation eventQ and discharge per unit
event size (5 eventQp where p is the precipitation
magnitude) for the largest 50 hurricane-season storms
(in terms of delivered precipitation amount) during the
28-yr simulation period Large spread in flow response
even for events of similar sizes is highlighted through
two event pairs of magnitudes 0067m (events A and B)
and 0102m (C and D) respectively (Table 1 Fig 4a)
For the 0067- and 0102-m storm sizes eventQp varies
from 013 to 066mm21 and 018 to 035mm21 re-
spectively suggesting that runoff ratios can vary by
more than 100 in response to events of approximately
the same size
To understand the causes of differential streamflow
response to similar-sized hurricane-season storms hy-
drologic stores that vary markedly across the events
were identified For this we considered the two event
pairs with similar event size identified earlier in Table 1
and Fig 4 For each pair the source of difference in
streamflow response was first determined by comparing
water partitions between different hydrologic stores
(Table 3) It is to be noted that water partitions in all
hydrologic stores were estimated from the start of the
precipitation event to the time by which generated
streamflow recession limb flattened Because the sum-
mation of evapotranspirative loss net change in storage
delS and streamflow depth equals the precipitation
magnitude that is p5 et1 delS 1 eventQ for events of
TABLE 2 Key water balance statistics for calibration year
Precipitation
(m)
Observed annual
streamflow (m)
Simulated annual
streamflow (m)
Total
et (m)
Observed
runoff ratio
Modeled
runoff ratio
1139 0244 0250 0622 0214 0219
FEBRUARY 2015 CHEN ET AL 61
similar sizes the difference in eventQ has to be due to
differences in et and delS terms For events A and B
eventQ differs by 0018m This difference is primarily
attributable to the variation in net storage between
events (0015m) as difference in et between the two
events (ieDet) is only 0002 LargerDdelS could be due
to differences in antecedent conditions during the
events In contrast a difference of 0035m in eventQbetween events C and D is predominantly due to the
difference in et (0024m) This could be because of dif-
ferences in meteorological conditions or transpiration
and interception capability of vegetation between the
two events To identify the role of hydrologic controls on
changes in hydrologic stores and hence the flood re-
sponse additional event simulations were conducted by
removing the influence of controls one at a time The
role of these controls on a larger set of hurricane-season
storms was subsequently tested by evaluating correla-
tion between streamflow amount and effective precip-
itation size effp of hurricane-season events It is to be
noted that effp for an event was evaluated by calculat-
ing the difference between precipitation event size
and the lsquolsquonegative water storersquorsquo term which includes
evapotranspirative loss and the moisture storage deficit
that needs to be filled before streamflow is generated
For example effp for an event during which the soil is
completely saturated is equal to the event precip-
itation magnitude (p2 et) If the ground is unsaturated
and streamflow due to a precipitation event is gener-
ated only after the topsoil layer gets saturated (after the
moisture deficit has been filled) effp is evaluated as p2(et 1 d) Henceforth the correlation coefficient be-
tween eventQ and effp was compared to correlations
between eventQ and p A higher correlation between
effp and eventQ would indicate that hydrologic stores
used in the evaluation of effp play an important role in
determining streamflow response In contrast a lower
or negligible change in correlation coefficient with re-
spect to correlation between p and eventQ would sug-
gest that streamflow response is not sensitive enough to
the concerned hydrologic stores that are used in eval-
uation of effp
3 Results and discussion
a Role of watershed antecedent hydrologicconditions on variable streamflow response
Comparison of water budget partitions for events A
and B (see Table 3) shows that delS during event B
(0069m) was larger than during event A (0054m) thus
indicating that difference in net storage (ie DdelS)played an important role in disparity in streamflow re-
sponse between the two events It is to be noted that delSfor an event is defined as the difference in total sub-
surface soil moisture content (both in unsaturated and
saturated zone) between start and end of an event sim-
ulation The marked difference in delS (equal to 83 of
the difference in streamflow response amount) between
the two events could be attributed to larger moisture
deficit in both the near-surface soil layer and the
groundwater table for event B To isolate the role of
antecedent hydrologic conditions (and hence moisture
deficit) on variability in flood response an additional
event simulation A1 was conducted The modeling
configuration (watershed properties and meteorological
conditions) of event simulation A1 was set exactly
the same as that of event A however the antecedent
FIG 4 Variation of (a) streamflow magnitude and (b) streamflow magnitude per unit event size with event
precipitation size for the largest 50 storm events in the hurricane season in LMW
62 JOURNAL OF HYDROMETEOROLOGY VOLUME 16
conditions were set identical to event B Results from
event simulation A1 suggest that the flood response
amount of event A would be much less and also very
similar to that of event B if the antecedent conditions of
B were used This confirms that antecedent conditions
play a dominant role in varied response of events A and
B and could be an important factor in determining
a wide range of streamflow responses to hurricane-
season storms in general It should be noted however
that event simulation A1 does not fully identify if the
moisture deficit near the land surface (say in the top
25 cm) is the major contributor to differential response
or if differences in groundwater table depths are also
important To explore this further two additional ex-
periments (A2 and A3) were conducted The simulation
configuration of A2 was set exactly the same as A but
the groundwater initial condition was set identical to
that of event B The simulated flood response amount
for event A2 which only marginally differed from that
of event A indicated that groundwater depth did not
play a substantial role in determining varied responses
between events A and B In contrast event simulation
A3 which has the same configuration as A but with
surface soil (top 25 cm) moisture identical to B showed
a flood response amount that was more akin to event B
thus confirming that surface soil moisture was the pri-
mary driver for the disparity in responses between
event A and B The role of antecedent moisture con-
ditions in varied streamflow responses was also evident
for event pairs (20 and 27) and (21 and 39) in Table 1
where streamflow response was also significantly larger
when antecedent soil moisture was higher These re-
sults highlight that differences in individual hydrologic
stores (unsaturated zone or groundwater) can play
as significant a role as differences in total storage in
determining varied streamflow response to hurricane-
season storms
We examined variations in surface flow depth near
the land surface saturation (top 25 cm) and in ground-
water depth during events A and B to further un-
derstand how soil moisture deficit near the land surface
influences variability in response even while ground-
water initial conditions have a negligible impact (Fig 5)
For certain periods during both events simulation re-
sults suggested that the top 25 cm was saturated in most
of the watershed However the groundwater table was
never that shallow anywhere in the watershed during
the time of saturation (Figs 5ab) This indicates that
overland flow generated during saturation (shown
in Figs 5cd) was primarily because of an infiltration
excess process resulting from saturation in the near-
surface soil It should be noted that the absence of
transient groundwater observation data within the wa-
tershed makes it difficult to absolutely confirm that
the groundwater table does not reach the land surface
during the period when surface soil experiences satura-
tion as was simulated by the model However observed
groundwater level time series from a neighboring wa-
tershed [North Carolina Division of Water Resources
(NCDWR) Caldwell site F43 3 1 the site is 193 km
from the LMW outlet NCDWR 2014] confirmed that
the groundwater table never reached the land surface
even in the valley floor during the entire observation
period (1985ndash2012) Additionally soil saturation SS data
at the ECONet site (Fig 3d) which incidentally also
exists outside the LMW (see section 2c) confirmed that
the near-surface soil moisture did reach saturation dur-
ing hurricane-season storms as was also simulated by the
model Because infiltration excess due to near-surface
saturation was the cause of overland flow generation
TABLE 3 Water partitioning across different water stores for event pairs (A B) and (C D) (identified in Fig 4) A1 A2 and A3 are
ancillary event simulations with exactly the same forcings as event A but with all only groundwater or only surface soil moisture
antecedent conditions being respectively identical to event B C1 C2 andC3 are same as event C but they happen at same time as eventD
have antecedent conditions identical to event D and have both antecedent condition and timing of event D respectively
Storm
properties
Antecedent
conditions Water budget partition
Changes in water budget partitions
between event pairs
Event Timing p (m) SS GW (m) eventQ (m) eventQp delS (m) et (m) D DeventQ (m) 2DdelS (m) 2Det (m)
A Sep 0102 043 292 0036 035 0054 0012 B 2 A 20018 20015 20002
B Oct 0101 009 2103 0018 018 0069 0014
A1 Sep 0102 009 2103 002 02 0072 001 A1 2 A 20016 20018 0002
A2 Sep 0102 043 2103 0034 033 0057 0011 A2 2 A 20002 20003 0001
A3 Sep 0102 009 292 0021 021 007 0011 A3 2 A 20015 20016 0001
C Nov 0067 076 265 0044 066 0016 0007 D 2 C 20035 20011 20024
D Aug 0067 050 275 0009 013 0027 0031
C1 Aug 0067 076 265 0031 046 0001 0035 C1 2 C 20013 0015 20028
C2 Nov 0067 050 275 0023 034 0038 0006 C2 2 C 20021 20022 0001
C3 Aug 0067 050 275 0007 010 0026 0034 C3 2 C 20037 20010 20027
FEBRUARY 2015 CHEN ET AL 63
during the two events lower antecedent soil saturation
for event D (Table 3 Fig 5a) meant that a larger soil
moisture deficit had to be satisfied before overland flow
can be generated Hence antecedent soil saturation
conditions near the land surface can play a crucial role
in determining surface flow response Because overland
flow contribution to streamflow during events A and B
was as large as 97 and 98 respectively antecedent
soil moisture conditions near the land surface ended up
being the primary determinant of the varied response in
events A and B
To evaluate the role of nearndashland surface moisture
deficits on variable responses due to large hurricane-
season storms in general the correlation coefficient
between streamflow amount and effective precipitation
size evaluated here as (p 2 d) where d is the moisture
deficit in the top 25 cm was compared to the correlation
between eventQ and p for all top-50 hurricane-season
events Improved R2 of 077 for eventQ versus effp(Fig 6b) with respect to eventQ versus p (Fig 6a) in-
dicates that soil moisture deficit is indeed an important
determinant in variability of streamflow response and
hence also on its predictability Notably R2 between
eventQ versus effp for the case when effp is evaluated as
(p 2 d) where d is the moisture deficit defined by
groundwater table depth reduced to 044 thus re-
confirming that groundwater level did not play a sub-
stantial role in variability of streamflow response and
hence in its predictability
It should be noted that the differences in antecedent
soil saturation conditions which influenced the stream-
flow response may themselves be controlled by previous
precipitation To explore this furtherR2 values between
antecedent soil moisture and total precipitation amount
in the previous N days (where N is a positive integer)
were evaluated Results reveal that precipitation in the
previous 1 4 8 15 and 30 days explained 64 224
248 227 and 166 of the variance in antecedent
soil moisture respectively Sizable R2 values indicate
that precipitation history did influence the antecedent
soil moisture and hence hydrologic response to large
storms Furthermore a maximum R2 for N 5 8 days
FIG 5 (a) Average SS and GW for events A and B (b) percentage of watershed area near saturation
(Percent_SS) and area with GW hitting the land surface (Percent_GW) for events A and B (c) SS and overland
flow depth (OVL) for event A and (d) SS and OVL for event B
64 JOURNAL OF HYDROMETEOROLOGY VOLUME 16
suggests that the soil moisture memory of the watershed
was approximately one week
b Role of evapotranspiration on variable streamflowresponse
Comparison of water budget partition in events C and
D (see Table 3) shows that evapotranspiration loss plays
an important role in the disparity in streamflow re-
sponse Evapotranspiration during event D (0031m)
was markedly larger than during event C (0007m) It
is to be noted again that et is the total evapotranspira-
tion during the streamflow event which spans from
the start of the storm to the time by which the gener-
ated streamflow recession limb has flattened Notably
evapotranspirative losses during the storm periods are
relatively small (0002 and 0006m for events C and D
respectively) and hence the marked difference in et
between the two events is because of losses that happen
after the storm a major component of which is due to
transpiration of infiltrated water in the root zone The
difference in et rate during poststorm periods is attrib-
utable to favorable meteorological (higher temperature
and radiation conditions) and ecological (higher leaf
area index) conditions in August relative to November
(when event C happened) It is to be noted that ante-
cedent conditions for events C andDwere also different
and could also play a role in differential responses by
influencing both et and delS To isolate the influence of
meteorological conditions and vegetation states on et
a new event simulation C1 was conducted Event C1
replicates event C but with an assumption that it hap-
pens in August (at the same time as event D) This
means that meteorological and vegetation conditions
during C1 were the same as that during event D
FIG 6 Linear regression between (a) precipitation and streamflow magnitudes (b) effective precipitation
(effp 5 p2 d) and eventQ (c) effective precipitation (effp 5 p2 et) and eventQ and (d) effective precipitation
(effp 5 p 2 et 2 d) and eventQ Variable d is the moisture deficit in top 25 cm of soil and et is the total
evapotranspiration during an event
FEBRUARY 2015 CHEN ET AL 65
Expectedly et for event C1 was much larger than in
event C thus reinforcing the fact that the difference in et
between events C and D was largely due to their timing
and differences in potential evapotranspiration Nota-
bly a relatively large evapotranspiration loss in C1 in
relation to event D does not translate to a very small
flood response as was the case in event D This suggests
that antecedent conditions could also be playing a role in
differential response To evaluate the role of antecedent
conditions event simulation C2 was conducted with
exactly the same modeling configuration as event C but
with antecedent conditions that were set identical to
event D Results suggest that while eventQ in this case is
relatively smaller than event C it is still markedly dif-
ferent than eventQ in event D The combined effect of
differences in antecedent conditions and et was evalu-
ated by event simulation C3 which has the same timing
and antecedent conditions as event D The simulated
flood response amount for event C3 now onlymarginally
differed from that of event D This indicates that both et
and moisture deficit contributed to varied responses
between events C and D The combined effect of et and
moisture deficit is evident in the event pair 15 and 26
(see Table 1) for which the streamflow responses are
almost the same even though event 26 had a much
higher antecedent soil moisture This is because of much
larger et during the postevent streamflow recession pe-
riod of event 26 as it occurs in July when potential
evapotranspiration rates are relatively larger
To evaluate the role of differences in et on variable
flood responses due to large hurricane-season storms
correlation coefficients between eventQ and effp were
evaluated for the largest 50 hurricane-season storms
during the simulation period Here effp is calculated as
(p 2 et) Improved R2 of 073 (Fig 6c) with respect to
eventQ versus p (Fig 6a) indicates that et was indeed an
important determinant in variability of streamflow re-
sponse and hence also on its predictability It is to be
noted that variations in et are often rooted in differences
in timing of respective events as timing determines both
the vegetation states and meteorological conditions that
are conducive to et This suggests that variability in flood
response due to hurricane-season storms can sometimes
be simply related to timing of the eventwithin a year with
a smaller response expected in summer (JunendashAugust)
when et is as large as 40 of event precipitation
The integrated role of antecedent conditions and et on
the variability of flood response due to the largest 50
hurricane-season storms was further evaluated by
recalculating the correlation between eventQ and effp
where effp is calculated as (p2 et2 d) Improved R2 of
083 (Fig 6d) confirms the potential role of both et and
antecedent near-surface soil moisture conditions on the
variability of streamflow response amount Further
analyses suggest that the average lsquolsquomissingrsquorsquo percentage
of precipitation [quantified as 100(12 eventQp)] for the
largest 50 hurricane-season storms was as large as 74
of the precipitation amount of which approximately
52 and 22 were lost to soil moisture deficit and
evapotranspiration respectively The results indicate
that antecedent soil moisture was the dominant control
on streamflow response Event-based analyses showed
that antecedent soil moisture was the primary control on
streamflow response in 28 out of the 50 top hurricane-
season storms while evapotranspirative losses were
dominant in 22 storms Relative dominance of the two
controls on streamflow response showed a seasonal
trend with antecedent soil moisture being the dominant
control for 735 of large hurricane-season storms
during AugustndashNovember In contrast evapotranspira-
tion was the main determinant in 875 of the large
hurricane-season storms between June and July
4 Conclusions and synthesis
This paper evaluates the extent of variability in
streamflow response due to large hurricane-season
storms and examines the role of transient hydrologic
controls on said variability Analyses were conducted
based on model simulation results obtained from
a physically based integrated hydrologic model PIHM
which was validated for multiple states within the Lake
Michie watershed including streamflow hydrograph
runoff ratio groundwater table elevation soil moisture
and ranges of evapotranspiration To confirm the ap-
plicability of the model for analyses of variability in
streamflow response ranks of predicted streamflow re-
sponses were validated The validated model was then
used to perform nested control event simulations to
quantify the variability in streamflow response and to
identify and isolate the role of hydrologic controls on
different water stores during storm events Analyses
suggest that hurricane-season storms of similar size
could generate a considerable range of streamflow re-
sponses (more than 100 difference) thus highlighting
that it is not reliable to use storm size alone to predict
the streamflow response and the consequent flood
Event simulations suggest that the dominant controls on
the variability of streamflow amount were soil saturation
near the ground surface and evapotranspirative losses
which are in turn influenced by meteorological condi-
tions and vegetation states Generally higher anteced-
ent topsoil saturation would lead to generation of larger
streamflow in response to events of similar sizes Also
because meteorological conditions and ecohydrologic
functions of vegetation follow a seasonal variation
66 JOURNAL OF HYDROMETEOROLOGY VOLUME 16
streamflow response shows a strong dependence on
timing of the event within a year For example
streamflow amount in response to events of similar
sizes is much less for events that happen in July with
respect to the ones that happen in November Notably
groundwater contribution on streamflow amount under
hurricane-season storms is negligible The role of iden-
tified controls on varied streamflow responses for
a wider set of hurricane-season storms was evaluated by
calculating the predictability of streamflow response size
after accounting for the role of controls Increased cor-
relation between streamflow response size and effective
storm size which accounts for the role of controls
compared to that between streamflow amount and pre-
cipitation alone further reinforced the role of individual
hydrologic controls Between antecedent topsoil satu-
ration and postevent evapotranspiration the former was
identified as the dominant control on streamflow re-
sponse amount However evapotranspiration was still
a primary determinant on streamflow response espe-
cially during June and July
Information regarding the dominant controls on var-
iability of streamflow response can be used to help pri-
oritize resources for field campaigns and observation
systems For example distributed measurements of soil
moisture which play a crucial role in determining flood
response can be used in assimilation of antecedent soil
moisture states regionalization of relevant sensitive
model parameters and validation of model results thus
leading to an improved predictability and reduced un-
certainty in estimation of flood response to large
hurricane-season storms In contrast a much-refined
groundwater network although important might not
sufficiently improve the prediction of flood response to
hurricane-season storms Knowledge of process controls
and antecedent conditions can also be used to aid in risk
management by providing look-up diagrams to quickly
evaluate flood responses given prior information about
hurricane storm size This may be realized through de-
velopment of a streamflow response map for a range of
antecedent conditions timings of hurricane storms and
event sizes in a watershed One simplistic but repre-
sentative example of a look-up diagram is shown in
Fig 7 which shows streamflow response to three hurri-
cane storms of varying sizes happening at different
times (June September and November) and during
dry intermediate and wet antecedent states A look-up
diagram of this sort with responses mapped at finer
resolutions and for a wide range of conditions could be
used by resource managers to easily estimate the flood
response size due to an impending hurricane storm In
addition comparison of look-up diagrams or storm-
response maps among different watersheds can also
provide information about which watershed is more
vulnerable to events of a particular size It should be
noted that the two dominant controls on the variability
in flood response documented heremdashantecedent soil mois-
ture and evolving vegetation states and meteorological
conditionsmdashcan both be estimated using remote sensing
data This points to the potential for using satellite data
to improve flood prediction due to hurricane-season
storms It is to be noted that the dominant hydrologic
controls identified in LMW might not be applicable in
all the southeastern US watersheds because of differ-
ences in topographic physiographic and other hydro-
geologic properties such as soil drainage parameters
and vegetation types all of which can influence infil-
tration and evapotranspiration rates In addition while
the validation process took advantage of available hy-
drologic datasets within and around the Lake Michie
watershed further confidence in the model performance
and analyses could be built by observing additional
hydrologic variables for validation such as transient
groundwater depth and evapotranspiration
AcknowledgmentsThis study was supported byGrant
NSF-EAR1331846 from Calhoun Critical Zone Obser-
vatory an Ecosystem and Water Working Group seed
FIG 7 Streamflow magnitude under different antecedent soil
moisture conditions in topsoil layer (25 cm) timing of event and
storm size Variables SMd SMi and SMw indicate dry in-
termediate andwet topsoil saturation conditions respectively J S
and N indicate July September and November respectively and
pi pl and ph indicate intermediate low and high precipitation
magnitudes respectively
FEBRUARY 2015 CHEN ET AL 67
grant from the Nicholas Institute and the Duke Uni-
versity start-up fund for new faculty We would also
like to thank all three anonymous reviewers for their
constructive comments that greatly improved this
manuscript
REFERENCES
Ashley S T andW S Ashley 2008 Flood fatalities in the United
States J Appl Meteor Climatol 47 805ndash818 doi101175
2007JAMC16111
Bhatt G M Kumar and C J Duffy 2008 Bridging the gap
between geohydrologic data and integrated hydrologic mod-
eling Proc iEMSs 2008 Int Congress on Environmental
Modelling and Software Vol 2 Barcelona Spain In-
ternational Environmental Modelling and Software Society
743ndash750 [Available online at wwwiemssorgiemss2008
uploadsMainVol2-iEMSs2008-Proceedingspdf]
mdashmdash mdashmdash and mdashmdash 2014 A tightly coupled GIS and distributed
hydrologic modeling framework Environ Modell Software
62 70ndash84 doi101016jenvsoft201408003Blake E S C W Landsea and E J Gibney 2007 The deadliest
costliest and most intense United States tropical cyclones
from 1851 to 2006 (and other frequently requested hurricane
facts) NOAA Tech Memo NWS TPC-5 43 pp [Available
online at wwwnhcnoaagovpdfNWS-TPC-5pdf]
Carney C B andAVHardy 1967NorthCarolina hurricanesA
listing and description of tropical cyclones which have affected
the state Rev ed US Government Printing Office 40 pp
Castillo V M A Gomez-Plaza and M Martinez-Mena 2003
The role of antecedent soil water content in the runoff re-
sponse of semiarid catchments A simulation approach J
Hydrol 284 114ndash130 doi101016S0022-1694(03)00264-6
Changnon S 2009 Characteristics of severeAtlantic hurricanes in
the United States 1949ndash2006 Nat Hazards 48 329ndash337
doi101007s11069-008-9265-z
mdashmdash and J Changnon 1992 Temporal fluctuations in weather
disasters 1950ndash1989 Climatic Change 22 191ndash208 doi101007
BF00143027
Dale V H and Coauthors 2001 Climate change and forest dis-
turbances Climate change can affect forests by altering the
frequency intensity duration and timing of fire drought in-
troduced species insect and pathogen outbreaks hurricanes
windstorms ice storms or landslidesBioScience 51 723ndash734doi1016410006-3568(2001)051[0723CCAFD]20CO2
Easterling D R GAMeehl C Parmesan S A Changnon T R
Karl and L O Mearns 2000 Climate extremes Observa-
tions modeling and impacts Science 289 2068ndash2074
doi101126science28954872068
Elsenbeer H D Lorieri and M Bonell 1995 Mixing model ap-
proaches to estimate storm flow sources in an overland flow-
dominated tropical rain forest catchmentWater Resour Res
31 2267ndash2278 doi10102995WR01651
Elsner J B 2007 Granger causality and Atlantic hurricanes
Tellus 59A 476ndash485 doi101111j1600-0870200700244xEmanuel K A 1987 The dependence of hurricane intensity on
climate Nature 326 483ndash485 doi101038326483a0
mdashmdash R Sundararajan and J Williams 2008 Hurricanes and global
warmingResults fromdownscaling IPCCAR4 simulationsBull
Amer Meteor Soc 89 347ndash367 doi101175BAMS-89-3-347
Goldenberg S B CW Landsea AMMestas-Nuntildeez andWM
Gray 2001 The recent increase in Atlantic hurricane activity
Causes and implications Science 293 474ndash479 doi101126
science1060040
HardyAV andC B Carney 1963 NorthCarolina hurricanes A
descriptive listing of tropical cyclones which have affected the
state US Government Printing Office 26 pp
Jones J P E A Sudicky and R G McLaren 2008 Application
of a fully-integrated surfacendashsubsurface flow model at the
watershed-scale A case studyWater Resour Res 44W03407
doi1010292006WR005603
Knutson T R and R E Tuleya 2004 Impact of CO2-induced
warming on simulated hurricane intensity and precipitation
Sensitivity to the choice of climate model and convective
parameterization J Climate 17 3477ndash3495 doi101175
1520-0442(2004)0173477IOCWOS20CO2
Kopec R J and J W Clay 1975 Climate and air quality North
Carolina Atlas Portrait of a Changing Southern State J W
Clay D M Orr Jr and A W Stuart Eds University of
North Carolina Press 92ndash111 pp
Kumar M 2009 Toward a hydrologic modeling system PhD
thesis The Pennsylvania State University 274 pp
mdashmdash G Bhatt and C J Duffy 2009a An efficient domain de-
composition framework for accurate representation of geo-
data in distributed hydrologic models Int J Geogr Inf Sci
23 1569ndash1596 doi10108013658810802344143mdashmdash C J Duffy and K M Salvage 2009b A second-order
accurate finite volume-based integrated hydrologic mod-
eling (FIHM) framework for simulation of surface and
subsurface flow Vadose Zone J 8 873ndash890 doi102136
vzj20090014
mdashmdashG Bhatt and C J Duffy 2010 An object-oriented shared data
model for GIS and distributed hydrologic models Int J Geogr
Inf Sci 24 1061ndash1079 doi10108013658810903289460
Landsea C 2007 Counting Atlantic tropical cyclones back to
1900 Eos Trans Amer Geophys Union 88 197ndash202
doi1010292007EO180001
Mann M E and K A Emanuel 2006 Atlantic hurricane trends
linked to climate change Eos Trans Amer Geophys Union
87 233ndash241 doi1010292006EO240001
Mitchell K E and Coauthors 2004 The multi-institution North
American Land Data Assimilation System (NLDAS) Utiliz-
ing multiple GCIP products and partners in a continental
distributed hydrological modeling system J Geophys Res
109 D07S90 doi1010292003JD003823
MRLC cited 2013 National Land Cover Database 2006 [Avail-
able online at wwwmrlcgovnlcd2006php]
NCDC cited 2014 North Carolina hurricane events Storm events
database [Available online at wwwncdcnoaagovstormevents
listeventsjspbeginDate_mm501ampbeginDate_dd501amp
beginDate_yyyy51996ampendDate_mm504ampendDate_dd530amp
endDate_yyyy52013ampeventType528Z291Hurricane1
28Typhoon29ampcounty5ALLampzone5ALLampsubmitbutton5Searchampstatefips5372CNORTH1CAROLINA]
NCDWR cited 2014 Ground water level database detail North
Carolina Division of Water Resources [Available online
at httpncwaterorgData_and_ModelingGround_Water_
Databasesleveldetailphpquado5F43X1]
NOAA cited 2013a Preliminary report Hurricane Fran [Avail-
able online at wwwnhcnoaagov1996franhtml]
mdashmdash cited 2013b Historical hurricane tracks [Available online at
httpcoastnoaagovhurricanes]
Pielke R A C Landsea M Mayfield J Laver and R Pasch
2005 Hurricanes and global warming Bull Amer Meteor
Soc 86 1571ndash1575 doi101175BAMS-86-11-1571
68 JOURNAL OF HYDROMETEOROLOGY VOLUME 16
Qu Y and C J Duffy 2007 A semidiscrete finite volume for-
mulation for multiprocess watershed simulation Water Re-
sour Res 43 W08419 doi1010292006WR005752
Refsgaard J C and B Storm 1996 Construction calibration and
validation of hydrological models Distributed Hydrological
ModellingM Abbott and J Refsgaard Eds Springer 41ndash54
Salinger M J 2005 Climate variability and change Past present
and futuremdashAnoverviewClimaticChange 70 9ndash29 doi101007s10584-005-5936-x
SaundersMA R E Chandler C JMerchant and F P Roberts
2000 Atlantic hurricanes and NW Pacific typhoons ENSO
spatial impacts on occurrence and landfall Geophys Res
Lett 27 1147ndash1150 doi1010291999GL010948
SCONC cited 2014a Tropical cyclones that have affected the
southeastern US State Climate Office of North Carolina
[Available online at wwwnc-climatencsueduclimatehurricanes
affectingphpstate5NCampbuffer5150]
mdashmdash cited 2014b NC CRONOS Database North DurhamWater
Reclamation Facility (DURH) State Climate Office of North
Carolina [Available online at httphatterasmeasncsuedu
cronosstation5DURHamptemporal5daily]
Soil Survey Staff cited 2013 Web soil survey Natural Resources
Conservation Service United States Department of Agricul-
ture [Available online at httpwebsoilsurveynrcsusdagov]
Stoy P C and Coauthors 2006 Separating the effects of climate
and vegetation on evapotranspiration along a successional
chronosequence in the southeastern USGlobal Change Biol
12 2115ndash2135 doi101111j1365-2486200601244x
Sturdevant-Rees P J A Smith J Morrison and M L Baeck
2001 Tropical storms and the flood hydrology of the central
AppalachiansWater Resour Res 37 2143ndash2168 doi101029
2000WR900310
Tramblay Y C Bouvier C Martin J-F Didon-Lescot
D Todorovik and J-MDomergue 2010 Assessment of initial
soil moisture conditions for event-based rainfallndashrunoff model-
ling J Hydrol 387 176ndash187 doi101016jjhydrol201004006
Weaver J C 1994 Sediment characteristic and sedimentation
rates in Lake Michie Durham County North Carolina
1990ndash92 USGS Water-Resources Investigations Rep 94-
4123 38 pp
Webster P J G J Holland J A Curry and H-R Chang 2005
Changes in tropical cyclone number duration and intensity in
a warming environment Science 309 1844ndash1846 doi101126
science1116448
Wood E F 1976 An analysis of the effects of parameter un-
certainty in deterministic hydrologic models Water Resour
Res 12 925ndash932 doi101029WR012i005p00925
Xia Y and Coauthors 2012 Continental-scale water and energy
flux analysis and validation for the North American Land
Data Assimilation System project phase 2 (NLDAS-2) 1
Intercomparison and application of model products J Geo-
phys Res 117 D03109 doi1010292011JD016048
FEBRUARY 2015 CHEN ET AL 69
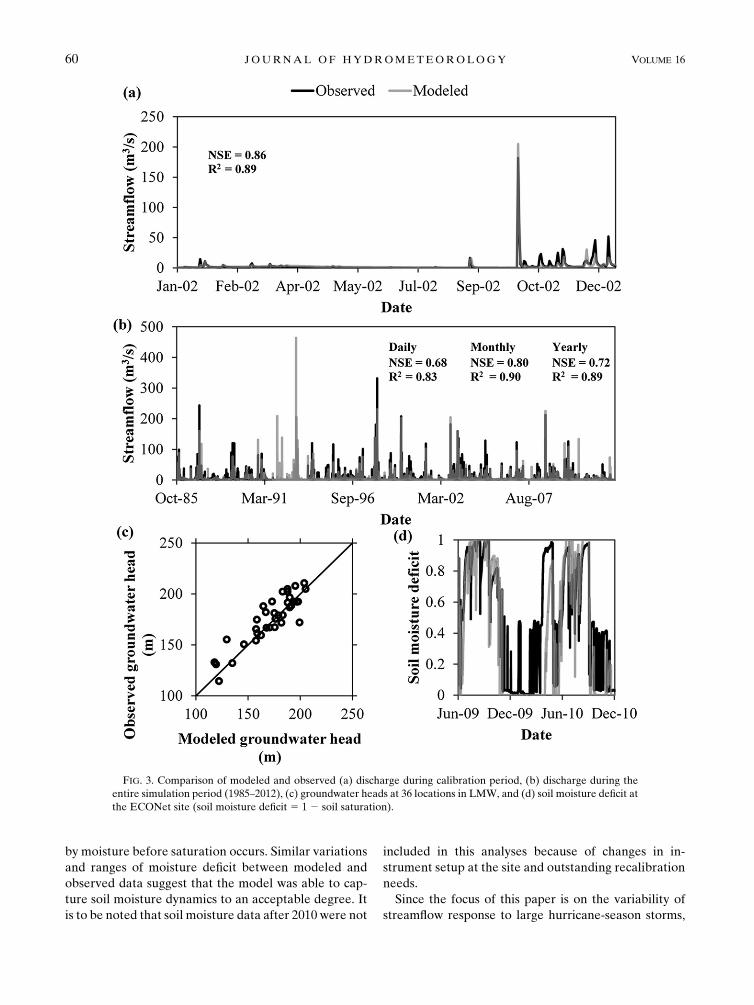
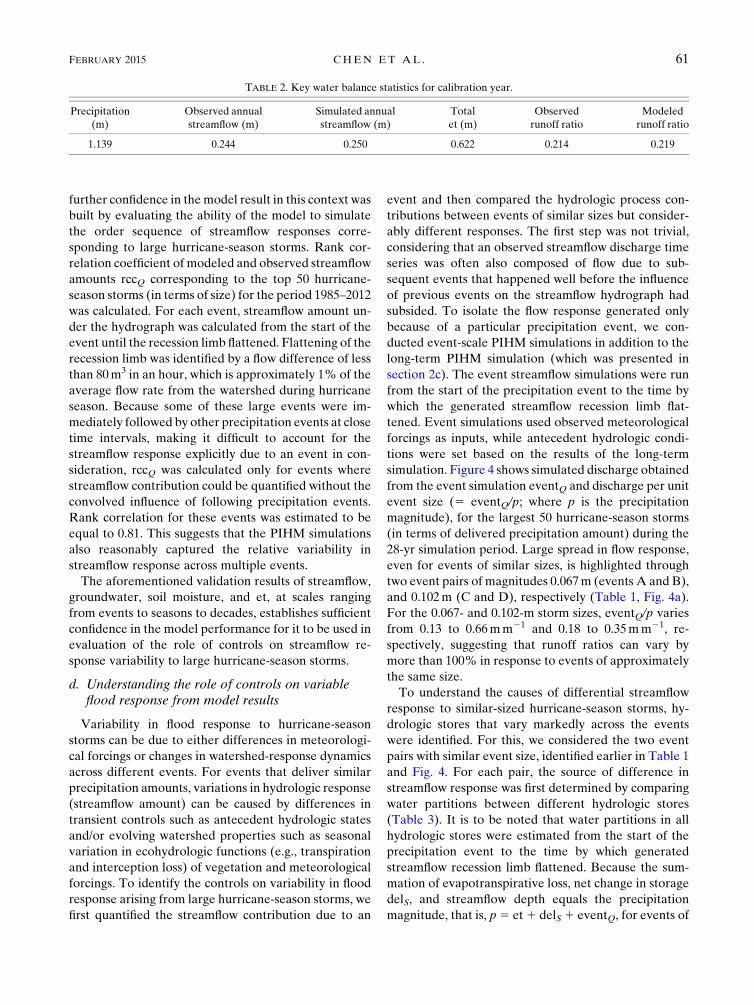
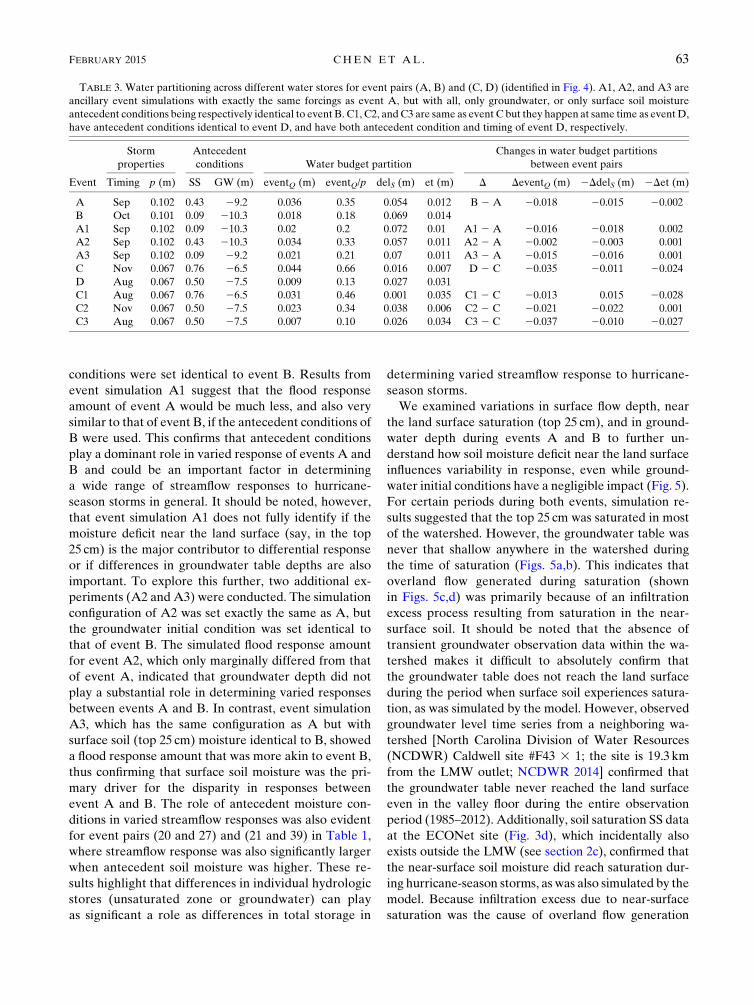
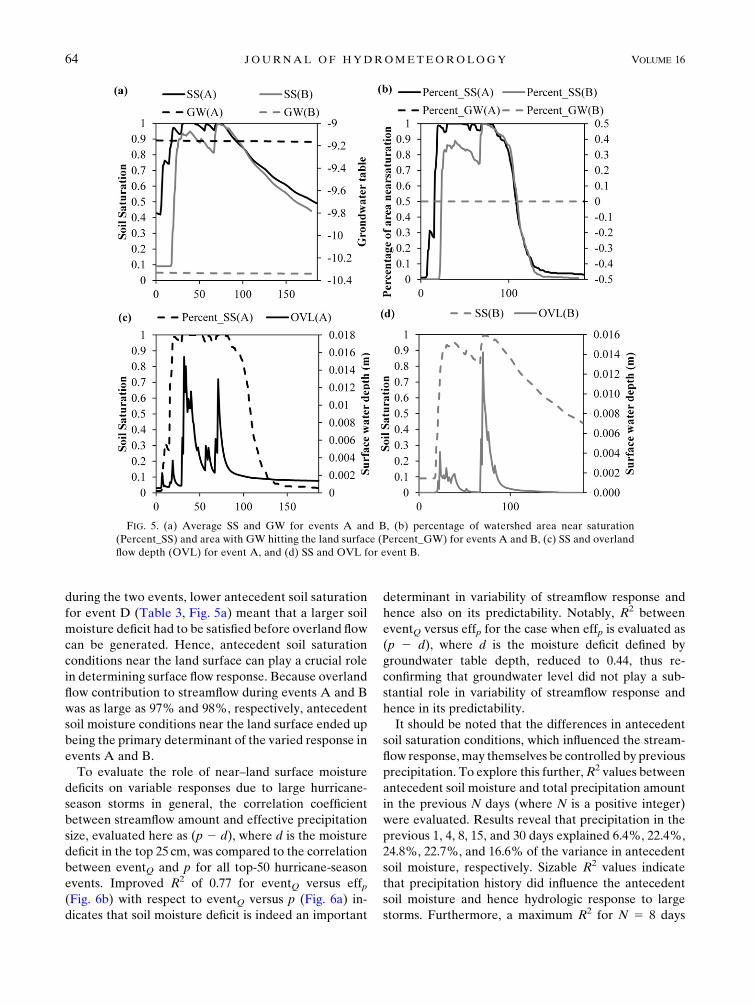
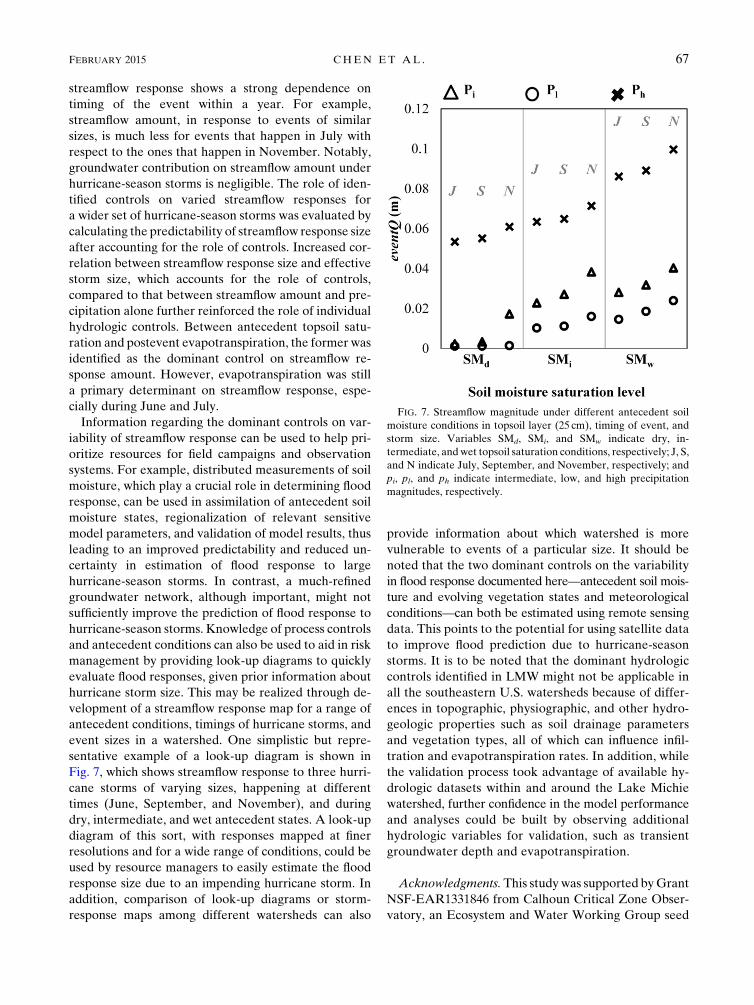
Related Documents