J. Physiol. (1987). 385, pp. 207-242 207 With 1 plate and 19 text-figures Printed in Great Britain VARIATION OF MEMBRANE PROPERTIES IN HAIR CELLS ISOLATED FROM THE TURTLE COCHLEA BY J. J. ART* AND R. FETTIPLACE From the Physiological Laboratory, University of Cambridge, Cambridge CB2 3EG (Received 1 July 1986) SUMMARY 1. Hair cells were enzymatically isolated from identified regions of the turtle basilar papilla and studied with the patch-electrode technique. The experimental aim was to relate the resonance properties seen during current injection to the membrane currents measured in the same cell under whole-cell voltage clamp. 2. Solitary hair cells had resting potentials of about -50 mV, and produced a damped oscillation in membrane potential at the onset and termination of a small current step; the resonant frequency varied from 9 to 350 Hz between cells, and was correlated with the region of papilla from which a cell had been isolated. The inferred frequency map was consistent with the tonotopic arrangement described previously in the intact papilla. 3. Depolarizations from the resting potential under voltage clamp activated a large net outward current with a steep voltage dependence, and the steady-state current- voltage relationship was strongly rectified about the resting potential. Input resistances tended to be smaller in cells with higher resonant frequencies, although there was no concurrent variation in membrane area as inferred from the cell capacitance. 4. The kinetics of the outward current evoked by a small depolarizing step depended upon the resonant frequency, f0, of the hair cell, and were slower in low-frequency cells. On repolarization to the resting potential the current decayed exponentially with a time constant that changed from 150 ms in the lowest- frequency cell to less than 1 ms in the highest-frequency one. The time constant was approximately proportional to 1/f02. 5. Following repolarization to different membrane potentials, the tail current was found to reverse around -80 mV. indicating that the outward current was due mainly to K+. 6. The outward current was abolished by extracellular application of 25 mM- tetraethylammonium chloride (TEA), or on exchange of Cs+ for K+ in the intracellular medium filling the recording electrode, each experiment supporting the contention that K+ is the major current carrier. Such treatments also removed the oscillations in membrane potential evoked by imposed current steps. 7. Addition of TEA or intracellular perfusion with Cs+ also revealed a fast inward current with an ionic sensitivity consistent with its being carried by Ca2+. Like the * Present address: Department of Pharmacological and Physiological Sciences, University of Chicago, Chicago, IL 60637, L'.S.A. ) by guest on July 10, 2011 jp.physoc.org Downloaded from J Physiol (

Welcome message from author
This document is posted to help you gain knowledge. Please leave a comment to let me know what you think about it! Share it to your friends and learn new things together.
Transcript

J. Physiol. (1987). 385, pp. 207-242 207With 1 plate and 19 text-figuresPrinted in Great Britain
VARIATION OF MEMBRANE PROPERTIES IN HAIR CELLS ISOLATEDFROM THE TURTLE COCHLEA
BY J. J. ART* AND R. FETTIPLACEFrom the Physiological Laboratory, University of Cambridge, Cambridge CB2 3EG
(Received 1 July 1986)
SUMMARY
1. Hair cells were enzymatically isolated from identified regions of the turtlebasilar papilla and studied with the patch-electrode technique. The experimental aimwas to relate the resonance properties seen during current injection to the membranecurrents measured in the same cell under whole-cell voltage clamp.
2. Solitary hair cells had resting potentials of about -50 mV, and produced adamped oscillation in membrane potential at the onset and termination of a smallcurrent step; the resonant frequency varied from 9 to 350 Hz between cells, and wascorrelated with the region of papilla from which a cell had been isolated. The inferredfrequency map was consistent with the tonotopic arrangement described previouslyin the intact papilla.
3. Depolarizations from the resting potential under voltage clamp activated a largenet outward current with a steep voltage dependence, and the steady-state current-voltage relationship was strongly rectified about the resting potential. Inputresistances tended to be smaller in cells with higher resonant frequencies, althoughthere was no concurrent variation in membrane area as inferred from the cellcapacitance.
4. The kinetics of the outward current evoked by a small depolarizing stepdepended upon the resonant frequency, f0, of the hair cell, and were slower inlow-frequency cells. On repolarization to the resting potential the current decayedexponentially with a time constant that changed from 150 ms in the lowest-frequency cell to less than 1 ms in the highest-frequency one. The time constant wasapproximately proportional to 1/f02.
5. Following repolarization to different membrane potentials, the tail current wasfound to reverse around -80 mV. indicating that the outward current was duemainly to K+.
6. The outward current was abolished by extracellular application of 25 mM-tetraethylammonium chloride (TEA), or on exchange ofCs+ for K+ in the intracellularmedium filling the recording electrode, each experiment supporting the contentionthat K+ is the major current carrier. Such treatments also removed the oscillationsin membrane potential evoked by imposed current steps.
7. Addition of TEA or intracellular perfusion with Cs+ also revealed a fast inwardcurrent with an ionic sensitivity consistent with its being carried by Ca2+. Like the
* Present address: Department of Pharmacological and Physiological Sciences, University ofChicago, Chicago, IL 60637, L'.S.A.
) by guest on July 10, 2011jp.physoc.orgDownloaded from J Physiol (
J. J. ART AND R. FETTIPLACE
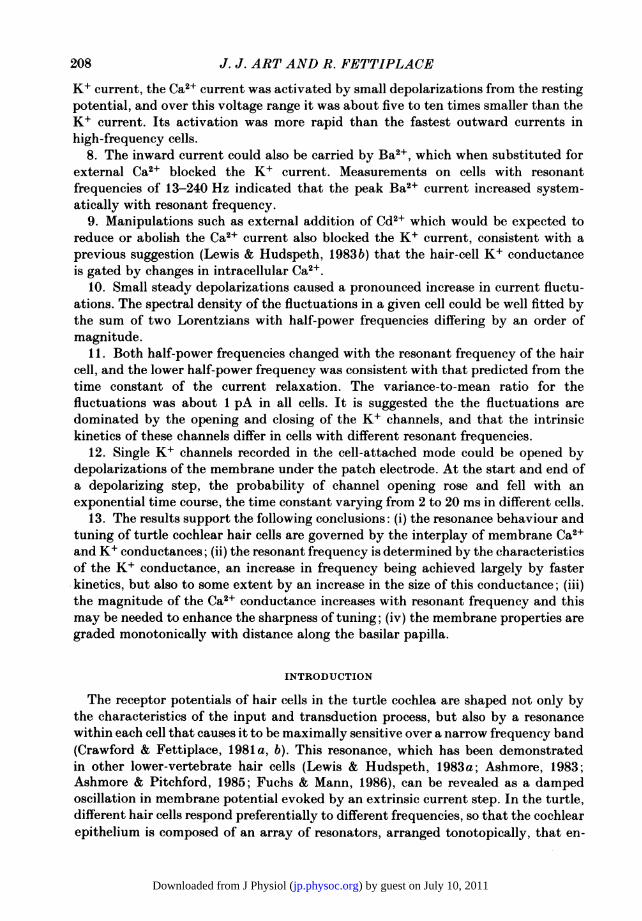
K+ current, the Ca2+ current was activated by small depolarizations from the restingpotential, and over this voltage range it was about five to ten times smaller than theK+ current. Its activation was more rapid than the fastest outward currents inhigh-frequency cells.
8. The inward current could also be carried by Ba2+, which when substituted forexternal Ca2+ blocked the K+ current. Measurements on cells with resonantfrequencies of 13-240 Hz indicated that the peak Ba2+ current increased system-atically with resonant frequency.
9. Manipulations such as external addition of Cd2+ which would be expected toreduce or abolish the Ca2+ current also blocked the K+ current, consistent with aprevious suggestion (Lewis & Hudspeth, 1983b) that the hair-cell K+ conductanceis gated by changes in intracellular Ca2+.
10. Small steady depolarizations caused a pronounced increase in current fluctu-ations. The spectral density of the fluctuations in a given cell could be well fitted bythe sum of two Lorentzians with half-power frequencies differing by an order ofmagnitude.
11. Both half-power frequencies changed with the resonant frequency of the haircell, and the lower half-power frequency was consistent with that predicted from thetime constant of the current relaxation. The variance-to-mean ratio for thefluctuations was about 1 pA in all cells. It is suggested the the fluctuations aredominated by the opening and closing of the K+ channels, and that the intrinsickinetics of these channels differ in cells with different resonant frequencies.
12. Single K+ channels recorded in the cell-attached mode could be opened bydepolarizations of the membrane under the patch electrode. At the start and end ofa depolarizing step, the probability of channel opening rose and fell with anexponential time course, the time constant varying from 2 to 20 ms in different cells.
13. The results support the following conclusions: (i) the resonance behaviour andtuning of turtle cochlear hair cells are governed by the interplay of membrane Ca2+and K+ conductances; (ii) the resonant frequency is determined by the characteristicsof the K+ conductance, an increase in frequency being achieved largely by fasterkinetics, but also to some extent by an increase in the size of this conductance; (iii)the magnitude of the Ca2+ conductance increases with resonant frequency and thismay be needed to enhance the sharpness of tuning; (iv) the membrane properties aregraded monotonically with distance along the basilar papilla.
INTRODUCTION
The receptor potentials of hair cells in the turtle cochlea are shaped not only bythe characteristics of the input and transduction process, but also by a resonancewithin each cell that causes it to be maximally sensitive over a narrow frequency band(Crawford & Fettiplace, 1981 a, b). This resonance, which has been demonstratedin other lower-vertebrate hair cells (Lewis & Hudspeth, 1983a; Ashmore, 1983;Ashmore & Pitchford, 1985; Fuchs & Mann, 1986), can be revealed as a dampedoscillation in membrane potential evoked by an extrinsic current step. In the turtle,different hair cells respond preferentially to different frequencies, so that the cochlearepithelium is composed of an array of resonators, arranged tonotopically, that en-
208
) by guest on July 10, 2011jp.physoc.orgDownloaded from J Physiol (
MEMBRANE CONDUCTANCES IN HAIR CELLS
compasses the animal's audible range from about 30 to 700 Hz (Crawford &Fettiplace, 1980). An important question is what factors change with positionalong the epithelium to produce the distribution of resonant frequencies.
It was originally proposed (Crawford & Fettiplace, 1981 a) that the resonance wasa consequence of time- and voltage-dependent conductances in the hair-cellmembrane, and that specifically a voltage-sensitive K+ conductance could confer onthe hair cell the necessary inductive properties (Detwiler, Hodgkin & McNaughton,1980), which when coupled with the membrane capacitance would generate reson-ance. Subsequently, the membrane currents of isolated hair cells were examined undervoltage clamp (Lewis & Hudspeth, 1983b; Ohmori, 1984), and two major currentsactivated close to the resting potential were described: an inward current thoughtto be carried by Ca2+, and an outward current believed to be a Ca2+-activated K+current (Lewis & Hudspeth, 1983b; Ohmori, 1984). That these two currents, alongwith a membrane capacitance, would be sufficient to account for the hair-cellresonance has been established by reconstructing the oscillatory responses to currentpulses (Lewis, 1985). This was done for a single resonant frequency by devising akinetic scheme to describe the behaviour of the two currents under voltage clamp,and then using this scheme to predict the voltage changes to current steps. It is worthnoting that the combination of a Ca2+ and a Ca2+-activated K+ conductance is alsothought to underlie the very low-frequency oscillatory behaviour of some inverte-brate neurones (e.g. Gorman, Hermann & Thomas, 1982).The primary goal of the present work was to define the conductances responsible
for resonance in turtle hair cells and ascertain how these conductances varied withthe frequency to which the cells were maximally sensitive. Possible variables includethe size and kinetics of the respective conductances, the speed of Ca2+ buffering withinthe cytoplasm (which could in turn limit the kinetics of activation of the K+ conduc-tance), or the cellular dimensions. The turtle cochlea is particularly suitable for suchexperiments since cells of a given resonant frequency can be selected according totheir position along the basilar papilla (Crawford & Fettiplace, 1980). Cells couldtherefore be isolated from different regions, and by using patch-electrode techniques(Hamill, Marty, Neher, Sakmann & Sigworth, 1981), it was possible to measuremembrane currents in cells with a broad range of resonant frequencies. The mainconclusion from these experiments is that while several factors change, the mostimportant one appears to be the speed of the K+ conductance which varies over twoorders of magnitude and may thus be the major determinant of resonant frequency.Preliminary accounts of some of the results have already been published (Art,Crawford & Fettiplace, 1986 a, b).
METHODS
PreparationExperiments were performed on hair cells isolated from the cochlea of the turtle Pseudemys scripta
elegans (carapace lengths 80-120 mm). The cochlear duct and lagena were dissected out and bathedin an artificial perilymph (Table 1) containing the peptidase subtilisin BPN' (Sigma, 30 ,tg/ml),and the cochlea opened and pinned to the bottom of a dissociation chamber. After 20 min, thetectorial membrane was peeled from the underlying epithelium. Hair cells were isolated enzy-matically using a procedure developed in collaboration with Paul Fuchs which was similar to thatpreviously applied to frog saccular hair cells (Lewis & Hudspeth, 1983b). The basilar papilla was
209
) by guest on July 10, 2011jp.physoc.orgDownloaded from J Physiol (
J. J. ART AND R. FETTIPLACE
superfused with a low-Ca2l (01 mM) perilymph to which had been added 05 mg papain/ml(Calbiochem), 01 mg bovine serum albumin/ml (BSA, Sigma) and L-cysteine to yield a concen-tration of 2-5 mm. During enzymatic digestion, the epithelium was loosened by undercuttingsuccessive supporting cells with a sharpened tungsten wire. After 25-30 min exposure, thepapain-rich medium was replaced by several changes of low-Ca2+ solution containing 0-2 mgBSA/ml, which after a further 10-s15 min was exchanged for a solution of normal ionic compositionwith the same BSA concentration.The papilla was then divided transversely into quarters (see Fig. 2), and the cells harvested from
each region a few rows at a time by gentle aspiration into a pipette whose opening had been firepolished to an internal diameter of 100-250,um. The cells were plated into normal perilvmph in oneof four glass recording chambers. Both the cover-slips which formed the bottom of these chambers,and the transfer pipettes had been pre-treated with tri-N-butyl-chlorosilane (Pfaltz & Bauer) toprevent cell adhesion. Cells were subsequently allowed to settle for up to 45 min before recordingcommenced. In some later experiments, cells were pooled into fewer than four recording dishes. Allexperiments were performed on the stage of a Zeiss IM-35 inverted microscope equipped withNomarski differential interference contrast optics (total magnification, 1000 x ) at room tempera-ture (21-26°C).
Hair cell morphologyThe best recordings were from cells the ciliarv bundles of which were intact and perpendicular
to the apical surface of the cuticular plate. Such cells retained their morphology for 4 h afterisolation, an example being shown in Pl. 1. The majority of cells examined were from the centralregion of the basilar papilla, the portion supported by the flexible basilar membrane. Difficultiesassociated with dissecting and isolating cells on the limbus in the hook region (see Miller, 1978,and diagram of cochlea in Fig. 2), near the junction of the cochlear duct with the saccule, precludeda systematic study of this most basal area.A small variation in ciliary bundle height was observed with position along the basilar papilla,
the length of the tallest row of stereocilia decreasing from about 9 ,um at the apical end of thecochlear duct to 5,um at the basal end. Such a variation has been noted previously in the cochleasof other vertebrates (Lim, 1980; Tilney & Saunders, 1983). In the present experiments, we coulddemonstrate a relationship to the resonant frequency of a hair cell so that cells with the longestbundles had the lowest resonant frequencies, and those with the shortest bundles the highestresonant frequencies. Although we cannot assign a functional significance to the variation in bundleheight, it did serve as a useful index of both the expected frequency of a cell, and the region fromwhich it had been isolated.
Recording instrumentationWhen heat polished to an internal diameter of about 1 jim, soda-glass patch electrodes filled with
standard internal K+ solution (see Table 1) had resistances of 2-3 MQ. For whole-cell recordingin either current or voltage clamp (Hamill et al. 1981; Marty & Neher, 1983), the electrode wasconnected to a modified Yale MK V electrometer which had a 100 MQ feed-back resistor in thehead-stage, and a frequency boost circuit (Sigworth, 1983) to increase the band width of the currentmonitor to about 20 kHz. So as to allow ionic currents to be tape-recorded at maximumamplification, a circuit with a variable time constant and gain was driven by the voltage commandto the head-stage, and used to create a signal that matched the capacitive transient at the startand end of a voltage-clamp step. This signal was not fed back to the input, but was subtractedfrom the total current at the output stage of the amplifier, thereby removing the large transientcomponent. Both the difference signal and other data were stored on an FM tape recorder (bandwidth 0-8 kHz) for subsequent analysis.
Experimental procedureAfter sealing to the basolateral surface of a hair cell in voltage clamp, the electrometer was
switched to current clamp, and continuity with the cell interior was attained following slightsuction. The shunt resistance across the seal was normally between 1 and 10 GQ. The value of theresting potential was stored on an internal sample-and-hold circuit, and so it was possible later toswitch between current and voltage clamp and remain within 0 5 mV of the zero-current potential.The duration of recordings from most cells was typically 15 min.
210
) by guest on July 10, 2011jp.physoc.orgDownloaded from J Physiol (
MEMBRANE CONDUCTANCES IN HAIR CELLS
The resonant frequency of a hair cell was first determined from the damped oscillatory voltageresponses to small constant-current pulses (Fig. 1). In about a third of recordings, a steadydepolarizing current of 10-50 pA was added to decrease the membrane potential to a value wherethe cell would display symmetric oscillations at the onset and offset of the superimposed pulse. Theelectrometer was then switched into voltage clamp, and by hyperpolarizing the cell by 25-30 mVto where all voltage-sensitive conductance were turned off, the current in response to a 5 mV stepwas used to adjust the compensation for the series resistance in the electrode and to nullify thecapacity transient in the manner described above. The maintained response gave a measure of theleakage current. During later analysis, the net ionic current was obtained by subtracting from theraw averages a scaled version of this leakage current as well as any residual capacitive currentsnot removed by the nulling procedure.
Feed-back from the current monitor to the voltage command signal was used to compensate up
TABLE 1. Compositions of solutions (mm)
ExternalSolution NaCl KCI MgCI2 CaC12 BaCI2 Tris Cl TEA Cl
Normal 130 4 2-2 2-8TEA 105 4 2-2 2 8 25Ba21 130 4 5Tris 4 2-2 2-8 130K+ 134 2-2 28 -
InternalK(C CsCl MgCI2 EGTA
K+ 125 2-8 5 (K+ salt)Cs+ 125 2-8 5 (Na' salt)
In addition to the salts listed, all external solutions contained D-glucose (8 mM) and HEPES(5 mM) neutralized with NaOH to pH 7-6; all internal solutions contained Na2ATP (2-5 mM) andHEPES (5 mM) neutralized with KOH (K+ solution) or NaOH (Cs+ solution) to pH 7-2. In someexperiments, BAPTA was substituted for EGTA in the internal solution. The internal solutionswere used to fill the recording electrode during whole-cell recording. The high-K+ external solutionfilled the electrodes for single-channel recording.
to 70% of the total series resistance; the remaining 1 5-5 MQ resulted in average voltage-clamptime constants of about 35 ,us. The value for the uncompensated series resistance inferred from thecapacity transient (Marty & Neher, 1983) was used to correct the voltage-clamp potentials whenconstructing steady-state current-voltage relationships.
Repetitive voltage-clamp pulses were normally delivered at 10/s, though the rate was oftenslowed to I /s to examine the Ca2+ current. Fatigue of the Ca2+ current was sometimes noted, andalthough we did not examine this in detail, it may be related to properties reported for some otherpreparations, where inactivation of the Ca2+ current is thought to result from accumulation ofintracellular Ca2+ (Ashcroft & Stanfield, 1982; Eckert & Chad, 1984). The fatigue was not evidentin the net currents recorded at 10/s.
SolutionsThe compositions of external bath and internal pipette solutions are listed in Table 1. EGTA
or occasionally BAPTA (1,2-bis(o-aminophenoxy)ethane-N,N,N',N'-tetraacetic acid, BDH) wasincluded in the internal solution to give a free Ca2+ concentration of less than 10-8 M, and Na2ATP(Boehring-Mannheim) was added to try to maintain the Ca2+ current. In the final experiments,tetraethylammonium chloride (TEA) bought from Aldrich was used. TEA salts from Fluka, Fisonsand Sigma were also tried but gave very small or variable Ca2+ currents, and furthermore two ofthese salts had a detectable amine smell. It has been suggested (Zucker, 1981) that this impuritycan alter the intracellular Ca2+ buffering which might in turn affect the membrane conductancefor Ca2+.
All resting potentials have been corrected for the liquid junction potential measured between
211
) by guest on July 10, 2011jp.physoc.orgDownloaded from J Physiol (
J. J. ART AND R. FETTIPLACE
normal perilymph and the K+ intracellular solution, which made the real membrane potential 4 mVmore negative than the observed value. Experiments with Cs+-filled electrodes showed that theoutward membrane current, as well as the voltage oscillations to extrinsic current pulses which wereinitially recorded on obtaining the whole-cell configuration, disappeared within 30 s, suggestingthat the pipette solution quickly equilibrated with the cell interior.
Bath perfusionFor rapid exchange of the bathing solution in the vicinity of a particular cell, the perfusion
method of Krishtal & Pidoplichko (1980) was employed. A U-shaped glass capillary 250,m indiameter with a 200,um diameter hole in its bottom wall was positioned within a few hundredmicrometres of the cell under study. The influx and efflux of the tube were fed by a pair of peristalticpumps, the relative rates of which were initially adjusted so as to draw solution from the bath intothe tube. To superfuse a cell, the pump rates were electronically switched (Lamb, 1983), reducingthe efflux and increasing the influx, and the test solution was expelled into the bath. Though thistechnique minimized exposure of other cells to the test solution, in each recording chamber onlya single solution change was made when toxic chemicals such as Cd2+ or Ba2+ were applied.
Noise analysisAt each holding potential, current segments were low-pass filtered to prevent aliasing and
digitized at 01-2 ms intervals. The mean level was substracted from each segment, and theresulting 1024-point array was multiplied by a cosine-taper window (Bendat & Piersol, 1971, p.325), and transformed using an integer fast Fourier transform; the single-sided power spectrum(Gk) was computed from
2 hGk 0875 N lXk 2,
where k = 0, 1, 2 .... N -1 and values of Xk are the Fourier coefficients at the discrete frequencyvalues k/Nh with h the sample interval and N the number of data points. For each membranepotential, between 20 and 115 raw spectra were averaged. The spectrum due to the membranecurrent fluctuations was obtained by subtracting point-by-point the spectrum of the instru-mentation noise, which was estimated from the residual noise present at a holding potential ofabout -80 mV, where all voltage-sensitive conductances would be turned off.
Single-channel currentsSingle-channel currents were measured in the cell-attached mode (Hamill et al. 1981) using a List
EPC-7 electrometer with 10 kHz output filtering. Electrodes coated with Sylgard were polished to05,m internal diameter, and when filled with a high-K+ solution (Table 1) had resistances of5-10 MQ. Channel slope conductances were computed from stretches of data collected withmaintained depolarizations and hyperpolarizations. Ensemble estimates of the non-stationaryprobability of channel opening during a voltage step were computed as described bv Aldrich &Yellen (1983). For each sweep, all detectable opening and closing transitions were found and usedto generate a schematic record that had a value of 0 when the channel was closed and 1 when itwas open, and these idealized records were then averaged.
RESULTS
Resonant properties of isolated hair cellsThe majority of solitary hair cells displayed properties akin to those of cells in the
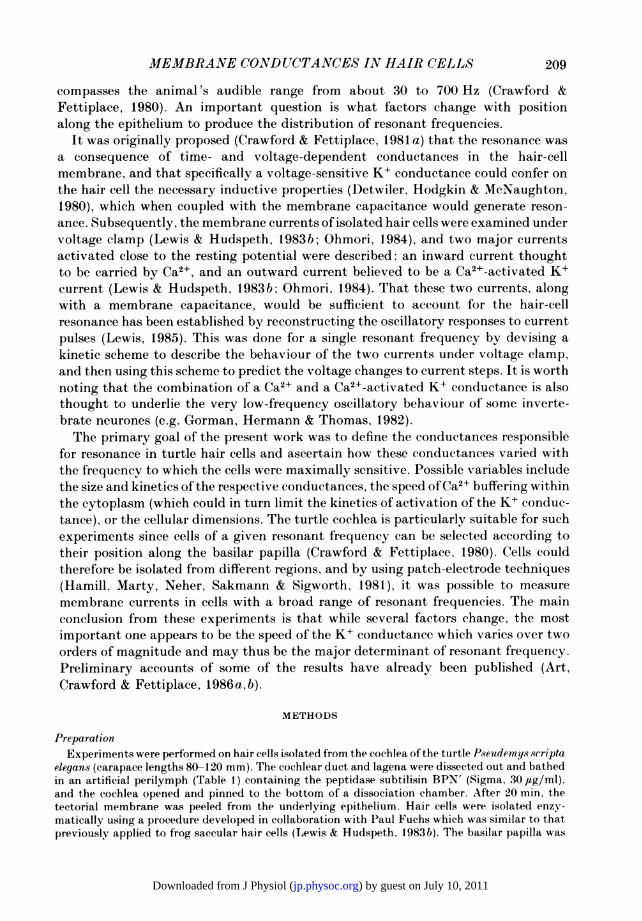
intact papilla, and in particular produced damped oscillations in membrane potentialat the onset and termination of an imposed current step. Examples of this resonantbehaviour can be seen in Fig. 1, which gives the oscillatory voltage responses of fivecells from different regions of the papilla. The frequency of the oscillations is givenbeside each averaged record and it is clear that a range of resonant frequencies was
obtainable. In the absence of deliberate stimulation, the membrane potential of an
isolated cell oscillated spontaneously at its resonant frequency, a phenomenon which
212
) by guest on July 10, 2011jp.physoc.orgDownloaded from J Physiol (
MEMBRANE CONDUCTANCES IN HAIR CELLS
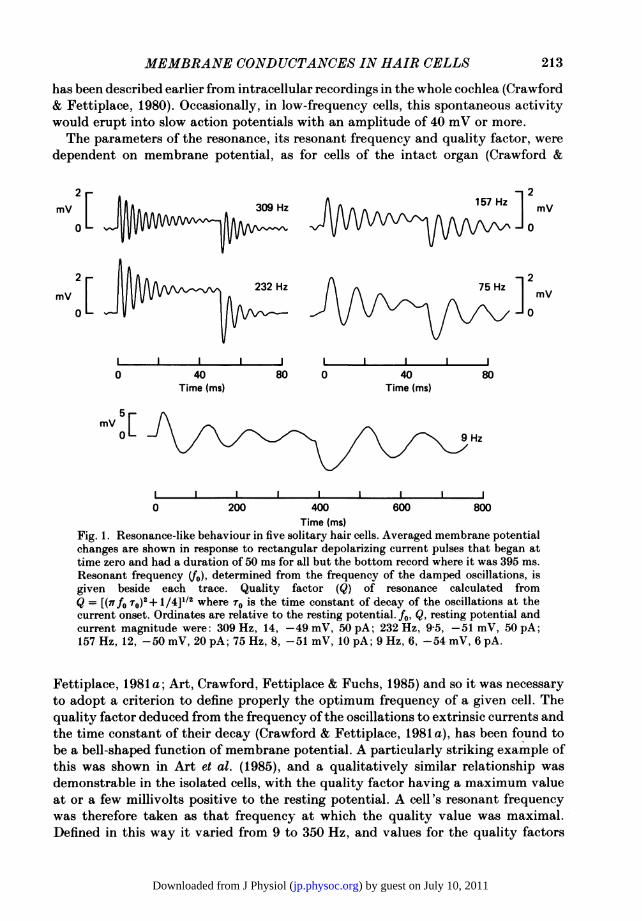
has been described earlier from intracellular recordings in the whole cochlea (Crawford& Fettiplace, 1980). Occasionally, in low-frequency cells, this spontaneous activitywould erupt into slow action potentials with an amplitude of 40 mV or more.The parameters of the resonance, its resonant frequency and quality factor, were
dependent on membrane potential, as for cells of the intact organ (Crawford &
2 21J\\ ]mmv 309 Hzi\2- ' 157Hz mv
[ ~~~~~~~~3z75Hz]:
0 40 80 0 40 80Time (ms) Time (ms)
5-mV
0: 9 Hz
0 200 400 600 800Time (ms)
Fig. 1. Resonance-like behaviour in five solitary hair cells. Averaged membrane potentialchanges are shown in response to rectangular depolarizing current pulses that began attime zero and had a duration of 50 ms for all but the bottom record where it was 395 ms.Resonant frequency (4o), determined from the frequency of the damped oscillations, isgiven beside each trace. Quality factor (Q) of resonance calculated fromQ = [(7Tfo To)2+ 1/4]1/2 where r0 is the time constant of decay of the oscillations at thecurrent onset. Ordinates are relative to the resting potential. f0, Q, resting potential andcurrent magnitude were: 309 Hz, 14, -49 mV, 50 pA; 232 Hz, 9-5, -51 mV, 50 pA;157 Hz, 12, -50 mV, 20 pA; 75 Hz, 8, -51 mV, 10 pA; 9 Hz, 6, -54 mV, 6 pA.
Fettiplace, 1981 a; Art, Crawford, Fettiplace & Fuchs, 1985) and so it was necessaryto adopt a criterion to define properly the optimum frequency of a given cell. Thequality factor deduced from the frequency ofthe oscillations to extrinsic currents andthe time constant of their decay (Crawford & Fettiplace, 1981 a), has been found tobe a bell-shaped function of membrane potential. A particularly striking example ofthis was shown in Art et al. (1985), and a qualitatively similar relationship wasdemonstrable in the isolated cells, with the quality factor having a maximum valueat or a few millivolts positive to the resting potential. A cell's resonant frequencywas therefore taken as that frequency at which the quality value was maximal.Defined in this way it varied from 9 to 350 Hz, and values for the quality factors
213
) by guest on July 10, 2011jp.physoc.orgDownloaded from J Physiol (
J. J. ART AND R. FETTIPLACE
of most cells lay between 5 and 31 (see legend to Fig. 1). Their resting potentialsranged from -41 to -61 mV (mean + S.D.,-51 + 4 mV; n = 35).A proportion of the cells were significantly hyperpolarized at rest with respect to
the membrane potential for peak quality factor. This was regarded as an abnormal
Basilar papilla
Apex j J /Base
1 00 Am
4 O00 0 00
3 - X o000
2 o00 0000 00
X 1 0 00o
0 100 200 300 400Resonant frequency (Hz)
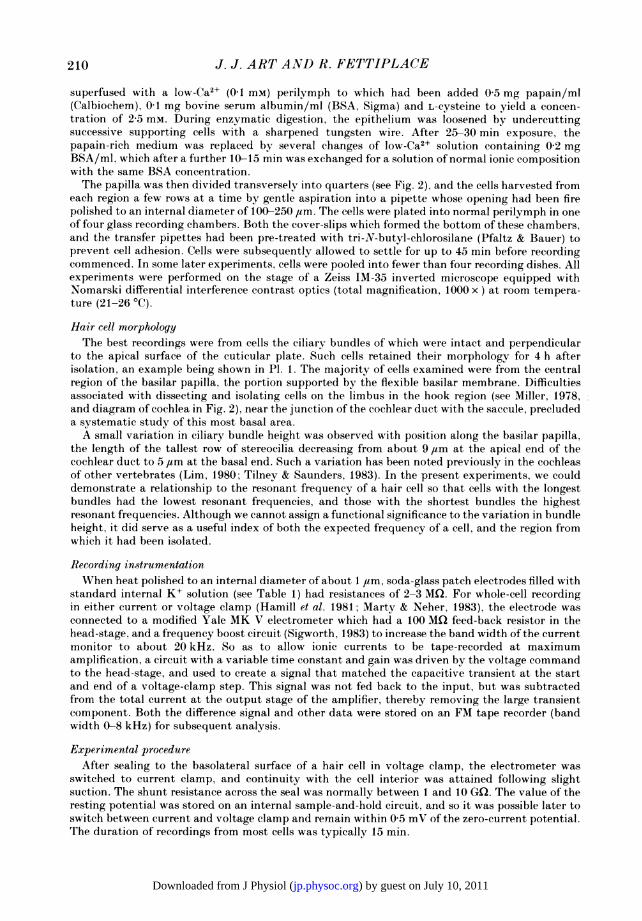
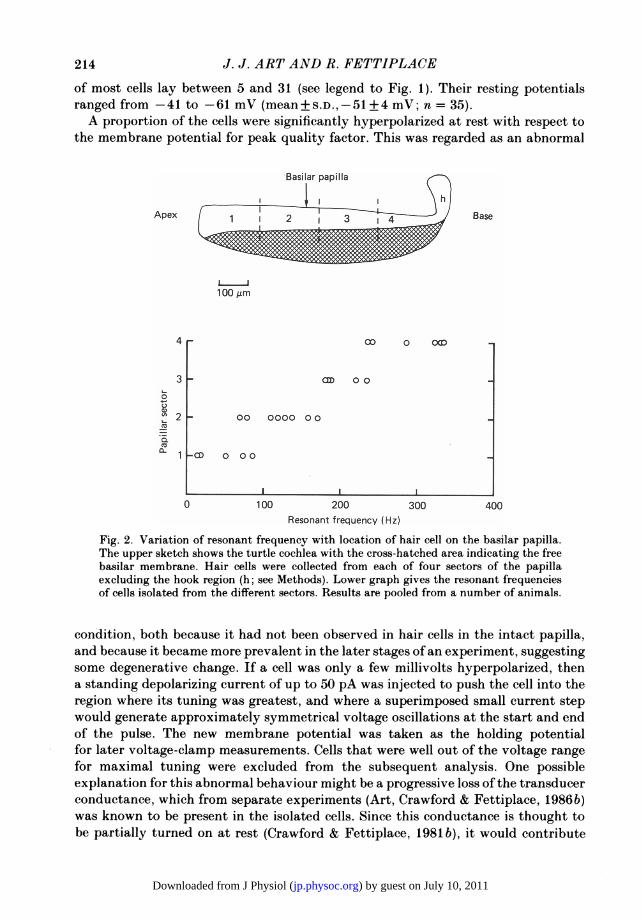
Fig. 2. Variation of resonant frequency with location of hair cell on the basilar papilla.The upper sketch shows the turtle cochlea with the cross-hatched area indicating the freebasilar membrane. Hair cells were collected from each of four sectors of the papillaexcluding the hook region (h; see Methods). Lower graph gives the resonant frequenciesof cells isolated from the different sectors. Results are pooled from a number of animals.
condition, both because it had not been observed in hair cells in the intact papilla,and because it became more prevalent in the later stages of an experiment, suggestingsome degenerative change. If a cell was only a few millivolts hyperpolarized, thena standing depolarizing current of up to 50 pA was injected to push the cell into theregion where its tuning was greatest, and where a superimposed small current stepwould generate approximately symmetrical voltage oscillations at the start and endof the pulse. The new membrane potential was taken as the holding potentialfor later voltage-clamp measurements. Cells that were well out of the voltage rangefor maximal tuning were excluded from the subsequent analysis. One possibleexplanation for this abnormal behaviour might be a progressive loss of the transducerconductance, which from separate experiments (Art, Crawford & Fettiplace, 1986b)was known to be present in the isolated cells. Since this conductance is thought tobe partially turned on at rest (Crawford & Fettiplace, 1981 b), it would contribute
214
) by guest on July 10, 2011jp.physoc.orgDownloaded from J Physiol (

MEMBRANE CONDUCTANCES IN HAIR CELLS
a standing inward current, and loss of the transducer would thus result in ahyperpolarization of the cell from its normal resting potential.
Tonotopic organizationPrevious studies (Crawford & Fettiplace, 1980; Art et al. 1986a) have shown that
the hair cells are arranged tonotopically in the turtle cochlea with the frequency ofmaximal sensitivity increasing roughly exponentially with distance from the lagenarend of the cochlear duct. To examine whether the resonant frequencies of isolatedcells matched their expected values in the intact cochlea, that portion of the papillaexcluding the most basal hook region (see Fig. 2) was divided into four sectors ofequallength, and cells were harvested from each sector into a separate experimental dish.The distribution of resonant ;frequencies for each of the four dishes is shown inFig. 2, the sectors being numbered sequentially from the lagenar end. It is evidentthat the dishes contained subsets of the frequency population, and the orientationof the map was correct with the lowest frequencies emanating from the papillar sectoradjacent to the lagena and the highest frequencies from that closest to the saccule.To obtain a quantitative assessment of the distribution of resonant frequencies inthe isolated cells, the frequencies at the transition from one sector to the next werecompared with those frequencies expected at the appropriate distances along thecochlea, i.e. at a quarter, a half and three-quarters of its length. From the data inFig. 2, transition frequencies of about 75, 175 and 235 Hz were inferred as comparedto 55, 140 and 290 Hz expected from the tonotopic organization in isolated papillarmeasurements (Art et al. 1986a); the latter had been made under comparable ionicconditions in cochleas of about the same size. The agreement between the two setsof numbers is reasonable considering the difficulty of reproducibly partitioning thepapilla during each dissociation, and therefore we have no reason to believe that thefrequency distribution observed in isolated cells is greatly different from that in theintact epithelium.
Net currents and current-voltage relationships of isolated cellsThe standard procedure for an experiment was initially to determine the resonant
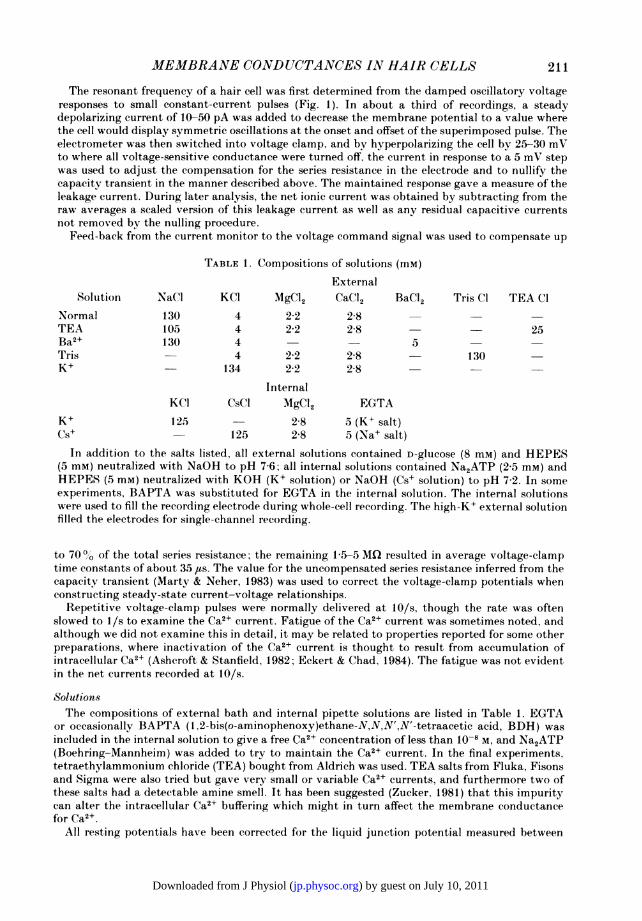
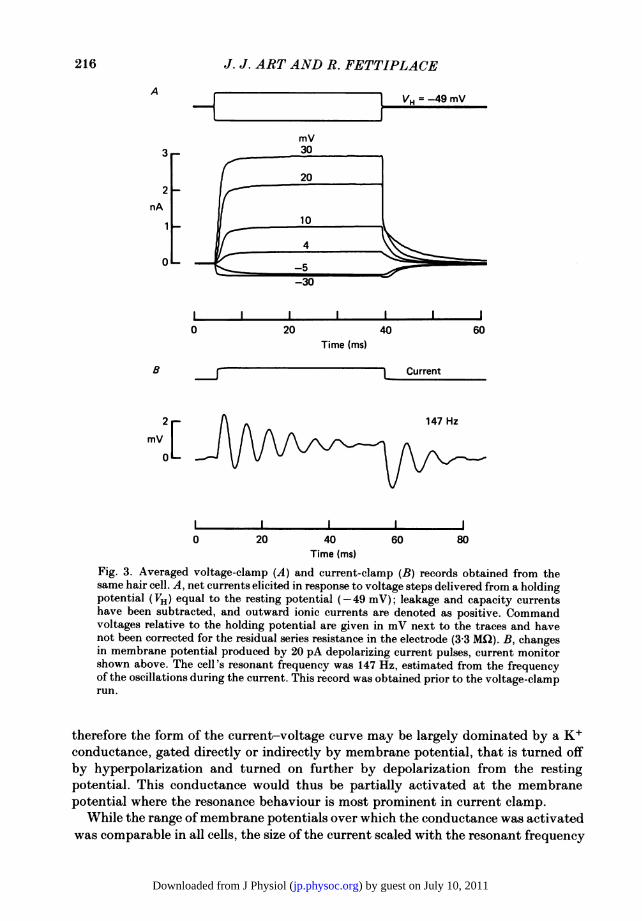
frequency of a cell and then switch to voltage clamp to measure the underlyingcurrents; the holding potential was normally the resting potential. Average mem-brane currents to a series of voltage-clamp steps are shown in Fig. 3, along with theoscillatory response to a current pulse recorded in the same cell. The records showthat with positive voltage steps, a maintained outward current developed, and itsmagnitude grew dramatically with increasing depolarization, reflecting a strongoutward rectification as reported previously (Corey & Hudspeth, 1979; Art et al.1985). Comparable hyperpolarizations elicited a more limited inward current.The rectification is evident in the steady-state current-voltage relationship, which
is plotted as the squares in Fig. 4A, along with measurements from three other cellswith a range of resonant frequencies. In each case, the clamp potentials have beencorrected for the uncompensated series resistance in the electrode. The shape of thecurrent-voltage relationship was found to be similar in all cells, being flat athyperpolarized levels and increasing its slope with depolarization through the restingpotential. As will be established later, the net current was carried mainly by K+, and
215
) by guest on July 10, 2011jp.physoc.orgDownloaded from J Physiol (
J. J. ART AND R. FETTIPLACE
mV30
20
10
4
-5-30
I I I I I II20 40 60
Time (ms)
l Current-F
147 Hz
I I I20 40
Time (ms)60
-880
Fig. 3. Averaged voltage-clamp (A) and current-clamp (B) records obtained from thesame hair cell. A, net currents elicited in response to voltage steps delivered from a holdingpotential (VH) equal to the resting potential (-49 mV); leakage and capacity currentshave been subtracted, and outward ionic currents are denoted as positive. Commandvoltages relative to the holding potential are given in mV next to the traces and havenot been corrected for the residual series resistance in the electrode (3 3 MQ2). B, changesin membrane potential produced by 20 pA depolarizing current pulses, current monitorshown above. The cell's resonant frequency was 147 Hz, estimated from the frequencyof the oscillations during the current. This record was obtained prior to the voltage-clamprun.
therefore the form of the current-voltage curve may be largely dominated by a K+conductance, gated directly or indirectly by membrane potential, that is turned offby hyperpolarization and turned on further by depolarization from the restingpotential. This conductance would thus be partially activated at the membranepotential where the resonance behaviour is most prominent in current clamp.
While the range of membrane potentials over which the conductance was activatedwas comparable in all cells, the size of the current scaled with the resonant frequency
216
A
3
2
nA
0
0
8
mV2_O _
0
mop.-
) by guest on July 10, 2011jp.physoc.orgDownloaded from J Physiol (
MEMBRANE CONDUCTANCES IN HAIR CELLS 217
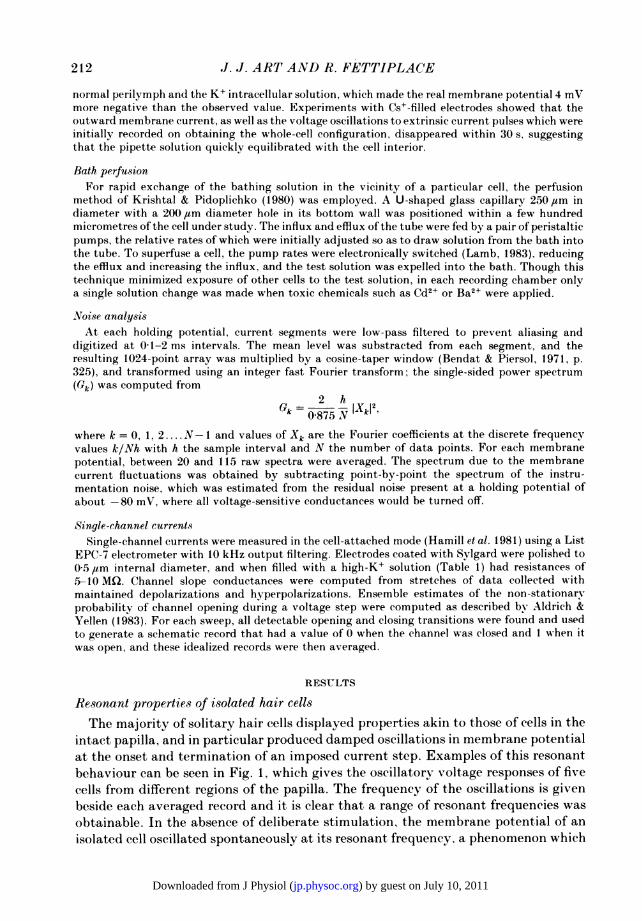
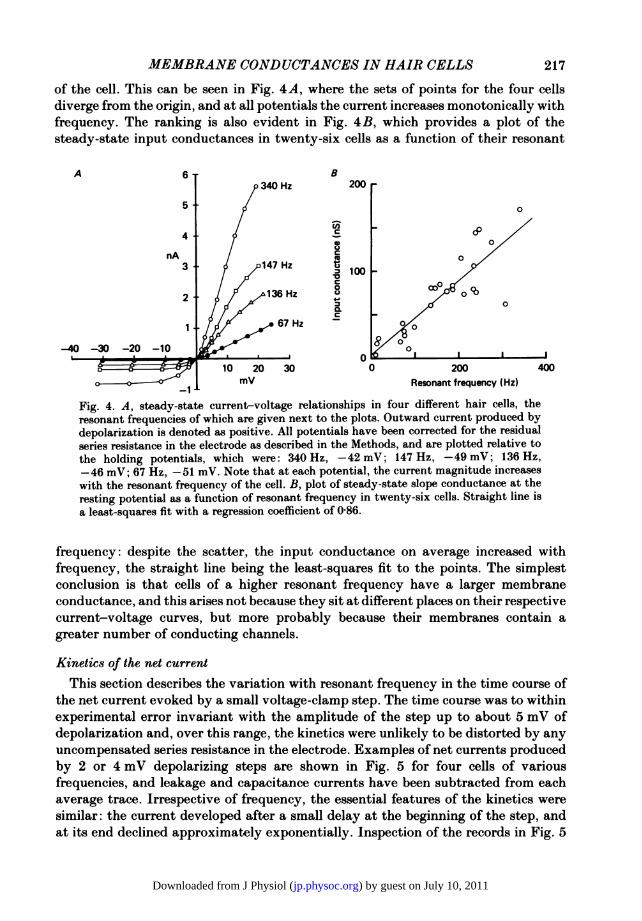
of the cell. This can be seen in Fig. 4A, where the sets of points for the four cellsdiverge from the origin, and at all potentials the current increases monotonically withfrequency. The ranking is also evident in Fig. 4B, which provides a plot of thesteady-state input conductances in twenty-six cells as a function of their resonant
A 6 B340 Hz 200
nA 0
C~~~~~~~C0
000
S
0 ~~00~~~~~~~
1 10 20 30 0 200 400
-1- mV Resonant frequency (Hz)
Fig. 4. A, steady-state current-voltage relationships in four different hair cells, theresonant frequencies of which are given next to the plots. Outward current produced bydepolarization is denoted as positive. All potentials have been corrected for the residualseries resistance in the electrode as described in the Methods, and are plotted relative tothe holding potentials, which were: 340 Hz, -42 mV; 147 Hz, -49 mV; 136 Hz,-46 mV; 67 Hz, -51 mV. Note that at each potential, the current magnitude increaseswith the resonant frequency of the cell. B, plot of steady-state slope conductance at theresting potential as a function of resonant frequency in twenty-six cells. Straight line isa least-squares fit with a regression coefficient of 0-86.
frequency: despite the scatter, the input conductance on average increased withfrequency, the straight line being the least-squares fit to the points. The simplestconclusion is that cells of a higher resonant frequency have a larger membraneconductance, and this arises not because they sit at different places on their respectivecurrent-voltage curves, but more probably because their membranes contain agreater number of conducting channels.
Kinetics of the net currentThis section describes the variation with resonant frequency in the time course of
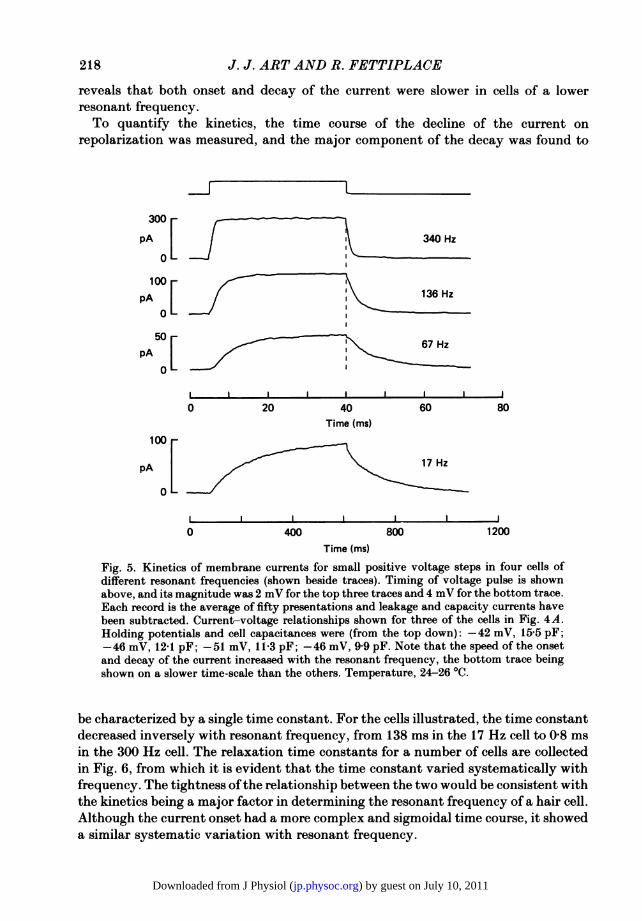
the net current evoked by a small voltage-clamp step. The time course was to withinexperimental error invariant with the amplitude of the step up to about 5 mV ofdepolarization and, over this range, the kinetics were unlikely to be distorted by anyuncompensated series resistance in the electrode. Examples of net currents producedby 2 or 4 mV depolarizing steps are shown in Fig. 5 for four cells of variousfrequencies, and leakage and capacitance currents have been subtracted from eachaverage trace. Irrespective of frequency, the essential features of the kinetics weresimilar: the current developed after a small delay at the beginning of the step, andat its end declined approximately exponentially. Inspection of the records in Fig. 5
) by guest on July 10, 2011jp.physoc.orgDownloaded from J Physiol (
218 J. J. ART AND R. FETTIPLACE
reveals that both onset and decay of the current were slower in cells of a lowerresonant frequency.To quantify the kinetics, the time course of the decline of the current on
repolarization was measured, and the major component of the decay was found to
r300 - -
pA [ X 340 Hz
O L
100=
pA [ , 136Hz
PA[ 67 HzpA5
0 20 40 60 80Time (ms)
loorl
pA [17 Hz
0 400 800 1200Time (ms)
Fig. 5. Kinetics of membrane currents for small positive voltage steps in four cells ofdifferent resonant frequencies (shown beside traces). Timing of voltage pulse is shownabove, and its magnitude was 2 mV for the top three traces and 4 mV for the bottom trace.Each record is the average of fifty presentations and leakage and capacity currents havebeen subtracted. Current-voltage relationships shown for three of the cells in Fig. 4A.Holding potentials and cell capacitances were (from the top down): -42 mV, 15.5 pF;-46 mV, 12-1 pF; -51 mV, 11-3 pF; -46 mV, 9 9 pF. Note that the speed of the onsetand decay of the current increased with the resonant frequency, the bottom trace beingshown on a slower time-scale than the others. Temperature, 24-26 0C.
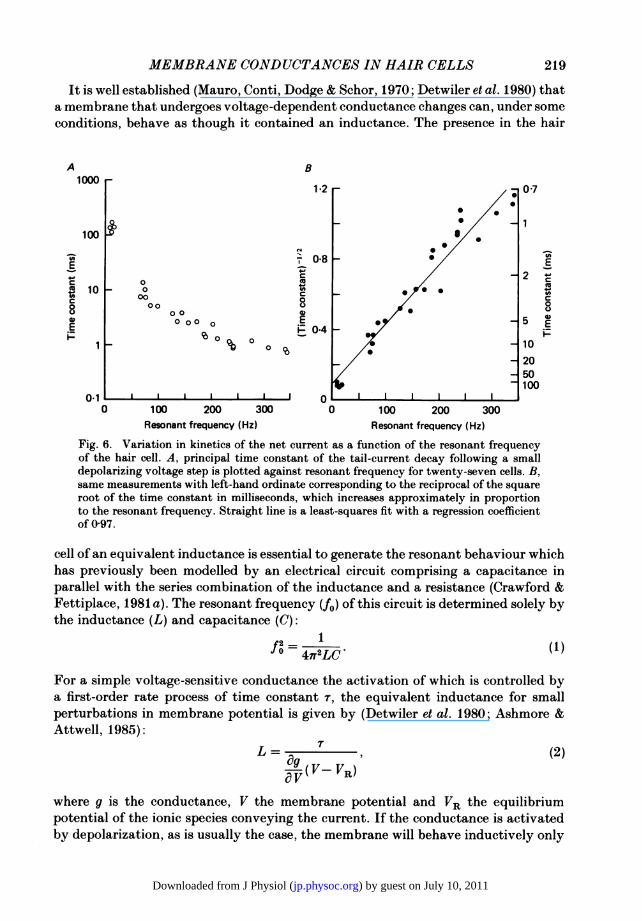
be characterized by a single time constant. For the cells illustrated, the time constantdecreased inversely with resonant frequency, from 138 ms in the 17 Hz cell to 0-8 msin the 300 Hz cell. The relaxation time constants for a number of cells are collectedin Fig. 6, from which it is evident that the time constant varied systematically withfrequency. The tightness ofthe relationship between the two would be consistent withthe kinetics being a major factor in determining the resonant frequency of a hair cell.Although the current onset had a more complex and sigmoidal time course, it showeda similar systematic variation with resonant frequency.
) by guest on July 10, 2011jp.physoc.orgDownloaded from J Physiol (
MEMBRANE CONDUCTANCES IN HAIR CELLS 219
It is well established (Mauro, Conti, Dodge & Schor, 1970; Detwiler et al. 1980) thata membrane that undergoes voltage-dependent conductance changes can, under someconditions, behave as though it contained an inductance. The presence in the hair
A B1000
1 *2 *0*7000 _
-a ; °°8 - X
E E ° t zc 0~~~~~~~~~~~~~~~~~~~~~
10 0 0c000~~~~~~~~.a
10 00000*0 0
~ ~ ~~ ~ ~ ~ ~ ~ ~ ~ ~ ~ ~ %~~Resonant f (fE 0E E
1 0%0 0 100Fig.6.Vaiaio i kneic o te etcuret s fncio oteesnatreuec
2050100
0 100 200 300 0 100 200 300Resonant frequency (Hz) Resonant frequency (Hz)
Fig. 6. Variation in kinetics of the net current as a function of the resonant frequencyof the hair cell. A, principal time constant of the tail-current decay following a smalldepolarizing voltage step is plotted against resonant frequency for twenty-seven cells. B,same measurements with left-hand ordinate corresponding to the reciprocal of the squareroot of the time constant in milliseconds, which increases approximately in proportionto the resonant frequency. Straight line is a least-squares fit with a regression coefficientof 097.
cell of an equivalent inductance is essential to generate the resonant behaviour whichhas previously been modelled by an electrical circuit comprising a capacitance inparallel with the series combination of the inductance and a resistance (Crawford &Fettiplace, 1981 a). The resonant frequency (fo) of this circuit is determined solely bythe inductance (L) and capacitance (C):
f2= 1I10 4rr2LC ( )
For a simple voltage-sensitive conductance the activation of which is controlled bya first-order rate process of time constant T, the equivalent inductance for smallperturbations in membrane potential is given by (Detwiler et al. 1980; Ashmore &Attwell, 1985):
L= 9 (2)(V_ VR)av
where g is the conductance, V the membrane potential and VR the equilibriumpotential of the ionic species conveying the current. If the conductance is activatedby depolarization, as is usually the case, the membrane will behave inductively only
) by guest on July 10, 2011jp.physoc.orgDownloaded from J Physiol (

J. J. ART AND R. FETTIPLACE
when the membrane potential is positive to the equilibrium potential. Thus duringa small depolarization, the current flowing through the voltage-sensitive channelsinitially increases with time and opposes the change in membrane potential.Combining eqns. (1) and (2) gives the relationship between the frequency of resonanceand the time constant with which the current is activated in voltage clamp:
ag (V- VR)4ir2CT (3)
In the absence of variations in parameters other than the time constant, theresonant frequency should be proportional to the reciprocal of the square root of thetime constant (rl). That this is approximately the case can be seen in Fig. 6B, wherethe results of Fig. 6A have been replotted with the reciprocal of the square root ofthe time constant on the ordinate.Although implying that a variation in the time constant may be sufficient to
account for the entire range of resonant frequencies, the analysis is clearly over-simplified. From the sigmoidal nature of the current onsets, the gating of theconductance cannot be completely described by first-order kinetics. Furthermore,the magnitude of this conductance exhibited some frequency dependence (seeFig. 4) although less pronounced than that of the time constant. However, the cell'smembrane capacitance, which may largely determine the capacitance in the equiv-alent circuit, showed no systematic trend with resonant frequency. For the cells ofFig. 6, it ranged from 9-9 to 15-5 pF (mean+s.D., 12-1 +1-7 pF; n = 26).
Tail current8
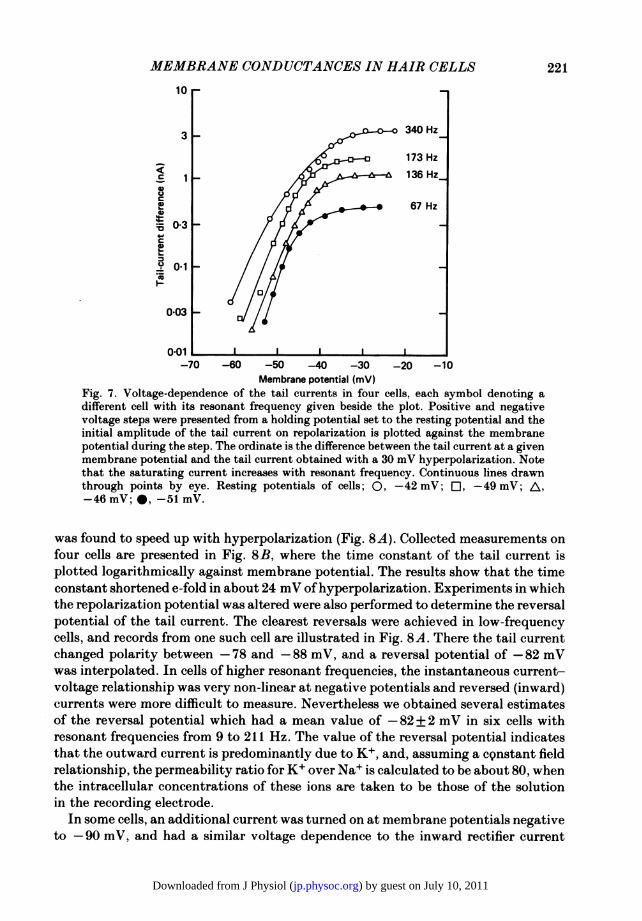
This section describes measurements of the tail currents at different membranepotentials, providing direct information about the voltage dependence of the majorconductance which we will show is due to K+. In Fig. 7 are plotted for four differentcells the amplitudes of the tail currents. These were derived by extrapolating theexponential current relaxation back to the break ofthe pulse. The measurements weremade on families of voltage-clamp records similar to those illustrated in Fig. 3, andare all for repolarizations to the resting potential. The currents are outward and areexpressed as the difference between the tail current at a given membrane potentialand the tail current obtained with a 30 mV hyperpolarization, at which potential thevoltage-sensitive conductance would be completely turned off. The tail current, whichshould be proportional to the fraction of channels activated at each membranepotential, had a similar voltage dependence in all cells, increased approximatelyexponentially around the resting potential and saturated at depolarized levels. Ascan be seen in Fig. 7, the saturated current increased systematically from 480 to3700 pA with the cell's resonant frequency, which is consistent with the notion thathigher-frequency cells had a larger conductance. From the limiting slopes at negativepotentials, we estimated that the current initially grew e-fold in 2-5 to 4-0 mV. Thesteep voltage dependence was a ubiquitous finding (mean+ S.D., 3-2 + 0-6 mV;n = 17) and has been predicted by earlier micro-electrode measurements (Art et al.1985).When the hair cell was repolarized to different potentials at the end of a positive
voltage step, the current relaxation, which still followed an exponential time course,
220
) by guest on July 10, 2011jp.physoc.orgDownloaded from J Physiol (
MEMBRANE CONDUCTANCES IN HAIR CELLS 221
10
3 340 Hz
173 Hz
C 1 136 Hz
67 Hz
9013
0-1
0*03-
0*01 I I I I I-70 -60 -50 -40 -30 -20 -10
Membrane potential (mV)Fig. 7. Voltage-dependence of the tail currents in four cells, each symbol denoting adifferent cell with its resonant frequency given beside the plot. Positive and negativevoltage steps were presented from a holding potential set to the resting potential and theinitial amplitude of the tail current on repolarization is plotted against the membranepotential during the step. The ordinate is the difference between the tail current at a givenmembrane potential and the tail current obtained with a 30 mV hyperpolarization. Notethat the saturating current increases with resonant frequency. Continuous lines drawnthrough points by eye. Resting potentials of cells; 0, -42 mV; Oi, -49 mV; A,-46 mV; , -51 mV.
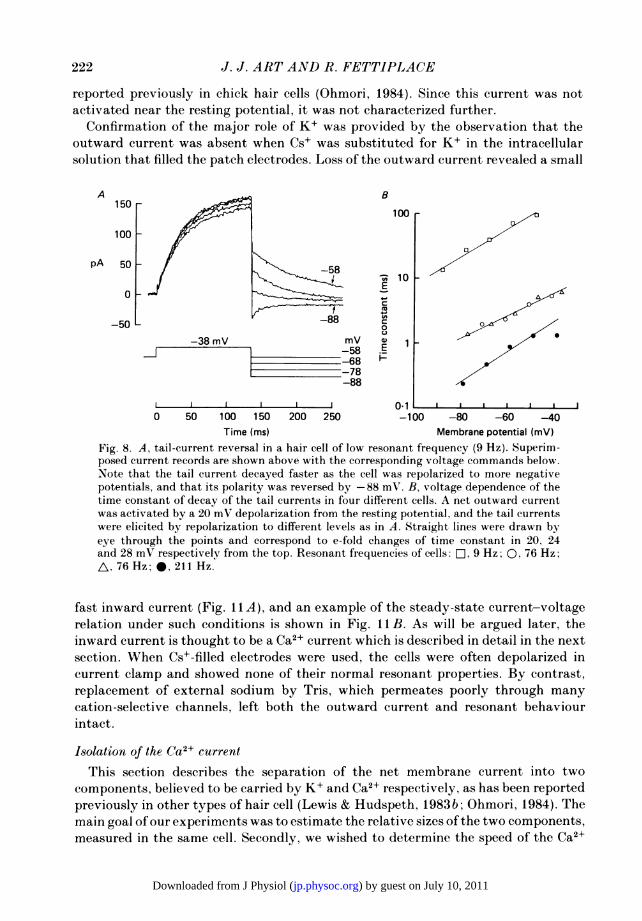
was found to speed up with hyperpolarization (Fig. 8A). Collected measurements onfour cells are presented in Fig. 8B, where the time constant of the tail current isplotted logarithmically against membrane potential. The results show that the timeconstant shortened e-fold in about 24 mV of hyperpolarization. Experiments in whichthe repolarization potential was altered were also performed to determine the reversalpotential of the tail current. The clearest reversals were achieved in low-frequencycells, and records from one such cell are illustrated in Fig. 8A. There the tail currentchanged polarity between -78 and -88 mV, and a reversal potential of -82 mVwas interpolated. In cells of higher resonant frequencies, the instantaneous current-voltage relationship was very non-linear at negative potentials and reversed (inward)currents were more difficult to measure. Nevertheless we obtained several estimatesof the reversal potential which had a mean value of -82 + 2 mV in six cells withresonant frequencies from 9 to 211 Hz. The value of the reversal potential indicatesthat the outward current is predominantly due to K+, and, assuming a constant fieldrelationship, the permeability ratio for K+ over Na+ is calculated to be about 80, whenthe intracellular concentrations of these ions are taken to be those of the solutionin the recording electrode.
In some cells, an additional current was turned on at membrane potentials negativeto -90 mV, and had a similar voltage dependence to the inward rectifier current
) by guest on July 10, 2011jp.physoc.orgDownloaded from J Physiol (
J. J. ART AND R. FETTJPLACE
reported previously in chick hair cells (Ohmori, 1984). Since this current was notactivated near the resting potential, it was not characterized further.
Confirmation of the major role of K+ was provided by the observation that theoutward current was absent when Cs+ was substituted for K+ in the intracellularsolution that filled the patch electrodes. Loss of the outward current revealed a small
A 8150-
100
100
10~~~~
E0 +A
-88
I I I 0-1 I I I I I l0 50 100 150 200 250 -100 -80 -60 -40
Time (ins) Membrane potential (mV)
Fig. 8. A, tail-current reversal in a hair cell of low resonant frequency (9 Hz). Superim-posed current records are shown above with the corresponding voltage commands below.Note that the tail current decayed faster as the cell was repolarized to more negativepotentials, and that its polarity was reversed by-88 mV. B, voltage dependence of thetime constant of decay of the tail currents in four different cells. A net outward currentwas activated by a 20 mV depolarization from the resting potential, and the tail currentswere elicited by repolarization to different levels as in A. Straight lines were drawn byeye through the points and correspond to e-fold changes of time constant in 20, 24and 28 mV respectively from the top. Resonant frequenc?ies of cells: D, 9 Hz; 0, 76 Hz;A, 76 Hz; *, 211 Hz.
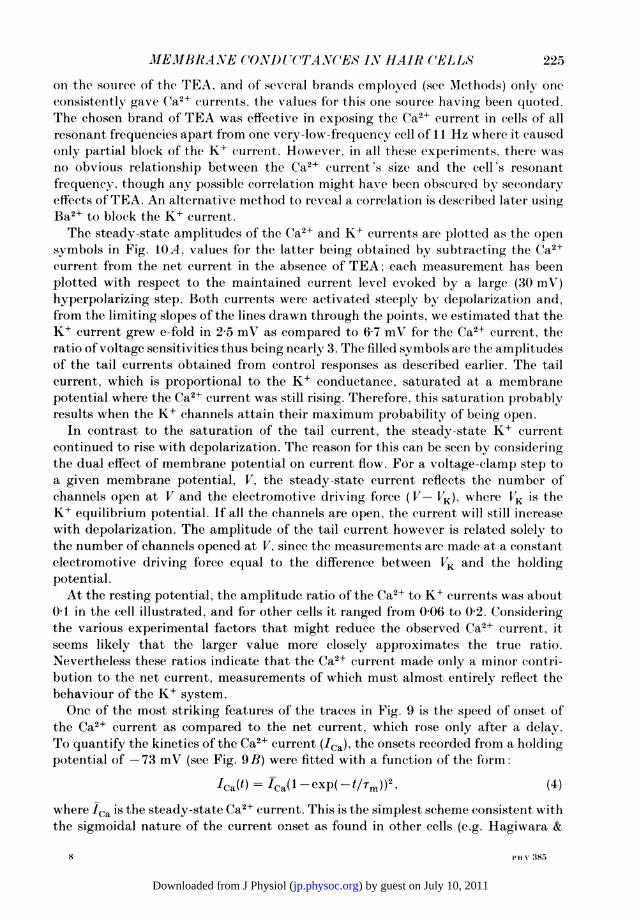
fast inward current (Fig. 11 A), and an example of the steady-state current-voltagerelation under such conditions is shown in Fig. ll B. As will be argued later, theinward current is thought to be a Ca2± current which is described in detail in the nextsection. When Cs+-filled electrodes were used, the cells were often depolarized incurrent clamp and showed none of their normal resonant properties. By contrast,replacement of external sodium by Tris, which permeates poorly through manycation-selective channels, left both the outward current and resonant behaviourintact.
Isolation of the Ca2+ currentThis section describes the separation of the net membrane current into two
components, believed to be carried by K+ and Ca2+ respectively, as has been reportedpreviously in other types of hair cell (Lewis & Hudspeth, 1983b; Ohmori, 1984). Themain goal of our experiments was to estimate the relative sizes of the two components,measured in the same cell. Secondly, we wished to determine the speed of the Ca2±
222
) by guest on July 10, 2011jp.physoc.orgDownloaded from J Physiol (

MEMBRANE CONDUCTANCES IN HAIR CELLS 223
current since this could conceivably limit the time course of the K+ current if thelatter were activated by Ca2+ influx. The Ca2+ current was unmasked on blockingthe K+ conductance by external application of 25 mM-TEA.
Average records showing the currents with and without TEA for a series ofvoltage-clamp steps from the resting potential are presented in Fig. 9A. The control
A B
VH =-47 mV VH =-73 mV
mV20 0 mV
2 _ / 15nA 10 -40 05
1 7~~~~~~~~pA4 -80
0 ~~~~~~~-20 -2 -48
nA -28~~~~~~~~~2-2+ 25 mM-TEA mV _0 -2O __ < = 4 _~~~~~40-4 X
-°.* 10 n-02A 15 -0.6-03L W ~320-08 -
a.*o , .
0 1 2 3 4 0 1 2 3Time (ms) Time (ms)
Fig. 9. Average membrane currents before (above) and during (below) external perfusionwith 25 mM-TEA. For each family, the cell was held at -47 mV and stepped to variouslevels, the change in potential being indicated in mV beside each trace. Leakage andcapacity currents have been subtracted, and the timing of the voltage step is shown above.Note that the net outward current evoked by depolarization for the control became inwardin the presence of TEA. Five to fifty presentations were averaged for controls and twoto five with TEA. The initial hump in the control records represents the instantaneouscomponent, the onset of which is smoothed due to filtering by the recording system. B,same cell as in A; membrane currents from a holding potential of -73 mV duringsuperfusion with TEA; absolute membrane potentials during step given next to traces.The current levels have been displaced vertically for display purposes but all had samestarting value. The superimposed smooth curves were calculated from an m2 relation(eqn. (4)) with Tm = 0-08 ms (-63 mV); 0-22 ms (-53 mV); 034 ms (-48 mV); 0-38 ms(-38 mV); 0-34 ms (-28 mV); 0-28 ms (-18 mV). Resonant frequency of hair cell,206 Hz. Temperature, 24 'C.
records (above) demonstrate the usual large outward current turned on by de-polarization. However, in the presence of TEA (below), the current became inwardfor positive steps and outward for negative steps; thus the current was activated inthe voltage range around the resting potential (-47 mV for the cell illustrated), andit increased with depolarization, attaining a maximum amplitude of 300 pA at about-20 mV. For further depolarization, its magnitude declined. This current was
) by guest on July 10, 2011jp.physoc.orgDownloaded from J Physiol (
J. J. ART AND R. FETTIPLACE
K' current
-40 -30 -20 -10Membrane potential (mV)
04r
0-3Ec
t 0-2C0C-)
0)
E
FP
* *F
mE
U Eu~N0*
*IF
*.i
0 1 1 Iv I
-70 -60 -50 -40 -30 -20 -10 0Membrane potential (mV)
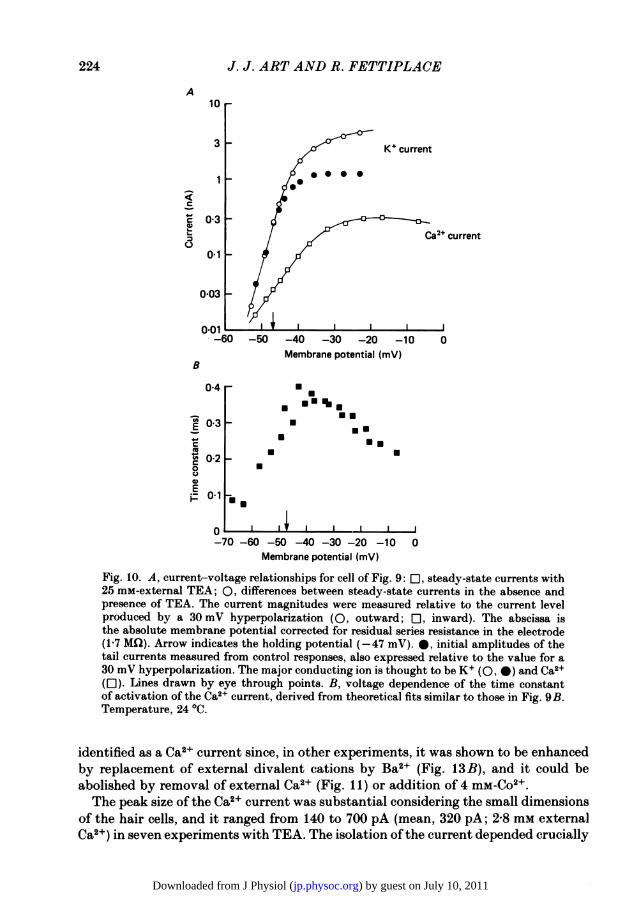
Fig. 10. A, current-voltage relationships for cell of Fig. 9: EO, steady-state currents with25 mM-external TEA; 0, differences between steady-state currents in the absence andpresence of TEA. The current magnitudes were measured relative to the current levelproduced by a 30 mV hyperpolarization (0, outward; rl, inward). The abscissa isthe absolute membrane potential corrected for residual series resistance in the electrode(17 MCI). Arrow indicates the holding potential (-47 mV). 0, initial amplitudes of thetail currents measured from control responses, also expressed relative to the value for a30 mV hyperpolarization. The major conducting ion is thought to be K+ (O, 0) and Ca2+(El). Lines drawn by eye through points. B, voltage dependence of the time constantof activation of the Ca2+ current, derived from theoretical fits similar to those in Fig. 9B.Temperature, 24 0C.
identified as a Ca2+ current since, in other experiments, it was shown to be enhancedby replacement of external divalent cations by Ba2+ (Fig. 13 B), and it could beabolished by removal of external Ca2+ (Fig. 11) or addition of 4 mM-Co2+.The peak size of the Ca2+ current was substantial considering the small dimensions
of the hair cells, and it ranged from 140 to 700 pA (mean, 320 pA; 2-8 mM externalCa2+) in seven experiments with TEA. The isolation of the current depended crucially
224
A0 r
3
1
c-
c
03 F
o01-Ca2+ current
0-03 I
-60 --60 -50
B
0
) by guest on July 10, 2011jp.physoc.orgDownloaded from J Physiol (
MXEIMBRA.NE CONI)DUC'TANC(ES IN HAIR CELLS
on the souirce of the TEA, and of several brands employed (see Methods) only oneconsistently gave Ca2± currents, the values for this one source having been quoted.The chosen brand of TEA was effective in exposing the Ca2+ current in cells of allresonant frequencies apart from one very-low-frequency cell of 11 Hz where it causedonly partial block of the K+ current. However, in all these experiments, there wasno obvious relationship between the Ca2+ current 's size and the cell's resonantfrequency. though any possible correlation might have been obscured by secondaryeffects of TEA. An alternative method to reveal a correlation is described later usingBa2+ to block the K+ current.The steady-state amplitudes of the Ca2+ and K+ currents are plotted as the open
symbols in Fig. IOA, values for the latter being obtained by subtracting the Ca2+current from the net current in the absence of TEA; each measurement has beenplotted with respect to the maintained current level evoked by a large (30 mV)hyperpolarizing step. Both currents were activated steeply by depolarization and,from the limiting slopes of the lines drawn through the points, we estimated that theK+ current grew e-fold in 2 5 mV as compared to 6-7 mV for the Ca2+ current, theratio of voltage sensitivities thus being nearly 3. The filled symbols are the amplitudesof the tail currents obtained from control responses as described earlier. The tailcurrent, which is proportional to the K+ conductance, saturated at a membranepotential where the Ca2+ current was still rising. Therefore, this saturation probablyresults when the K+ channels attain their maximum probability of being open.
In contrast to the saturation of the tail current, the steady-state K+ currentcontinued to rise with depolarization. The reason for this can be seen by consideringthe dual effect of membrane potential on current flow. For a voltage-clamp step toa given membrane potential, V, the steady-state current reflects the number ofchannels open at V and the electromotive driving force (V-VK), where VK is theK+ equilibrium potential. If all the channels are open, the current will still increasewith depolarization. The amplitude of the tail current however is related solely tothe number of channels opened at V, since the measurements are made at a constantelectromotive driving force equal to the difference between VK and the holdingpotential.At the resting potential, the amplitude ratio of the Ca2+ to K+ currents was about
0-1 in the cell illustrated, and for other cells it ranged from 0 06 to 0-2. Consideringthe various experimental factors that might reduce the observed Ca2+ current, itseems likely that the larger value more closely approximates the true ratio.Nevertheless these ratios indicate that the Ca2+ current made only a minor contri-bution to the net current, measurements of which must almost entirely reflect thebehaviour of the K+ system.One of the most striking features of the traces in Fig. 9 is the speed of onset of
the Ca2+ current as compared to the net current, which rose only after a delay.To quantify the kinetics of the Ca2+ current (lCa)' the onsets recorded from a holdingpotential of -73 mV (see Fig. 9B) were fitted with a function of the form:
ICa(t) = ICa(1-exp(t/Tm))2, (4)where ICa is the steady-state Ca2+ current. This is the simplest scheme consistent withthe sigmoidal nature of the current onset as found in other cells (e.g. Hagiwara &
225
8 PHN':385
) by guest on July 10, 2011jp.physoc.orgDownloaded from J Physiol (
226 J. J. ART AND R. FETTIPLACE
Ohmori, 1982). Eqn. (4) provided a good description of the rising phase of thecurrents in Fig. 9B, and, as in other preparations (Hagiwara & Ohmori, 1982;Fenwick, Marty & Neher, 1982) the inferred time constant, Tm, was found to bevoltage dependent (Fig. 10B). Its value near the resting potential was close to 0 3 ms,and therefore an order of magnitude smaller than the time constant of relaxation of
A 2-8 mM-Ca21
0 -34nA[_a-0-2_
nA[ -14
nA +-0-2_
L 110 50
Time (ms)
B
0 mM-Ca2l 2-8 mM-Ca2l
-34
-14
+6
0 50Time (ms)
0-1nA
-60 -40
-03
-14
91+6 r
0 50Time (ms)
K 40 60mV
o 2-8 mM-Ca21x 0 mM-Ca21A& 2-8 mM-Ca21
Fig. 11. Inward membrane currents recorded with a Cs+-filled electrode. A, singleexamples of currents during voltage clamp to the potential indicated beside each trace,before, during and after removal of 2-8 mm extracellular Ca2+. Capacitive currents havebeen subtracted. Holding potential, -74 mV. B, steady-state current-voltage relation-ships for the same cell in the presence (0, A) and absence ( x ) of 2-8 mm external Ca2+.Measurements made on records similar to those in A, and the controls are before and afterCa2+ removal. Abscissa is absolute membrane potential.
the K+ current, in this case 2 6 ms. Similar fast kinetics were observed in three othercells studied, also much faster than the relaxations of their respective K+ currents.
Ba2+ currents
Owing to the somewhat variable effects of using TEA, we looked for an alternativemethod of judging the size of the inward current in cells ofknown resonant frequency,and found that replacement of external divalent cations by Ba2+ would both abolish
) by guest on July 10, 2011jp.physoc.orgDownloaded from J Physiol (
MEXBRANE CONDUCTANCES IN HAIR CELLS 227
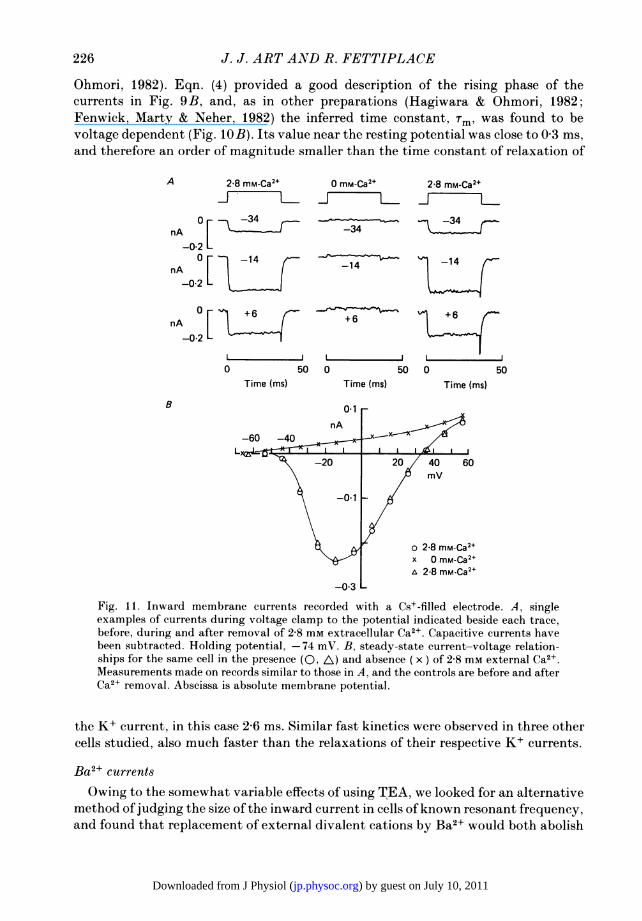
the K+ current and unveil the inward current. Examples of this manoeuvre are shownin Fig. 12 for two cells of quite different resonant frequencies, the lower-frequencyone being displayed on the left. In each case with Ba2+ substitution, the outwardcurrent was replaced by an inward current of comparable magnitude. Taking account
A -33 mV B -41 mV
VH =-73mV VH =-71 mV
1*5
0-4 r 1*0-2 FnA 5
nA 0 0-0-2 _____________-0*5
B2+ -1 0 lBa2+ lBa210-1*5
0 10 20 30 40 50 0 10 20 30 40 50Time (ms) Time (ms)
Fig. 12. Effects of replacing external divalent cations by 5 mM-Ba2+ in two hair cells. Foreach cell, the averaged currents with and without Ba2+ are shown for positive voltage stepsfrom a holding potential hyperpolarized to the resting potential, the absolute membranepotentials being indicated on the voltage monitors above each pair of records; leakageand capacity currents have been subtracted. Resting potentials and resonant frequenciesof cells were: -47 mV, 85 Hz (A); -59 mV, 240 Hz (B). Note that Ba2+ induced aninward current, and that both inward and outward currents were about five times largerin the higher frequency cell. The BaO+ currents displayed are close to maximal in eachcase. The patch electrode was filled with normal (high-K+) intracellular solution.
of the difference in scaling of the ordinates, it can be seen that both inward andoutward currents were about five times larger in the higher-frequency (240 Hz) cellthan in the lower-frequency (85 Hz) cell. For each of the experiments depicted theinward currents were close to maximal.The steady-state current-voltage relationship in the presence of Ba2+ is shown for
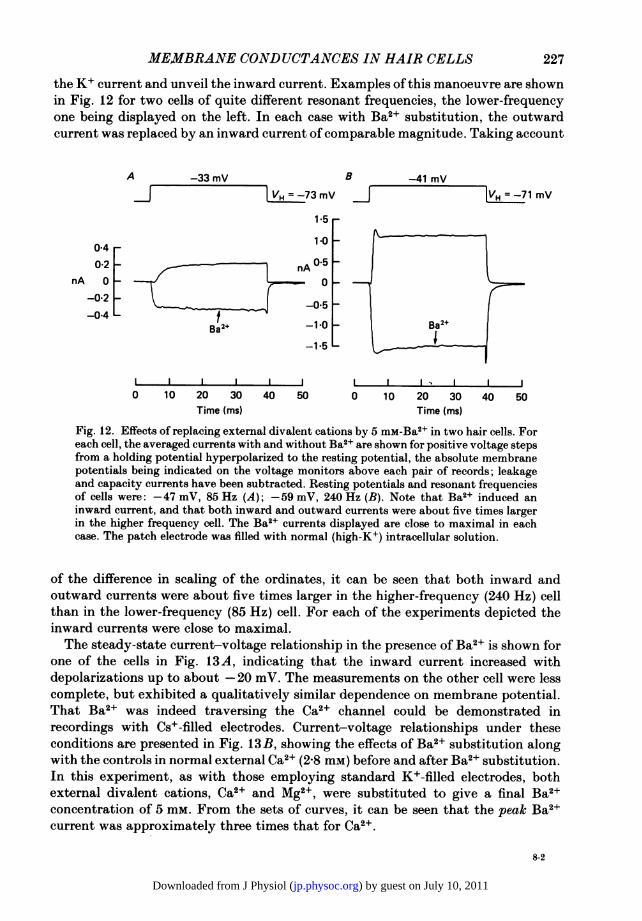
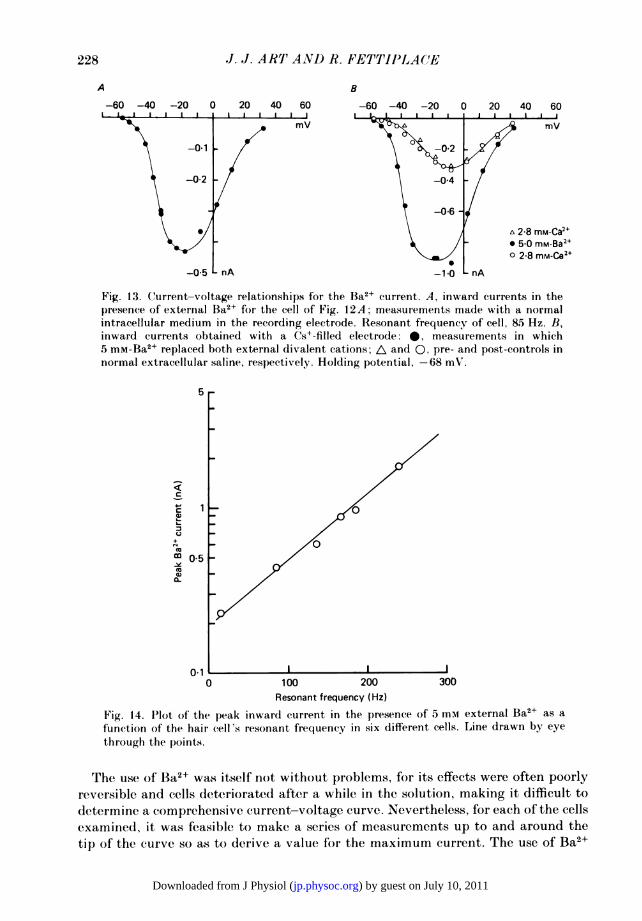
one of the cells in Fig. 13A, indicating that the inward current increased withdepolarizations up to about -20 mV. The measurements on the other cell were lesscomplete, but exhibited a qualitatively similar dependence on membrane potential.That Ba2+ was indeed traversing the Ca2+ channel could be demonstrated inrecordings with Cs+-filled electrodes. Current-voltage relationships under theseconditions are presented in Fig. 13B, showing the effects of Ba2+ substitution alongwith the controls in normal external Ca2+ (2-8 mM) before and after Ba2+ substitution.In this experiment, as with those employing standard K+-filled electrodes, bothexternal divalent cations, Ca2+ and Mg2+, were substituted to give a final Ba2+concentration of 5 mm. From the sets of curves, it can be seen that the peak Ba2+current was approximately three times that for Ca2+.
8-2
) by guest on July 10, 2011jp.physoc.orgDownloaded from J Physiol (
J. J. ART AND R. FETTIPLACE
A
-60 -40 -20 0 20 40 60B
-60 -40 -20
mV
20 40 60
A 2 8 mM-Ca2"* 5 0 mM-Ba2+o 2 8 mM-Ca2+
-0-5 L nA -1.0 LnA
Fig. 13. Current-voltage relationships for the Ba2+ current. A, inward currents in thepresence of external Ba2+ for the cell of Fig. 12A; measurements made with a normalintracellular medium in the recording electrode. Resonant frequency of cell, 8.5 Hz. B,inward currents obtained with a Cs+-filled electrode: 0, measurements in which5 mm-Ba2+ replaced both external divalent cations; A and 0, pre- and post-controls innormal extracellular saline, respectively. Holding potential, -68 mV.
5 r
C4-c
c)(U
m
(aCL)
0*5
0.10 100 200
Resonant frequency (Hz)300
Fig. 14. I'lot of the peakfunction of the hair cell'sthrough the points.
inward current in the presence of 5 mm external Ba2+ as a
resonant frequency in six different cells. Line drawn by eye
The use of Ba2± was itself not without problems, for its effects were often poorlyreversible and cells deteriorated after a while in the solution, making it difficult todetermine a comprehensive current-voltage curve. Nevertheless, for each of the cellsexamined, it was feasible to make a series of measurements up to and around thetip of the curve so as to derive a value for the maximum current. The use of Ba2+
228
) by guest on July 10, 2011jp.physoc.orgDownloaded from J Physiol (
MEMBRANE CONDUCTANCES IN HAIRCELLS29
abolished the outward K+ current in cells throughout the frequency range.Measurements of the peak Ba2+ c-urrent are plotted in Fig. 14 for six cells withresonant frequencies of 13-240 Hz, and the results show a clear systematic increaseof this current with resonant frequency. Using a ratio of 3 (Fig. 13B) for the relative
0*4rnA
0-4FnA
+ 500 /Am-CdCI2
4 mV step
0 20 40 60Time (ins)
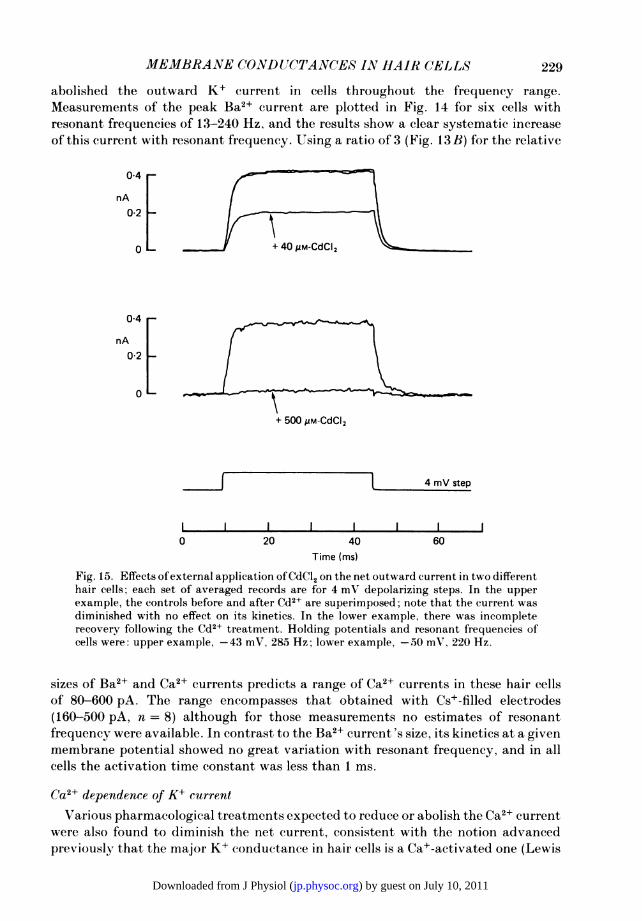
Fig. 15. Effects of external application of CdCl2 on the net outward current in two differenthair cells; each set of averaged records are for 4 mXV depolarizing steps. In the upperexample, the controls before and after Cd2+ are superimposed; note that the current wasdiminished with no effect on its kinetics. In the lower example, there was incompleterecovery following the Cd2+ treatment. Holding potentials and resonant frequencies ofcells were: upper example, -43 mV, 285 Hz; lower example, -.50 mV, 220 Hz.
sizes of Ba2+ and Ca2+ currents predicts a range of Ca2+ currents in these hair cellsof 80-600 PA. The range encompasses that obtained with Cs+-filled electrodes(160-500 PA, n = 8) although for those measurements no estimates of resonantfrequency were available. In contrast to the Ba2+ current 's size, its kinetics at a givenmembrane potential showed no great variation with resonant frequency, and in allcells the activation time constant was less than 1 ins.
Ca2+ dependence of K+ current
Various pharmacological treatments expected to reduce or abolish the Ca2+ currentwere also found to diminish the net current, consistent with the notion advancedpreviously that the major K+ conductance in hair cells is a Ca+-activated one (Lewis
229
) by guest on July 10, 2011jp.physoc.orgDownloaded from J Physiol (
J. J. ART AND R. FETTIPLACE
& Hudspeth, 1983b; Ohmori, 1984). Such treatments included removal of externalCa2+ or addition ofmillimolar quantities ofCo2+ or the more effective Cd2+. The effectsof two different concentrations of Cd2+ are shown in Fig. 15, the lower concentrationproducing a reversible reduction in the outward current, and the higher concentrationvirtually abolishing it. It is noteworthy that the low concentration of Cd2+ had noinfluence on the kinetics of the net current, here evoked by a small depolarizing step.In those experiments where the K+ current was abolished near the resting potentialit could be reactivated by larger depolarizing steps that took the membrane potentialpositive to 0 mV. This is usually interpreted as being due to the intrinsic voltagesensitivity of this type of K+ channel (Adams, Constanti, Brown & Clarke, 1982;Barrett, Magleby & Pallotta, 1982).None of these experiments rules out an external action of the divalent ions on the
K+ channel itself and it is necessary to show that direct manipulation of the internalCa2+ will influence the K+ conductance. Loss of the outward current could also beproduced by using BAPTA (Tsien, 1980) rather than EGTA as the Ca2+ chelator inthe intracellular medium. An advantage of BAPTA is that it has a more rapidequilibration than EGTA, and may thus be a more efficient buffer for internal Ca2+(Marty & Neher, 1985). Preliminary results showed that cells examined withelectrodes containing 5 mM-BAPTA displayed no outward current unless they weredepolarized beyond about -10 mV, suggesting that the K+ conductance is normallyactivated by a modulation in intracellular Ca2+. This conclusion might be moreproperly examined by perfusing the recording electrode with solutions of differentfree-Ca2+ concentrations buffered by BAPTA, but this was not attempted in thepresent study.
Current fluctuationsThe results so far indicate that of the two major currents flowing in the voltage
range around the resting potential, the K+ current is much the larger and its kineticsare a function of the resonant frequency of the hair cell. One approach tounderstanding the kinetic processes underlying the gating of the K+ channel is tocharacterize the fluctuations in current resulting from the statistical behaviour ofthese channels. Pronounced current fluctuations could be observed in all cells heldin voltage clamp at their resting potential, and the amplitude of the fluctuations wasincreased by depolarization and decreased by hyperpolarization to a potential wherethe K+ conductance would be turned off; the fluctuations were also greatlydiminished by application of TEA, implicating the K+ channels as their source.Examples of the noisiness of the current records are shown in Fig. 16A for two cellswhose resonant frequencies, given beside each set of traces, are widely spaced. Thelower trace of each pair is a sample of membrane current for a 4 mV steadydepolarization, and the upper trace is for a hyperpolarization of 25 mV, where theresidual activity mostly reflected the instrumentation noise. It is clear from theserecords that the fluctuations evoked during depolarization had a different spectralcomposition in the two cells, more high-frequency components being present in thehigher-frequency cell.The power spectral densities of the fluctuations are shown in Fig. 16B for these
two cells and one other. So as to clearly display the differences between the spectra,
230
) by guest on July 10, 2011jp.physoc.orgDownloaded from J Physiol (
MEMBRANE CONDUCTANCES IN HAIR CELLS
A75 Hz B
50 pA [ 1
241 Hz X
100pA[ ._ 001ICu
100 pA [
241 Hz
o-oo1 L,I I I I -.
JI ~~1 10 100 1000 5000
0 100 200 300 400 500 10(Hz)
Time (ins) ~~~~~~~~Frequency (Hz)Time (ms)
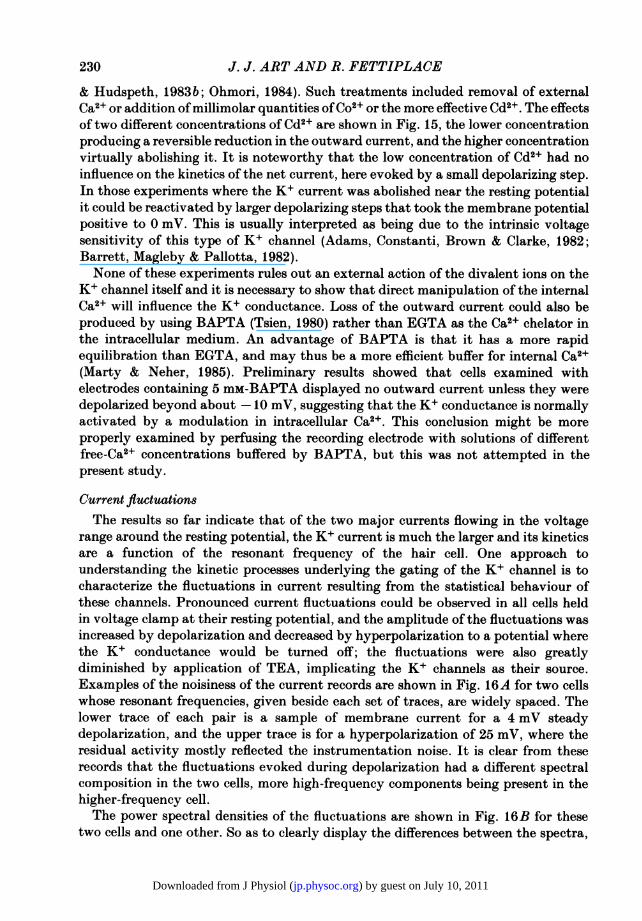
Fig. 16. A, membrane current fluctuations in two hair cells of different resonantfrequencies, indicated beside the traces. The upper record of each pair was obtained ata holding potential of about -80 mV, and the lower record at a holding potential 4 mVdepolarized to the resting potential. All traces filtered with an 8-pole Butterworth low-passfilter at 700 Hz. B, spectral densities of the current fluctuations in three cells, whoseresonant frequencies are given beside the plots. Each spectrum is the average of thedifference between the noise recorded at a holding potential 4 mV positive to the restingpotential and that recorded at about -80 mV, which is assumed to reflect the instru-mentation noise. The ordinates have been normalized to illustrate that the spectra havesimilar shapes but are shifted relative to one another along the frequency axis. Resonantfrequencies, ordinate scaling factors and number of averages were: 75 Hz, 4-5 x 10-24A2/Hz, 37; 206 Hz, 1-1 x 10-24 A2/Hz, 37; 241 Hz, 1-2 x 10-24 A2/Hz, 115. The digitizationintervals and anti-aliasing filter settings were different for the three spectra. The smoothcurves are each the sum oftwo Lorentzians calculated from eqn. (5) withf2/f1 = 10. Valuesof fi and S2(0)1S(0) were 19 Hz, 0-02; 88 Hz, 0-022; 300 Hz, 0-017. Temperature,21-24 °C.
the ordinates have been scaled to make the low-frequency powers comparable;normalizing factors are given in the legend. Each spectrum had a similar over-allform, was roughly flat at low frequencies and declined at higher frequencies with aslope of about (1/frequency)1 3. However, the frequency at which the roll-off beganincreased in proportion to the resonant frequency of the cell. The spectral densities(S) were found to be best fitted by the sum of two Lorentzian components, drawnas the smooth curves in Fig. 16B and calculated from:
Si(O) + SO()s= +(f/f)2 +(sf/f2)2 (5)
where f is frequency, S(°) and S2(0) are the zero frequency values of the twocomponents and fi and f2 are their respective corner frequencies. For each of thetheoretical curves f2/f1 was 10 and 52(S)/$1(0) was about 0-02. Similar spectra wereobtained in three other cells. The corner frequencies (fr) for the principal spectralcomponent are collected for six cells in Table 2, along with some of their otherproperties, including the time constant of the current relaxation. The values of the
LA.A
limI-W lqqT lir
231
) by guest on July 10, 2011jp.physoc.orgDownloaded from J Physiol (

J. J. ART AND R. FETTIPLAC(E
time constant were roughly comparable to the equivalent time constants (1/27f1)derive(l ftorn the noise analysis.The atnalysis of the fluctuations provides corroborative evidence for the idea that
a variation in resonant frequency is associated with changes in the kinetics of gating
TA BIE 2. Characteristics of current fluctuations
Cell
:34
6
Resonantfrequency
(Hz)a .)
145188206235241
Spectra
(z Ts(Hz) (ins)196412288
300323
84251 31 80(.0.5
RlelaxationT
(mis)10381 4261-110
20
(pA)0.991-130871 08063076
f1 is the corner frequency of the principal Lorentzian comp)onent of each hair cell's currentfluctuations; Ts= (2rf1)-l. T in column 5 measured from current relaxations to small positivevoltage steps; io is single-channel current estimated from variance-to-mean ratios.
200
0.
C.x 100
C
00 100
Mean current (pA)200
Fig. 17. Variance of the current fluctuations as a function of the meani current level intwo hair cells. The measurements were taken at a variety of membranie potentials from-2 to +5 mV relative to the resting potetntial. Both variance and imean of the currentare expressed relative to their values at a holding potential of about -80 mn. Straightline drawn by eye through the points has a slope of 1l06 pA. Resonant frequencies andresting potentials were; Q. 75 Hz. -53 mV; EL 206 Hz, -47 mtV.
of the K+ channel, and further suggests that more than one rate constant may bealtered between cells of different frequencies.Owing to the marked voltage dependence of the K+ conductanice, small voltage
excursions around the resting potential were associated with large changes ill thecurrent and its variance. A plot of the variaice against the niet current is presented
232
) by guest on July 10, 2011jp.physoc.orgDownloaded from J Physiol (
MEMBRANE CONDI 'CTANCNES IN HAIRCELLS23
for a pair of cells in Fig. 17. The measurements were derived from long voltage-clampsteps of -2 to +5 mV, and are referred to the current level and its variance at, aholding potential of about -80 mV. For each of the cells, the variance increased inproportion to the mean current, the straight line through the points having a slopeof 1 pA. Variance-to-mean ratios for the six cells are given in Table 2, and have anaverage value of 0-9 + 0 2 pA. On the assumption that the changes in driving forcefor the conducting ion are small over the voltage range for which the measurementswere taken, the variance (0.2) and mean current, (1) can be related by (Colquhoun &Hawkes, 1977): o-2 = Ji(1-p), (6)
where i is the current through a single K+ channel and p is the probability thatit is open; the linear relationship observed between o.2 and I implies that p wassmall, and thus the single-channel current, i, was about 1 pA to within experimentalerror in cells of all resonant frequencies. With a driving force of 30 mV. this currentcorresponds to a channel conductance of 33 pS. It must be noted that this channelsize may not apply to cells of the very lowest frequencies of 10-20 Hz, for which noisemeasurements were not obtained.The preceding analyses of the spectral composition of the fluctuations and the
current flowing through a single channel have ignored the contributions of the Ca2+current and have assumed that both the variance and the net current areoverwhelmingly dominated by the K+ current. The validity of this approximationcould be assessed for one of the cells (cell 4 in Table 2) for which measurements ofthe Ca2+ current were also given and are given in Fig. 10. On adding 25 mM-TEAthe current variance at the resting potential for this cell was reduced by a factor of65 from 116 to 1[8 pA2, and as was documented above (Fig. 10), the average Ca2+current was about a tenth of that due to K+. Hence the fluctuation in the Ca2+ currentwould have made a negligible contribution to the over-all variance. Its contributionto the net current would have resulted in a 10 0% over-estimate of the current flowingthrough a single K+ channel.
Single K+ channelsIn order to confirm that the time course of the macroscopic current resulted from
the behaviour of the K+ channels themselves rather than from some distributedproperty of the hair cell, such as for example the spatial separation of channels,recordings of single K+ channels were attempted. These recordings were performedon cell-attached patches. This configuration suffers from the disadvantage that thecells are not properly voltage clamped, though considering their low input resistances,the currents flowing through the patch were unlikely to significantly alter themembrane potential. Also to enhance the signal-to-noise ratio, the recording pipetteswere filled with an isotonic K+ saline.Two types of step-like current fluctuations indicative of single-channel events were
distinguishable in these experiments. One variety had an amplitude of about 1 pAwith no applied potential, and it remained open with an increased size for positivevoltage steps delivered to the pipette, equivalent to hyperpolarization of the cell;these channels are most likely due to the inward rectifier (Ohmori, 1984). The othervariety had a resting amplitude of 3-5 pA and was opened by the equivalent ofdepolarization. Examples of the latter species are illustrated in Fig. 18, showing the
233
) by guest on July 10, 2011jp.physoc.orgDownloaded from J Physiol (
J. J. ART AND R. FETTIPLACE
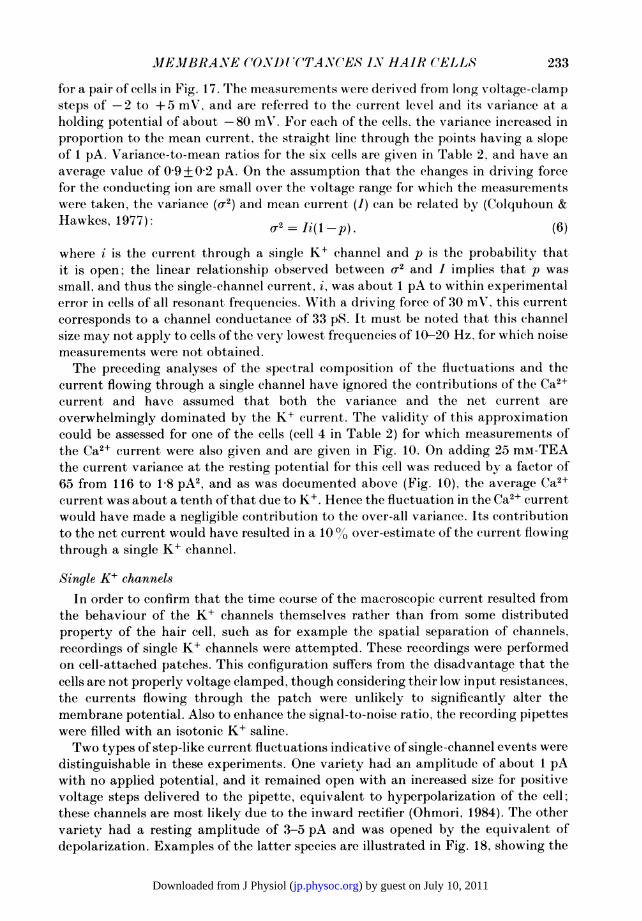
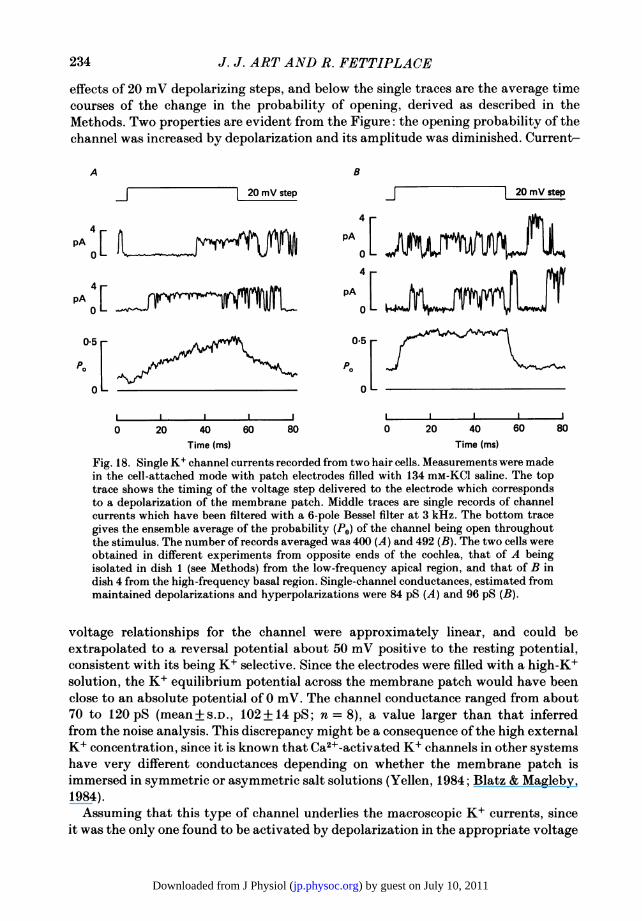
effects of 20 mV depolarizing steps, and below the single traces are the average timecourses of the change in the probability of opening, derived as described in theMethods. Two properties are evident from the Figure: the opening probability of thechannel was increased by depolarization and its amplitude was diminished. Current-
A B
20mVstep ep
pA PA [0 O
I I
0 20 40 60 80I- I I
0 20 40 60 80Time (ms) Time (ms)
Fig. 18. Single K+ channel currents recorded from two hair cells. Measurements were madein the cell-attached mode with patch electrodes filled with 134 mM-KCI saline. The toptrace shows the timing of the voltage step delivered to the electrode which correspondsto a depolarization of the membrane patch. Middle traces are single records of channelcurrents which have been filtered with a 6-pole Bessel filter at 3 kHz. The bottom tracegives the ensemble average of the probability (P0) of the channel being open throughoutthe stimulus. The number of records averaged was 400 (A) and 492 (B). The two cells wereobtained in different experiments from opposite ends of the cochlea, that of A beingisolated in dish 1 (see Methods) from the low-frequency apical region, and that of B indish 4 from the high-frequency basal region. Single-channel conductances, estimated frommaintained depolarizations and hyperpolarizations were 84 pS (A) and 96 pS (B).
voltage relationships for the channel were approximately linear, and could beextrapolated to a reversal potential about 50 mV positive to the resting potential,consistent with its being K+ selective. Since the electrodes were filled with a high-K+solution, the K+ equilibrium potential across the membrane patch would have beenclose to an absolute potential of 0 mV. The channel conductance ranged from about70 to 120 pS (mean+s.D., 102+14 pS; n = 8), a value larger than that inferredfrom the noise analysis. This discrepancy might be a consequence of the high externalK+ concentration, since it is known that Ca2+-activated K+ channels in other systemshave very different conductances depending on whether the membrane patch isimmersed in symmetric or asymmetric salt solutions (Yellen, 1984; Blatz & Magleby,1984).Assuming that this type of channel underlies the macroscopic K+ currents, since
it was the only one found to be activated by depolarization in the appropriate voltage
234
) by guest on July 10, 2011jp.physoc.orgDownloaded from J Physiol (

MEMBRANE CONDUCTANCES IN HAIR CELLS
range, then its kinetics might be expected to resemble the macroscopic current. Forthe two examples illustrated, the open probability rose and fell exponentially withtime after the beginning and end ofthe step; the respective time constants were about20 ms (Fig. 18A) and 2 ms(B). Although we had no measure of the resonantfrequencies of these cells, they originated from opposite ends of the papilla; the onewith slower kinetics was isolated in dish 1 which normally contained the low-frequencycells (see Fig. 2) and that with faster kinetics was isolated into the high-frequencydish 4. The magnitudes ofthe time constants are roughly consistent with the expectedrange of resonant frequencies found in these dishes. The results support the notionthat the spread in kinetics of the macroscopic K+ current between cells is due to localvariations in the vicinity of each channel, probably resulting in changes in the rateconstants of the channel-gating process.
DISCUSSION
Resonance in solitary hair cellsSolitary turtle hair cells displayed all aspects of the resonance phenomenon
observed in cells of the intact cochlea, and the spread of their resonant frequenciesand the sharpness of tuning add support for the idea that frequency selectivity inthe turtle ear is a private property of the hair cells. The lower- and upper-frequencybounds in solitary cells (9-350 Hz) were virtually identical to those found in theisolated papilla (20-320 Hz; Crawford & Fettiplace, 1985) but about an octave downon values obtained by micro-electrode recordings in the intact cochlea, wherecharacteristic frequencies extended up to 700 Hz (Crawford & Fettiplace, 1980).Notable ways in which the first two preparations differed from the last were in theabsence ofa tectorial membrane attachment for the ciliary bundles, and the exposureof the bundles to perilymph rather than the normal ionic environment of endolymph.The end result of these differences might have been a reduction in the transducerconductance, though it is unclear how this relates to the resonance. As mentionedearlier, loss of the transducer current could account for the tendency of some cellsto be hyperpolarized away from where they were most highly tuned. Despite thesesmall differences, the distribution oftuning characteristics in solitary cells reasonablyapproximated that of the intact organ, and motivated our subsequent search forpossible variations in the underlying membrane conductances.
Membrane currentsTwo major ionic currents, one carried by K+ and the other by Ca2+ that have been
described in hair cells of the frog (Lewis & Hudspeth, 1983b) and chick (Ohmori,1984) were also present in the turtle; both were activated by depolarization in thevoltage range around the resting potential where the resonance behaviour is mostprominent (Fig. 10A). In addition, isolated turtle hair cells have been shown totransduce mechanical stimuli delivered to the ciliary bundle (Art et al. 1986b),maximum transducer currents up to 200 pA being observed.Of the two major voltage-dependent currents, the K+ current was much the larger,
and in a majority of cells was blocked by TEA at a concentration that wouldextinguish the resonance behaviour on current injection (Crawford & Fettiplace,
235
) by guest on July 10, 2011jp.physoc.orgDownloaded from J Physiol (
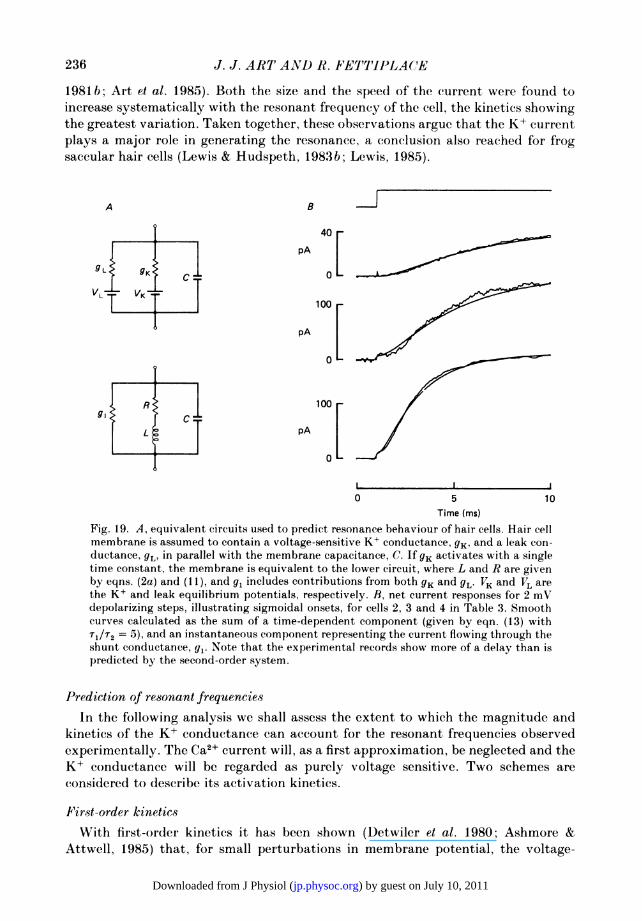
J. J. ART AND R. FETTIPLACE
1981 b; Art et al. 1985). Both the size and the speed of the current were found toincrease systematically with the resonant frequency of the cell, the kinetics showingthe greatest variation. Taken together, these observations argue that the K+ currentplays a major role in generating the resonance, a conclusion also reached for frogsaccular hair cells (Lewis & Hudspeth, 1983b; Lewis, 1985).
A B
gLt gKi pA oLpA 1
L pA[p0 LI
R~~~~~~10
0 5 10Time (ms)
Fig. 19. A, equivalent circuits used to predict resonance behaviour of hair cells. Hair cellmembrane is assumed to contain a voltage-sensitive K+ conductance, 9K, and a leak con-ductance, 9L, in parallel with the membrane capacitance, C. If 9K activates with a singletime constant, the membrane is equivalent to the lower circuit, where L and R are givenby eqns. (2a) and (11), and g1 includes contributions from both gK and gL. VK and VL arethe K+ and leak equilibrium potentials, respectively. B, net current responses for 2 mVdepolarizing steps, illustrating sigmoidal onsets, for cells 2, 3 and 4 in Table 3. Smoothcurves calculated as the sum of a time-dependent component (given by eqn. (13) withTl/T2 = 5), and an instantaneous component representing the current flowing through theshunt conductance, gl Note that the experimental records show more of a delay than ispredicted by the second-order system.
Prediction of resonant frequenciesIn the following analysis we shall assess the extent to which the magnitude and
kinetics of the K+ conductance can account for the resonant frequencies observedexperimentally. The Ca2+ current will, as a first approximation, be neglected and theK+ conductance will be regarded as purely voltage sensitive. Two schemes areconsidered to describe its activation kinetics.
First-order kineticsWith first-order kinetics it has been shown (Detwiler et al. 1980; Ashmore &
Attwell, 1985) that, for small perturbations in membrane potential, the voltage-
236
) by guest on July 10, 2011jp.physoc.orgDownloaded from J Physiol (

MEMBRANE CONDU;CTANCES IN HAIR CELLS
dependent conductance, 9K, can behave like an inductance, L, coupled to a pair ofresistances. Therefore the equivalent circuit for the membrane including the cellcapacitance, C, is that shown in the lower half of Fig. 19A (Crawford & Fettiplace,1981 a). The value of the inductance is given by:
L = T (2a)
6 I (V VK)where T is the activation time constant and VK, the K+ equilibrium potential, isnegative to the membrane potential, V, at rest.The dependence of the conductance, 9K, on membrane potential was obtained
from the tail-current measurements (Fig. 7) and near the resting potential could beapproximated by: 9K = A exp (V/ VE) , (7)
where A and VE are constants, and VE, representing the steepness of the voltage-dependence, had a mean value of 3-2 mV. Thus the denominator in eqn. (2 a) becomes:
ov
)Pmax 8VE' (8)
where Imax is the saturating amplitude of the tail current, and p the fraction turnedon at rest, which in most cells lay between 0 1 and 0-3.The impedance, Z, of the equivalent circuit as a function of angular frequency, co,
is given by:
cs2= 1 = PmAQ 21
Z ~ WOO- ____
R L - VE (11)T P'max
~R2C (J VETP x.( 12)
In the real membrane the parallel shunt conductance will be a combination of aninstantaneous K+ component plus contributions from the Ca2+ current and leak, sowe derived values for parallel shunt conductance in each cell from measurements ofthe initial hump at the onset of the current response (see Fig. 19B). The resonancecurve was then calculated from eqn. (9): the resonant frequencymfn,was derived fromthe frequency at maximum impedance and the quality factor, Q, fromf0 and the 3 dBband width (b.w.) of the curve (Q = f0/b.w.). For all but the very lowest-frequencycells, the predicted resonant frequency values were 10s200°o too high, and the qualityfactor was much too small, always less than2c6. The poor tuning that results from
237
) by guest on July 10, 2011jp.physoc.orgDownloaded from J Physiol (
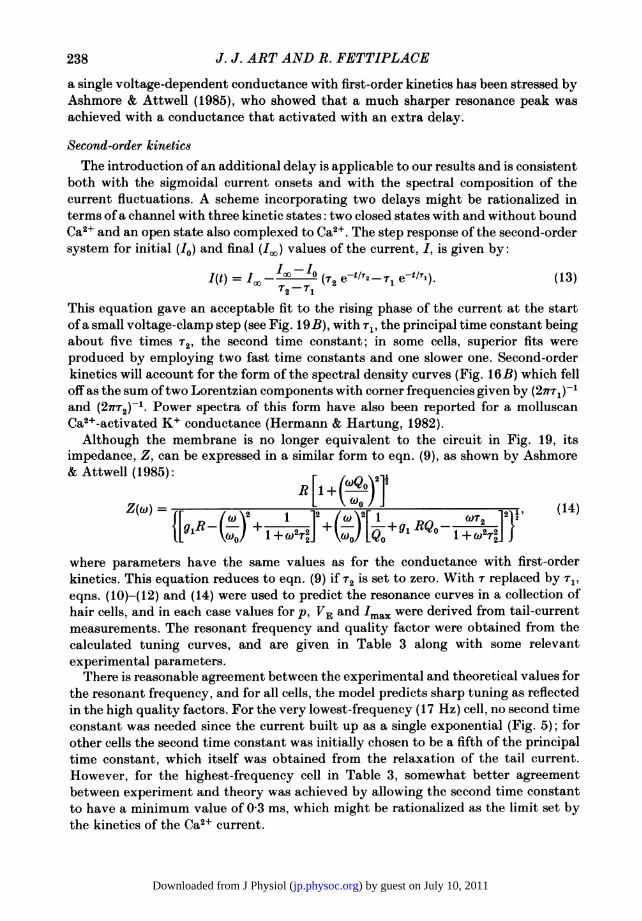
J. J. ART AND R. FETTIPLACE
a single voltage-dependent conductance with first-order kinetics has been stressed byAshmore & Attwell (1985), who showed that a much sharper resonance peak wasachieved with a conductance that activated with an extra delay.
Second-order kinetic8The introduction ofan additional delay is applicable to our results and is consistent
both with the sigmoidal current onsets and with the spectral composition of thecurrent fluctuations. A scheme incorporating two delays might be rationalized interms ofa channel with three kinetic states: two closed states with and without boundCa2+ and an open state also complexed to Ca2+. The step response of the second-ordersystem for initial (IO) and final (I'.) values of the current, I, is given by:
I(t) = Ioo 0-1 (t2e 1 et/tl)l (13)
This equation gave an acceptable fit to the rising phase of the current at the startofa small voltage-clamp step (see Fig. 19 B), with Tj, the principal time constant beingabout five times T2, the second time constant; in some cells, superior fits wereproduced by employing two fast time constants and one slower one. Second-orderkinetics will account for the form of the spectral density curves (Fig. 16B) which felloff as the sum oftwo Lorentzian components with corner frequencies given by (27rTr)-1and (27rT2)1. Power spectra of this form have also been reported for a molluscanCa2+-activated K+ conductance (Hermann & Hartung, 1982).Although the membrane is no longer equivalent to the circuit in Fig. 19, its
impedance, Z, can be expressed in a similar form to eqn. (9), as shown by Ashmore& Attwell (1985):
2,+i -]
Z(o) = {[__ (14)
where parameters have the same values as for the conductance with first-orderkinetics. This equation reduces to eqn. (9) if T2 is set to zero. With r replaced by 1,eqns. (10)-(12) and (14) were used to predict the resonance curves in a collection ofhair cells, and in each case values for p, VE and Imax were derived from tail-currentmeasurements. The resonant frequency and quality factor were obtained from thecalculated tuning curves, and are given in Table 3 along with some relevantexperimental parameters.There is reasonable agreement between the experimental and theoretical values for
the resonant frequency, and for all cells, the model predicts sharp tuning as reflectedin the high quality factors. For the very lowest-frequency (17 Hz) cell, no second timeconstant was needed since the current built up as a single exponential (Fig. 5); forother cells the second time constant was initially chosen to be a fifth of the principaltime constant, which itself was obtained from the relaxation of the tail current.However, for the highest-frequency cell in Table 3, somewhat better agreementbetween experiment and theory was achieved by allowing the second time constantto have a minimum value of 03 ms, which might be rationalized as the limit set bythe kinetics of the Ca2+ current.
238
) by guest on July 10, 2011jp.physoc.orgDownloaded from J Physiol (

MEMBRANE CONDUCTANCES IN HAIR CELLS
The scheme employed does not provide a complete description of the membranecurrents in turtle hair cells, but it is the simplest one consistent with the kinetics ofthe K+ conductance which can generate sharp tuning. Therefore it is useful inindicating how the characteristics of the K+ conductance may be important in
TABLE 3. Measured and predicted tuning in six hair cells
Measured Predicted
fo C imax T1 T2 foCell (Hz) Q (pF) (pA) (ms) (ms) gqR (Hz) Q
1 17 4-6 10 639 138 0-01 17 432 67 82 113 480 75 15 003 64 10-73 145 126 10 925 3-8 08 006 141 17-64 206 310 12-5 1200 26 05 007 242 34-65 276 13-7 15 2336 12 03 008 280 6-5
6 309 14-0 106 1200 0-9 f 02 003 333 6t1.0-3 0-03 312 17-3
Resonant frequency,fo, and quality factor, Q: measured values in first two columns and predictedvalues (from eqn. (14)) in last two columns. C, eell capacitance; Imax, saturated tail current; Tl,principal time constant of current relaxation. gi (parallel shunt conductance) was measured andR (resistance) calculated from eqn. (11). The last cell had an anomalously small Imax, but wasincluded because of its high quality factor.
determining the resonant frequency. No explicit account has been taken of the Ca2+current, and a more detailed analysis of the interplay of the two membrane currentswould require a model such as that proposed by Lewis (1985) for the complex gatingprocess of the K+ channel.
Kinetics of the K+ currentOne of our main observations was the wide range of time constants with which the
K+ current activates. The simplest explanation is that the variation reflects intrinsicdifferences in the K+ channels. If however these channels are gated by modulationof internal Ca2+, then the rate of entry and buffering of Ca2+ within the cell couldalso contribute to the kinetic variation. Activation of the Ca2+ current was fasterthan the fastest relaxation time constant measured for the K+ current and cannottherefore determine the over-all kinetics in the frequency range examined. If therelationship between the relaxation time constant and resonant frequency shown inFig. 6B extends to higher frequencies, the kinetics of the Ca2+ current, if they wereto remain constant, would dominate above 500 Hz. This frequency is close to theupper limit for the resonance in turtle hair cells at room temperature.
Additional information on the kinetic processes was provided by analysis of thecurrent fluctuations, whose major spectral component varied in parallel with therelaxation time constant. We have argued that the Ca2+ channel noise would havebeen small and it seems unlikely that the internal Ca2+ buffering mechanisms areintrinsically noisy, since they arise from binding to cytoplasmic proteins or membranepumps. Therefore it, is most reasonable to suppose that the current noise is largelydue to the probabilistic behaviour of the K+ channels, and that differences in themajor spectral component reflect, differences in the opening and closing rate constants
239
) by guest on July 10, 2011jp.physoc.orgDownloaded from J Physiol (

J. J. ART ANID R. FETTIPLACE
of the channel. Some support for this conclusion was provided by (lirect measurementof the kinetics of single K+ channels (Fig. 18).
Denvsity of K+ channelsThe fluctuation anialysis indi(cated( a single-channel current of about 1 pA at least
for resonant frequentcies above 75 Hz. If the channels exhibit fast flickeringun(lete(table within the band wi(dth of the recording system, this value may be anun(lerestimate (Coiquhoun & Hawkes, 1977), but taking it to be correct allows acaIculation of the number of K+ channels per hair cell. The saturating value of thetail current in Fig. 1OA (12 nA) represents the maximum current flowing throughthe openi channels foI a driving force at the resting potential. From Fig. 10, the tailcurrent had saturate(l at a membrane potential where the Ca2+ current was stillincreasing, and canlnot therefore be limited by ("a2+ influx. If we assume that atsaturation the probability of channel opening is close to unity, then we calculateabout 1200 channels for that cell; estimations in other eells (Fig. 7 and Table 3), gavenumbers ranging from about 480 to 3700 K+ channels per cell. Since there was nosystematic variation of membrane area with resonant frequency, our results showthat, in general, cells of a higher resonant frequency had a higher density of channelsin their membrane. Such estimates do not include the population of cells with thevery lowest resonant frequencies (10-20 Hz), for which no reliable measurements ofthe single-channel current were available.An intriguing question that remains is how the hair cells regulate the number and
kinetics of their K+ c hannels, and the number of Ca2+ channels. The cells are arranlgedtonotopically in the epithelium, the resonant frequency increasing monotonicallywith distance along the cochlea (Crawford & Fettiplace, 1980; Art et al. 1986a), whichimplies that the membrane properties are graded with position, just as are the cellulardimensions in other cochleas (Lim, 1980; Tilney & Saunders, 198:3). While the cellulararchitecture may be initially set by gene expression, it seems likely that the propertiesof the channel proteins, if these proteins turn over, require continual managementto preserve the precise geographical distributioni of resonant frequencies along thecochlea.
This research was supported by gr'anlts fiom the Medical Research (ouncil and the Howe Fundof the Royal Society. WVe would like to thank Paul Fuchs, who participate(l in early experiments,Andrew Crawford for helpful discussions and( Trevor Lamb and Brian Nunni for commenting on themanuscript. We acknowledge the technical assistance of' W. Smiiith and T. Carter and thankDr S. K. Bosher for loani of equipment.
REFERENCES
ADAMS, P. R., CONSTANTI, A., BROWN, 1). A. & CLARK. 1R. 13. (1982). I1tIracellular Caa2+ activatesa fast voltage-sensitive K+ current in vertebrate sympathetic nieurones. Nature 296. 746-749.
ALDRICH, R. WV. & YELLEN, G. (1983). Analysis of nonstationary channiiel kinetics. In Sinyle-channelRecording. ed. SAKMANN, B. & NEHER, E.. pp. 287--299). New York: Plenumiiii Plress.
ART.*J. ,J.. CRAWFORI), A. C. & FETTIPLACE. R. (1986a). Electrical resonance andC1 imemlbraniecurrents in turtle cochlear hair cells. Hearing Research 22. 31-36.
ART, J. ,J., CRAWFORI), A. C. & FETTIPLACE.R{. (1986b). Memibranec(urrlenlts in solitary turtle haircells. In Auditory Frequency SelectiOrity. ed. M0OORE. 13. C. J. & PATTERSON, R. D., pp. 81-88.New York: Plenuml'ress.
240
) by guest on July 10, 2011jp.physoc.orgDownloaded from J Physiol (
MEMBRANE CONDUCTANCES IN HAIR CELLS 241
ART, J. J., CRAWFORD, A. C., FETTIPLACE, R. & FuCHS, P. A. (1985). Efferent modulation of haircell tuning in the cochlea of the turtle. Journal of Physiology 360, 397-421.
ASHCROFT, F. M. & STANFIELD, P. R. (1982). Calcium inactivation in skeletal muscle fibres of thestick insect Carausius morosus. Journal of Physiology 330, 349-372.
ASHMORE, J. F. (1983). Frequency tuning in a frog vestibular organ. Nature 304, 536-538.ASHMORE, J. F. & ATTWELL, D. (1985). Models for electrical tuning in hair cells. Proceedings of the
Royal Society B 226, 325-344.ASHMORE, J. F. & PITCHFORD, S. (1985). Evidence for electrical tuning in hair cells of the frogamphibian papilla. Journal of Physiology 364, 39P.
BARRETT, J. N., MAGLEBY, K. L. & PALLOTTA, B. S. (1982). Properties of single calcium-activatedpotassium channels in cultured rat muscle. Journal of Physiology 331, 221-230.
BENDAT, J. S. & PIERSOL, A. G. (1971). Random Data: Analysis and Measurement Procedures. NewYork: Wiley-Interscience.
BLATZ, A. L. & MAGLEBY, K. L. (1984). Ion conductance and selectivity of single calcium-activatedpotassium channels in cultured rat muscle. Journal of General Physiology 84, 1-23.
COLQUHOUN, D. & HAWKES, A. G. (1977). Relaxation and fluctuations of membrane currents thatflow through drug-operated ion channels. Proceedings of the Royal Society B 199, 231-262.
COREY, D. P. & HUDSPETH, A. J. (1979). Ionic basis of the receptor potential in a vertebrate haircell. Nature 281, 675-677.
CRAWFORD, A. C. & FETTIPLACE, R. (1980). The frequency selectivity of auditory nerve fibres andhair cells in the cochlea of the turtle. Journal of Physiology 306, 79-125.
CRAWFORD, A. C. & FETTIPLACE, R. (1981 a). An electrical tuning mechanism in turtle cochlear haircells. Journal of Physiology 312, 377-412.
CRAWFORD, A. C. & FETTIPLACE, R. (1981 b). Non-linearities in the responses of turtle hair cells.Journal of Physiology 315, 317-338.
CRAWFORD, A. C. & FETTIPLACE, R. (1985). The mechanical propeties of ciliary bundles of turtlecochlear hair cells. Journal of Physiology 364, 359-379.
DETWILER, P. B., HODGKIN, A. L. & MCNAUGHTON, P. A. (1980). Temporal and spatial charac-teristics of the voltage response of rods in the retina of the snapping turtle. Journal of Physiology300, 213-250.
ECKERT, R. & CHAD, J. E. (1984). Inactivation of Ca channels. Progress in Biophysics and MolecularBiology 44, 215-267.
FENWICK, E., MARTY, A. & NEHER, E. (1982). Sodium and calcium channels in bovine chromaffincells. Journal of Physiology 331, 599-635.
FuCHS, P. A. & MANN, A. C. (1986). Voltage oscillations and ionic currents in hair cells isolatedfrom the apex of the chick's cochlea. Journal of Physiology 371, 31P.
GORMAN, A. L. F., HERMANN, A. & THOMAS, M. V. (1982). Ionic requirements for membraneoscillations and their dependence on the calcium concentration in a molluscan pace-makerneurone. Journal of Physiology 327, 185-217.
HAGIWARA, S. & OHMORI, H. (1982). Studies of calcium channels in rat clonal pituitary cells withpatch electrode voltage clamp. Journal of Physiology 331, 231-252.
HAMILL, 0. P., MARTY, A., NEHER, E., SAKMANN, B. & SIGWORTH, F. J. (1981). Improvedpatch-clamp techniques for high-resolution current recording from cells and cell-free membranepatches. Pfluigers Archiv 391, 85-100.
HERMANN, A. & HARTUNG, K. (1982). Noise and relaxation measurements of the Ca++-activatedK+ current in Helix neurones. Pftuigers Archiv 393, 254-261.
KRISHTAL, 0, A. & PIDOPLICHKO, V. I. (1980). A receptor for protons in the nerve cell membrane.Neuroscience 5, 2325-2327.
LAMB, T. D. (1983). An inexpensive perfusion pump and its use in rapid temperature changeexperiments on retinal rods. Journal of Physiology 332, 7P.
LEWIS, R. S. (1985). The ionic basis of frequency selectivity in hair cells of the bullfrog's sacculus.Ph.D. Thesis, California Institute of Technology, Pasadena, CA, U.S.A.
LEWIS, R. S. & HUDSPETH, A. J. (1983a). Frequency tuning and ionic conductances in hair cellsof the bullfrog's sacculus. In Hearing - Physiological Bases and Psychophysics, ed. KLINKE, R.& HARTMANN, R., pp. 17-22. Berlin and Heidelberg: Springer-Verlag.
LEWIS, R. S. & HUDSPETH, A. J. (1983b). Voltage- and ion-dependent conductances in solitaryvertebrate hair cells. Nature 304, 538-541.
) by guest on July 10, 2011jp.physoc.orgDownloaded from J Physiol (
J. J. ART AND R. FETTIPLACE
LIM, D. J. (1980). Cochlear anatomy related to cochlear micromechanics. A review. Journal of theAcoustical Society of America 67, 1686-1695.
MARTY, A. & NEHER, E. (1983). Tight-seal whole-cell recording. In Single-channel Recording, ed.SAKMANN, B. & NEHER, E., pp. 107-122. New York: Plenum Press.
MARTY, A. & NEHER, E. (1985). Potassium channels in cultured bovine adrenal chromaffin cells.Journal of Physiology 367, 117-141.
MAURO, A., CONTI, F., DODGE, F. & SCHOR, R. (1970). Subthreshold behavior and phenomenologicalimpedance of the squid giant axon. Journal of General Physiology 55, 497-523.
MILLER, M. R. (1978). Scanning electron microscope studies of the papilla basilaris of some turtlesand snakes. American Journal of Anatomy 151, 409-436.
OHMORI, H. (1984). Studies of ionic currents in the isolated vestibular hair cell of the chick. Journalof Physiology 350, 561-581.
SIGWORTH, F. J. (1983). Electronic design of the patch clamp. In Single-channel Recording, ed.SAKMANN, B. & NEHER, E., pp. 3-35. New York: Plenum Press.
TILNEY, L. G. & SAUNDERS, J. C. (1983). Actin filaments, stereocilia, and hair cells of the birdcochlea. I. Length, number, width and distribution of stereocilia on each hair cell are related tothe position of the hair cell on the cochlea. Journal of Cell Biology 96, 807-821.
TsIEN, R. Y. (1980). New calcium indicators and buffers with high selectivity against magnesiumand protons: design, synthesis, and properties of prototype structures. Biochemistry 19,2396-2404.
YELLEN, G. (1984). Ionic permeation and blockade in Ca2+-activated K+ channels of bovinechromaffin cells. Journal of General Physiology 84, 157-186.
ZUCKER, R. S. (1981). Tetraethylammonium contains an impurity which alkalizes cytoplasm andreduces calcium buffering in neurons. Brain Research 208, 473-478.
EXPLANATION OF PLATE
Photomicrograph of a solitary hair cell isolated from the middle region of the turtle basilar papillaand viewed with Nomarski optics. Note the prominent cuticular plate beneath the stereociliarybundle.
242
) by guest on July 10, 2011jp.physoc.orgDownloaded from J Physiol (
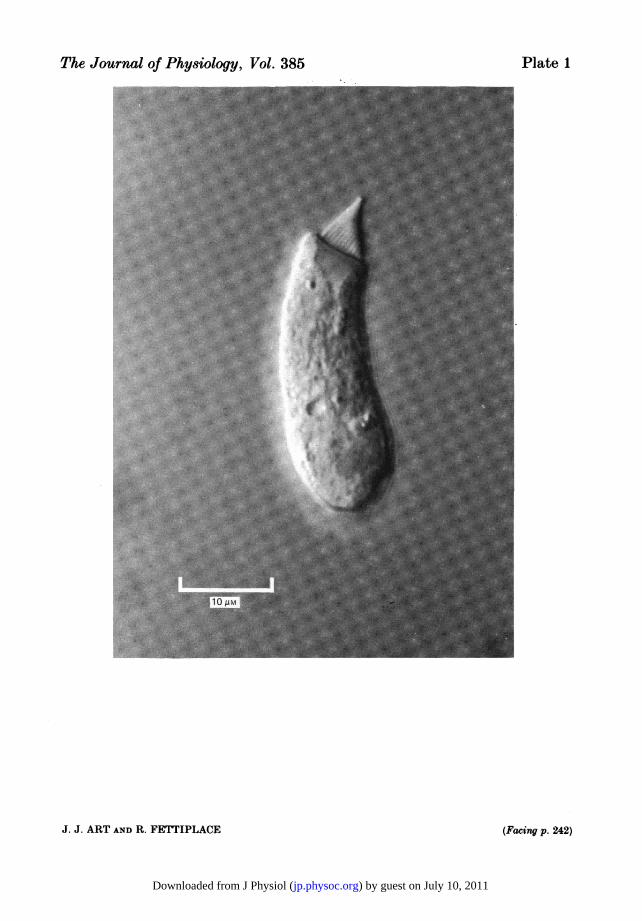
The Journal of Physiology, Vol. 385
J. J. ART AND R. FETTIPLACE (Facing p. 242)
Plate 1
) by guest on July 10, 2011jp.physoc.orgDownloaded from J Physiol (
Related Documents