VARIATION IN THE ESSENTIAL OIL COMPOSITION OF CALENDULA OFFICINALIS L. BY OMOBOLA OKOH DISSERTATION SUBMITTED IN SATISFACTION OF THE REQUIREMENTS FOR THE DEGREE OF MASTER OF SCIENCE (CHEMISTRY) IN THE FACULTY OF SCIENCE AND AGRICULTURE UNIVERSITY OF FORT HARE SUPERVISORS: PROFESSOR A. SADIMENKO PROFESSOR A.J. AFOLAYAN 2008

Welcome message from author
This document is posted to help you gain knowledge. Please leave a comment to let me know what you think about it! Share it to your friends and learn new things together.
Transcript
VARIATION IN THE ESSENTIAL OIL COMPOSITION OF CALENDULA
OFFICINALIS L .
BY
OMOBOLA OKOH
DISSERTATION SUBMITTED IN SATISFACTION OF
THE REQUIREMENTS FOR THE DEGREE OF MASTER OF SCIENC E
(CHEMISTRY) IN THE FACULTY OF SCIENCE AND AGRICULTU RE
UNIVERSITY OF FORT HARE
SUPERVISORS: PROFESSOR A. SADIMENKO
PROFESSOR A.J. AFOLAYAN
2008

2
TABLE OF CONTENTS
Page
Declaration ……………………………………………………………………… 5
Abstract …………………………………………………………………………... 6
CHAPTER 1 INTRODUCTION
1.1 Natural Products ………………………………………………………………… 7
1.2 Motivation / Justification of this Research ……………………………………. 9
1.3 Aims and Objective of the Study ………………………………………………… 10
CHAPTER 2 LITERATURE REVIEW
2.1 Calendula officinalis L ………………………………………………………… 12
2.2 Propagation of Calendula officinalis …………………………………………….. 13
2.3 Chemical Constituents of Calendula officinalis …………………………………. 14
2.4 Uses of Calendula officinalis ……………………………………………………... 18
2.5 Risk Involved in Calendula Usage ........................................................................... 20
2.6 Isolation of essential oils ......................................................................................... 20
2.6.1 Eufleurage ..................................................................................................... 20
2.6.2. Pneumatic method ......................................................................................... 21
2.6.3 Maceration ..................................................................................................... 21
2.6.4 Expression ..................................................................................................... 22
2.6.5 Solvent extraction ......................................................................................... 22
2.6.6 Distillation procedures ................................................................................... 23
3
2.6.6.1 Steam distillation ................................................................................... 23
2.6.6.2 Water distillation ................................................................................... 24
2.6.6.3 Dry distillation ................................................................................... 24
2.6.6.4 Hydrodiffusion ................................................................................... 24
2.6.7 Liquid Carbon Dioxide Extraction Method ..................................................... 25
2.7 Method of analyzing essential oils ....................................................................... 26
2.7.1 Gas chromatography ................................................................................... 26
2.7.2 Gas chromatography – mass spectroscopy (GC–MS) ................................... 32
2.7.3 Microbial Assays ............................................................................................. 36
2.7.3.1 Antimicrobial Assay of Essential Oils .................................................. 37
2.7.3.1.1 The Assay Technique ..................................................................... 37
2.7.3.1.2 The Assay Medium ....................................................................... 38
2.7.3.1.3 Microorganisms ............................................................................. 38
2.8 Past works on essential oil ............................................................................. 39
CHAPTER 3 MATERIALS AND METHODS
3.1 Seed Collection, Soil Preparation, and Cultivation of the Plant ............................. 48
3.2 Plant Collection and Distillation of the Essential Oils ......................................... 48
3.3 Soil Analysis ........................................................................................................... 49
3.4 GC-MS Analyses and Identification of Components ............................................... 49
3.5 Isolation of Compounds from Calendula officinalis ............................................... 50
3.5.1 Plant Materials ............................................................................................... 50
3.5.2 General Analysis ......................................................................................... 50

4
3.5.3 Extraction and Isolation ................................................................................... 51
CHAPTER 4 RESULTS AND DISCUSSION
4.1 Effects of Age on the Yield and Composition of the Essential Oils of Calendula offi-
cinalis ....................................................................................................................... 53
4.2 Effects of Drying on the Chemical Components of Essential Oil of Calendula offici-
nalis L. Growing Wild in the Eastern Cape Province of South Africa ................ 69
4.3 Isolation of Major Compounds ............................................................................. 78
4.4 Fragmentation Pattern …………………………………………………………....... 79
4.5 Spectral Identification of 1,8-Cineole ....................................................................... 82
CONCLUSIONS ........................................................................................................... 95
REFERENCES ........................................................................................................... 96
APPENDIX
List of Figures ................................................................................................................ 107
List of Tables ................................................................................................................ 108
5
DECLARATION
I declare that this dissertation is my own work except the acknowledged supervision
and referred literature. It has not been submitted before for any degree or examination in
any other University.
Omobola Okoh
January 2008, Alice

6
ACKNOWLEDGEMENT
I would like to thank the Almighty God, The Creator of Heaven and Earth, who gave
me the strength to complete this thesis. I am deeply indebted to my supervisor Professor
A. Sadimenko, of the Department of Chemistry, whose help, stimulating suggestions and
encouragement helped me in all the time of research and writing of this thesis. I also want
to thank my supervisor, Professor A. J. Afolayan, of the Department of Botany, for his
advice, experience, encouragement, and commitment he shared throughout this project.
A special thanks to my husband, Professor A.I. Okoh for his support and encourage-
ment and to my children for their understanding and moral support. Many thanks to my
colleagues for all their help, support, interest, and valuable hints in my research work.
There are many others whose names I have not mentioned to whom I am greatly in-
debted.
Finally I would like to thank the National Research Foundation for funding my re-
search work.

7
ABSTRACT
Variations in the yield and composition of the essential oils from Calendula officina-
lis L. cultivated in Alice (Eastern Cape) are reported. Essential oils were obtained by hy-
drodistillation using the Clevenger apparatus and analysis was performed by GC-MS.
The yield in essential oil revealed a maximum at the full-flowering stage (0.97%) and a
minimum during the pre-flowering stage (0.13%). The composition showed different pat-
terns at different phases of the vegetative cycle. Sesquiterpenes (α-cadinene, α-cadinol,
T-muurolol, and epi-bicyclosesquiphellandrene) and monoterpenes (limonene, 1,8-
cineole, and trans-β-ocimene) showed highest correlations with the age of the plant. An
interesting stage is the post-flowering period, the essential oil being rich in α-cadinene, α-
cadinol, T-muurolol, limonene, 1,8-cineole, with p-cymene presenting lower levels.
The oils were extracted by hydrodistillation from fresh leaves, dry leaves, and fresh
flowers yielding 0.06 %, 0.03 %, and 0.09 %, respectively. The analysis of oils by GC-
MS revealed a total of 30, 21, and 24 compounds from the fresh leaves, dry leaves, and
the flowers, respectively, representing 91.7, 89.8, and 87.5% of the total oil composition.
Sesquiterpenoids dominated in the fresh leaves (59.5 %) and flowers (26 %), while the
monoterpenes dominated in the dry leaves (70.3 %). T-Muurolol (40.9 %) predominated
in the fresh leaf oil, α-thujene (19.2 %) and δ-cadinene (11.8 %) were present in high
quantities. In contrast, 1,8-cineole (29.4%), γ-terpenene (11.6 %), δ-cadinene (9.0 %), β-
pinene (6.9 %), and α-thujene (6.3 %) were the major components in the dry leaf oil,
while in the fresh flower oil, α-thujene (15.9 %), δ-cadinene (13.1 %) and γ-cadinene
(10.9 %) were the major components. The significance of the effect of drying and age on
essential oil composition is discussed.
8
CHAPTER 1
INTRODUCTION
1.1 NATURAL PRODUCTS
All over the world, natural products have found great usefulness in industry as well as
in herbal medicine. In Africa, for example, the majority of inhabitants depend on the
available plants for their primary health care. Most of these remedies are natural prod-
ucts.
Plants through scientific researches have been found to contain valuable chemicals
(Morrison and Boyd, 1987). These natural chemicals and their synthetic counterparts
have continued to serve as feed stock in relevant industrial fields. While some are used in
pharmaceutical, food, and chemical industry, others are applied as food flavors and fra-
grances, sweeteners, or even pesticides. Although western technologists have transformed
many medicinal plants into more palatable forms like tablets, capsules, and syrups, many
traditional healers still use plants in their crude form (herbal remedies). Extracts from
some of the medicinal plants being used by traditional healers have been found to contain
properties that inhibit the growth of bacteria, viruses, and other microbes (Ndubani &
Hojer, 1999).
The global markets of natural products for industrial and medicinal uses have been
growing rapidly in recent years. Today medicinal and aromatic plants have become an
integral component of research and pharmaceutical industry. Such research focuses on
the isolation and direct use of active medicinal constituents of plants, semi-synthetic
drugs, and pharmacologically active compounds. As a result, industry is investing vast
9
resources into screening of the active constituents of medicinal and aromatic plants from
all over the world. For example, about half of the world’s 25 best selling pharmaceuticals
in 1991 originated from natural source materials and about 25% of the prescribed drugs
were from the plant kingdom (Balick, 1990). In addition to the medicinal and industrial
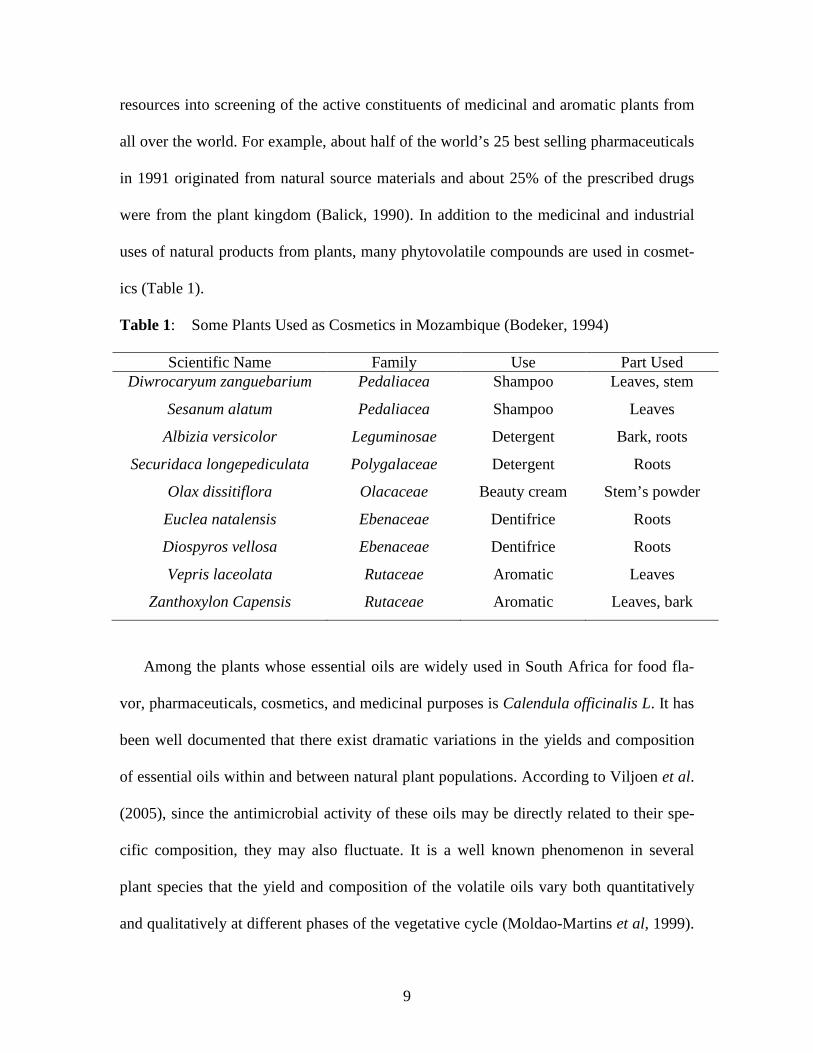
uses of natural products from plants, many phytovolatile compounds are used in cosmet-
ics (Table 1).
Table 1: Some Plants Used as Cosmetics in Mozambique (Bodeker, 1994)
Scientific Name Family Use Part Used Diwrocaryum zanguebarium Pedaliacea Shampoo Leaves, stem
Sesanum alatum Pedaliacea Shampoo Leaves
Albizia versicolor Leguminosae Detergent Bark, roots
Securidaca longepediculata Polygalaceae Detergent Roots
Olax dissitiflora Olacaceae Beauty cream Stem’s powder
Euclea natalensis Ebenaceae Dentifrice Roots
Diospyros vellosa Ebenaceae Dentifrice Roots
Vepris laceolata Rutaceae Aromatic Leaves
Zanthoxylon Capensis Rutaceae Aromatic Leaves, bark
Among the plants whose essential oils are widely used in South Africa for food fla-
vor, pharmaceuticals, cosmetics, and medicinal purposes is Calendula officinalis L. It has
been well documented that there exist dramatic variations in the yields and composition
of essential oils within and between natural plant populations. According to Viljoen et al.
(2005), since the antimicrobial activity of these oils may be directly related to their spe-
cific composition, they may also fluctuate. It is a well known phenomenon in several
plant species that the yield and composition of the volatile oils vary both quantitatively
and qualitatively at different phases of the vegetative cycle (Moldao-Martins et al, 1999).
10
This has been demonstrated for Dracocephalum moldavica, Thymus capitatus, Artemisia
judaica and Thymus vulgaris (Holm et al, 1988; Arras et al, 1993; and McGimpsey et al.
1994; Ravid et al, 2006). In these reports, higher yields were observed in the flowering
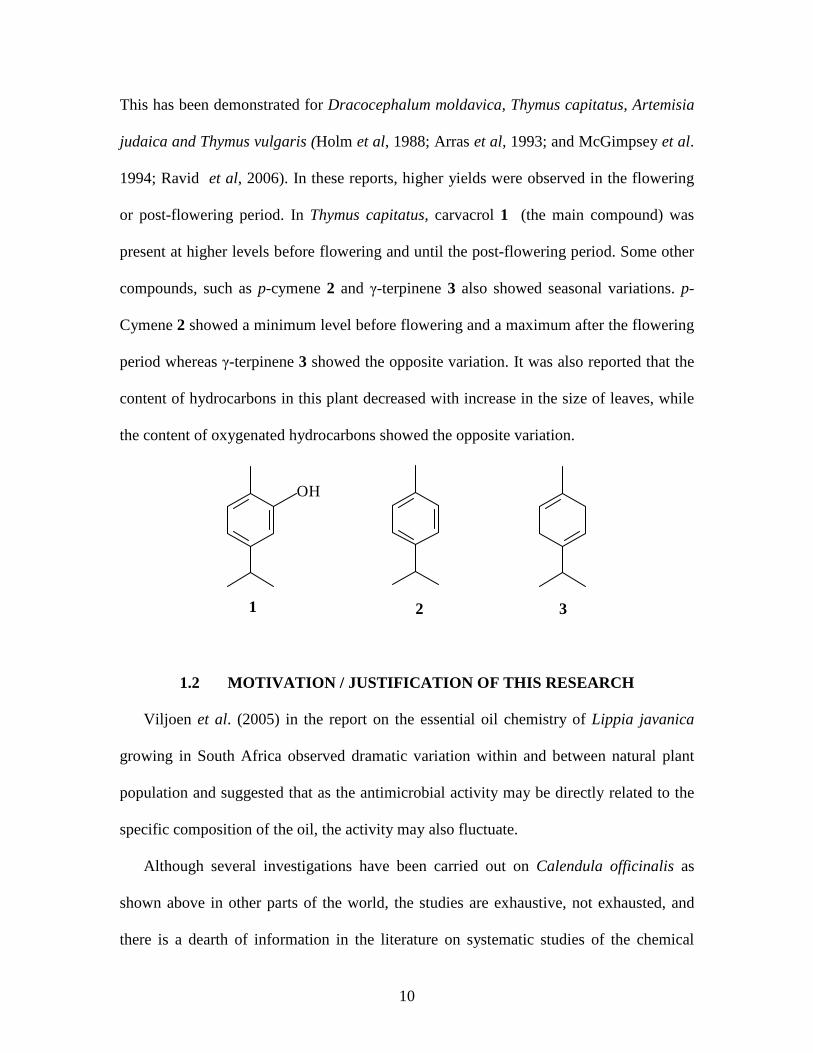
or post-flowering period. In Thymus capitatus, carvacrol 1 (the main compound) was
present at higher levels before flowering and until the post-flowering period. Some other
compounds, such as p-cymene 2 and γ-terpinene 3 also showed seasonal variations. p-
Cymene 2 showed a minimum level before flowering and a maximum after the flowering
period whereas γ-terpinene 3 showed the opposite variation. It was also reported that the
content of hydrocarbons in this plant decreased with increase in the size of leaves, while
the content of oxygenated hydrocarbons showed the opposite variation.
OH
1 2 3
1.2 MOTIVATION / JUSTIFICATION OF THIS RESEARCH
Viljoen et al. (2005) in the report on the essential oil chemistry of Lippia javanica
growing in South Africa observed dramatic variation within and between natural plant
population and suggested that as the antimicrobial activity may be directly related to the
specific composition of the oil, the activity may also fluctuate.
Although several investigations have been carried out on Calendula officinalis as
shown above in other parts of the world, the studies are exhaustive, not exhausted, and
there is a dearth of information in the literature on systematic studies of the chemical
11
composition of essential oils from the plant found growing in the Eastern Cape Province
of South Africa. Yet, there have been reports of variability in the chemical composition
of essential oils of same plants from different regions, with seasonal differences also sig-
nificantly affecting such compositions (Miguel et al, 2004).
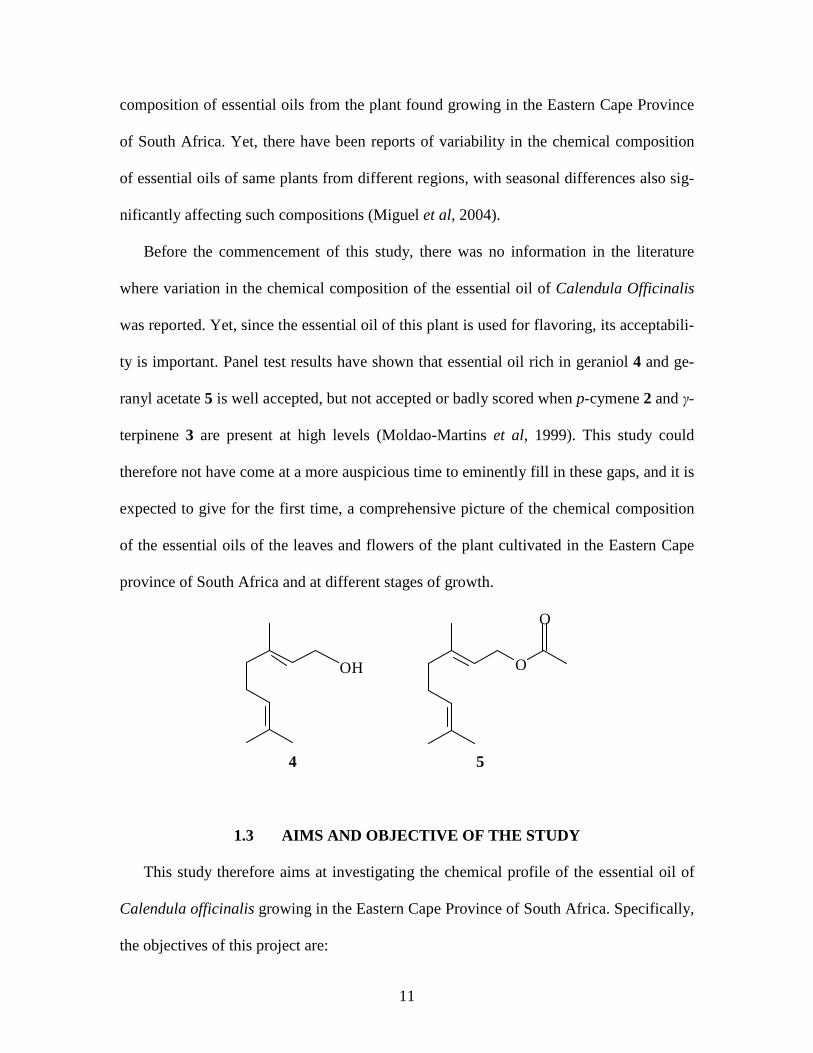
Before the commencement of this study, there was no information in the literature
where variation in the chemical composition of the essential oil of Calendula Officinalis
was reported. Yet, since the essential oil of this plant is used for flavoring, its acceptabili-
ty is important. Panel test results have shown that essential oil rich in geraniol 4 and ge-
ranyl acetate 5 is well accepted, but not accepted or badly scored when p-cymene 2 and γ-
terpinene 3 are present at high levels (Moldao-Martins et al, 1999). This study could
therefore not have come at a more auspicious time to eminently fill in these gaps, and it is
expected to give for the first time, a comprehensive picture of the chemical composition
of the essential oils of the leaves and flowers of the plant cultivated in the Eastern Cape
province of South Africa and at different stages of growth.
OH
4
O
5
O
1.3 AIMS AND OBJECTIVE OF THE STUDY
This study therefore aims at investigating the chemical profile of the essential oil of
Calendula officinalis growing in the Eastern Cape Province of South Africa. Specifically,
the objectives of this project are:
12
• To carry out a comparative investigation of the chemical composition of Ca-
lendula officinalis growing in the Eastern Cape Province of South Africa.
• Isolation of essential oils from the leaves and flowers of Calendula officinalis
plant at different stages of growth and season.
• To investigate the influence of drying on the quantity and quality of its essen-
tial oil.
• To carry out structural elucidation of key components of the essential oil using
traditional spectroscopic methods (IR- and NMR-spectroscopy).
13
CHAPTER 2
LITERATURE REVIEW
2.1 CALENDULA OFFICINALIS L.
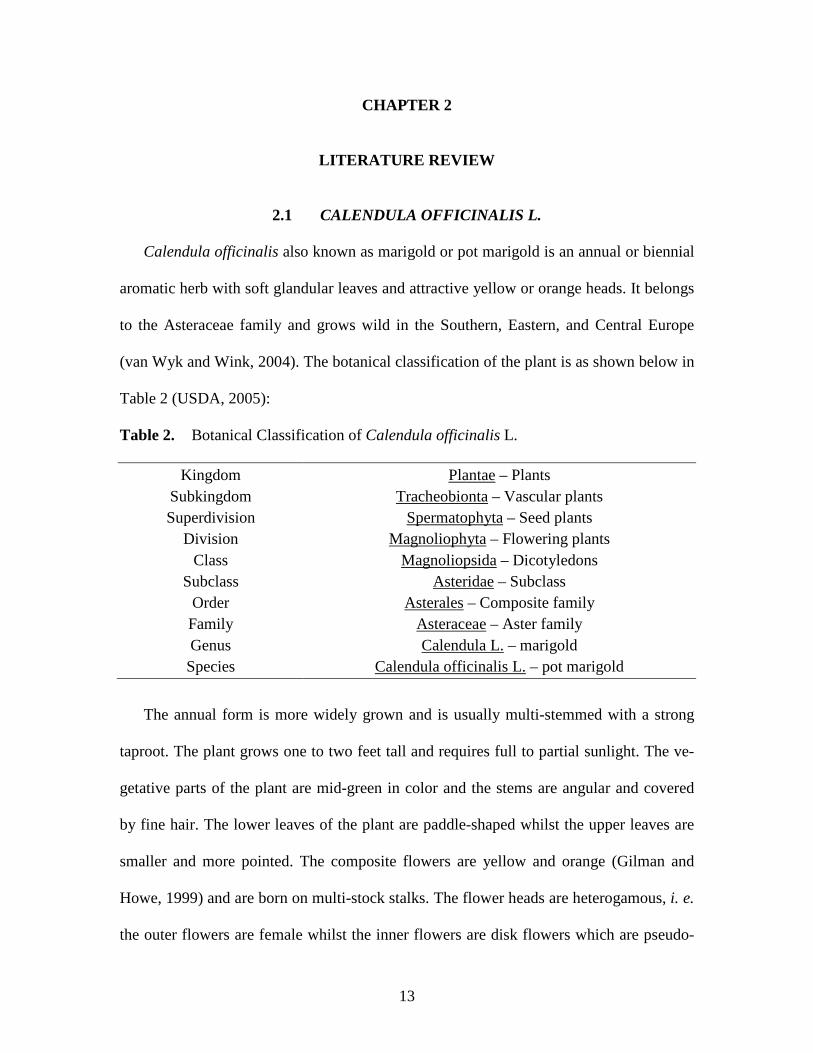
Calendula officinalis also known as marigold or pot marigold is an annual or biennial
aromatic herb with soft glandular leaves and attractive yellow or orange heads. It belongs
to the Asteraceae family and grows wild in the Southern, Eastern, and Central Europe
(van Wyk and Wink, 2004). The botanical classification of the plant is as shown below in
Table 2 (USDA, 2005):
Table 2. Botanical Classification of Calendula officinalis L.
Kingdom Plantae – Plants Subkingdom Tracheobionta – Vascular plants Superdivision Spermatophyta – Seed plants
Division Magnoliophyta – Flowering plants Class Magnoliopsida – Dicotyledons
Subclass Asteridae – Subclass Order Asterales – Composite family Family Asteraceae – Aster family Genus Calendula L. – marigold Species Calendula officinalis L. – pot marigold
The annual form is more widely grown and is usually multi-stemmed with a strong
taproot. The plant grows one to two feet tall and requires full to partial sunlight. The ve-
getative parts of the plant are mid-green in color and the stems are angular and covered
by fine hair. The lower leaves of the plant are paddle-shaped whilst the upper leaves are
smaller and more pointed. The composite flowers are yellow and orange (Gilman and
Howe, 1999) and are born on multi-stock stalks. The flower heads are heterogamous, i. e.
the outer flowers are female whilst the inner flowers are disk flowers which are pseudo-
14
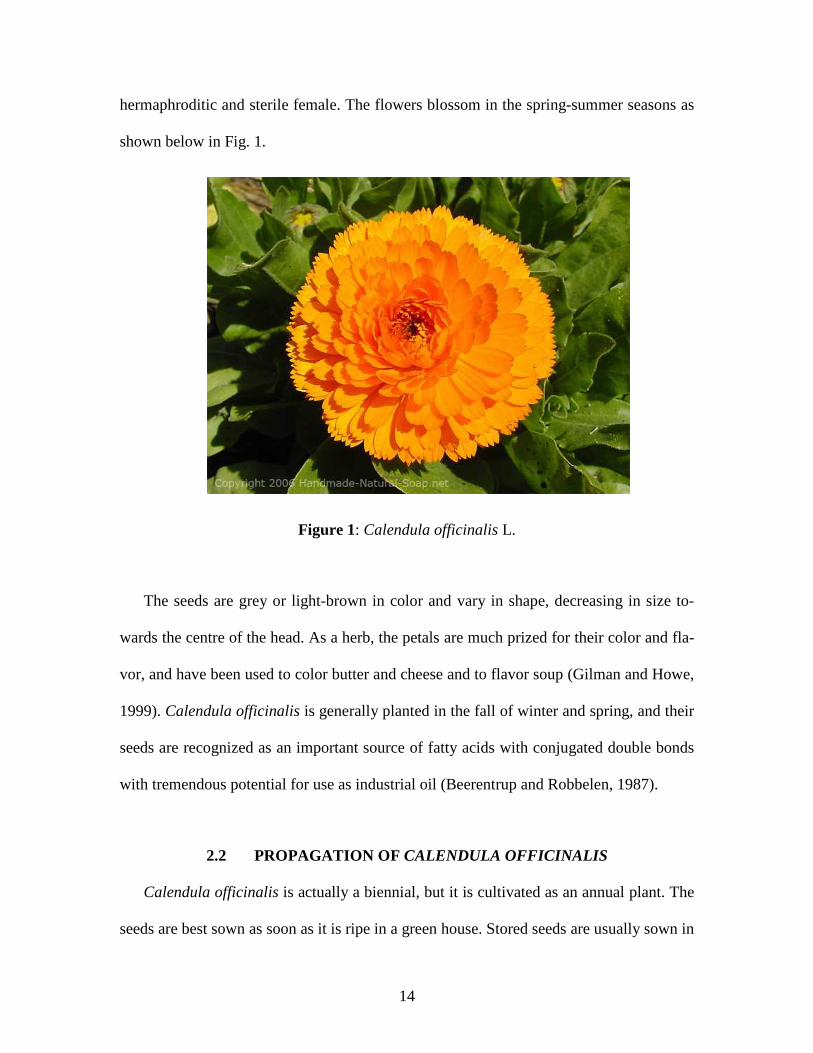
hermaphroditic and sterile female. The flowers blossom in the spring-summer seasons as
shown below in Fig. 1.
Figure 1: Calendula officinalis L.
The seeds are grey or light-brown in color and vary in shape, decreasing in size to-
wards the centre of the head. As a herb, the petals are much prized for their color and fla-
vor, and have been used to color butter and cheese and to flavor soup (Gilman and Howe,
1999). Calendula officinalis is generally planted in the fall of winter and spring, and their
seeds are recognized as an important source of fatty acids with conjugated double bonds
with tremendous potential for use as industrial oil (Beerentrup and Robbelen, 1987).
2.2 PROPAGATION OF CALENDULA OFFICINALIS
Calendula officinalis is actually a biennial, but it is cultivated as an annual plant. The
seeds are best sown as soon as it is ripe in a green house. Stored seeds are usually sown in
15
early spring in a greenhouse or in the field, and no treatment is needed. Seeds planting
could be commenced in-doors and then transplanted using 10 to 12 inches spacing. The
seed germinates well under conditions of high temperature and full sun. The seeds germi-
nate in one to two weeks and usually have about 80% germination. However, calendula
pests exist and they include whitefly, aphids, and thrips. Cucumber beetles and blister
beetles may also be a problem (Janke and DeArmond, 2004). Flowers are usually har-
vested by hand when they are completely open and have not gone to seed, as medicinal
properties are usually not active in plants that have gone to seed. Also, harvesting can be
done any time in the growing season but preferably in early summer in order for the new
plant to become established before winter.
2.3 CHEMICAL CONSTITUENTS OF CALENDULA OFFICINALIS
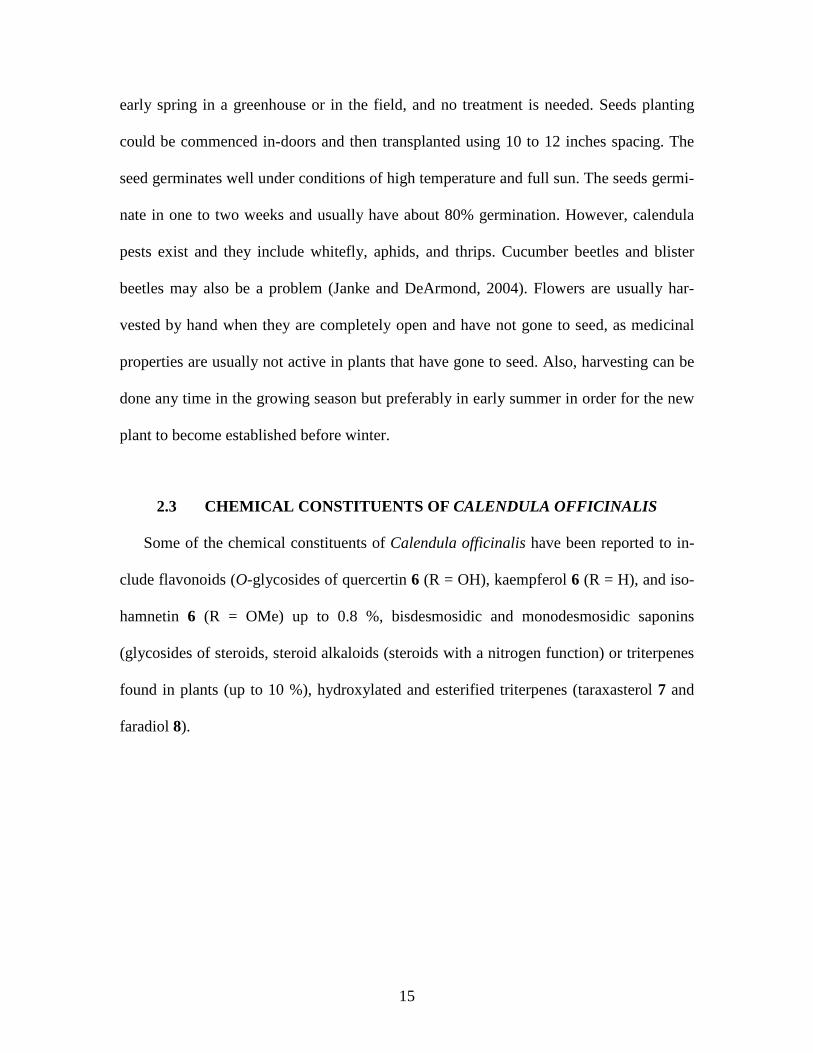
Some of the chemical constituents of Calendula officinalis have been reported to in-
clude flavonoids (O-glycosides of quercertin 6 (R = OH), kaempferol 6 (R = H), and iso-
hamnetin 6 (R = OMe) up to 0.8 %, bisdesmosidic and monodesmosidic saponins
(glycosides of steroids, steroid alkaloids (steroids with a nitrogen function) or triterpenes
found in plants (up to 10 %), hydroxylated and esterified triterpenes (taraxasterol 7 and
faradiol 8).
16
OHO
OH O
OH
R
OH
6
HOH
H
H
H
7
HOH
H
H
OH
8
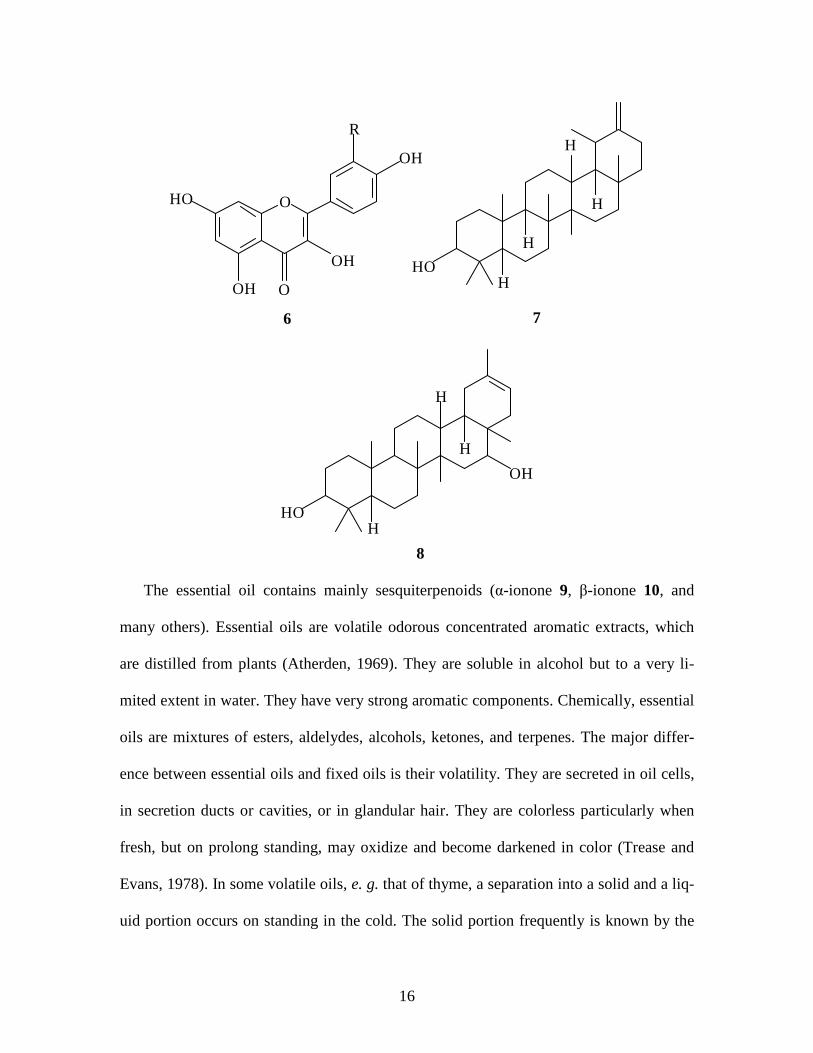
The essential oil contains mainly sesquiterpenoids (α-ionone 9, β-ionone 10, and
many others). Essential oils are volatile odorous concentrated aromatic extracts, which
are distilled from plants (Atherden, 1969). They are soluble in alcohol but to a very li-
mited extent in water. They have very strong aromatic components. Chemically, essential
oils are mixtures of esters, aldelydes, alcohols, ketones, and terpenes. The major differ-
ence between essential oils and fixed oils is their volatility. They are secreted in oil cells,
in secretion ducts or cavities, or in glandular hair. They are colorless particularly when
fresh, but on prolong standing, may oxidize and become darkened in color (Trease and
Evans, 1978). In some volatile oils, e. g. that of thyme, a separation into a solid and a liq-
uid portion occurs on standing in the cold. The solid portion frequently is known by the
17
name stearoptene, and the liquid portion is called eleoptene. Some of the stearoptene is of
commercial importance (e. g. thymol, camphor, and menthol).
O O
9 10
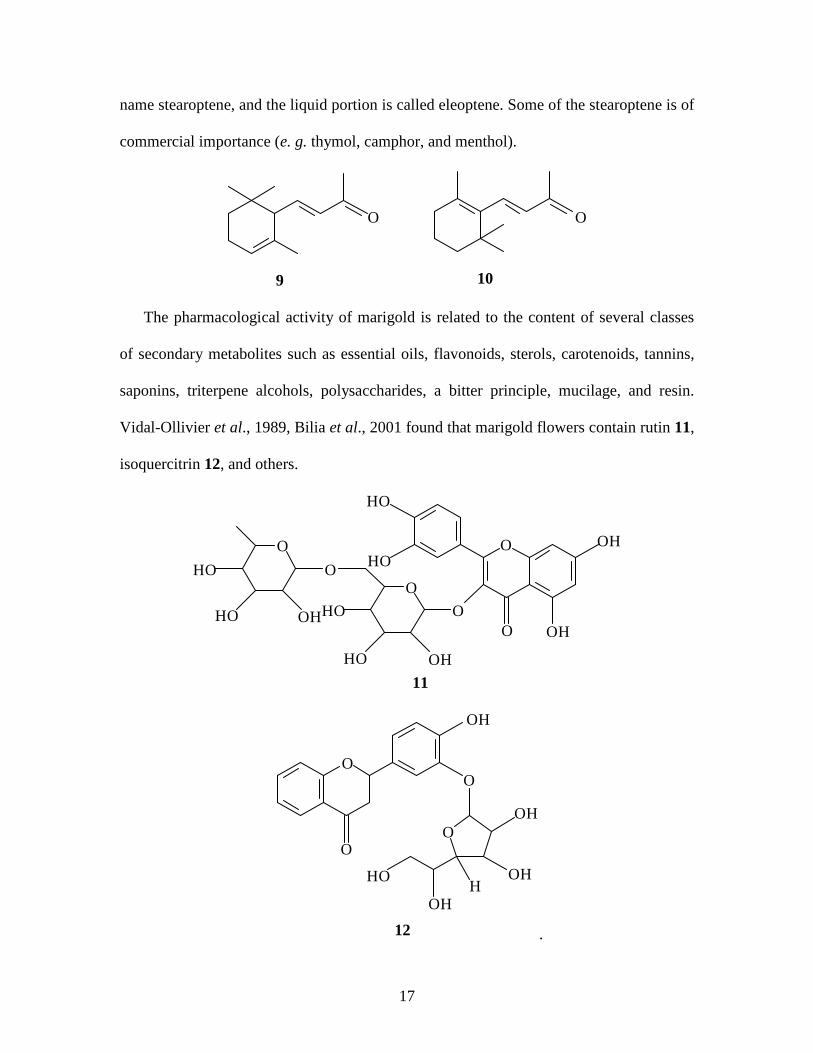
The pharmacological activity of marigold is related to the content of several classes
of secondary metabolites such as essential oils, flavonoids, sterols, carotenoids, tannins,
saponins, triterpene alcohols, polysaccharides, a bitter principle, mucilage, and resin.
Vidal-Ollivier et al., 1989, Bilia et al., 2001 found that marigold flowers contain rutin 11,
isoquercitrin 12, and others.
O
OO
O
O
HO
HO OHHO
HO OH
O OH
OH
HO
HO
11
O
O
OH
O
O
HOH
OH
OH
OH
12 .

18
Also present are coumarines (scopoletin 13), carotenoids, and polysaccharides (van
Wyk and Wink, 1997). The saponins, triterpenes, and flavonoids appear to be responsible
for wound-healing effects as they show anti-inflammatory and anti-microbial properties
(Jimenez-Medina et al., 2006). Also, Crabas (2003) reported that the essential oil of Ca-
lendula officinalis obtained from Italy contained methyl hexadecanoate 14 (23.8%), me-
thyl linoleate 15 (18.6%), methyl 9,12,15-octadecatrienoate 16 (17.2 %), methyl octade-
canoate 17 (4.8 %), methyl tetradecanoate 18 (4.6 %), γ-cadinene 19 and cubenol 20 (4.0
%), δ-cadinene 21 (3.2 %), α-cadinol 22 (1.8 %) and oplopanone 23 (1.3 %).
OHO
MeO
O
13
O
O
14
O
O
15
O
O
16
O
O
17
O
O
18

19
H
H
19
H
OH
20 21
O
OHH
23
OHH
H
22
2.4 USES OF CALENDULA OFFICINALIS
Calendula officinalis products are mainly used for external and local application to
treat slow-healing wounds, burns, dry skin, eczema, oral thrush, and hemorrhoids. It is
applied locally as a tincture, oil, or lotion and is considered an antiseptic. Taken internal-
ly it has anti-inflammatory (Dumenil et al., 1980) and spasmolytic effects and is effective
against inflammation of the mouth and throat. It also improves digestion, stimulates bile
production, heals gastric ulcers, and regulates menstrual disorders. The flowers are used
in foods to color and add flavor to local dishes, and contain essential oil, fatty acids, or-
ganic acids, bitter substances, mucilage, resin, rubber, cholesterolic esters, saponins, tri-
terpenic alcohols, ascorbic acid, and a mixture of natural dyes (Marczal et al., 1987). The
dried flowers are included in herbal teas to improve their appearance (van Wyk and
Wink, 2004). The crushed petals may be combined with olive oil to form an ointment for
20
external application to cuts, bruises, sores, and burns. The infusion is used to soothe wa-
tery irritated eyes, to relieve bronchial complaints, to treat liver disorders, and to induce
perspiration in case of fever.
Several clinical studies have shown that calendula has antimicrobial and antiviral ac-
tivity and wound healing capacity in skin tissue by inducing the formation of new blood
vessels, and has been approved in Europe for use in inflammation of the mouth and pha-
rynx, and for healing wounds and burns (Janke and DeArmond, 2004). Historically, ca-
lendula blossoms were used to color broth, rice, and other foods as a substitute for saf-
fron, but are now primarily used as skin cream, oil, or lotion (Janke and DeArmond,
2004).
Some of the other non-food applications of Calendula officinalis include their use in
paints, coatings and cosmetics (Muuse et al. 1992) and industrial nylon products. It is al-
so considered an ornamental plant in Cuba (Svanidze et al., 1975) and across Europe
(Cromack and Smith, 1998), and more than 35 properties have been attributed to the de-
coctions and tincture from the flowers such as anti-inflammatory, analgesic, antitumor,
antiulcer, bactericide, diuretic, tonic, and the healing of wounds and skin eruptions
(Duke, 1991). The seeds of Calendula officinalis are recognized as an important source
of fatty acids with conjugated double bonds with tremendous potential for use as indus-
trial oil (Beerentrup and Robbelen, 1987). The vast medicinal uses of this plant are prob-
ably due to the yield, quality and general properties of its essential oil.
Marigold is a herb of ancient medicinal repute. In traditional and homeopathic medi-
cine it has been used for skin complaints, wounds, and burns, conjunctivitis and poor
eyesight, menstrual irregularities, varicose veins, hemorrhoids, duodenal ulcers, etc.
21
(Wichtl, 1994). Marigold grows as a wild and common garden plant throughout Europe
and North America. The yellow or golden-orange flowers of marigold are used as spice,
tea, and medicine. They may be used either as fresh or dried, and can be made into tea,
tinctures, ointments, and creams.
2.5 RISK INVOLVED IN CALENDULA USAGE
Chemicals in calendula may result in a miscarriage if taken by a pregnant woman.
They may also interfere with conception if taken by either member of a couple trying to
conceive a child. Women who are breast-feeding and small children are advised to avoid
taking calendula orally and individuals who are allergic to any members of the daisy fam-
ily of plants may also have allergic reactions to calendula (EDrug Digest, 2004).
2.6 ISOLATION OF ESSENTIAL OILS
Several methods are available for the extraction of essential oils from plants. The iso-
lation of essential oils is facilitated by the properties of a compound such as vapor pres-
sure, solubility, polarity, and molecular size. The following methods can be used to iso-
late or extract essential oils: effleurage, pneumatic method, maceration, expression, sol-
vent extraction, distillation procedures, and liquid carbon dioxide method (Trease and
Evans, 1978; Srivastava, 1991; Igwe and Osinowo, 1996).
2.6.1 Effleurage
The most important center for the extraction of flower oils is Grasse, in the South of
France where the effleurage method is used and has its root. This method involves extrac-
22
tion of the volatile oil with cold fat. In the effleurage process, glass plates are covered
with a thin layer of purified fixed oil or fat upon which the fresh flowers are spread. The
essential oil gradually passes into the fat and the exhausted flowers are removed and re-
placed by a fresh supply until the fat is saturated with the volatile oil. In this process the
volatile oil is obtained in a fatty base. Then successive extractions with alcohol are ful-
filled. The alcoholic extracts may be put on the market as flower perfumes or the oil ob-
tained in a pure form by recovery of the alcohol (Trease and Evans, 1978; EB, 1990).
2.6.2 Pneumatic Method
This method is similar in principle to the effleurage process. It involves the passage
of a current of warm air through the flowers. The air, laden with suspended volatile oil, is
then passed through a spray of melted fat in which the volatile oil is absorbed. The vola-
tile oil, as in effleurage, is obtained from the fat by three successive extractions with al-
cohol.
2.6.3 Maceration
This involves the immersion of the flower into a melted fat at a temperature of about
40° to 80°C. This process, which is similar to effleurage, takes a shorter period of one to
two hours. The volatile oil can be sold in fatty base or extracted with alcohol to obtain
the pure oil (EB, 1990).
23
2.6.4 Expression
This method of isolation is often applied to citrus oils, e. g. oils from lemon, lime,
grape, tangerine, sweet and bitter orange, etc. Citrus oils are isolated from the peel by ex-
pression or cold pressing. This process involves the abrasion of peel and the removal of
the oil in an aqueous emulsion, which is subsequently separated in a centrifuge. Centri-
fuging of the aqueous emulsion separates the aqueous component and cell debris (EB,
1990). Expressed citrus oils have superior fragrance characteristics compared with distill-
ed oils, because of the absence of heat during processing and the presence of components
that would not be volatile in steam. They are also more stable to oxidation because of the
presence of anti-oxidants, such as tocopherol, which are not volatile in steam. The lack of
heat damage to the oil is also significant. The citrus oils are one of the most natural per-
fume materials in the sense that they can be used exactly as they occur in nature.
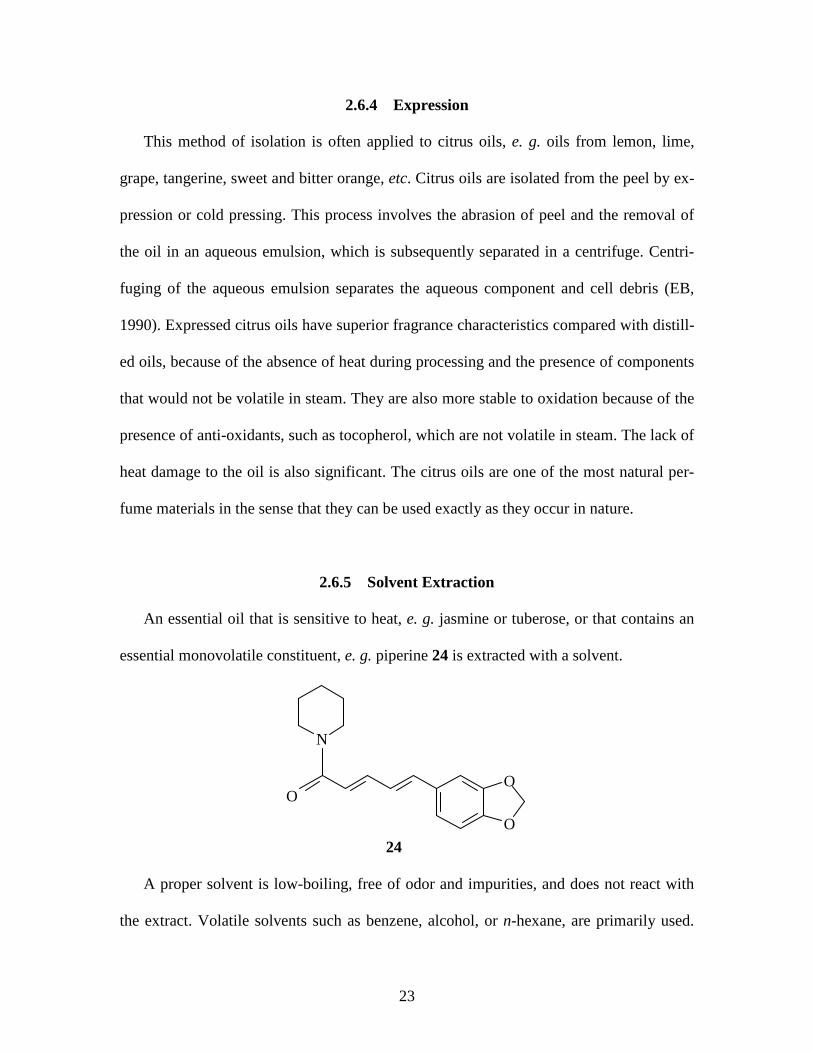
2.6.5 Solvent Extraction
An essential oil that is sensitive to heat, e. g. jasmine or tuberose, or that contains an
essential monovolatile constituent, e. g. piperine 24 is extracted with a solvent.
N
O
O
O
24
A proper solvent is low-boiling, free of odor and impurities, and does not react with
the extract. Volatile solvents such as benzene, alcohol, or n-hexane, are primarily used.
24
The freshly picked flowers are placed in specially constructed vessels and extracted at
room temperature. The dissolved oil carries waxes and coloring matter along with it. Dis-
tillation of semi-solid dark–colored mass can remove the solvent, which is called flora
concrete. In order to remove plant waxes from the floral concrete, the latter is dissolved
in alcohol. The mixture is cooled and filtered to remove solidified waxes. The filtrate is
then distilled to recover the viscous oil known as absolute (Conn and Stumpf, 1976).
2.6.6 Distillation Procedures
Distillation is by far the most common and important method of isolating essential oil
from a plant material. There are three types of distillation, namely steam distillation, wa-
ter distillation, and dry distillation (Igwe and Osinowo, 1996).
2.6.6.1 Steam Distillation
Essential oils are produced by a variety of methods as described in the above sections
of this chapter. Steam distillation is the most widely used. In this process the plant ma-
terial is suspended on a grid above the water level. The steam, which is normally generat-
ed in a separate boiler, is passed through the plant material via a pipe under the grid. The
steam and volatile oil are then condensed and the oil separated. The basic principle be-
hind the distillation of two heterogeneous liquids, such as water and an essential oil, is
that each exerts its own vapor pressure as if the other component were absent. When the
combined vapor pressure equals the surrounding pressure, the mixture starts to boil. Es-
sential oil components boil at a temperature close to the boiling point of water. The steam
and essential oil are condensed and separated. Essential oils produced in this way are fre-
quently different from the original in the plant material in a number of respects. Chemi-
25
cals, which are not volatile in steam, for example, phenyl ethanol (C6H4CH2CH2OH) in
rose oil, are mainly left behind in the still. Many of these non-volatile components are
responsible for the taste rather than fragrance effects. Some very volatile chemicals may
be lost in the distillation, and the process itself may induce chemical changes such as oxi-
dation or hydrolysis.
2.6.6.2 Water Distillation
In this process, a vessel containing water and the crushed plant material is heated by
direct flame. The water vapor and volatile oil are condensed and recovered by a water-
cooled condenser. This process is disadvantageous in that coming in contact with the
sides of the vessel can burn the material and this imparts a bad odor (still odor) to the fi-
nished product. The burnt character of still odor gradually reduces on storage of the oil.
2.6.6.3 Dry Distillation
Dry distillation is only suitable for a small range of essential oils and is often used to
distil the oil from exudates such as balsams. In the process, the vessel containing the
plant material on a grid is heated to prevent condensation of steam under vacuum (EB,
1990).
2.6.6.4 Hydrodiffusion
Hydrodiffusion is a variation of the normal steam distillation process and involves the
pulsing of the steam through the top of the vessel containing the plant material; the oil

26
and water mixture is then condensed from the bottom. This method reduces distillation
time and is particularly suitable for distilling seeds (Srivastava, 1991).
During distillation, the boiling water penetrates the plant tissues and dissolves a part
of the essential oil present in the oil-containing structures (cells, secretion ducts, cavities,
or glandular hairs). The aqueous solution diffuses through the cell membrane by the
process called hydrodiffusion. Immediately upon arrival at the surface, the essential oil is
vaporized. The process cycle continues until all the enclosed essential oil is removed
from the oil cells. The various components of the essential oils are liberated based on
their solubility in the boiling water rather than the order of their boiling points (Srivasta-
va, 1991). The oxygenated oil constituents, which are more soluble in boiling water than
the hydrocarbon carbon analogues, remain associated with the plant material to a lesser
extent (Beckett and Stenlake, 1986; Srivastava, 1991).
2.6.7 Liquid Carbon Dioxide Extraction Method
Extraction of the oils with supercritical or liquid carbon dioxide is a new process and
it provides the advantages of a cold process and the incorporation of some of the non-
volatile components. It is expensive in terms of plant and, in some cases, results in an un-
usual balance of extracted oil components.
The process is carried out using a specially designed high-pressure soxhlet apparatus
for extraction with carbon dioxide. The plant materials are charged into the extraction
columns, which are under high pressure (55–58 bar). The required amount of carbon dio-
xide is then slowly introduced into the column before commencing the extraction
process. The liquid CO2 flows through the extraction columns in turn and the last is satu-
27
rated with the essential oil. At the end of the extraction the column is taken and liquid
carbon dioxide is drained from it. The essential oils obtained by this method have been
found to be superior in quality and flavor as compared with the conventional steam dis-
tilled essential oils (Srivastava, 1981).
2.7 METHOD OF ANALYZING ESSENTIAL OILS
2.7.1 Gas Chromatography
Developed largely since 1951, this technique has become the preferred method for
rapid and accurate analysis of many volatile substances (Conn and Stumpf, 1976; Beckett
and Stenlake, 1986). The introduction of capillary gas chromatography to essential oil
analysis has unraveled the complete essential oil profiles, giving an overview of the dif-
ferent column types used in recent times.
In gas chromatography, the sample, e. g. essential oil, is introduced into a stream of
an inert gas, which is the mobile phase. The vaporized sample is swept through the liquid
stationary phase, which is held on an inert support in the column and the separated ana-
lytes flow through a detector, whose response is displayed on a computer or recorder. The
column must be hot enough to provide sufficient vapor pressure for analytes to be eluted
in a reasonable time. The detector is maintained at a higher temperature than the column,
so that the analytes are gaseous (Harris, 1999). In gas-liquid chromatography, separation
occurs as the vapor constituent’s partition between the gas and the liquid phases in the
same manner as other liquid–liquid chromatographic processes. The carrier gas must be
chemically inert and available in pure form, e. g. argon, helium, or nitrogen. A high-
28
density gas gives best efficiency but a low-density gas gives faster speed (Christian,
1977). The type of detector often dictates the choice of a gas.
The vast majority of analyses use long, narrow open tubular columns made of fused
silica (SiO2) and coated with polyimide (a plastic capable of withstanding 350°C) for
support and protection from atmospheric moisture. Column inner diameters are typically
0.10 to 0.53 mm. The open tubular designs offer higher resolution, shorter analysis time,
and greater sensitivity but have a lower capacity for sample when compared with packed
columns. Narrow open tubular columns provide higher resolution than wider open tubular
columns, but they require higher pressure to operate and have less sample capacity. These
open tubular columns are also known as capillary columns.
The capillary columns can either be wall-coated or support-coated designs. The wall-
coated column features a 0.1–5 mm-thick film of stationary liquid phase on the inner wall
of the column. Decreasing the thickness of the stationary phase increases resolution, de-
creases retention time, and decreases sample capacity. The support-coated design has sol-
id particles coated with stationary liquid phase attached to the inner wall of the column
(Harris, 1999).
The packed columns contain a fine solid support coated with non-volatile liquid sta-
tionary phase; or the solid itself may be the stationary (in gas solid chromatography). De-
spite their inferior resolution, packed columns are useful for preparative operations, when
a great deal of stationary phase is required, or to separate gases that are poorly retained.
Columns are usually made of stainless steel, nickel, or glass and are typically 3 – 6 mm in
diameter and 1–5 m in length (Harris, 1999).
29
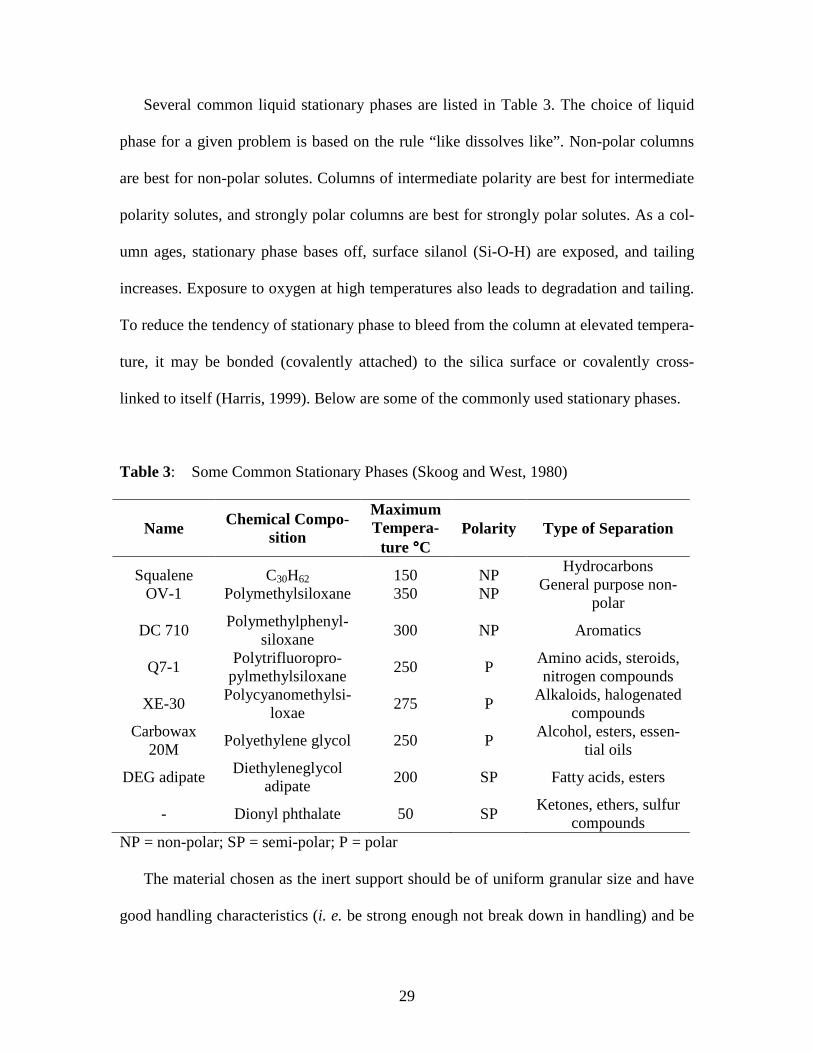
Several common liquid stationary phases are listed in Table 3. The choice of liquid
phase for a given problem is based on the rule “like dissolves like”. Non-polar columns
are best for non-polar solutes. Columns of intermediate polarity are best for intermediate
polarity solutes, and strongly polar columns are best for strongly polar solutes. As a col-
umn ages, stationary phase bases off, surface silanol (Si-O-H) are exposed, and tailing
increases. Exposure to oxygen at high temperatures also leads to degradation and tailing.
To reduce the tendency of stationary phase to bleed from the column at elevated tempera-
ture, it may be bonded (covalently attached) to the silica surface or covalently cross-
linked to itself (Harris, 1999). Below are some of the commonly used stationary phases.
Table 3: Some Common Stationary Phases (Skoog and West, 1980)
Name Chemical Compo-
sition
Maximum Tempera-ture °°°°C
Polarity Type of Separation
Squalene OV-1
C30H62 Polymethylsiloxane
150 350
NP NP
Hydrocarbons General purpose non-
polar
DC 710 Polymethylphenyl-
siloxane 300 NP Aromatics
Q7-1 Polytrifluoropro-
pylmethylsiloxane 250 P
Amino acids, steroids, nitrogen compounds
XE-30 Polycyanomethylsi-
loxae 275 P
Alkaloids, halogenated compounds
Carbowax 20M
Polyethylene glycol 250 P Alcohol, esters, essen-
tial oils
DEG adipate Diethyleneglycol
adipate 200 SP Fatty acids, esters
- Dionyl phthalate 50 SP Ketones, ethers, sulfur
compounds NP = non-polar; SP = semi-polar; P = polar
The material chosen as the inert support should be of uniform granular size and have
good handling characteristics (i. e. be strong enough not break down in handling) and be

30
capable of being packed into a uniform bed in a column. The surface area of the material
should be large so as to promote distribution of the liquid phase as a film and ensure the
rapid attainment of equilibrium between the stationary and mobile phases. The material
should be inert at elevated temperatures and be readily wetted by the liquid phase to give
a uniform coating. The most common supports are made from diatomaceous earths, e. g.
firebrick and kieselguhr. Firebrick which is solid under trade names such as chromosorb
P, C 22, and sterchamol, has the better strength and larger specific area (4 m2/g); its dis-
advantage lies in the fact that it is more active and, therefore, cannot be employed on po-
lar compounds. Kieselguhr is more fragile and has a smaller specific surface area (1
m2/g) but is less reactive; it is sold under such trade names as chromosorb W, celite, em-
bacel, and celatom.
The function of the detector, which is situated at the exit of the separation column, is
to sense and measure the small amounts of the separated components present in the carri-
er gas stream leaving the column. The output from the detector is fed to a recorder, which
produces a pen-trace called a chromatogram. The choice of detector depends on various
factors such as the concentration level to be measured and the nature of the separated
components. The most widely used detectors are the thermal conductivity and flame ioni-
zation detectors.
In thermal conductivity detector, the detection system is based upon changes in the
thermal conductivity of the gas stream; an instrument employed for this purpose is some-
times called a katharometer. As a gas is passed over a heated filament wire, the tempera-
ture and thus the resistance of the wire vary according to the thermal conductivity of the
gas. The purer carrier gas is passed over one filament, and the effluent gas containing the
31
sample constituents is passed over another. These filaments are in opposite arms of a
Wheatstone bridge circuit that measures the difference in their resistance. So long as
there is no sample gas in the effluent, the resistance of the wires is the same. But when-
ever a sample component is eluted with the carrier gas, a small resistance change occurs
in the effluent arm. The change, which is proportional to the concentration of the sample
component in the carrier gas, is registered on the recorder. Helium is the carrier gas
commonly used with a thermal conductivity detector. Helium has the second highest
thermal conductivity of any gas (after H2), so any analyte mixed with helium lowers the
thermal conductivity of the gas stream.
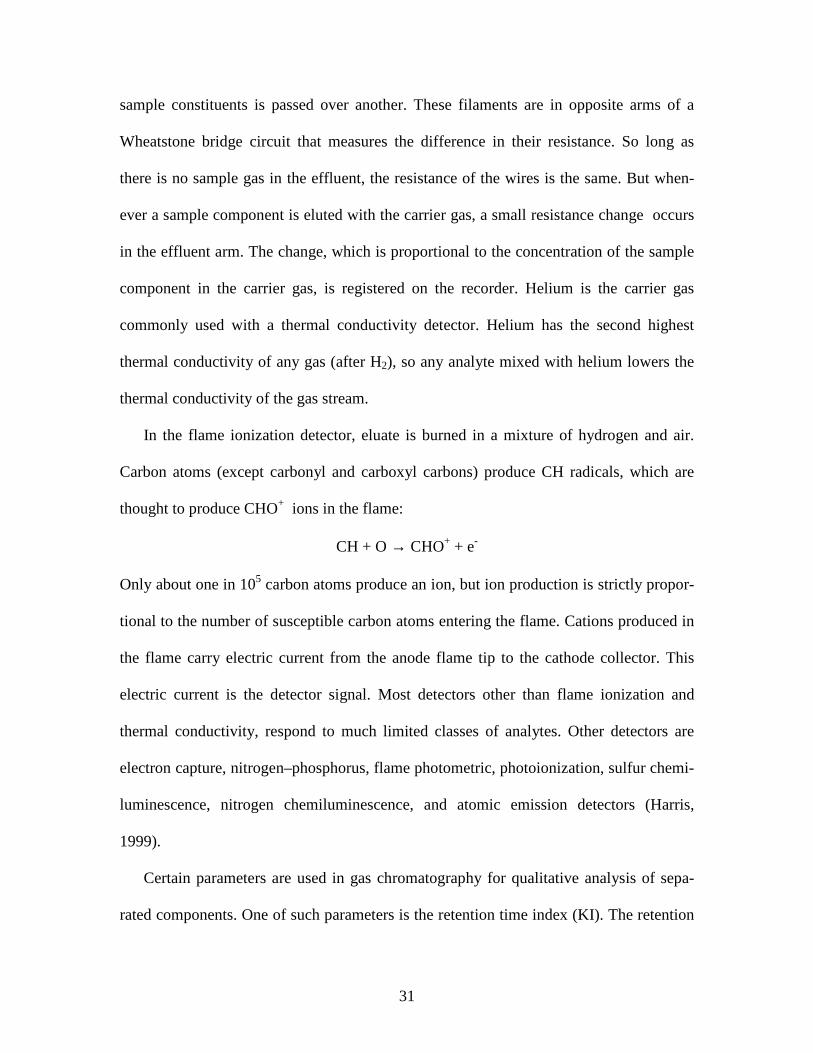
In the flame ionization detector, eluate is burned in a mixture of hydrogen and air.
Carbon atoms (except carbonyl and carboxyl carbons) produce CH radicals, which are
thought to produce CHO+ ions in the flame:
CH + O → CHO+ + e-
Only about one in 105 carbon atoms produce an ion, but ion production is strictly propor-
tional to the number of susceptible carbon atoms entering the flame. Cations produced in
the flame carry electric current from the anode flame tip to the cathode collector. This
electric current is the detector signal. Most detectors other than flame ionization and
thermal conductivity, respond to much limited classes of analytes. Other detectors are
electron capture, nitrogen–phosphorus, flame photometric, photoionization, sulfur chemi-
luminescence, nitrogen chemiluminescence, and atomic emission detectors (Harris,
1999).
Certain parameters are used in gas chromatography for qualitative analysis of sepa-
rated components. One of such parameters is the retention time index (KI). The retention
32
time index (KI) was proposed by Kovats (Goedert, 2006) as a qualitative parameter for
general use in reporting chromatographic data. The retention index is based upon a com-
parison between the position of an analyte peak and the peak for two or more normal pa-
raffins. That is, retention index relates the retention time of a solute to the retention times
of linear alkanes. By definition, the Kovats retention index for a linear alkane is equal to
100 times the number of carbon atoms in the compound, regardless of the columns used
or the chromatographic conditions.
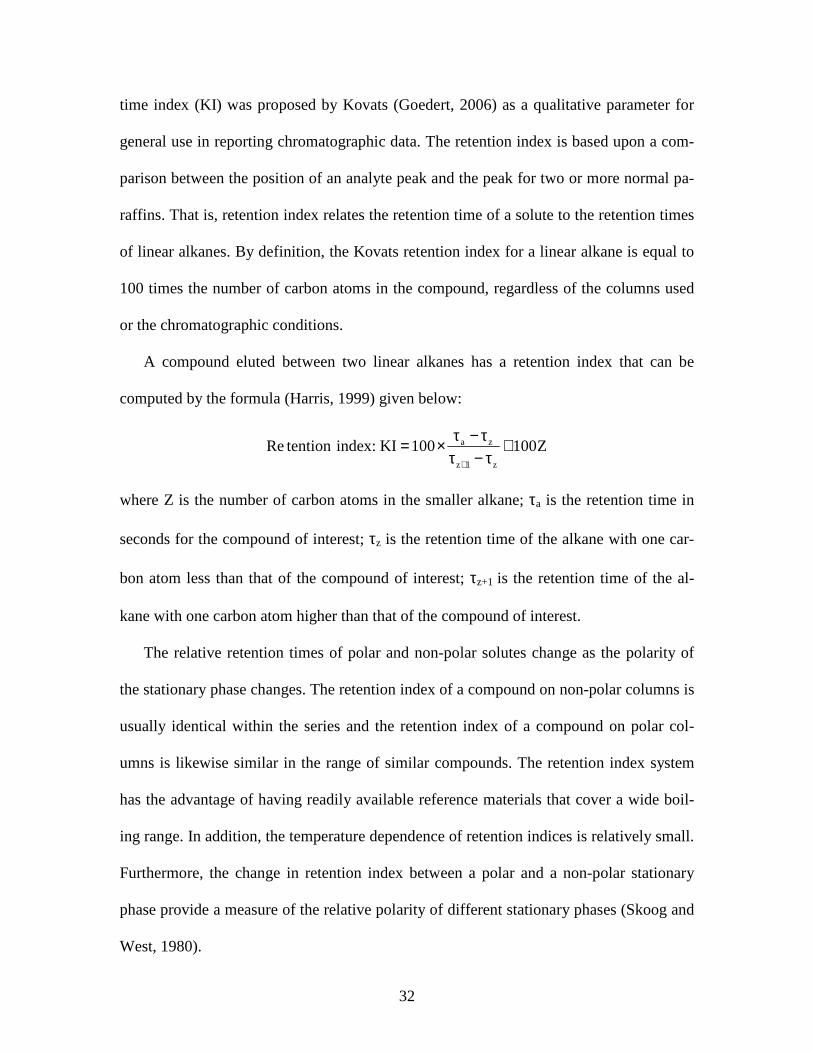
A compound eluted between two linear alkanes has a retention index that can be
computed by the formula (Harris, 1999) given below:
a z
z 1 z
Re tention index: KI 100 100Z+
τ − τ= × +τ − τ
where Z is the number of carbon atoms in the smaller alkane; τa is the retention time in
seconds for the compound of interest; τz is the retention time of the alkane with one car-
bon atom less than that of the compound of interest; τz+1 is the retention time of the al-
kane with one carbon atom higher than that of the compound of interest.
The relative retention times of polar and non-polar solutes change as the polarity of
the stationary phase changes. The retention index of a compound on non-polar columns is
usually identical within the series and the retention index of a compound on polar col-
umns is likewise similar in the range of similar compounds. The retention index system
has the advantage of having readily available reference materials that cover a wide boil-
ing range. In addition, the temperature dependence of retention indices is relatively small.
Furthermore, the change in retention index between a polar and a non-polar stationary
phase provide a measure of the relative polarity of different stationary phases (Skoog and
West, 1980).
33
2.7.2 Gas Chromatography – Mass-Spectroscopy (GC – MS)
Gas chromatographic columns have been directly interfaced to rapid-scan mass spec-
trometers, thus permitting the instantaneous display of the spectrum of each species as it
leaves the column. The excellent separation qualities of gas chromatography, combined
with the powerful technique for the identification properties of mass-spectrometry, pro-
vide the chemist with a most useful tool for analyzing complex mixtures. The combina-
tion of the two methods gives a powerful technique for the separation of complex consti-
tuents of essential oils and other volatile substances.
In mass spectrometry, gaseous molecules are ionized (usually to make cations), acce-
lerated by an electric field, and then separated according to their mass (Harris, 1999). The
ionization process usually imparts enough energy to the molecule to break it into a varie-
ty of fragments. Mass-spectrum is a graph showing the relative abundance of each frag-
ment striking the detector of the mass spectrometer. The mass spectrometer consists of
three major parts, which are the ion source, mass-analyzer and the detection system. A
characteristic feature of mass-spectrometry, which is not encountered in most optical me-
thods, is the need to maintain all of the components leading to the detector at low pres-
sures (10-4 to 10-8 torr); thus, the elaborate vacuum systems are an important part of mass
spectrometers. The operation of a typical analytical mass spectrometer is based on the
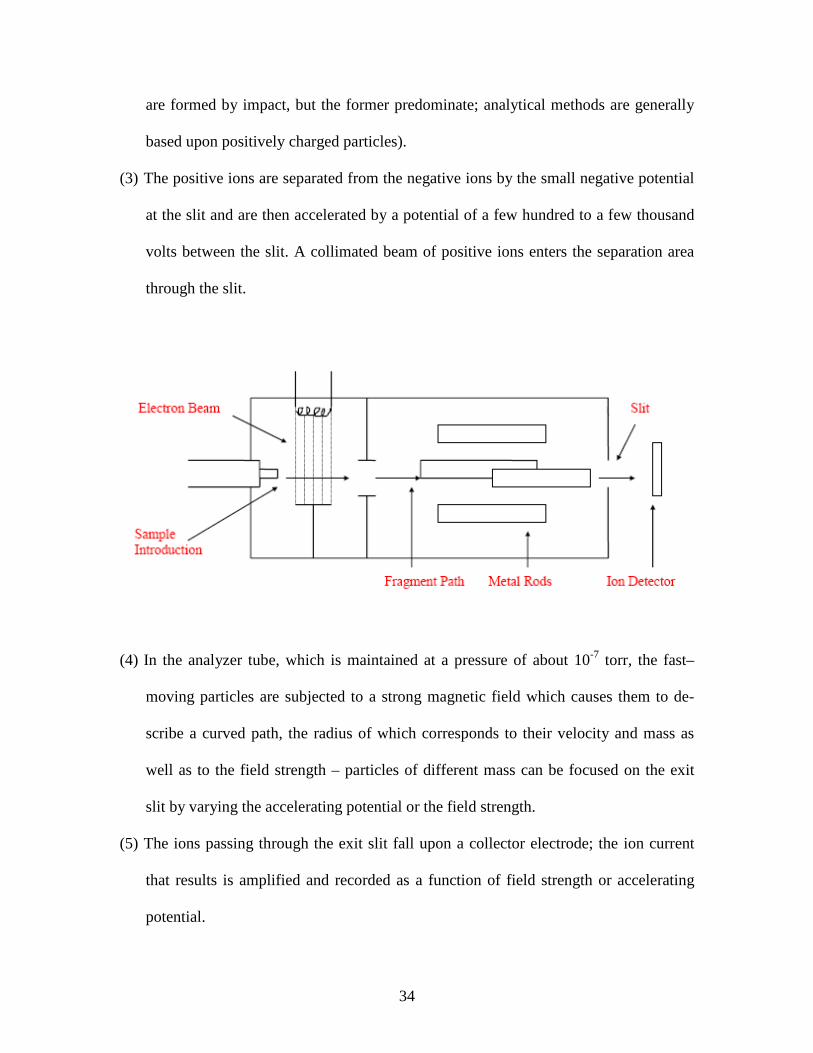
following sequence of events:
(1) A micromole (or less) of a sample is volatized and allowed to leak slowly into the io-
nization chamber, which is maintained at a pressure of about 10-5 torr.
(2) The molecules of the sample are ionized directly or indirectly by a stream of electrons
flowing from the heated filament toward an anode (both positive and negative ions
34
are formed by impact, but the former predominate; analytical methods are generally
based upon positively charged particles).
(3) The positive ions are separated from the negative ions by the small negative potential
at the slit and are then accelerated by a potential of a few hundred to a few thousand
volts between the slit. A collimated beam of positive ions enters the separation area
through the slit.
(4) In the analyzer tube, which is maintained at a pressure of about 10-7 torr, the fast–
moving particles are subjected to a strong magnetic field which causes them to de-
scribe a curved path, the radius of which corresponds to their velocity and mass as
well as to the field strength – particles of different mass can be focused on the exit
slit by varying the accelerating potential or the field strength.
(5) The ions passing through the exit slit fall upon a collector electrode; the ion current
that results is amplified and recorded as a function of field strength or accelerating
potential.

35
The sample of the material to be analyzed is introduced into the ion source by either
batch inlet or direct probe inlet systems. In batch inlet system, the sample is introduced as
a gas into a reservoir which is at a pressure greater than that within the ionization cham-
ber; while in direct probe inlet system, non-volatile or thermally unstable materials are
often introduced directly into the ion source by means of a sample probe, which is in-
serted through a vacuum lock. The separated components in the effluent stream of the
typical gas liquid chromatograph can be fed directly into the ion chamber.
When the gas stream reaches the ionization chamber, it is bombarded at right angles
by a beam of electron emitted by a hot filament. This leads to the removal of an electron
from the gaseous molecule to form the molecular ion (M+) or parent ion.
+ . M + ē → M + 2ē
The molecular ion under electron bombardment of minimum energy reaches the detector
and gives a mass-spectrum consisting almost entirely of a single peak corresponding to
the mass of the original molecule. Increasing the energy of the electron beam yields a
more highly excited ion that fragments if it is complex, or a second electron may be
knocked out.
In the analysis of essential oil using mass-spectrometry, electron impact (EI) and
chemical ionization (CI) methods are used for the ion production. Electron impact ioniza-
tion usually creates molecular fragments. The molecular ion, M+, might have a low abun-
dance or even be absent which makes the identification of an unknown substance diffi-
cult. Extensive fragmentation of large molecules makes their mass-spectra difficult to in-
terpret. Computer programs may be used to match the spectrum of an unknown to one or
more similar spectra in a library (Harris, 1999).
36
The chemical ionization is a gentle technique that yields less fragmentation. In this
case, the ionization source is filled with methane (CH4) at a pressure of about 10-5 to 10-7
torr. Energetic electrons convert CH4 to a variety of reactive products.
+ . CH4 + ē → CH4
+ 2ē
+ . . CH4
+ CH4 → CH5+ + CH3
CH5+ is a proton donor that reacts with analyte to give MH+, which is usually the most
abundant ion in the methane chemical ionization mass spectrum.
CH5++ M → CH4 + MH+
The mass spectrum by CI methods is always a simpler profile than those produced by
EI techniques. The CI spectrum displays a clearly visible protonated molecular ion (M +
1)+. The presence of this quasi-molecular ion aids greatly in identifying the molar mass of
the compound under investigation, particularly where EI techniques do not indicate any
M+ ions (Pecsoc. 1976).
GC–MS makes possible the identification of the hundreds of components that may be
present in natural and biological systems. For example, the interfacing of chromatogra-
phy with mass spectroscopy has permitted characterization of the odor and flavor compo-
nents of foods, identification of pollutants, medical diagnosis based on breath compo-
nents, and studies of drug metabolites (Skoog and West 1980).
A major problem in interfacing of a gas chromatograph with a mass-spectrometer
arises from the presence of the carrier gas, which dilutes the eluted components enorm-
ously and tends to swamp the pumping system of the spectrometer. Several methods have
37
been developed for overcoming this problem. One of the solutions to the problem is that
the exit gases flow through a fritted glass tube situated in an evacuated chamber. The
smaller atoms or molecules of the carrier gas (He or H2) diffuse readily through the walls
of the tube and are pumped away, leaving the molecules of the eluted sample; these are
then led directly into the ion source of the mass spectrometer (Skoog and West, 1980).
2.7.3 Microbial Assays
Microbial assay designates a type of biological assay, specifically, a biological assay
performed with microorganisms, e. g. bacteria, yeast and moulds. Biological assay refers
to the measurement of the relative potency of activity of compounds by determining the
amount required producing a stipulated effect on a suitable test animal or organ under
standard conditions (Katocs, 1995).
Antimicrobial agents are chemical or biological agents that can either destroy or inhi-
bit the growth of microorganisms. Such agents can be antibacterial, antifungal, antiviral
or antiprotozoan depending on the kind of microorganisms against which they are found
effective.
The chemical agent at low concentrations should have a broad spectrum of antimi-
crobial activity, which implies that it should kill or inhibit the growth of many kinds of
microbes. Antibiotics are initially referred to as substances, produced by one microorgan-
ism, which inhibit the growth of other microorganisms. The advent of synthetic method
has, however, resulted in a modification of this definition and they are now referred to as
substances produced by a microorganism, or to a similar substance (produced wholly or

38
partly by chemical synthesis), which in low concentration inhibits the growth of other
microorganism.
Antimicrobial agents perform their work by killing or inhibiting the growth of micro-
organisms. The mechanism of their action is by damaging some structures of the cell like
cell wall or the cytoplasmic membrane or substances within the cytoplasm, such as en-
zymes, ribosome or nuclear material. Microbial agents kill microorganisms while micro-
biostatic agents inhibit the growth of organisms.
Certain parameters may be considered to have effect on the antimicrobial assay of
essential oils. These parameters are the method of assay, the medium, microorganisms
and the composition of the essential oils.
2.7.3.1 Antimicrobial Assay Of Essential Oils
The antimicrobial activity measurement of essential oils poses some difficulties be-
cause of their volatility, complexity and water insolubility. The parameters, which may
affect the antimicrobial assay of essential oils, are briefly discussed below.
2.7.3.1.1 The Assay Technique
The two assay techniques namely agar-plate and tube-dilution techniques are com-
mon laboratory techniques. For antimicrobial assay of essential oils, the agar-plate me-
thod is commonly used, as it does not require homogenous dispersion of the oil in water.
The method requires reservoirs like the paper disc or cylinders placed on the surface of
the medium and holes bored on the medium. A plate of nutrient agar medium is then in-
oculated with the test organism and the essential oil is instilled into the discs or cylinders.

39
On the other hand, small volume of the essential oils is placed in the holes bored on the
medium. The plate is observed for zone of inhibition after incubation for 48 hours.
2.7.3.1.2 The Assay Medium
The growth medium is the artificially created habitat where an organism is expected
to grow. The constituents of the medium must not react or alter the components of essen-
tial oil or vice versa. Any change in the constituents of the medium affects the growth of
the organism.
2.7.3.1.3 Microorganisms
In the microbial assay of essential oils both Gram-positive and Gram-negative organ-
isms are tested. The minimum inhibitory concentration (MIC) values may vary from one
essential oil to another using the same microorganisms.
The test period for an organism may also affect the assay. The test period for fungi is
generally long; this may facilitate the decomposition or evaporation of the oil and this
may affect the zones of inhibition.
If any change occurs in the composition of essential oil, this will invariably affect the
microbial activity of the essential oil. Essential oils are water insoluble and to enhance
their solubility, solvents like ethanol, methanol, and dimethylsulfoxide are used to dis-
solve them so as to be able to measure their minimum inhibitory concentration. Essential
oils have direct proportionality between their concentration and antimicrobial activity
against test organisms.

40
2.8 PAST WORKS ON ESSENTIAL OIL
Problems of resistance and environmental degradation and pollution associated with
irrational use of orthodox medicines have necessitated renewed interests in nature as
source of effective and safe alternatives in the management of human infections. Thus, in
recent years, there has been a phenomenal rise in the interest of scientific community to
explore the pharmacological activities of medicinal plants and to confirm the claims
made about them in folklore medicines (Chah et al., 2006). This has led to research
works on the elucidation of the compositions of many essential oils.
A report on chemical constituents of the essential oils from ripe and unripe Iriboaka
capsicum revealed the presence n-butanoic acid, 3–methyl–, and 4–methyl-n-pentylester
as the most abundant constituents. Other acids and esters found in Iriboaka capisum in-
clude n-pentanoic acid, 1–methyl-n-pentylester; n-decanoic acid, and methylester. The
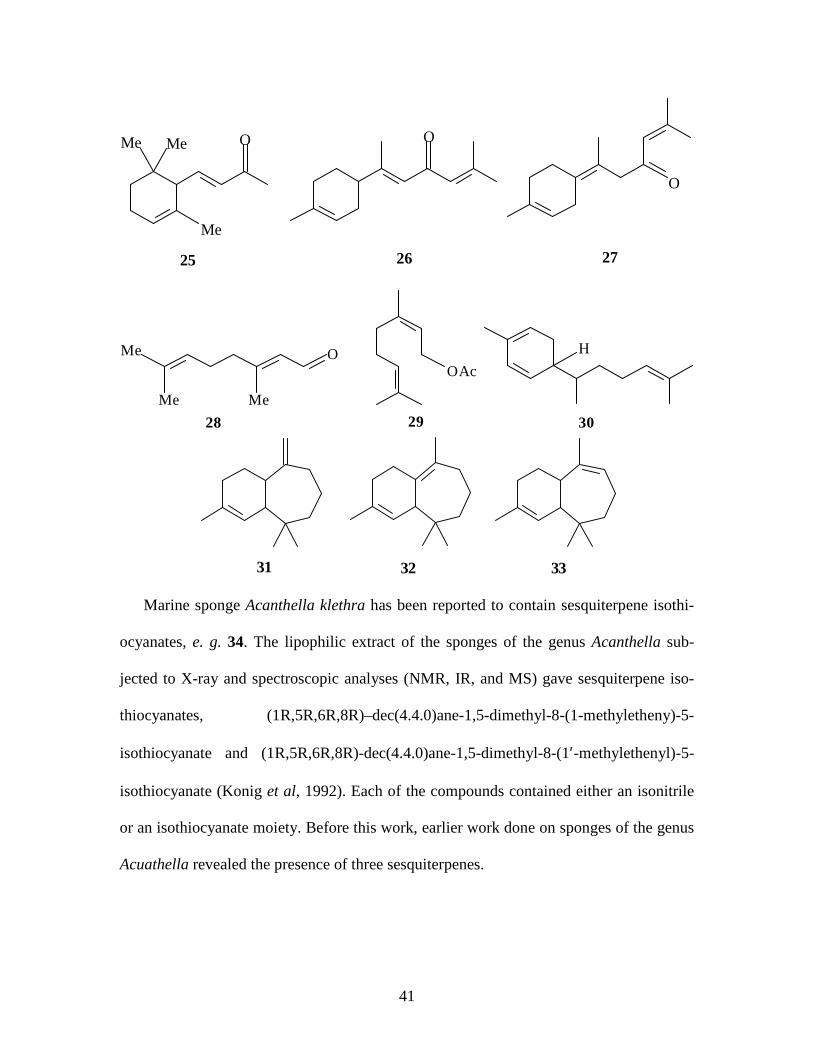
ketones, α-lonone 25, α - and γ–atlantone 26 and 27, 4–fluoro-n-butylmethyl ketone; ace-
tophenone; n-nonylmethyketone and 4-n-heptenylmethylketone as well as the aldehydes
geranial 28, iso-dodecyl aldehyde; 4-methylbenzaldehyde and tridecyl aldehyde were re-
ported for the first time in the essential oils of genus capisum. The terpenes neryl acetate
29, zingiberene 30, (-)–α–, β, and γ– himachalene 31-33, and the ethers 4–n-pentenyl me-
thyl ether; 2–n-propyl-nona–5,7–dienylethyl ether, and 2–n-propyl-non–7-enylethyl ether
were also reported for the first time in the essential oils of genus capisum (Agbakwuru,
1993).
41
Me Me O
Me
25
O
26
O
27
Me
Me
O
Me
28
OAc
29
H
30
31 32 33
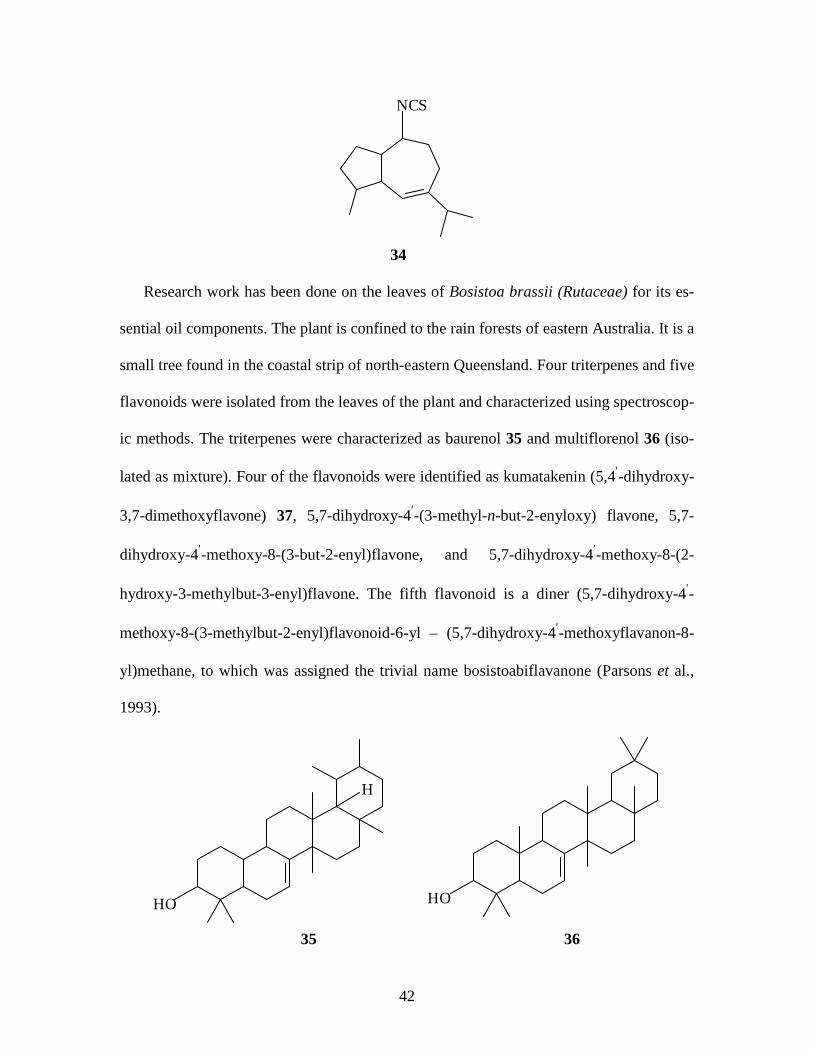
Marine sponge Acanthella klethra has been reported to contain sesquiterpene isothi-
ocyanates, e. g. 34. The lipophilic extract of the sponges of the genus Acanthella sub-
jected to X-ray and spectroscopic analyses (NMR, IR, and MS) gave sesquiterpene iso-
thiocyanates, (1R,5R,6R,8R)–dec(4.4.0)ane-1,5-dimethyl-8-(1-methyletheny)-5-
isothiocyanate and (1R,5R,6R,8R)-dec(4.4.0)ane-1,5-dimethyl-8-(1′-methylethenyl)-5-
isothiocyanate (Konig et al, 1992). Each of the compounds contained either an isonitrile
or an isothiocyanate moiety. Before this work, earlier work done on sponges of the genus
Acuathella revealed the presence of three sesquiterpenes.
42
NCS
34
Research work has been done on the leaves of Bosistoa brassii (Rutaceae) for its es-
sential oil components. The plant is confined to the rain forests of eastern Australia. It is a
small tree found in the coastal strip of north-eastern Queensland. Four triterpenes and five
flavonoids were isolated from the leaves of the plant and characterized using spectroscop-
ic methods. The triterpenes were characterized as baurenol 35 and multiflorenol 36 (iso-
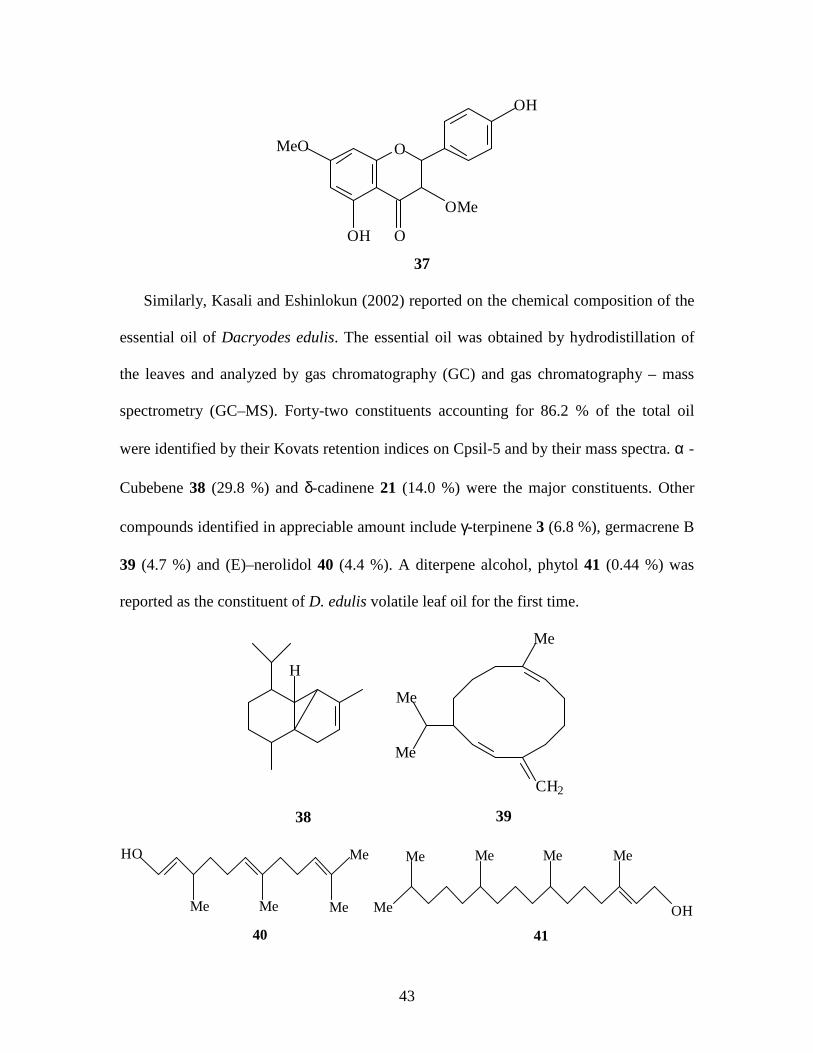
lated as mixture). Four of the flavonoids were identified as kumatakenin (5,4′-dihydroxy-
3,7-dimethoxyflavone) 37, 5,7-dihydroxy-4′-(3-methyl-n-but-2-enyloxy) flavone, 5,7-
dihydroxy-4′-methoxy-8-(3-but-2-enyl)flavone, and 5,7-dihydroxy-4′-methoxy-8-(2-
hydroxy-3-methylbut-3-enyl)flavone. The fifth flavonoid is a diner (5,7-dihydroxy-4′-
methoxy-8-(3-methylbut-2-enyl)flavonoid-6-yl – (5,7-dihydroxy-4′-methoxyflavanon-8-
yl)methane, to which was assigned the trivial name bosistoabiflavanone (Parsons et al.,
1993).
HO
H
35
HO
36
43
OMeO
OH O
OMe
OH
37
Similarly, Kasali and Eshinlokun (2002) reported on the chemical composition of the
essential oil of Dacryodes edulis. The essential oil was obtained by hydrodistillation of
the leaves and analyzed by gas chromatography (GC) and gas chromatography – mass
spectrometry (GC–MS). Forty-two constituents accounting for 86.2 % of the total oil
were identified by their Kovats retention indices on Cpsil-5 and by their mass spectra. α -
Cubebene 38 (29.8 %) and δ-cadinene 21 (14.0 %) were the major constituents. Other
compounds identified in appreciable amount include γ-terpinene 3 (6.8 %), germacrene B
39 (4.7 %) and (E)–nerolidol 40 (4.4 %). A diterpene alcohol, phytol 41 (0.44 %) was
reported as the constituent of D. edulis volatile leaf oil for the first time.
H
38
Me
Me
CH2
Me
39
HO Me
Me Me Me
Me Me Me Me
Me OH
40 41
44
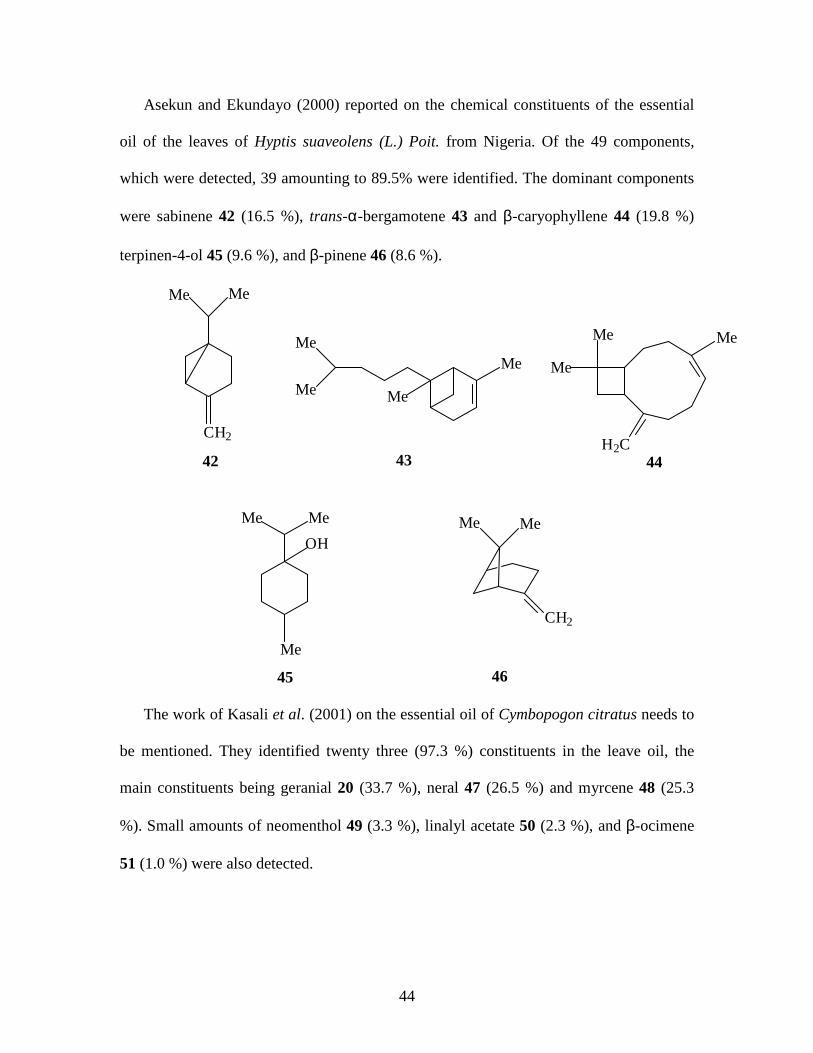
Asekun and Ekundayo (2000) reported on the chemical constituents of the essential
oil of the leaves of Hyptis suaveolens (L.) Poit. from Nigeria. Of the 49 components,
which were detected, 39 amounting to 89.5% were identified. The dominant components
were sabinene 42 (16.5 %), trans-α-bergamotene 43 and β-caryophyllene 44 (19.8 %)
terpinen-4-ol 45 (9.6 %), and β-pinene 46 (8.6 %).
Me Me
CH2
42
Me
Me Me
Me
43
Me
Me
Me
H2C44
Me Me
OH
Me
45
Me Me
CH2
46
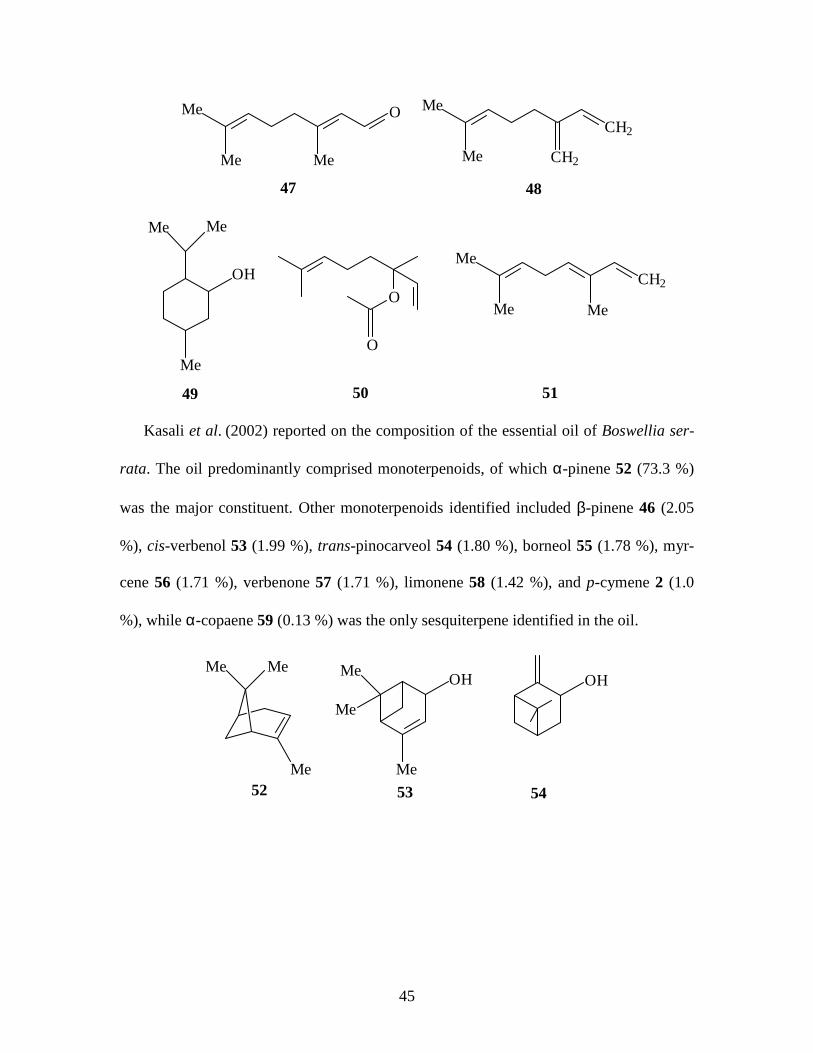
The work of Kasali et al. (2001) on the essential oil of Cymbopogon citratus needs to
be mentioned. They identified twenty three (97.3 %) constituents in the leave oil, the
main constituents being geranial 20 (33.7 %), neral 47 (26.5 %) and myrcene 48 (25.3
%). Small amounts of neomenthol 49 (3.3 %), linalyl acetate 50 (2.3 %), and β-ocimene
51 (1.0 %) were also detected.
45
Me
Me Me
O
47 48
Me
Me CH2
CH2
Me Me
OH
Me
49
O
O
50
Me
Me Me
CH2
51
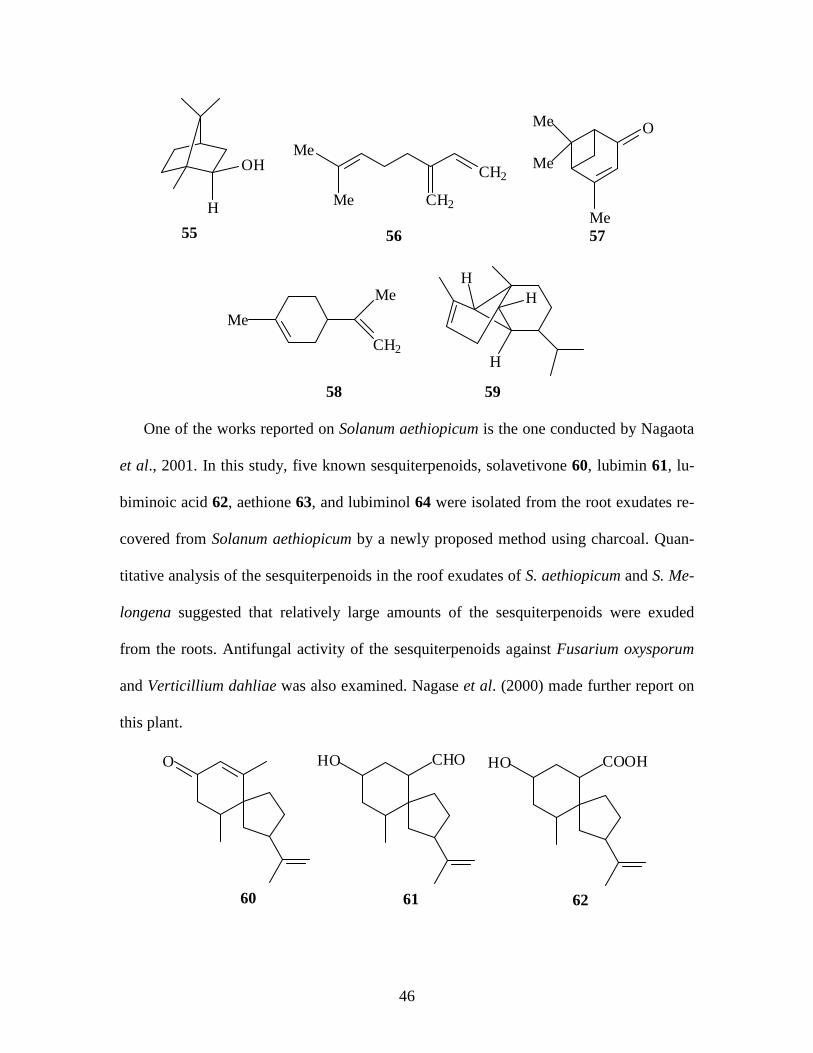
Kasali et al. (2002) reported on the composition of the essential oil of Boswellia ser-
rata. The oil predominantly comprised monoterpenoids, of which α-pinene 52 (73.3 %)
was the major constituent. Other monoterpenoids identified included β-pinene 46 (2.05
%), cis-verbenol 53 (1.99 %), trans-pinocarveol 54 (1.80 %), borneol 55 (1.78 %), myr-
cene 56 (1.71 %), verbenone 57 (1.71 %), limonene 58 (1.42 %), and p-cymene 2 (1.0
%), while α-copaene 59 (0.13 %) was the only sesquiterpene identified in the oil.
Me Me
Me52
Me
Me
OH
Me
53
OH
54
46
H
OH
55
Me
Me CH2
CH2
56
Me
Me
O
Me57
Me
Me
CH2
HH
H
58 59
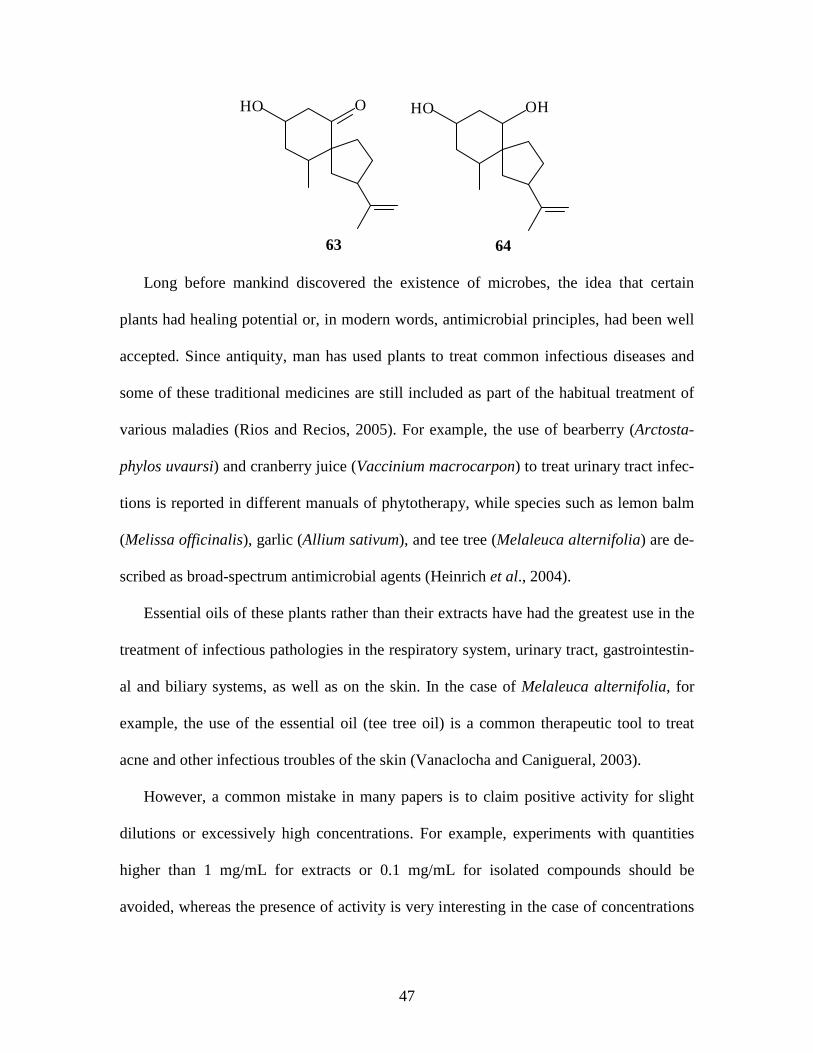
One of the works reported on Solanum aethiopicum is the one conducted by Nagaota
et al., 2001. In this study, five known sesquiterpenoids, solavetivone 60, lubimin 61, lu-
biminoic acid 62, aethione 63, and lubiminol 64 were isolated from the root exudates re-
covered from Solanum aethiopicum by a newly proposed method using charcoal. Quan-
titative analysis of the sesquiterpenoids in the roof exudates of S. aethiopicum and S. Me-
longena suggested that relatively large amounts of the sesquiterpenoids were exuded
from the roots. Antifungal activity of the sesquiterpenoids against Fusarium oxysporum
and Verticillium dahliae was also examined. Nagase et al. (2000) made further report on
this plant.
O HO CHO HO COOH
60 61 62
47
HO O HO OH
63 64
Long before mankind discovered the existence of microbes, the idea that certain
plants had healing potential or, in modern words, antimicrobial principles, had been well
accepted. Since antiquity, man has used plants to treat common infectious diseases and
some of these traditional medicines are still included as part of the habitual treatment of
various maladies (Rios and Recios, 2005). For example, the use of bearberry (Arctosta-
phylos uvaursi) and cranberry juice (Vaccinium macrocarpon) to treat urinary tract infec-
tions is reported in different manuals of phytotherapy, while species such as lemon balm
(Melissa officinalis), garlic (Allium sativum), and tee tree (Melaleuca alternifolia) are de-
scribed as broad-spectrum antimicrobial agents (Heinrich et al., 2004).
Essential oils of these plants rather than their extracts have had the greatest use in the
treatment of infectious pathologies in the respiratory system, urinary tract, gastrointestin-
al and biliary systems, as well as on the skin. In the case of Melaleuca alternifolia, for
example, the use of the essential oil (tee tree oil) is a common therapeutic tool to treat
acne and other infectious troubles of the skin (Vanaclocha and Canigueral, 2003).
However, a common mistake in many papers is to claim positive activity for slight
dilutions or excessively high concentrations. For example, experiments with quantities
higher than 1 mg/mL for extracts or 0.1 mg/mL for isolated compounds should be
avoided, whereas the presence of activity is very interesting in the case of concentrations

48
below 100 µg/mL for extracts and 10 µg/mL for isolated compounds (Rios and Recios,
2005).
49
CHAPTER 3
MATERIALS AND METHODS
3.1 SEED COLLECTION, SOIL PREPARATION, AND CULTIVA TION OF
THE PLANT
The seeds of Calendula officinalis were collected from a cultivated garden within the
University of Fort Hare campus. They were planted in the nursery in the greenhouse of
the Botany Department. Individual plants were grown in polythene bags. The soil was
collected from the University Research Farm, dried for about 48 h, sieved through a 2
mm wire mesh (Ingram, 1993) and homogenized before filling the polythene bags. All
plants were adequately watered as required. Harvesting was not done during the first two
weeks following transplanting; this was to allow the seedlings overcome the shock of
transplanting and establish themselves in the new soils. Thereafter, the leaves were har-
vested at weekly intervals until full flowering stage. After each harvesting the fresh
leaves were weighed and hydrodistilled for 3 h in an all-glass Clevenger apparatus in ac-
cordance with the British Pharmacopoeia method (British Pharmacopoeia, 1980).
3.2 PLANT COLLECTION AND DISTILLATION OF THE ESSEN TIAL OILS
Fresh materials of Calendula officinalis were collected from one population within
the University of Fort Hare, Alice campus in the Eastern Cape Province of South Africa,
latitudes 30°00′–34°15′S and longitudes 22°45′–30°15′E in September 2005. A voucher
specimen (OKOH/01) was deposited at the University Herbarium.
50
The fresh plant materials were carefully separated into leaves and flowers. Some of the
leaves were air dried at room temperature (18°C) for seven days. About 500 g, 200 g and
250 g of the fresh leaves, dry leaves, and fresh flowers, respectively, were hydrodistilled
separately for 3 h in an all-glass Clevenger apparatus in accordance with the British
pharmacopoeia method (British Pharmacopoeia, 1980).
3.3 SOIL ANALYSIS
The sieved soil samples were digested at 360°C for 2 h using the selenium powder,
lithium sulfate, hydrogen peroxide, and sulfuric acid digestion mixture (Anderson and
Ingram, 1993). Total phosphorus was determined from the digest using the colorimetric
method without pH adjustment (Okalebo et al. 2002 ). Total K, Mg, Na, Ca, Fe, Cu, and
Mn content were determined in the digest using the atomic absorption spectrometer. The
soil particle size analysis was carried out using the hydrometer method while pH and
electric conductivity were determined using the methods described by Okalebo et al.
2002.
3.4 GC-MS ANALYSES AND IDENTIFICATION OF COMPONENT S
The GC-MS analyses were carried out using Hewlett-Packard HP 5973 mass spec-
trometer interfaced with an HP-6890 gas chromatograph with an HP5 column. The fol-
lowing conditions were used: initial temperature 70°C, maximum temperature 325°C,
equilibration time 3 min, ramp 4°C / min, final temperature 240°C; inlet: split less, initial
temperature 220°C, pressure 8.27 psi, purge flow 30 mL / min, purge time 0.20 min, gas

51
type helium; column: capillary, 30 m × 0.25 mm, film thickness 0.25 µm, initial flow 0.7
mL / min, average velocity 32 cm / s; MS: EI method at 70 eV.
The components of the oils were identified by matching their mass spectra and reten-
tion indices with those of the Wiley 275 library (Wiley, New York) in the computer li-
brary and literature (Shibamoto, 1987). The yield of the oil was calculated per gram of
the plant material, while the percentage composition was calculated from summation of
the peak areas of the total oil composition.
3.5 ISOLATION OF COMPOUNDS FROM Calendula officinalis
3.5.1 Plant Materials
The leaves of Calendula officinalis were collected from a cultivated garden in Alice,
South Africa. The plant was authenticated by Prof. Afolayan and a voucher specimen was
deposited in the herbarium of the University of Fort Hare.
3.5.2 General Analysis
The 1H, 13C and DEPT 135 (Distortionless Enhancement of Polarization Transfer
using a 135° decoupler pulse) NMR spectra (in methanol-d4) were obtained on a Bruker
Avance DPX 300 spectrometer (300 MHz); melting points were recorded on Stuart
Scientific (SMPI) apparatus; vacuum liquid chromatography (VLC) and column chroma-
tography (CC) experiments were achieved using silica gel 60 (particle size 0.063-0.200
mm, Merck); preparative TLC was carried out using silica gel 60 PF254+366 precoated
alumina sheets (Merck); visualization of compounds was done under UV lamp (254 and
365 nm) and using vanillin-sulfuric acid spray. The IR spectra were recorded using Per-
52
kin-Elmer 2000 FTIR spectrophotometer, spectrum version 5.3. The solutions of the iso-
lates liquid were prepared (1 × 10⁻³ M concentration) and placed into a 1-cm spectral cu-
vette.
3.5.3 Extraction and Isolation
Fresh plant material were collected and air-dried at room temperature. The dried ma-
terial (1 kg) was milled to a fine texture and extracted with ethanol for 48 hours at room
temperature, with gentle and continuous shaking using a Labotec 201 orbital shaker. Af-
ter filtering, the residue was again extracted four times. Filtrate were combined and con-
centrated to dryness under reduced pressure using a Buchi rotary evaporator at a maxi-
mum temperature of 40°C. The mass of the combined crude extracts was 67 g and this
crude extract was subjected to vacuum liquid chromatography using an elution gradient
as follows: petroleum ether (100%); petroleum ether / CHCl3 (9 : 1); petroleum ether /
CHCl3 (7 : 3); petroleum ether / CHCl3 (5:5); CHCl3 (100%); CHCl3 / EtOAc (8:2); CHCl3
/ EtOAc (5:5); EtOAc (100%); EtOAc / MeOH (8:2); EtOAc / MeOH (5:5), and finally
MeOH (100%). A total of 113 fractions of 20 ml each were collected. The combined frac-
tions 59 to 65 were loaded using 100% CHCl3 then followed by chloroform / ethyl ace-
tate (8:2) with increasing polarity to 50% ethyl acetate. It was later eluted with petroleum
ether / toluene / ethyl acetate (3 : 5 : 10). Fourteen fractions each with 50 mL were col-
lected. Fractions 1 to 6 were combined to give A, fractions 7 to 12 were combined to give
B, fractions 13 to 21 were combined to give C, fractions 22 to 27 were combined to give
D, fractions 28 to 35 were combined to give E, fractions 36 to 40 were combined to give
F, fractions 41 to 52 were combined to give G, fractions 53 to 56 were combined to give
53
H, fractions 57 to 73 were combined to give I, fractions 74 to 83 were combined to give
J, fractions 84 to 88 were combined to give K, fractions 89 to 97 were combined to give
L, fractions 98 to 102 were combined to give M, fractions 103 to 113 were combined to
give N. Fractions 13 to 21 were subjected to preparative TLC and developed three times
using petroleum ether / toluene / ethyl acetate (3 : 5 : 10) to give a pure compound. Frac-
tions 57 to 73 were also subjected to preparative TLC and developed three times using
petroleum ether / toluene / ethyl acetate (3 : 5 : 10) to give a pure compound. The struc-
tures were obtained through NMR and IR spectral analysis and by comparing with the
available data in the literature.
54
CHAPTER 4
RESULTS AND DISCUSSION
4.1 EFFECTS OF AGE ON THE YIELD AND COMPOSITION OF THE ES-
SENTIAL OILS OF Calendula officinalis
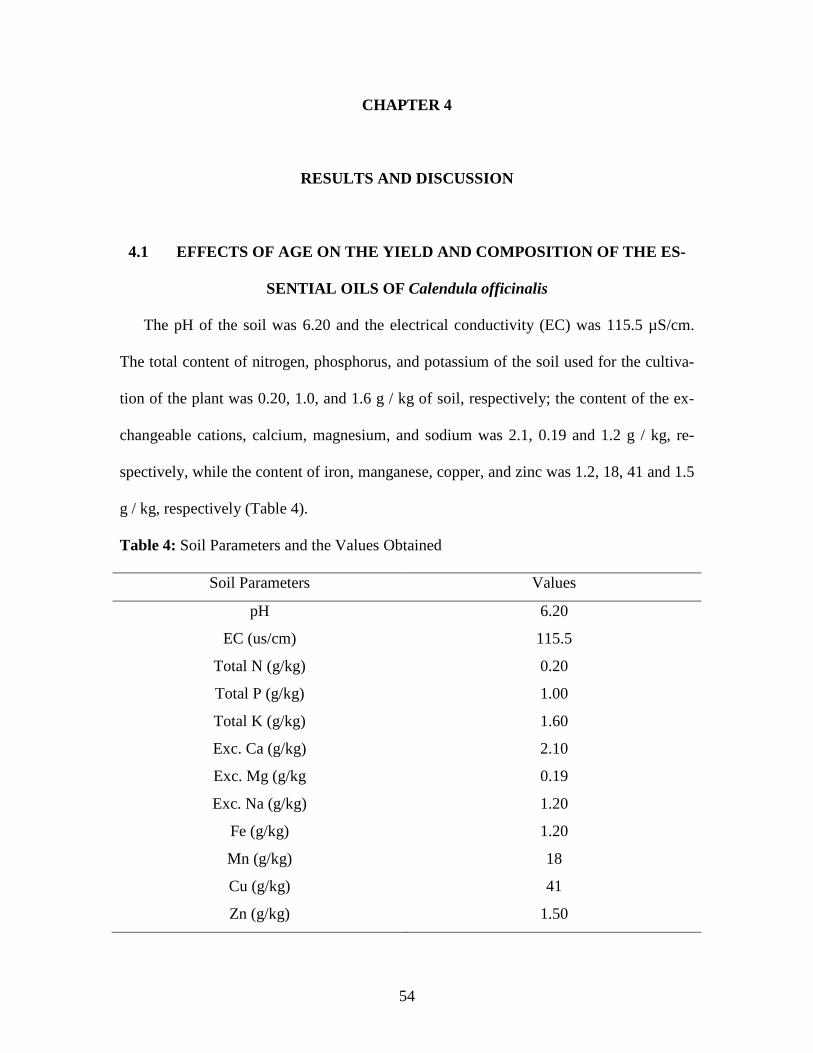
The pH of the soil was 6.20 and the electrical conductivity (EC) was 115.5 µS/cm.
The total content of nitrogen, phosphorus, and potassium of the soil used for the cultiva-
tion of the plant was 0.20, 1.0, and 1.6 g / kg of soil, respectively; the content of the ex-
changeable cations, calcium, magnesium, and sodium was 2.1, 0.19 and 1.2 g / kg, re-
spectively, while the content of iron, manganese, copper, and zinc was 1.2, 18, 41 and 1.5
g / kg, respectively (Table 4).
Table 4: Soil Parameters and the Values Obtained
Soil Parameters Values
pH 6.20
EC (us/cm) 115.5
Total N (g/kg) 0.20
Total P (g/kg) 1.00
Total K (g/kg) 1.60
Exc. Ca (g/kg) 2.10
Exc. Mg (g/kg 0.19
Exc. Na (g/kg) 1.20
Fe (g/kg) 1.20
Mn (g/kg) 18
Cu (g/kg) 41
Zn (g/kg) 1.50
55
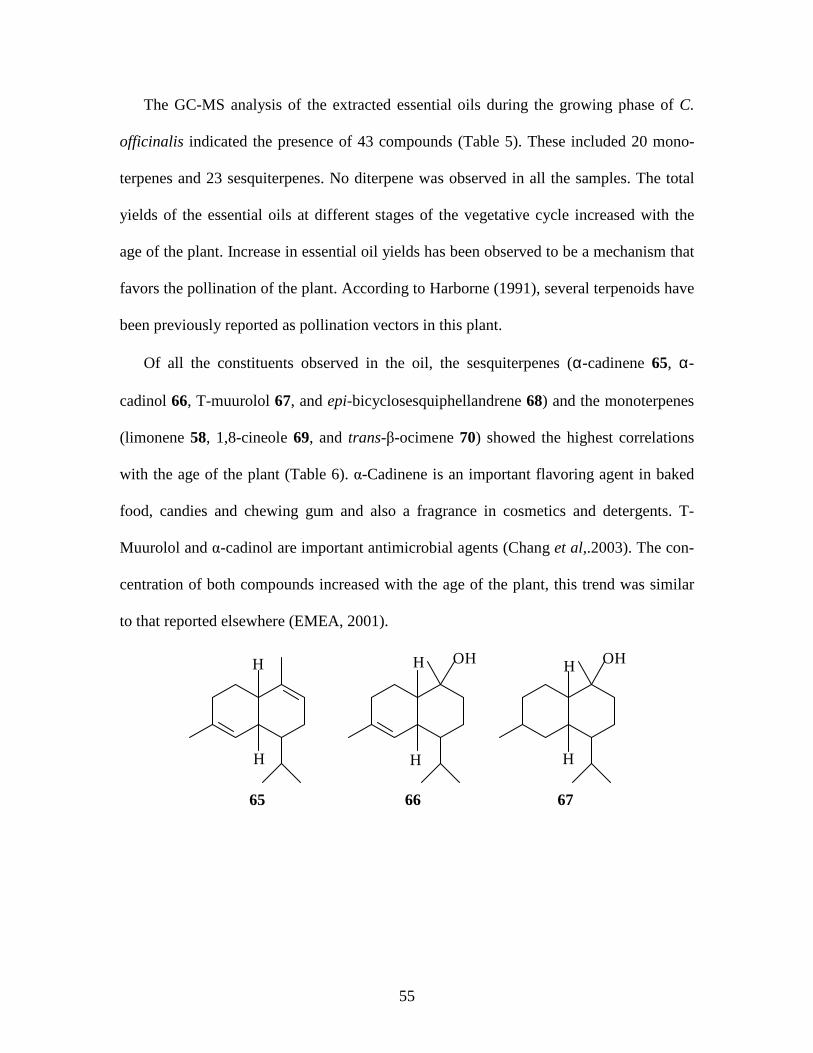
The GC-MS analysis of the extracted essential oils during the growing phase of C.
officinalis indicated the presence of 43 compounds (Table 5). These included 20 mono-
terpenes and 23 sesquiterpenes. No diterpene was observed in all the samples. The total
yields of the essential oils at different stages of the vegetative cycle increased with the
age of the plant. Increase in essential oil yields has been observed to be a mechanism that
favors the pollination of the plant. According to Harborne (1991), several terpenoids have
been previously reported as pollination vectors in this plant.
Of all the constituents observed in the oil, the sesquiterpenes (α-cadinene 65, α-
cadinol 66, T-muurolol 67, and epi-bicyclosesquiphellandrene 68) and the monoterpenes
(limonene 58, 1,8-cineole 69, and trans-β-ocimene 70) showed the highest correlations
with the age of the plant (Table 6). α-Cadinene is an important flavoring agent in baked
food, candies and chewing gum and also a fragrance in cosmetics and detergents. T-
Muurolol and α-cadinol are important antimicrobial agents (Chang et al,.2003). The con-
centration of both compounds increased with the age of the plant, this trend was similar
to that reported elsewhere (EMEA, 2001).
H
H
OHH
H
OHH
H
65 66 67
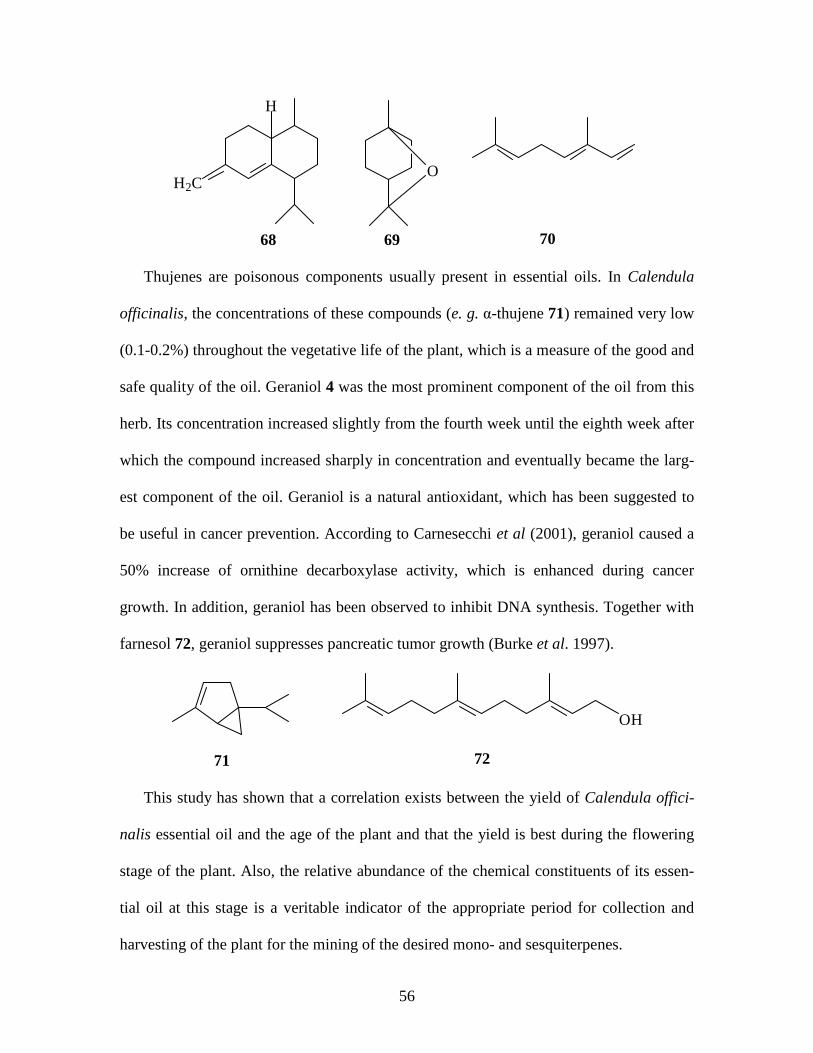
56
H
H2C
68
O
69 70
Thujenes are poisonous components usually present in essential oils. In Calendula
officinalis, the concentrations of these compounds (e. g. α-thujene 71) remained very low
(0.1-0.2%) throughout the vegetative life of the plant, which is a measure of the good and
safe quality of the oil. Geraniol 4 was the most prominent component of the oil from this
herb. Its concentration increased slightly from the fourth week until the eighth week after
which the compound increased sharply in concentration and eventually became the larg-
est component of the oil. Geraniol is a natural antioxidant, which has been suggested to
be useful in cancer prevention. According to Carnesecchi et al (2001), geraniol caused a
50% increase of ornithine decarboxylase activity, which is enhanced during cancer
growth. In addition, geraniol has been observed to inhibit DNA synthesis. Together with
farnesol 72, geraniol suppresses pancreatic tumor growth (Burke et al. 1997).
OH
71 72
This study has shown that a correlation exists between the yield of Calendula offici-
nalis essential oil and the age of the plant and that the yield is best during the flowering
stage of the plant. Also, the relative abundance of the chemical constituents of its essen-
tial oil at this stage is a veritable indicator of the appropriate period for collection and
harvesting of the plant for the mining of the desired mono- and sesquiterpenes.
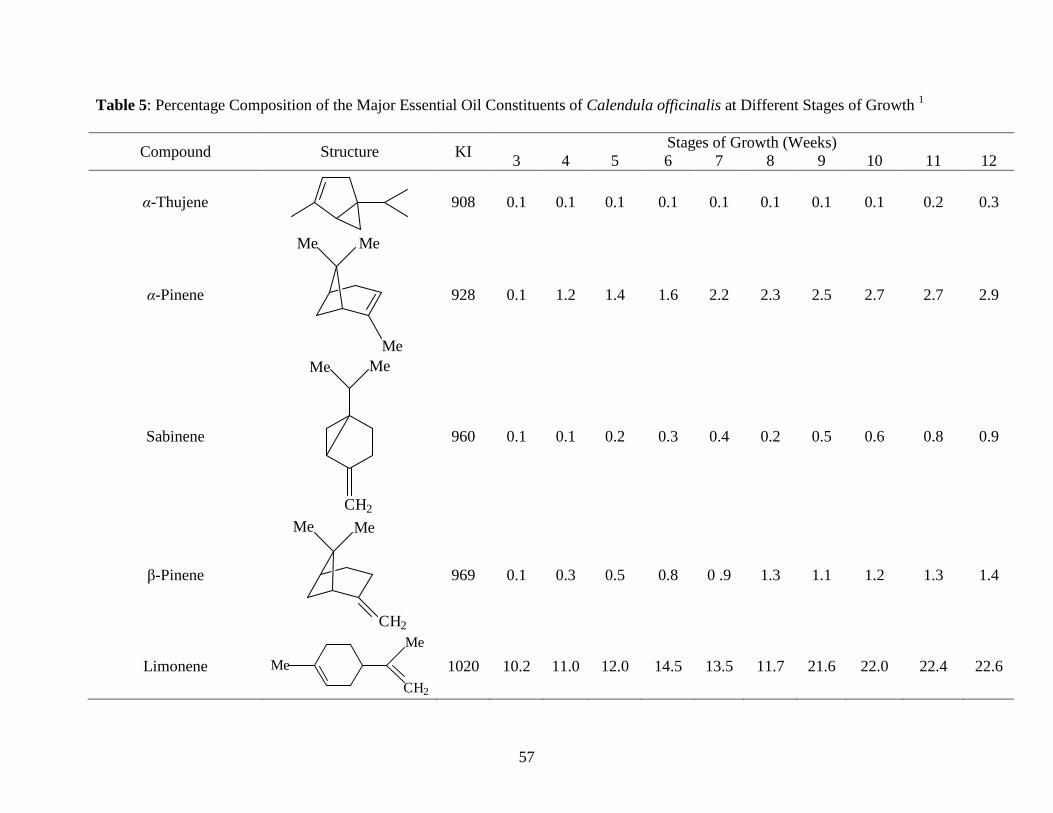
57
Table 5: Percentage Composition of the Major Essential Oil Constituents of Calendula officinalis at Different Stages of Growth 1
Compound Structure KI Stages of Growth (Weeks)
3 4 5 6 7 8 9 10 11 12
α-Thujene
908 0.1 0.1 0.1 0.1 0.1 0.1 0.1 0.1 0.2 0.3
α-Pinene
Me Me
Me
928 0.1 1.2 1.4 1.6 2.2 2.3 2.5 2.7 2.7 2.9
Sabinene
Me Me
CH2
960 0.1 0.1 0.2 0.3 0.4 0.2 0.5 0.6 0.8 0.9
β-Pinene
Me Me
CH2
969 0.1 0.3 0.5 0.8 0 .9 1.3 1.1 1.2 1.3 1.4
Limonene Me
Me
CH2
1020 10.2 11.0 12.0 14.5 13.5 11.7 21.6 22.0 22.4 22.6
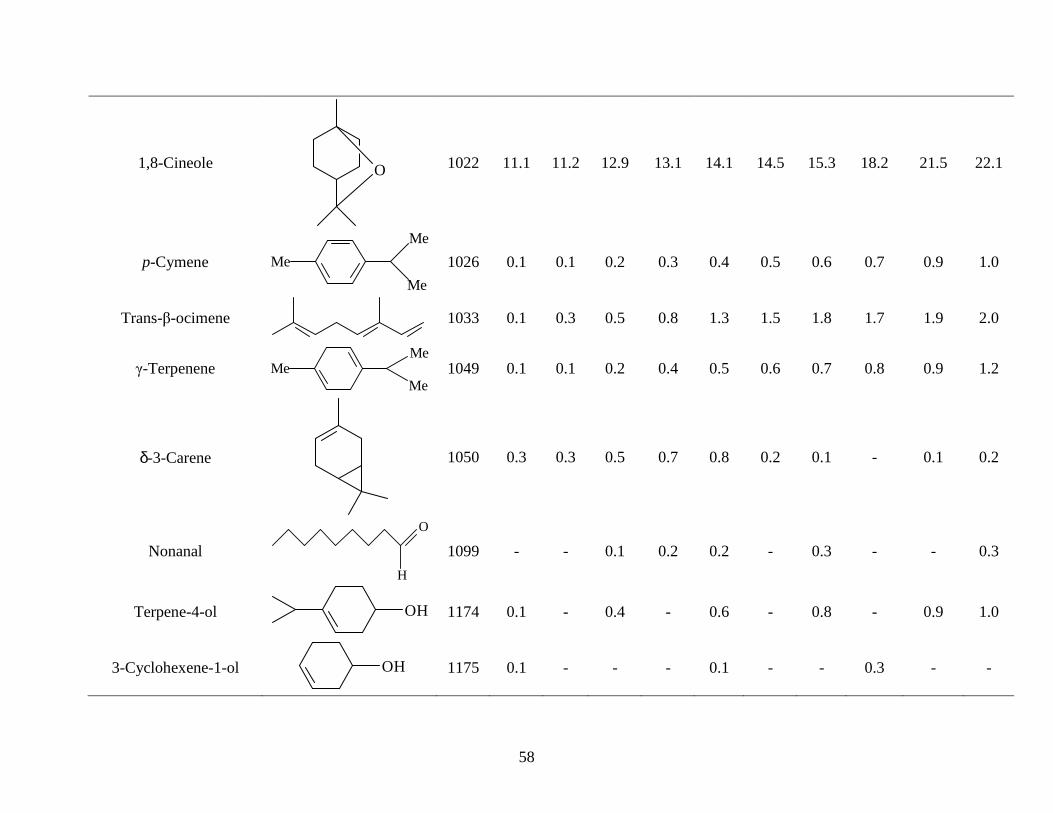
58
1,8-Cineole O
1022 11.1 11.2 12.9 13.1 14.1 14.5 15.3 18.2 21.5 22.1
p-Cymene Me
Me
Me
1026 0.1 0.1 0.2 0.3 0.4 0.5 0.6 0.7 0.9 1.0
Trans-β-ocimene
1033 0.1 0.3 0.5 0.8 1.3 1.5 1.8 1.7 1.9 2.0
γ-Terpenene Me
MeMe
1049 0.1 0.1 0.2 0.4 0.5 0.6 0.7 0.8 0.9 1.2
δ-3-Carene
1050 0.3 0.3 0.5 0.7 0.8 0.2 0.1 - 0.1 0.2
Nonanal
O
H
1099 - - 0.1 0.2 0.2 - 0.3 - - 0.3
Terpene-4-ol OH
1174 0.1 - 0.4 - 0.6 - 0.8 - 0.9 1.0
3-Cyclohexene-1-ol OH
1175 0.1 - - - 0.1 - - 0.3 - -
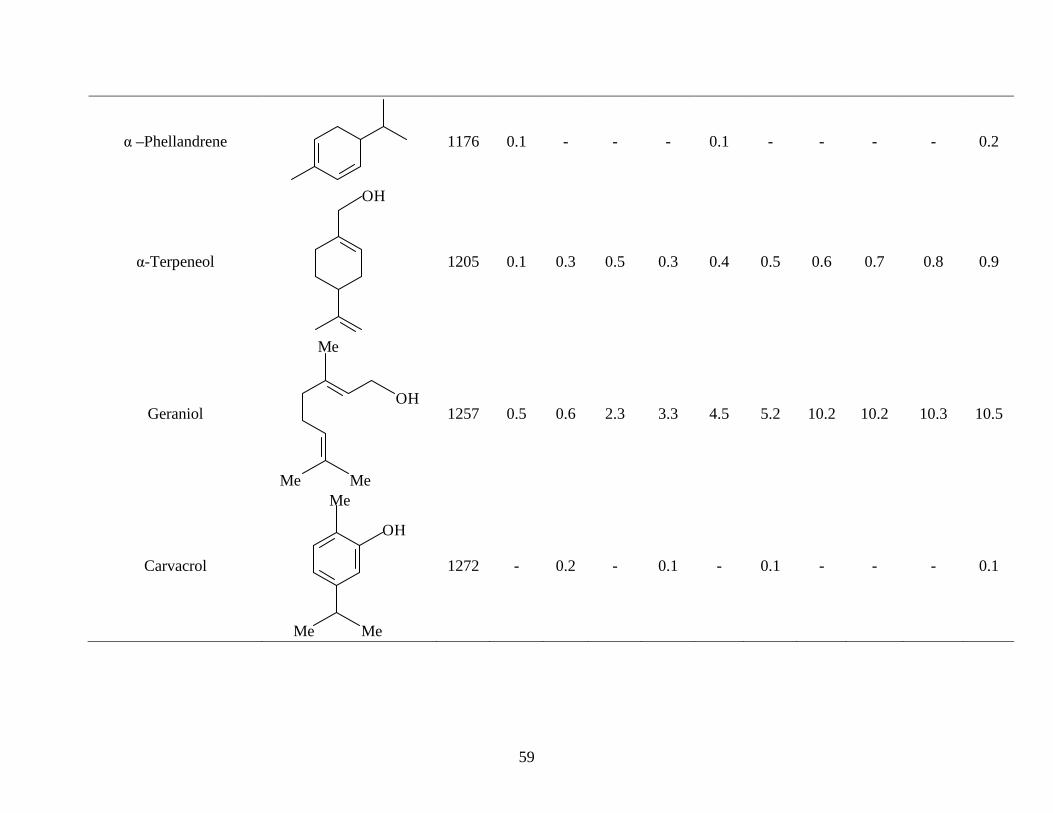
59
α –Phellandrene
1176 0.1 - - - 0.1 - - - - 0.2
α-Terpeneol
OH
1205 0.1 0.3 0.5 0.3 0.4 0.5 0.6 0.7 0.8 0.9
Geraniol
Me
OH
Me Me
1257 0.5 0.6 2.3 3.3 4.5 5.2 10.2 10.2 10.3 10.5
Carvacrol
Me
OH
Me Me
1272 - 0.2 - 0.1 - 0.1 - - - 0.1

60
Bornyl acetate O
MeMe
Me
O
OMe
1283 - - 0.1 - - - - 0.4 - -
Sabinyl acetate OMe
OH2C
1288 0.1 - - 0.1 - - 0.1 0.1 - -
α-Cubebene
H
1347 - 0.3 - 0.1 0.3 - - 0.2 - 1.7
α-Copaene
HH
H
1376 - - - - 0.1 - - 0.2 - -
α-Bourbonene
H
H H
1385 - 0.1 - - - - - 0.1 0.1 0.2
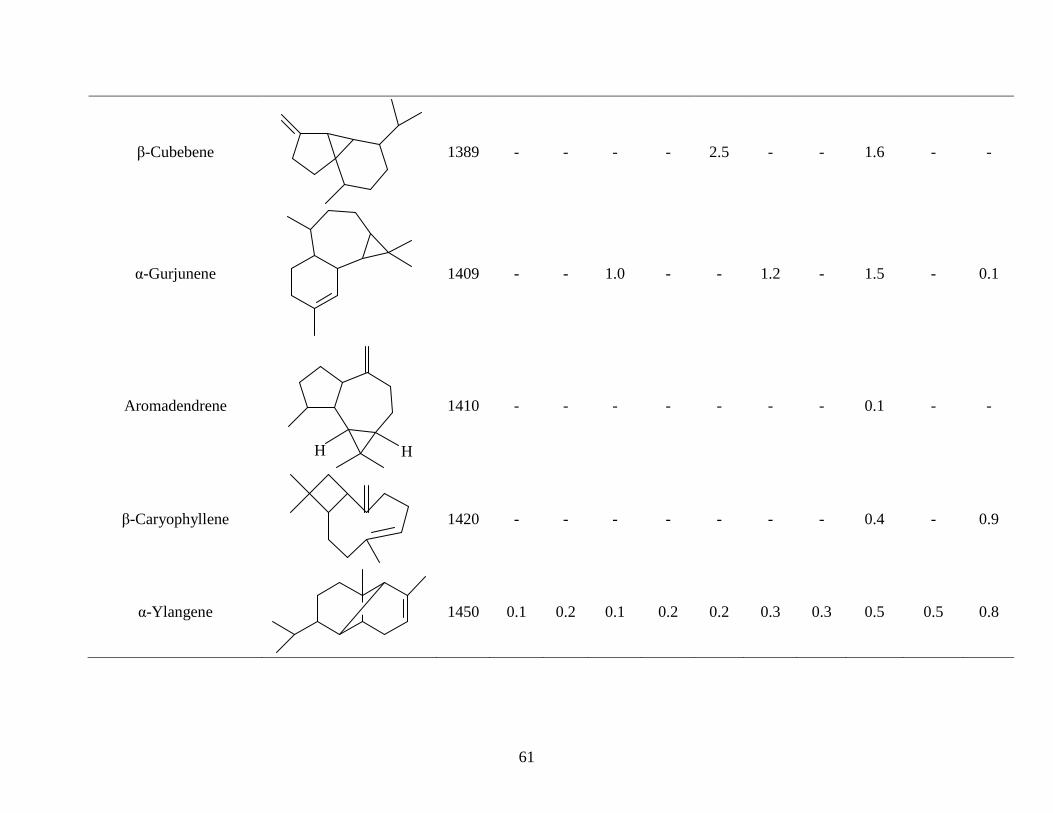
61
β-Cubebene
1389 - - - - 2.5 - - 1.6 - -
α-Gurjunene
1409 - - 1.0 - - 1.2 - 1.5 - 0.1
Aromadendrene
H H
1410 - - - - - - - 0.1 - -
β-Caryophyllene
1420 - - - - - - - 0.4 - 0.9
α-Ylangene
1450 0.1 0.2 0.1 0.2 0.2 0.3 0.3 0.5 0.5 0.8
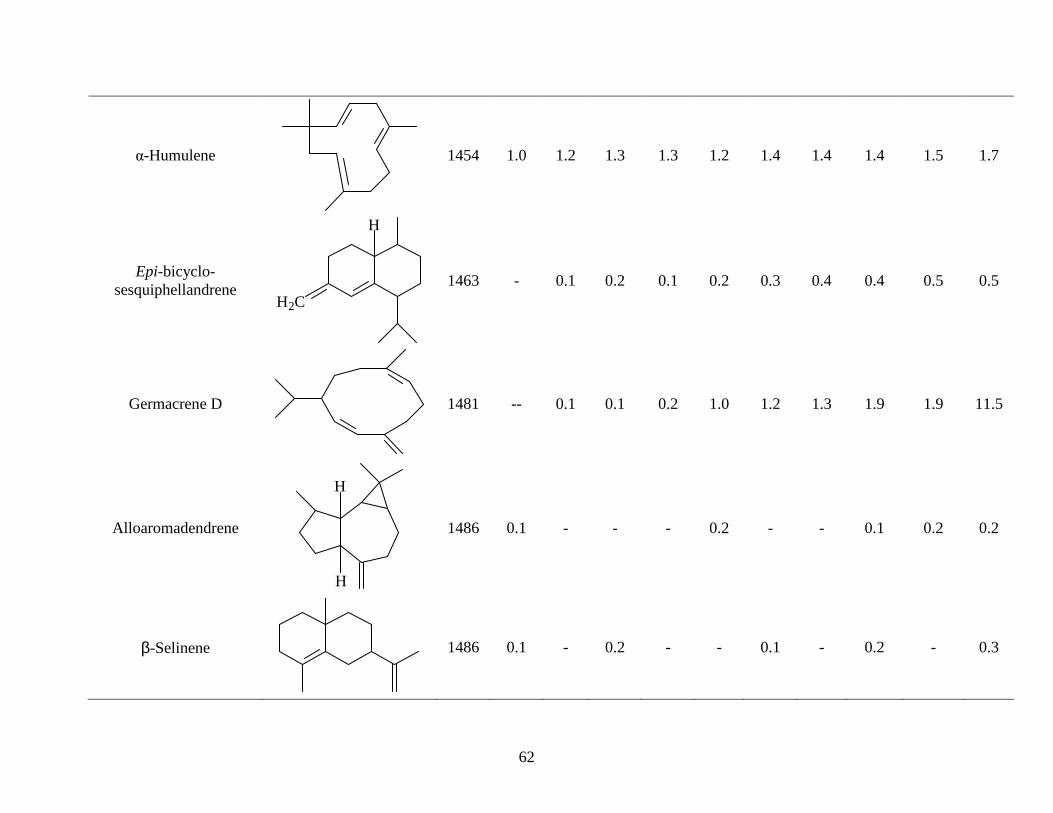
62
α-Humulene
1454 1.0 1.2 1.3 1.3 1.2 1.4 1.4 1.4 1.5 1.7
Epi-bicyclo-sesquiphellandrene
H
H2C
1463 - 0.1 0.2 0.1 0.2 0.3 0.4 0.4 0.5 0.5
Germacrene D
1481 -- 0.1 0.1 0.2 1.0 1.2 1.3 1.9 1.9 11.5
Alloaromadendrene
H
H
1486 0.1 - - - 0.2 - - 0.1 0.2 0.2
β-Selinene
1486 0.1 - 0.2 - - 0.1 - 0.2 - 0.3
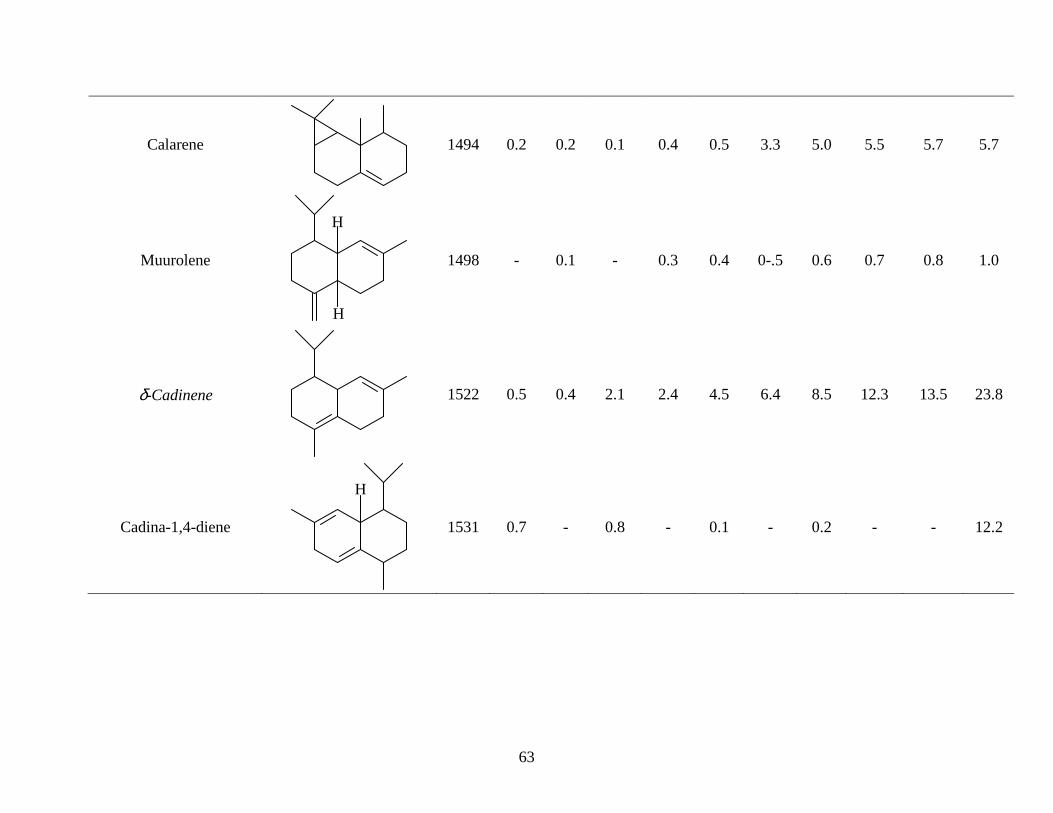
63
Calarene
1494 0.2 0.2 0.1 0.4 0.5 3.3 5.0 5.5 5.7 5.7
Muurolene
H
H
1498 - 0.1 - 0.3 0.4 0-.5 0.6 0.7 0.8 1.0
δ-Cadinene
1522 0.5 0.4 2.1 2.4 4.5 6.4 8.5 12.3 13.5 23.8
Cadina-1,4-diene
H
1531 0.7 - 0.8 - 0.1 - 0.2 - - 12.2
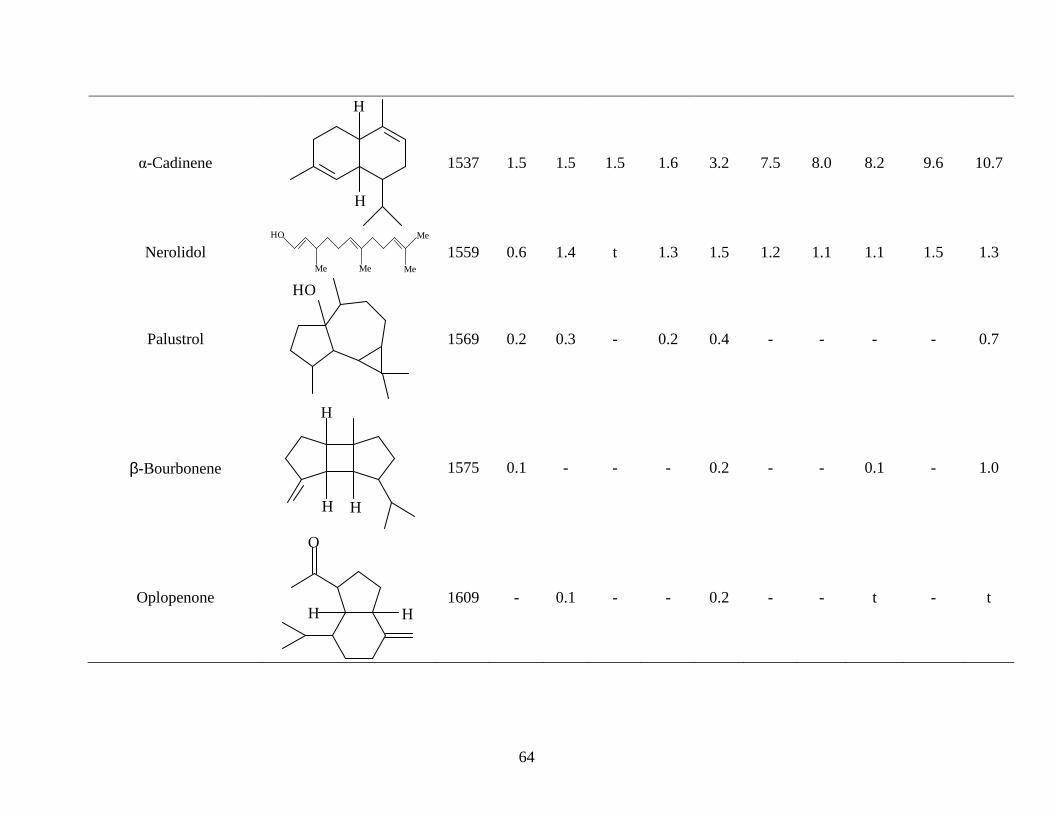
64
α-Cadinene
H
H
1537 1.5 1.5 1.5 1.6 3.2 7.5 8.0 8.2 9.6 10.7
Nerolidol HO Me
Me Me Me 1559 0.6 1.4 t 1.3 1.5 1.2 1.1 1.1 1.5 1.3
Palustrol
HO
1569 0.2 0.3 - 0.2 0.4 - - - - 0.7
β-Bourbonene
H
H H
1575 0.1 - - - 0.2 - - 0.1 - 1.0
Oplopenone
O
H H
1609 - 0.1 - - 0.2 - - t - t

65
α-Cadinol
OHH
H
1655 0.1 0.4 5.1 6.4 7.5 8.4 9.4 21.5 22.4 24.2
T-muurolol
OHH
H
1659 12.5 13.4 14.5 15.4 17.5 18.6 18.8 20.9 21.9 22.5
Yield (%w/w) 0.13 0.30 0.45 0.48 0.52 0.64 0.65 0.79 0.95 0.97 1 t = traces, KI = Kovats indices
Percentage Yield (%) = Total Weight of Oil __________________ X 100 Total Weight of Plant
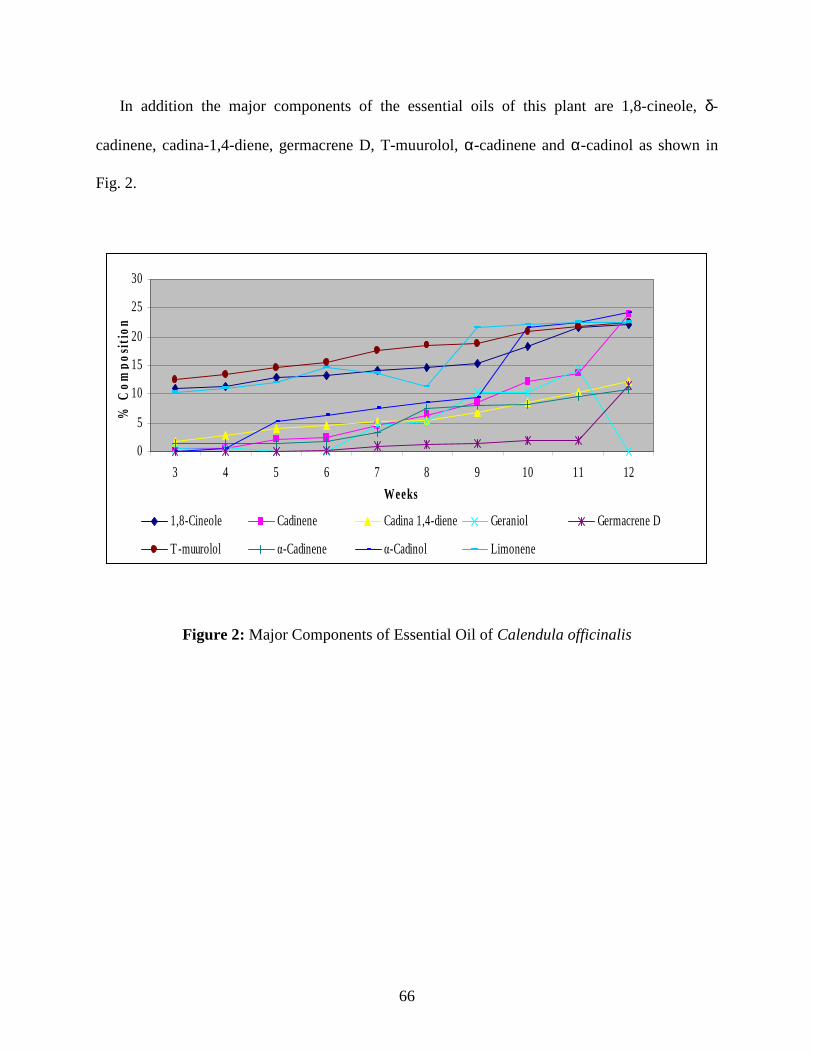
66
In addition the major components of the essential oils of this plant are 1,8-cineole, δ-
cadinene, cadina-1,4-diene, germacrene D, T-muurolol, α-cadinene and α-cadinol as shown in
Fig. 2.
0
5
10
15
20
25
30
3 4 5 6 7 8 9 10 11 12
Weeks
% C
om
posi
tion
1,8-Cineole Cadinene Cadina 1,4-diene Geraniol Germacrene D
T-muurolol α-Cadinene α-Cadinol Limonene
Figure 2: Major Components of Essential Oil of Calendula officinalis

67
Table 6: R2 Values of the Main Components of the Essential Oil of Calendula officinalis During
its Vegetative Life Cycle
Chemical Component Structure R-Squared Value
(R2) 1
α-Pinene
Me Me
Me
0.8862
β-Pinene
Me Me
CH2
0.8867
Limonene Me
Me
CH2
0.9184
1,8-Cineole O
0.9053
Trans-β-ocimene
0.944

68
Geraniol
Me
OH
Me Me
0.8042
α-Cubebene
H
0.5024
α-Ylangene
0.8107
α-Humulene
0.8264
Epi-bicyclo-
sesquiphellandrene
H
H2C
0.9075
Calarene
0.8623
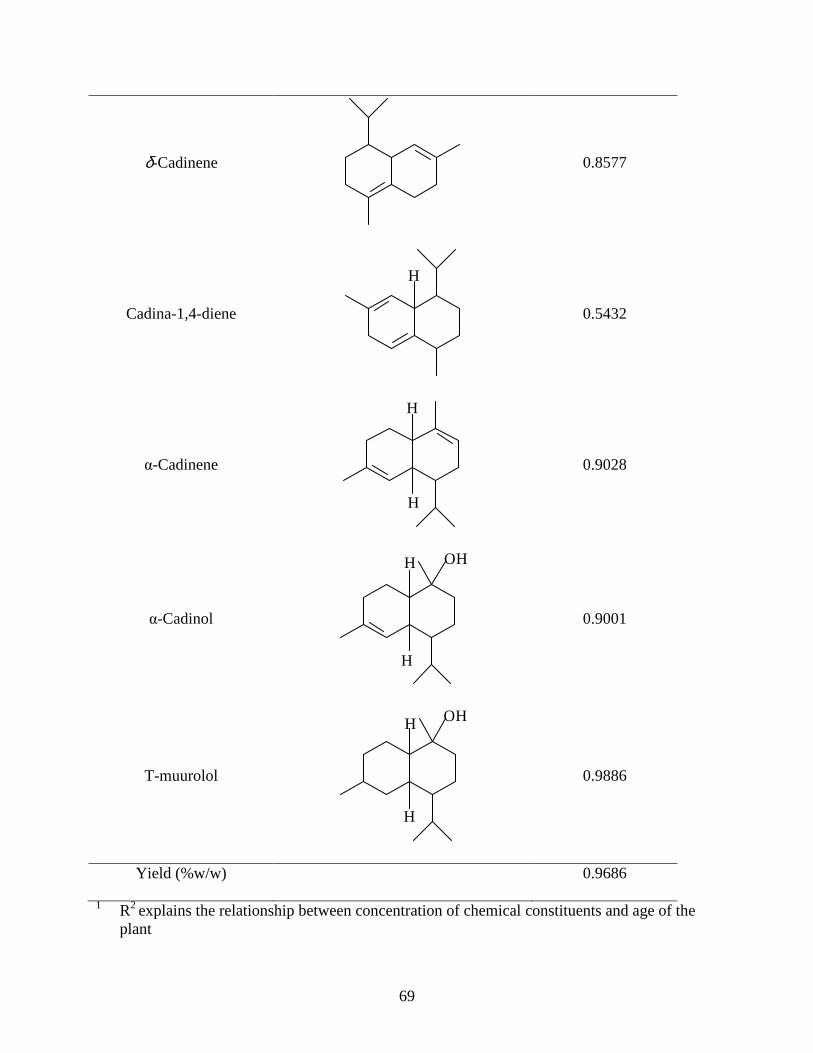
69
δ-Cadinene
0.8577
Cadina-1,4-diene
H
0.5432
α-Cadinene
H
H
0.9028
α-Cadinol
OHH
H
0.9001
T-muurolol
OHH
H
0.9886
Yield (%w/w) 0.9686
1 R2 explains the relationship between concentration of chemical constituents and age of the plant

70
4.2 EFFECTS OF DRYING ON THE CHEMICAL COMPONENTS O F ESSENTIAL
OIL OF Calendula officinalis L. GROWING WILD IN THE EASTERN CAPE
PROVINCE OF SOUTH AFRICA
Pale yellow oils with yields of 0.06%, 0.03%, and 0.09% were obtained from the fresh leaves,
dry leaves, and fresh flowers of the plant, respectively. The oils gave a total of 30, 21, and 24
identified compounds, representing 91.7%, 89.8%, and 87.5% of the total oil composition from
the fresh leaves, dry leaves, and fresh flowers, respectively (Table 7).
Although the flowers had the greatest oil yield, the oil from the fresh leaves was richer in
chemical constituents than that from the dry leaves and fresh flowers. A total of 30 chemical
constituents were identified from the fresh leave oil, while 21 constituents were identified from
oil from the dry leaves. This supports the observation by Loughrin and Kasperbauer (2003), who
reported that there could be a 50-fold reduction in chemical composition when plant materials
are dried.
The fresh leaf oil was dominated by T-muurolol (40.9 %), α-thujene (19.2 %), and δ-
cadinene (11.4 %), while the dry leaf oil was found to be rich in 1,8-cineole (29.4 %), α-thujene
(17.8%), β-pinene (6.9 %), and δ-cadinene (9.0 %). The fresh flower oil, on the other hand, has
its major components as α-thujene (26.9 %), T-muurolol (24.9 %), and δ-cadinene (13.1 %). The
complete absence of 1,8-cineole in the fresh leaves and its sudden appearance in the dry leaves
(29.4%) is noteworthy. However, changes in oil composition are known to be dependent on a
number of factors including the class of plant. The presence of 1,8-cineole in the dry leaf oil
makes it superior to the fresh leaf oil due to the characteristic properties of the compound.

71
Generally, a lot of components were missing in the dried leaf oil as compared to the fresh
leaf oil. The sesquiterpene hydrocarbons present in all the oil samples were α-humulene 73, ger-
macrene D 74, α-cadinene 65, and δ-cadinene 21, while among the monoterpene hydrocarbons
was α-thujene 71. T-Muurolol 67, the major component in the fresh leaf oil, was also present in
the other oils. T-Muurolol is produced from the direct oxidation of α-muurolene 75. β-Pinene
present at 6.9% in the dry leaves occurred in minute amount in the fresh leaf oil, and α -
terpenene present at values of 6.9% and 11.6%, in the dry leaf oil, occurred in minute amounts in
the fresh leaf oil. The changes in the regimes of volatile compounds during drying have been re-
ported to depend on several factors, such as drying method and class of plants (Asekun et al.
2007). According to Moyler (1994), the components of the essential oils that are lost in the dried
leaves are those stored on or near the leaf surfaces. However, Ibanez et al. (1999) observed no
difference in the essential oil composition of fresh and dry rosemary plant.
73 74
H
H
75
The results of this study have reinforced the fact that there are quantitative and qualitative
differences in the essential oil components of the same plant that may be growing in different
parts of the world. For example, Crabas (2003) reported the presence of methyl hexadecanoate
14, methyl linoleate 15, methyl 9,12,15-octadecatrienoate 16, 10-methyl octadecanoate 17, me-
thyl tetradecanoate 18, γ-cadinene 19, oplopanone 23, cubenol 20, ß-cadinene 76, and α-cadinol
22 in the essential oil of Calendula officinalis growing wild in Italy. These compounds were not

72
detected in the oil of this plant found in the Eastern Cape, except oplopanone 23 that was present
only in the fresh leaf oil. In another study that assessed the carotenoid composition of different
parts of Calendula officinalis (Bako et al. 2002), it was observed that in the petals and pollens,
the main carotenoids were flavoxanthin 77 and auroxanthin 78 while the stem and leaves mostly
contained lutein 79 and β-carotene 80, thus supporting the hypothesis of variability in the oil
composition of this herb depending on the part of the plant and geographical location.
H
H
76
OHO
OH
77
OHO
OH
78

73
HO
OH
79
80
Table 7: Chemical Composition of the Essential Oil from Calendula officinalis L Growing in the
Eastern Cape Province of South Africa.
Compound 1 Structure KI 2
% Composition (oil) Leaves Flow-
ers Fresh Dry
α- Thujene
908 19.2 17.8 26.9
α-Pinene
Me Me
Me
928 - 2.4 1.8
Sabinene
Me Me
CH2
960 1.1 - 1.8

74
β- Pinene
Me Me
CH2
969 0.6 6.9 -
Myrcene Me
Me CH2
CH2
971 - - 1.1
Limonene Me
Me
CH2
1020 0.8 - -
1,8 Cineole O
1022 - 29.4 1.7
Trans-β-ocimene
1033 0.2 - -
γ-Terpenene Me
MeMe
1049 0.4 - 0.7
δ-3-Carene
1050 - 0.3 -
Nonanal
O
H
1099 - 1.0 -
Terpene-4-ol OH
1174 0.4 - 0.6
3-cyclohexen-1-ol OH
1175 - 0.6 -
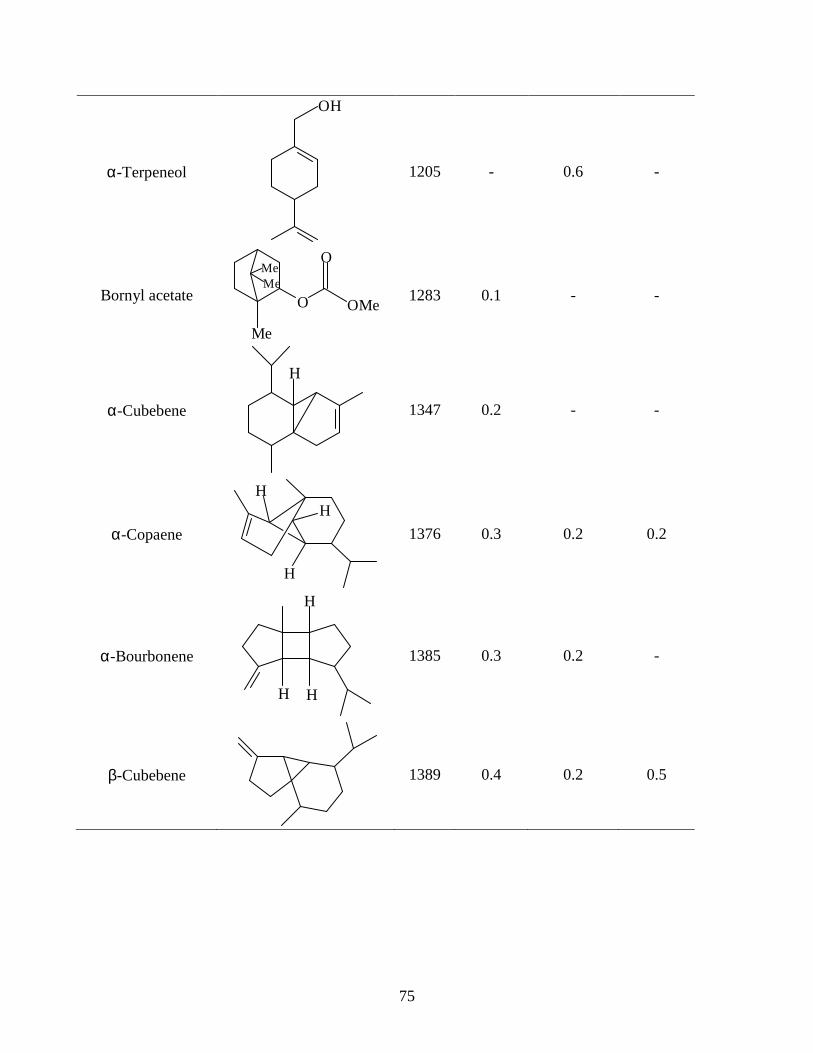
75
α-Terpeneol
OH
1205 - 0.6 -
Bornyl acetate O
MeMe
Me
O
OMe
1283 0.1 - -
α-Cubebene
H
1347 0.2 - -
α-Copaene
HH
H
1376 0.3 0.2 0.2
α-Bourbonene
H
H H
1385 0.3 0.2 -
β-Cubebene
1389 0.4 0.2 0.5

76
α-Gurjunene
1409 0.6 - 0.6
Aromadendrene
H H
1410 - 0.2 -
β-Caryophyllene
1420 1.0 - 1.2
α-Ylangene
1450 0.2 - -
α-Humulene
1454 1.7 1.2 1.5
Epi-bicyclosesquiph-
landrene
H
H2C
1463 0.4 - -
α-Amorphene
1513 0.6 - 0.5

77
α-Copaene
HH
H
1376 - - 2.7
Alloaromaden-drene
H
H
1486 - - 0.3
β-Selinene
1486 0.5 - -
Germacrene D
1481 1.1 0.6 2.8
β-Cubebene
1491 - 1.4 0.2
Muurolene
H
H
1498 2.1 1.6 -
γ-Cadinene
H
H
1513 2.7 2.2 2.2
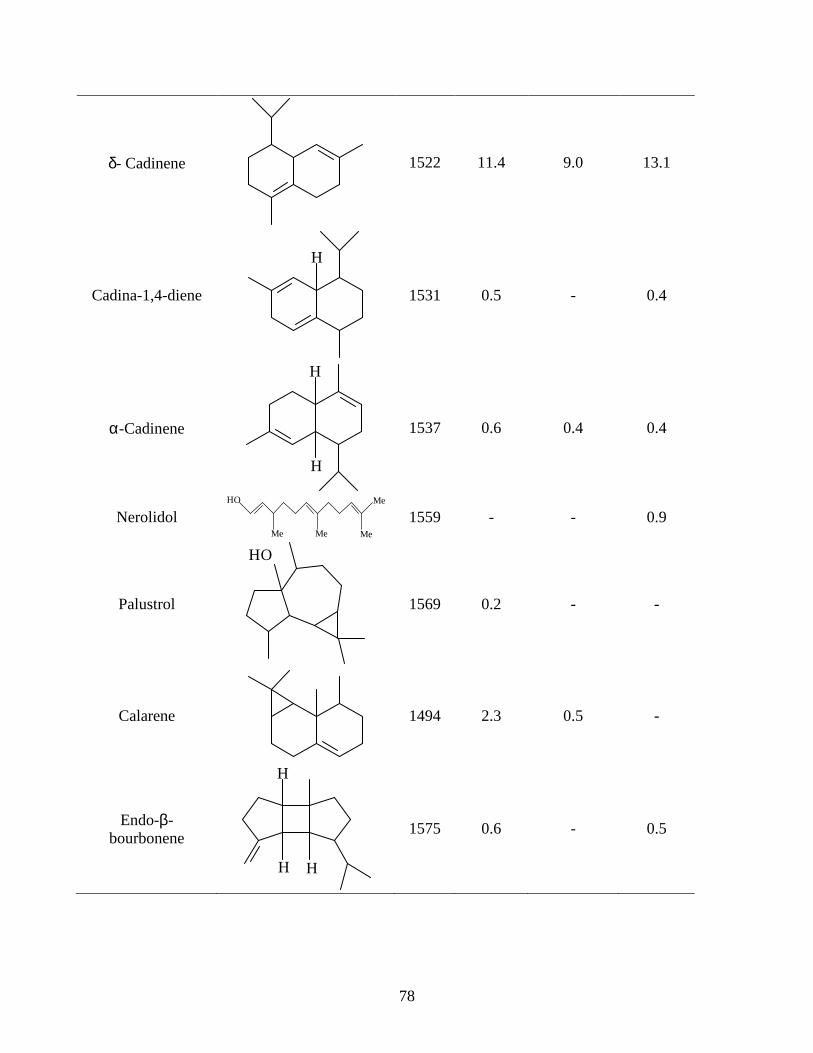
78
δ- Cadinene
1522 11.4 9.0 13.1
Cadina-1,4-diene
H
1531 0.5 - 0.4
α-Cadinene
H
H
1537 0.6 0.4 0.4
Nerolidol HO Me
Me Me Me 1559 - - 0.9
Palustrol
HO
1569 0.2 - -
Calarene
1494 2.3 0.5 -
Endo-β-bourbonene
H
H H
1575 0.6 - 0.5

79
Oplopenone
O
H H
1609 0.3 - -
T-Muurolol
OHH
H
1659 40.9 13.1 24.9
Yield (% w/w) 0.06 0.03 0.09 1 In order of elution 2 KI - Kovats retention indices on HP-5 (similar to DB-5)
4.3 ISOLATION OF MAJOR COMPOUNDS
Efforts were made to isolate some major compounds from this plant. The procedure for the
extraction and partitioning, fractionation and purification are illustrated in the diagrams below
(Fig. 3, 4).
Freshly collected plant material ↓↓↓↓
Air-dried and milled to fine texture (1 kg) ↓↓↓↓
Extracted with ethanol (4 times) ↓↓↓↓
Filtered (Whatman # 1) ↓↓↓↓
Filtrates combined and concentrated to dryness under reduced pressure ↓↓↓↓
Partitioned between hexane and water ���� ���� N-hexane fraction Water fraction ���� ����
Partitioned between EtOAc and water ���� ���� Ethyl acetate fraction Water fraction
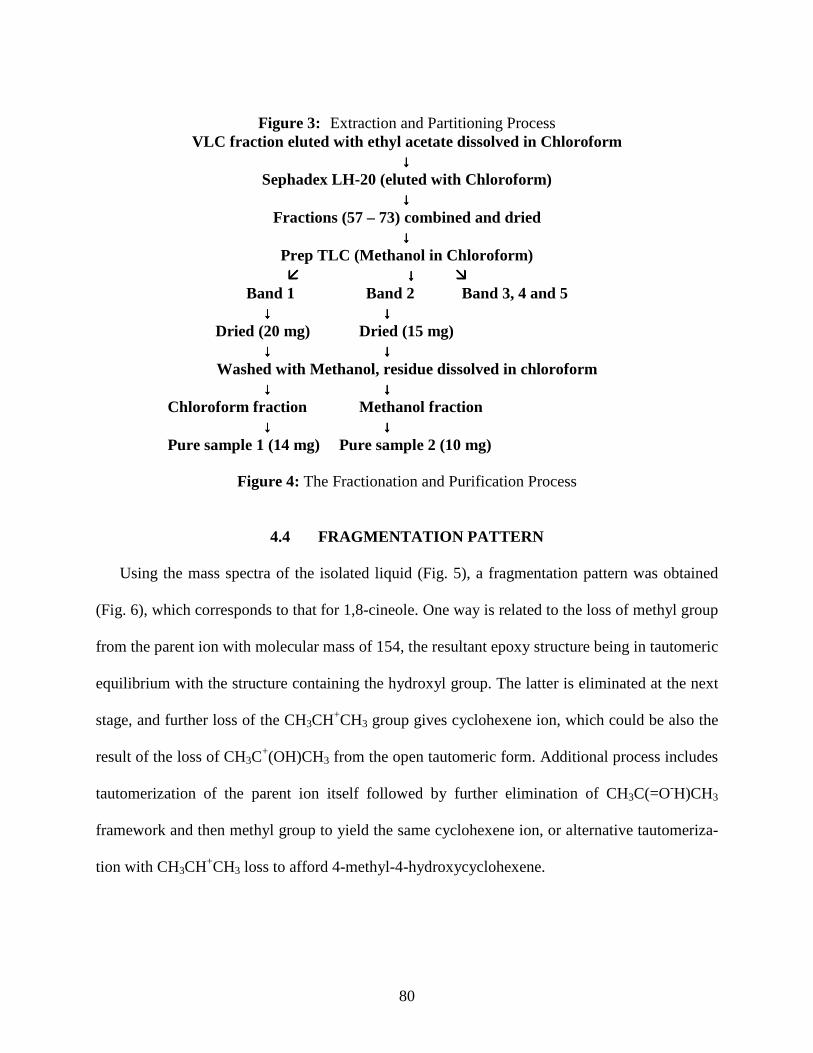
80
Figure 3: Extraction and Partitioning Process
VLC fraction eluted with ethyl acetate dissolved in Chloroform ↓↓↓↓
Sephadex LH-20 (eluted with Chloroform) ↓↓↓↓
Fractions (57 – 73) combined and dried ↓↓↓↓
Prep TLC (Methanol in Chloroform) ���� ↓↓↓↓ ����
Band 1 Band 2 Band 3, 4 and 5 ↓↓↓↓ ↓↓↓↓ Dried (20 mg) Dried (15 mg) ↓↓↓↓ ↓↓↓↓
Washed with Methanol, residue dissolved in chloroform ↓↓↓↓ ↓↓↓↓ Chloroform fraction Methanol fraction ↓↓↓↓ ↓↓↓↓ Pure sample 1 (14 mg) Pure sample 2 (10 mg)
Figure 4: The Fractionation and Purification Process
4.4 FRAGMENTATION PATTERN
Using the mass spectra of the isolated liquid (Fig. 5), a fragmentation pattern was obtained
(Fig. 6), which corresponds to that for 1,8-cineole. One way is related to the loss of methyl group
from the parent ion with molecular mass of 154, the resultant epoxy structure being in tautomeric
equilibrium with the structure containing the hydroxyl group. The latter is eliminated at the next
stage, and further loss of the CH3CH+CH3 group gives cyclohexene ion, which could be also the
result of the loss of CH3C+(OH)CH3 from the open tautomeric form. Additional process includes
tautomerization of the parent ion itself followed by further elimination of CH3C(=O-H)CH3
framework and then methyl group to yield the same cyclohexene ion, or alternative tautomeriza-
tion with CH3CH+CH3 loss to afford 4-methyl-4-hydroxycyclohexene.
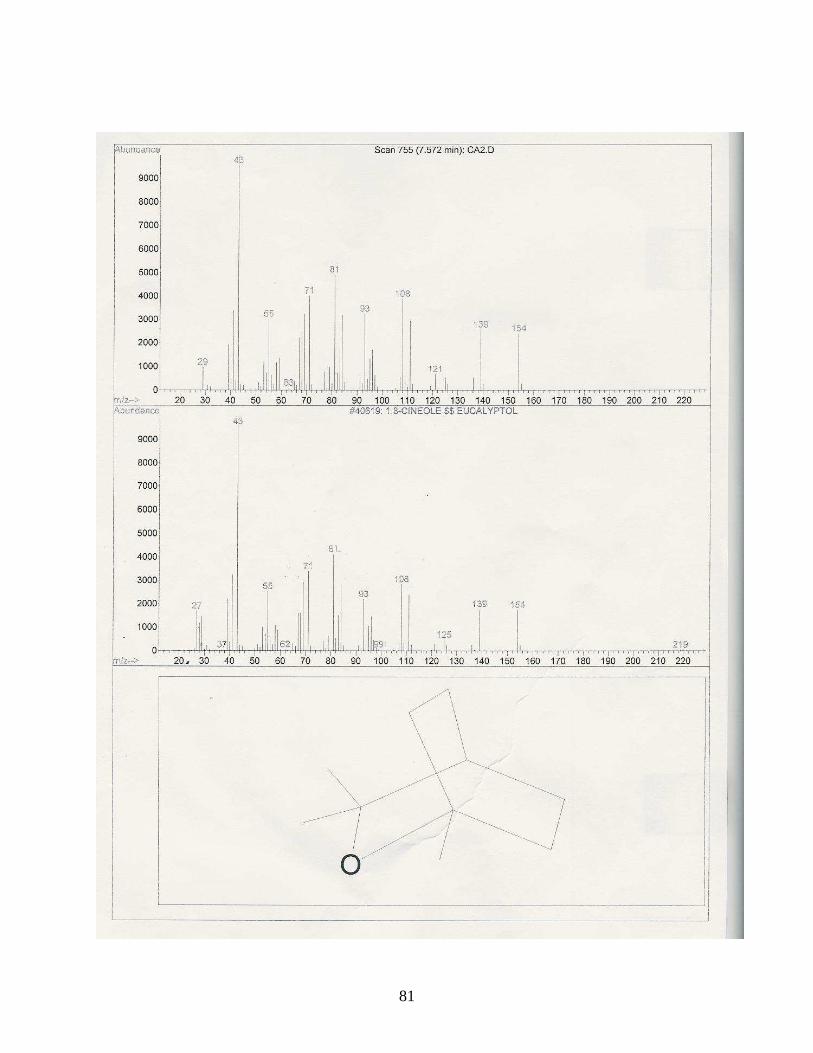
81
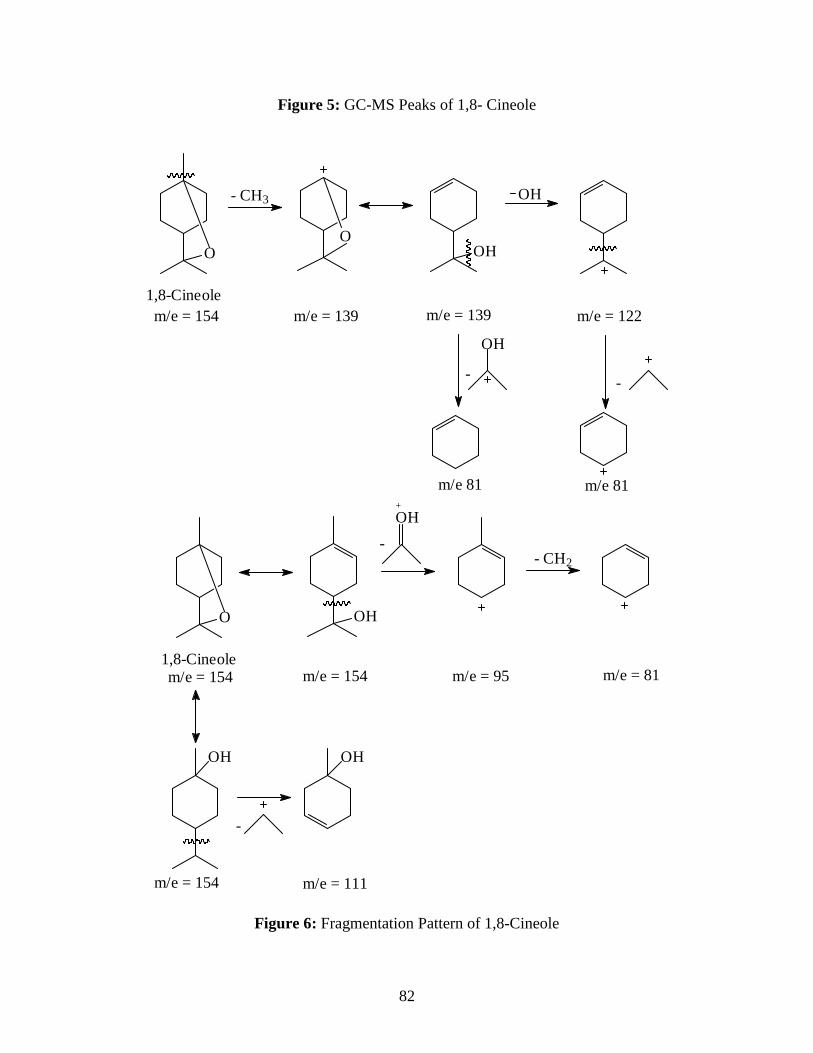
82
Figure 5: GC-MS Peaks of 1,8- Cineole
O
1,8-Cineolem/e = 154
- CH3
O
m/e = 139
OH
m/e = 139
OH
m/e = 122
OH
m/e 81m/e 81
--
O
1,8-Cineolem/e = 154 m/e = 154
OH
OH
m/e = 95
- CH2
m/e = 81
OH
m/e = 154
OH
m/e = 111
-
+
-
Figure 6: Fragmentation Pattern of 1,8-Cineole
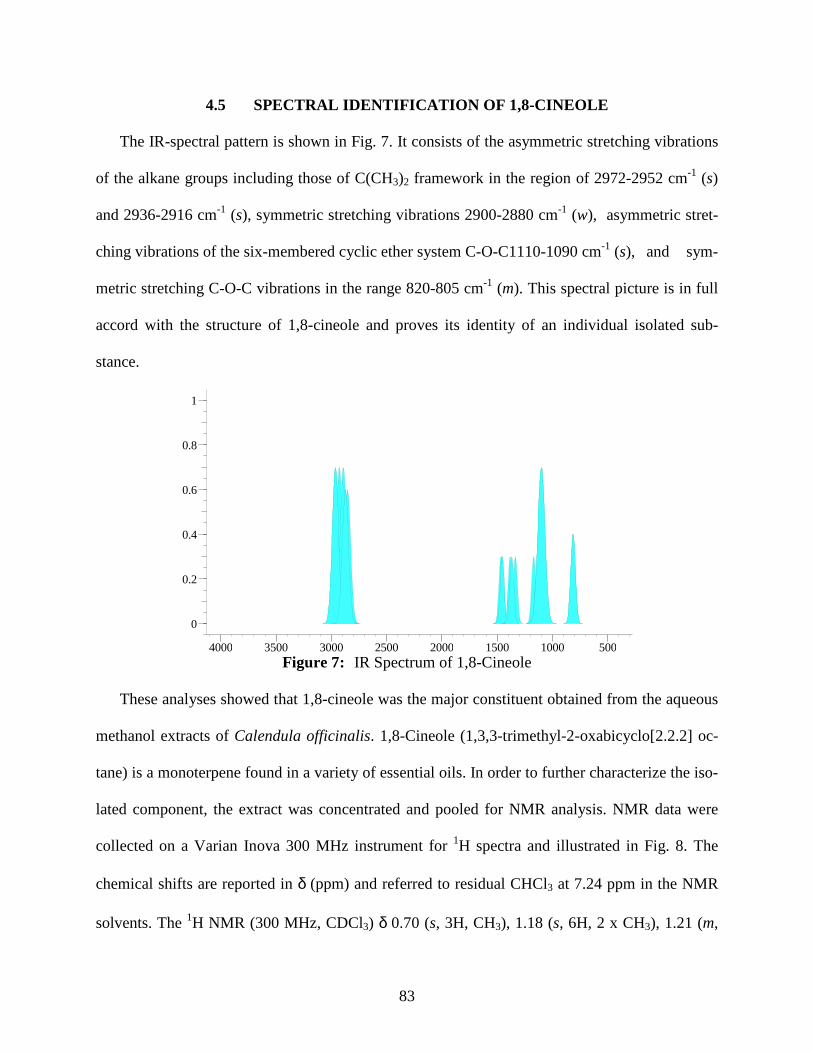
83
4.5 SPECTRAL IDENTIFICATION OF 1,8-CINEOLE
The IR-spectral pattern is shown in Fig. 7. It consists of the asymmetric stretching vibrations
of the alkane groups including those of C(CH3)2 framework in the region of 2972-2952 cm-1 (s)
and 2936-2916 cm-1 (s), symmetric stretching vibrations 2900-2880 cm-1 (w), asymmetric stret-
ching vibrations of the six-membered cyclic ether system C-O-C1110-1090 cm-1 (s), and sym-
metric stretching C-O-C vibrations in the range 820-805 cm-1 (m). This spectral picture is in full
accord with the structure of 1,8-cineole and proves its identity of an individual isolated sub-
stance.
4000 3500 3000 2500 2000 1500 1000 500
0
0.2
0.4
0.6
0.8
1
Figure 7: IR Spectrum of 1,8-Cineole
These analyses showed that 1,8-cineole was the major constituent obtained from the aqueous
methanol extracts of Calendula officinalis. 1,8-Cineole (1,3,3-trimethyl-2-oxabicyclo[2.2.2] oc-
tane) is a monoterpene found in a variety of essential oils. In order to further characterize the iso-
lated component, the extract was concentrated and pooled for NMR analysis. NMR data were
collected on a Varian Inova 300 MHz instrument for 1H spectra and illustrated in Fig. 8. The
chemical shifts are reported in δ (ppm) and referred to residual CHCl3 at 7.24 ppm in the NMR
solvents. The 1H NMR (300 MHz, CDCl3) δ 0.70 (s, 3H, CH3), 1.18 (s, 6H, 2 x CH3), 1.21 (m,

84
1H, H4), 1.26 (m, 4H), 1.3 – 2.22 (m, 3H). The chemical shift at 7.22 ppm is due to the solvent
while the one at 0.001 ppm might be due to the presence of water or the possibility of another
form of cineole that have the hydroxyl group.
Figure 8: NMR Peaks for 1,8-Cineole Nuclear magnetic resonance spectroscopy (NMR) is one of the most important and wide-
spread analytical methods in the academic and industrial research. It enables a unique and, in
principle, quantitative determination of the relative amount of molecular groups, thus offering a
tool to quantify entire molecular structures even in mixtures. The recorded 1H-NMR spectrum of
the analyte correlates well with the known spectrum (Fig. 9), which was assigned to 1,8-cineole
(Malz and Jancke, 2005), as well as the simulated 1H NMR spectrum of 1,8-cineole done by us
using Chemwindow software (Fig. 10). The published spectrum represents 1,8-cineole dissolved
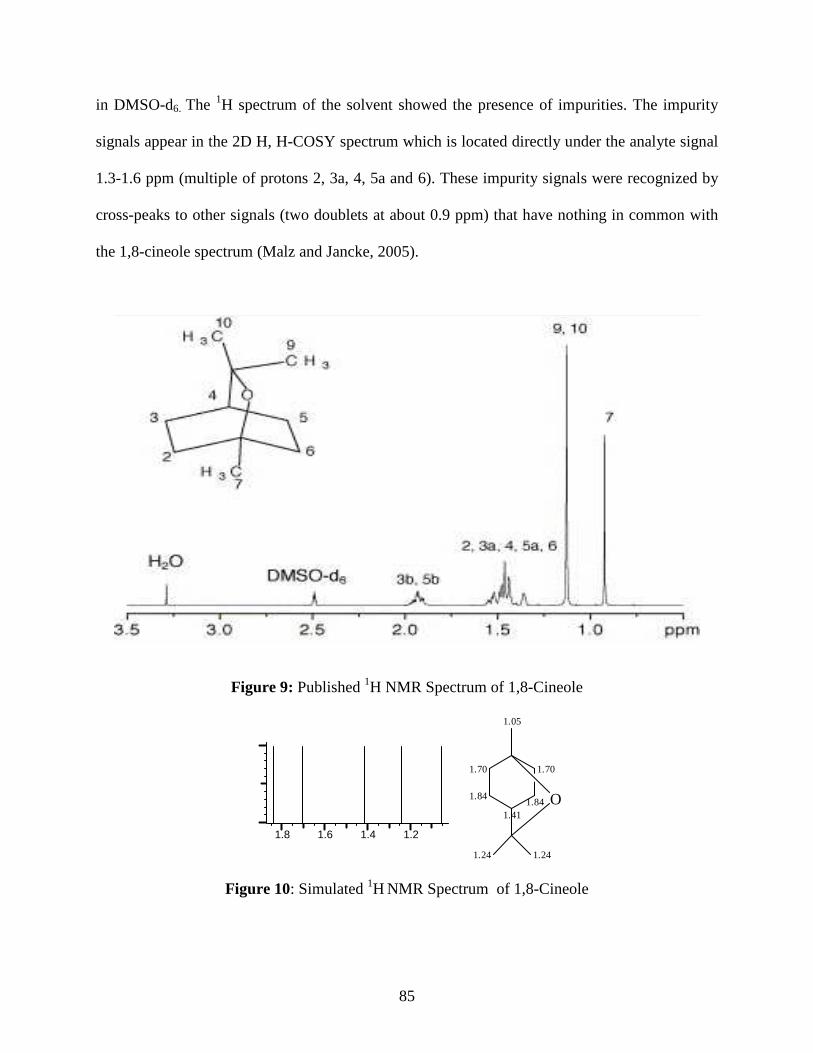
85
in DMSO-d6. The 1H spectrum of the solvent showed the presence of impurities. The impurity
signals appear in the 2D H, H-COSY spectrum which is located directly under the analyte signal
1.3-1.6 ppm (multiple of protons 2, 3a, 4, 5a and 6). These impurity signals were recognized by
cross-peaks to other signals (two doublets at about 0.9 ppm) that have nothing in common with
the 1,8-cineole spectrum (Malz and Jancke, 2005).
Figure 9: Published 1H NMR Spectrum of 1,8-Cineole
1.8 1.6 1.4 1.2
O
1.70
1.84
1.411.84
1.70
1.05
1.24 1.24
Figure 10: Simulated 1H NMR Spectrum of 1,8-Cineole
86
Therefore the structure that is consistent with the above spectra is ,8 –cineole. 1,8-Cineole is
an oxygenated monoterpenoid with a molecular mass of 154. The oxygen forms an ether linkage
with carbon atoms at positions 1 and 8. It should be generally unreactive as any other ether. The
fragmentation pattern of ether is favored by cleavages of the C-O bonds. Fragmentation is also
favored by branching thus the cleavages at position 1 and 8 as shown in Fig. 6. 1H and 13C NMR
spectra of some representative isolated components of the essential oil listed in Tables 5 and 8
are presented in Figures 7-15 together with their spectral peaks.

87
Figure 7: 1H NMR 399.65 MHz C10 H18 O 0.05 ml: 0.5 ml CDCl3 1,8-cineole
Assign. Shift(ppm) A 2.022 B 1.661 C 1.50 E 1.41 F 1.239 G 1.050
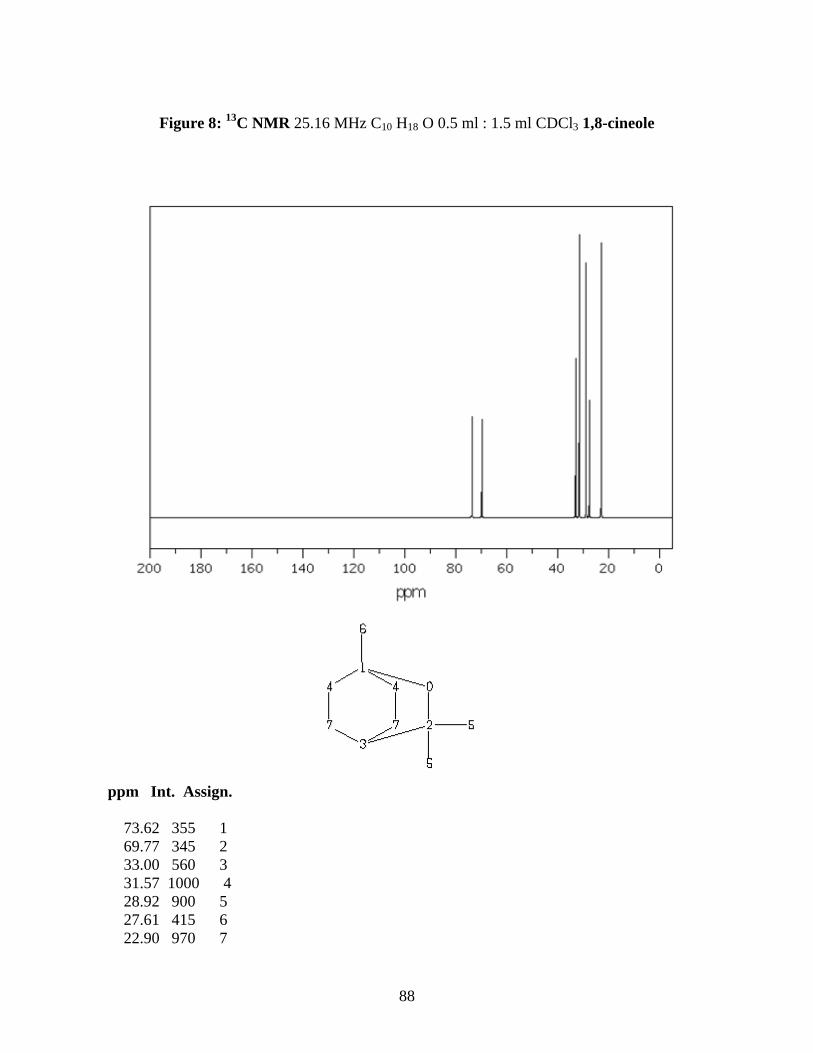
88
Figure 8: 13C NMR 25.16 MHz C10 H18 O 0.5 ml : 1.5 ml CDCl3 1,8-cineole
ppm Int. Assign. 73.62 355 1 69.77 345 2 33.00 560 3 31.57 1000 4 28.92 900 5 27.61 415 6 22.90 970 7
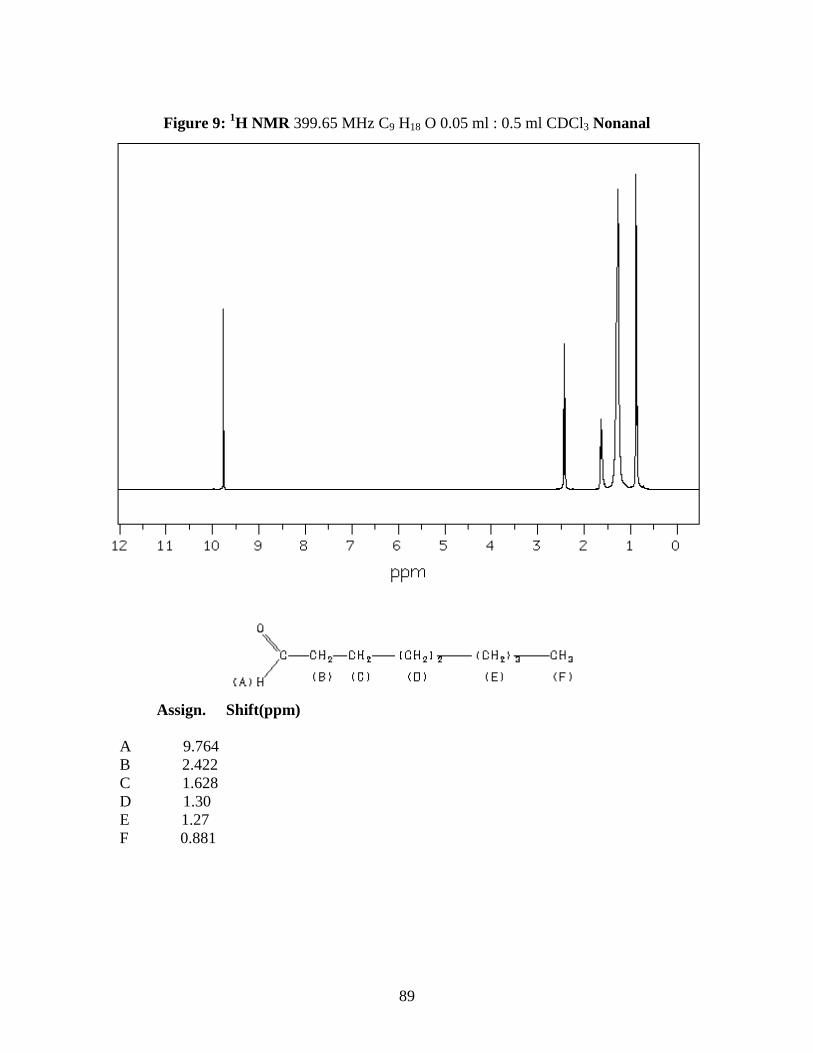
89
Figure 9: 1H NMR 399.65 MHz C9 H18 O 0.05 ml : 0.5 ml CDCl3 Nonanal
Assign. Shift(ppm) A 9.764 B 2.422 C 1.628 D 1.30 E 1.27 F 0.881
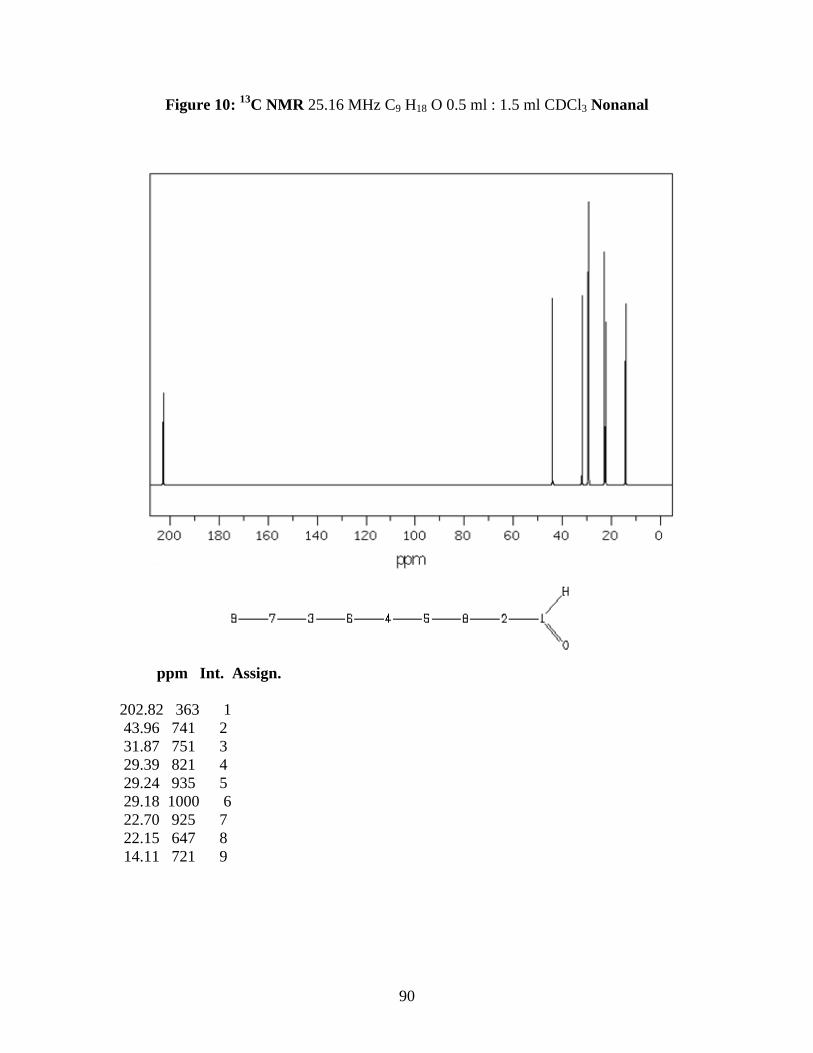
90
Figure 10: 13C NMR 25.16 MHz C9 H18 O 0.5 ml : 1.5 ml CDCl3 Nonanal
ppm Int. Assign. 202.82 363 1 43.96 741 2 31.87 751 3 29.39 821 4 29.24 935 5 29.18 1000 6 22.70 925 7 22.15 647 8 14.11 721 9
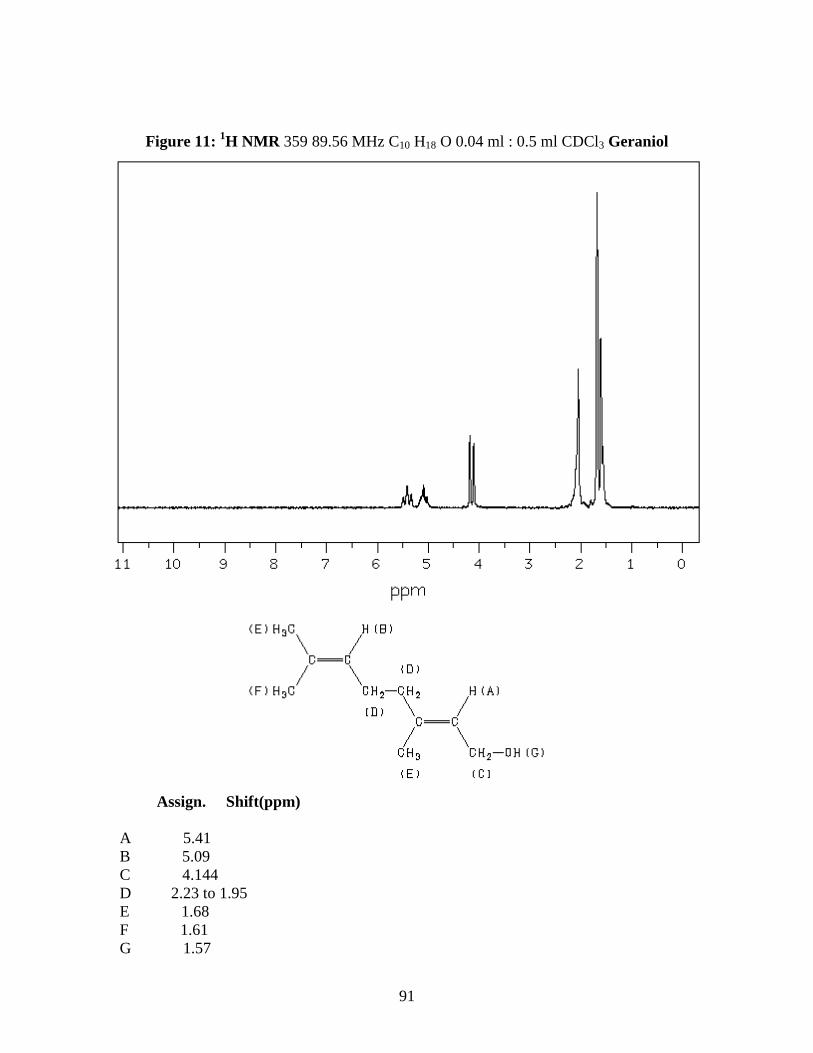
91
Figure 11: 1H NMR 359 89.56 MHz C10 H18 O 0.04 ml : 0.5 ml CDCl3 Geraniol
Assign. Shift(ppm) A 5.41 B 5.09 C 4.144 D 2.23 to 1.95 E 1.68 F 1.61 G 1.57
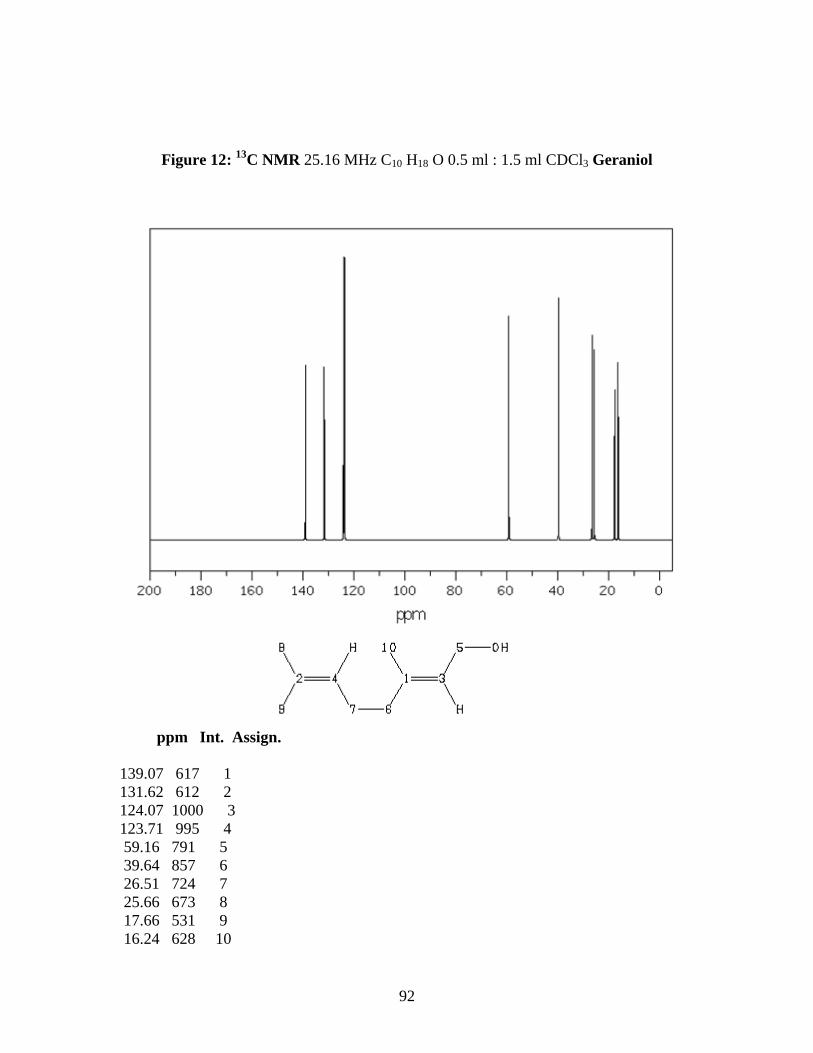
92
Figure 12: 13C NMR 25.16 MHz C10 H18 O 0.5 ml : 1.5 ml CDCl3 Geraniol
ppm Int. Assign. 139.07 617 1 131.62 612 2 124.07 1000 3 123.71 995 4 59.16 791 5 39.64 857 6 26.51 724 7 25.66 673 8 17.66 531 9 16.24 628 10

93
Figure 13: 13C NMR 25.16 MHz C10 H14 O 0.5 ml : 1.5 ml CDCl3 Carvacrol
ppm Int. Assign. 153.52 458 1 148.42 398 2 130.92 687 3 121.21 453 4 118.90 652 5 113.23 672 6 33.68 537 7 23.95 1000 8 15.35 517 9
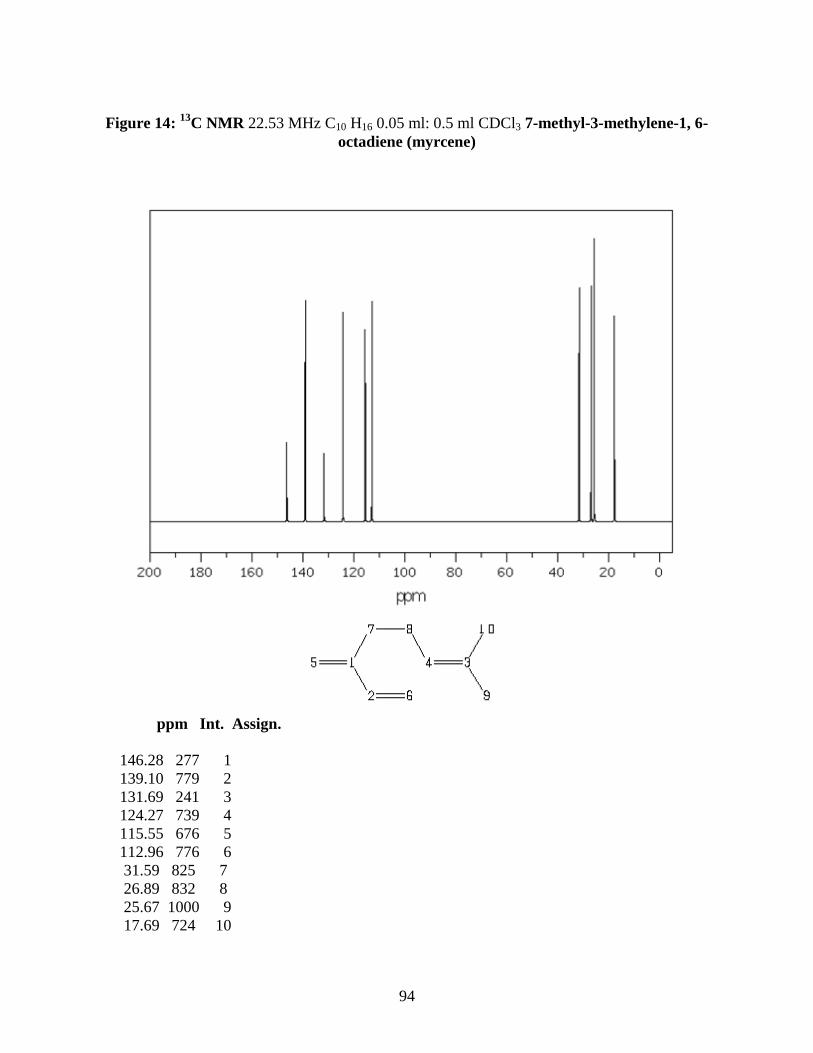
94
Figure 14: 13C NMR 22.53 MHz C10 H16 0.05 ml: 0.5 ml CDCl3 7-methyl-3-methylene-1, 6-octadiene (myrcene)
ppm Int. Assign. 146.28 277 1 139.10 779 2 131.69 241 3 124.27 739 4 115.55 676 5 112.96 776 6 31.59 825 7 26.89 832 8 25.67 1000 9 17.69 724 10

95
Figure 15: 13C NMR 25.16 MHz C12 H20 O2 0.5 ml : 1.5 ml CDCl3 Endo-bornyl acetate
ppm Int. Assign. 171.26 625 1 79.80 913 2 48.69 788 3 47.77 832 4 44.92 1000 5 36.77 842 6 28.05 870 7 27.09 728 8 21.22 408 9 19.72 701 10 18.83 679 11 13.49 647 12

96
CONCLUSIONS
This study has shown that a correlation exists between the yield of Calendula officinalis es-
sential oil and the age of the plant and that the yield is best during the flowering stage of the
plant. The relative abundance of the chemical constituents of its essential oil at this stage is a ve-
ritable indicator of the appropriate period for collection and harvesting of the plant for the isola-
tion of the desired mono- and sesquiterpenes.
The results of this study have reinforced the fact that there are quantitative and qualitative
differences in the essential oil components of the same plant that may be growing in different
parts of the world or of the fresh and dry plant materials. Finally, we were able to isolate and
elucidate 1, 8-cineole and some other key components of essential oils from the plant. The dy-
namics of oxidation of the components like α-thujene to the components like 1,8-cineole can be
envisaged and will be the topic of our further research in botanical and chemical laboratories.
97
REFERENCES
Agbakwuru E.O.P (1993). Chemical constituents of fragrant capsicums of Nigeria Part IV:
Composition of the essential oil of the fragrant, Capsicum ‘Iriboaka’ (Urhobo) or Izuwoaka
(Isoko) grown in the West Niger delta area of Nigeria, J. West Afro Pharm., 7, 22–26.
Anderson J. and Ingram J., 1993. Tropical soil biology and fertility. A Handbook of Methods, 2nd
ed., CABI, UK, 221 pp.
Arras, G., Piga, A., and D'hallewin G. (1993). The use of Thymus capitatus essential oil under
vacuum conditions to control Penicillium digitatum development on citrus fruit. Acta Horticult.,
344,147-153.
Asekun O. T. and Ekundayo O. (2000). Essential oil constituents of Hyptis suaveoleus (L) Poit
(bush tea) leaves from Nigeria. J. Essent. Oil Res., 12, 227–230.
Asekun, O. T.; Grierson, D. S., and Afolayan, A. J. (2007). Effects of drying methods on the
quality and quantity of the essential oil of Mentha longifolia L. Subsp. Capensis, Food Chem. J.,
101, 995-998.
Atherden L.M. (1969). Constituents of volatile oil: In Bentley and Driver’s Textbook of Pharma-
ceutical Chemistry, 8th edition, Oxford University Press London, 596–605.
98
Bako E., Deli J., and Toch G. (2002) HPLC study on the carotenoid composition of Calendula
products, J. Biochem. Biophys. Meth., 20, 13-20.
Balick, M. J. (1990). Ethnobotany and the identification of therapeutic agents from the rain for-
est, In: Bioactive Compounds from Plants. Ciba Foundation Symp., 154.
Beckett A. H and Stenlake J. B. (1986). Gas chromatography, In Practical Pharmaceutical Che-
mistry, 3rd Edition, Volume 2, Chatten L.G. (Editor), Athlone Press, London, 109–115.
Beerentrup H. M. and Robbelen G. (1987). Calendula and coriander - new potential oil crops for
industrial uses, Fett. Wiss. Technol., 89, 227-230.
Bilia A.R., Salvini D., Mazzi G., and Vincieri F. (2001). Characterization of calendula flower,
milk-thistle fruit, and passion flower tinctures by HPLC-DAD and HPLC-MS, Chromatogra-
phia, 53, 210–215.
Bodeker G. (1994). Traditional health knowledge and public policy, Nature Res., 30(2)5-16.
British Pharmacopoeia (BP) (1980). 11, P.A. 109, HMSO.
Burke Y. D., Stark M. J., Roach S. L., Sen S. E., and Crowell P. L (1997). Inhibition of pancrea-
tic cancer growth by the dietry isoprenoids farnesol and geraniol, Lipids, 32, 151-156.

99
Carnesecchi S., Schneider J., Ceraline J., Duranton B., Gosse N., Seiler N., and Raul F.
(2001).Geraniol, a component of plant essential oils, inhibits growth and polyamine biosynthesis
in human colon cancer cells. Pharmacol., 298(1)197-200.
Chah K. F., Eze C. A., Emuelosi C. E., and Esimone C. O. (2006). Antibacterial and wound heal-
ing properties of methanolic extracts of some Nigerian medicinal plants. J. Ethnopharmacol.,
104, 164-167.
Chang S. T., Wang S. Y., and Kuo Y. H. (2003). Resources and bioactive substances from Tai-
wan. (Taiwania cryptomerioides), J. Wood Sci., 49,1–4.
Christian G. D. (1977). Gas chromatography: In Analytical Chemistry 2nd Ed., John Wiley &
Sons, Inc.,605 Third Avenue, New York, 151–164.
Conn E.E. and Stumpf P.K. (1976). Outlines of Biochemistry, 4th Ed. John Wiley and Sons, New
York, 629.
Crabas N. (2003). Extraction, separation and isolation of volatiles and dyes from Calendula of-
ficinalis L. and Aloysia triphylla (L'Her.) Britton by supercritical CO2. JEOR (Sept/Oct), 5, No.
5, 350-355.
Cromack H. T. H. and Smith J. M. (1998). Calendula officinalis- production potential and crop
agronomy in Southern England. Ind. Crops Prod., 7, 223-229.
100
Duke J. A. (1991), Handbook of Medicinal Herbs, CRC Press, Boca Raton, 87-88.
Dumenil G., Chemli R., and Balausad G. (1980). Evaluation of antibacterial properties of Calen-
dula officinalis flowers and mother homeopathic tinctures of Calendula officinalis, Ann.
Pham. Franc., 38, 493-499.
EB (1990). The Encyclopedia Britannica, Micropaedia Ready Reference, 15th Edition, Volume
7, 122–124.
EDrugDigest (2004). Calendula What is it for? http://www.drugdigest.org/DD
/PrintablePages/herbMonograph/0,11475,4092,00.html
EMEA (2001) public statement. Reports of lactic acidosis in pregnant women treated with Zerit
and Videx. January 26, 2001.
Gilman E. F. and Howe T. (1999). Calendula officinalis. Cooperative Extension Service, Insti-
tute of Food and Agricultural Sciences, University of Florida. Fact Sheet FPS-87.
Goedert M. G. (2006). Field-portable instrumentation standard article, In: Encyclopedia of Ana-
lytical Chemistry, Hewlett-Packard Laboratories, Palo Alto, John Wiley & Sons.
101
Harborne J. B. (1991). Recent advances in the ecological chemistry of plant terpenoids, In: Eco-
logical Chemistry and Biochemistry of Plant Terpenoids (Harborne, J. B. and Tomas Barberan,
F.A., Eds.), Oxford University Press, Oxford, 399–426.
Harris D.C. (1999). Gas chromatography: In: Quantitative Chemical Analysis, 50th Ed., W.H.
Freeman & Co. New York, 675–693.
Heinrich M., Barnes J., Gibbons S., and Williamson E. M. (2004). Fundamentals of Pharmacog-
nosy and Phytotherapy. Churchill Livingstone, Edinburgh, 245–252.
Holm Y., Galambosi B., and Hiltunen R. (1988). Variation of the main terpenes in dragonhead
(Dracocephalum moldavica L.) during growth. Flavor Fragrance J. 3, 113-115.
Ibanez E., Oca A., de Murga G., Sebastian L. S., Tabera J., and Reglero G. (1999). Supercritical
fluid extraction and fractionation of different preprocessed rosemary plants, J. Agric. Food.
Chem., 47, 1400–1404.
Igwe C. C. and Osinowo F. A. O. (1996). Evaluation of the methods of essential oil extraction,
Nigeria Food J., 14, 78–84.
Ingram A. (1993). Tropical soil biology and fertility. A handbook of methods, C. A. B. Interna-
tional, Wallingford.

102
Janke R. and De Armond J. (2004). K-State research and extension MF-2610. A Grower’s
Guide, Calendula officinalis.
Jimenez-Medina E, Garcia-Lora A., Paco L., Algarra I., Collado A., and Garrido F. (2006). A
new extract of the plant Calendula officinalis produces a dual in vitro effect: cytotoxic anti-tumor
activity and lymphocyte activation, BMC Cancer, 6,119.
Kasali A. A., Oyedeji A. O. and Eshilokun A. O. (2001). Volatile leaf oil constituents of Cymbo-
pogon citratus (DC) Stapf., Flavor Fragr. J., 16, 377–378.
Kasali A. A. and Eshinlokun A. O. (2002). Volatile constituents of Dacryodes edulis (G. Don) H.
J. Lam leaves, JEOBP, 5(2), 77–82.
Kasali A. A., Adio A. M., Oyedeji A. O., Eshilokun A. O., and Adefenwa M. (2002). Volatile
constituents of Boswellia serrata Roxb. (Burseraceae) bark. Flavor Fragr. J., 17, 462–464.
Katocs A. S. (1995). Biological Testing, In, Remington: The Science and Practice of Pharmacy,
19th Edition, Mack Publishing, Easton, Pennsylvania U.S.A. Volume 1: 497–500.
Konig G. M., Wright A.D., Sticher O. and Fronczek F.R (1992). Two new sesquiterpene isothi-
ocyanates from the marine sponge Acanthella Klethra. J. Nat. Prod., 55, No.5. 633-638.

103
Longman and De Bussy J. H. (1972): In: Encyclopedia of Materials and Technology - Natural
Organic Materials and Related Synthetic Products, Volume 5, Kirk Othmer. 898.
Loughrin J. H. and Kasperbauer M. J. (2003) Aroma content of fresh basil (Ocimum basilicum
L) leaves as affected by light reflected from colored mulches, J. Agric. Food Chem., 51, 2272-
2276.
Malz F. and Jancke H. (2005). Validation of quantitative NMR. J. Pharml Biomed. Anal., 38,
813-823.
Marczal G., Cserjsi Z., Hethelyi E., and Petri G. (1987). Data on the essential content and com-
position of Calendula officinalis L. Herbs Hung., 26, 179-189.
McGimpsey, J. A., Douglas, M. H., Vanklink, J. W., Beauregard, D. A., and Perry, N. B. (1994).
Seasonal variation in essential oil yield and composition from naturalized Thymus vulgaris L. in
New Zealand. Flavor and Fragrance J., 9, 347–352.
Miguel M. G., Duarte F., Venancio F. and Tavares R. (2004). Composition of the essential oils
from Portuguese Thymus albicans collected at different regions of Ria Formosa (Algarve),
JEOR, (http://www.findarticles.com/p/articles/mi_qa4091/is_200407/ai n9450516).

104
Moldao-Martins M., Bernardo-Gil M. G., Da Costa M. L. B., and Rouzet M. (1999). Seasonal
variation in yield and composition of Thymus zygis L. subsp. sylvestris essential oil. Flavor
Fragr. J., 14, No.3, 177-182.
Morrison R. T. and Boyd R. N. (1987). Phenols, In: Organic Chemistry, Fifth edition, Allyn and
Bacon, Boston, Ch. 28.
Moyler, D.A. (1994). Spices – Recent advances. In: Spices, Herbs and Edible Fungi, Chara-
lambous (Ed.), Amsterdam: Elsevier Science, 1–65.
Muuse B. G., Cuperus F. P., and Derksen J. (1992). Composition and physical properties of oils
from new oil seed crops. Ind. Crops Prod., 1, 57-65.
Nagaota T., Goto K., Watanabe A., Sakata Y. and Yoshihara T. (2001). Sesquiterpenoids in root
exudates of Solanum aethiopicum., Z. Naturforsch., C56, 707-713.
Nagase H., Toshinori N., Ayako W., Yoshiteru S., and Teruhiko Y. (2000). Sesquiterpenoids
from the Roots of Solanum aethiopicum, Z. Naturforsch., C56, 181–187.
Ndubani P. and Hojer B. (1999). Traditional healers and the treatment of sexually transmitted
illness in rural Zambia, J. Ethnopharmacol., 67, 15–25.
105
Okalebo J. R., Gathua K. W. and Woomer P. L. (2002). Laboratory methods for soil and plant
analysis: A working manual, 2nd Ed., Tropical Soil and Biology Program, Nairobi, Kenya.
Parsons I. C., Gray A. I., Waterman P. G., and Harley T. G. (1993): New triterpenes and flavono-
ids from the leaves of Bosistoa brassii. J. Nat. Prod., 56(1) 46–53.
Pecsoc, R.L (1976). Mass spectrometry of organic compounds, In: Modern Methods of Chemical
Analysis, 2nd Edition, John Wiley & Sons, New York, 316–346.
Ravid.U. , Putievsky E. , Katzir I., Carmeli D. , Eshel A. and Schenk H.P. (2006). The essential
oil of Artemisia Judaica L. Chemotypes. Flavor and fragrance J., 7, 69-72.
Rios J. L. and Recios M. C. (2005). Medicinal plants and antimicrobial activity, J. Ethnophar-
macol., 100, 80–84.
Skoog D. A. and West D. M. (1980). Gas-liquid chromatography. In: Principles of Instrumental
Analysis, 2nd Ed., Saunders College, Philadelphia, 725.
Srivastava S. B. (1991). Perfume, flavor and essential oil industries, 6th Ed., published by
Small-scale Industries Research Institute, Delhi, India, 113–119.
Svanidze N. L., Sanchez A., Rodriguez P., Soler B., and Fornet E. (1975). Perspectives de culti-
vo de Calendula officinalis, Rev. Cub. Farm., 9, 97-101.
106
Trease G. E. and Evans W. C. (1978). Volatile oils and resins, In: Trease and Evans, Pharma-
cognosy, 11th Edition, Balliere Tindall,. London, 404–474.
Shibamoto T (1987). Retention indices in essential oil analysis. In: Capillary Gas Chromatogra-
phy in Essential Oil Analysis, Sandra P and Bicch C (Eds), Alfred Heuthig - Verlag, New York,
259-275.
USDA (2005). United States Department of Agriculture. Natural resources conservation servic-
es. http://plants.usda.gov/cgi_bin/topics.cgi?earl=plant_profile.cgi&symbol=CA OF).
Van Wyk B. E., Van Oudshoorn B., and Gericke N. (1997). Medicinal Plants of South Africa,
First ed., Briza Publications, Pretoria.
Van Wyk B. E. and Wink M. (2004). Medicinal Plants of the World. Briza Publications, Preto-
ria.
Vanaclocha A. and Canigueral S. (2003). Fitoterapia: Vademécum de Prescripción, 4a edición.
Barcelona: Masson, 310-311.
Vidal-Ollivier E., Elias R., Faure F., Babadjamian A., Crespin F., Balansard G., and Boudon G.
(1989). Flavonal glycosides from Calendula officinalis flowers, Planta Medica, 55, 73–74.
107
Viljoen A. M., Subramoney S., van Vuuren S. F., Baser K. H. C., and Demirci B. (2005). The
composition, geographical variation and antimicrobial activity of Lippia javanica (Verbenaceae)
leaf essential oils. J. Ethnopharmacol., 96, 271–277.
Wichtl M. (1994). Herbal drugs and Phytopharmaceuticals, Medpharm Scientific Publishers,
Stuttgart:, 446.
108
APPENDIX
List of Figures
1 Calendula officinalis L. ………………………………………………………................. 13
2 Major Components of the Essential Oil of Calendula officinalis ......................................... 64
3 Extraction and Partitioning Process ………...……………………………........................ 77
4 Fractionation and Purification Process …..……………………………………............... 78
5 GC-MS peaks of 1,8-cineole ............................................................................................... 79
6 Fractionation pattern of 1,8-cineole ................................................................................... 80
7 IR-Spectrum of 1,8-Cineole ............................................................................................... 81
8 NMR Peaks for 1,8-Cineole ............................................................................................... 82
9 Published 1H NMR Spectrum of 1,8-Cineole ...................................................................... 83
10 Simulated 1H NMR Spectrum of 1,8-Cineole ................................................................. 83
109
List of Tables
1 Some Plants Used as Cosmetics in Mozambique (Bodeker, 1994) ……………………... 8
2 Botanical Classification of Calendula Officinalis L. ……………………………………... 12
3 Some Common Stationary Phases (Skoog and West, 1980) ............................................... 28
4 Soil Parameters and the Values Obtained ............................................................................. 52
5 Major Essential Oil Constituents of Calendula officinalis at Different Stages of Growth
............................................................................................................................................... 55
6 R2 values of the Main Components of the Essential Oil of Calendula officinalis During Its
Vegetative Life Cycle ........................................................................................................... 65
7 Chemical Composition of the Essential Oil from Calendula officinalis L Growing in the
Eastern Cape Province of South Africa ........................................................................... 71
Related Documents