Journal of Fish Biology (2012) 80, 785–801 doi:10.1111/j.1095-8649.2012.03220.x, available online at wileyonlinelibrary.com Variation in gene expression along a salinity gradient in wild populations of the euryhaline black-chinned tilapia Sarotherodon melanotheron M. Tine‡*§, B. Guinand* and J.-D. Durand† ‡Max Planck Institute for Molecular Genetics, Ihnestrasse 63-73, D-14195 Berlin, Germany,*Universit´ e Montpellier II, CNRS-UMR 5554 (Institut des Sciences de l’Evolution de Montpellier), Station M´ editerran´ eenne de l’Environnement Littoral, S` ete 34200, France and †IRD, UMR 5119 ECOSYM, route des hydrocarbures BP 1386 18524 Dakar, Senegal (Received 13 February 2011, Accepted 23 December 2011) This study evaluated variation in expression of 11 genes within and among six wild populations of the black-chinned tilapia Sarotherodon melanotheron distributed along a salinity gradient from 0 to 100. Previous laboratory studies had shown that expression of these genes was sensitive to water salinity; the current study confirmed that a number of them also varied in expression in wild populations along the salinity gradient. Principal component analysis (PCA) first distinguished two, not mutually exclusive, sets of genes: trade-off genes that were highly expressed at one or other extreme of the salinity gradient and stress genes that were up-regulated at the two salinity extremes (i.e. a U-shaped expression pattern). The PCA clearly partitioned the populations into three groups based on their gene expression patterns and their position along the salinity gradient: a freshwa- ter (GL; 0) population, four brackish and seawater (GB, HB, SM, SF; ranging from 20 to 50) populations and a hypersaline (SK, 100) population. Individual variation in gene expression was significantly greater within the populations at the extreme compared to intermediate salinities. These results reveal phenotypically plastic regulation of gene expression in S. melanotheron, and greater osmoregulatory and plasticity costs at extreme salinities, where fitness-related traits are known to be altered. © 2012 The Authors Journal of Fish Biology © 2012 The Fisheries Society of the British Isles Key words: adaptation; biomarker; fish; osmoregulation; plasticity. INTRODUCTION Over the past 10 years, there has been a significant growth in gene expression studies in fishes (Cossins et al., 2006; Douglas, 2006; Goetz & MacKenzie, 2008; Kassahn, 2008; Miller & Maclean, 2008; Oleksiak, 2010; Larsen et al., 2011), in particular when they were exposed to environmental stressors (Cossins & Crawford, 2005; Oleksiak, 2010; Larsen et al., 2011). At a molecular level, variation in gene expression can result in the alteration of phenotype, known as phenotypic plastic- ity (Gibson, 2008; Shiu & Borevitz, 2008). Phenotypic plasticty presumably plays an important role in short-term physiological acclimation of organisms to their environment (L´ opez-Maury et al., 2008; Dalziel et al., 2009; Hofmann & Todgham, §Author to whom correspondence should be addressed. Tel.: +49 30 8413 1556; email: tine@molgen. mpg.de; [email protected] 785 © 2012 The Authors Journal of Fish Biology © 2012 The Fisheries Society of the British Isles

Welcome message from author
This document is posted to help you gain knowledge. Please leave a comment to let me know what you think about it! Share it to your friends and learn new things together.
Transcript
Journal of Fish Biology (2012) 80, 785–801
doi:10.1111/j.1095-8649.2012.03220.x, available online at wileyonlinelibrary.com
Variation in gene expression along a salinity gradientin wild populations of the euryhaline black-chinned tilapia
Sarotherodon melanotheron
M. Tine‡*§, B. Guinand* and J.-D. Durand†
‡Max Planck Institute for Molecular Genetics, Ihnestrasse 63-73, D-14195 Berlin,Germany,*Universite Montpellier II, CNRS-UMR 5554 (Institut des Sciences de l’Evolutionde Montpellier), Station Mediterraneenne de l’Environnement Littoral, Sete 34200, Franceand †IRD, UMR 5119 ECOSYM, route des hydrocarbures BP 1386 18524 Dakar, Senegal
(Received 13 February 2011, Accepted 23 December 2011)
This study evaluated variation in expression of 11 genes within and among six wild populationsof the black-chinned tilapia Sarotherodon melanotheron distributed along a salinity gradient from0 to 100. Previous laboratory studies had shown that expression of these genes was sensitive towater salinity; the current study confirmed that a number of them also varied in expression in wildpopulations along the salinity gradient. Principal component analysis (PCA) first distinguished two,not mutually exclusive, sets of genes: trade-off genes that were highly expressed at one or otherextreme of the salinity gradient and stress genes that were up-regulated at the two salinity extremes(i.e. a U-shaped expression pattern). The PCA clearly partitioned the populations into three groupsbased on their gene expression patterns and their position along the salinity gradient: a freshwa-ter (GL; 0) population, four brackish and seawater (GB, HB, SM, SF; ranging from 20 to 50)populations and a hypersaline (SK, 100) population. Individual variation in gene expression wassignificantly greater within the populations at the extreme compared to intermediate salinities. Theseresults reveal phenotypically plastic regulation of gene expression in S. melanotheron, and greaterosmoregulatory and plasticity costs at extreme salinities, where fitness-related traits are known to bealtered. © 2012 The Authors
Journal of Fish Biology © 2012 The Fisheries Society of the British Isles
Key words: adaptation; biomarker; fish; osmoregulation; plasticity.
INTRODUCTION
Over the past 10 years, there has been a significant growth in gene expressionstudies in fishes (Cossins et al., 2006; Douglas, 2006; Goetz & MacKenzie, 2008;Kassahn, 2008; Miller & Maclean, 2008; Oleksiak, 2010; Larsen et al., 2011), inparticular when they were exposed to environmental stressors (Cossins & Crawford,2005; Oleksiak, 2010; Larsen et al., 2011). At a molecular level, variation in geneexpression can result in the alteration of phenotype, known as phenotypic plastic-ity (Gibson, 2008; Shiu & Borevitz, 2008). Phenotypic plasticty presumably playsan important role in short-term physiological acclimation of organisms to theirenvironment (Lopez-Maury et al., 2008; Dalziel et al., 2009; Hofmann & Todgham,
§Author to whom correspondence should be addressed. Tel.: +49 30 8413 1556; email: [email protected]; [email protected]
785© 2012 The AuthorsJournal of Fish Biology © 2012 The Fisheries Society of the British Isles
786 M . T I N E E T A L .
2010; Larsen et al., 2011). Indeed, phenotypic plasticity is considered to be an essen-tial determinant of an organism’s fitness because it provides appropriate responsesto environmental variation and may also drive long-term heritable adaptation (Priceet al., 2003; West-Eberhard, 2003; Ghalambor et al., 2007).
Tine et al. (2008) used suppression subtractive hybridization (SSH; Diatchenkoet al., 1996) to produce libraries of genes that were either down or up-regulated ingills of black-chinned tilapia Sarotherodon melanotheron Ruppell 1852 acclimatedto either fresh water (FW; 0) or hypersaline water (HW; 70) in the laboratory.This revealed a series of genes involved in osmoregulation, energy production andenergy consumption (Tine et al., 2008). Sarotherodon melanotheron is particularlyinteresting because natural populations are found in some West African estuaries inwhich salinity levels have risen drastically, as a result of climate change, over recentdecades (since the late 1960s or early 1970s; Pages & Citeau, 1990). In Senegal,reduced freshwater input and intense evaporation have caused an inversion of thesalinity gradient in the Saloum and Casamance Estuaries, such that salinities actuallyincrease from the mouth to the upper reaches (inverted estuary; Simier et al., 2004).The salinities in these areas range from 0 to >130 (Panfili et al., 2004a, b). Theseextreme salinities have affected fish community structure and influenced life-historyor fitness traits such as growth and reproduction in several species, including S.melanotheron (Panfili et al., 2004a, b, 2006; Simier et al., 2004; Diouf et al., 2009;Labonne et al., 2009).
How variations in salinity may influence patterns of gene expression has notbeen investigated in these natural populations of S. melanotheron. Studies of geneexpression in wild individuals are rare in fishes and mainly restricted to analysis ofone or two genes (Oleksiak, 2010); Scott et al. (2009) carried out a microarray study.In S. melanotheron, Tine et al. (2010) analysed variation in expression of the heatshock protein (hsp70 ) and Na+, K+-ATPase1α (naka) genes among three populationsin the Saloum Estuary, whose salinity varies from 40 to 100. Gene expression patternswere positively correlated with the salinity gradient, which is coherent with the resultsobtained for these two genes in the previous laboratory study of salinity acclimation(Tine et al., 2008). The other genes identified in the laboratory SSH study (Tineet al., 2008) remain to be investigated in wild populations along a salinity gradient.
The main objective of this study was, therefore, to evaluate variation in expres-sion of 11 genes (Table I) in six natural populations of S. melanotheron sampledover a range of salinities from 0 to 100, using real-time PCR. These genes werepreviously identified as sensitive to salinity (Tine et al., 2008) and are involved inosmotic homeostasis, detoxification processes and cellular energy metabolism. Theymay, therefore, provide biomarkers of salinity stress and demonstrate a link betweenthis stressor and the negative effects on life-history traits observed in natural popu-lations at extreme salinities. Significant variation in gene expression was revealed inpopulations along the salinity gradient.
MATERIALS AND METHODS
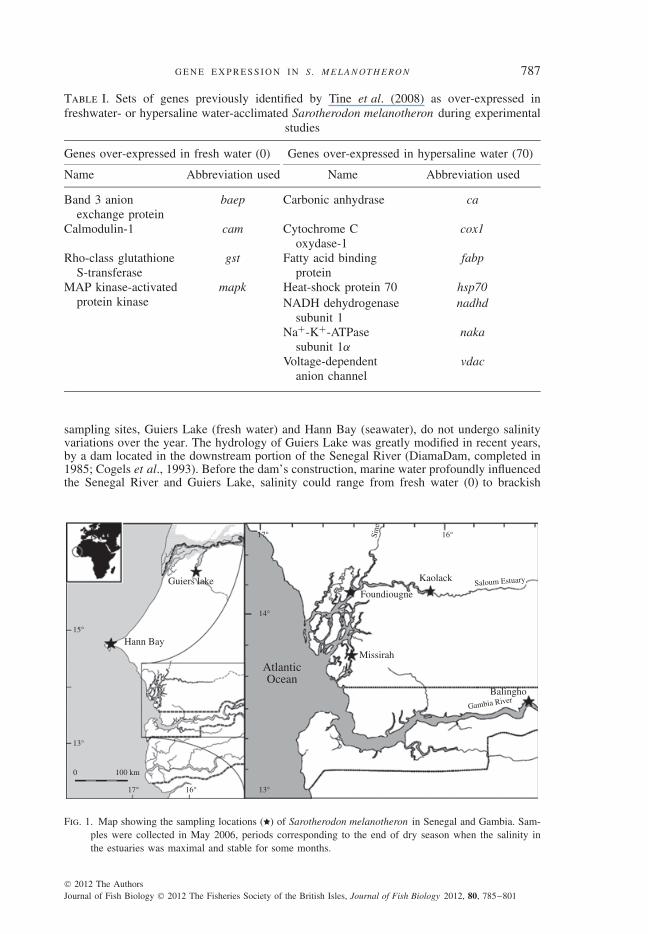
S T U DY A R E A A N D S A M P L I N G I N NAT U R A L P O P U L AT I O N SSix populations of S. melanotheron [subspecies S. m. heudeulotii (Dumeril 1861)] were
sampled in Senegal and Gambia in 2006, at the end of the dry season (May) (Fig. 1). Two
© 2012 The AuthorsJournal of Fish Biology © 2012 The Fisheries Society of the British Isles, Journal of Fish Biology 2012, 80, 785–801
G E N E E X P R E S S I O N I N S . M E L A N OT H E RO N 787
Table I. Sets of genes previously identified by Tine et al. (2008) as over-expressed infreshwater- or hypersaline water-acclimated Sarotherodon melanotheron during experimental
studies
Genes over-expressed in fresh water (0) Genes over-expressed in hypersaline water (70)
Name Abbreviation used Name Abbreviation used
Band 3 anionexchange protein
baep Carbonic anhydrase ca
Calmodulin-1 cam Cytochrome Coxydase-1
cox1
Rho-class glutathioneS-transferase
gst Fatty acid bindingprotein
fabp
MAP kinase-activatedprotein kinase
mapk Heat-shock protein 70 hsp70NADH dehydrogenase
subunit 1nadhd
Na+-K+-ATPasesubunit 1α
naka
Voltage-dependentanion channel
vdac
sampling sites, Guiers Lake (fresh water) and Hann Bay (seawater), do not undergo salinityvariations over the year. The hydrology of Guiers Lake was greatly modified in recent years,by a dam located in the downstream portion of the Senegal River (DiamaDam, completed in1985; Cogels et al., 1993). Before the dam’s construction, marine water profoundly influencedthe Senegal River and Guiers Lake, salinity could range from fresh water (0) to brackish
Guiers lake
Missirah
Balingho
Gambia River
Foundiougne
Kaolack
16°17°
15°
13°
17° 16° 13°
14°
0 100 km
Saloum Estuary
Sine
Hann Bay
AtlanticOcean
Fig. 1. Map showing the sampling locations ( ) of Sarotherodon melanotheron in Senegal and Gambia. Sam-ples were collected in May 2006, periods corresponding to the end of dry season when the salinity inthe estuaries was maximal and stable for some months.
© 2012 The AuthorsJournal of Fish Biology © 2012 The Fisheries Society of the British Isles, Journal of Fish Biology 2012, 80, 785–801
788 M . T I N E E T A L .
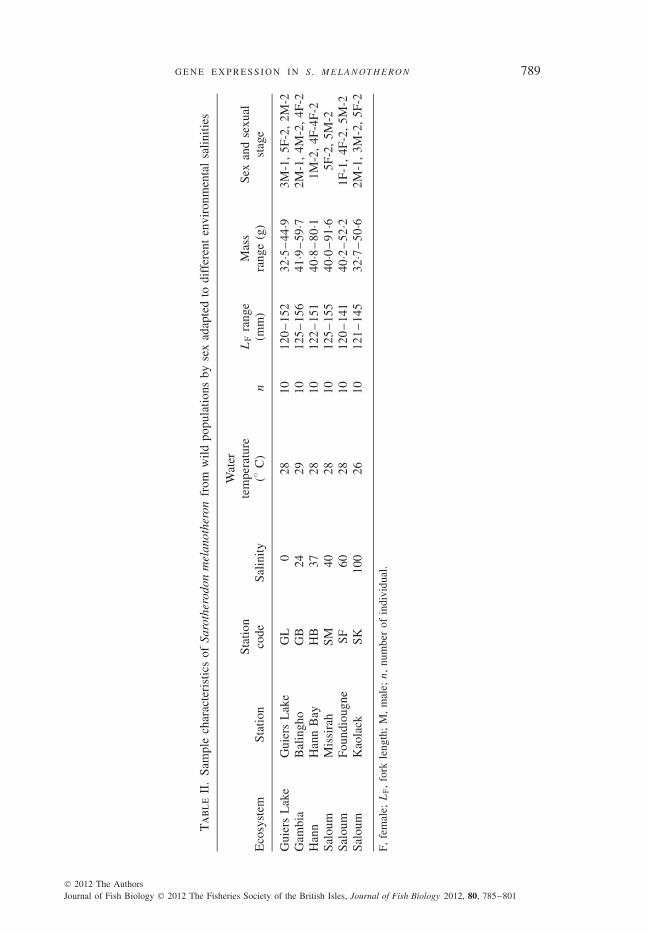
(15–20) on a seasonal basis (Gac et al., 1986). Fish were also collected at three locations ofthe Saloum Estuary (Kaolack, Foundiougne and Missirah) and at one location on the GambiaEstuary (Balingho). Salinity and temperature were measured at each location (Table II). Aninversion of the salinity gradient is observed in the Saloum Estuary, with salinities thatincrease from the mouth to the upper reaches (inverse estuary; Albaret et al., 2004; Simieret al., 2004; Panfili et al., 2006). By contrast, the nearby Gambia Estuary has been lessaffected by droughts and therefore retains a typical salinity gradient (Simier et al., 2006). Fishsampling was performed by local fishermen using cast nets with small mesh. Since inbreedingis common in tilapias (Pouyaud et al., 1999; Thunken et al., 2007), fish were sampled indifferent cast nets at each location in order to minimize any such effect. Fish were then killedby rapid decapitation, with sex and gonad maturity stage recorded according to Legendre& Ecoutin (1989). Since gene expression could conceivably be influenced by differences indevelopmental or sexual stage, only size classes between 120 and 160 mm fork length (LF)with sexual stage 1 (immature) and 2 (less advanced stage of sexual maturation) were selectedfor the analyses. Gills were extracted from these individuals and stored in RNAlater (Ambion;www.invitrogen.com) at 4◦ C for 24 h, and then at −20◦ C until processing.
Q UA N T I TAT I V E R E A L - T I M E P C R A NA LY S I S
Total RNA was extracted from the gills preserved at −80◦ C for experimental samples andin RNAlater of natural samples with TRIzol reagent (Gibco-BRL; Invitrogen), according to themanufacturer’s instructions. RNA concentrations were determined using a spectrophometer,and RNA integrity was verified by 1% Tris-acetate-EDTA (TAE) 1× agarose gel electrophore-sis (Tris 40 mM, acetate, EDTA 1 mM). The relative expression of genes reported in Table Iwas analysed in 60 fish (10 individuals per population). Each quantitative real-time (qRT)-PCR reaction was conducted in duplicate, and the coefficients of variation (c.v.) betweenthese were all <10%. The qRT-PCR quantification was performed on a LightCycler (RocheMolecular Biomedicals; http://molecular.roche.com) and comprised an initial denaturationstep of 15 min at 95◦ C followed by an amplification of the target complementary (c)DNA(40 cycles of denaturation at 95◦ C for 15 s, annealing between 54 and 55◦ C for 15 s,and extension time at 72◦ C for 15 s). Details on the primers used in this study are givenin the study by Tine et al. (2008). To determine qRT-PCR efficiency of each primer pair,standard curves were generated using five serial dilutions (1, 1/10, 1/50, 1/100 and 1/500)of a unique cDNA sample constituted of a pool of six cDNA from each population to beanalysed. Efficiencies (E) of qRT-PCR were calculated from the given slope (b) of thestandard curve according to the equation E = 10(−1−b). The products of amplification werevalidated by analysing the amplicon size on agarose gel electrophoresis. Results are shown aschanges in relative expression normalized to the reference gene (β-actin) using the 2−(��Ct)
method described by Pfaffl (2001). As in previous studies (Tine et al., 2007, 2008), β-actinwas the reference house-keeping gene in this study because messenger (m)RNA levels didnot vary across samples, unlike other commonly used housekeeping genes (e.g. 18srna andgapdh).
DATA A NA LY S E S
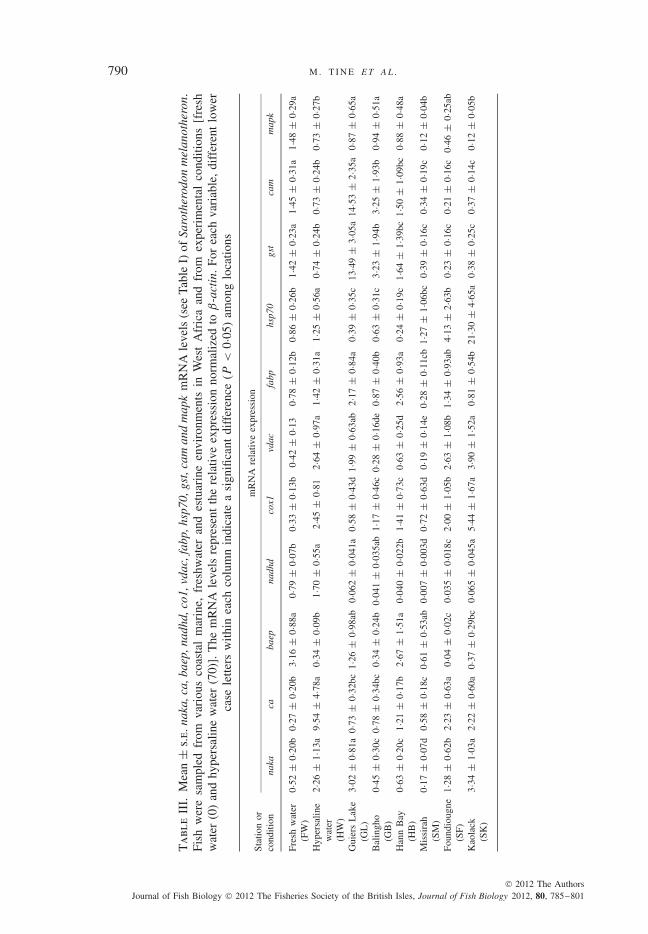
Gene expression data (Table III) at each site represent the relative expression normal-ized to β-actin and were expressed as mean ± s.e. The Kruskal–Wallis non-parametricANOVA and the Mann–Whitney U -test were performed for each variable to reveal signif-icant differences in means between sites. Taking all the individual data from the sites, thestrength of the correlations between mRNA levels and environmental salinity (Appendix I)was assessed by Spearman’s rank test. These tests were performed with Statistica Software(//www.statsoft.com). For all tests, a probability of <5% (P < 0·05) was taken as the fidu-cial level of significance. In order to summarize expression differences among populationsfor the full set of investigated genes, a principal component analysis (PCA) was performed(R Software, version R-2.8.1; //www.r-project.org). This illustrates variation of expressionboth among and within populations. PCA was performed on the whole data set (n = 60)
© 2012 The AuthorsJournal of Fish Biology © 2012 The Fisheries Society of the British Isles, Journal of Fish Biology 2012, 80, 785–801
G E N E E X P R E S S I O N I N S . M E L A N OT H E RO N 789
Tab
leII
.Sa
mpl
ech
arac
teri
stic
sof
Saro
ther
odon
mel
anot
hero
nfr
omw
ildpo
pula
tions
byse
xad
apte
dto
diff
eren
ten
viro
nmen
tal
salin
ities
Eco
syst
emSt
atio
nSt
atio
nco
deSa
linity
Wat
erte
mpe
ratu
re(◦
C)
n
LF
rang
e(m
m)
Mas
sra
nge
(g)
Sex
and
sexu
alst
age
Gui
ers
Lak
eG
uier
sL
ake
GL
028
1012
0–
152
32·5–
44·9
3M-1
,5F
-2,
2M-2
Gam
bia
Bal
ingh
oG
B24
2910
125
–15
641
·9–59
·72M
-1,
4M-2
,4F
-2H
ann
Han
nB
ayH
B37
2810
122
–15
140
·8–80
·11M
-2,
4F-4
F-2
Salo
umM
issi
rah
SM40
2810
125
–15
540
·0–91
·65F
-2,
5M-2
Salo
umFo
undi
ougn
eSF
6028
1012
0–
141
40·2–
52·2
1F-1
,4F
-2,
5M-2
Salo
umK
aola
ckSK
100
2610
121
–14
532
·7–50
·62M
-1,
3M-2
,5F
-2
F,fe
mal
e;L
F,
fork
leng
th;
M,
mal
e;n
,nu
mbe
rof
indi
vidu
al.
© 2012 The AuthorsJournal of Fish Biology © 2012 The Fisheries Society of the British Isles, Journal of Fish Biology 2012, 80, 785–801
790 M . T I N E E T A L .
Tab
leII
I.M
ean
±s.
e.na
ka,c
a,ba
ep,n
adhd
,co1
,vda
c,fa
bp,h
sp70
,gst
,cam
and
map
km
RN
Ale
vels
(see
Tabl
eI)
ofSa
roth
erod
onm
elan
othe
ron.
Fish
wer
esa
mpl
edfr
omva
riou
sco
asta
lm
arin
e,fr
eshw
ater
and
estu
arin
een
viro
nmen
tsin
Wes
tA
fric
aan
dfr
omex
peri
men
tal
cond
ition
s[f
resh
wat
er(0
)an
dhy
pers
alin
ew
ater
(70)
].T
hem
RN
Ale
vels
repr
esen
tth
ere
lativ
eex
pres
sion
norm
aliz
edto
β-a
ctin
.Fo
rea
chva
riab
le,
diff
eren
tlo
wer
case
lette
rsw
ithin
each
colu
mn
indi
cate
asi
gnifi
cant
diff
eren
ce(P
<0·0
5)am
ong
loca
tions
mR
NA
rela
tive
expr
essi
onSt
atio
nor
cond
ition
naka
caba
epna
dhd
cox1
vdac
fabp
hsp7
0gs
tca
mm
apk
Fres
hw
ater
(FW
)0·5
2±
0·20b
0·27
±0·2
0b3·1
6±
0·88a
0·79
±0·0
7b0·3
3±
0·13b
0·42
±0·1
30·7
8±
0·12b
0·86
±0·2
6b1·4
2±
0·23a
1·45
±0·3
1a1·4
8±
0·29a
Hyp
ersa
line
wat
er(H
W)
2·26
±1·1
3a9·5
4±
4·78a
0·34
±0·0
9b1·7
0±
0·55a
2·45
±0·8
12·6
4±
0·97a
1·42
±0·3
1a1·2
5±
0·56a
0·74
±0·2
4b0·7
3±
0·24b
0·73
±0·2
7b
Gui
ers
Lak
e(G
L)
3·02
±0·8
1a0·7
3±
0·32b
c1·2
6±
0·98a
b0·0
62±
0·041
a0·5
8±
0·43d
1·99
±0·6
3ab
2·17
±0·8
4a0·3
9±
0·35c
13·49
±3·0
5a14
·53±
2·35a
0 ·87
±0·6
5a
Bal
ingh
o(G
B)
0·45
±0·3
0c0·7
8±
0·34b
c0·3
4±
0·24b
0·041
±0·0
35ab
1·17
±0·4
6c0·2
8±
0·16d
e0·8
7±
0·40b
0·63
±0·3
1c3·2
3±
1·94b
3·25
±1·9
3b0·9
4±
0·51a
Han
nB
ay(H
B)
0·63
±0·2
0c1·2
1±
0·17b
2·67
±1·5
1a0·0
40±
0·022
b1·4
1±
0·73c
0·63
±0·2
5d2·5
6±
0·93a
0·24
±0·1
9c1·6
4±
1·39b
c1·5
0±
1·09b
c0·8
8±
0·48a
Mis
sira
h(S
M)
0·17
±0·0
7d0·5
8±
0·18c
0·61
±0·5
3ab
0·007
±0·0
03d
0·72
±0·6
3d0·1
9±
0·14e
0·28
±0·1
1cb
1·27
±1·0
6bc
0·39
±0·1
6c0·3
4±
0·19c
0·12
±0·0
4b
Foun
diou
gne
(SF)
1·28
±0·6
2b2·2
3±
0·63a
0·04
±0·0
2c0·0
35±
0·018
c2·0
0±
1·05b
2·63
±1·0
8b1·3
4±
0·93a
b4·1
3±
2·63b
0·23
±0·1
6c0·2
1±
0·16c
0·46
±0·2
5ab
Kao
lack
(SK
)3·3
4±
1·03a
2·22
±0·6
0a0·3
7±
0·29b
c0·0
65±
0·045
a5·4
4±
1·67a
3·90
±1·5
2a0·8
1±
0·54b
21·30
±4·6
5a0·3
8±
0·25c
0·37
±0·1
4c0·1
2±
0·05b
© 2012 The AuthorsJournal of Fish Biology © 2012 The Fisheries Society of the British Isles, Journal of Fish Biology 2012, 80, 785–801
G E N E E X P R E S S I O N I N S . M E L A N OT H E RO N 791
and for each of the 11 variables (mRNA levels for the 11 investigated genes) measured foreach individual. Interindividual variation in gene expression within group (i.e. the overallvariation of gene expression among individuals) was also investigated in the populations, asa within-population coefficient of variation (C.V.w) using the mean and s.d. of 11 relativeexpression values for each individual at each gene (c.v. = s.d. divided by mean). Differencesin C.V.w between populations were tested using the non-parametric Kolmogorov–Smirnovtest with the Statistica Software.
RESULTS
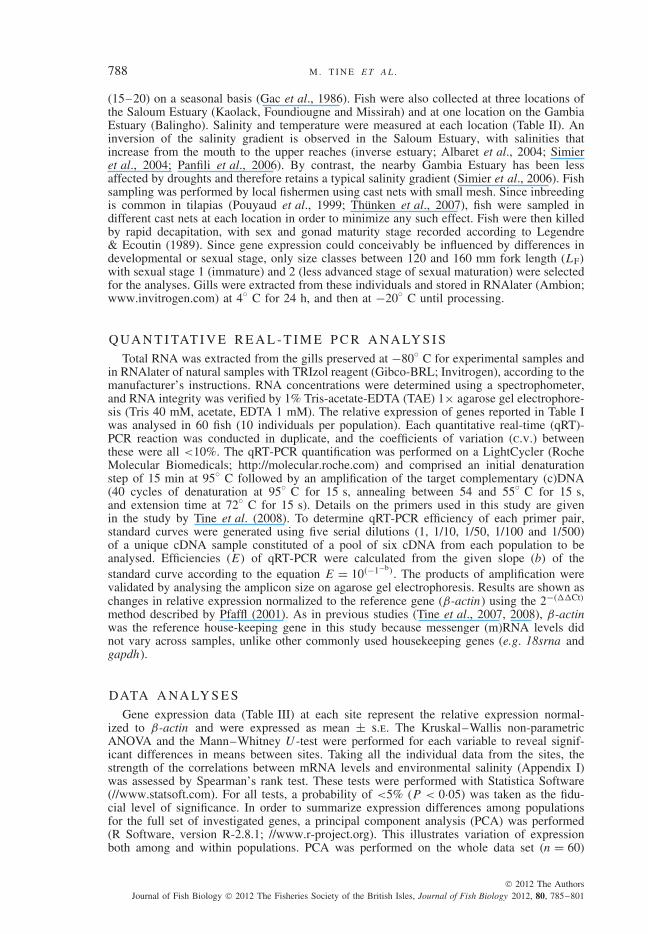
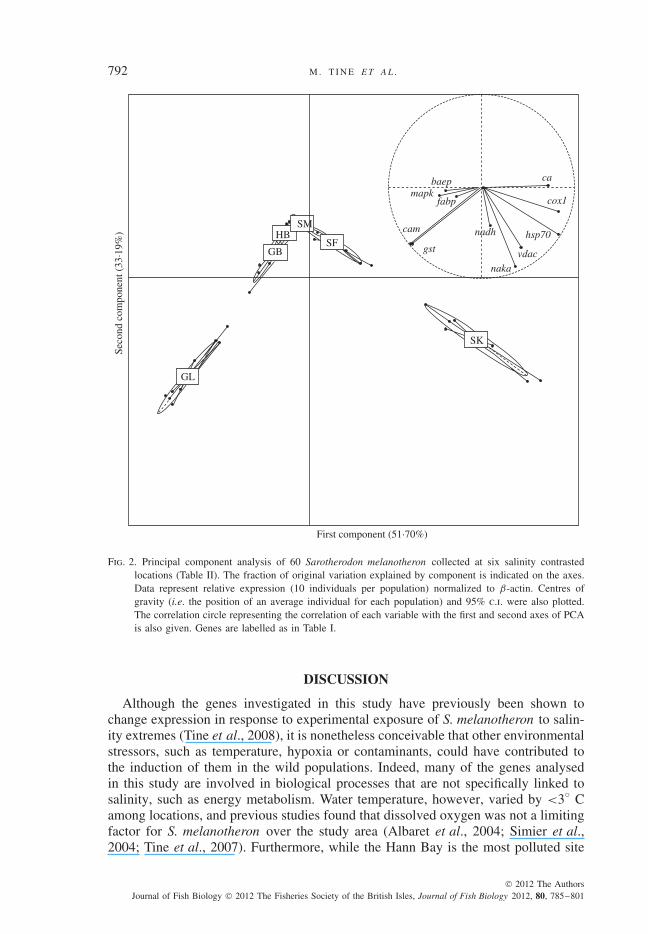
The PCA summarized expression variation among wild populations over the 11genes investigated (Fig. 2). Correlations between environmental salinity and mRNAexpression at each investigated gene, as well as individual gene expressions foreach population, are reported in Appendix I and Table III. The two first PCA axesaccounted for 84·89% of total variance and identified three groups of populations,opposing populations with extreme salinities (GL and SK) to those caught at inter-mediate salinities (GB, HB, SM and SF). Ordination of populations along the firstaxis of the PCA arranged them along the salinity gradient (GL, GB, HB, SM, SFand SK; Table II and Fig. 2). The correlation circle (Fig. 2, inset) illustrated howeach variable (gene expression level) participated in the ordination of samples alongeach PCA axis. It indicated genes whose expression was negatively (on the left side)or positively (on the right side) correlated with ordination of samples along the firstPCA axis (similarly, at the bottom and at the top of the figure for ordination of sam-ples along the second PCA axis). The strength and then the sign of the correlationfor expression of each gene is established by projecting arrow vectors on each PCAaxis (Fig. 2, insert), making such information more useful than simple correlationsamong environmental salinity and mRNA expression level at each gene and popu-lation (Appendix I). According to this analysis, the freshwater population GL wasmainly characterized by higher expression of the cam and gst genes, then the mapk,baep and fabp genes along the first PCA axis, whereas the hypersaline populationSK was first characterized by higher expression of the ca, cox1 and hsp70 genes,then by expression of the vdac and naka genes (Fig. 2). The correlation of nadhdwith the first axis was very low, indicating no significant correlation with salinity(Appendix I).
Ordination of samples along the second PCA axis indicated similar levels of geneexpression in extreme salinity populations GL and SK, principally for the vdac andnaka genes (but also nadhd ; Table III) whose expressions were highly correlatedwith this axis (Fig. 2, inset).
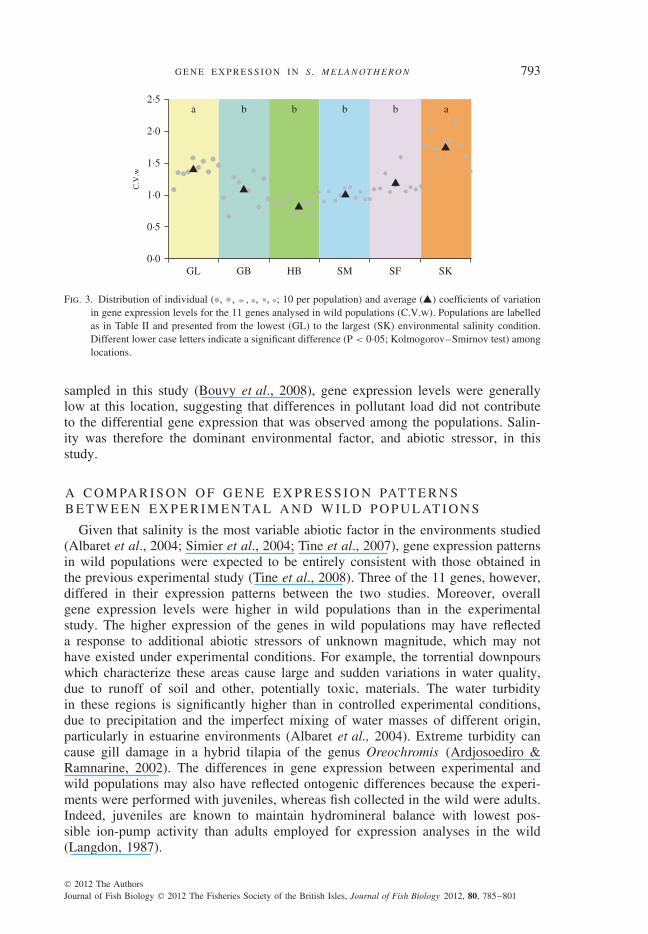
The evaluation of interindividual variation in gene expression among populationsinvestigated whether confidence interval ellipses reported on Fig. 2 were similar ordissimilar. Levels of interindividual variation averaged over the 11 investigated genes(C.V.w; within-population coefficient of variation based on observed interindivid-ual variation in gene expression within a population) are reported in Fig. 3. TheKolmogorov–Smirnov test indicated a significant difference at extreme salinities(GL and SK) compared to brackish and marine populations (P < 0·05). Comparisonamong brackish and marine populations (GB, HB, SM and SF), or of the GL andSK populations found no significant differences. The seawater HB population wascharacterized by the lowest interindividual variation in gene expression (Fig. 3).
© 2012 The AuthorsJournal of Fish Biology © 2012 The Fisheries Society of the British Isles, Journal of Fish Biology 2012, 80, 785–801
792 M . T I N E E T A L .
GL
GB
HBSM
SF
First component (51·70%)
Seco
nd c
ompo
nent
(33
·19%
)
SK
naka
nadh
gst
cam
fabpmapk
baep ca
cox1
hsp70
vdac
Fig. 2. Principal component analysis of 60 Sarotherodon melanotheron collected at six salinity contrastedlocations (Table II). The fraction of original variation explained by component is indicated on the axes.Data represent relative expression (10 individuals per population) normalized to β-actin. Centres ofgravity (i.e. the position of an average individual for each population) and 95% c.i. were also plotted.The correlation circle representing the correlation of each variable with the first and second axes of PCAis also given. Genes are labelled as in Table I.
DISCUSSION
Although the genes investigated in this study have previously been shown tochange expression in response to experimental exposure of S. melanotheron to salin-ity extremes (Tine et al., 2008), it is nonetheless conceivable that other environmentalstressors, such as temperature, hypoxia or contaminants, could have contributed tothe induction of them in the wild populations. Indeed, many of the genes analysedin this study are involved in biological processes that are not specifically linked tosalinity, such as energy metabolism. Water temperature, however, varied by <3◦ Camong locations, and previous studies found that dissolved oxygen was not a limitingfactor for S. melanotheron over the study area (Albaret et al., 2004; Simier et al.,2004; Tine et al., 2007). Furthermore, while the Hann Bay is the most polluted site
© 2012 The AuthorsJournal of Fish Biology © 2012 The Fisheries Society of the British Isles, Journal of Fish Biology 2012, 80, 785–801
G E N E E X P R E S S I O N I N S . M E L A N OT H E RO N 793
2·5a b b b b a
2·0
1·5
C.V
.w
1·0
0·5
0·0GL GB HB SM SF SK
Fig. 3. Distribution of individual ( , , , , , ; 10 per population) and average ( ) coefficients of variationin gene expression levels for the 11 genes analysed in wild populations (C.V.w). Populations are labelledas in Table II and presented from the lowest (GL) to the largest (SK) environmental salinity condition.Different lower case letters indicate a significant difference (P < 0·05; Kolmogorov–Smirnov test) amonglocations.
sampled in this study (Bouvy et al., 2008), gene expression levels were generallylow at this location, suggesting that differences in pollutant load did not contributeto the differential gene expression that was observed among the populations. Salin-ity was therefore the dominant environmental factor, and abiotic stressor, in thisstudy.
A C O M PA R I S O N O F G E N E E X P R E S S I O N PAT T E R N SB E T W E E N E X P E R I M E N TA L A N D W I L D P O P U L AT I O N S
Given that salinity is the most variable abiotic factor in the environments studied(Albaret et al., 2004; Simier et al., 2004; Tine et al., 2007), gene expression patternsin wild populations were expected to be entirely consistent with those obtained inthe previous experimental study (Tine et al., 2008). Three of the 11 genes, however,differed in their expression patterns between the two studies. Moreover, overallgene expression levels were higher in wild populations than in the experimentalstudy. The higher expression of the genes in wild populations may have reflecteda response to additional abiotic stressors of unknown magnitude, which may nothave existed under experimental conditions. For example, the torrential downpourswhich characterize these areas cause large and sudden variations in water quality,due to runoff of soil and other, potentially toxic, materials. The water turbidityin these regions is significantly higher than in controlled experimental conditions,due to precipitation and the imperfect mixing of water masses of different origin,particularly in estuarine environments (Albaret et al., 2004). Extreme turbidity cancause gill damage in a hybrid tilapia of the genus Oreochromis (Ardjosoediro &Ramnarine, 2002). The differences in gene expression between experimental andwild populations may also have reflected ontogenic differences because the experi-ments were performed with juveniles, whereas fish collected in the wild were adults.Indeed, juveniles are known to maintain hydromineral balance with lowest pos-sible ion-pump activity than adults employed for expression analyses in the wild(Langdon, 1987).
© 2012 The AuthorsJournal of Fish Biology © 2012 The Fisheries Society of the British Isles, Journal of Fish Biology 2012, 80, 785–801
794 M . T I N E E T A L .
I N T E R P R E TAT I O N O F T H E D I S T I N C T C O - E X P R E S S I O NO F S E T S O F G E N E S A M O N G NAT U R A L P O P U L AT I O N SO F S . M E L A N OT H E RO N
The two first PCA axes, which explained almost 85% of the variance in the data,revealed (1) groups of populations with dissimilar gene expression levels and (2) setsof genes that were differentially expressed along the salinity gradient. Ordination ofpopulations along the first PCA axis was highly correlated with the salinity gra-dient. Fish originating from locations with intermediate salinities (20–60) revealedlower expression levels for most genes. Accordingly, such populations were scat-tered together at the centre of the PCA factor map. By contrast, populations at thetwo extreme salinities (0 at GL and 100 at SK) with higher expression levels werediametrically opposed along the first PCA axis. Gene expression patterns matchedresults obtained in experimental conditions for seven of the 11 genes (ca, hsp70,cox1, gst, cam, mapk and baep; Tine et al., 2008). The reasons why these genesmight be co-expressed, and why they should be correlated with ambient salinity, canbe speculated from their biological roles (Tseng & Hwang, 2008). The ca and baepare involved in ion transport processes. ca is responsible for converting CO2 intoHCO −
3 and H+ ions, and it can be either cytosolic or membrane bound (Henry, 2001;Henry et al., 2003). It has been reported that the HCO −
3 generated by ca is theneliminated by a Cl− –HCO −
3 exchanger. ca also supplies H+ levels for excretionvia the V-H+-ATPase or via the Na+ –H+ exchanger (Scott et al., 2005). Therefore,ca would be implicated in both acid–base regulation and hydromineral homeostasis.baep is considered to play a major role in homeostatic regulation of cell volume,by promoting an efflux of potassium, chloride and amino acids in response to hypo-osmotic stress, essentially through the baep (Motais et al., 1997; Pierce & Warren,2001). The hsp70 and gst have a role in stress resistance and detoxification processes.Studies recently conducted in two species of sea bream [Acanthopagrus schlegeliischlegelii (Bleeker 1854) and Rhabdosargus sarba (Forsskal 1775); Deane et al.,2002; Deane & Woo, 2004, respectively] have shown substantial increases in hsp70mRNA levels in response to hyperosmotic stress, which was attributed to a role inavoiding protein disruption and damage. This function of hsp70 would explain itsoverexpression in fish living at the extremely hypersaline site (SK, 100). The highgst expression levels observed in the freshwater GL population may indicate a role inacclimation to hypo-osmotic stress. This is consistent with the decreased expressionof its mRNA levels after transfer of European eel Anguilla anguilla (L. 1758) fromfresh to seawater (Kalujnaia et al., 2007). mapk and cam are involved in amplifi-cation and integration of extracellular signals and may, therefore, be very importantfor adaptation to salinity. mapk activity increased in Fundulus heteroclitus (L. 1766)exposed to hypo-osmotic stress, by comparison to hyperosmotic stress (Kultz &Avila, 2001). Hypo-osmotic stress activates the calcium and calmodulin-dependentmembrane pathway, leading to a loss of cellular K+ in order to restore normal cellvolume (Edmonds & Koenig, 1990). Finally, as a component of the mitochondrialrespiratory transport chain, cox1 contributes to oxidative phosphorylation, whichprovides ATP for all metabolic activities (Kadenbach, 2003).
As the majority of these genes clearly revealed antagonistic gene expression pat-terns (higher expression levels in fresh water for gst, cam, mapk and baep v. highermRNA levels in hypersaline water for ca, hsp7 0 and cox1 ), they can be qualifiedas trade-off genes for the purpose of this study [Gracey et al. (2008) used the term
© 2012 The AuthorsJournal of Fish Biology © 2012 The Fisheries Society of the British Isles, Journal of Fish Biology 2012, 80, 785–801
G E N E E X P R E S S I O N I N S . M E L A N OT H E RO N 795
eigengene to report sets of genes presenting antagonistic gene expression patternswithin the data, owing to a multivariate procedure]. fabp was previously differen-tially expressed in laboratory experiments (fresh water v. hyperaline water) (Tineet al., 2008) but did not show such a response in the natural populations, withsignificantly higher expression levels in the freshwater GL population. This discrep-ancy might be because fabp is involved in the intracellular uptake, transport andmetabolism of long-chain fatty acids which, together with glucose, represent themain substrate for energy production (Stahl et al., 2001; Stahl, 2004). Therefore, thelow fabp expression in wild populations at higher salinities may reflect an extensiveuse of other substrates such as glucose, lactate and glutamate for energy production(Crockett et al., 1999). The ad libitum feeding during laboratory experiments (Tineet al., 2008) may have created fatter individuals, which were preferentially usinglipid stores. Such switches in substrate use are extensively documented (Jury et al.,2008; Kolditz et al., 2009).
Finally, the naka, vdac and nadhd expression levels were overall highest in thefish at the two most extreme salinities and did not differ between these two locations.This seems to contradict experimental results that reported higher expression levelsin hypertonic water than in fresh water (Table I). Although Tine et al. (2008) didnot measure the expression levels of these genes in control fish (i.e. in seawater),it might be expected that the latter would be lower in sea-water compared to eitherfresh water or hypersaline water (70). Indeed, individuals from marine populationsof S. melanotheron and those living in salinities close to sea-water are known to havegreater growth and fertility than their conspecifics from fresh water and hypersalinewater (Panfili et al., 2004a; Tine et al., 2007). This is probably due to the fact thatthe species has evolved mechanisms that are adapted to have minimal energeticrequirements for maintenance of hydromineral balance in sea-water. It has beenshown (at least for naka) that euryhaline teleosts living at lower and higher salinitieshave higher activity and expression compared to those living at salinities close toiso-osmotic conditions. Such U-shaped expression patterns (or U-shaped salinitydependence) have been proposed as a general characteristic of marine euryhalineor estuarine-dependent marine species living in water with sudden and frequentchanges in environmental salinity (Jensen et al., 1998). It was interpreted as a lowerrequirement for active homeostatic osmoregulation in fishes living at intermediatesalinities, because they are almost isotonic with respect to the ambient medium. nakais a membrane protein which maintains ion gradients required for cell homeostasis(Marshall & Bryson, 1998; Sakamoto et al., 2001; Varsamos et al., 2005). Therefore,its activity in the gills is related to either active ion secretion in hyper-osmoticconditions or active uptake in hypo-osmotic conditions. Similar results have beenreported in other euryhaline teleosts such as A. s. schlegelii (Kelly et al., 1999),R. sarba (Deane & Woo, 2004), Morone saxatilis (Walbaum 1792) (Tipsmark et al.,2004) and Sparus aurata L. 1758 (Laiz-Carrion et al., 2005), where the activityand expression of naka were lower at intermediate salinities (15–25). These resultsseem to contradict those reported by Hwang & Lee (2007), Lin & Lee (2005) andLin et al. (2004) in Mozambique tilapia Oreochromis mossambicus (peters 1852),where there were higher naka expression levels in sea-water than in fresh water, butsalinities approaching iso-osmotic conditions were not tested, so a potential U-shapedexpression pattern could not be revealed.
© 2012 The AuthorsJournal of Fish Biology © 2012 The Fisheries Society of the British Isles, Journal of Fish Biology 2012, 80, 785–801
796 M . T I N E E T A L .
The vdac located on the outer mitochondrial membrane represents the com-mon pathway for ATP–ADP exchanges between mitochondria and ATP consump-tion sites, including ion pumps (Colombini, 2004). It is expected that ATP–ADPexchanges increase when ion gradients must be actively maintained. Finally, nadhdencodes for proteins essential to the mitochondrial respiratory chain and henceoxidative phosphorylation that provides ATP for all metabolic activities (Kaden-bach, 2003). Thus, higher expression levels of vdac and nadhd in the gills mightreflect an increased production of ATP, to meet the increased energetic demandsfor osmotic homeostasis, in particular, the increased expression and activity of thenaka. Note that expression of nadhd did not significantly correlate with salinity, con-trary to vdac and naka. This increased energetic demands for osmoregulation wouldleave less energy to achieve other biological functions in fresh and hypersaline habi-tats. This may explain why S. melanotheron inhabiting environments with extremesalinities exhibit reduced growth rates, size at sexual maturity and lower fecundities(Panfili et al., 2004a; Tine et al., 2007). Compared to previously mentioned trade-offgenes, vdac and naka, and nadhd to a lesser extent, are best qualified as being stressgenes, with changes in expression that reflect extreme environments.
I N T E R I N D I V I D UA L VA R I AT I O N I N G E N E E X P R E S S I O NW I T H I N P O P U L AT I O N
Interindividual variation in gene expression is rarely reported in fishes as its magni-tude among individuals within a population is often very low (Crawford & Oleksiak,2007). Its potential biological significance has been demonstrated (Crawford &Oleksiak, 2007), but it is still often considered as background noise and the result ofinconsistency in mRNA harvest (Hodgins-Davis & Townsend, 2009). Accordingly,numerous studies on variation in gene expression have focused on changes occur-ring among populations following reciprocal transplantation experiments (Oleksiak,2010; Larsen et al., 2011).
In this study, reciprocal transplant experiments were not feasible. Nevertheless,the results demonstrated that interindividual variation in gene expression was depen-dent upon the population hence on salinity conditions experienced by the individuals.Individual variation within populations cannot be attributed to differences in size orsexual stage, because only LF classes between 120 and 160 mm with sexual stages1 or 2 (i.e. immature individuals) were analysed. As individuals were collected atthe same time and samples treated identically, sampling artefacts are unlikely. Thissuggests the existence of a large salinity range (i.e. 20 to 60) where gene expressiontogether with physiological and metabolic processes are buffered. By contrast, theextreme salinities observed in this study reflect situations where buffering mecha-nisms are expected to be breaking down.
Nevertheless, interindividual variation may represent a first step in an adaptivewalk, allowing a lineage to explore and cross an adaptive threshold and move closerto the optimum phenotype, here a new pattern of co-regulated gene expression, ina new environment (Price et al., 2003; Ghalambor et al., 2007). Such variation isexpected when individuals from a given population experience rapid change in theirenvironment that may induce fitness costs and turn a source population into a sink(Kimbrell & Holt, 2007; Lande, 2009). Indeed, the populations of S. melanotheronexhibiting the greatest interindividual variation in gene expression were exposed to
© 2012 The AuthorsJournal of Fish Biology © 2012 The Fisheries Society of the British Isles, Journal of Fish Biology 2012, 80, 785–801
G E N E E X P R E S S I O N I N S . M E L A N OT H E RO N 797
recent salinity changes. Hypersaline conditions (>70) have become established sincethe early 1980s in the upper reaches of the River Saloum, where SK is located (Pages& Citeau, 1990). Conversely, yearlong freshwater conditions are recent for the GLpopulation, as GL seasonally became brackish before the Diama Dam was built in1985 (Gac et al., 1986). It may be hypothesized that S. melanotheron populations atsalinity extremes are experiencing niche shifts and the first part of an adaptive pro-cess to new environmental optima. Niche shifts due to environmental extremes havebeen reported in fishes but are more traditionally described when population diver-gence has already occurred [e.g. the Magadi tilapia Alcolapia grahami (Boulenger1912); Portner et al., 2010]. Rapid adaptive changes occurring over a few generationshave, however, been recorded for gene expression variation in fishes, both in cap-tive (Roberge et al., 2006) and natural populations experiencing recent habitat shifts(landlocked salmonids; Aykanat et al., 2011). Further investigations on the withinand among-population components of genetic architecture are hence still necessaryin S. melanotheron.
This study demonstrated that expression of 11 genes differed significantly amongsix natural populations of S. melanotheron acclimatized to salinities ranging from0 to 100. Given that these genes had previously been shown to be differentiallyexpressed in this species when exposed to salinity extremes in the laboratory, it isconcluded that their expression in the wild populations is causally related to salinityat the various sites. According to their expression patterns, two categories of geneswere distinguished: (1) trade-off genes (cam, gst, baep, mapk, hsp70, cox1 and ca)which were up-regulated either in fresh water or hypertonic water and (2) stressgenes (naka, vdac and nadhd ) with U-shaped expression levels, rising at both salin-ity extremes. As such, stress genes are involved in energetic and osmoregulatoryprocesses, their high expression levels may carry physiological costs, thereby explain-ing life-history and fitness impairments previously observed in the wild populations.This suggest that they may be biomarkers of salinity stress in fishes. The relativelyhigher mRNA levels in wild populations compared to experimental fish, however,indicates that their expression might also be influenced by abiotic factors other thansalinity. Therefore, caution should be applied when using them as biomarkers in envi-ronments where salinity is not the only variable that differs among locations. Thestudy also demonstrated higher interindividual plasticity in gene expression at salin-ity extremes by comparison with salinities approaching sea-water. These results mayillustrate a rupture of homeostasis in extreme salinity environments. Such a possibil-ity, together with better understanding of genotype–environment interactions, shouldbe investigated further, with reciprocal transplant or common garden experiments.
The authors are grateful to F. Bonhomme for comments, to the Plateau IFR 122 for RT-PCRand to J.-F. Agnese and M. Legendre for their experience with S. melanotheron. They are alsograteful to D. McKenzie for English language editing. The authors also thank two anonymousreferees for their constructive criticism of the previous version of this article.
References
Albaret, J.-J., Simier, M., Darboe, F. S., Ecoutin, J.-M., Rafray, J. & de Morais, L. T.(2004). Fish diversity and distribution in the Gambia Estuary, West Africa, in relationto environmental variables. Aquatic Living Resourses 17, 35–46.
© 2012 The AuthorsJournal of Fish Biology © 2012 The Fisheries Society of the British Isles, Journal of Fish Biology 2012, 80, 785–801
798 M . T I N E E T A L .
Ardjosoediro, I. & Ramnarine, I. W. (2002). The influence of the turbidity on growth, feedconversion and survivorship of the Jamaica red tilapia strain. Aquaculture 212,159–165.
Aykanat, T., Thrower, F. P. & Heath, D. D. (2011). Rapid evolution of osmoregulatory func-tion by modification of gene transcription in steelhead trout. Genetica 139, 233–242.
Bouvy, M., Briand, E., Boup, M. M., Got, P., Leboulanger, C., Bettarel, Y. & Arfi, R. (2008).Effects of sewage discharges on microbial components in tropical coastal waters (Sene-gal, West Africa). Marine and Freshwater Research 59, 614–626.
Cogels, F.-X., Thiam, A. & Gac, J.-Y. (1993). Premiers effets des barrages sur le fleuveSenegal sur le lac de Guiers. Revue d’Hydrobiologie Tropicale 26, 105–117.
Colombini, M. (2004). VDAC: the channel at the interface between mitochondria and thecytosol. Molecular and Cellular Biochemistry 256/257, 107–115.
Cossins, A. R. & Crawford, D. L. (2005). Opinion – fish as models for environmentalgenomics. Nature Reviews Genetics 6, 324–333.
Cossins, A., Fraser, J., Hughes, M. & Gracey, A. (2006). Post-genomic approaches to under-standing the mechanisms of environmentally induced phenotypic plasticity. Journal ofExperimental Biology 209, 2328–2336.
Crawford, D. L. & Oleksiak, M. F. (2007). The biological importance of measuring individualvariation. Journal of Experimental Biology 210, 1613–1621.
Crockett, E. L., Londraville, R. L., Wilkes, E. E. & Popesco, M. C. (1999). Enzymatic capac-ities for b-oxidation of fatty fuels are low in the gill of teleost fishes despite presenceof fatty acid-binding protein. Journal of Experimental Zoology 284, 276–285.
Dalziel, A. C., Rogers, S. M. & Schulte, P. M. (2009). Linking genotypes to phenotypes andfitness: how mechanistic biology can inform molecular ecology. Molecular Ecology18, 4997–5017.
Deane, E. E. & Woo, N. Y. S. (2004). Differential gene expression associated with euryhalin-ity in sea bream (Sparus sarba). American Journal of Physiology 287, R1054–R1063.
Deane, E. E., Kelly, S. P., Luk, J. C. Y. & Woo, N. Y. S. (2002). Chronic salinity adaptationmodulates hepatic heat shock protein and insulin-like growth factor I expression inblack sea bream. Marine Biotechnology 4, 193–205.
Diatchenko, L., Lau, Y.-F. C., Campbell, A. P., Chenchik, A., Moqadam, F., Huang, B.,Lukyanov, S., Lukyanov, K., Gurskaya, N., Sverdlov, E. D. & Siebert, P. D. (1996).Suppression subtractive hybridization: a method for generating differentially regulatedor tissue-specific cDNA probes and libraries. Proceedings of the National Academy ofSciences of the United States of America 93, 6025–6030.
Diouf, K., Guilhaumon, F., Aliaume, C., Ndiaye, P., Do Chi, T. & Panfili, J. (2009). Effectsof the environment on fish juvenile growth in West African stressful estuaries. EstuarineCoastal and Shelf Sciences 83, 115–125.
Douglas, S. E. (2006). Microarray studies of gene expression in fish. OMICS 10, 474–489.Edmonds, B. T. & Koenig, E. (1990). Volume regulation in response to hypo-osmotic stress in
goldfish retinal ganglion cell axons regenerating in vitro. Brain Research 520, 159–165.Gac, J.-Y., Carn, M. & Saos, J.-L. (1986). Les invasions marines dans la basse vallee du
Senegal. Revue d’Hydrobiologie Tropicale 19, 3–17.Ghalambor, C. K., McKay, J. K., Carroll, S. P. & Reznick, D. N. (2007). Adaptive versus
non-adaptive phenotypic plasticity and the potential for contemporary adaptation innew environments. Functional Ecology 21, 394–407.
Gibson, G. (2008). The environmental contribution to gene expression profiles. Nature ReviewsGenetics 9, 575–581.
Goetz, F. W. & MacKenzie, S. (2008). Functional genomics with microarrays in fish biologyand fisheries. Fish and Fisheries 9, 378–395.
Gracey, A. Y., Chaney, M. L., Boomhower, J. P., Tyburczy, W. R., Connor K. & Somero,G. N. (2008). Rhythms of gene expression in a fluctuating intertidal environment.Current Biology 18, 1501–1507.
Henry, R. P. (2001). Environmentally mediated carbonic anhydrase induction in the gills ofeuryhaline crustaceans. Journal Experimental Biology 204, 991–1002.
Henry, R. P., Gehnrich, S., Weihrauch, D. & Towle, D. W. (2003). Salinity-mediated car-bonic anhydrase induction in the gills of the euryhaline green crab, Carcinus maenas.Comparative Biochemistry and Physiology C 136, 243–258.
© 2012 The AuthorsJournal of Fish Biology © 2012 The Fisheries Society of the British Isles, Journal of Fish Biology 2012, 80, 785–801
G E N E E X P R E S S I O N I N S . M E L A N OT H E RO N 799
Hodgins-Davis, A. & Townsend, J. P. (2009). Evolving gene expression: from G to E to Gx E. Trends in Ecology and Evolution 24, 649–658.
Hofmann, G. E. & Todgham, A. E. (2010). Living in the now: physiological mechanisms totolerate a rapidly changing environment. Annual Review of Physiology 72, 127–145.
Hwang, P. P. & Lee, T. H. (2007). New insights into fish ion regulation and mitochondrion-rich cells. Comparative Biochemistry and Physiology A 148, 479–497.
Jensen, M. K., Madsen, S. S. & Kristiansen, K. (1998). Osmoregulation and salinity effectson the expression and activity of Na+, K(+)-ATPase in the gills of European sea bass,Dicentrarchus labrax (L.). Journal of Experimental Zoology 282, 290–300.
Jury, D. R., Kaveti, S., Duan, Z. H., Willard, B., Kinter, M. & Londraville, R. (2008). Effectsof calorie restriction on the zebrafish liver proteome. Comparative Biochemistry andPhysiology D 3, 275–282.
Kadenbach, B. (2003). Intrinsic and extrinsic uncoupling of oxidative phosphorylation.Biochimica and Biophysica Acta: Bioenergetics 1604, 77–94.
Kalujnaia, S., McWilliam, I. S., Zaguinaiko, V. A., Feilen, A. L., Nicholson, J., Hazon, N.,Cutler, C. P., Balment, R. J., Cossins, A. R., Hughes, M. et al. (2007). Salinity adapta-tion and gene profiling analysis in the European eel (Anguilla anguilla) using microar-ray technology. General and Comparative Endocrinology 152, 274–280.
Kassahn, K. S. (2008). Microarrays for comparative and ecological genomics: beyond single-species applications of array technologies. Journal of Fish Biology 72, 2407–2434.
Kelly, S. P., Chow, I. N. K. & Woo, N. Y. S. (1999). Haloplasticity of black seabream (Myliomacrocephalus): hypersaline to freshwater acclimation. Journal of Experimental Biol-ogy 283, 226–241.
Kimbrell, T. & Holt, R. D. (2007). Canalization breakdown and evolution in a source-sinksystem. The American Naturalist 169, 370–382.
Kolditz, C. I., Pabœuf, G., Borthaire, M., Esquerre, D., SanCristobal, M., Lefevre, F. &Medale, F. (2009). Changes induced by dietary energy intake and divergent selection formuscle fat content in rainbow trout (Oncorhynchus mykiss), assessed by transcriptomeand proteome analysis of the liver. BMC Genomics 9, 506.
Kultz, D. & Avila, K. (2001). Mitogen-activated protein kinases are in vivo transducers ofosmosensory signals in fish gill cells. Comparative Biochemistry and Physiology B129, 821–829.
Labonne, M., Morize, E., Scolan, P., Lae, R., Dabas, E. & Bohn, M. (2009). Impact of salin-ity on early life history traits of three estuarine fish species in Senegal. EstuarineCoastal and Shelf Sciences 82, 673–681.
Laiz-Carrion, R., Guerreiro, P. M., Fuentes, J., Canario, A. V. M., Del Rio, M. P. M. &Mancera, J. M. (2005). Branchial osmoregulatory response to salinity in the giltheadsea bream, Sparus auratus. Journal of Experimental Zoology 303A, 563–576.
Lande, R. (2009). Adaptation to an extraordinary environment by evolution of phenotypicplasticity and genetic assimilation. Journal of Evolutionary Biology 22, 1435–1446.
Langdon, J. S. (1987). Active osmoregulation in the Australian bass, Macquaria novemac-uleata (Steindachner), and the golden perch, Macquaria ambigua (Richardson) (Per-cichthyidae). Journal of Marine and Freshwater Research 38, 771–776.
Larsen, P. F., Schulte, P. M. & Nielsen, E. E. (2011). Gene expression analysis for the iden-tification of selection and local adaptation in fishes. Journal of Fish Biology 78, 1–22.
Legendre, M. & Ecoutin, J. M. (1989). Suitability of brackish water tilapia species fromthe Ivory Coast for lagoon aquaculture. 1 - reproduction. Aquatic Living Resourse 2,71–79.
Lin, C. H. & Lee, T. H. (2005). Sodium or potassium ions activate different kinetics of gillNa, K-ATPase in three seawater- and freshwater-acclimated euryhaline teleosts. Journalof Experimental Zoology A 303, 57–65.
Lin, C. H., Huang, C. L., Yang, C. H., Lee, T. H. & Hwang, P. P. (2004). Time-coursechanges in the expression of Na, K-ATPase and the morphometry of mitochondrion-rich cells in gills of euryhaline tilapia (Oreochromis mossambicus) during freshwateracclimation. Journal of Experimental Zoology A 301, 85–96.
Lopez-Maury, L., Marguerat, S. & Bahler, J. (2008). Tuning gene expression to changing envi-ronments: from rapid responses to evolutionary adaptation. Nature Reviews Genetics9, 583–593.
© 2012 The AuthorsJournal of Fish Biology © 2012 The Fisheries Society of the British Isles, Journal of Fish Biology 2012, 80, 785–801
800 M . T I N E E T A L .
Marshall, W. S. & Bryson, S. E. (1998). Transport mechanisms of seawater teleost chloridecells: an inclusive model of a multifunctional cell. Comparative Biochemistry andPhysiology A 119, 97–106.
Miller, K. M. & Maclean, N. (2008). Teleost microarrays: development in a broad phyloge-netic range reflecting diverse applications. Journal of Fish Biology 72, 2039–2050.
Motais, R., Fievet, B., Borgese, F. & Garcia-Romeu, F. (1997). Association of the band 3protein with a volume-activated, anion and amino acid channel: a molecular approach.Journal of Experimental Biology 200, 361–367.
Oleksiak, M. F. (2010). Genomic approaches with natural fish populations. Journal of FishBiology 76, 1067–1093.
Pages, J. & Citeau, J. (1990). Rainfall and salinity of a sahelian estuary between 1927 and1987. Journal of Hydrology 113, 325–341.
Panfili, J., Mbow, A., Durand, J.-D., Diop, K., Diouf, K., Thior, D., Ndiaye, P. & Lae, R.(2004a). Influence of salinity on the life-history traits of the West African black-chinned tilapia (Sarotherodon melanotheron): comparison between the Gambia andSaloum estuaries. Aquatic Living Resources 17, 65–74.
Panfili, J., Durand, J.-D., Mbow, A., Guinand, B., Diop, K., Kantoussan, J., Thior, D., Thiaw,O. T., Albaret, J.-J. & Lae, R. (2004b). Influence of salinity on life history traits of thebonga shad Ethmalosa fimbriata (Pisces, Clupeidae): comparison between the Gambiaand Saloum estuaries. Marine Ecology Progress Series 270, 241–257.
Panfili, J., Thior, D., Ecoutin, J.-M., Ndiaye, P. & Albaret, J.-J. (2006). Influence of salinityon the size at maturity for fish species reproducing in contrasting West African estuaries.Journal of Fish Biology 69, 95–113.
Pfaffl, M. W. (2001). A new mathematical model for relative quantification in real-time RT-PCR. Nucleic Acids Research 29, 2002–2007.
Pierce, S. K. & Warren, J. W. (2001). The taurine efflux portal used to regulate cell volumein response to hypoosmotic stress seems to be similar in many cell types: lessons tobe learned from molluscan red blood cells. American Zoologist 41, 710–720.
Portner, H. O., Schulte, P. M., Wood, C. M. & Schiemer, F. (2010). Niche dimensions infishes: an integrative view. Physiologial and Biochemical Zoology 83, 808–826.
Pouyaud, L., Desmarais, E., Chenuil, A., Agnese, J.-F. & Bonhomme, F. (1999). Kin cohe-siveness and possible inbreeding in the mouth brooding tilapia Sarotherodon melan-otheron (Pisces Cichlidae). Molecular Ecology 8, 803–812.
Price, T. D., Qvarnstrom, A. & Irwin, D. E. (2003). The role of phenotypic plasticity indriving genetic evolution. Proceeding of the Royal Society B 270, 1433–1440.
Roberge, C., Einum, S., Guderley, H. & Bernatchez, L. (2006). Rapid parallel evolutionarychanges of gene transcription profiles in farmed Atlantic salmon. Molecular Ecology15, 9–20.
Sakamoto, T., Uchida, K. & Yokota, S. (2001). Regulation of the ion-transporting mito-chondrion-rich cell during adaptation of teleost fishes to different salinities. ZoologicalSciences 18, 1163–1174.
Scott, C. P., Williams, D. A. & Crawford, D. L. (2009). The effect of genetic and environ-mental variation on metabolic gene expression. Molecular Ecology 18, 2832–2843.
Scott, G. R., Claiborne, J. B., Edwards, S. L., Schulte, P. M. & Wood, C. M. (2005). Geneexpression after freshwater transfer in gills and opercular epithelia of killifish: insightinto divergent mechanisms of ion transport. Journal of Experimental Biology 208,2719–2729.
Shiu, S. H. & Borevitz, J. O. (2008). The next generation of microarray research: applicationsin evolutionary and ecological genomics. Heredity 100, 141–149.
Simier, M., Blanc, L., Aliaume, C., Diouf, P. S. & Albaret, J.-J. (2004). Spatial and temporalstructure of fish assemblages in an “inverse estuary”, the Sine Saloum system (Senegal).Estuarine Coastal and Shelf Sciences 59, 69–86.
Simier, M., Laurent, C., Ecoutin, J.-M. & Albaret, J.-J. (2006). The Gambia River estuary: areference point for estuarine fish assemblages studies in West Africa. Estuarine Coastaland Shelf Sciences 69, 615–628.
Stahl, A. (2004). A current review of fatty acid transport proteins (SLC27 ). Pflugers Archivs447, 722–727.
© 2012 The AuthorsJournal of Fish Biology © 2012 The Fisheries Society of the British Isles, Journal of Fish Biology 2012, 80, 785–801
G E N E E X P R E S S I O N I N S . M E L A N OT H E RO N 801
Stahl, A., Gimeno, R. E., Tartaglia, L. A. & Lodish, H. F. (2001). Fatty acid transport pro-teins: a current view of a growing family. Trends in Endocrinology and Metabolism12, 266–273.
Thunken, T., Bakler, T. C. M., Baldauf, S. A. & Kullmann, H. (2007). Active inbreeding ina cichlid fish and its adaptative significance. Current Biology 17, 225–229.
Tine, M., de Lorgeril, J., Diop, K., Bonhomme, F., Panfili, J. & Durand, J.-D. (2007).Growth hormone and Prolactin-1 gene transcription in natural populations of theblack-chinned tilapia Sarotherodon melanotheron acclimatised to different salinities.Comparative Biochemistry and Physiology B 147, 541–549.
Tine, M., de Lorgeril, J., D’Cotta, H., Pepey, E., Bonhomme, F., Baroiller, J.-F. & Durand, J.-D. (2008). Transcriptional responses of the black-chinned tilapia Sarotherodon melan-otheron to salinity extremes. Marine Genomics 1, 37–46.
Tine, M., Bonhomme, F., McKenzie, D. J. & Durand, J.-D. (2010). Differential expression ofthe heat shock protein Hsp70 in natural populations of the tilapia, Sarotherodon melan-otheron, acclimatised to a range of environmental salinities. BMC Ecology10, 11.
Tipsmark, C. K., Madsen, S. S. & Borski, R. J. (2004). Effect of salinity on expression ofbranchial ion transporters in striped bass (Morone saxatilis). Journal of ExperimentalZoology 301A, 979–991.
Tseng, Y. C. & Hwang P.-P. (2008). Some insights into energy metabolism for osmoregula-tion in fish. Comparative Biochemistry and Physiology C 148, 419–429.
Varsamos, S., Nebel, C. & Charmantier, G. (2005). Ontogeny of osmoregulation in postem-bryonic fish: a review. Comparative Biochemistry and Physiology A 141, 401–429.
West-Eberhard, M. J. (2003). Developmental Plasticity and Evolution. Oxford: Oxford Uni-versity Press.
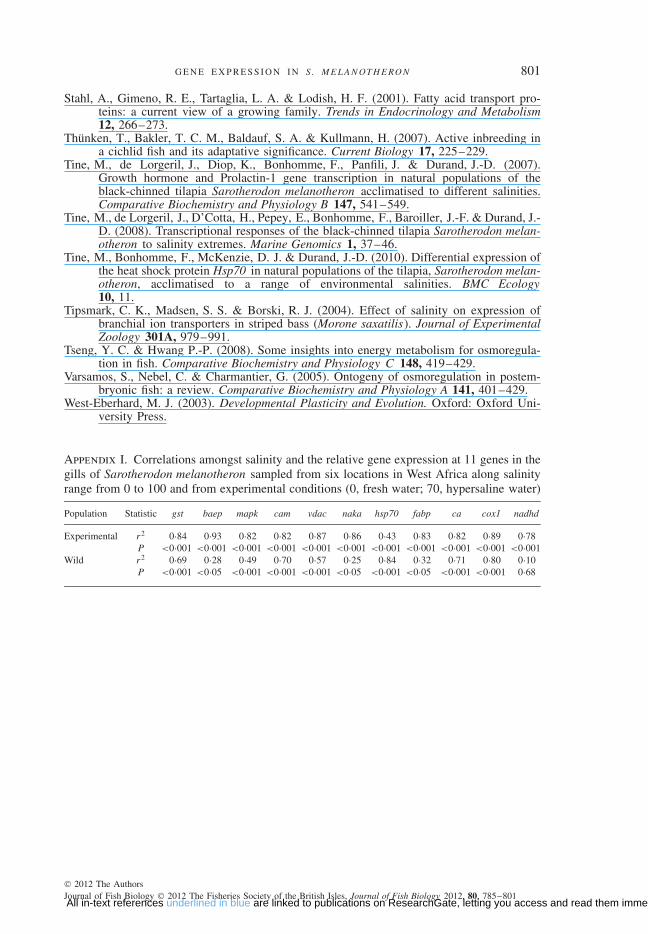
Appendix I. Correlations amongst salinity and the relative gene expression at 11 genes in thegills of Sarotherodon melanotheron sampled from six locations in West Africa along salinityrange from 0 to 100 and from experimental conditions (0, fresh water; 70, hypersaline water)
Population Statistic gst baep mapk cam vdac naka hsp70 fabp ca cox1 nadhd
Experimental r2 0·84 0·93 0·82 0·82 0·87 0·86 0·43 0·83 0·82 0·89 0·78P <0·001 <0·001 <0·001 <0·001 <0·001 <0·001 <0·001 <0·001 <0·001 <0·001 <0·001
Wild r2 0·69 0·28 0·49 0·70 0·57 0·25 0·84 0·32 0·71 0·80 0·10P <0·001 <0·05 <0·001 <0·001 <0·001 <0·05 <0·001 <0·05 <0·001 <0·001 0·68
© 2012 The AuthorsJournal of Fish Biology © 2012 The Fisheries Society of the British Isles, Journal of Fish Biology 2012, 80, 785–801All in-text references underlined in blue are linked to publications on ResearchGate, letting you access and read them immediately.
Related Documents