BMC Public Health BMC Public Health This Provisional PDF corresponds to the article as it appeared upon acceptance. Fully formatted PDF and full text (HTML) versions will be made available soon. Variation and risk factors of drug resistant tuberculosis in sub-Saharan Africa: a systematic review and meta-analysis BMC Public Health Sample doi:10.1186/s12889-015-1614-8 Deus Lukoye ([email protected]) Willy Ssengooba ([email protected]) Kenneth Musisi ([email protected]) George W Kasule ([email protected]) Frank G J Cobelens ([email protected]) Moses Joloba ([email protected]) Gabriela B Gomez ([email protected]) Sample ISSN 1471-2458 Article type Research article Submission date 3 November 2014 Acceptance date 4 March 2015 Article URL http://dx.doi.org/10.1186/s12889-015-1614-8 For information about publishing your research in BioMed Central journals, go to http://www.biomedcentral.com/info/authors/ © 2015 Lukoye et al.; licensee BioMed Central. This is an Open Access article distributed under the terms of the Creative Commons Attribution License ( http://creativecommons.org/licenses/by/4.0 ), which permits unrestricted use, distribution, and reproduction in any medium, provided the original work is properly credited. The Creative Commons Public Domain Dedication waiver ( http://creativecommons.org/publicdomain/zero/1.0/ ) applies to the data made available in this article, unless otherwise stated. (2015) 15:291

Welcome message from author
This document is posted to help you gain knowledge. Please leave a comment to let me know what you think about it! Share it to your friends and learn new things together.
Transcript
BMC Public HealthBMC Public Health
This Provisional PDF corresponds to the article as it appeared upon acceptance. Fully formattedPDF and full text (HTML) versions will be made available soon.
Variation and risk factors of drug resistant tuberculosis in sub-Saharan Africa: asystematic review and meta-analysis
BMC Public Health Sample
doi:10.1186/s12889-015-1614-8
Deus Lukoye ([email protected])Willy Ssengooba ([email protected])
Kenneth Musisi ([email protected])George W Kasule ([email protected])
Frank G J Cobelens ([email protected])Moses Joloba ([email protected])
Gabriela B Gomez ([email protected])
Sample
ISSN 1471-2458
Article type Research article
Submission date 3 November 2014
Acceptance date 4 March 2015
Article URL http://dx.doi.org/10.1186/s12889-015-1614-8
For information about publishing your research in BioMed Central journals, go tohttp://www.biomedcentral.com/info/authors/
© 2015 Lukoye et al.; licensee BioMed Central.This is an Open Access article distributed under the terms of the Creative Commons Attribution License (http://creativecommons.org/licenses/by/4.0), whichpermits unrestricted use, distribution, and reproduction in any medium, provided the original work is properly credited. The Creative Commons Public Domain
Dedication waiver (http://creativecommons.org/publicdomain/zero/1.0/) applies to the data made available in this article, unless otherwise stated.
(2015) 15:291

Variation and risk factors of drug resistant tuberculosis in sub-Saharan Africa: a systematic review and meta-analysis
Deus Lukoye1,2 Email: [email protected]
Willy Ssengooba3,4 Email: [email protected]
Kenneth Musisi6 Email: [email protected]
George W Kasule1,6 Email: [email protected]
Frank G J Cobelens4,5 Email: [email protected]
Moses Joloba1,3,6 Email: [email protected]
Gabriela B Gomez4,7,* * Corresponding author Email: [email protected]
1 National Tuberculosis and Leprosy Program, Kampala, Uganda
2 Management Sciences for Health (MSH), Kampala, Uganda
3 Department of Medical Microbiology, Makerere University College of Health Sciences Kampala, Kampala, Uganda
4 Academic Medical Center, Department of Global Health and Amsterdam Institute for Global Heath and Development, Pietersbergweg 17, 1105 BM Amsterdam, The Netherlands
5 KNCV Tuberculosis Foundation, The Hague, Hague, The Netherlands
6 National TB Reference Laboratory, Kampala, Uganda
7 London School of Hygiene and Tropical Medicine, Department of Global Health and Development, London, UK
Abstract
Background
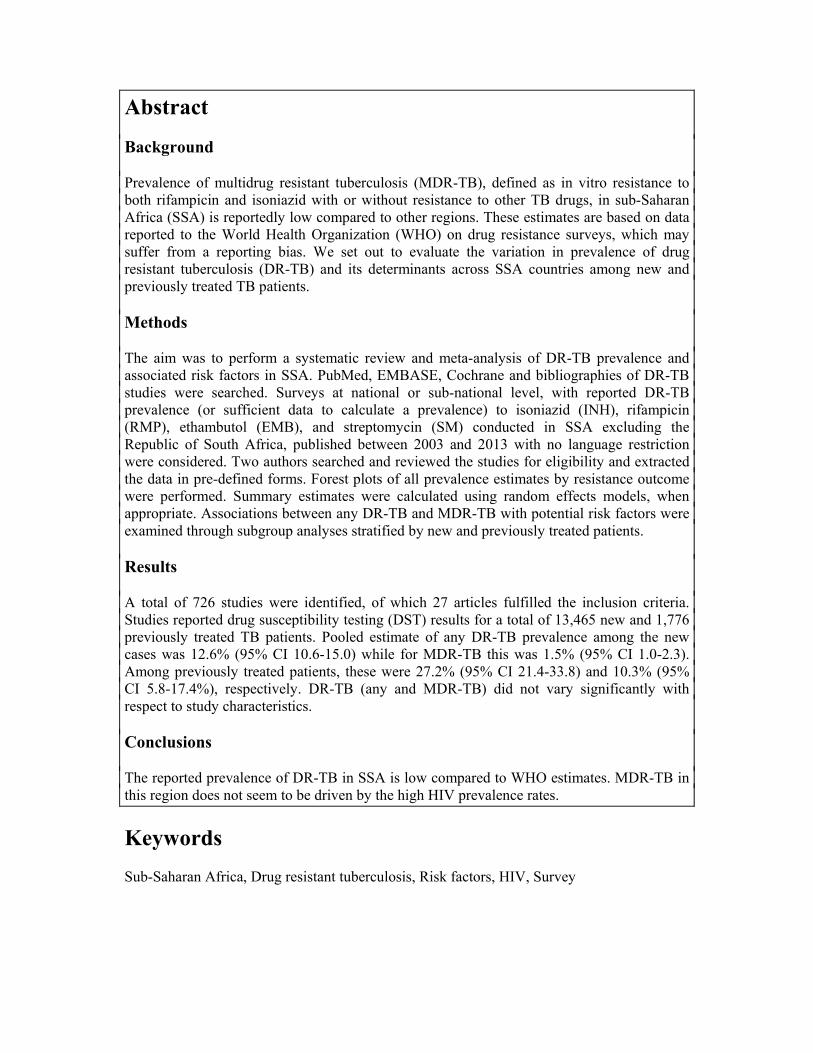
Prevalence of multidrug resistant tuberculosis (MDR-TB), defined as in vitro resistance to both rifampicin and isoniazid with or without resistance to other TB drugs, in sub-Saharan Africa (SSA) is reportedly low compared to other regions. These estimates are based on data reported to the World Health Organization (WHO) on drug resistance surveys, which may suffer from a reporting bias. We set out to evaluate the variation in prevalence of drug resistant tuberculosis (DR-TB) and its determinants across SSA countries among new and previously treated TB patients.
Methods
The aim was to perform a systematic review and meta-analysis of DR-TB prevalence and associated risk factors in SSA. PubMed, EMBASE, Cochrane and bibliographies of DR-TB studies were searched. Surveys at national or sub-national level, with reported DR-TB prevalence (or sufficient data to calculate a prevalence) to isoniazid (INH), rifampicin (RMP), ethambutol (EMB), and streptomycin (SM) conducted in SSA excluding the Republic of South Africa, published between 2003 and 2013 with no language restriction were considered. Two authors searched and reviewed the studies for eligibility and extracted the data in pre-defined forms. Forest plots of all prevalence estimates by resistance outcome were performed. Summary estimates were calculated using random effects models, when appropriate. Associations between any DR-TB and MDR-TB with potential risk factors were examined through subgroup analyses stratified by new and previously treated patients.
Results
A total of 726 studies were identified, of which 27 articles fulfilled the inclusion criteria. Studies reported drug susceptibility testing (DST) results for a total of 13,465 new and 1,776 previously treated TB patients. Pooled estimate of any DR-TB prevalence among the new cases was 12.6% (95% CI 10.6-15.0) while for MDR-TB this was 1.5% (95% CI 1.0-2.3). Among previously treated patients, these were 27.2% (95% CI 21.4-33.8) and 10.3% (95% CI 5.8-17.4%), respectively. DR-TB (any and MDR-TB) did not vary significantly with respect to study characteristics.
Conclusions
The reported prevalence of DR-TB in SSA is low compared to WHO estimates. MDR-TB in this region does not seem to be driven by the high HIV prevalence rates.
Keywords Sub-Saharan Africa, Drug resistant tuberculosis, Risk factors, HIV, Survey
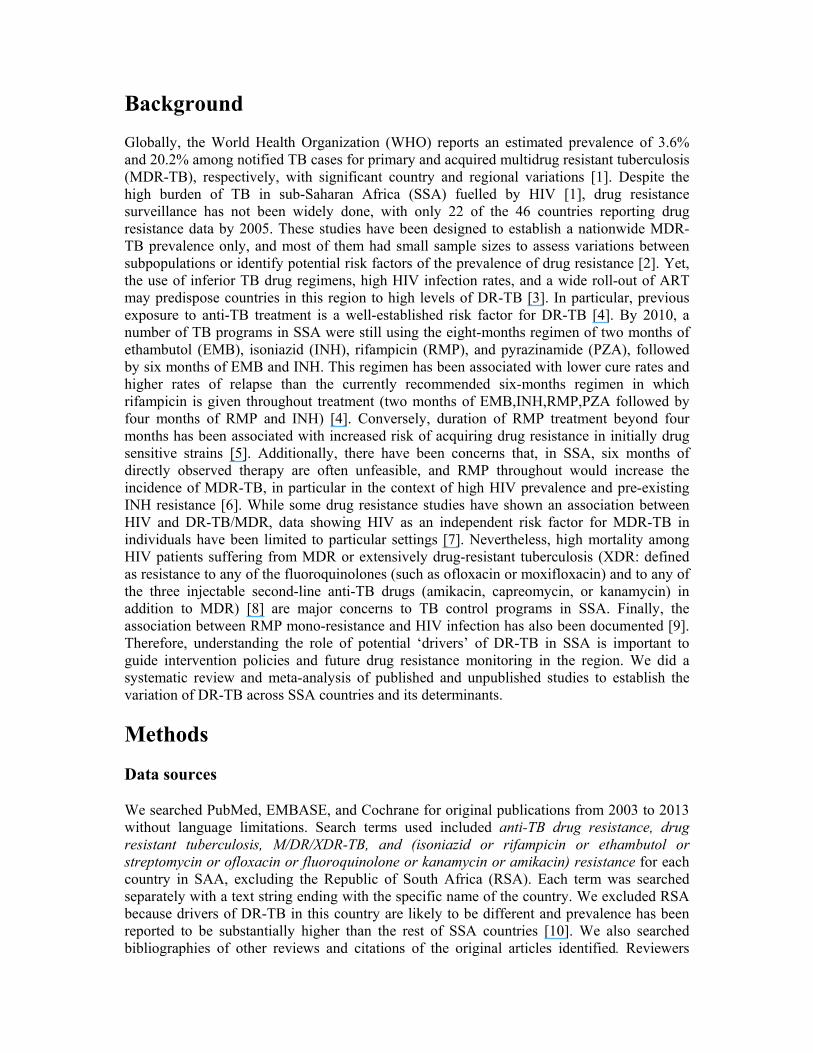
Background Globally, the World Health Organization (WHO) reports an estimated prevalence of 3.6% and 20.2% among notified TB cases for primary and acquired multidrug resistant tuberculosis (MDR-TB), respectively, with significant country and regional variations [1]. Despite the high burden of TB in sub-Saharan Africa (SSA) fuelled by HIV [1], drug resistance surveillance has not been widely done, with only 22 of the 46 countries reporting drug resistance data by 2005. These studies have been designed to establish a nationwide MDR-TB prevalence only, and most of them had small sample sizes to assess variations between subpopulations or identify potential risk factors of the prevalence of drug resistance [2]. Yet, the use of inferior TB drug regimens, high HIV infection rates, and a wide roll-out of ART may predispose countries in this region to high levels of DR-TB [3]. In particular, previous exposure to anti-TB treatment is a well-established risk factor for DR-TB [4]. By 2010, a number of TB programs in SSA were still using the eight-months regimen of two months of ethambutol (EMB), isoniazid (INH), rifampicin (RMP), and pyrazinamide (PZA), followed by six months of EMB and INH. This regimen has been associated with lower cure rates and higher rates of relapse than the currently recommended six-months regimen in which rifampicin is given throughout treatment (two months of EMB,INH,RMP,PZA followed by four months of RMP and INH) [4]. Conversely, duration of RMP treatment beyond four months has been associated with increased risk of acquiring drug resistance in initially drug sensitive strains [5]. Additionally, there have been concerns that, in SSA, six months of directly observed therapy are often unfeasible, and RMP throughout would increase the incidence of MDR-TB, in particular in the context of high HIV prevalence and pre-existing INH resistance [6]. While some drug resistance studies have shown an association between HIV and DR-TB/MDR, data showing HIV as an independent risk factor for MDR-TB in individuals have been limited to particular settings [7]. Nevertheless, high mortality among HIV patients suffering from MDR or extensively drug-resistant tuberculosis (XDR: defined as resistance to any of the fluoroquinolones (such as ofloxacin or moxifloxacin) and to any of the three injectable second-line anti-TB drugs (amikacin, capreomycin, or kanamycin) in addition to MDR) [8] are major concerns to TB control programs in SSA. Finally, the association between RMP mono-resistance and HIV infection has also been documented [9]. Therefore, understanding the role of potential ‘drivers’ of DR-TB in SSA is important to guide intervention policies and future drug resistance monitoring in the region. We did a systematic review and meta-analysis of published and unpublished studies to establish the variation of DR-TB across SSA countries and its determinants.
Methods
Data sources
We searched PubMed, EMBASE, and Cochrane for original publications from 2003 to 2013 without language limitations. Search terms used included anti-TB drug resistance, drug resistant tuberculosis, M/DR/XDR-TB, and (isoniazid or rifampicin or ethambutol or streptomycin or ofloxacin or fluoroquinolone or kanamycin or amikacin) resistance for each country in SAA, excluding the Republic of South Africa (RSA). Each term was searched separately with a text string ending with the specific name of the country. We excluded RSA because drivers of DR-TB in this country are likely to be different and prevalence has been reported to be substantially higher than the rest of SSA countries [10]. We also searched bibliographies of other reviews and citations of the original articles identified. Reviewers

obtained unpublished DR-TB studies through personal communication with experts and authors of papers identified.
Study selection
We included surveys carried out both at national or sub-national level reporting M/DR-TB prevalence or sufficient data to calculate a prevalence of resistance to isoniazid (INH), rifampicin (RMP), ethambutol (EMB), streptomycin (SM), and/or MDR (INH and RMP). Conference proceedings, chapters of books, and correspondences were excluded. Studies were considered of sufficient quality for inclusion if participants were classified as new or previously treated based on the WHO definition [11], the study covered a large geographical area (district, region, or entire country), and recommended laboratory procedures for culture and drug susceptibility testing (DST) were followed [12]. Studies conducted in a single health unit e.g. a referral hospital or a TB center, or those where fewer than 50 participants had DST were excluded to minimize bias of including non-representative samples of the population. Where cluster sampling was used, adjustment for the cluster design was a requirement for inclusion in this review.
Two authors conducted the electronic searches independently; the last search was conducted in June 2014. Selection of articles was done by both reviewers independently. Disagreements on articles to be included were resolved by consensus among the two authors.
Data extraction
We extracted data using pre-defined forms on: country of the study; sampling method; description of the facilities where the study was done; total number of patients enrolled in the study as per treatment category; number of patients with DST results; number of patients with a positive result for resistance to INH, RMP, EMB, SM, or MDR-TB; and HIV prevalence among the participants (if available). HIV prevalence at national level for each country of interest was collected from the UNAIDS report 2013 [13]. Two authors extracted data independently and any discrepancies in the data extracted were resolved through discussions.
Data synthesis and analysis
According to WHO, resistance among new cases is defined as resistance to one or more anti-tuberculosis drugs in patients that have never been treated for TB. Resistance among previously treated TB patients, on the other hand, is defined as resistance to one or more anti-tuberculosis drugs in patients that have been treated for TB. It can be transmitted from another patient with DR-TB or acquired in patients diagnosed with pan-sensitive TB who have started TB treatment and subsequently develop resistance to one or more of the drugs used during the treatment. To generate data stratified for the resistance among the new and previously treated TB patients, we calculated pooled resistance prevalence along with the 95% confidence interval through meta-analysis using random effects models for MDR-TB and any DR-TB to the first line drugs (INH, RMP, EMB, and SM). We assessed the heterogeneity among reported prevalence using the I2 statistic.
To explore the variation observed in the prevalence estimates, we did a subgroup analysis by stratifying studies by predefined variables. In particular, we categorized variables as follows: 1) by sub-region (Eastern sub-region included Burundi, Ethiopia, Kenya, Rwanda, Somalia, Uganda, and Tanzania; West Africa sub-region included Benin, Burkina Faso, Cameroon,

Equatorial Guinea, Gambia, Ghana, Ivory Coast, and Nigeria; Southern sub-region: Botswana, Zambia, Mozambique, Madagascar, Swaziland, and Zambia; and Central Africa sub-region: Central African Republic and Chad); 2) HIV prevalence at a national level (countries with a prevalence of less than 5% compared to those with a prevalence of more than 5% in the general population); 3) type of survey (national or sub-national); 4) sampling method (random sampling or cluster sampling); 5) sample size (studies of less than 100 patients or more than 100 patients); and HIV prevalence among study participants (less than 40% compared to, equal to or more than 40%).
We defined drug resistance (DR) among new TB cases as resistance in a patient who had not received anti-TB drugs for more than one month and resistance among previously treated patients as otherwise. We avoided use of acquired resistance for these categories of patients due to limitations of this definition for acquired resistance as it does not put into consideration possibilities of re-infection with resistant forms and initial infection with resistant strains contributing to treatment failure, since capacity to ascertain resistance patterns prior to treatment initiation is rarely available under routine settings.
Results We identified 725 citations through electronic data searches and one completed study with unpublished data. Out of these, 47 articles were selected for full text review, of which 20 articles were excluded for various reasons (Figure 1). Characteristics of the 27 articles included are summarized in Table 1. Of these 27 studies, 19 (70%) reported DR-TB data on both new and previously treated patients. Seven studies reported resistance among new cases only, while one study assessed DR-TB among the previously treated. Sixteen (59%) studies reported HIV testing, and HIV prevalence estimates at country level were available for more than 90% of the studies. Thirteen (48.1%) studies in total reported data at national level. Compared to other regions, the eastern region contributed the highest number of articles, five of which were from national surveys.
Figure 1 PRISMA flow chart.
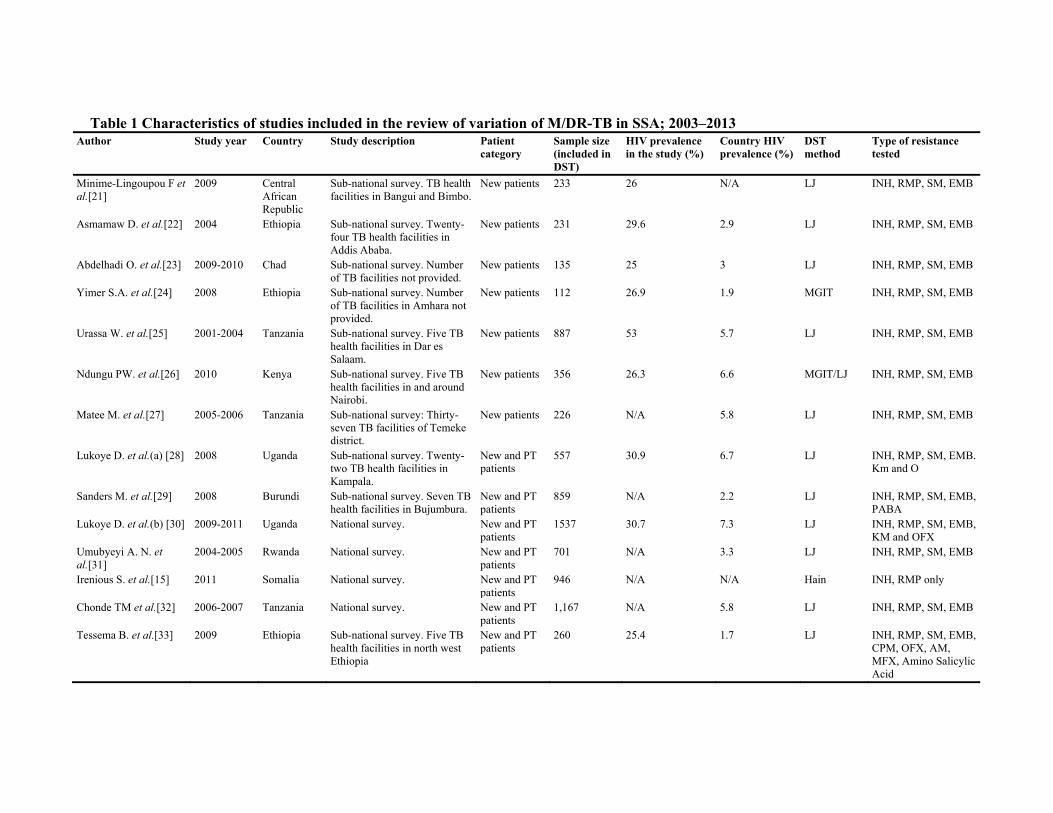
Table 1 Characteristics of studies included in the review of variation of M/DR-TB in SSA; 2003–2013 Author Study year Country Study description Patient
category Sample size (included in DST)
HIV prevalence in the study (%)
Country HIV prevalence (%)
DST method
Type of resistance tested
Minime-Lingoupou F et al.[21]
2009 Central African Republic
Sub-national survey. TB health facilities in Bangui and Bimbo.
New patients 233 26 N/A LJ INH, RMP, SM, EMB
Asmamaw D. et al.[22] 2004 Ethiopia Sub-national survey. Twenty-four TB health facilities in Addis Ababa.
New patients 231 29.6 2.9 LJ INH, RMP, SM, EMB
Abdelhadi O. et al.[23] 2009-2010 Chad Sub-national survey. Number of TB facilities not provided.
New patients 135 25 3 LJ INH, RMP, SM, EMB
Yimer S.A. et al.[24] 2008 Ethiopia Sub-national survey. Number of TB facilities in Amhara not provided.
New patients 112 26.9 1.9 MGIT INH, RMP, SM, EMB
Urassa W. et al.[25] 2001-2004 Tanzania Sub-national survey. Five TB health facilities in Dar es Salaam.
New patients 887 53 5.7 LJ INH, RMP, SM, EMB
Ndungu PW. et al.[26] 2010 Kenya Sub-national survey. Five TB health facilities in and around Nairobi.
New patients 356 26.3 6.6 MGIT/LJ INH, RMP, SM, EMB
Matee M. et al.[27] 2005-2006 Tanzania Sub-national survey: Thirty-seven TB facilities of Temeke district.
New patients 226 N/A 5.8 LJ INH, RMP, SM, EMB
Lukoye D. et al.(a) [28] 2008 Uganda Sub-national survey. Twenty-two TB health facilities in Kampala.
New and PT patients
557 30.9 6.7 LJ INH, RMP, SM, EMB. Km and O
Sanders M. et al.[29] 2008 Burundi Sub-national survey. Seven TB health facilities in Bujumbura.
New and PT patients
859 N/A 2.2 LJ INH, RMP, SM, EMB, PABA
Lukoye D. et al.(b) [30] 2009-2011 Uganda National survey. New and PT patients
1537 30.7 7.3 LJ INH, RMP, SM, EMB, KM and OFX
Umubyeyi A. N. et al.[31]
2004-2005 Rwanda National survey. New and PT patients
701 N/A 3.3 LJ INH, RMP, SM, EMB
Irenious S. et al.[15] 2011 Somalia National survey. New and PT patients
946 N/A N/A Hain INH, RMP only
Chonde TM et al.[32] 2006-2007 Tanzania National survey. New and PT patients
1,167 N/A 5.8 LJ INH, RMP, SM, EMB
Tessema B. et al.[33] 2009 Ethiopia Sub-national survey. Five TB health facilities in north west Ethiopia
New and PT patients
260 25.4 1.7 LJ INH, RMP, SM, EMB, CPM, OFX, AM, MFX, Amino Salicylic Acid
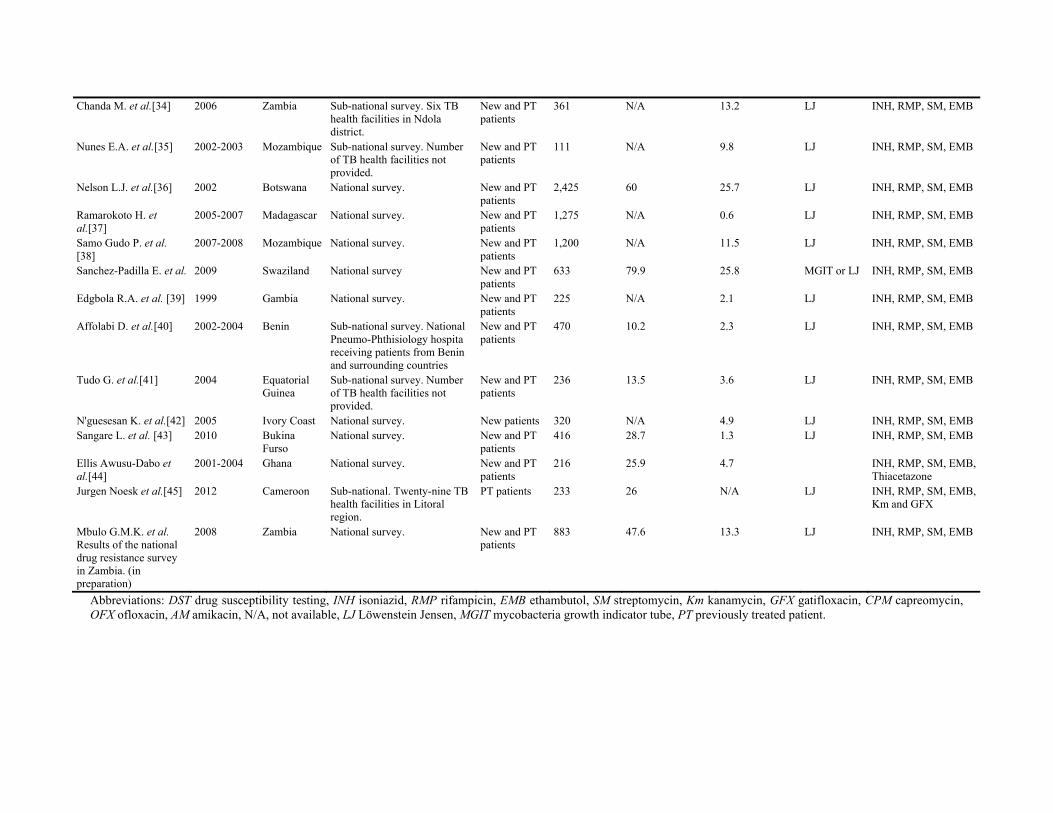
Chanda M. et al.[34] 2006 Zambia Sub-national survey. Six TB health facilities in Ndola district.
New and PT patients
361 N/A 13.2 LJ INH, RMP, SM, EMB
Nunes E.A. et al.[35] 2002-2003 Mozambique Sub-national survey. Number of TB health facilities not provided.
New and PT patients
111 N/A 9.8 LJ INH, RMP, SM, EMB
Nelson L.J. et al.[36] 2002 Botswana National survey. New and PT patients
2,425 60 25.7 LJ INH, RMP, SM, EMB
Ramarokoto H. et al.[37]
2005-2007 Madagascar National survey. New and PT patients
1,275 N/A 0.6 LJ INH, RMP, SM, EMB
Samo Gudo P. et al. [38]
2007-2008 Mozambique National survey. New and PT patients
1,200 N/A 11.5 LJ INH, RMP, SM, EMB
Sanchez-Padilla E. et al. 2009 Swaziland National survey New and PT patients
633 79.9 25.8 MGIT or LJ INH, RMP, SM, EMB
Edgbola R.A. et al. [39] 1999 Gambia National survey. New and PT patients
225 N/A 2.1 LJ INH, RMP, SM, EMB
Affolabi D. et al.[40] 2002-2004 Benin Sub-national survey. National Pneumo-Phthisiology hospita receiving patients from Benin and surrounding countries
New and PT patients
470 10.2 2.3 LJ INH, RMP, SM, EMB
Tudo G. et al.[41] 2004 Equatorial Guinea
Sub-national survey. Number of TB health facilities not provided.
New and PT patients
236 13.5 3.6 LJ INH, RMP, SM, EMB
N'guesesan K. et al.[42] 2005 Ivory Coast National survey. New patients 320 N/A 4.9 LJ INH, RMP, SM, EMB Sangare L. et al. [43] 2010 Bukina
Furso National survey. New and PT
patients 416 28.7 1.3 LJ INH, RMP, SM, EMB
Ellis Awusu-Dabo et al.[44]
2001-2004 Ghana National survey. New and PT patients
216 25.9 4.7 INH, RMP, SM, EMB, Thiacetazone
Jurgen Noesk et al.[45] 2012 Cameroon Sub-national. Twenty-nine TB health facilities in Litoral region.
PT patients 233 26 N/A LJ INH, RMP, SM, EMB, Km and GFX
Mbulo G.M.K. et al. Results of the national drug resistance survey in Zambia. (in preparation)
2008 Zambia National survey. New and PT patients
883 47.6 13.3 LJ INH, RMP, SM, EMB
Abbreviations: DST drug susceptibility testing, INH isoniazid, RMP rifampicin, EMB ethambutol, SM streptomycin, Km kanamycin, GFX gatifloxacin, CPM capreomycin, OFX ofloxacin, AM amikacin, N/A, not available, LJ Löwenstein Jensen, MGIT mycobacteria growth indicator tube, PT previously treated patient.
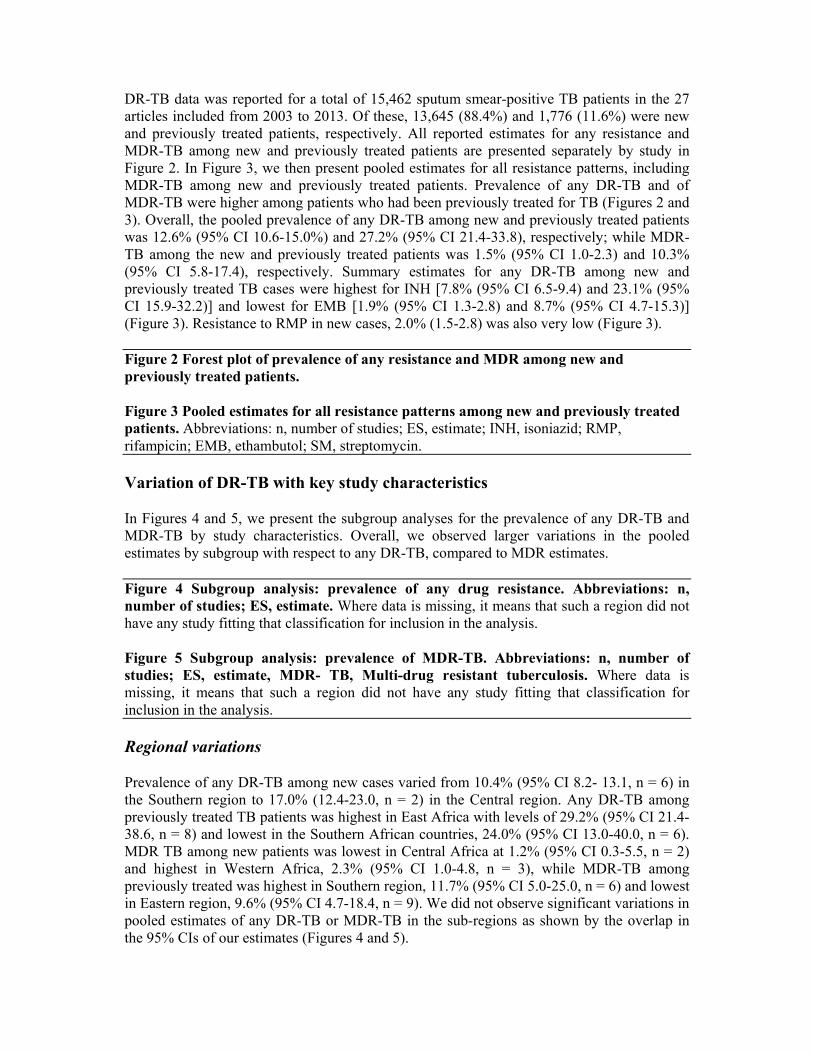
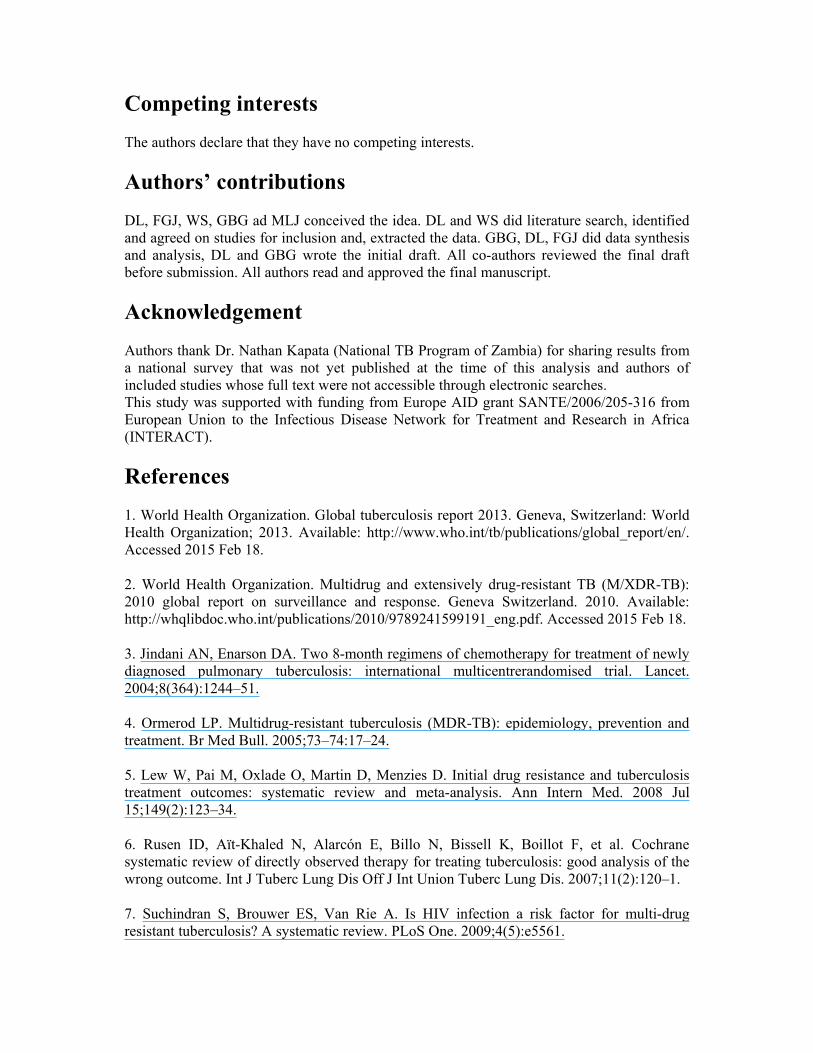
DR-TB data was reported for a total of 15,462 sputum smear-positive TB patients in the 27 articles included from 2003 to 2013. Of these, 13,645 (88.4%) and 1,776 (11.6%) were new and previously treated patients, respectively. All reported estimates for any resistance and MDR-TB among new and previously treated patients are presented separately by study in Figure 2. In Figure 3, we then present pooled estimates for all resistance patterns, including MDR-TB among new and previously treated patients. Prevalence of any DR-TB and of MDR-TB were higher among patients who had been previously treated for TB (Figures 2 and 3). Overall, the pooled prevalence of any DR-TB among new and previously treated patients was 12.6% (95% CI 10.6-15.0%) and 27.2% (95% CI 21.4-33.8), respectively; while MDR-TB among the new and previously treated patients was 1.5% (95% CI 1.0-2.3) and 10.3% (95% CI 5.8-17.4), respectively. Summary estimates for any DR-TB among new and previously treated TB cases were highest for INH [7.8% (95% CI 6.5-9.4) and 23.1% (95% CI 15.9-32.2)] and lowest for EMB [1.9% (95% CI 1.3-2.8) and 8.7% (95% CI 4.7-15.3)] (Figure 3). Resistance to RMP in new cases, 2.0% (1.5-2.8) was also very low (Figure 3).
Figure 2 Forest plot of prevalence of any resistance and MDR among new and previously treated patients.
Figure 3 Pooled estimates for all resistance patterns among new and previously treated patients. Abbreviations: n, number of studies; ES, estimate; INH, isoniazid; RMP, rifampicin; EMB, ethambutol; SM, streptomycin.
Variation of DR-TB with key study characteristics
In Figures 4 and 5, we present the subgroup analyses for the prevalence of any DR-TB and MDR-TB by study characteristics. Overall, we observed larger variations in the pooled estimates by subgroup with respect to any DR-TB, compared to MDR estimates.
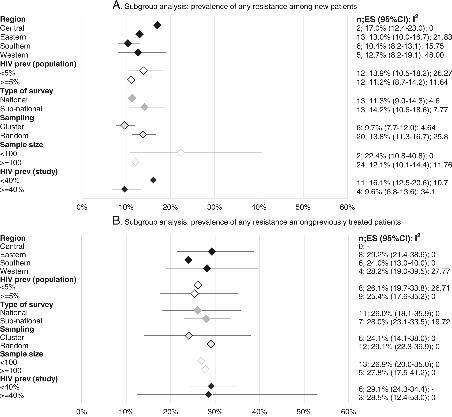
Figure 4 Subgroup analysis: prevalence of any drug resistance. Abbreviations: n, number of studies; ES, estimate. Where data is missing, it means that such a region did not have any study fitting that classification for inclusion in the analysis.
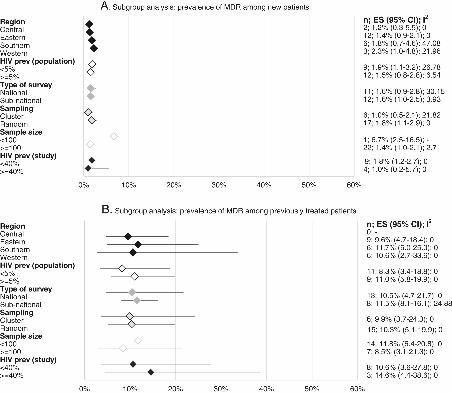
Figure 5 Subgroup analysis: prevalence of MDR-TB. Abbreviations: n, number of studies; ES, estimate, MDR- TB, Multi-drug resistant tuberculosis. Where data is missing, it means that such a region did not have any study fitting that classification for inclusion in the analysis.
Regional variations
Prevalence of any DR-TB among new cases varied from 10.4% (95% CI 8.2- 13.1, n = 6) in the Southern region to 17.0% (12.4-23.0, n = 2) in the Central region. Any DR-TB among previously treated TB patients was highest in East Africa with levels of 29.2% (95% CI 21.4-38.6, n = 8) and lowest in the Southern African countries, 24.0% (95% CI 13.0-40.0, n = 6). MDR TB among new patients was lowest in Central Africa at 1.2% (95% CI 0.3-5.5, n = 2) and highest in Western Africa, 2.3% (95% CI 1.0-4.8, n = 3), while MDR-TB among previously treated was highest in Southern region, 11.7% (95% CI 5.0-25.0, n = 6) and lowest in Eastern region, 9.6% (95% CI 4.7-18.4, n = 9). We did not observe significant variations in pooled estimates of any DR-TB or MDR-TB in the sub-regions as shown by the overlap in the 95% CIs of our estimates (Figures 4 and 5).

Country-level HIV prevalence
Analysis of any DR-TB among new cases in relation to HIV infection rates (Figure 4) showed somewhat higher resistance rates of 13.9% (95% CI 10.5-18.2, n = 12) in countries where HIV prevalence was lower than 5%, compared to countries where the prevalence was equal to or higher than 5%, [11.2% (95% CI 8.7-14.2, n = 12)], while DR-TB among the previously treated was almost the same among settings with these different HIV prevalence rates (26.1%, n = 8 vs 25.4%, n = 9). Primary MDR-TB in settings with less than 5% HIV prevalence was 1.9% (95% CI 1.1-3.2 n = 9) as compared to 1.5% (95% CI 0.8-2.8 n = 12) in settings where the HIV prevalence equal to or higher than 5%. MDR-TB among previously treated patients in countries with lower than 5% HIV prevalence was 8.3% (95% CI 3.4-18.8, n = 11) compared to 11.0 (95% CI 5.8-19.9, n = 9) in countries with HIV prevalence of equal to or higher than 5%. However, differences were small with largely overlapping 95% confidence intervals.
TB/HIV co-infection
Where HIV testing was done as part of the survey (Figure 4), we observe a higher prevalence of DR-TB among new cases in studies where HIV was lower than 40% among the study participants [16.1% (95% CI 12.5-20.6, n = 11)] as compared to 9.6% (95% CI 6.8-13.6, n = 4) in studies where HIV prevalence among participants was equal to or higher than 40%. Analysis of DR-TB among previously treated cases in relation to these HIV co-infection rates shows the same rates in these two settings, those studies with lower than 40% HIV co-infection and equal to or more than 40% of HIV co-infection, [29.1%, 95% CI = 24.3-34.4 n = 6 and 28.5% 95% CI 12.4-53.0 n = 3]. MDR among new cases in studies where TB/HIV co-infection rates were lower than <40% was 1.8% (1.2-2.7, n = 9); and 1.0% (0.2-5.7; n = 4); in studies with equal to or higher than 40% TB/HIV co-infection. MDR-TB among previously treated patients where TB/HIV co-infection was lower than 40% among the participants was 10.6% (95% CI = 3.6-27.8, n = 8) and 14.6% (95% CI 4.4-38.6, n = 3) where equal to or higher than 40% of the participants were HIV co-infected, although this difference was also not significant (Figure 5).
Study geographical coverage
Generally, articles reporting national surveys estimated lower rates of any DR-TB among new cases 11.3% (95% CI = 9.0-14.3, n = 13) as compared to sub-national reports 14.2% (95% CI 10.6-18.6, n = 13). Any acquired DR-TB was similar in the national (26.0%; 95% CI 18.1-35.9, n = 11) and sub-national surveys (28%; 95% CI- 23.1-33.5, n = 7) (Figure 4). MDR estimates among new cases were the same in both national and sub-national studies at 1.6% (95% CI 0.9- 2.8, n = 11) and 1.6% (95% CI 1.0-2.5, n = 12) respectively, as were MDR rates among the previously treated: 10.5% (95% CI 4.7-21.7, n = 13) versus 11.0% (95% CI 5.8-19.9, n = 8), respectively (Figure 5).
Sampling design
Studies that applied a cluster sampling design reported lower rates of any DR-TB 9.7% (7.7-12.0; n = 6) in new cases than studies where random sampling was used 13.8% (11.3-16.7; n = 20); DR-TB rates among previously treated patients in these two study designs were 24.1% (14.1-38.0; n = 6) and 29.1% (22.3-36.9 n = 12) respectively. Rates of MDR-TB followed a

similar trend with MDR-TB among the new patients in studies that used cluster and random sampling designs reporting MDR-TB rates of 1.0% (0.5-2.1; n = 6) and 1.8% (1.1-2.9; n = 17), respectively. MDR-TB among the previously treated category in studies that used cluster design was 9.9% (3.7-24.3; n = 6), similar to that in studies where random sampling was used [10.3% (5.1-19.9; n = 15)]. All the differences in these measurements did not show statistical significance (Figures 4 and 5).
Sample size
Studies with sample sizes of less than 100 participants reported significantly higher rates of any DR-TB among new cases, 22.4% (95% CI 10.8-40.0, n = 2) compared to studies where 100 or more participants were recruited, 12.1% (95% CI 10.1-14.4, n = 24). Levels of DR-TB among the previously treated were almost the same in both categories of sample size, 26.9% (95% CI 20.0-35.0, n = 13) and 27.8% (95% CI 17.5-42.1, n = 5). For either category of study size, MDR levels amongst new cases followed similar trends, significantly higher 6.7% (95% CI 2.5-16, n = 1) in studies with less than 100 participants as compared to 1.4% (95% CI 1.0-2.1, n = 22) in studies with larger sample sizes. Although slightly higher, levels of MDR-TB among previously treated patients in studies with less than 100 participants, 11.8% (6.4%-20.8%, n = 14), this difference was not statistically significant as compared to studies with 100 participants or more, 8.5% (95% CI 3.1%-21.3%, n = 7).
Publication bias
Finally, in Figure 6, we explored graphically the possibility of a publication bias. We did not observe an indication of such a bias in the studies included.
Figure 6 Funnel plot exploring publication bias.
Discussion In our study, we reviewed variations and risk factors of DR-TB in SSA. We found that levels of any DR-TB and MDR-TB are lower in SSA than reported globally [1]. In particular, our results show MDR-TB prevalence estimates as almost half as compared to the global average reported by WHO for both new (1.5% vs 3.6%) and previously treated TB patients (10.3% vs 20.2%) [2]. These consistent low levels occur in settings with high rates of HIV, largely attributed, among other factors, to the late introduction of RMP and limited availability of TB drugs on the open market outside national TB programs [14] in this region. According to the subgroup analyses, rates of (M)DR-TB remain generally low regardless of the study geographical coverage, sample size, HIV co-infection rates, and sub-region where the study was conducted. This finding happens at a time when more information on rates and factors associated with of DR-TB in this region is emerging, as more countries conduct surveys at national and sub-national level [14], although data on DR-TB from SSA is still limited [10]. The observed low levels of (M)DR-TB may also reflect the functionality of TB control programs in this region. Previous studies have shown that countries where standardized regimens are available and properly implemented, where quality drugs are regularly supplied, and where systems are in place to ensure patients’ adherence are less likely to report high rates of (M)DR-TB. From our findings, such explanation can be supported by the high rates of MDR-TB from the Horn of Africa included in our review, which could have resulted from a break down in the public health system and therefore in the functionality of the TB program
due to civil strife also observed elsewhere in the world [16,17]. Therefore, regional variations in MDR-TB rates might be considered a proxy measure for functionality of national TB programs which should alert national governments and donor communities for timely interventions. The role of Mycobacterium tuberculosis (MTB) strains in transmissibility and its potential to develop DR in this region should not be ignored. As observed in some settings, particular MTB strains predominant in specific localities have been associated with varying rates of MDR-TB [18]. Hence, more molecular studies are required to examine and explain possible associations of the predominant MTB strains with the observed prevalence of DR-TB in SSA. Our findings seem to imply that transmission-related factors such as late diagnosis, nosocomial spread, and delay in initiation of second-line treatment as observed in most settings of this region have not led to increase in (M)DR-TB above the minimum WHO estimates. However we observe higher rates of resistance to INH and SM than other drugs in our analysis, also documented earlier, attributed to the long history of INH and SM use in management of TB and to the stepwise acquisition of DR by MTB to these two drugs [19].
Lower levels of MDR-TB (1.5%) in settings with higher HIV prevalence at population level, also observed where HIV testing was included in the study design, could result from less participation rates of (M)DR-TB/HIV co-infected patients in surveys due to either severe illness or higher risk of death [8]. Where collection of individual HIV data was included in the study design, we found higher rates of MDR-TB (25%) among previously treated patients in studies where HIV prevalence was lower, possibly due to the same explanation and the possibility of suspected high MDR-TB rates in such populations.
We observed levels of any RMP resistance among new cases (1.5%) in the analysis close to the reported prevalence of MDR-TB (2.0%). This finding is of significant relevance in the current global and regional efforts to accurately and timely diagnose MDR-TB with the scale-up of molecular technology like GeneXpert MTB/RIF, providing quick results of RMP resistance as a proxy to MDR-TB. In fact, in many SSA countries, access to culture and DST facilities is limited and molecular technologies might ease access to MDR-TB diagnosis and reduce the time spent between diagnosis and initiation of the patient on treatment. High levels of INH and SM resistance found in our review, also documented elsewhere, need to be monitored closely in relation to the potential increase in treatment failure and relapse rates with the current first-line drugs [20]. In light of the recommended roll-out of the RMP-through regimen by WHO, especially in high HIV burden settings such as SSA, TB programs need to ensure correct use of RMP in drug -susceptible cases to avoid adding RMP resistance to the already high levels of INH resistance, likely to lead to high MDR-TB rates.
Finally, we observe higher rates of MDR-TB in smaller studies as compared to larger ones possibly arising from the difference in the core objectives of the studies. Studies with small sample sizes are usually done to explore possibilities of high MDR-TB rates in specific populations. Similarly, DR-TB rates in sub-national studies are higher than in the national surveys since, in most cases, sample sizes in such studies tend to be smaller, non-representative of the population, and sometimes do not apply standardized methodologies, although we aimed to exclude such studies from our analysis. The lower (M)DR levels observed in cluster surveys as compared to surveys where random sampling was applied may have a similar explanation. Cluster sampling designs are usually applied where the study population is large and covering a wider geographical area for optimal use of resources without compromising the quality of the data. Consequently, lower (M)DR rates in cluster surveys could have been a proxy to the large sample sizes involved.
As demonstrated by the publication bias sub-analysis, we observed no tendency from authors to publish papers showing more or less resistance more frequently that could distort our findings.
Limitations
Our review had some limitations. Of 44 countries in SSA (excluding the Republic of South Africa), only 20 countries had done studies that fulfilled our inclusion criteria, of which studies from five countries were not on a national scale. Many of the DR-TB surveys identified during our searches were excluded because they took place at a single health facility or had not stratified patients according to their treatment history.
Although the association between HIV infection and DR-TB is still controversial and deserves further exploration, ten of the 27 studies analyzed did not include HIV testing. It was, therefore, difficult to draw meaningful conclusions. Similarly, we did not review data on national ART coverage due to challenges associated with accessing accurate data to examine a possible relationship between ART roll-out and levels of MDR-TB. Finally, results on second-line DST were not reported for the majority of studies. This could be a reflection that most countries in SSA had not initiated MDR-TB treatment at the time of the study and the possibilities of finding XDR-TB were limited, although this analysis would be important especially in settings where some fluoroquinolones (a cornerstone of second-line drug regimens) are widely used for treatment of other bacterial infections.
We excluded the republic of South Africa on the basis of high levels of MDR-TB and XDR-TB rates in comparison to other countries of SSA [1,8], possibly fuelled by high nosocomial transmission rates in the context of very high rates of TB/HIV co-infection reported in this country. We assumed that including such studies could potentially skew our results towards higher DR-TB or MDR-TB estimates.
Conclusions Our analysis showed low levels of MDR-TB in sub-Saharan Africa compared to WHO estimates, with higher resistance to INH and SM as reported elsewhere in the world. There are no major variations in MDR-TB burden by sub-region and evidence of association between MDR-TB and HIV infection rates did not show statistical significance. We attribute these low levels to the limited existence of anti-TB drugs outside the national programs, late introduction of RMP in SSA, and wide use of fixed drug combinations. Since these factors may apply to other settings where rates of MDR-TB are higher, more studies are required to explore other possible explanations for the low levels of MDR-TB in SSA, such as the role of predominant MTB strains in generation and transmission of DR-TB in this region
Abbreviations ART, Anti-retroviral therapy; DR-TB, Drug resistant tuberculosis; DST, Drug susceptibility testing; EMB, Ethambutol; INH, Isoniazid; MDR-TB, Multi Drug Resistant Tuberculosis; RMP, Rifampicin; RSA, Republic of South Africa; SM, Streptomycin; SSA, Sub-Saharan Africa; TB, Tuberculosis; WHO, World Health Organization; XDR- TB, Extensively drug resistant tuberculosis; PZA, Pyrazinamide
Competing interests The authors declare that they have no competing interests.
Authors’ contributions DL, FGJ, WS, GBG ad MLJ conceived the idea. DL and WS did literature search, identified and agreed on studies for inclusion and, extracted the data. GBG, DL, FGJ did data synthesis and analysis, DL and GBG wrote the initial draft. All co-authors reviewed the final draft before submission. All authors read and approved the final manuscript.
Acknowledgement Authors thank Dr. Nathan Kapata (National TB Program of Zambia) for sharing results from a national survey that was not yet published at the time of this analysis and authors of included studies whose full text were not accessible through electronic searches. This study was supported with funding from Europe AID grant SANTE/2006/205-316 from European Union to the Infectious Disease Network for Treatment and Research in Africa (INTERACT).
References 1. World Health Organization. Global tuberculosis report 2013. Geneva, Switzerland: World Health Organization; 2013. Available: http://www.who.int/tb/publications/global_report/en/. Accessed 2015 Feb 18.
2. World Health Organization. Multidrug and extensively drug-resistant TB (M/XDR-TB): 2010 global report on surveillance and response. Geneva Switzerland. 2010. Available: http://whqlibdoc.who.int/publications/2010/9789241599191_eng.pdf. Accessed 2015 Feb 18.
3. Jindani AN, Enarson DA. Two 8-month regimens of chemotherapy for treatment of newly diagnosed pulmonary tuberculosis: international multicentrerandomised trial. Lancet. 2004;8(364):1244–51.
4. Ormerod LP. Multidrug-resistant tuberculosis (MDR-TB): epidemiology, prevention and treatment. Br Med Bull. 2005;73–74:17–24.
5. Lew W, Pai M, Oxlade O, Martin D, Menzies D. Initial drug resistance and tuberculosis treatment outcomes: systematic review and meta-analysis. Ann Intern Med. 2008 Jul 15;149(2):123–34.
6. Rusen ID, Aït-Khaled N, Alarcón E, Billo N, Bissell K, Boillot F, et al. Cochrane systematic review of directly observed therapy for treating tuberculosis: good analysis of the wrong outcome. Int J Tuberc Lung Dis Off J Int Union Tuberc Lung Dis. 2007;11(2):120–1.
7. Suchindran S, Brouwer ES, Van Rie A. Is HIV infection a risk factor for multi-drug resistant tuberculosis? A systematic review. PLoS One. 2009;4(5):e5561.

8. Gandhi NRMA, Sturm AWPR, Friedland G. Extensively drug-resistant tuberculosis as a cause of death in patients co-infected with tuberculosis and HIV in a rural area of South Africa. Lancet. 2006;368:1575–80.
9. Wells CDCJ, Nelson LJLK, Holtz THFA, Castro KGWK. HIV infection and multidrug-resistant tuberculosis-the perfect storm. J Infect Dis. 2007;196:S86–S107.
10. Pablos-Méndez A, Raviglione MC, Laszlo A, Binkin N, Rieder HL, Bustreo F, et al. Global surveillance for Antituberculosis-drug resistance, 1994–1997 world health organization-international union against tuberculosis and lung disease working group on anti-tuberculosis drug resistance surveillance. N Engl J Med. 1998;338(23):1641–9.
11. World Health Organization: Definitions and revised reporting framework for tuberculosis; 2013 revision, (updated December 2014). Available: http://apps.who.int/iris/bitstream/10665/79199/1/9789241505345_eng.pdf. Accessed 2015. Feb.18.
12. WHO. Guidelines for surveillance of drug resistant tuberculosis p. 30. Geneva Switzerland; 2009. Available: http://whqlibdoc.who.int/publications/2009/9789241598675_eng.pdf. Accessed 2015. Feb. 18.
13. WHO; UNICEF; UNAIDS: Global AIDS response progress reporting 2013; Construction of core indicators for monitoring the 2011 UN Political Declaration on HIV/AIDS; (http://www.who.int/hiv/pub/me/ua_indicator_guide/en/).
14. Berhan A, Berhan Y, Yizengaw D. A meta-analysis of drug resistant tuberculosis in Sub-Saharan Africa: how strongly associated with previous treatment and HIV co-infection? Ethiop J Health Sci. 2013;23(3):271–82.
15. Mwinga A. Drug-resistant tuberculosis in Africa. Ann N Y Acad Sci. 2001 Dec;953:106–12.
16. Sindani I, Fitzpatrick C, Falzon D, Suleiman B, Arube P, Adam I, et al. Multidrug-resistant tuberculosis, Somalia, 2010–2011. Emerg Infect Dis. 2013;19(3):478–80.
17. Zignol M, Dara M, Dean AS, Falzon D, Dadu A, Kremer K, et al. Drug-resistant tuberculosis in the WHO European Region: An analysis of surveillance data. Drug Resist Updat Rev Comment Antimicrob Anticancer Chemother. 2013 Dec;16(6):108–15.
18. De Steenwinkel JEM, ten Kate MT, de Knegt GJ, Kremer K, Aarnoutse RE, Boeree MJ, et al. Drug susceptibility of Mycobacterium tuberculosis Beijing genotype and association with MDR TB. Emerg Infect Dis. 2012 Apr;18(4):660–3.
19. Zhang Y, Yew WW. Mechanisms of drug resistance in Mycobacterium tuberculosis. Int J Tuberc Lung Dis Off J Int Union Tuberc Lung Dis. 2009;13(11):1320–30.
20. Quy HTW, Lan NTN, Borgdorff MW, Grosset J, Linh PD, Tung LB, et al. Drug resistance among failure and relapse cases of tuberculosis: is the standard re-treatment regimen adequate? Int J Tuberc Lung Dis Off J Int Union Tuberc Lung Dis. 2003;7(7):631–6.
21. Minime-Lingoupou F, Manirakiza A, Yango F, Zandanga G, Le Faou A, Rigouts L. Relatively low primary resistance to anti-tuberculosis drugs in Bangui and Bimbo, Central African Republic. Int J Tuberc Lung Dis Off J Int Union Tuberc Lung Dis. 2011 May;15(5):657–61.
22. Asmamaw D, Seyoum B, Makonnen E, Atsebeha H, Woldemeskel D, Yamuah L, et al. Primary drug resistance in newly diagnosed smear positive tuberculosis patients in Addis Ababa. Ethiopia Ethiop Med J. 2008 Oct;46(4):367–74.
23. Abdelhadi O, Ndokaïn J, Ali MM, Friocourt V, Mortier E, Heym B. [Drug resistance testing of Mycobacterium tuberculosis isolates from sputum in Chad]. Bull Société Pathol Exot 1990. 2012;105(1):16–22.
24. Yimer SA, Agonafir M, Derese Y, Sani Y, Bjune GA, Holm-Hansen C. Primary drug resistance to anti-tuberculosis drugs in major towns of Amhara region, Ethiopia. APMIS Acta Pathol Microbiol Immunol Scand. 2012 Jun;120(6):503–9.
25. Urassa W, Mugusi F, Villamor E, Msamanga G, Moshiro C, Bosch R, et al. Primary antimicrobial resistance among Mycobacterium tuberculosis isolates from HIV seropositive and HIV seronegative patients in Dar es Salaam Tanzania. BMC Res Notes. 2008;1:58.
26. Ndung’u PW, Kariuki S, Ng’ang’a Z, Revathi G. Resistance patterns of Mycobacterium tuberculosis isolates from pulmonary tuberculosis patients in Nairobi. J Infect Dev Ctries. 2012;6(1):33–9.
27. Matee M, Mfinanga S, Holm-Hansen C. Anti-TB drug resistance levels and patterns among Mycobacterium tuberculosis isolated from newly diagnosed cases of pulmonary tuberculosis in Dar es Salaam, Tanzania. APMIS Acta Pathol Microbiol Immunol Scand. 2009;117(4):263–7.
28. Lukoye DCF, Ezati NKS, Adatu FE. Rates of anti-tuberculosis drug resistance in Kampala-Uganda Are Low and Not associated with HIV infection. PLoS ONE. 2011;6(1):e16130.
29. Sanders M, Van Deun A, Ntakirutimana D, Masabo JP, Rukundo J, Rigouts L, et al. Rifampicin mono-resistant Mycobacterium tuberculosis in Bujumbura, Burundi: results of a drug resistance survey. Int J Tuberc Lung Dis Off J Int Union Tuberc Lung Dis. 2006;10(2):178–83.
30. Lukoye D, Adatu F, Musisi K, Kasule GW, Were W, Odeke R, et al. Anti-tuberculosis drug resistance among new and previously treated sputum smear-positive tuberculosis patients in Uganda: results of the first national survey. PLoS One. 2013;8(8):e70763.
31. Umubyeyi VG AN, Gasan MZJ, Basinga P. Results of a national survey on drug resistance among pulmonary tuberculosis patients in Rwanda. Int J Tuberc Lung Dis. 2007;1:189–94.
32. Chonde BD TM, SGM Mfinanga N. National anti-Tuberculosis drug resistance study in Tanzania. Int J Turberc Lung Dis. 2010;14(8):967–72.
33. Tessema B, Beer J, Emmrich F, Sack U, Rodloff AC. First- and second-line anti-tuberculosis drug resistance in Northwest Ethiopia. Int J Tuberc Lung Dis Off J Int Union Tuberc Lung Dis. 2012;16(6):805–11.
34. Mulenga C, Chonde A, Bwalya IC, Kapata N, Kakungu-Simpungwe M, Docx S, et al. Low occurrence of tuberculosis drug resistance among pulmonary tuberculosis patients from an urban setting, with a long-running DOTS program in Zambia. Tuberc Res Treat. 2010;2010:938178.
35. Nunes EA, De Capitani EM, Coelho E, Joaquim OA, Figueiredo IRO, Cossa AM, et al. Patterns of anti-tuberculosis drug resistance among HIV-infected patients in Maputo, Mozambique, 2002–2003. Int J Tuberc Lung Dis Off J Int Union Tuberc Lung Dis. 2005;9(5):494–500.
36. Nelson LJ, Talbot EA, Mwasekaga MJ, Ngirubiu PK, Mwansa RA, Notha M, et al. Antituberculosis drug resistance and anonymous HIV surveillance in tuberculosis patients in Botswana, 2002. Lancet. 2005;366(9484):488–90.
37. Ramarokoto H, Ratsirahonana O, Soares JL, Ravaosolo J, Ravololonandriana P, Rakotoarisaonina A, et al. First national survey of Mycobacterium tuberculosis drug resistance, Madagascar, 2005–2006. Int J Tuberc Lung Dis Off J Int Union Tuberc Lung Dis. 2010;14(6):745–50.
38. Samo Gudo P, Cuna Z, Coelho E, Maungate S, Borroni E, Miotto P, et al. Is multidrug-resistant tuberculosis on the rise in Mozambique? Results of a national drug resistance survey. Eur Respir J. 2011;38(1):222–4.
39. Adegbola RA, Hill P, Baldeh I, Otu J, Sarr R, Sillah J, et al. Surveillance of drug-resistant Mycobacterium tuberculosis in The Gambia. Int J Tuberc Lung Dis Off J Int Union Tuberc Lung Dis. 2003;7(4):390–3.
40. Affolabi D, Adjagba OABG, Tanimomo-Kledjo B, Gninafon M, Anagonou SY, Portaels F. Anti-tuberculosis drug resistance among new and previously treated pulmonary tuberculosis patients in Cotonou, Benin. Int J Tuberc Lung Dis Off J Int Union Tuberc Lung Dis. 2007;11(11):1221–4.
41. Tudó G, González J, Obama R, Rodríguez JM, Franco JR, Espasa M, et al. Study of resistance to anti-tuberculosis drugs in five districts of Equatorial Guinea: rates, risk factors, genotyping of gene mutations and molecular epidemiology. Int J Tuberc Lung Dis Off J Int Union Tuberc Lung Dis. 2004;8(1):15–22.
42. N’guessan K, Dosso M, Nahoua I, Koffi MS, Kouakou J. Primary resistance to antituberculosis drugs: trends in Cote d’Ivoire from 1995 to 2006. Médecine Mal Infect. 2008;38(4):231–2.
43. Sangaré L, Diandé S, Badoum G, Dingtoumda B, Traoré AS. Anti-tuberculosis drug resistance in new and previously treated pulmonary tuberculosis cases in Burkina Faso. Int J Tuberc Lung Dis Off J Int Union Tuberc Lung Dis. 2010;14(11):1424–9.

44. Owusu-Dabo E, Adjei O, Meyer CG, Horstmann RD, Enimil A, Kruppa TF, et al. Mycobacterium tuberculosis drug resistance. Ghana Emerg Infect Dis. 2006 Jul;12(7):1171–2.
45. Noeske J, Voelz N, Fon E, Abena Foe J-L. Early results of systematic drug susceptibility testing in pulmonary tuberculosis retreatment cases in Cameroon. BMC Res Notes. 2012;5:160.


Related Documents


![New Multidrug-resistant tuberculosis outbreak associated with poor … · 2019. 5. 7. · drug-resistant TB globally, including rifampicin-resistant-tuberculosis [6]. This represents](https://static.cupdf.com/doc/110x72/600d77f9f2a2e24066677183/new-multidrug-resistant-tuberculosis-outbreak-associated-with-poor-2019-5-7.jpg)