Variation Among Processors Under Turbo Boost in HPC Systems Bilge Acun, Phil Miller, Laxmikant V. Kale Department of Computer Science University of Illinois at Urbana-Champaign, Urbana, IL, 61801 {acun2, mille121, kale}@illinois.edu Abstract The design and manufacture of present-day CPUs causes inherent variation in supercomputer architectures such as variation in power and temperature of the chips. The vari- ation also manifests itself as frequency differences among processors under Turbo Boost dynamic overclocking. This variation can lead to unpredictable and suboptimal perfor- mance in tightly coupled HPC applications. In this study, we use compute-intensive kernels and applications to analyze the variation among processors in four top supercomputers: Edison, Cab, Stampede, and Blue Waters. We observe that there is an execution time difference of up to 16% among processors on the Turbo Boost-enabled supercomputers: Edi- son, Cab, Stampede. There is less than 1% variation on Blue Waters, which does not have a dynamic overclocking feature. We analyze measurements from temperature and power in- strumentation and find that intrinsic differences in the chips’ power efficiency is the culprit behind the frequency variation. Moreover, we analyze potential solutions such as disabling Turbo Boost, leaving idle cores and replacing slow chips to mitigate the variation. We also propose a speed-aware dy- namic task redistribution (load balancing) algorithm to reduce the negative effects of performance variation. Our speed- aware load balancing algorithm improves the performance up to 18% compared to no load balancing performance and 6% better than the non-speed aware counterpart. 1. Introduction Heterogeneity in supercomputer architectures is often pre- dicted as a characteristic of future exascale machines with non-uniform processors, for example, machines with GPGPUs, FPGAs, or Intel Xeon Phi co-processors. How- ever, even today’s architectures with nominally uniform pro- cessors are not homogeneous, i.e. there can be performance, power, and thermal variation among them. This variation can be caused by the CMOS manufacturing process of the tran- sistors in a chip, physical layout of each node, differences in node assembly, and data center hot spots. These variations can manifest themselves as frequency dif- ference among processors under dynamic overclocking. Dy- namic overclocking allows the processors to automatically run above their base operating frequency since power, heat, and manufacturing cost prevent all processors from con- stantly running at their maximum validated frequency. The processor can improve performance by opportunistically ad- justing its voltage and frequency within its thermal and power constraints. Intel’s Turbo Boost Technology is an example of this feature. Overclocking rates are dependent on each processor’s power consumption, current draw, thermal limits, number of active cores, and the type of the workload [3]. High performance computing (HPC) applications are often more tightly coupled than server or personal computer work- loads. However, HPC systems are mostly built with com- mercial off-the-shelf processors (with exceptions for special- purpose SoC processors as in the IBM Blue Gene series and moderately custom products for some Intel customers [5]). Therefore, HPC systems with recent Intel processors come with the same Turbo Boost Technology as systems deployed in other settings, even though it may be less optimized for HPC workloads. Performance heterogeneity among compo- nents and performance variation over time can hinder the per- formance of HPC applications running on supercomputers. Even one slow core in the critical path can slow down the whole application. Therefore heterogeneity in performance is an important concern for HPC users. In future generation architectures, dynamic features of the processors are expected to increase, and cause their variabil- ity to increase as well. Thus, we expect variation to become a pressing challenge in future HPC platforms. Our goal in this paper is to measure and characterize the sources of varia- tion, and propose solutions to mitigate their effects. The main contributions of this paper are: • Measurement and analysis of performance variation of up to 16% between processors in top supercomputing platforms (§ 2) • Measurement and analysis of frequency, power, and temperature of processors on Edison (§ 4) • A demonstration of the performance degradation of HPC applications caused by variation (§ 4) • Identify specific measurement and control features that future architectures should provide to enable responses to in-homogeneity at the level of applications, runtime

Welcome message from author
This document is posted to help you gain knowledge. Please leave a comment to let me know what you think about it! Share it to your friends and learn new things together.
Transcript
Variation Among Processors Under Turbo Boostin HPC Systems
Bilge Acun, Phil Miller, Laxmikant V. KaleDepartment of Computer Science
University of Illinois at Urbana-Champaign, Urbana, IL, 61801{acun2, mille121, kale}@illinois.edu
Abstract
The design and manufacture of present-day CPUs causesinherent variation in supercomputer architectures such asvariation in power and temperature of the chips. The vari-ation also manifests itself as frequency differences amongprocessors under Turbo Boost dynamic overclocking. Thisvariation can lead to unpredictable and suboptimal perfor-mance in tightly coupled HPC applications. In this study,we use compute-intensive kernels and applications to analyzethe variation among processors in four top supercomputers:Edison, Cab, Stampede, and Blue Waters. We observe thatthere is an execution time difference of up to 16% amongprocessors on the Turbo Boost-enabled supercomputers: Edi-son, Cab, Stampede. There is less than 1% variation on BlueWaters, which does not have a dynamic overclocking feature.We analyze measurements from temperature and power in-strumentation and find that intrinsic differences in the chips’power efficiency is the culprit behind the frequency variation.Moreover, we analyze potential solutions such as disablingTurbo Boost, leaving idle cores and replacing slow chips tomitigate the variation. We also propose a speed-aware dy-namic task redistribution (load balancing) algorithm to reducethe negative effects of performance variation. Our speed-aware load balancing algorithm improves the performance upto 18% compared to no load balancing performance and 6%better than the non-speed aware counterpart.
1. IntroductionHeterogeneity in supercomputer architectures is often pre-dicted as a characteristic of future exascale machineswith non-uniform processors, for example, machines withGPGPUs, FPGAs, or Intel Xeon Phi co-processors. How-ever, even today’s architectures with nominally uniform pro-cessors are not homogeneous, i.e. there can be performance,power, and thermal variation among them. This variation canbe caused by the CMOS manufacturing process of the tran-sistors in a chip, physical layout of each node, differences innode assembly, and data center hot spots.
These variations can manifest themselves as frequency dif-ference among processors under dynamic overclocking. Dy-namic overclocking allows the processors to automatically
run above their base operating frequency since power, heat,and manufacturing cost prevent all processors from con-stantly running at their maximum validated frequency. Theprocessor can improve performance by opportunistically ad-justing its voltage and frequency within its thermal and powerconstraints. Intel’s Turbo Boost Technology is an exampleof this feature. Overclocking rates are dependent on eachprocessor’s power consumption, current draw, thermal limits,number of active cores, and the type of the workload [3].
High performance computing (HPC) applications are oftenmore tightly coupled than server or personal computer work-loads. However, HPC systems are mostly built with com-mercial off-the-shelf processors (with exceptions for special-purpose SoC processors as in the IBM Blue Gene series andmoderately custom products for some Intel customers [5]).Therefore, HPC systems with recent Intel processors comewith the same Turbo Boost Technology as systems deployedin other settings, even though it may be less optimized forHPC workloads. Performance heterogeneity among compo-nents and performance variation over time can hinder the per-formance of HPC applications running on supercomputers.Even one slow core in the critical path can slow down thewhole application. Therefore heterogeneity in performanceis an important concern for HPC users.
In future generation architectures, dynamic features of theprocessors are expected to increase, and cause their variabil-ity to increase as well. Thus, we expect variation to becomea pressing challenge in future HPC platforms. Our goal inthis paper is to measure and characterize the sources of varia-tion, and propose solutions to mitigate their effects. The maincontributions of this paper are:
• Measurement and analysis of performance variation ofup to 16% between processors in top supercomputingplatforms (§ 2)• Measurement and analysis of frequency, power, and
temperature of processors on Edison (§ 4)• A demonstration of the performance degradation of HPC
applications caused by variation (§ 4)• Identify specific measurement and control features that
future architectures should provide to enable responsesto in-homogeneity at the level of applications, runtime
systems, and job schedulers (§ 5)• Analysis of potential solutions to mitigate effects of in-
homogeneity: disabling Turbo Boost, replacing slowchips, idling cores, and dynamic task redistribution (§ 6)• A speed-aware dynamic task redistribution technique
which improves performance up to 18% (§ 6.4)
To the best of our knowledge, there is no other work whichmeasures and analyzes performance, frequency, temperature,and power variation among nominally equal processors underTurbo Boost at large scale (See related work in Section 7).
2. Motivation
Homogeneous synchronous applications running on multiplecores or processors are limited by the slowest rank. Hence,even one slow core can degrade the performance of the wholeapplication. If one core is slower than others by x%, then thewhole application would run x% slower if the slow core ison the critical path. For applications with non-homogeneousworkloads, this effect is not as straightforward to measure. Inthe worst case scenario, the heaviest loaded rank would be onthe slowest core and that could make the application up to x%slower.
��������������������������������������
���� ���� ���� ���� ���� ���� ���� ����
��������������������
�������
���������������������������
�����������
������
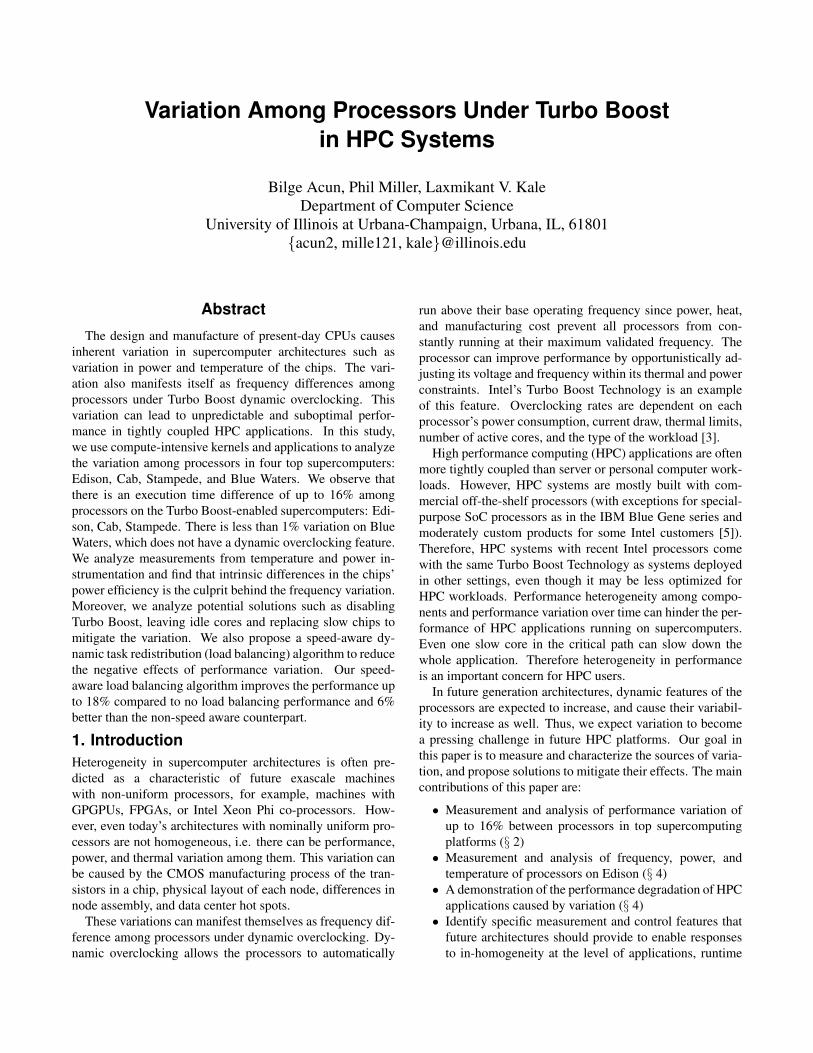
Figure 1: The distribution of benchmark times on 512nodes of each machine looping MKL-DGEMM a fixednumber of times on each core.
The impact of the core-to-core performance difference isalso based on what fraction of the cores are fast and what frac-tion of them are slow. If there are only a few fast cores andmost of the cores are slower, then the situation is not unfavor-able. However the opposite of this condition, i.e most of thecores are fast but some of them are slow, is unfavorable. Fig-ure 1, shows the histogram of the core performance runninga benchmark that calls Intel MKL-DGEMM sequentially onthe Edison, Cab and Stampede supercomputers. Overall core-to-core performance difference is around 16%, 8% and 15%respectively.
To further understand this time difference, we look intothe relation between total time and the average frequency of
��������������������������������
���� ���� ���� ���� ���� ���� �� ���� ����
��������������
���������������
������������������������������
������
���
��������
���������������
���������������
���������������
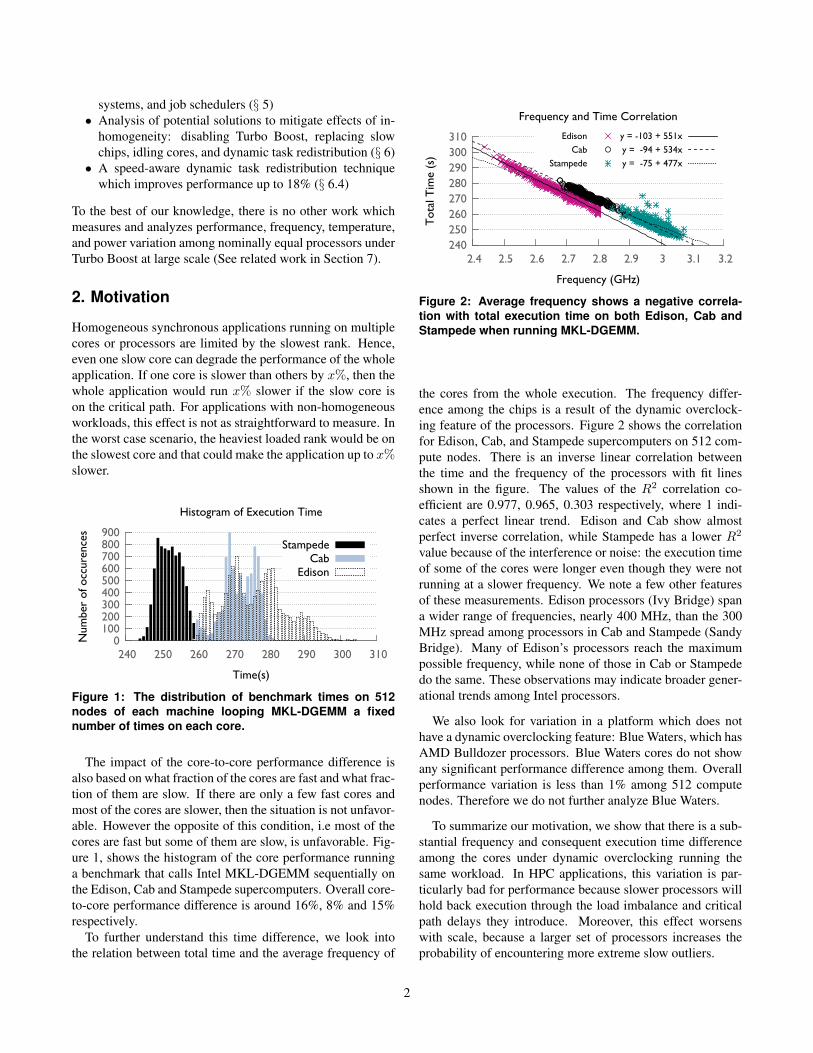
Figure 2: Average frequency shows a negative correla-tion with total execution time on both Edison, Cab andStampede when running MKL-DGEMM.
the cores from the whole execution. The frequency differ-ence among the chips is a result of the dynamic overclock-ing feature of the processors. Figure 2 shows the correlationfor Edison, Cab, and Stampede supercomputers on 512 com-pute nodes. There is an inverse linear correlation betweenthe time and the frequency of the processors with fit linesshown in the figure. The values of the R2 correlation co-efficient are 0.977, 0.965, 0.303 respectively, where 1 indi-cates a perfect linear trend. Edison and Cab show almostperfect inverse correlation, while Stampede has a lower R2
value because of the interference or noise: the execution timeof some of the cores were longer even though they were notrunning at a slower frequency. We note a few other featuresof these measurements. Edison processors (Ivy Bridge) spana wider range of frequencies, nearly 400 MHz, than the 300MHz spread among processors in Cab and Stampede (SandyBridge). Many of Edison’s processors reach the maximumpossible frequency, while none of those in Cab or Stampededo the same. These observations may indicate broader gener-ational trends among Intel processors.
We also look for variation in a platform which does nothave a dynamic overclocking feature: Blue Waters, which hasAMD Bulldozer processors. Blue Waters cores do not showany significant performance difference among them. Overallperformance variation is less than 1% among 512 computenodes. Therefore we do not further analyze Blue Waters.
To summarize our motivation, we show that there is a sub-stantial frequency and consequent execution time differenceamong the cores under dynamic overclocking running thesame workload. In HPC applications, this variation is par-ticularly bad for performance because slower processors willhold back execution through the load imbalance and criticalpath delays they introduce. Moreover, this effect worsenswith scale, because a larger set of processors increases theprobability of encountering more extreme slow outliers.
2
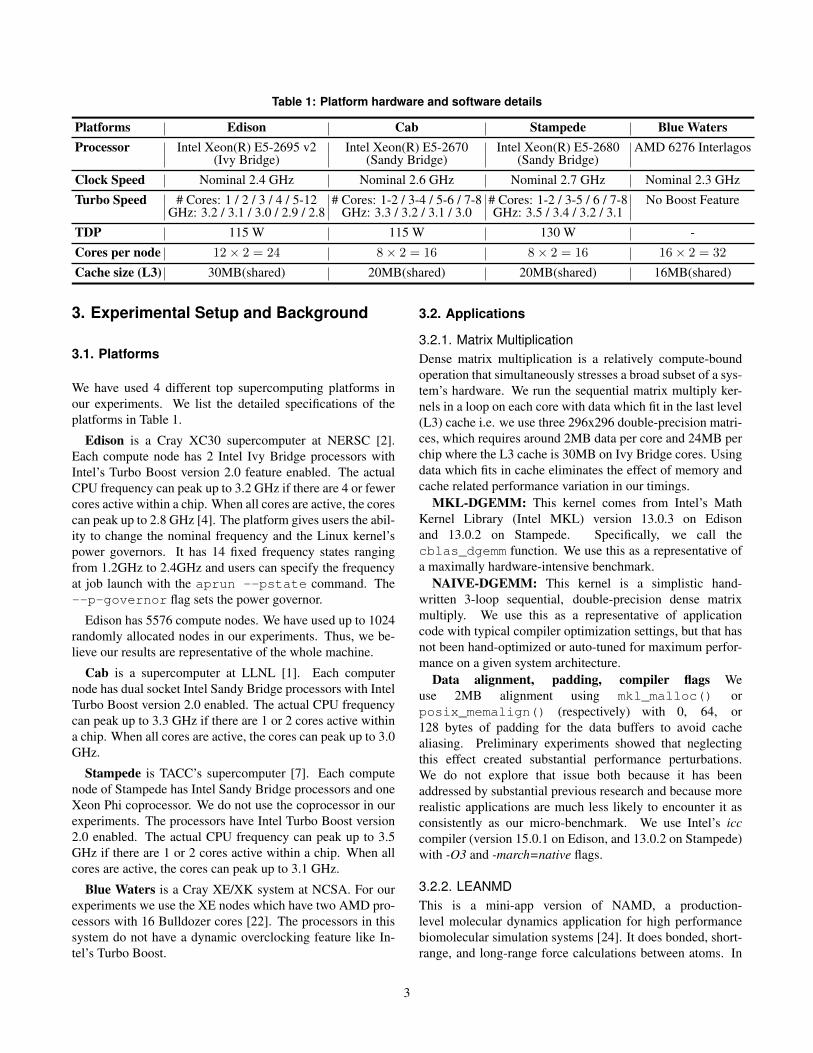
Table 1: Platform hardware and software details
Platforms Edison Cab Stampede Blue WatersProcessor Intel Xeon(R) E5-2695 v2 Intel Xeon(R) E5-2670 Intel Xeon(R) E5-2680 AMD 6276 Interlagos
(Ivy Bridge) (Sandy Bridge) (Sandy Bridge)
Clock Speed Nominal 2.4 GHz Nominal 2.6 GHz Nominal 2.7 GHz Nominal 2.3 GHz
Turbo Speed # Cores: 1 / 2 / 3 / 4 / 5-12 # Cores: 1-2 / 3-4 / 5-6 / 7-8 # Cores: 1-2 / 3-5 / 6 / 7-8 No Boost FeatureGHz: 3.2 / 3.1 / 3.0 / 2.9 / 2.8 GHz: 3.3 / 3.2 / 3.1 / 3.0 GHz: 3.5 / 3.4 / 3.2 / 3.1
TDP 115 W 115 W 130 W -
Cores per node 12× 2 = 24 8× 2 = 16 8× 2 = 16 16× 2 = 32
Cache size (L3) 30MB(shared) 20MB(shared) 20MB(shared) 16MB(shared)
3. Experimental Setup and Background
3.1. Platforms
We have used 4 different top supercomputing platforms inour experiments. We list the detailed specifications of theplatforms in Table 1.
Edison is a Cray XC30 supercomputer at NERSC [2].Each compute node has 2 Intel Ivy Bridge processors withIntel’s Turbo Boost version 2.0 feature enabled. The actualCPU frequency can peak up to 3.2 GHz if there are 4 or fewercores active within a chip. When all cores are active, the corescan peak up to 2.8 GHz [4]. The platform gives users the abil-ity to change the nominal frequency and the Linux kernel’spower governors. It has 14 fixed frequency states rangingfrom 1.2GHz to 2.4GHz and users can specify the frequencyat job launch with the aprun --pstate command. The--p-governor flag sets the power governor.
Edison has 5576 compute nodes. We have used up to 1024randomly allocated nodes in our experiments. Thus, we be-lieve our results are representative of the whole machine.
Cab is a supercomputer at LLNL [1]. Each computernode has dual socket Intel Sandy Bridge processors with IntelTurbo Boost version 2.0 enabled. The actual CPU frequencycan peak up to 3.3 GHz if there are 1 or 2 cores active withina chip. When all cores are active, the cores can peak up to 3.0GHz.
Stampede is TACC’s supercomputer [7]. Each computenode of Stampede has Intel Sandy Bridge processors and oneXeon Phi coprocessor. We do not use the coprocessor in ourexperiments. The processors have Intel Turbo Boost version2.0 enabled. The actual CPU frequency can peak up to 3.5GHz if there are 1 or 2 cores active within a chip. When allcores are active, the cores can peak up to 3.1 GHz.
Blue Waters is a Cray XE/XK system at NCSA. For ourexperiments we use the XE nodes which have two AMD pro-cessors with 16 Bulldozer cores [22]. The processors in thissystem do not have a dynamic overclocking feature like In-tel’s Turbo Boost.
3.2. Applications
3.2.1. Matrix MultiplicationDense matrix multiplication is a relatively compute-boundoperation that simultaneously stresses a broad subset of a sys-tem’s hardware. We run the sequential matrix multiply ker-nels in a loop on each core with data which fit in the last level(L3) cache i.e. we use three 296x296 double-precision matri-ces, which requires around 2MB data per core and 24MB perchip where the L3 cache is 30MB on Ivy Bridge cores. Usingdata which fits in cache eliminates the effect of memory andcache related performance variation in our timings.
MKL-DGEMM: This kernel comes from Intel’s MathKernel Library (Intel MKL) version 13.0.3 on Edisonand 13.0.2 on Stampede. Specifically, we call thecblas_dgemm function. We use this as a representative ofa maximally hardware-intensive benchmark.
NAIVE-DGEMM: This kernel is a simplistic hand-written 3-loop sequential, double-precision dense matrixmultiply. We use this as a representative of applicationcode with typical compiler optimization settings, but that hasnot been hand-optimized or auto-tuned for maximum perfor-mance on a given system architecture.
Data alignment, padding, compiler flags Weuse 2MB alignment using mkl_malloc() orposix_memalign() (respectively) with 0, 64, or128 bytes of padding for the data buffers to avoid cachealiasing. Preliminary experiments showed that neglectingthis effect created substantial performance perturbations.We do not explore that issue both because it has beenaddressed by substantial previous research and because morerealistic applications are much less likely to encounter it asconsistently as our micro-benchmark. We use Intel’s icccompiler (version 15.0.1 on Edison, and 13.0.2 on Stampede)with -O3 and -march=native flags.
3.2.2. LEANMDThis is a mini-app version of NAMD, a production-level molecular dynamics application for high performancebiomolecular simulation systems [24]. It does bonded, short-range, and long-range force calculations between atoms. In
3
our experiments, we use the benchmark size of around 1.8million atoms. The benchmark is written in CHARM++ par-allel programming framework.
3.2.3. JACOBI2DThis is a 5-point stencil application on a 2D grid. The appli-cation uses the CHARM++ parallel programming frameworkfor parallelization. The grid is divided into multiple smallblocks, each is represented as an object. We use multipledifferent grid sizes and block sizes in our experiments. Foreach iteration, the application executes in 3 stages, i.e. lo-cal computation, neighbor communication and barrier-basedsynchronization.
3.3. Measurement Methodology
We sample the time, hardware counters, temperature andpower every 10 matrix multiply iterations for NAIVE-DGEMM and 100 iterations for MKL-DGEMM. This makesthe sampling time roughly 20 milliseconds. For other bench-marks we do 1 second periodic measurements through anexternal module. The temperature and power measurementsare specific to Edison.
Frequency Measurements: We use PAPI [10] to read thehardware counters. Specifically, we measure the total clockcycles, reference clock cycles, and cache misses. Total cy-cles (PAPI TOT CYC) “measure the number of cycles re-quired to do a fixed amount of work” and reference clockcycles (PAPI REF CYC) “measure the number of cycles ata constant reference clock rate, independent of the actualclock rate of the core” [6]. We use the total and refer-ence cycles to calculate the cycle ratio (PAPI TOT CYC /PAPI REF CYC). The cycle ratio gives us the effective clockrate of the processor. If the ratio is greater than one, it meansthe processor is running above the nominal speed and belowmeans slower than the nominal speed. When running a work-load under Turbo Boost this ratio is typically greater than one.On the other hand, if the processor is idle this ratio will typ-ically be less than one [6]. In summary, we can obtain theclock frequency of the processor using the following formula:
Freqeffective = Freqnominal ×TotalCycles
ReferenceCycles
Temperature Measurements on Edison: Edison usershave read access to the temperature data of the cores throughthe /sys/devices/platform/coretemp interface.
Power Measurements on Edison: Edison allows readaccess to node level power meters for all users through thefile: /sys/cray/pm_counters/power or using PAPI‘native’ counters. We use the first option to get each computenode’s power consumption. The power measurements areavailable as the whole compute node’s power (CPUs, RAM,
and all other components) in watts. These meters read outwith an apparent 4 W resolution. Cab, Stampede and BlueWaters do not provide an application-accessible interface toaccess power consumption without a specific privilage.
We note that the CPUs in Edison, Cab and Stampede havemodel-specific registers (MSRs) that report CPU-level powerand energy measurements. However, these are only accessi-ble to OS kernel code or processes running with administra-tive privileges. We discuss this limitation further in Section 5.
3.4. Eliminating OS Interference
Operating systems and other extraneous processes can inducesignificant noise into the application [23]. On Edison andBlue Waters, we eliminate the effect of OS interference bybinding all the OS processes to one core using the processlauncher option aprun -r 1. From our observations, thesesystems use the last core in each node to satisfy this option.We then report measurements focusing on core 0 in each chipto avoid the effect of those OS processes. Cab and Stampededo not provide such an option.
3.5. Turbo Boost and Frequency
On the Intel Ivy Bridge EP processors found in Edison, thereare two ways in which the observed operating frequency ofa chip can differ from the nominal 2.4 GHz for which theyare rated. P-states are software controlled, and Turbo Boostis hardware controlled within the limits of software-providedparameters and hardware constraints.
The software-driven P-state variable can be used to setthe desired baseline frequency, ranging from 1.2 GHz to 2.4GHz in increments of 100 MHz [4]. Various experimentshave used this control in HPC runtime system, job scheduler,and resource manager software to optimize for energy usage,temperature, reliability, and performance under resource con-straints [14, 18, 27]. On Edison, users can only set a uni-form P-state across all nodes for the duration of a job usingthe aprun --pstate flag when launching compute pro-cesses. For the results examined in this paper, we use onlythe default maximum setting of this variable except in Sec-tion 6.1.
Intel Turbo Boost provides dynamic hardware-driven op-eration at frequencies above the baseline frequency requestedby the P-state setting. All active cores within a chip operateat the same frequency. Software settings can bound the al-lowed range of frequency values that Turbo Boost can select,but none of the platforms currently allows users to controlthis. The hardware constraints are based on limits of operat-ing temperature (max of 76◦ C), keeping power consumptionbelow TDP, and current draw (value not documented in avail-able sources) [4]. At 1 ms intervals, the hardware controllerexamines sensor values for these parameters and adjusts ac-cordingly: if any limit is exceeded, then the CPU slows down100 MHz; if no limit is exceeded and the frequency is belowthe maximum, then the CPU speeds up 100 MHz.
4
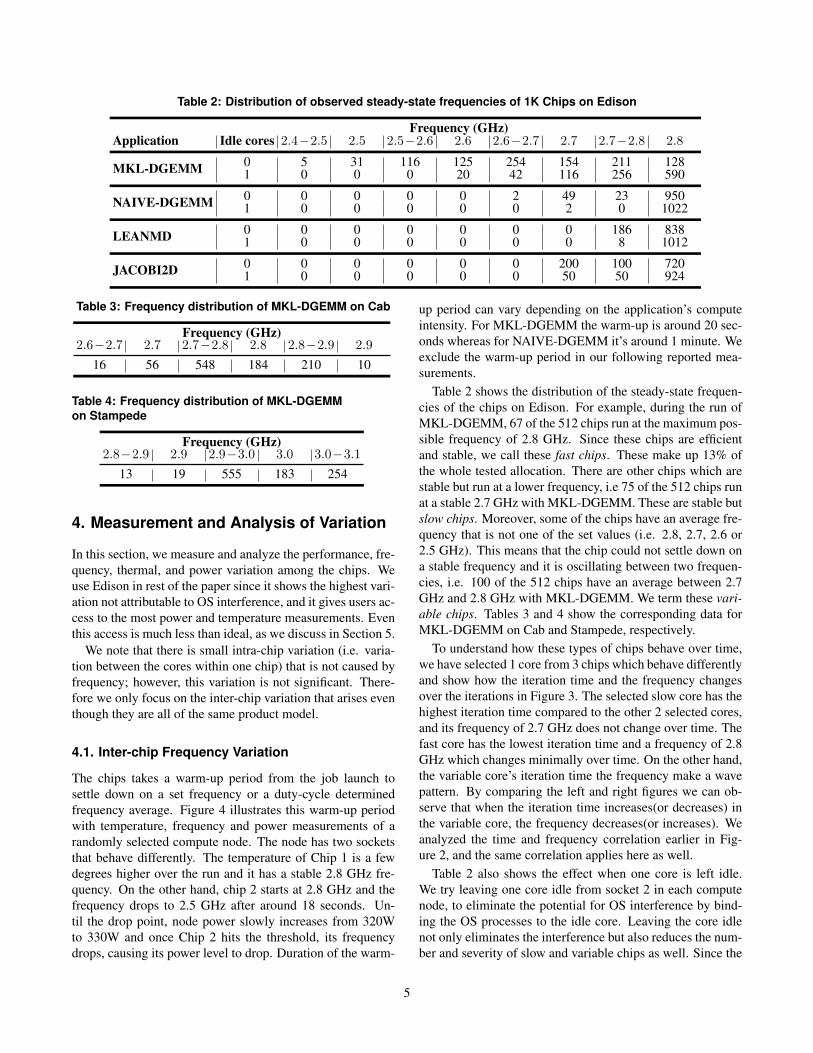
Table 2: Distribution of observed steady-state frequencies of 1K Chips on Edison
Frequency (GHz)Application Idle cores 2.4−2.5 2.5 2.5−2.6 2.6 2.6−2.7 2.7 2.7−2.8 2.8
MKL-DGEMM 0 5 31 116 125 254 154 211 1281 0 0 0 20 42 116 256 590
NAIVE-DGEMM 0 0 0 0 0 2 49 23 9501 0 0 0 0 0 2 0 1022
LEANMD 0 0 0 0 0 0 0 186 8381 0 0 0 0 0 0 8 1012
JACOBI2D 0 0 0 0 0 0 200 100 7201 0 0 0 0 0 50 50 924
Table 3: Frequency distribution of MKL-DGEMM on Cab
Frequency (GHz)2.6−2.7 2.7 2.7−2.8 2.8 2.8−2.9 2.9
16 56 548 184 210 10
Table 4: Frequency distribution of MKL-DGEMMon Stampede
Frequency (GHz)2.8−2.9 2.9 2.9−3.0 3.0 3.0−3.1
13 19 555 183 254
4. Measurement and Analysis of Variation
In this section, we measure and analyze the performance, fre-quency, thermal, and power variation among the chips. Weuse Edison in rest of the paper since it shows the highest vari-ation not attributable to OS interference, and it gives users ac-cess to the most power and temperature measurements. Eventhis access is much less than ideal, as we discuss in Section 5.
We note that there is small intra-chip variation (i.e. varia-tion between the cores within one chip) that is not caused byfrequency; however, this variation is not significant. There-fore we only focus on the inter-chip variation that arises eventhough they are all of the same product model.
4.1. Inter-chip Frequency Variation
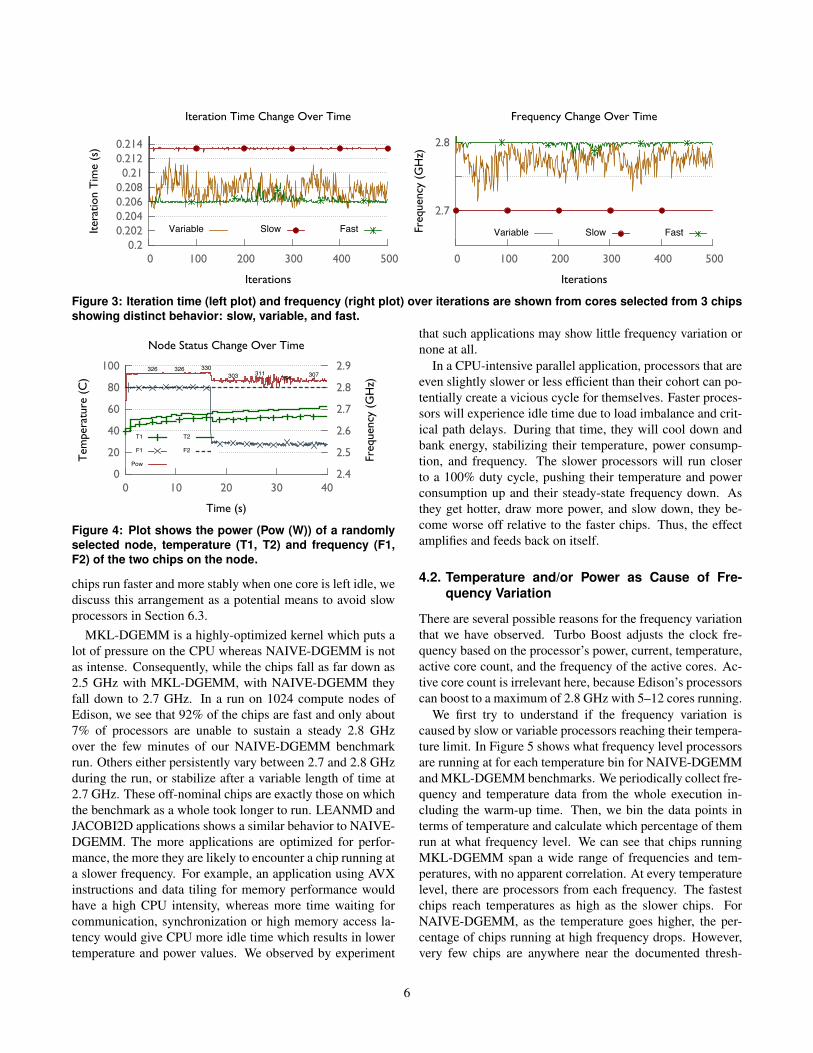
The chips takes a warm-up period from the job launch tosettle down on a set frequency or a duty-cycle determinedfrequency average. Figure 4 illustrates this warm-up periodwith temperature, frequency and power measurements of arandomly selected compute node. The node has two socketsthat behave differently. The temperature of Chip 1 is a fewdegrees higher over the run and it has a stable 2.8 GHz fre-quency. On the other hand, chip 2 starts at 2.8 GHz and thefrequency drops to 2.5 GHz after around 18 seconds. Un-til the drop point, node power slowly increases from 320Wto 330W and once Chip 2 hits the threshold, its frequencydrops, causing its power level to drop. Duration of the warm-
up period can vary depending on the application’s computeintensity. For MKL-DGEMM the warm-up is around 20 sec-onds whereas for NAIVE-DGEMM it’s around 1 minute. Weexclude the warm-up period in our following reported mea-surements.
Table 2 shows the distribution of the steady-state frequen-cies of the chips on Edison. For example, during the run ofMKL-DGEMM, 67 of the 512 chips run at the maximum pos-sible frequency of 2.8 GHz. Since these chips are efficientand stable, we call these fast chips. These make up 13% ofthe whole tested allocation. There are other chips which arestable but run at a lower frequency, i.e 75 of the 512 chips runat a stable 2.7 GHz with MKL-DGEMM. These are stable butslow chips. Moreover, some of the chips have an average fre-quency that is not one of the set values (i.e. 2.8, 2.7, 2.6 or2.5 GHz). This means that the chip could not settle down ona stable frequency and it is oscillating between two frequen-cies, i.e. 100 of the 512 chips have an average between 2.7GHz and 2.8 GHz with MKL-DGEMM. We term these vari-able chips. Tables 3 and 4 show the corresponding data forMKL-DGEMM on Cab and Stampede, respectively.
To understand how these types of chips behave over time,we have selected 1 core from 3 chips which behave differentlyand show how the iteration time and the frequency changesover the iterations in Figure 3. The selected slow core has thehighest iteration time compared to the other 2 selected cores,and its frequency of 2.7 GHz does not change over time. Thefast core has the lowest iteration time and a frequency of 2.8GHz which changes minimally over time. On the other hand,the variable core’s iteration time the frequency make a wavepattern. By comparing the left and right figures we can ob-serve that when the iteration time increases(or decreases) inthe variable core, the frequency decreases(or increases). Weanalyzed the time and frequency correlation earlier in Fig-ure 2, and the same correlation applies here as well.
Table 2 also shows the effect when one core is left idle.We try leaving one core idle from socket 2 in each computenode, to eliminate the potential for OS interference by bind-ing the OS processes to the idle core. Leaving the core idlenot only eliminates the interference but also reduces the num-ber and severity of slow and variable chips as well. Since the
5
���������������������������������������������
�� ���� ���� ���� ���� ����
������������������
����������
�������������������������������
�������� ���� ����
���
���
�� ���� ���� ���� ���� ����
���������������
����������
��������������������������
�������� ���� ����
Figure 3: Iteration time (left plot) and frequency (right plot) over iterations are shown from cores selected from 3 chipsshowing distinct behavior: slow, variable, and fast.
��
���
���
���
���
����
� �� �� �� ������
����
����
����
����
����
���������������
���������������
��������
����������������������������
��
��
���
��� ��� ���
��� ������
���
��
��
Figure 4: Plot shows the power (Pow (W)) of a randomlyselected node, temperature (T1, T2) and frequency (F1,F2) of the two chips on the node.
chips run faster and more stably when one core is left idle, wediscuss this arrangement as a potential means to avoid slowprocessors in Section 6.3.
MKL-DGEMM is a highly-optimized kernel which puts alot of pressure on the CPU whereas NAIVE-DGEMM is notas intense. Consequently, while the chips fall as far down as2.5 GHz with MKL-DGEMM, with NAIVE-DGEMM theyfall down to 2.7 GHz. In a run on 1024 compute nodes ofEdison, we see that 92% of the chips are fast and only about7% of processors are unable to sustain a steady 2.8 GHzover the few minutes of our NAIVE-DGEMM benchmarkrun. Others either persistently vary between 2.7 and 2.8 GHzduring the run, or stabilize after a variable length of time at2.7 GHz. These off-nominal chips are exactly those on whichthe benchmark as a whole took longer to run. LEANMD andJACOBI2D applications shows a similar behavior to NAIVE-DGEMM. The more applications are optimized for perfor-mance, the more they are likely to encounter a chip running ata slower frequency. For example, an application using AVXinstructions and data tiling for memory performance wouldhave a high CPU intensity, whereas more time waiting forcommunication, synchronization or high memory access la-tency would give CPU more idle time which results in lowertemperature and power values. We observed by experiment
that such applications may show little frequency variation ornone at all.
In a CPU-intensive parallel application, processors that areeven slightly slower or less efficient than their cohort can po-tentially create a vicious cycle for themselves. Faster proces-sors will experience idle time due to load imbalance and crit-ical path delays. During that time, they will cool down andbank energy, stabilizing their temperature, power consump-tion, and frequency. The slower processors will run closerto a 100% duty cycle, pushing their temperature and powerconsumption up and their steady-state frequency down. Asthey get hotter, draw more power, and slow down, they be-come worse off relative to the faster chips. Thus, the effectamplifies and feeds back on itself.
4.2. Temperature and/or Power as Cause of Fre-quency Variation
There are several possible reasons for the frequency variationthat we have observed. Turbo Boost adjusts the clock fre-quency based on the processor’s power, current, temperature,active core count, and the frequency of the active cores. Ac-tive core count is irrelevant here, because Edison’s processorscan boost to a maximum of 2.8 GHz with 5–12 cores running.
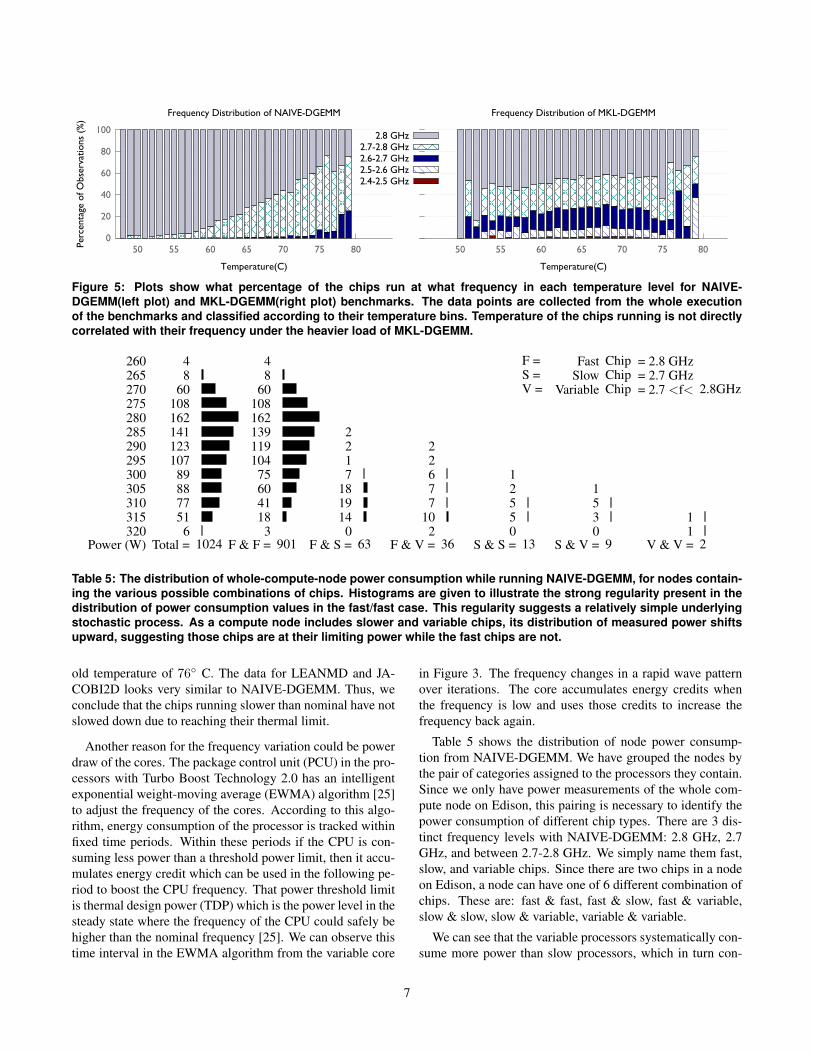
We first try to understand if the frequency variation iscaused by slow or variable processors reaching their tempera-ture limit. In Figure 5 shows what frequency level processorsare running at for each temperature bin for NAIVE-DGEMMand MKL-DGEMM benchmarks. We periodically collect fre-quency and temperature data from the whole execution in-cluding the warm-up time. Then, we bin the data points interms of temperature and calculate which percentage of themrun at what frequency level. We can see that chips runningMKL-DGEMM span a wide range of frequencies and tem-peratures, with no apparent correlation. At every temperaturelevel, there are processors from each frequency. The fastestchips reach temperatures as high as the slower chips. ForNAIVE-DGEMM, as the temperature goes higher, the per-centage of chips running at high frequency drops. However,very few chips are anywhere near the documented thresh-
6
��
���
���
���
���
����
�� �� �� �� �� �� ��������������������������������
��������������
�������������������������������������
���������������������������������������������������
�� �� �� �� �� �� ��
��������������
�����������������������������������
Figure 5: Plots show what percentage of the chips run at what frequency in each temperature level for NAIVE-DGEMM(left plot) and MKL-DGEMM(right plot) benchmarks. The data points are collected from the whole executionof the benchmarks and classified according to their temperature bins. Temperature of the chips running is not directlycorrelated with their frequency under the heavier load of MKL-DGEMM.
260 4 4 F = Fast Chip = 2.8 GHz265 8 8 S = Slow Chip = 2.7 GHz270 60 60 V = Variable Chip = 2.7 <f< 2.8GHz275 108 108280 162 162285 141 139 2290 123 119 2 2295 107 104 1 2300 89 75 7 6 1305 88 60 18 7 2 1310 77 41 19 7 5 5315 51 18 14 10 5 3 1320 6 3 0 2 0 0 1
Power (W) Total = 1024 F & F = 901 F & S = 63 F & V = 36 S & S = 13 S & V = 9 V & V = 2
Table 5: The distribution of whole-compute-node power consumption while running NAIVE-DGEMM, for nodes contain-ing the various possible combinations of chips. Histograms are given to illustrate the strong regularity present in thedistribution of power consumption values in the fast/fast case. This regularity suggests a relatively simple underlyingstochastic process. As a compute node includes slower and variable chips, its distribution of measured power shiftsupward, suggesting those chips are at their limiting power while the fast chips are not.
old temperature of 76◦ C. The data for LEANMD and JA-COBI2D looks very similar to NAIVE-DGEMM. Thus, weconclude that the chips running slower than nominal have notslowed down due to reaching their thermal limit.
Another reason for the frequency variation could be powerdraw of the cores. The package control unit (PCU) in the pro-cessors with Turbo Boost Technology 2.0 has an intelligentexponential weight-moving average (EWMA) algorithm [25]to adjust the frequency of the cores. According to this algo-rithm, energy consumption of the processor is tracked withinfixed time periods. Within these periods if the CPU is con-suming less power than a threshold power limit, then it accu-mulates energy credit which can be used in the following pe-riod to boost the CPU frequency. That power threshold limitis thermal design power (TDP) which is the power level in thesteady state where the frequency of the CPU could safely behigher than the nominal frequency [25]. We can observe thistime interval in the EWMA algorithm from the variable core
in Figure 3. The frequency changes in a rapid wave patternover iterations. The core accumulates energy credits whenthe frequency is low and uses those credits to increase thefrequency back again.
Table 5 shows the distribution of node power consump-tion from NAIVE-DGEMM. We have grouped the nodes bythe pair of categories assigned to the processors they contain.Since we only have power measurements of the whole com-pute node on Edison, this pairing is necessary to identify thepower consumption of different chip types. There are 3 dis-tinct frequency levels with NAIVE-DGEMM: 2.8 GHz, 2.7GHz, and between 2.7-2.8 GHz. We simply name them fast,slow, and variable chips. Since there are two chips in a nodeon Edison, a node can have one of 6 different combination ofchips. These are: fast & fast, fast & slow, fast & variable,slow & slow, slow & variable, variable & variable.
We can see that the variable processors systematically con-sume more power than slow processors, which in turn con-
7
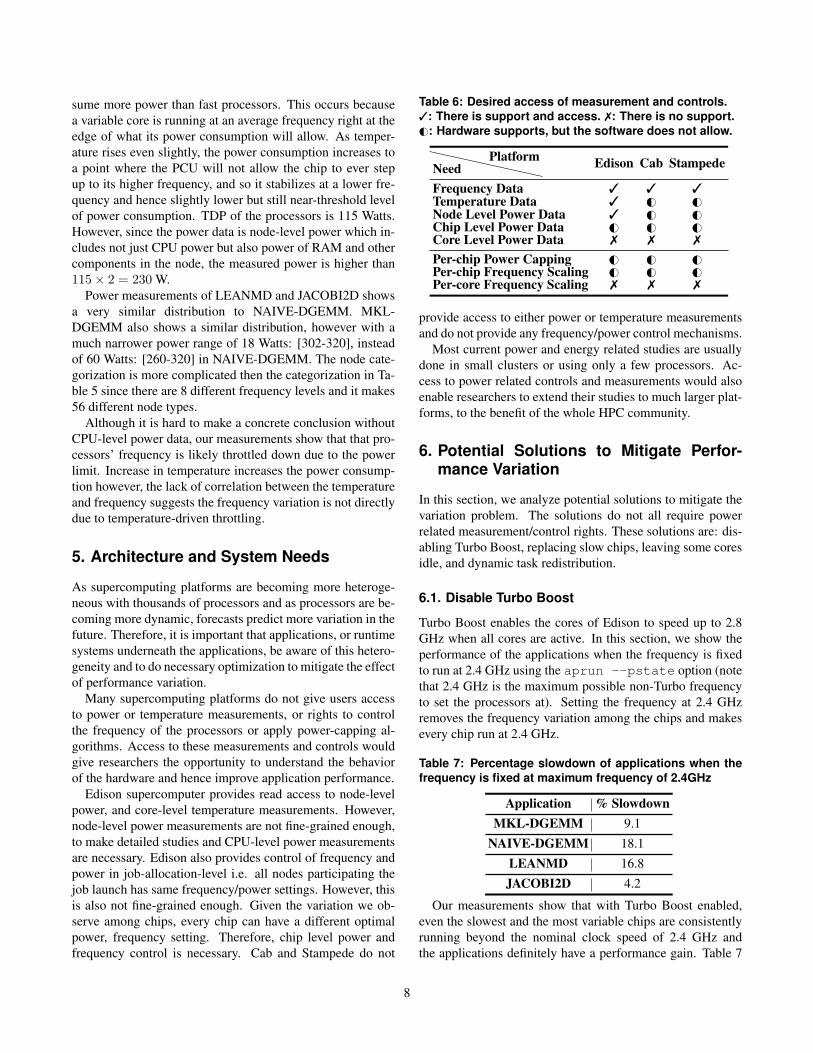
sume more power than fast processors. This occurs becausea variable core is running at an average frequency right at theedge of what its power consumption will allow. As temper-ature rises even slightly, the power consumption increases toa point where the PCU will not allow the chip to ever stepup to its higher frequency, and so it stabilizes at a lower fre-quency and hence slightly lower but still near-threshold levelof power consumption. TDP of the processors is 115 Watts.However, since the power data is node-level power which in-cludes not just CPU power but also power of RAM and othercomponents in the node, the measured power is higher than115× 2 = 230 W.
Power measurements of LEANMD and JACOBI2D showsa very similar distribution to NAIVE-DGEMM. MKL-DGEMM also shows a similar distribution, however with amuch narrower power range of 18 Watts: [302-320], insteadof 60 Watts: [260-320] in NAIVE-DGEMM. The node cate-gorization is more complicated then the categorization in Ta-ble 5 since there are 8 different frequency levels and it makes56 different node types.
Although it is hard to make a concrete conclusion withoutCPU-level power data, our measurements show that that pro-cessors’ frequency is likely throttled down due to the powerlimit. Increase in temperature increases the power consump-tion however, the lack of correlation between the temperatureand frequency suggests the frequency variation is not directlydue to temperature-driven throttling.
5. Architecture and System Needs
As supercomputing platforms are becoming more heteroge-neous with thousands of processors and as processors are be-coming more dynamic, forecasts predict more variation in thefuture. Therefore, it is important that applications, or runtimesystems underneath the applications, be aware of this hetero-geneity and to do necessary optimization to mitigate the effectof performance variation.
Many supercomputing platforms do not give users accessto power or temperature measurements, or rights to controlthe frequency of the processors or apply power-capping al-gorithms. Access to these measurements and controls wouldgive researchers the opportunity to understand the behaviorof the hardware and hence improve application performance.
Edison supercomputer provides read access to node-levelpower, and core-level temperature measurements. However,node-level power measurements are not fine-grained enough,to make detailed studies and CPU-level power measurementsare necessary. Edison also provides control of frequency andpower in job-allocation-level i.e. all nodes participating thejob launch has same frequency/power settings. However, thisis also not fine-grained enough. Given the variation we ob-serve among chips, every chip can have a different optimalpower, frequency setting. Therefore, chip level power andfrequency control is necessary. Cab and Stampede do not
Table 6: Desired access of measurement and controls.3: There is support and access. 7: There is no support.G#: Hardware supports, but the software does not allow.
NeedPlatform Edison Cab Stampede
Frequency Data 3 3 3Temperature Data 3 G# G#Node Level Power Data 3 G# G#Chip Level Power Data G# G# G#Core Level Power Data 7 7 7
Per-chip Power Capping G# G# G#Per-chip Frequency Scaling G# G# G#Per-core Frequency Scaling 7 7 7
provide access to either power or temperature measurementsand do not provide any frequency/power control mechanisms.
Most current power and energy related studies are usuallydone in small clusters or using only a few processors. Ac-cess to power related controls and measurements would alsoenable researchers to extend their studies to much larger plat-forms, to the benefit of the whole HPC community.
6. Potential Solutions to Mitigate Perfor-mance Variation
In this section, we analyze potential solutions to mitigate thevariation problem. The solutions do not all require powerrelated measurement/control rights. These solutions are: dis-abling Turbo Boost, replacing slow chips, leaving some coresidle, and dynamic task redistribution.
6.1. Disable Turbo Boost
Turbo Boost enables the cores of Edison to speed up to 2.8GHz when all cores are active. In this section, we show theperformance of the applications when the frequency is fixedto run at 2.4 GHz using the aprun --pstate option (notethat 2.4 GHz is the maximum possible non-Turbo frequencyto set the processors at). Setting the frequency at 2.4 GHzremoves the frequency variation among the chips and makesevery chip run at 2.4 GHz.
Table 7: Percentage slowdown of applications when thefrequency is fixed at maximum frequency of 2.4GHz
Application % SlowdownMKL-DGEMM 9.1
NAIVE-DGEMM 18.1
LEANMD 16.8
JACOBI2D 4.2
Our measurements show that with Turbo Boost enabled,even the slowest and the most variable chips are consistentlyrunning beyond the nominal clock speed of 2.4 GHz andthe applications definitely have a performance gain. Table 7
8
��������������������������������������
�� ���� ���� ���� ���� ���� ���� ���� ���� ����
�����������������������
��������������������������
������������������������������������
��������������������
��������������
����������
������
�� ���� ���� ���� ���� ���� ���� ���� ���� ����
�����������
��������������������������
������������������������������������
��������������������
��������������
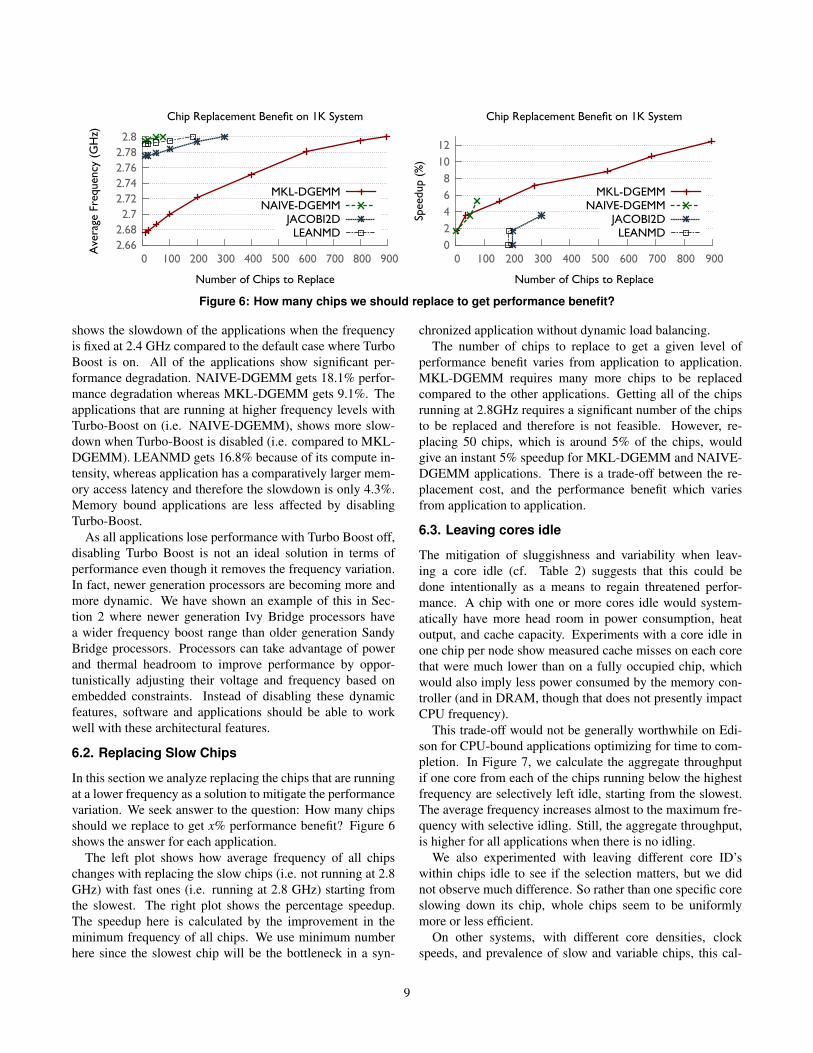
Figure 6: How many chips we should replace to get performance benefit?
shows the slowdown of the applications when the frequencyis fixed at 2.4 GHz compared to the default case where TurboBoost is on. All of the applications show significant per-formance degradation. NAIVE-DGEMM gets 18.1% perfor-mance degradation whereas MKL-DGEMM gets 9.1%. Theapplications that are running at higher frequency levels withTurbo-Boost on (i.e. NAIVE-DGEMM), shows more slow-down when Turbo-Boost is disabled (i.e. compared to MKL-DGEMM). LEANMD gets 16.8% because of its compute in-tensity, whereas application has a comparatively larger mem-ory access latency and therefore the slowdown is only 4.3%.Memory bound applications are less affected by disablingTurbo-Boost.
As all applications lose performance with Turbo Boost off,disabling Turbo Boost is not an ideal solution in terms ofperformance even though it removes the frequency variation.In fact, newer generation processors are becoming more andmore dynamic. We have shown an example of this in Sec-tion 2 where newer generation Ivy Bridge processors havea wider frequency boost range than older generation SandyBridge processors. Processors can take advantage of powerand thermal headroom to improve performance by oppor-tunistically adjusting their voltage and frequency based onembedded constraints. Instead of disabling these dynamicfeatures, software and applications should be able to workwell with these architectural features.
6.2. Replacing Slow Chips
In this section we analyze replacing the chips that are runningat a lower frequency as a solution to mitigate the performancevariation. We seek answer to the question: How many chipsshould we replace to get x% performance benefit? Figure 6shows the answer for each application.
The left plot shows how average frequency of all chipschanges with replacing the slow chips (i.e. not running at 2.8GHz) with fast ones (i.e. running at 2.8 GHz) starting fromthe slowest. The right plot shows the percentage speedup.The speedup here is calculated by the improvement in theminimum frequency of all chips. We use minimum numberhere since the slowest chip will be the bottleneck in a syn-
chronized application without dynamic load balancing.The number of chips to replace to get a given level of
performance benefit varies from application to application.MKL-DGEMM requires many more chips to be replacedcompared to the other applications. Getting all of the chipsrunning at 2.8GHz requires a significant number of the chipsto be replaced and therefore is not feasible. However, re-placing 50 chips, which is around 5% of the chips, wouldgive an instant 5% speedup for MKL-DGEMM and NAIVE-DGEMM applications. There is a trade-off between the re-placement cost, and the performance benefit which variesfrom application to application.
6.3. Leaving cores idle
The mitigation of sluggishness and variability when leav-ing a core idle (cf. Table 2) suggests that this could bedone intentionally as a means to regain threatened perfor-mance. A chip with one or more cores idle would system-atically have more head room in power consumption, heatoutput, and cache capacity. Experiments with a core idle inone chip per node show measured cache misses on each corethat were much lower than on a fully occupied chip, whichwould also imply less power consumed by the memory con-troller (and in DRAM, though that does not presently impactCPU frequency).
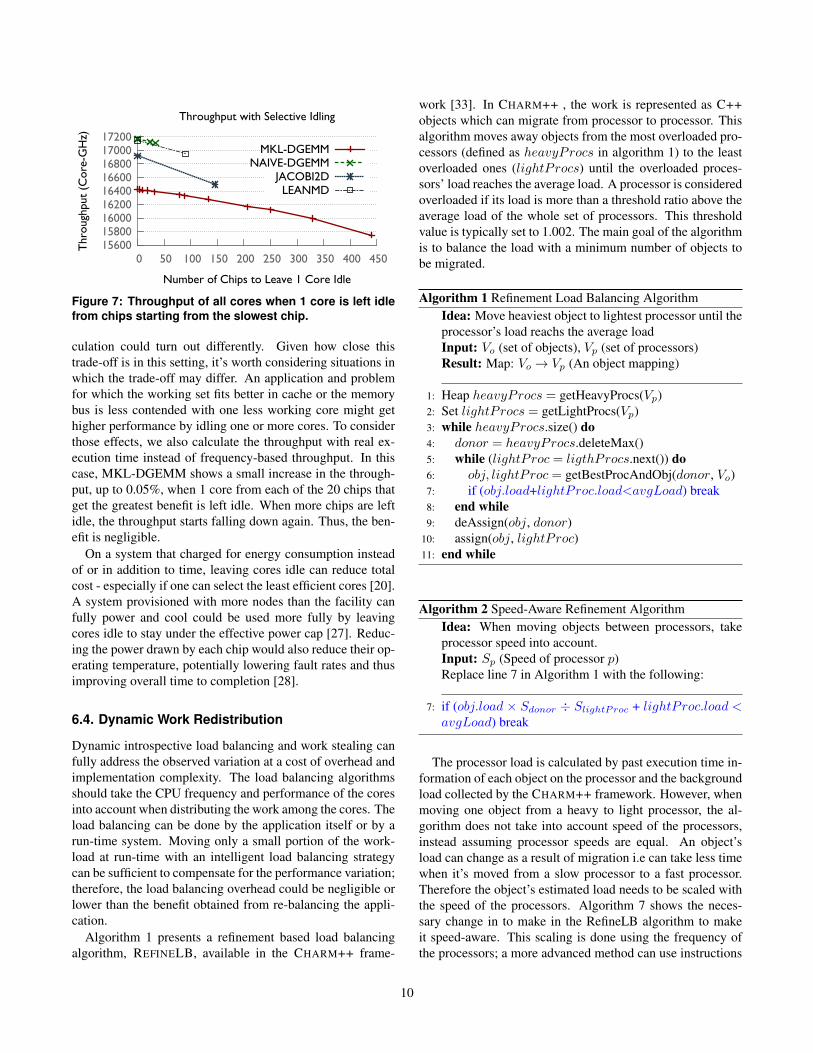
This trade-off would not be generally worthwhile on Edi-son for CPU-bound applications optimizing for time to com-pletion. In Figure 7, we calculate the aggregate throughputif one core from each of the chips running below the highestfrequency are selectively left idle, starting from the slowest.The average frequency increases almost to the maximum fre-quency with selective idling. Still, the aggregate throughput,is higher for all applications when there is no idling.
We also experimented with leaving different core ID’swithin chips idle to see if the selection matters, but we didnot observe much difference. So rather than one specific coreslowing down its chip, whole chips seem to be uniformlymore or less efficient.
On other systems, with different core densities, clockspeeds, and prevalence of slow and variable chips, this cal-
9
������������������������������������������������������
�� ��� ���� ���� ���� ���� ���� ���� ���� ����
���������������������
������������������������������������
��������������������������������
��������������������
��������������
Figure 7: Throughput of all cores when 1 core is left idlefrom chips starting from the slowest chip.
culation could turn out differently. Given how close thistrade-off is in this setting, it’s worth considering situations inwhich the trade-off may differ. An application and problemfor which the working set fits better in cache or the memorybus is less contended with one less working core might gethigher performance by idling one or more cores. To considerthose effects, we also calculate the throughput with real ex-ecution time instead of frequency-based throughput. In thiscase, MKL-DGEMM shows a small increase in the through-put, up to 0.05%, when 1 core from each of the 20 chips thatget the greatest benefit is left idle. When more chips are leftidle, the throughput starts falling down again. Thus, the ben-efit is negligible.
On a system that charged for energy consumption insteadof or in addition to time, leaving cores idle can reduce totalcost - especially if one can select the least efficient cores [20].A system provisioned with more nodes than the facility canfully power and cool could be used more fully by leavingcores idle to stay under the effective power cap [27]. Reduc-ing the power drawn by each chip would also reduce their op-erating temperature, potentially lowering fault rates and thusimproving overall time to completion [28].
6.4. Dynamic Work Redistribution
Dynamic introspective load balancing and work stealing canfully address the observed variation at a cost of overhead andimplementation complexity. The load balancing algorithmsshould take the CPU frequency and performance of the coresinto account when distributing the work among the cores. Theload balancing can be done by the application itself or by arun-time system. Moving only a small portion of the work-load at run-time with an intelligent load balancing strategycan be sufficient to compensate for the performance variation;therefore, the load balancing overhead could be negligible orlower than the benefit obtained from re-balancing the appli-cation.
Algorithm 1 presents a refinement based load balancingalgorithm, REFINELB, available in the CHARM++ frame-
work [33]. In CHARM++ , the work is represented as C++objects which can migrate from processor to processor. Thisalgorithm moves away objects from the most overloaded pro-cessors (defined as heavyProcs in algorithm 1) to the leastoverloaded ones (lightProcs) until the overloaded proces-sors’ load reaches the average load. A processor is consideredoverloaded if its load is more than a threshold ratio above theaverage load of the whole set of processors. This thresholdvalue is typically set to 1.002. The main goal of the algorithmis to balance the load with a minimum number of objects tobe migrated.
Algorithm 1 Refinement Load Balancing AlgorithmIdea: Move heaviest object to lightest processor until theprocessor’s load reachs the average loadInput: Vo (set of objects), Vp (set of processors)Result: Map: Vo→ Vp (An object mapping)
1: Heap heavyProcs = getHeavyProcs(Vp)2: Set lightProcs = getLightProcs(Vp)3: while heavyProcs.size() do4: donor = heavyProcs.deleteMax()5: while (lightProc = ligthProcs.next()) do6: obj, lightProc = getBestProcAndObj(donor, Vo)7: if (obj.load+lightProc.load<avgLoad) break8: end while9: deAssign(obj, donor)
10: assign(obj, lightProc)11: end while
Algorithm 2 Speed-Aware Refinement AlgorithmIdea: When moving objects between processors, takeprocessor speed into account.Input: Sp (Speed of processor p)Replace line 7 in Algorithm 1 with the following:
7: if (obj.load × Sdonor ÷ SlightProc + lightProc.load <avgLoad) break
The processor load is calculated by past execution time in-formation of each object on the processor and the backgroundload collected by the CHARM++ framework. However, whenmoving one object from a heavy to light processor, the al-gorithm does not take into account speed of the processors,instead assuming processor speeds are equal. An object’sload can change as a result of migration i.e can take less timewhen it’s moved from a slow processor to a fast processor.Therefore the object’s estimated load needs to be scaled withthe speed of the processors. Algorithm 7 shows the neces-sary change in to make in the RefineLB algorithm to makeit speed-aware. This scaling is done using the frequency ofthe processors; a more advanced method can use instructions
10
��
��
���
���
���
������ ��������
�����������
��������������������������
��������������������������
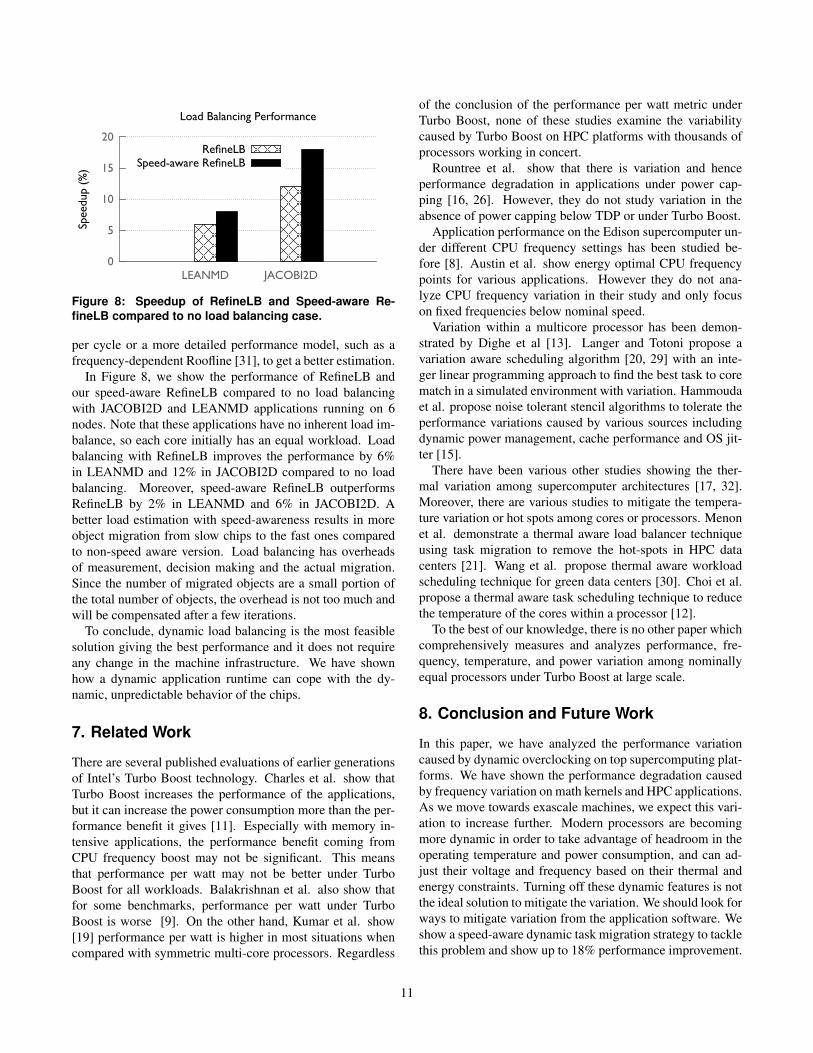
Figure 8: Speedup of RefineLB and Speed-aware Re-fineLB compared to no load balancing case.
per cycle or a more detailed performance model, such as afrequency-dependent Roofline [31], to get a better estimation.
In Figure 8, we show the performance of RefineLB andour speed-aware RefineLB compared to no load balancingwith JACOBI2D and LEANMD applications running on 6nodes. Note that these applications have no inherent load im-balance, so each core initially has an equal workload. Loadbalancing with RefineLB improves the performance by 6%in LEANMD and 12% in JACOBI2D compared to no loadbalancing. Moreover, speed-aware RefineLB outperformsRefineLB by 2% in LEANMD and 6% in JACOBI2D. Abetter load estimation with speed-awareness results in moreobject migration from slow chips to the fast ones comparedto non-speed aware version. Load balancing has overheadsof measurement, decision making and the actual migration.Since the number of migrated objects are a small portion ofthe total number of objects, the overhead is not too much andwill be compensated after a few iterations.
To conclude, dynamic load balancing is the most feasiblesolution giving the best performance and it does not requireany change in the machine infrastructure. We have shownhow a dynamic application runtime can cope with the dy-namic, unpredictable behavior of the chips.
7. Related Work
There are several published evaluations of earlier generationsof Intel’s Turbo Boost technology. Charles et al. show thatTurbo Boost increases the performance of the applications,but it can increase the power consumption more than the per-formance benefit it gives [11]. Especially with memory in-tensive applications, the performance benefit coming fromCPU frequency boost may not be significant. This meansthat performance per watt may not be better under TurboBoost for all workloads. Balakrishnan et al. also show thatfor some benchmarks, performance per watt under TurboBoost is worse [9]. On the other hand, Kumar et al. show[19] performance per watt is higher in most situations whencompared with symmetric multi-core processors. Regardless
of the conclusion of the performance per watt metric underTurbo Boost, none of these studies examine the variabilitycaused by Turbo Boost on HPC platforms with thousands ofprocessors working in concert.
Rountree et al. show that there is variation and henceperformance degradation in applications under power cap-ping [16, 26]. However, they do not study variation in theabsence of power capping below TDP or under Turbo Boost.
Application performance on the Edison supercomputer un-der different CPU frequency settings has been studied be-fore [8]. Austin et al. show energy optimal CPU frequencypoints for various applications. However they do not ana-lyze CPU frequency variation in their study and only focuson fixed frequencies below nominal speed.
Variation within a multicore processor has been demon-strated by Dighe et al [13]. Langer and Totoni propose avariation aware scheduling algorithm [20, 29] with an inte-ger linear programming approach to find the best task to corematch in a simulated environment with variation. Hammoudaet al. propose noise tolerant stencil algorithms to tolerate theperformance variations caused by various sources includingdynamic power management, cache performance and OS jit-ter [15].
There have been various other studies showing the ther-mal variation among supercomputer architectures [17, 32].Moreover, there are various studies to mitigate the tempera-ture variation or hot spots among cores or processors. Menonet al. demonstrate a thermal aware load balancer techniqueusing task migration to remove the hot-spots in HPC datacenters [21]. Wang et al. propose thermal aware workloadscheduling technique for green data centers [30]. Choi et al.propose a thermal aware task scheduling technique to reducethe temperature of the cores within a processor [12].
To the best of our knowledge, there is no other paper whichcomprehensively measures and analyzes performance, fre-quency, temperature, and power variation among nominallyequal processors under Turbo Boost at large scale.
8. Conclusion and Future Work
In this paper, we have analyzed the performance variationcaused by dynamic overclocking on top supercomputing plat-forms. We have shown the performance degradation causedby frequency variation on math kernels and HPC applications.As we move towards exascale machines, we expect this vari-ation to increase further. Modern processors are becomingmore dynamic in order to take advantage of headroom in theoperating temperature and power consumption, and can ad-just their voltage and frequency based on their thermal andenergy constraints. Turning off these dynamic features is notthe ideal solution to mitigate the variation. We should look forways to mitigate variation from the application software. Weshow a speed-aware dynamic task migration strategy to tacklethis problem and show up to 18% performance improvement.
11
References
[1] Cab supercomputer at LLNL. https://computing.llnl.gov/tutorials/bgq/https://computing.llnl.gov/?set=resources&page=OCF_resources#cab.
[2] Edison Supercomputer at NERSC.https://www.nersc.gov/users/computational-systems/edison/.
[3] Intel Turbo Boost Technology 2.0. http://www.intel.com/content/www/us/en/architecture-and-technology/turbo-boost/turbo-boost-technology.html.
[4] Intel Xeon Processor E5 v2 Product Family,Specification Update. http://www.intel.com/content/dam/www/public/us/en/documents/specification-updates/xeon-e5-v2-spec-update.pdf.
[5] Lenovo showcases high-performance com-puting innovations at supercomputing 2014.http://news.lenovo.com/article_display.cfm?article_id=1865.
[6] PAPI 5.4.1.0, Cycle Ratio. https://icl.cs.utk.edu/papi/docs/da/dab/cycle__ratio_8c_source.html.
[7] Stampede supercomputer at TACC. https://www.tacc.utexas.edu/stampede/.
[8] Brian Austin and Nicholas J Wright. Measurement andinterpretation of microbenchmark and application en-ergy use on the Cray XC30. In Proceedings of the 2NdInternational Workshop on Energy Efficient Supercom-puting, E2SC ’14, pages 51–59, Piscataway, NJ, USA,2014. IEEE.
[9] Ganesh Balakrishnan. Understanding Intel Xeon 5500Turbo Boost Technology. How to Use Turbo BoostTechnology to Your Advantage, IBM, 2009.
[10] S. Browne, J. Dongarra, N. Garner, G. Ho, and P. Mucci.A Portable Programming Interface for PerformanceEvaluation on Modern Processors. Int. J. High Perform.Comput. Appl., 14(3):189–204, 2000.
[11] James Charles, Preet Jassi, Narayan S Ananth, Ab-bas Sadat, and Alexandra Fedorova. Evaluation of theIntel R© Core i7 Turbo Boost feature. In Workload Char-acterization, 2009. IISWC 2009. IEEE InternationalSymposium on, pages 188–197. IEEE, 2009.
[12] Jeonghwan Choi, Chen-Yong Cher, Hubertus Franke,Henrdrik Hamann, Alan Weger, and Pradip Bose.Thermal-aware task scheduling at the system softwarelevel. In Proceedings of the 2007 International Sympo-sium on Low Power Electronics and Design, ISLPED’07, pages 213–218. ACM, 2007.
[13] Saurabh Dighe, Sriram R Vangal, Paolo Aseron, ShasiKumar, Tiju Jacob, Keith A Bowman, Jason Howard,James Tschanz, Vasantha Erraguntla, Nitin Borkar,et al. Within-die variation-aware dynamic-voltage-frequency-scaling with optimal core allocation andthread hopping for the 80-core teraflops processor.Solid-State Circuits, IEEE Journal of, 46(1):184–193,Jan 2011.
[14] Rong Ge, Xizhou Feng, and Kirk W Cameron.Performance-constrained distributed DVS schedulingfor scientific applications on power-aware clusters. InProceedings of the 2005 ACM/IEEE Conference on Su-percomputing, SC ’05, pages 34–, Washington, DC,USA, 2005. IEEE.
[15] Adam Hammouda, Andrew R Siegel, and Stephen FSiegel. Noise-tolerant explicit stencil computations fornonuniform process execution rates. ACM Trans. Par-allel Comput., 2(1):7:1–7:33, April 2015.
[16] Yuichi Inadomi, Tapasya Patki, Koji Inoue, MutsumiAoyagi, Barry Rountree, Martin Schulz, David Lowen-thal, Yasutaka Wada, Keiichiro Fukazawa, MasatsuguUeda, et al. Analyzing and mitigating the impact ofmanufacturing variability in power-constrained super-computing. In Proceedings of the International Con-ference for High Performance Computing, Networking,Storage and Analysis, page 78. ACM, 2015.
[17] Laxmikant Kale, Akhil Langer, and Osman Sarood.Power-aware and Temperature Restrain Modeling forMaximizing Performance and Reliability. In DoE Work-shop on Modeling and Simulation of Exascale Systemsand Applications (MODSIM), Seattle, Washington, Au-gust 2014.
[18] Nandini Kappiah, Vincent W Freeh, and David KLowenthal. Just in time dynamic voltage scaling: Ex-ploiting inter-node slack to save energy in MPI pro-grams. In Proceedings of the 2005 ACM/IEEE Confer-ence on Supercomputing, SC ’05, pages 33–, Washing-ton, DC, USA, 2005. IEEE.
[19] Rakesh Kumar, Keith Farkas, Norman P Jouppi,Parthasarathy Ranganathan, Dean M Tullsen, et al.Single-ISA heterogeneous multi-core architectures:The potential for processor power reduction. In Mi-croarchitecture, 2003. MICRO-36. Proceedings. 36th
12
Annual IEEE/ACM International Symposium on, pages81–92. IEEE, 2003.
[20] Akhil Langer, Ehsan Totoni, Udatta S. Palekar, andLaxmikant V. Kale. Energy-efficient computing forHPC workloads on heterogeneous manycore chips. InProceedings of Programming Models and Applicationson Multicores and Manycores. ACM, 2015.
[21] Harshitha Menon, Bilge Acun, Simon Garcia De Gon-zalo, Osman Sarood, and Laxmikant Kale. Thermalaware automated load balancing for HPC applications.In Cluster Computing (CLUSTER), 2013 IEEE Interna-tional Conference on, pages 1–8. IEEE, 2013.
[22] National Center for SupercomputingApplications. Blue Waters project.http://www.ncsa.illinois.edu/BlueWaters/.
[23] Fabrizio Petrini, Darren Kerbyson, and Scott Pakin.The Case of the Missing Supercomputer Performance:Achieving Optimal Performance on the 8,192 Proces-sors of ASCI Q. In ACM/IEEE SC2003, Phoenix, Ari-zona, November 10–16, 2003.
[24] James C. Phillips, Rosemary Braun, Wei Wang,James Gumbart, Emad Tajkhorshid, Elizabeth Villa,Christophe Chipot, Robert D. Skeel, Laxmikant Kale,and Klaus Schulten. Scalable molecular dynamicswith NAMD. Journal of Computational Chemistry,26(16):1781–1802, 2005.
[25] Efraim Rotem, Alon Naveh, Avinash Ananthakrish-nan, Doron Rajwan, and Eliezer Weissmann. Power-management architecture of the Intel microarchitecturecode-named Sandy Bridge. IEEE Micro, (2):20–27,2012.
[26] Barry Rountree, Dong H Ahn, Bronis R de Supin-ski, David K Lowenthal, and Martin Schulz. BeyondDVFS: A First Look at Performance Under a Hardware-enforced Power Bound. In IEEE 26th International Par-allel and Distributed Processing Symposium Workshops& PhD Forum (IPDPSW), 2012.
[27] Osman Sarood, Akhil Langer, Abhishek Gupta, andLaxmikant V. Kale. Maximizing throughput of over-provisioned HPC data centers under a strict power bud-get. In Proceedings of the International Conferenceon High Performance Computing, Networking, Stor-age and Analysis, SC ’14, New York, NY, USA, 2014.ACM.
[28] Osman Sarood, Esteban Meneses, and L. V. Kale. A‘cool’ way of improving the reliability of HPC ma-chines. In Proceedings of The International Conferencefor High Performance Computing, Networking, Storageand Analysis, Denver, CO, USA, November 2013.
[29] Ehsan Totoni. Power and Energy Management of Mod-ern Architectures in Adaptive HPC Runtime Systems.PhD thesis, Dept. of Computer Science, University ofIllinois, 2014.
[30] Lizhe Wang, Gregor von Laszewski, Jai Dayal, andThomas R Furlani. Thermal aware workload schedulingwith backfilling for green data centers. In PerformanceComputing and Communications Conference (IPCCC),2009 IEEE 28th International, pages 289–296. IEEE,2009.
[31] Samuel Williams, Andrew Waterman, and David Patter-son. Roofline: an insightful visual performance modelfor multicore architectures. Commun. ACM, 52(4):65–76, 2009.
[32] Kaicheng Zhang, Seda Ogrenci-Memik, GokhanMemik, Kazutomo Yoshii, Rajesh Sankaran, and PeteBeckman. Minimizing thermal variation across systemcomponents. In Parallel and Distributed ProcessingSymposium (IPDPS), 2015 IEEE International, pages1139–1148. IEEE, 2015.
[33] Gengbin Zheng. Achieving high performance on ex-tremely large parallel machines: performance predic-tion and load balancing. PhD thesis, Department ofComputer Science, University of Illinois at Urbana-Champaign, 2005.
13
Related Documents