arXiv:astro-ph/0510545v1 19 Oct 2005 Variable Stars in the Large Magellanic Cloud: Discovery of Extragalactic W UMa Binaries 1 Janusz Kaluzny Copernicus Astronomical Center, Bartycka 18, 00-716 Warsaw, Poland [email protected] and Stefan Mochnacki, Slavek M. Rucinski David Dunlap Observatory Department of Astronomy and Astrophysics, University of Toronto P.O.Box 360, Richmond Hill, Ontario, Canada L4C 4Y6 (mochnacki,rucinski)@astro.utoronto.ca ABSTRACT We observed a field in the disk of the LMC on two consecutive nights in search of rapid variable stars. We have found two pulsating stars of type RRab and δ Sct, and four binary stars, among the latter one sdB or CV below the LMC blue Main Sequence and three very close binary systems on the MS. At least one of the MS binaries, and possibly all three, are the first solar-type (W UMa-type) contact binaries to be detected in any extragalactic system and observed to obey the same M V = M V (log P,B − V ) calibration as the Galactic systems. Given the selection effects due to small amplitudes at faint magnitudes, the frequency of such binaries in the disk of the LMC with its large spread in population ages is not inconsistent with that in the disk of our Galaxy, and contrasts with the lack of binaries found in earlier observations of the much younger LMC cluster LW55. Subject headings: galaxies: individual: (Large Magellanic Cloud) – – galaxies: star clusters – Magellanic Clouds – stars: binary – techniques: photometric 1 Based on the data obtained at Las Campanas Observatory, operated by the Carnegie Institution of Washington, during the University of Toronto time allocation.

Welcome message from author
This document is posted to help you gain knowledge. Please leave a comment to let me know what you think about it! Share it to your friends and learn new things together.
Transcript

arX
iv:a
stro
-ph/
0510
545v
1 1
9 O
ct 2
005
Variable Stars in the Large Magellanic Cloud: Discovery of Extragalactic
W UMa Binaries1
Janusz Kaluzny
Copernicus Astronomical Center, Bartycka 18, 00-716 Warsaw, Poland
and
Stefan Mochnacki, Slavek M. Rucinski
David Dunlap Observatory
Department of Astronomy and Astrophysics, University of Toronto
P.O.Box 360, Richmond Hill, Ontario, Canada L4C 4Y6
(mochnacki,rucinski)@astro.utoronto.ca
ABSTRACT
We observed a field in the disk of the LMC on two consecutive nights in search of
rapid variable stars. We have found two pulsating stars of type RRab and δ Sct, and
four binary stars, among the latter one sdB or CV below the LMC blue Main Sequence
and three very close binary systems on the MS. At least one of the MS binaries, and
possibly all three, are the first solar-type (W UMa-type) contact binaries to be detected
in any extragalactic system and observed to obey the same MV = MV (log P,B − V )
calibration as the Galactic systems. Given the selection effects due to small amplitudes
at faint magnitudes, the frequency of such binaries in the disk of the LMC with its large
spread in population ages is not inconsistent with that in the disk of our Galaxy, and
contrasts with the lack of binaries found in earlier observations of the much younger
LMC cluster LW55.
Subject headings: galaxies: individual: (Large Magellanic Cloud) – – galaxies: star
clusters – Magellanic Clouds – stars: binary – techniques: photometric
1Based on the data obtained at Las Campanas Observatory, operated by the Carnegie Institution of Washington,
during the University of Toronto time allocation.
– 2 –
1. INTRODUCTION
Very little is known about short time scale (< 1 day) variability of stars in the Magellanic
Clouds. Only recently, the availability of large telescopes located at excellent sites has made it
possible to consider time-domain monitoring of the stellar population at brightness levels reaching
and beyond the levels of the Turn-Off Point of the oldest stellar population in LMC at V ≃ 20.5.
The current study addresses the detection and characterization of contact binary stars in a
typical LMC field 1.7 degrees from the center of the LMC. This field was selected taking guidance
from an HST study of the stellar population in the LMC (Smecker-Hane et al. 2002), where it was
called Disk-1. Availability of the archival HST images was one of the reasons for this study as
it permitted us to check for stellar blends and assure better consistency of our results. The field
is characterized by a constant star formation rate from the advanced age of 7.5 to 15 Gyr until
recently. In a companion study on short time-scale variability in the LMC (Kaluzny & Rucinski
2003), the studied field was dominated by a population of the open cluster LW55 with an age
of about 1.5 Gyr, in the presence of an underlying older population with an age about 4 Gyr or
more. We did not find any short-period binaries in or around LW55, but only several short-period
pulsating stars instead.
We present the observations and show the color – magnitude diagram for stars in the field in
Section 2. The results of the search for short-period variable stars are given in Section 3. Section 4
concludes the paper and summarizes the results.
2. Observations
2.1. Instruments and observing conditions
We used the Magellan/Baade 6.5m telescope with the TEK5 CCD 2K×2K camera which had
a focal scale of 0.069 arcsec/pixel. The field of view was 137× 137 arcsec square. The images were
binned by 2 pixels in both directions before extraction of photometry, with the resulting scale of
0.138 arcsec/pixel. The median seeing during our run was 0.94 arcsec in the V filter and 1.09 arcsec
in the B filter. The binned images significantly oversampled the Point Spread Function (PSF) even
in the cases of the best seeing. The search for variability was done mainly with the V filter (47
images) but also with the B filter (12 images). All V -filter exposures were 600 s while all B-filter
ones were 900 s.
The observations were made on two nights, 2002 January 4/5 and 5/6. We conducted 6.2
hours of variability monitoring on the first night and 7.3 hours on the second night. The nights can
be characterized as gray time, with the fraction of the illuminated area of the Moon disc of 61%
and 50%, respectively.
The image processing was identical to that described in Kaluzny & Rucinski (2003). The initial

– 3 –
processing of the images was done with standard procedures from IRAF2 with a combination of
the dome and sky flats used for the CCD response flat-field corrections.
The astrometric calibration was based on 48 reference stars from the USNO-B catalogue (Monet
et al. 2003). The random errors for the calibration do not exceed 0.5 arcsec, based on the recovered
coordinates of the USNO-B stars.
2.2. The field Disk-1
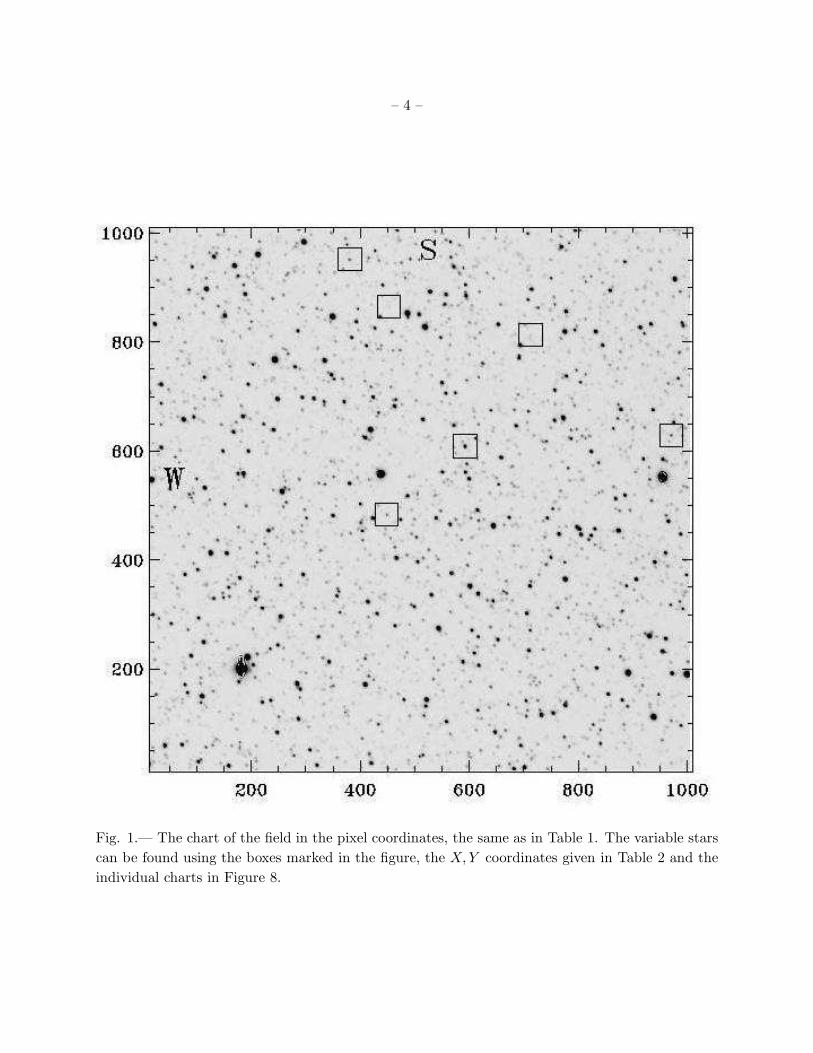
Figure 1 shows the sky image in the pixel space (after the 2 × 2 binning), with pixels 0.138
arcsec in size and with a total field of view of 2.3 × 2.3 arcmin square. The field in Figure 1 is
oriented with East to left and North down. The X-coordinate runs W to E, while the Y -coordinate
runs N to S.
2.3. Photometric calibration
The photometric calibrations were done using three of Stetson’s standard star fields (Stetson
2000): 2 stars in NGC 1866, 6 stars in E4–108 and 15 stars in NGC 2682 (M67). The fields were
observed with air masses ranging from 1.13 to 1.77. The extinction coefficients as well as the color
terms and zero points of the transformations from the instrumental to the standard BV system
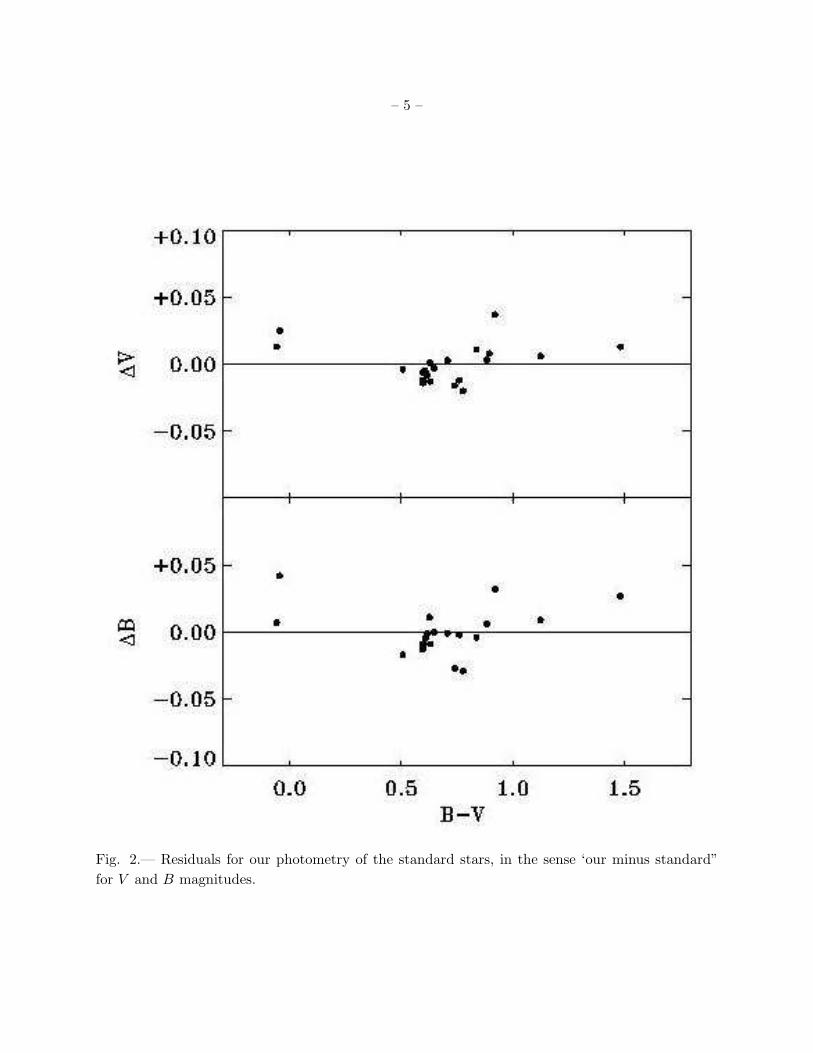
were determined from observations of all 23 standards stars. The adopted formulae were:
v = V − 1.050 + 0.021 × (B − V ) + 0.089 × (X − 1.25)
b = B − 0.702 − 0.142 × (B − V ) + 0.147 × (X − 1.25)
X is an air-mass and lower-case symbols denote instrumental magnitudes derived with the aperture
photometry with the DAOPHOT program (Stetson 1987). Figure 2 shows transformation residuals
for the standard stars.
Table 1 contains the results of our photometry for 4413 stars in the same pixel coordinate
system of as shown in Figure 1. The reference frames in V and B were obtained by collation of,
respectively, 10 and 7 individual frames with the best seeing, in the way as described in detail in
Mochejska et al. (2002). The seeing in the reference images had FWHM of 0.62 arcsec in V and
0.74 arcsec in B. The quoted errors in Table 1 do not reflect stellar variability but are just the
internal errors of the PSF photometry on the reference images.
2IRAF is distributed by the National Optical Astronomy Observatories, which are operated by the Association of
Universities for Research in Astronomy, Inc., under cooperative agreement with the NSF
– 4 –
Fig. 1.— The chart of the field in the pixel coordinates, the same as in Table 1. The variable stars
can be found using the boxes marked in the figure, the X,Y coordinates given in Table 2 and the
individual charts in Figure 8.
– 5 –
Fig. 2.— Residuals for our photometry of the standard stars, in the sense ‘our minus standard”
for V and B magnitudes.
– 6 –
2.4. Photometric uncertainties
It is difficult to assess reliably errors of single-frame profile photometry in a crowded field such
as Disk-1. Some formal errors, such as those returned by the DAOPHOT software, are often too
optimistic as they tend to miss problems related to blending.
We were not able to compare directly our results with those of Smecker-Hane et al. (2002)
which were discussed only in graphical and verbal form. However, we have analyzed the archival
HST–WFPC2 data: V : 2 × 500s, F555W, #u4b10905r and #u4b10906r; I: 2 × 300s, F814W,
#u4b10902r and #u4b10904r; the pairs of images were used to remove cosmic rays. We esti-
mated deviations between our photometry and the HST photometry, the latter obtained using the
“HSTphot” software package (Dolphin 2000a,b). While no obvious trends exist in the V magni-
tude differences for 963 common stars in the range 18 < V < 25, there does exist an offset of
∆V = −0.08 ± 0.02 (our results brighter). This offset has not been applied to the photometric
results listed in Tables 1 and the variable stars (Section 3). We note that systematic uncertainties
in the WFPC2 photometry are estimated at about 0.05 mag., and may even reach 0.1 mag. (Piotto
et al. 2002).
To estimate random uncertainties, we compared our results with the HST results for individual
stars. The deviations for the sample of 963 common stars are shown in Figure 3. After accounting
for the systematic shift of −0.08, binning the deviations in one magnitude intervals, and with
an assumption that errors from both sources add quadratically, we estimate the rms scatter at
σV ≃ 0.02 − 0.04 for for V < 21; it increases to 0.09 at V = 22 and to 0.11 at V = 23.
Much more reliable than the above estimates are estimates of errors in the search for variable
stars, obtained by comparison a large number of images analyzed using the image differencing
technique. They are discussed in Section 3 in a discussion of amplitudes of detectable variable
stars.
2.5. The color magnitude diagram
The photometric results for the whole field are plotted on the color–magnitude diagram (CMD)
in Figure 4. As discussed by Smecker-Hane et al. (2002), the Disk-1 field contains populations of
different age with clear indications that the star formation rate in this part of the LMC was constant
over a long time. We can see the red horizontal branch (at about V ≃ 19.5) and the Main Sequence
turn-off point (at about V ≃ 21) of the old population as well as a sequence of young stars extending
to V ≃ 18.

– 7 –
Fig. 3.— ∆V differences between our photometry and HST photometry (after allowance for the
offset of −0.08 mag) can be taken as a measure of random errors at different magnitude levels.
Estimates of the rms errors at one magnitude intervals are shown by vertical bars.

– 8 –
Fig. 4.— The CMD for the Disk-1 field. The six variable stars are marked with large filled circles
at their median magnitudes and color indices. The vertical bar for V4 shows its observed ranges
of variability in V ; for the remaining variables the ranges are smaller than the symbol size. The
absolute magnitude scale on the right vertical axis is based on the assumption of (m−M)0 = 18.5
and EB−V = 0.10.
– 9 –
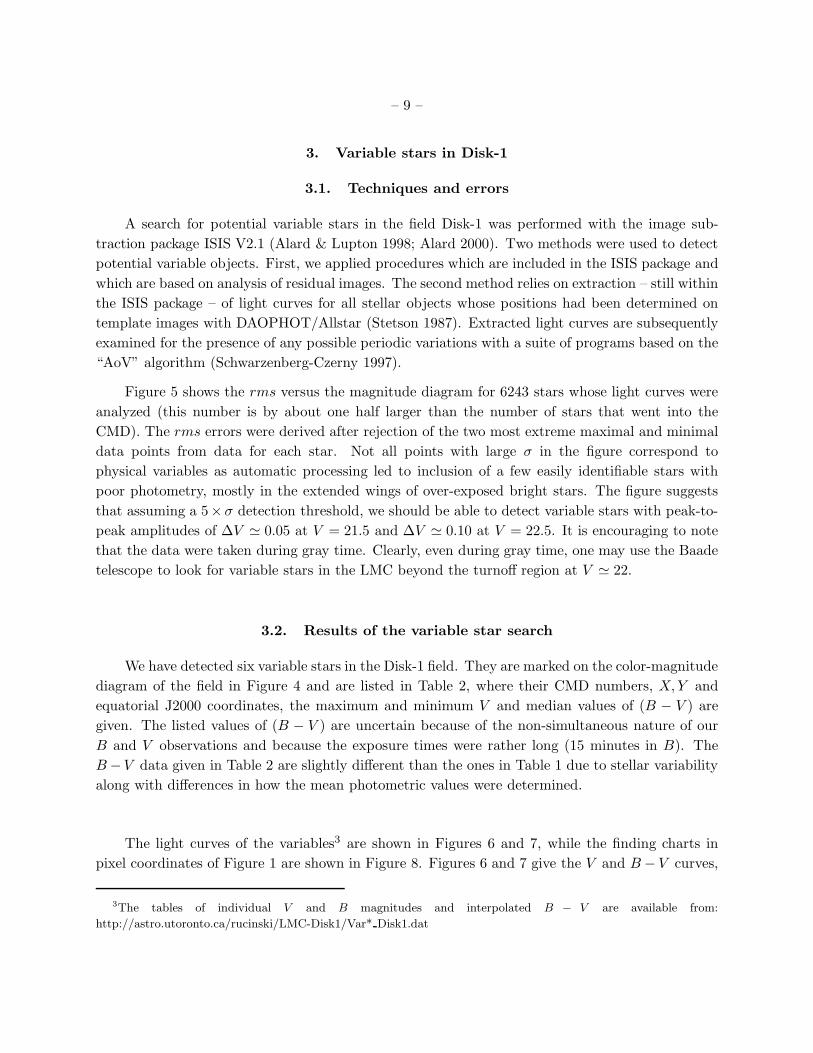
3. Variable stars in Disk-1
3.1. Techniques and errors
A search for potential variable stars in the field Disk-1 was performed with the image sub-
traction package ISIS V2.1 (Alard & Lupton 1998; Alard 2000). Two methods were used to detect
potential variable objects. First, we applied procedures which are included in the ISIS package and
which are based on analysis of residual images. The second method relies on extraction – still within
the ISIS package – of light curves for all stellar objects whose positions had been determined on
template images with DAOPHOT/Allstar (Stetson 1987). Extracted light curves are subsequently
examined for the presence of any possible periodic variations with a suite of programs based on the
“AoV” algorithm (Schwarzenberg-Czerny 1997).
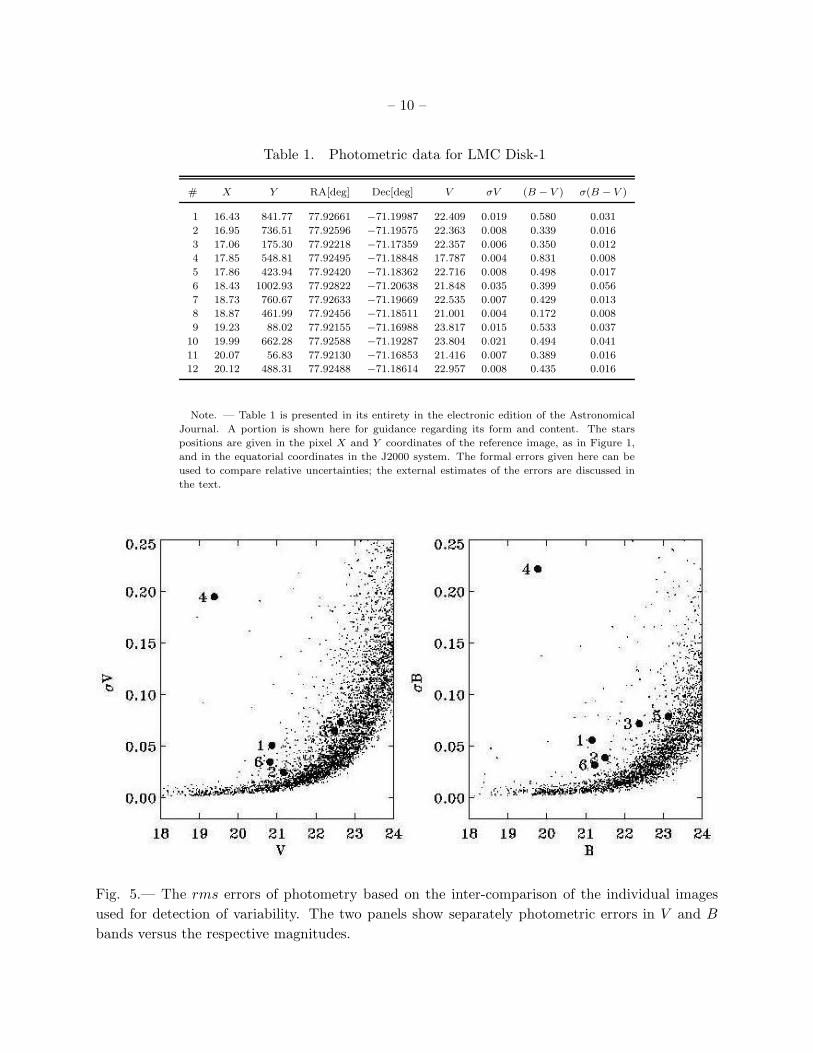
Figure 5 shows the rms versus the magnitude diagram for 6243 stars whose light curves were
analyzed (this number is by about one half larger than the number of stars that went into the
CMD). The rms errors were derived after rejection of the two most extreme maximal and minimal
data points from data for each star. Not all points with large σ in the figure correspond to
physical variables as automatic processing led to inclusion of a few easily identifiable stars with
poor photometry, mostly in the extended wings of over-exposed bright stars. The figure suggests
that assuming a 5×σ detection threshold, we should be able to detect variable stars with peak-to-
peak amplitudes of ∆V ≃ 0.05 at V = 21.5 and ∆V ≃ 0.10 at V = 22.5. It is encouraging to note
that the data were taken during gray time. Clearly, even during gray time, one may use the Baade
telescope to look for variable stars in the LMC beyond the turnoff region at V ≃ 22.
3.2. Results of the variable star search
We have detected six variable stars in the Disk-1 field. They are marked on the color-magnitude
diagram of the field in Figure 4 and are listed in Table 2, where their CMD numbers, X,Y and
equatorial J2000 coordinates, the maximum and minimum V and median values of (B − V ) are
given. The listed values of (B − V ) are uncertain because of the non-simultaneous nature of our
B and V observations and because the exposure times were rather long (15 minutes in B). The
B −V data given in Table 2 are slightly different than the ones in Table 1 due to stellar variability
along with differences in how the mean photometric values were determined.
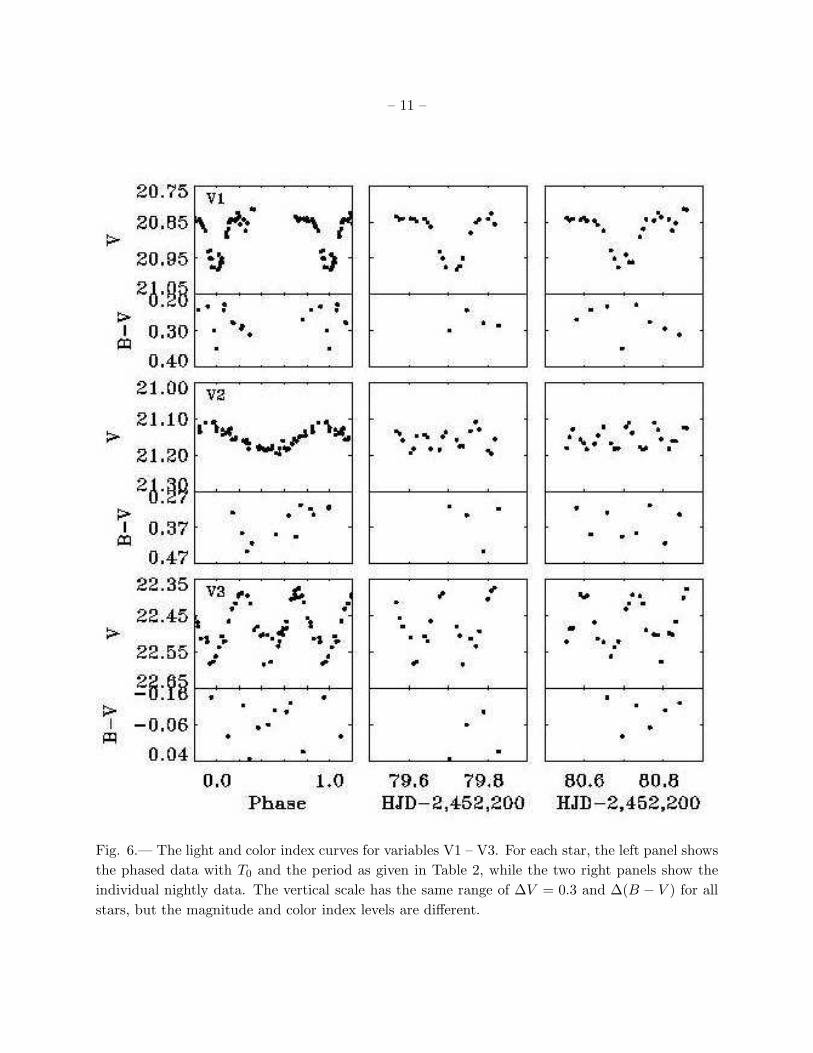
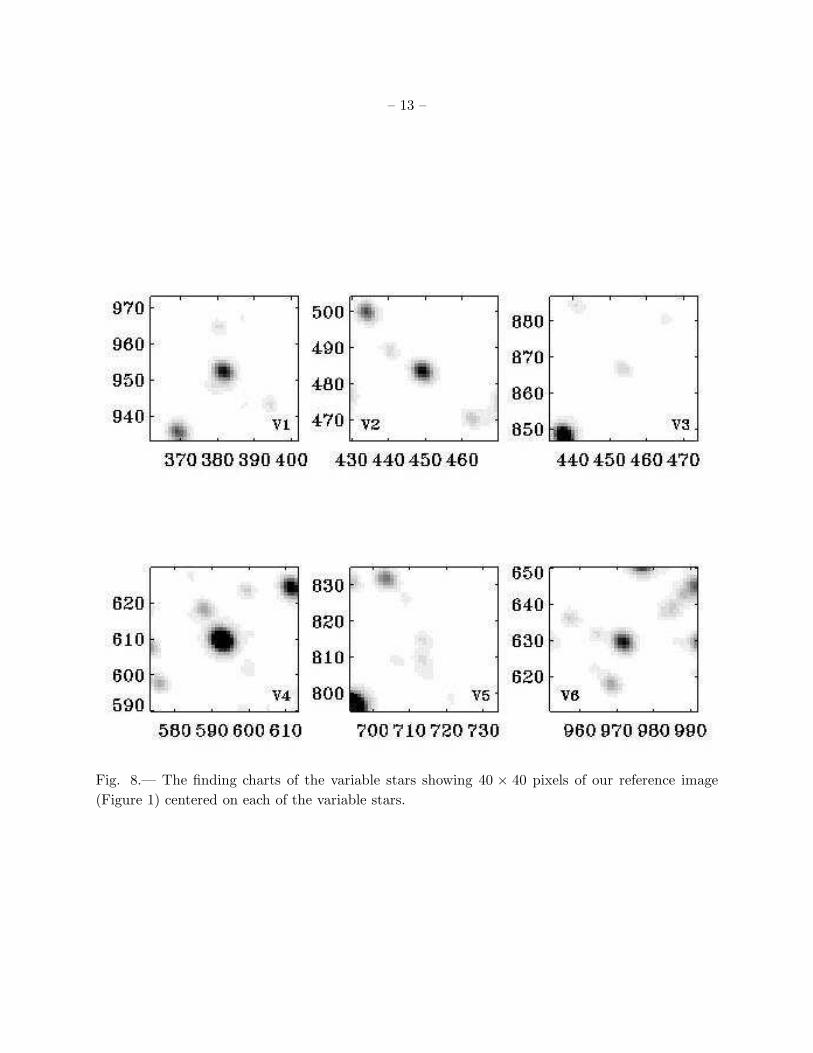
The light curves of the variables3 are shown in Figures 6 and 7, while the finding charts in
pixel coordinates of Figure 1 are shown in Figure 8. Figures 6 and 7 give the V and B − V curves,
3The tables of individual V and B magnitudes and interpolated B − V are available from:
http://astro.utoronto.ca/rucinski/LMC-Disk1/Var* Disk1.dat
– 10 –
Table 1. Photometric data for LMC Disk-1
# X Y RA[deg] Dec[deg] V σV (B − V ) σ(B − V )
1 16.43 841.77 77.92661 −71.19987 22.409 0.019 0.580 0.031
2 16.95 736.51 77.92596 −71.19575 22.363 0.008 0.339 0.016
3 17.06 175.30 77.92218 −71.17359 22.357 0.006 0.350 0.012
4 17.85 548.81 77.92495 −71.18848 17.787 0.004 0.831 0.008
5 17.86 423.94 77.92420 −71.18362 22.716 0.008 0.498 0.017
6 18.43 1002.93 77.92822 −71.20638 21.848 0.035 0.399 0.056
7 18.73 760.67 77.92633 −71.19669 22.535 0.007 0.429 0.013
8 18.87 461.99 77.92456 −71.18511 21.001 0.004 0.172 0.008
9 19.23 88.02 77.92155 −71.16988 23.817 0.015 0.533 0.037
10 19.99 662.28 77.92588 −71.19287 23.804 0.021 0.494 0.041
11 20.07 56.83 77.92130 −71.16853 21.416 0.007 0.389 0.016
12 20.12 488.31 77.92488 −71.18614 22.957 0.008 0.435 0.016
Note. — Table 1 is presented in its entirety in the electronic edition of the Astronomical
Journal. A portion is shown here for guidance regarding its form and content. The stars
positions are given in the pixel X and Y coordinates of the reference image, as in Figure 1,
and in the equatorial coordinates in the J2000 system. The formal errors given here can be
used to compare relative uncertainties; the external estimates of the errors are discussed in
the text.
Fig. 5.— The rms errors of photometry based on the inter-comparison of the individual images
used for detection of variability. The two panels show separately photometric errors in V and B
bands versus the respective magnitudes.
– 11 –
Fig. 6.— The light and color index curves for variables V1 – V3. For each star, the left panel shows
the phased data with T0 and the period as given in Table 2, while the two right panels show the
individual nightly data. The vertical scale has the same range of ∆V = 0.3 and ∆(B − V ) for all
stars, but the magnitude and color index levels are different.

– 12 –
Fig. 7.— The same as in Figure 6, but for the variables V4 – V6. Note that for V4, the magnitude
scale is expanded 3 times relative to that for the remaining stars.
– 13 –
Fig. 8.— The finding charts of the variable stars showing 40 × 40 pixels of our reference image
(Figure 1) centered on each of the variable stars.
– 14 –
the latter for the interpolated moments of the B observations. We do not discuss the B magnitude
light curves in this paper because of their low precision.
We inspected the archival WFPC2 images (particularly the image WFPC2ASN U4B10905B)
and found that all our detected variables are free from blending. We also found that our RA/Dec
coordinates of the variables agree with the WCS of the WFPC2 image to 0.6 arcsec.
Obviously, due to the short duration of the program, we could detect only short time scale
variables. On the other hand, we could probe relatively deeply and could detect variables among
stars of very moderate brightness reaching as far down the main sequence as solar stars, in the
LMC at V ≃ 22 − 23. The limited scope of the project is fully confirmed by the characteristics of
the detected variables: As we can see in Fig. 4, four of the stars are located in the Main Sequence
of the LMC; these are V1, V2, V5, V6. One of them, V2, is a δ Scuti variable, while the remaining
ones are short period binary systems. V1, V2 and V6 are located in the turn-off region of the old
population Main Sequence within +0.28 < B − V < +0.39 and V ≃ 21. We also detected one
RR Lyr-type (RRab) variable and one very blue variable below the Main Sequence. We comment
on the individual objects below.
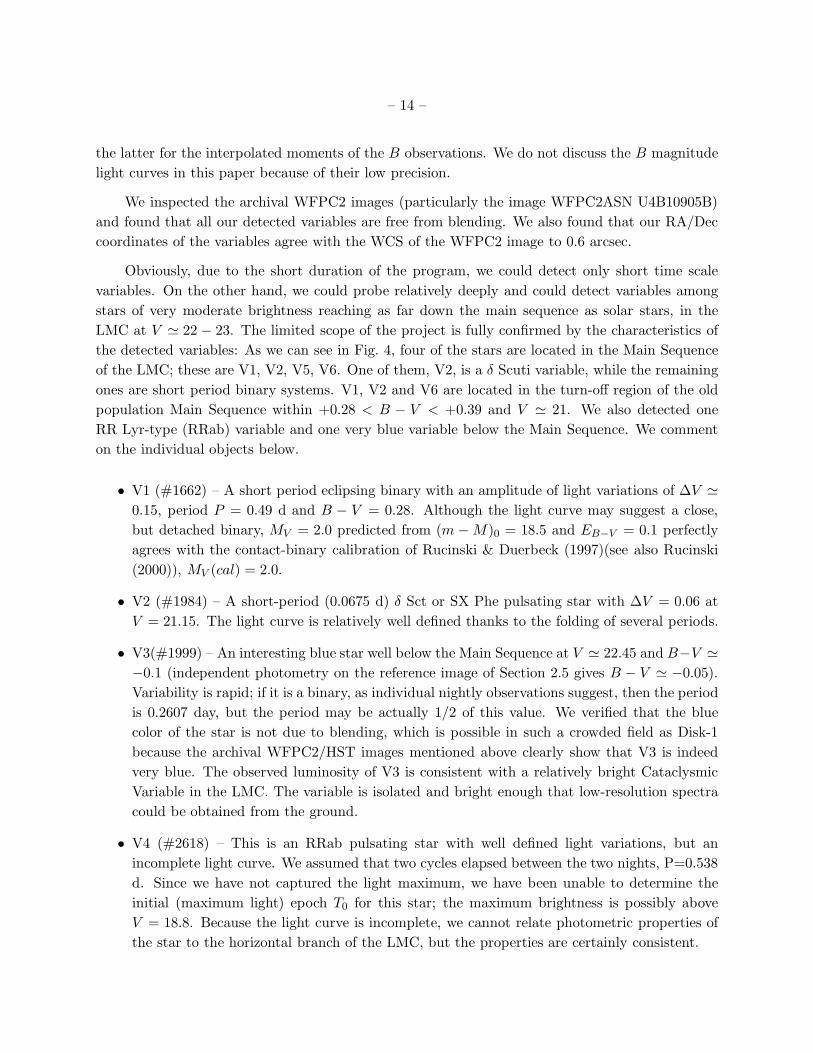
• V1 (#1662) – A short period eclipsing binary with an amplitude of light variations of ∆V ≃
0.15, period P = 0.49 d and B − V = 0.28. Although the light curve may suggest a close,
but detached binary, MV = 2.0 predicted from (m − M)0 = 18.5 and EB−V = 0.1 perfectly
agrees with the contact-binary calibration of Rucinski & Duerbeck (1997)(see also Rucinski
(2000)), MV (cal) = 2.0.
• V2 (#1984) – A short-period (0.0675 d) δ Sct or SX Phe pulsating star with ∆V = 0.06 at
V = 21.15. The light curve is relatively well defined thanks to the folding of several periods.
• V3(#1999) – An interesting blue star well below the Main Sequence at V ≃ 22.45 and B−V ≃
−0.1 (independent photometry on the reference image of Section 2.5 gives B − V ≃ −0.05).
Variability is rapid; if it is a binary, as individual nightly observations suggest, then the period
is 0.2607 day, but the period may be actually 1/2 of this value. We verified that the blue
color of the star is not due to blending, which is possible in such a crowded field as Disk-1
because the archival WFPC2/HST images mentioned above clearly show that V3 is indeed
very blue. The observed luminosity of V3 is consistent with a relatively bright Cataclysmic
Variable in the LMC. The variable is isolated and bright enough that low-resolution spectra
could be obtained from the ground.
• V4 (#2618) – This is an RRab pulsating star with well defined light variations, but an
incomplete light curve. We assumed that two cycles elapsed between the two nights, P=0.538
d. Since we have not captured the light maximum, we have been unable to determine the
initial (maximum light) epoch T0 for this star; the maximum brightness is possibly above
V = 18.8. Because the light curve is incomplete, we cannot relate photometric properties of
the star to the horizontal branch of the LMC, but the properties are certainly consistent.
– 15 –
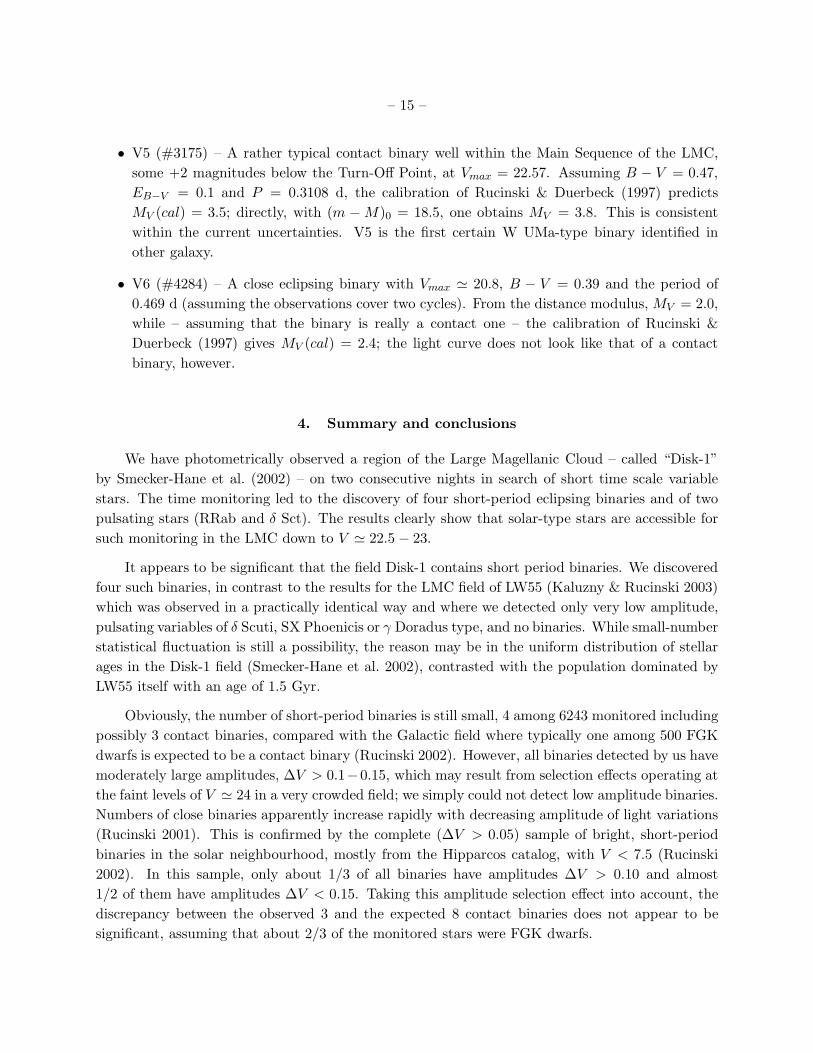
• V5 (#3175) – A rather typical contact binary well within the Main Sequence of the LMC,
some +2 magnitudes below the Turn-Off Point, at Vmax = 22.57. Assuming B − V = 0.47,
EB−V = 0.1 and P = 0.3108 d, the calibration of Rucinski & Duerbeck (1997) predicts
MV (cal) = 3.5; directly, with (m − M)0 = 18.5, one obtains MV = 3.8. This is consistent
within the current uncertainties. V5 is the first certain W UMa-type binary identified in
other galaxy.
• V6 (#4284) – A close eclipsing binary with Vmax ≃ 20.8, B − V = 0.39 and the period of
0.469 d (assuming the observations cover two cycles). From the distance modulus, MV = 2.0,
while – assuming that the binary is really a contact one – the calibration of Rucinski &
Duerbeck (1997) gives MV (cal) = 2.4; the light curve does not look like that of a contact
binary, however.
4. Summary and conclusions
We have photometrically observed a region of the Large Magellanic Cloud – called “Disk-1”
by Smecker-Hane et al. (2002) – on two consecutive nights in search of short time scale variable
stars. The time monitoring led to the discovery of four short-period eclipsing binaries and of two
pulsating stars (RRab and δ Sct). The results clearly show that solar-type stars are accessible for
such monitoring in the LMC down to V ≃ 22.5 − 23.
It appears to be significant that the field Disk-1 contains short period binaries. We discovered
four such binaries, in contrast to the results for the LMC field of LW55 (Kaluzny & Rucinski 2003)
which was observed in a practically identical way and where we detected only very low amplitude,
pulsating variables of δ Scuti, SX Phoenicis or γ Doradus type, and no binaries. While small-number
statistical fluctuation is still a possibility, the reason may be in the uniform distribution of stellar
ages in the Disk-1 field (Smecker-Hane et al. 2002), contrasted with the population dominated by
LW55 itself with an age of 1.5 Gyr.
Obviously, the number of short-period binaries is still small, 4 among 6243 monitored including
possibly 3 contact binaries, compared with the Galactic field where typically one among 500 FGK
dwarfs is expected to be a contact binary (Rucinski 2002). However, all binaries detected by us have
moderately large amplitudes, ∆V > 0.1−0.15, which may result from selection effects operating at
the faint levels of V ≃ 24 in a very crowded field; we simply could not detect low amplitude binaries.
Numbers of close binaries apparently increase rapidly with decreasing amplitude of light variations
(Rucinski 2001). This is confirmed by the complete (∆V > 0.05) sample of bright, short-period
binaries in the solar neighbourhood, mostly from the Hipparcos catalog, with V < 7.5 (Rucinski
2002). In this sample, only about 1/3 of all binaries have amplitudes ∆V > 0.10 and almost
1/2 of them have amplitudes ∆V < 0.15. Taking this amplitude selection effect into account, the
discrepancy between the observed 3 and the expected 8 contact binaries does not appear to be
significant, assuming that about 2/3 of the monitored stars were FGK dwarfs.

– 16 –
We thank the reviewer Dr. Wayne Osborn for very careful checking of our paper and for several
useful suggestions.
Research support from the Ministry of Scientific Research and Informational Technology,
Poland to JK (grant 1 P03D 001 28) and from the Natural Sciences and Engineering Council
of Canada to SWM and SMR is acknowledged here with gratitude.
This work is based on observations with the NASA/ESA Hubble Space Telescope, obtained
from the Data Archive at the Space Telescope Science Institute, which is operated by the Associ-
ation of Universities for Research in Astronomy, Inc., under NASA contract NAS 5-26555. These
observations are associated with program #7382
REFERENCES
Alard, C. 2000, A&AS, 144, 363
Alard, C., & Lupton, R. H. 1998, ApJ, 503, 325
Dolphin, A. E. 2000a, PASP, 112, 1383
Dolphin, A. E. 2000b, PASP, 112, 1397
Kaluzny, J., & Rucinski, S. M. 2003, AJ, 126, 237
Mochejska, B. J., Stanek, K. Z., Sasselov, D. D., & Szentgyorgyi, A. H. 2002, AJ, 123, 3460
Monet D. et al, 2003, AJ, 125, 984
Piotto, G., King, I. R., Djorgovski, S. G., Sosin, C., Zoccali, M., Saviane, I., De Angeli, F., Riello,
M., Recio Blanco, A., Rich, R. M., Meylan, G. & Renzini, A. 2002, A&A, 391, 945
Rucinski, S. M. 2000, AJ, 120, 319
Rucinski, S. M. 2001, AJ, 122, 1007
Rucinski, S. M 2002, PASP, 114, 1124
Rucinski, S. M., & Duerbeck, H.W. 1997, PASP, 109, 1340
Schwarzenberg-Czerny, A. 1997, ApJ, 489, 941
Smecker-Hane, T. A., Cole, A. A., Gallagher III, J. S., & Stetson, P. B. 2002, ApJ, 566, 239
Stetson, P. B. 1987, PASP, 99, 191
Stetson, P. B. 2000, PASP, 112, 925
This preprint was prepared with the AAS LATEX macros v5.2.

– 17 –
Table 2. Variable stars in Disk-1
V # X Y Vmax Vmin (B − V ) RA(hh:mm:ss) Dec(dd:mm:ss) Type Period(d) T0
1 1662 381.82 953.11 20.84 20.97 0.28 5:11:53.10 −71:12:14.6 EA/EW: 0.491(1): 79.715
2 1984 449.61 484.19 21.12 21.18 0.33 5:11:54.51 −71:11:09.4 δ Sct 0.0675(1) 79.568
3 1999 453.81 866.78 22.39 22.57 −0.10 5:11:55.02 −71:12:02.0 sdB/CV 0.2607(2) 80.67
4 2618 593.36 609.87 <18.80 19.56 0.38 5:11:58.71 −71:11:25.8 RRab 0.538:
5 3175 713.90 814.92 22.57 22.78 0.47 5:12:02.35 −71:11:53.2 EW 0.3108(1) 80.625
6 4284 971.90 630.27 20.79 20.91 0.39 5:12:09.52 −71:11:26.2 EA/EW: 0.469(1): 80.69
Note. — The variable star numbers, as used in the text, are given in the first column, while identifications in Table 1 are in the
second column. The full names which conform to the International Astronomical Union recommendations are “Disk1–LCO–V...”.
The J2000 equatorial coordinates were obtained through an astrometric frame solution using positions of 48 stars from the USNO-B
catalogue; this solution reproduces the J2000 coordinates of these stars with residuals not exceeding 0.5 arcsec in RA and Dec. Note
that the V and B − V data differ slightly between this table and Table 1 due to different photometric methods used; the differences
can be taken as indication of external uncertainties combined with the genuine variability.
Related Documents