VARIABILITY: Range Variance Standard Deviation

Welcome message from author
This document is posted to help you gain knowledge. Please leave a comment to let me know what you think about it! Share it to your friends and learn new things together.
Transcript

VARIABILITY:
Range
Variance
Standard Deviation

Measures of Variability
Describe the extent to which scores in a
distribution differ from each other.

Distance Between the Locations of
Scores in Three Distributions

Three Variations of the Normal
Curve

The Range, Variance, and
Standard Deviation

The Range
• The range indicates the distance between the
two most extreme scores in a distribution
Range = highest score – lowest score

Variance and Standard Deviation
• The variance and standard deviation are two
measures of variability that indicate how
much the scores are spread out around the
mean
• We use the mean as our reference point since
it is at the center of the distribution

The Sample Variance and the Sample Standard Deviation

N
XXSX
22 )(
Sample Variance
• The sample variance is the average of the
squared deviations of scores around the
sample mean
• Definitional formula

N
N
XX
SX
22
2
)(
Sample Variance
• Computational formula

N
XXSX
2)(
Sample Standard Deviation
• The sample standard deviation is the
square root of the sample variance
• Definitional formula
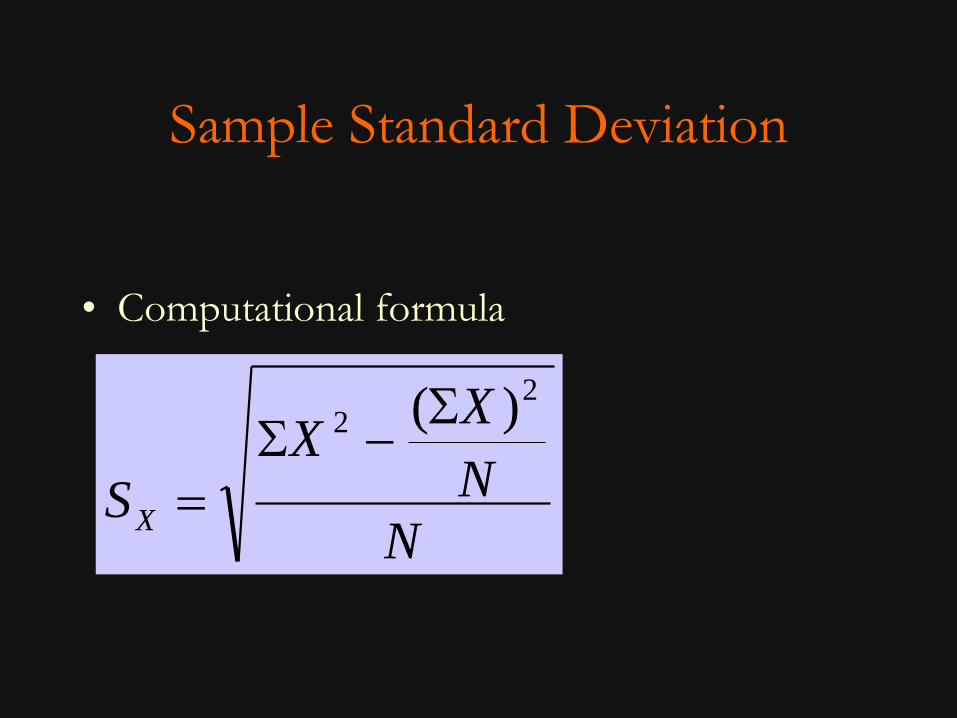
Sample Standard Deviation
• Computational formula
N
N
XX
SX
22 )(

The Standard Deviation
• The standard deviation indicates the “average
deviation” from the mean, the consistency in
the scores, and how far scores are spread out
around the mean

Normal Distribution and
the Standard Deviation

Normal Distribution and
the Standard Deviation
Approximately 34% of the scores in a perfect
normal distribution are between the mean and
the score that is one standard deviation from
the mean.

Standard Deviation and Range
For any roughly normal distribution, the
standard deviation should equal about one-sixth
of the range.

The Population Variance and the Population Standard
Deviation

N
XX
22 )(
Population Variance
• The population variance is the true or
actual variance of the population of scores.

N
XX
2)(
Population Standard Deviation
• The population standard deviation is the
true or actual standard deviation of the
population of scores.

The Estimated Population Variance
and The Estimated Population
Standard Deviation

Estimating the Population
Variance and Standard Deviation
• The sample standard deviation is a
biased estimator of the population
standard deviation.
)( XS
• The sample variance is a biased
estimator of the population variance.
)( 2
XS

1
)( 22
N
XXsX
Estimated Population Variance
• By dividing the numerator of the sample
variance by N - 1, we have an unbiased
estimator of the population variance.
• Definitional formula

Estimated Population Variance
• Computational formula
1
)( 22
2
N
N
XX
sX

1
)( 2
N
XXsX
Estimated Population
Standard Deviation
• By dividing the numerator of the sample
standard deviation by N - 1, we have an
unbiased estimator of the population
standard deviation.
• Definitional formula

Estimated Population
Standard Deviation
• Computational formula
1
)( 22
N
N
XX
sX

Unbiased Estimators 2
Xs2• is an unbiased estimator of
Xs
• is an unbiased estimator of
• The quantity N - 1 is called the degrees of
freedom

2
Xs2
XS XS XsUses of , , , and
2
XS
XS• Use the sample variance and the
sample standard deviation to
describe the variability of a sample. 2
Xs
Xs• Use the estimated population variance
and the estimated population standard
deviation for inferential purposes when
you need to estimate the variability in the
population.

Organizational Chart of
Descriptive and Inferential
Measures of Variability

Applying to Research
5 item list 10-item list 15-item list
3
4
2
5
5
8
9
11
7
82.
3
xS
X
41.1
6
xS
X
63.1
9
xS
X
• The standard deviation in each condition tells me about:
1. on “average” the scores differ from each other (i.e.
consistency of scores and behavior)
2. the strength of overall relationship
3. amount of error we have in prediction (Rather, the variance
is the “average error” when using the mean to predict
scores)

Proportion of Variance
Accounted For
• When describing a relationship, we evaluate
its scientific usefulness:
– How important is it?
– What does it “buy” me?
• Using a relationship helps us predict more
accurately
– but “more accurate” compared to what?

Proportion of Variance
Accounted For
• Compare our “average” prediction error
when using the relationship to the “average”
prediction error without using the
relationship
3
5
1
6
2
10
10
4
13 15
6
2
xS
X 5 item 10-item 15-item
3
5
1
6
2
10
10
4
13
Average Error = 10
6X 9X3X

Proportion of Variance
Accounted For
The proportion of variance accounted for by a relationship is:
the proportion of error in our predictions when we
use the overall mean to predict scores that is eliminated
when we use the relationship with another variable to
predict scores
i.e. the improvement that results from using a
relationship to predict scores, compared to not using
that relationship

14 14 13 15 11 15
13 10 12 13 14 13
14 15 17 14 14 15
Example 1
• Using the following data set, find
– The range,
– The sample variance and standard deviation,
– The estimated population variance and standard deviation

71017
Example1
• The range is the largest value minus the
smallest value.

N
N
XX
SX
22
2
)(
44.218
33623406
18
18
)246(3406
2
2
XS
Example 1

N
N
XX
SX
22 )(
56.144.218
18
2463406
2
XS
Example 1

1
)( 22
2
N
N
XX
sX
59.217
33623406
17
18
)246(3406
2
2
Xs
Example 1

1
)( 22
N
N
XX
sX
61.159.217
18
2463406
2
Xs
Example 1

Example 2
• For the following sample data, compute the range,
variance and standard deviation
8 8 10 7 9 6 11 9 10 7
11 11 7 9 11 10 11 8 10 7
range= 11-6=5
Variance= 2.60
Standard Deviation= 1.61

Example 3
• For the data set below, calculate the mean,
deviation, sum of squares, variance and
standard deviation by creating a table.
• 15 12 13 15 16 17 13 16 11 18

Example 3 Solution
score mean deviation sum of squares variance standard deviation
11 14,60 -3,60 12,96
12 14,60 -2,60 6,76
13 14,60 -1,60 2,56
13 14,60 -1,60 2,56
15 14,60 0,40 0,16
15 14,60 0,40 0,16
16 14,60 1,40 1,96
16 14,60 1,40 1,96
17 14,60 2,40 5,76
18 14,60 3,40 11,56
46,40 4,64 2,15

Example 4
• For the data set below, calculate the mean,
deviation, sum of squares, variance and
standard deviation by creating a table.
• 1 3 2 2 2 4 3 3 4 1

Example 4 Solution
score mean deviation sum of squares variance standard deviation
1 2,50 -1,50 2,25
1 2,50 -1,50 2,25
2 2,50 -0,50 0,25
2 2,50 -0,50 0,25
2 2,50 -0,50 0,25
3 2,50 0,50 0,25
3 2,50 0,50 0,25
3 2,50 0,50 0,25
4 2,50 1,50 2,25
4 2,50 1,50 2,25
10,50 1,05 1,02

Example 5
• For the data set below, calculate the mean,
deviation, sum of squares, variance and
standard deviation by creating a table.
• 1 3 30 12 15 20 5 13 2 4

Example 5 Solution score mean deviation sum of squares variance standard deviation
1 10,50 -9,50 90,25
2 10,50 -8,50 72,25
3 10,50 -7,50 56,25
4 10,50 -6,50 42,25
5 10,50 -5,50 30,25
12 10,50 1,50 2,25
13 10,50 2,50 6,25
15 10,50 4,50 20,25
20 10,50 9,50 90,25
30 10,50 19,50 380,25
790,50 79,05 8,89

Related Documents


