Variability of alkaline phosphatase in goat milk in relation to its use as an effective index of pasteurisation Final report on Project SO 1003 to Food Standards Agency Scotland Variability of ALP activity in goat milk throughout lactation Suitability of methods for the assessment of effectiveness of pasteurisation of goats milk Residual ALP activity and microbiological quality of pasteurised goat milk retailed in Scotland J M Banks D D Muir Hannah Research Institute Ayr KA6 5HL

Welcome message from author
This document is posted to help you gain knowledge. Please leave a comment to let me know what you think about it! Share it to your friends and learn new things together.
Transcript

Variability of alkaline phosphatase in goat milk in relation to its use as an effective
index of pasteurisation
Final report on Project SO 1003 to Food Standards Agency Scotland
Variability of ALP activity in goat milk throughout lactation
Suitability of methods for the assessment of effectiveness of pasteurisation of goats milk
Residual ALP activity and microbiological quality of
pasteurised goat milk retailed in Scotland J M Banks D D Muir Hannah Research Institute Ayr KA6 5HL

i
CONTENT CONTENTS i-ii EXECUTIVE SUMMARY iii-iv LAYMAN’S SUMMARY v INTRODUCTION 1 SUMMARY OBJECTIVES 1 MILESTONES 2 DELIVERABLES 3 Objective No. 01 – Lactational study of the variability of alkaline phosphatase in 17 British Saanen goats as measured by fluorescence Introduction 4 Results and Discussion 4 Goat Herd 4-5 Results for alkaline phosphatase (ALP) measured by Fluorophos 6 Individual animals monitored weekly July 2001 to January 2002 6 Conclusions 6 Tables 1-18 7-16 Figures 1a) – 6q) 17-119 Statistical analysis of lactational and heat stability data 120 Introduction 120 Study Design 120 Statistical Analysis 120 a) Untreated ALP 120-122 b) Comparison of untreated and heat treated ALP 122-123 Results and Discussion 123 a) Untreated ALP 123-134 b) Comparison of untreated and heat treated ALP 134-146 Conclusions 147 Objective No. 02 – Comparison of effectiveness of bioluminescence, fluorescence and spectrophotmetric methods in determining the efficiency of pasteurisation of goat, sheep and cow milk Introduction 148 Methods for testing residual ALP in pasteurised milk 148-149 Application of tests to milk of different species 149-150 Lactational study of goat milk 150 Goat Milk Samples 150 Methodology 150 Results and Discussion 150-160

ii
Objective No. 03 – Study of the origins and factors influencing the formation of heat stable alkaline phosphatases in goat milk Milk samples 161 Results and Discussion 161 Conclusions 161-163 Objective No. 04 – Survey of residual ALP activity in commercial pasteurised and unpasteurised goat and sheep milk on sale in Scotland Objective No. 05 – Survey of the microbiological quality of pasteurised and unpasteurised goat milk on sale in Scotland Introduction 164 Samples 164 Results and Discussion 165 Conclusions 165-169
iii
Variability of alkaline phosphatase in goat milk in relation to its use as an effective index
of pasteurisation
Food Standards Agency Scotland Project SO 1003
EXECUTIVE SUMMARY The microbiological safety of milk depends on efficient pasteurisation and prevention of recontamination of the finished product. Pasteurisation, a heat treatment equivalent to a minimum holding of milk at no less than 71.8°C for 15 seconds – inactivates almost all potential pathogens found in raw milk. Validation of the effectiveness of the pasteurisation process is based on destruction of a natural milk enzyme-alkaline phosphatase (ALP). The sensitivity of this test hinges on the initial concentration of ALP in raw milk. The higher the initial activity, the more sensitive is the test. In addition, the sensitivity depends on the method of analysis of residual enzyme activity. The detection limit for the reference test for ALP is equivalent to contamination of properly pasteurised cows milk by 0.1% raw milk. The implications of applying the test to pasteurised goat milk were explored because goat milk was reported to have natural levels of ALP around 10% of the activity found in cows milk. In such circumstances the sensitivity of the reference method for ALP would be reduced ten fold i.e. contamination of pasteurised goat milk by raw milk could reach a level of 1% before it would be detected. Variations in the initial pool of indigenous alkaline phosphatase in milk lead to different amounts of raw milk being allowed in the pasteurised milk product at the statutory pass level. The research undertaken in this project aimed to reduce the potential threat to public safety associated with consumption of inadequately processed goat milk. The effectiveness of the ALP test is determined by three factors: (1) The level of ALP in milk and its variability, (2) The sensitivity of the method of measuring ALP (spectrophotmetric, fluoroescence, bioluminescence) and (3) The levels set in legislation as acceptable standards for residual ALP activity. The work undertaken within this project encompassed: a lactational study of the variability of ALP in a herd of British Saanen goats; a comparison of the effectiveness of bioluminescence, fluorescence and spectrophotometric measurements of ALP; a study of the formation of heat stable ALP; and a limited survey of residual ALP and microbiological quality of pasteurised goat milk retailed in Scotland. There is little information in the literature regarding the variability levels of ALP in individual goat milks or the influence of lactational effects on secretion of ALP into milk. Seventeen British Saanen goats from the Hannah Research Institute herd were therefore sampled on a weekly basis throughout a full lactation, i.e. April 2001 to early January 2002. Individual morning and evening milking samples were tested for ALP daily during the first eight weeks of lactation Thereafter the morning milk from individual goats was sampled once a week throughout the remaining lactation period. Alkaline phosphatase was determined by the Fluorophos method (IDF Standard 155A:1999). Statistical modelling of the lactational data explored relationships between ALP levels in milk and goat genotype, age, lactation history and milk composition.

iv
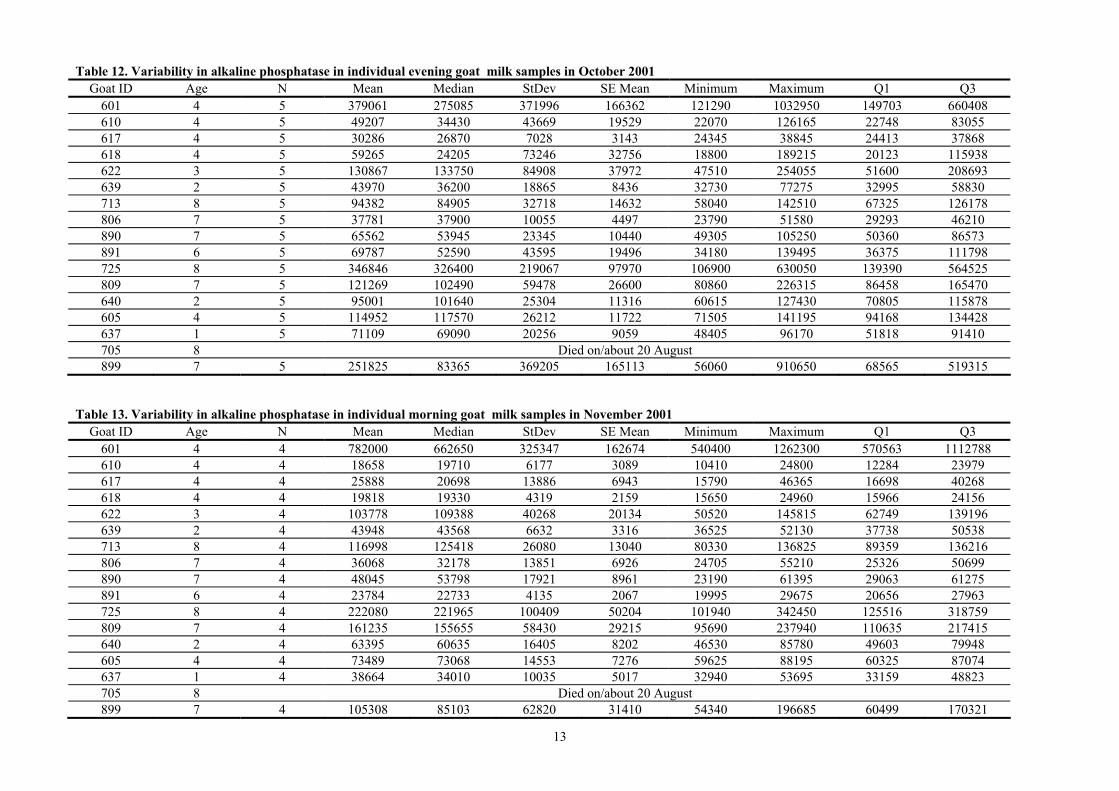
ALP levels in milk were lowest in the early stages of lactation and increased as the lactation progressed and milk yields declined. ALP levels were higher in milk samples from evening milk as compared with morning milk. The lowest mean value recorded for ALP in an individual goat for morning milk in May was 5823 mU/L. 15 of the 16 animals producing milk in May had ALP levels under 32000mU/L. The lowest level of ALP in an individual goat milk sample was 3630 mU/L. Values for ALP in goat milk increased as lactation progressed. In November, the minimum mean value for ALP in an individual goat morning milk was 18658 mU/L. The minimum value for an individual goat was 10410 mU/L. Mean vales for ALP in November ranged from 18658 mU/L to 782000mU/L. The mean value throughout lactation (11 samples) for ALP in bulk herd goat milk was 38880 mU/L. The equivalent value for cows milk (mean of 22 samples) was more than tenfold higher at 560049 mU/L. Early lactation pasteurised bulk goat milk which was contaminated with raw milk at levels of 1.0% raw milk did not fail the Fluorophos, Bioluminescence or Sanders and Sager ALP test. In mid lactation failures for goat milk were obtained at levels ranging from 0.7 to 0.9% contamination. In cows milk failures for the ALP tests were evident at 0.08 to 0.1% contamination of pasteurised milk with raw milk. Results indicate that all tests currently available are not suitable for ALP determination in goat milk. Twenty nine samples of pasteurised goat milk were collected from retail outlets in Ayrshire. All samples had satisfactory residual phosphatase levels but two of the samples had unacceptably high counts for Enterobacteriaceae.
v
Variability of alkaline phosphatase in goat milk in relation to its use as an effective index
of pasteurisation
Food Standards Agency Scotland Project SO 1003
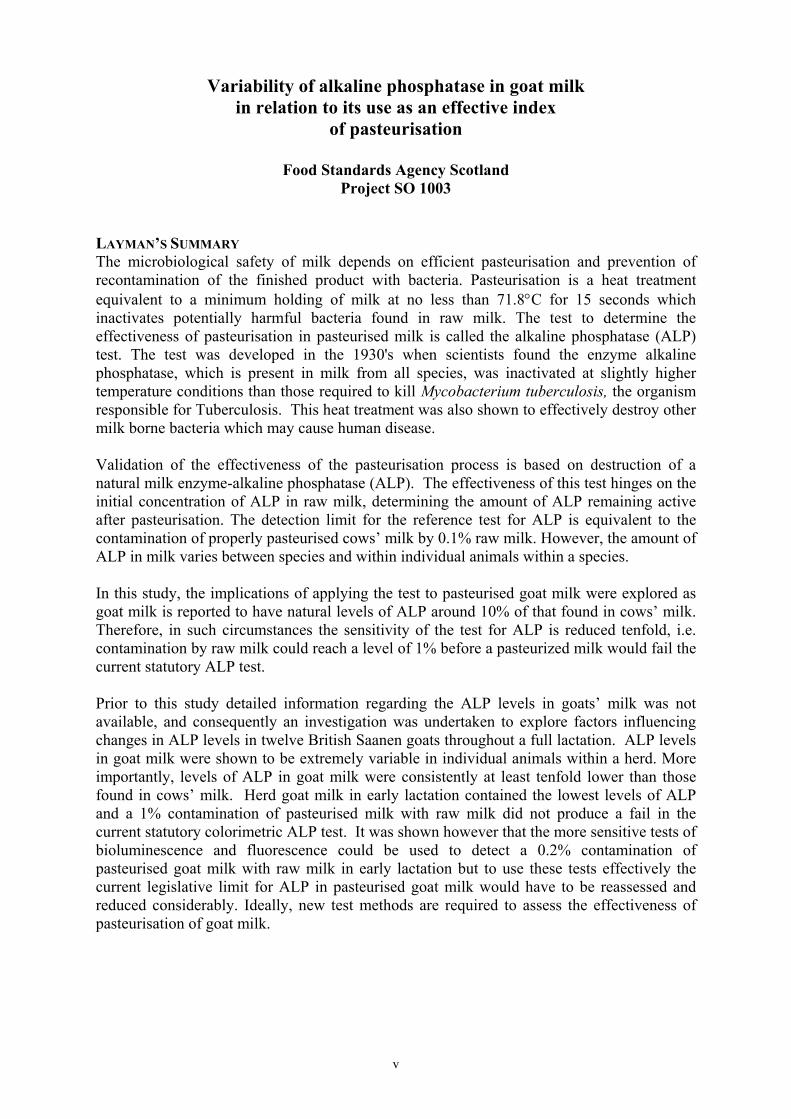
LAYMAN’S SUMMARY The microbiological safety of milk depends on efficient pasteurisation and prevention of recontamination of the finished product with bacteria. Pasteurisation is a heat treatment equivalent to a minimum holding of milk at no less than 71.8°C for 15 seconds which inactivates potentially harmful bacteria found in raw milk. The test to determine the effectiveness of pasteurisation in pasteurised milk is called the alkaline phosphatase (ALP) test. The test was developed in the 1930's when scientists found the enzyme alkaline phosphatase, which is present in milk from all species, was inactivated at slightly higher temperature conditions than those required to kill Mycobacterium tuberculosis, the organism responsible for Tuberculosis. This heat treatment was also shown to effectively destroy other milk borne bacteria which may cause human disease. Validation of the effectiveness of the pasteurisation process is based on destruction of a natural milk enzyme-alkaline phosphatase (ALP). The effectiveness of this test hinges on the initial concentration of ALP in raw milk, determining the amount of ALP remaining active after pasteurisation. The detection limit for the reference test for ALP is equivalent to the contamination of properly pasteurised cows’ milk by 0.1% raw milk. However, the amount of ALP in milk varies between species and within individual animals within a species. In this study, the implications of applying the test to pasteurised goat milk were explored as goat milk is reported to have natural levels of ALP around 10% of that found in cows’ milk. Therefore, in such circumstances the sensitivity of the test for ALP is reduced tenfold, i.e. contamination by raw milk could reach a level of 1% before a pasteurized milk would fail the current statutory ALP test. Prior to this study detailed information regarding the ALP levels in goats’ milk was not available, and consequently an investigation was undertaken to explore factors influencing changes in ALP levels in twelve British Saanen goats throughout a full lactation. ALP levels in goat milk were shown to be extremely variable in individual animals within a herd. More importantly, levels of ALP in goat milk were consistently at least tenfold lower than those found in cows’ milk. Herd goat milk in early lactation contained the lowest levels of ALP and a 1% contamination of pasteurised milk with raw milk did not produce a fail in the current statutory colorimetric ALP test. It was shown however that the more sensitive tests of bioluminescence and fluorescence could be used to detect a 0.2% contamination of pasteurised goat milk with raw milk in early lactation but to use these tests effectively the current legislative limit for ALP in pasteurised goat milk would have to be reassessed and reduced considerably. Ideally, new test methods are required to assess the effectiveness of pasteurisation of goat milk.

1
INTRODUCTION The microbiological safety of milk depends on efficient pasteurisation and prevention of recontamination of the finished product. Pasteurisation, a heat treatment equivalent to a minimum holding of milk at no less than 71.8°C for 15 seconds, inactivates almost all potential pathogens found in raw milk. Validation of the effectiveness of the pasteurisation process is based on destruction of a natural milk enzyme-alkaline phosphatase (ALP). The sensitivity of this test hinges on the initial concentration of ALP in raw milk. The higher the initial activity, the more sensitive is the test. The sensitivity of the test depends on the method of analysis of residual enzyme activity. The detection limit for the reference test for ALP is equivalent to contamination of properly pasteurised cows milk by 0.1% raw milk. The implications of applying the test to pasteurised goat milk were explored because goat milk was reported to have natural levels of ALP around 10% of the activity found in bovine milk. In such circumstances the sensitivity of the reference method for ALP is reduced tenfold. i.e. contamination of pasteurised goat milk by raw milk could reach a level of 1% before it would be detected. The research undertaken aimed to reduce the potential threat to public safety associated with consumption of inadequately processed goat milk. The extent of the potential problem in goat milk was explored throughout a full lactation. SUMMARY OBJECTIVES
Objective No.
Objective Description
01 Lactational study of the variability of alkaline phosphatase in 17 British Saanen Goats as measured by fluorescence.
02 Comparison of effectiveness of bioluminescence, fluorescence and spectrophotometric methods in determining the efficiency of pasteurisation of goat, sheep and cow milk.
03 Study of the origins and factors influencing the formation of heat stable alkaline phosphatases in goat milk
04 Survey of residual ALP activity in commercial pasteurised and unpasteurised goat and sheep milk on sale in Scotland
05 Survey of the microbiological quality of pasteurised and unpasteurised goat milk on sale in Scotland

2
MILESTONES
Milestone No.
Target Date Milestone Title
01/01 31.10.01 Complete report on ALP levels in individual goat milk from early to mid lactation
01/02 1.02.02 Complete report to FSA on ALP levels in goat milk from mid to late lactation
01/03 31.06.02 Complete report on variability in ALP activity in individual goat milks and a bulk sample throughout lactation
02/01 31.10.01 Complete report on comparison of measurement of ALP in bulk goat milk in early to mid lactation and the sensitivity of detecting raw milk contamination using spectrophotometric, fluorescence and bioluminescence techniques.
02/02 1.02.02 Complete preliminary report on comparison of measurement of ALP in bulk goat milk in mid to late lactation and the sensitivity of detecting raw milk contamination using spectrophotometric, fluorescence and bioluminescence techniques.
02/03 31.06.02 Complete final report on comparison of measurement of ALP in bulk goat milk throughout lactation and the sensitivity of detecting raw milk contamination using spectrophotometric, fluorescence and bioluminescence techniques.
03/01 31.10.01 Complete preliminary report on heat stable ALP in individual goat milks in early and mid lactation
03/02 1.02.02 Complete preliminary report on heat stable ALP in individual goat milk in late lactation
03/03 31.05.02 Complete final report to FSA on the occurrence of heat stable ALP in goat milk
04/01 31.05.02 Complete preliminary report on the survey of residual ALP measurements in retail samples of pasteurised goat milk on sale in Scotland.
05/01 31.05.02 Complete report on the microbiological quality of commercially produced pasteurised goat milk retailed in Scotland.
06/01 31.06.02 Complete final report: variability of ALP activity in goat milk throughout lactation; suitability of methods for the assessment of effectiveness of pasteurisation of goats milk ; residual ALP activity and microbiological quality of pasteurised goat milk retailed in Scotland.
DELIVERABLES
3
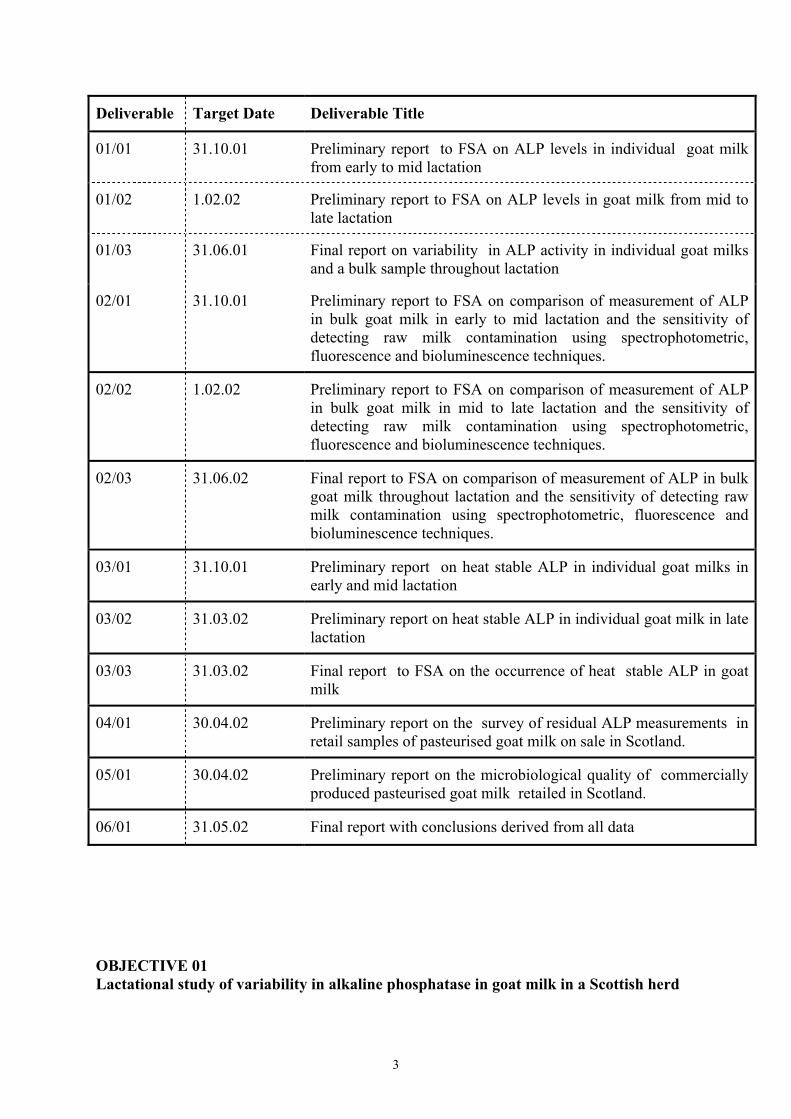
Deliverable Target Date Deliverable Title
01/01 31.10.01 Preliminary report to FSA on ALP levels in individual goat milk from early to mid lactation
01/02 1.02.02 Preliminary report to FSA on ALP levels in goat milk from mid to late lactation
01/03 31.06.01 Final report on variability in ALP activity in individual goat milks and a bulk sample throughout lactation
02/01 31.10.01 Preliminary report to FSA on comparison of measurement of ALP in bulk goat milk in early to mid lactation and the sensitivity of detecting raw milk contamination using spectrophotometric, fluorescence and bioluminescence techniques.
02/02 1.02.02 Preliminary report to FSA on comparison of measurement of ALP in bulk goat milk in mid to late lactation and the sensitivity of detecting raw milk contamination using spectrophotometric, fluorescence and bioluminescence techniques.
02/03 31.06.02 Final report to FSA on comparison of measurement of ALP in bulk goat milk throughout lactation and the sensitivity of detecting raw milk contamination using spectrophotometric, fluorescence and bioluminescence techniques.
03/01 31.10.01 Preliminary report on heat stable ALP in individual goat milks in early and mid lactation
03/02 31.03.02 Preliminary report on heat stable ALP in individual goat milk in late lactation
03/03 31.03.02 Final report to FSA on the occurrence of heat stable ALP in goat milk
04/01 30.04.02 Preliminary report on the survey of residual ALP measurements in retail samples of pasteurised goat milk on sale in Scotland.
05/01 30.04.02 Preliminary report on the microbiological quality of commercially produced pasteurised goat milk retailed in Scotland.
06/01 31.05.02 Final report with conclusions derived from all data
OBJECTIVE 01 Lactational study of variability in alkaline phosphatase in goat milk in a Scottish herd
4
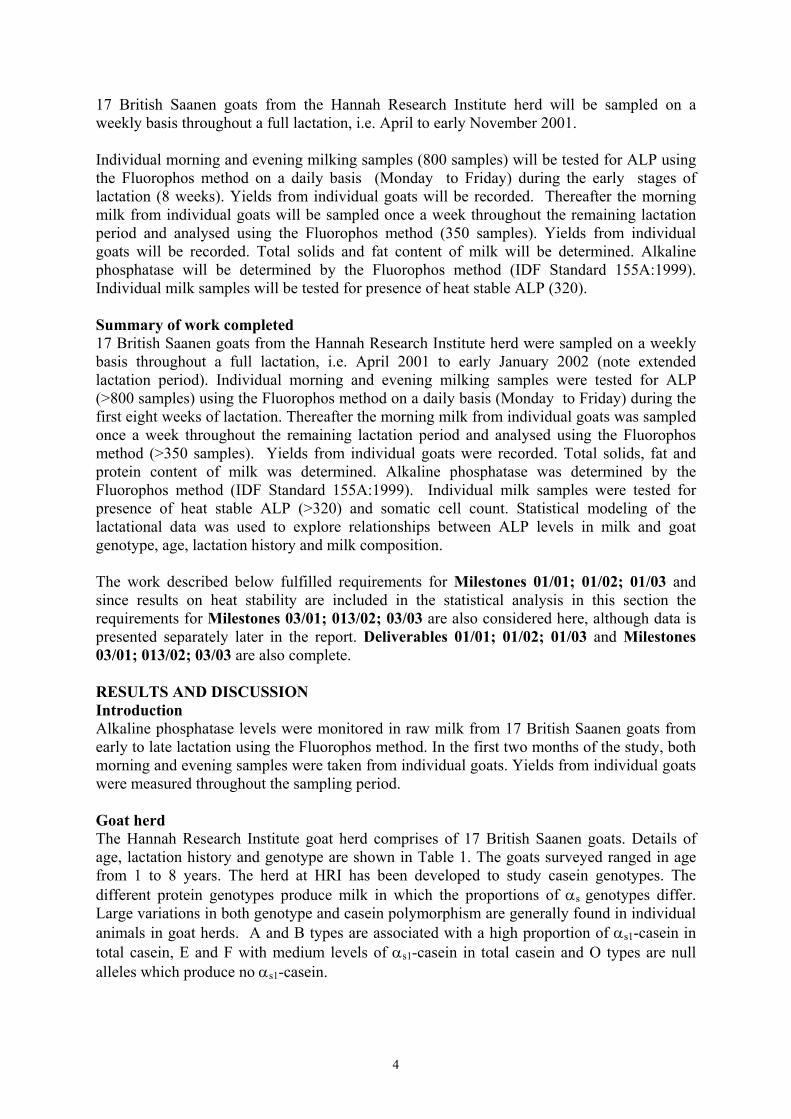
17 British Saanen goats from the Hannah Research Institute herd will be sampled on a weekly basis throughout a full lactation, i.e. April to early November 2001. Individual morning and evening milking samples (800 samples) will be tested for ALP using the Fluorophos method on a daily basis (Monday to Friday) during the early stages of lactation (8 weeks). Yields from individual goats will be recorded. Thereafter the morning milk from individual goats will be sampled once a week throughout the remaining lactation period and analysed using the Fluorophos method (350 samples). Yields from individual goats will be recorded. Total solids and fat content of milk will be determined. Alkaline phosphatase will be determined by the Fluorophos method (IDF Standard 155A:1999). Individual milk samples will be tested for presence of heat stable ALP (320). Summary of work completed 17 British Saanen goats from the Hannah Research Institute herd were sampled on a weekly basis throughout a full lactation, i.e. April 2001 to early January 2002 (note extended lactation period). Individual morning and evening milking samples were tested for ALP (>800 samples) using the Fluorophos method on a daily basis (Monday to Friday) during the first eight weeks of lactation. Thereafter the morning milk from individual goats was sampled once a week throughout the remaining lactation period and analysed using the Fluorophos method (>350 samples). Yields from individual goats were recorded. Total solids, fat and protein content of milk was determined. Alkaline phosphatase was determined by the Fluorophos method (IDF Standard 155A:1999). Individual milk samples were tested for presence of heat stable ALP (>320) and somatic cell count. Statistical modeling of the lactational data was used to explore relationships between ALP levels in milk and goat genotype, age, lactation history and milk composition. The work described below fulfilled requirements for Milestones 01/01; 01/02; 01/03 and since results on heat stability are included in the statistical analysis in this section the requirements for Milestones 03/01; 013/02; 03/03 are also considered here, although data is presented separately later in the report. Deliverables 01/01; 01/02; 01/03 and Milestones 03/01; 013/02; 03/03 are also complete. RESULTS AND DISCUSSION Introduction Alkaline phosphatase levels were monitored in raw milk from 17 British Saanen goats from early to late lactation using the Fluorophos method. In the first two months of the study, both morning and evening samples were taken from individual goats. Yields from individual goats were measured throughout the sampling period. Goat herd The Hannah Research Institute goat herd comprises of 17 British Saanen goats. Details of age, lactation history and genotype are shown in Table 1. The goats surveyed ranged in age from 1 to 8 years. The herd at HRI has been developed to study casein genotypes. The different protein genotypes produce milk in which the proportions of αs genotypes differ. Large variations in both genotype and casein polymorphism are generally found in individual animals in goat herds. A and B types are associated with a high proportion of αs1-casein in total casein, E and F with medium levels of αs1-casein in total casein and O types are null alleles which produce no αs1-casein.

5
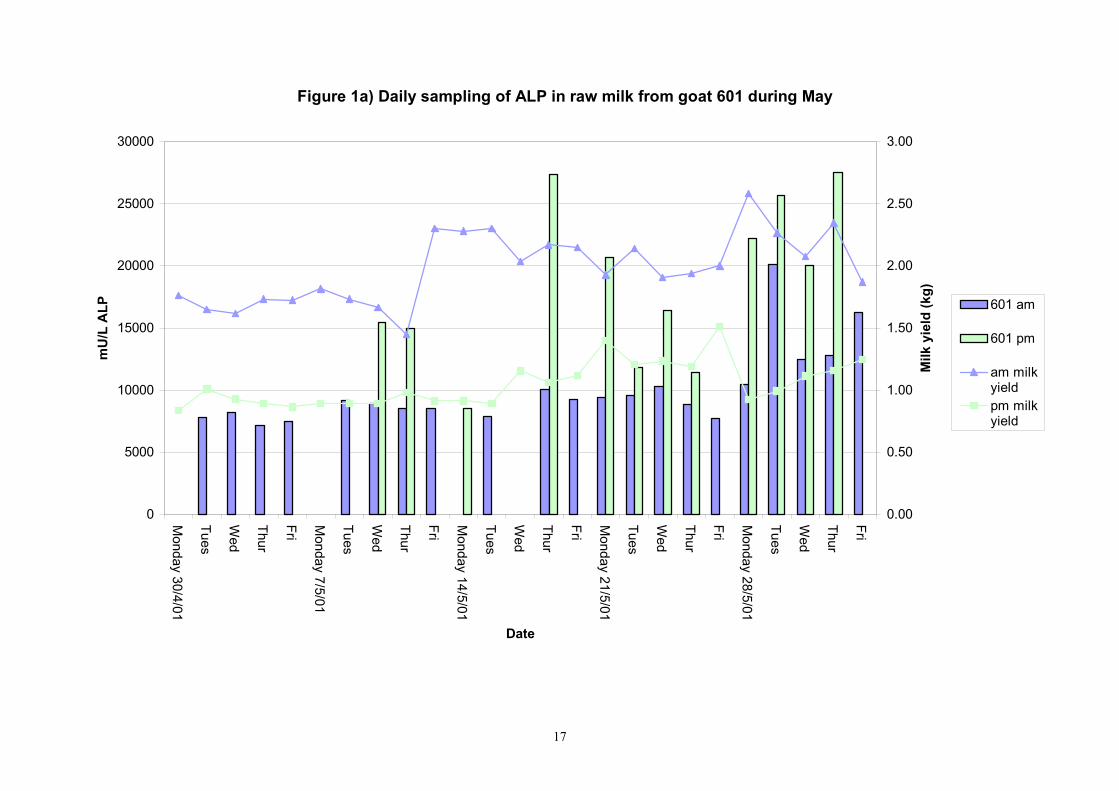
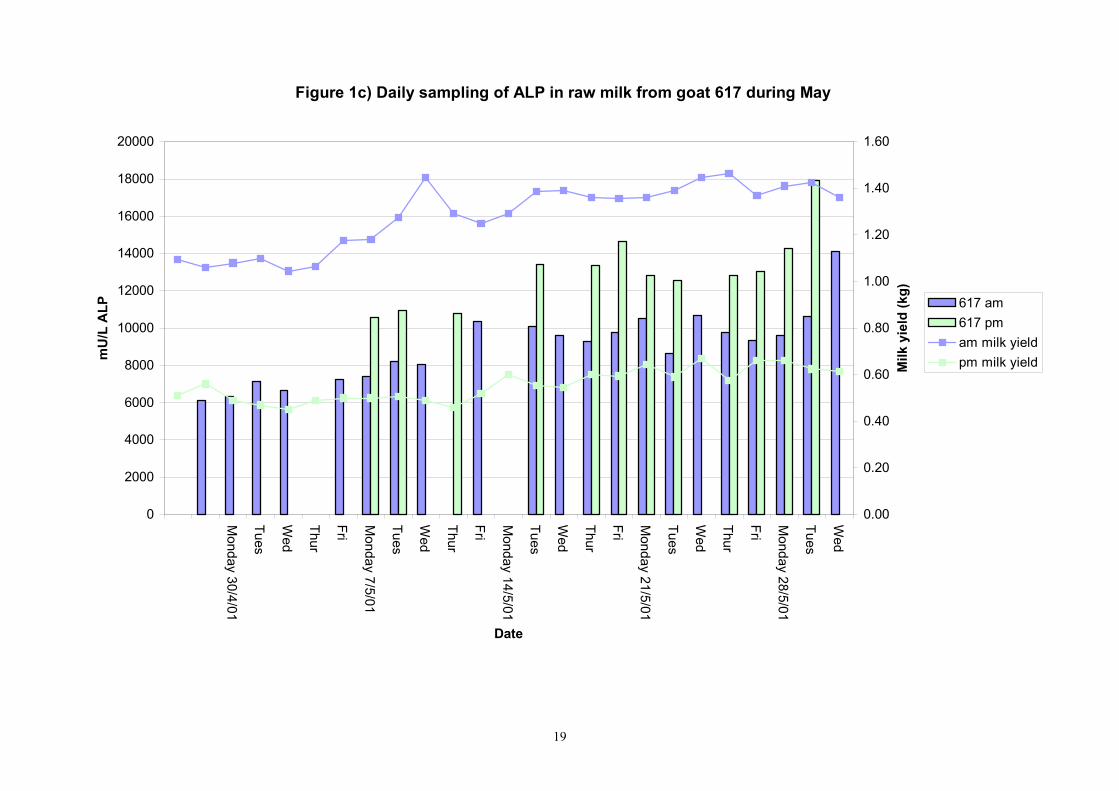
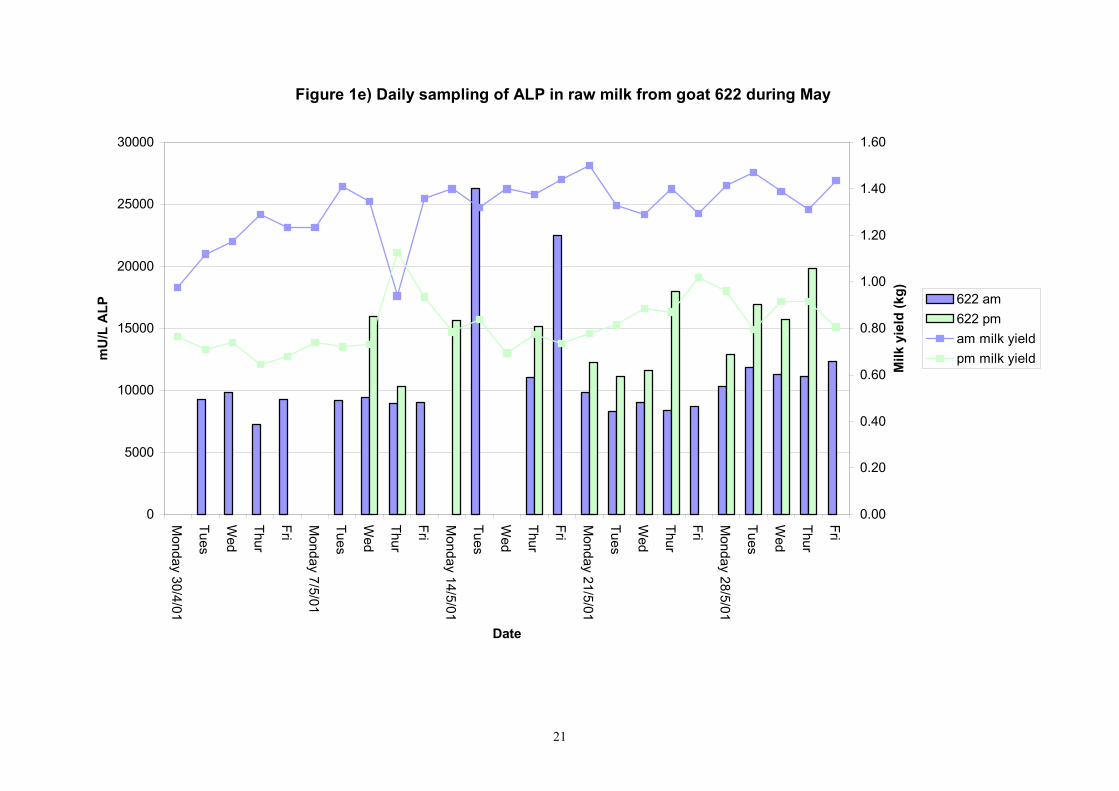
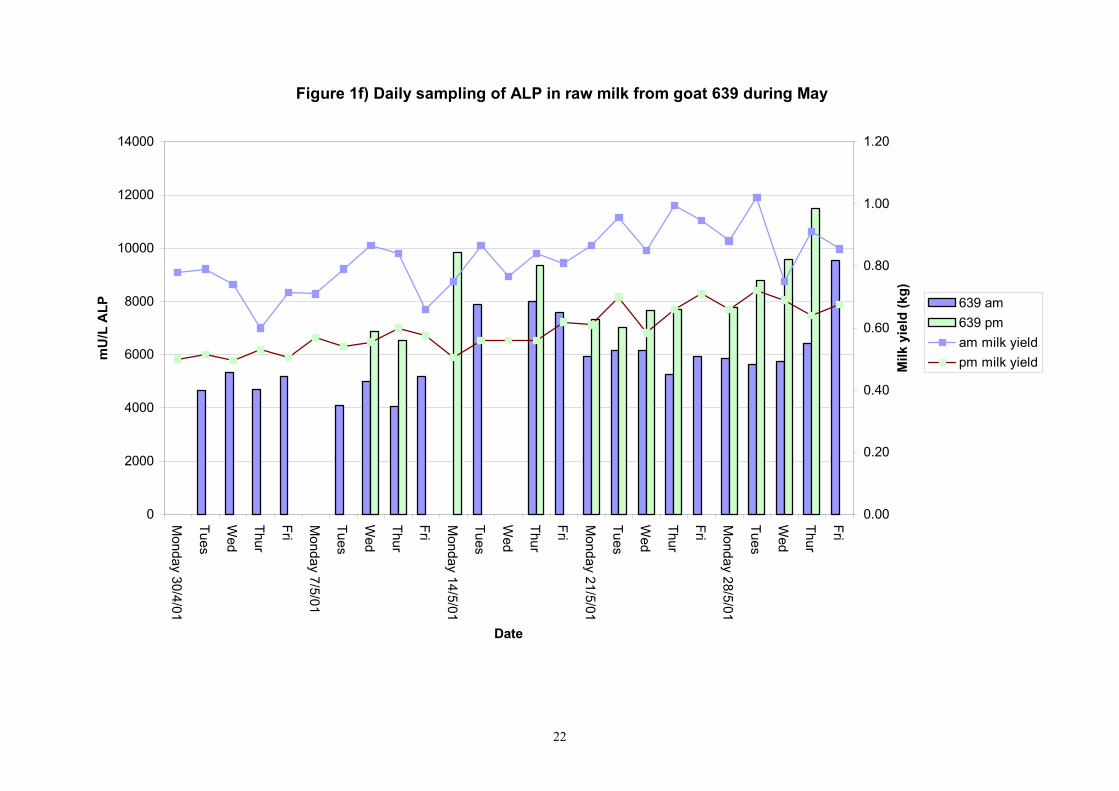
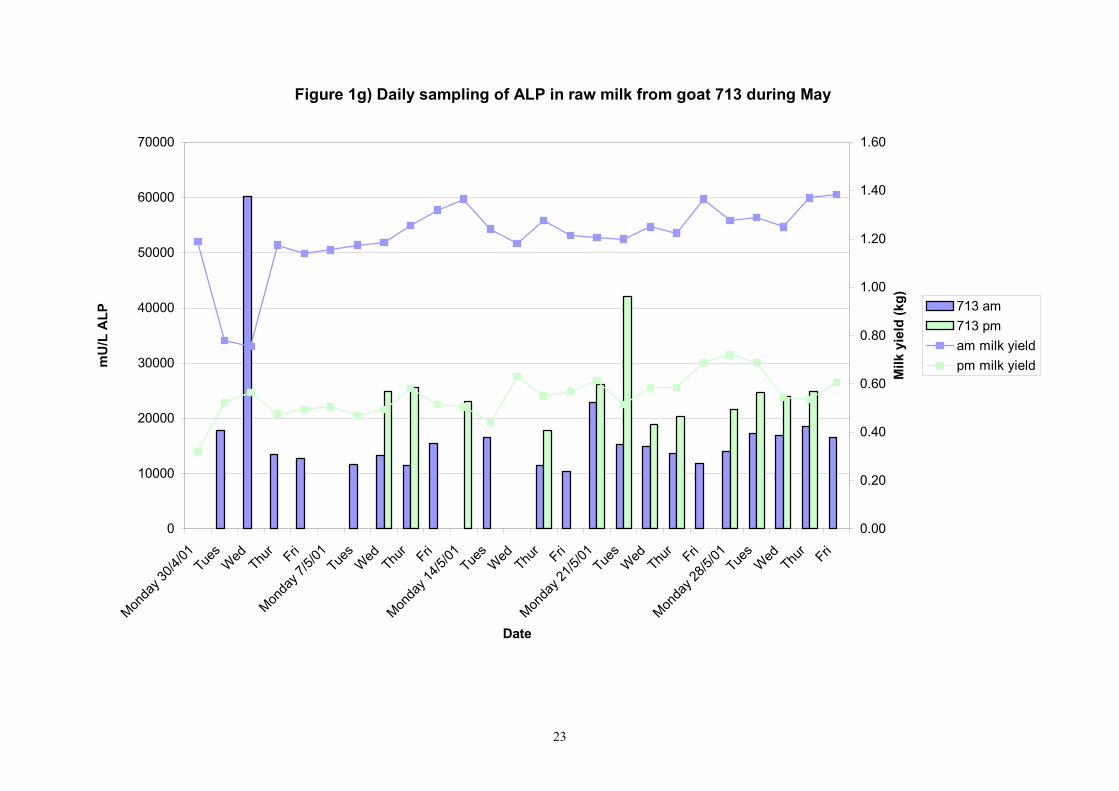
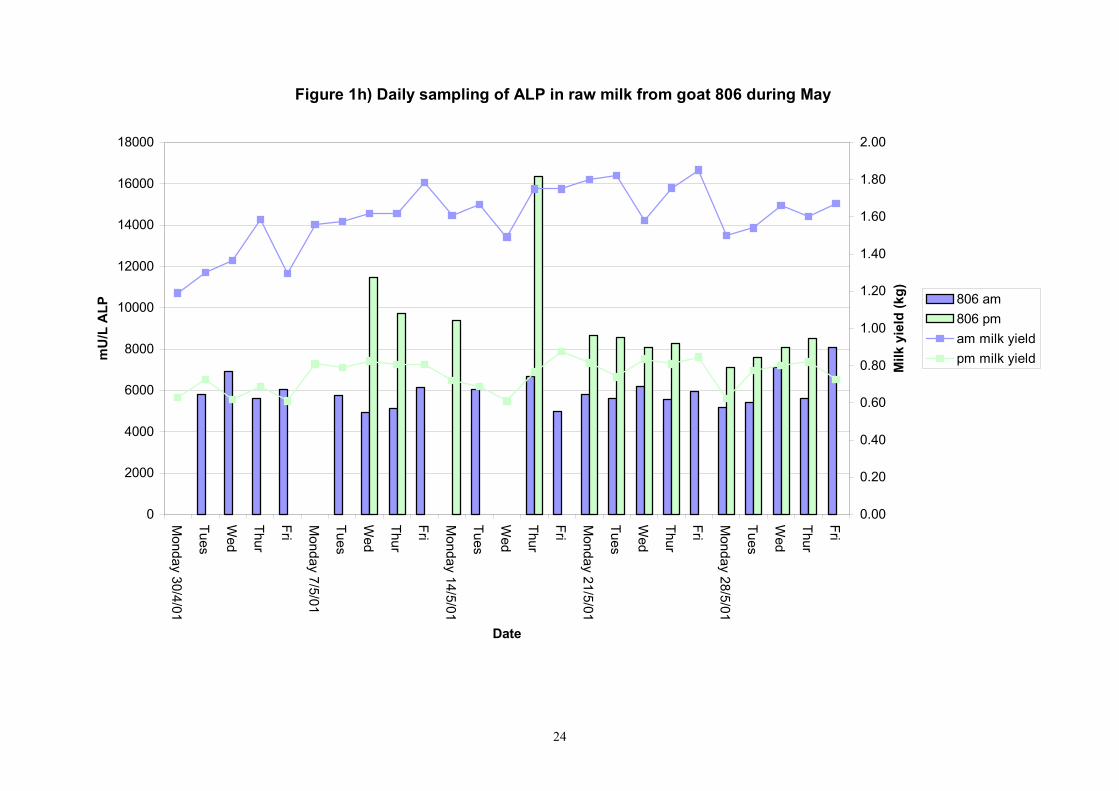
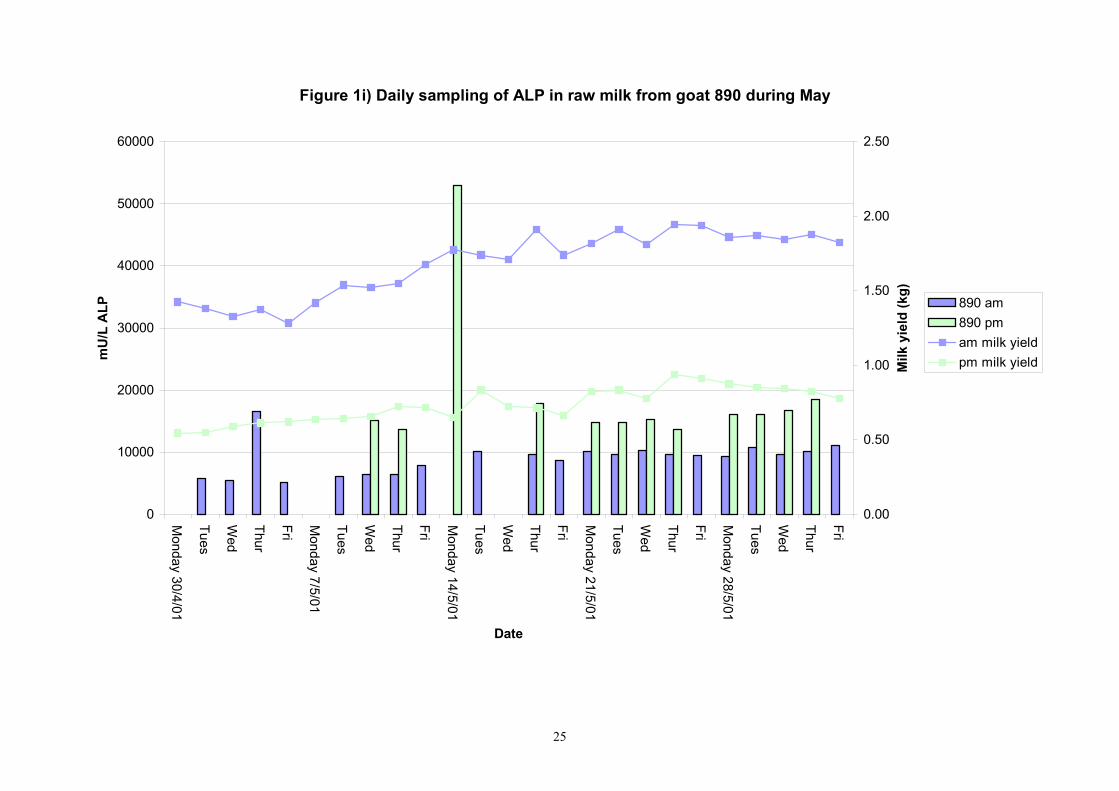
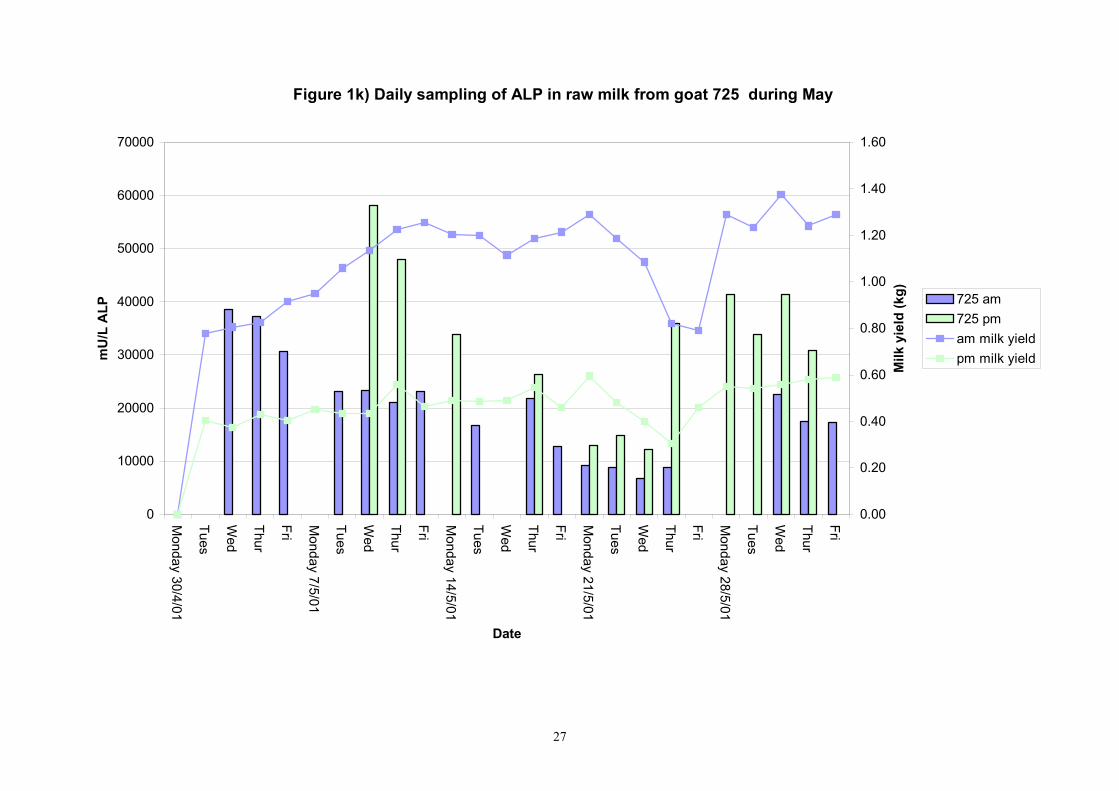
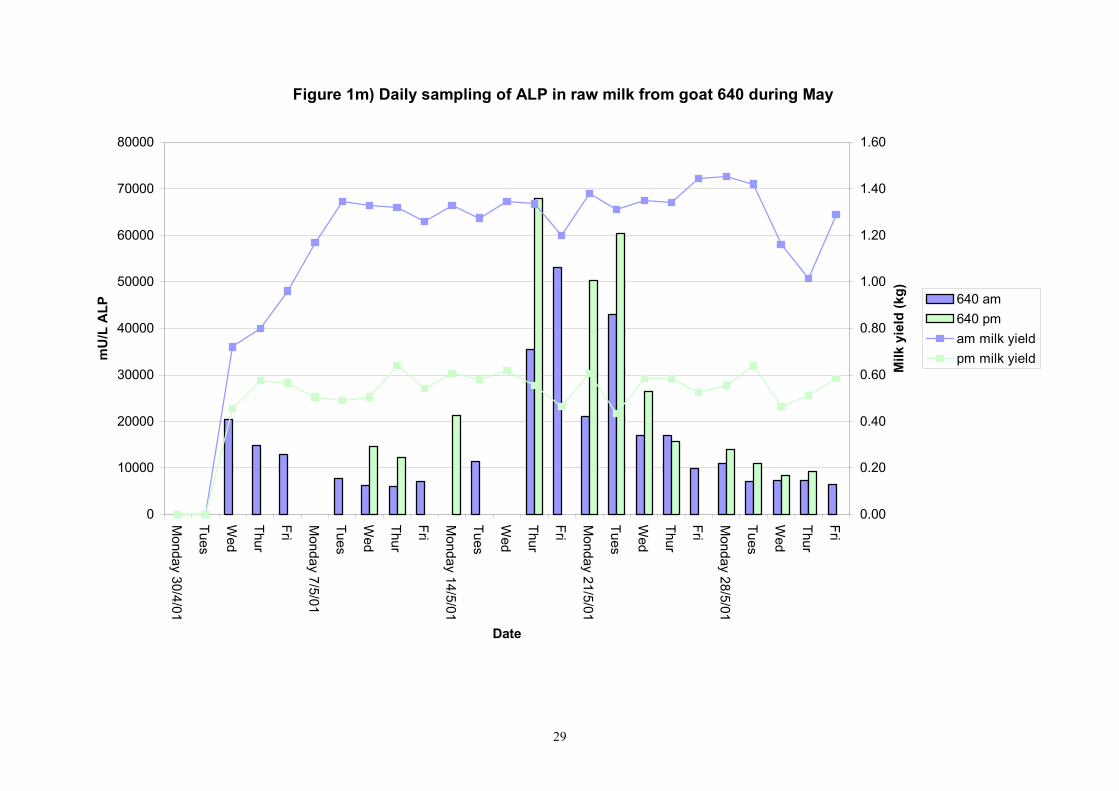
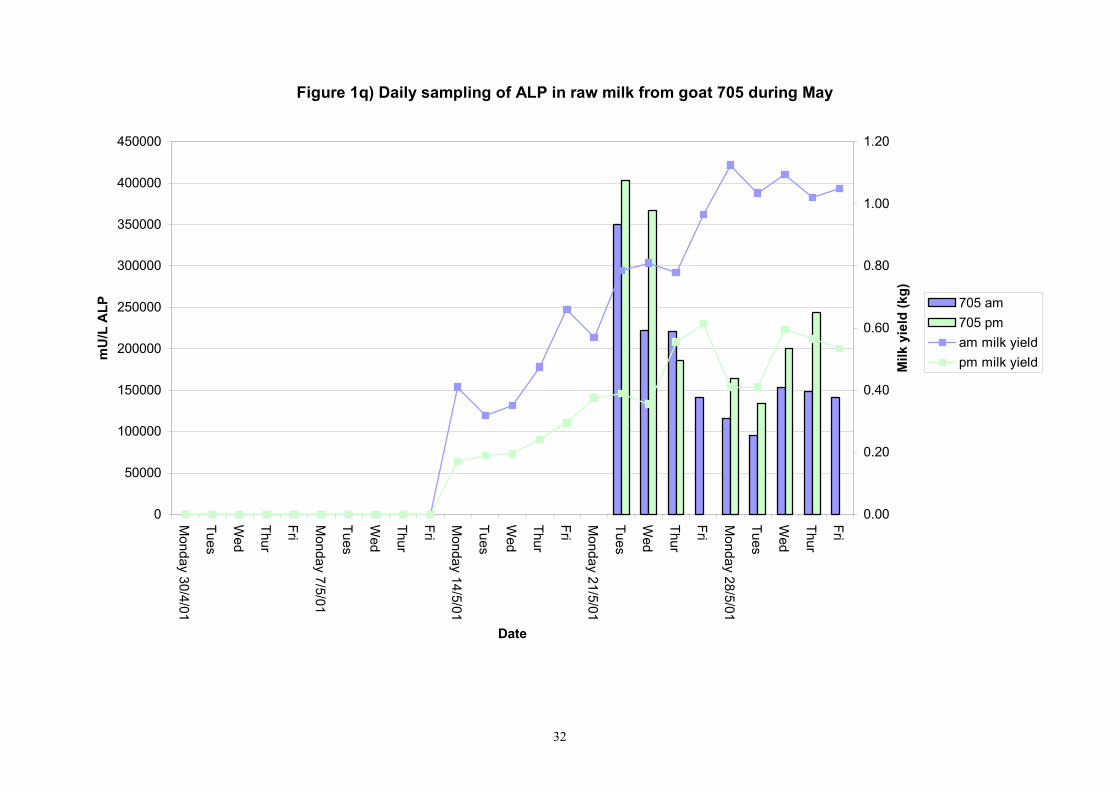
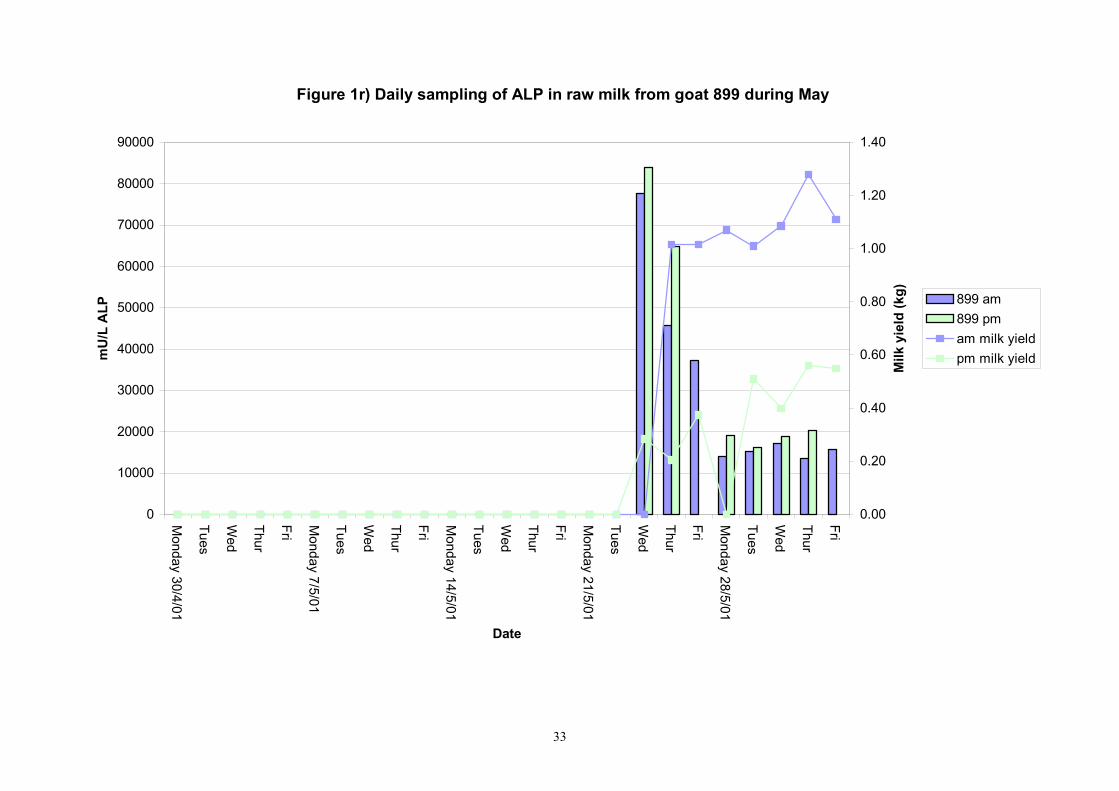
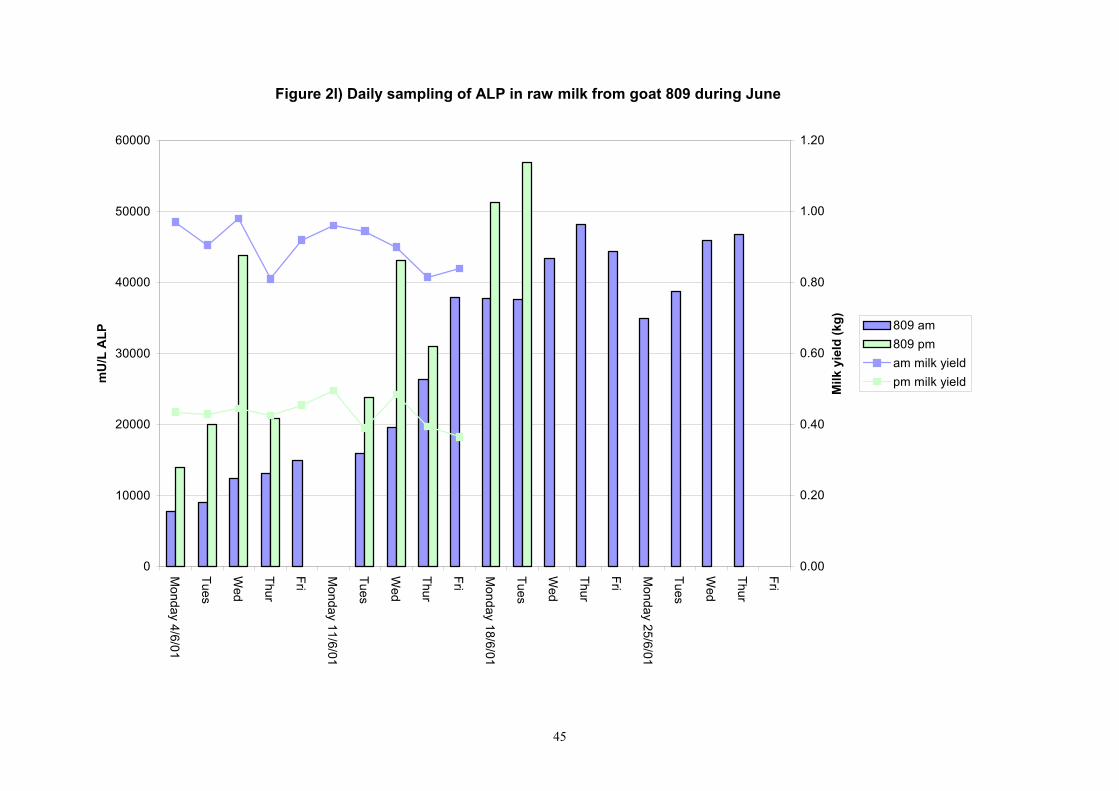
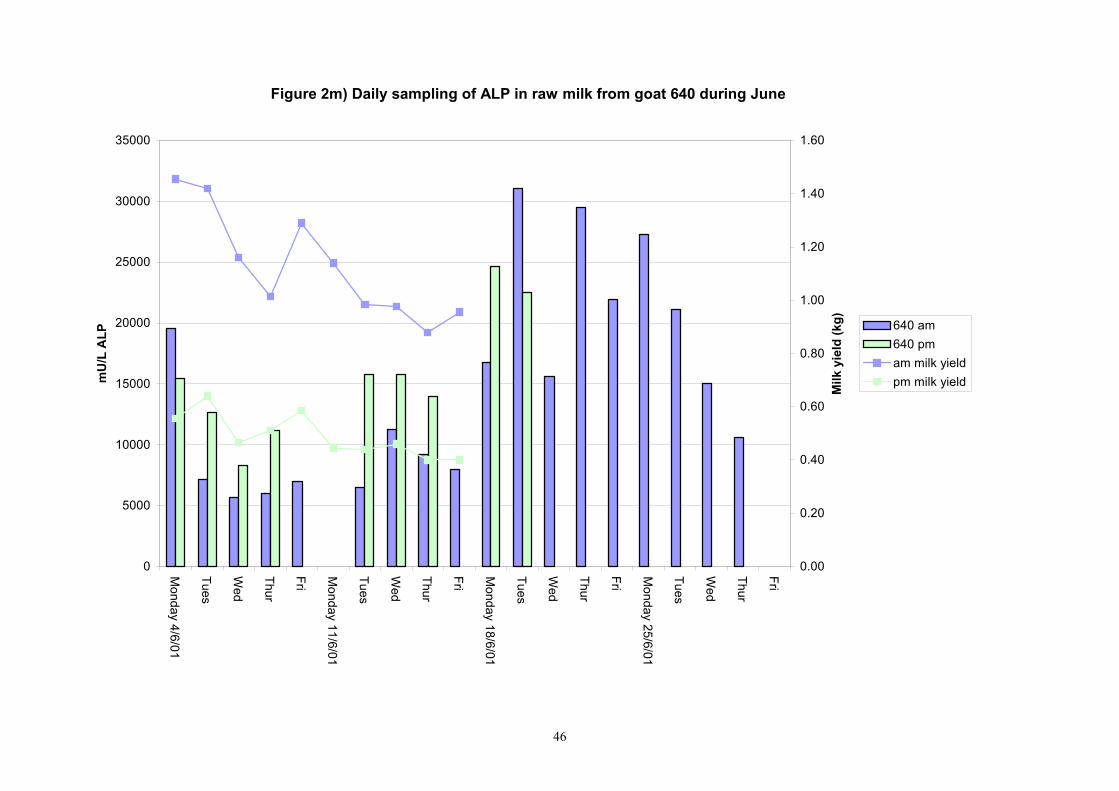
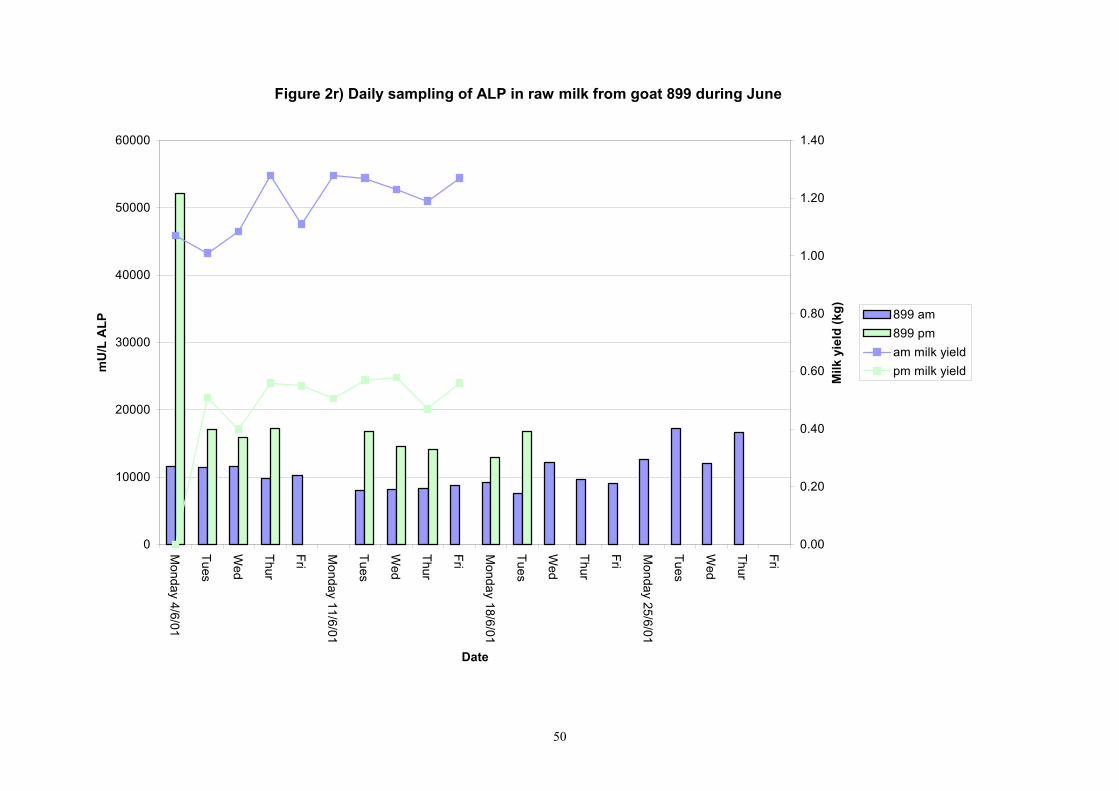
Birth of kids to individual goats occurred at regular intervals throughout April and May 2001. Individual goats produced between one and four kids and twelve of the goats gave birth to twins. Goat 705 lost both kids at birth. Sampling of goat milk morning samples was initiated on the 30th April and evening milk samples were first taken during the week beginning the 7th May. Results for alkaline phosphatase (ALP) measured by Fluorophos Individual animals monitored daily in May, June and July 2001 (Completion of Milestones 01/01; 01/02 and Deliverables 01/01; 01/02) Results for daily individual measurements of ALP in goats during May and June are shown in Figures 1a) to 1q) together with milk yield data. Mean values for ALP for individual morning and evening samples, calculated using Minitab statistical package are shown in Tables 2-5. Mean values for ALP in morning milk in May ranged form 5823.9 mU ALP/L in goat 806 to 180903 mU ALP/L in goat 705. Levels of ALP in goat 705 appeared abnormally high in comparison to the rest of the herd. The majority of goats had ALP levels less than 17000 mU ALP/L. However within individual goats there was some variabilty in ALP levels throughout the month and ALP levels double that of the normal level were observed on one or two days during the month. The lowest level recorded was 3630 mU ALP/L (Goat 605) and the highest value was 369600 mU ALP/L (goat 705). As lactation progressed through May ALP levels increased. At this stage milk yield was also increasing. Mean values for ALP in evening milk during May are shown in Table 3. ALP levels were higher in evening as compared with morning milk. Goat 605 produced the lowest mean level of ALP (7918 mU ALP/L) while the highest mean value was recorded for goat 705 (242795 mU ALP/L). ALP levels in 705 were again abnormally high and all other goats had levels approximately 10 times lower than those in 705. The minimum value observed for evening milks was 4895 mU ALP/L (Goat 605) and the maximum was 416050 (Goat 705). Milk yields in evening samples were considerably reduced as compared with morning samples. Results for daily individual measurements for June are shown in Figures 2a) to 2r). Mean values for ALP in morning and evening milk in June are shown in tables 4 and 5. Mean values for ALP in June ranged from 7888 mU ALP/L (Goat 605) to 426229 mU ALP/L (Goat 705). It was clear that as the lacation progressed levels of ALP in milk increased. Goat 610 produced milk with the lowest level of ALP (530 mU ALP/L) while goat 705 again produced the highest recorded value (188375 mU ALP/L). For evening milks, the lowest mean recorded for ALP was 11170 mU ALP/L (Goat 639) and the highest was 631615 mU ALP/L. The minimum value observed in evening milk was 7873 mU ALP/L while the maximum value was 1554125 mU ALP/L. Again it was noted that reduced milk yields in evening milk samples were associated with an increase in the concentration of ALP in milk.

6
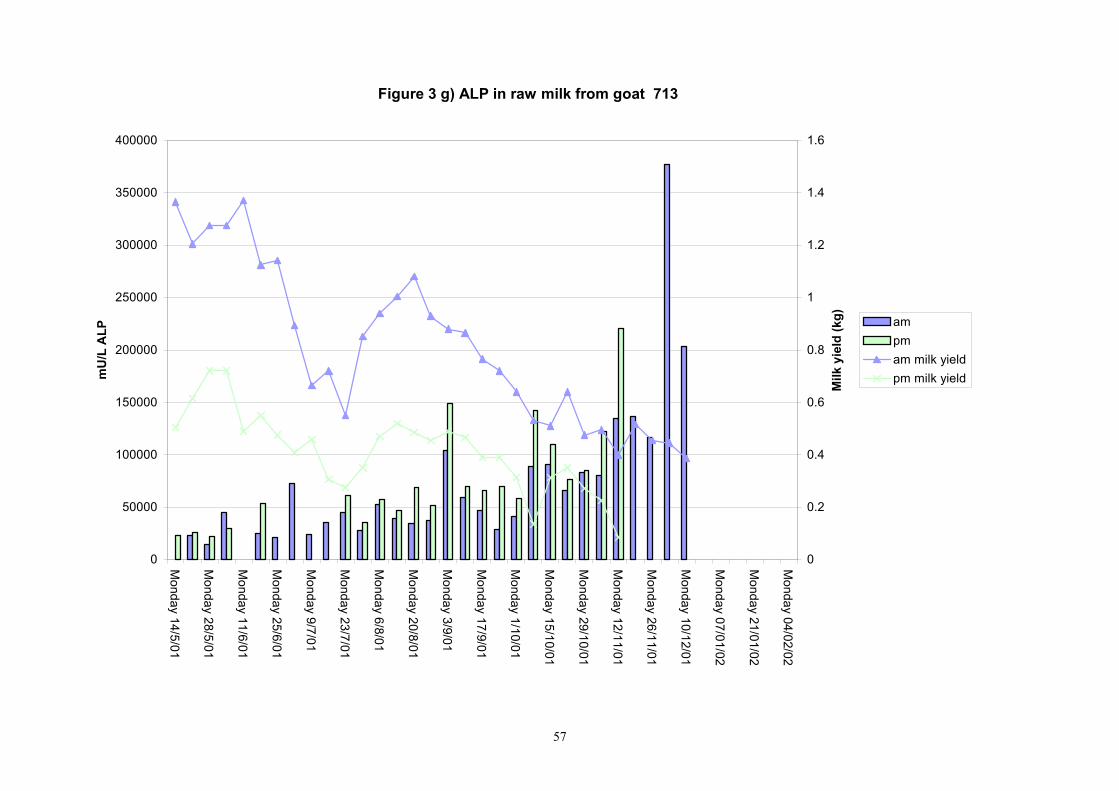
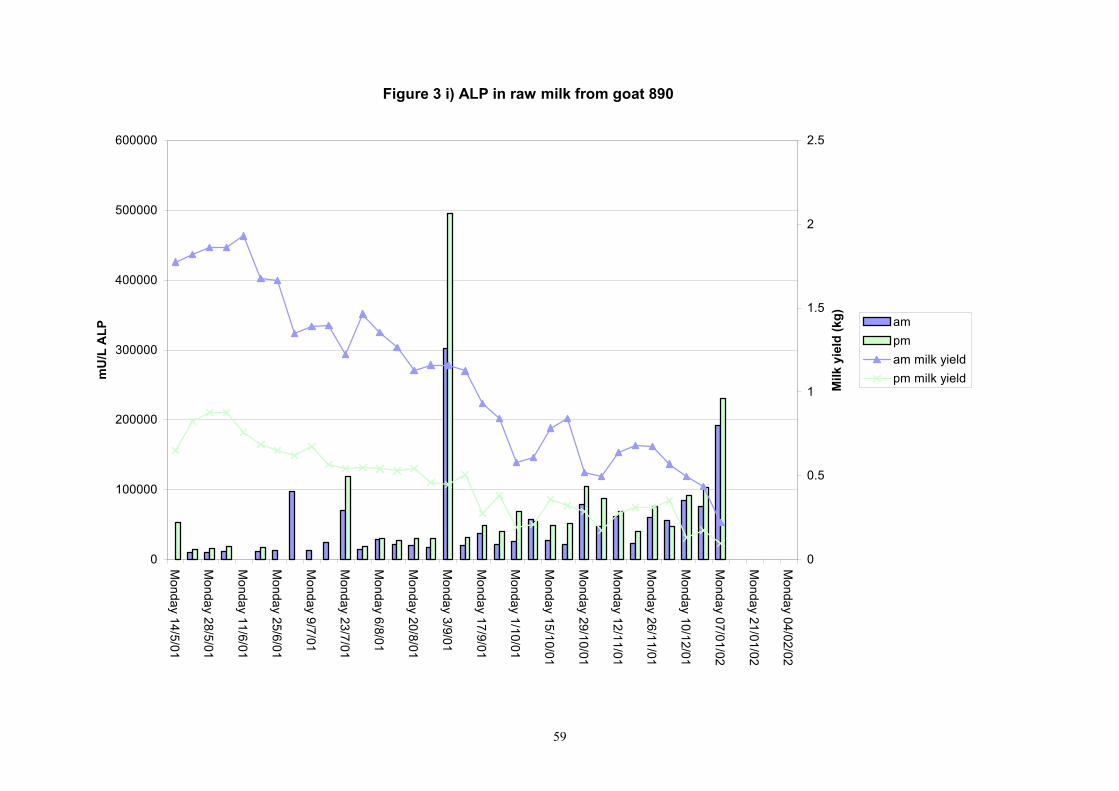
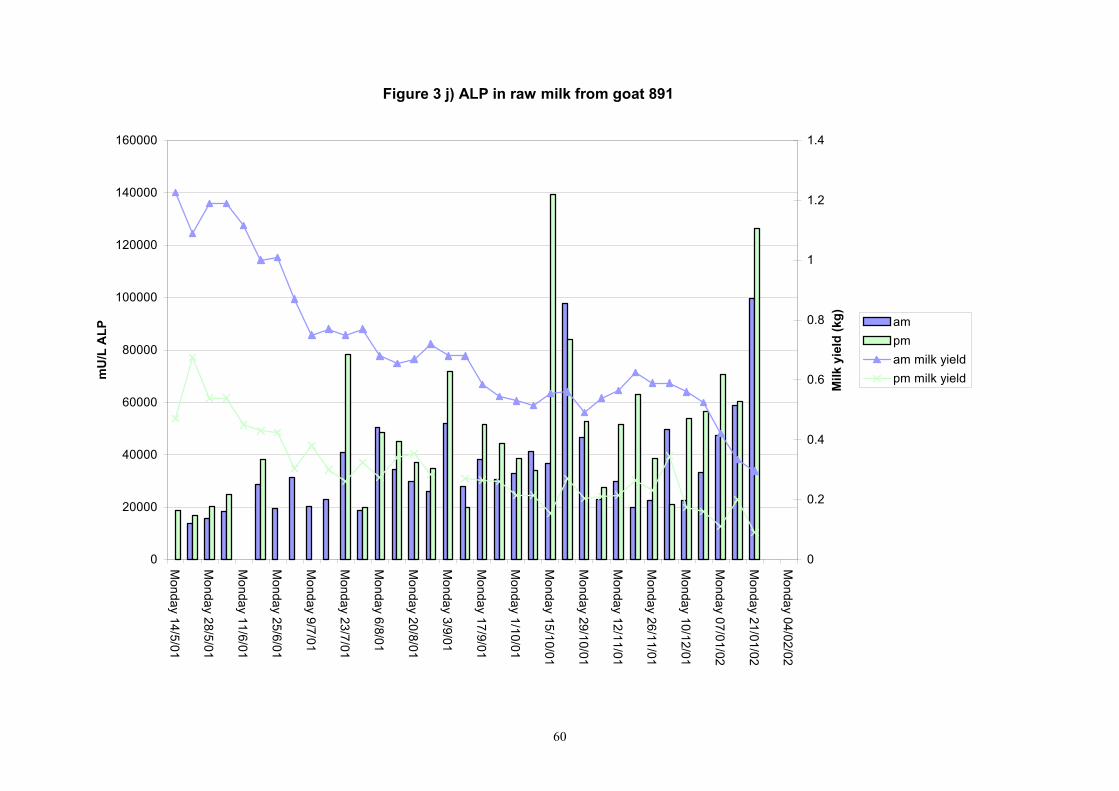
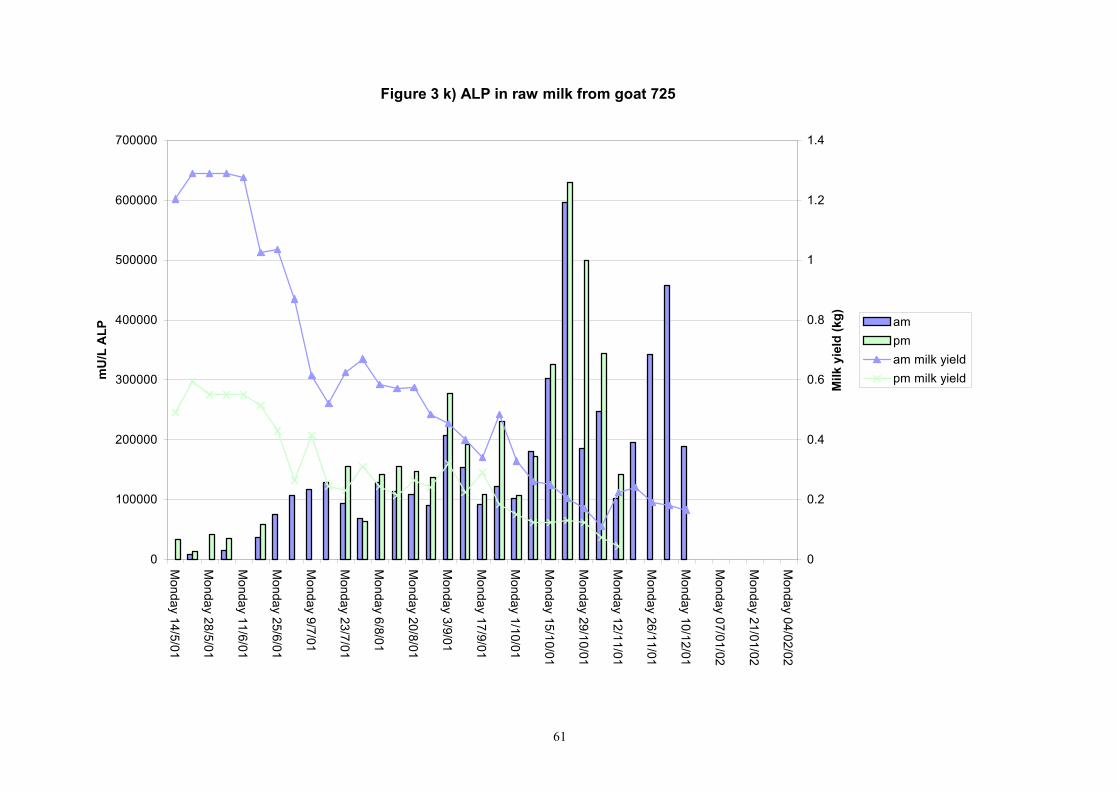
Individual animals monitored weekly July 2001 to January 2002 (Completion Milestones 01/01; 01/02; 01/03 and Deliverables 01/01; 01/02; 01/03) Results for levels of ALP individual animals are shown in Figures 3a) to 3q). Data for milk yields are also graphed. Milk was sampled on a weekly basis and both morning and evening milks were monitored. Statistical analysis of data for each month is shown in Tables 6 to 18. Results from Figures 3a (goat 601) show typical trends. As the lactation progresses and milk yield is reduced, the level of ALP in milk increases. Concentrations of ALP in evening milk are increased as milk yields are low. Although concentrations of ALP increase as the lactation progresses there are occasions where a sudden rapid rise in ALP is observed. This is particularly evident in samples from goats 610, 617, 622, 713, 804, 890, 891, 809, 640, 605 and 891. Goat 705, which produced consistently high levels of ALP throughout lactation died mid August. There was considerable variation in the level of ALP produced in individual goats, but it was clear that in the majority of samples levels in milk were too low for use in the phosphatase test to validate the efficiency of pasteurisation. This is particularly evident in the early stages of lactation, when ALP levels in milk are lowest. Milk yield data and ALP concentration data for individual milks were combined to study changes in total ALP produced in morning and evening samples throughout lactation. Results shown in Figures 4a) to r) indicate that the total quantity of ALP produced in morning samples is only slightly greater than that produced in evening samples. Additionally, the total level of ALP released into milk remains quite consistent throughout lactation in some of the goats and increases slightly in others. Milk composition and somatic cell counts were monitored from July 2001 to January 2002. Data for individual animals for morning and evening samples for July to December are shown in Figure 5a) to q) and 6a) to q). Somatic cell count data shows that Goat 705, which produced the highest recorded level of ALP in milk also had the highest somatic cell count. Statistical analysis of data is presented in the following section. Factors influencing variability ALP levels in goat milk such as somatic, cell count, milk composition, genotype and age of goat have been considered. CONCLUSIONS A lactational study on ALP levels in the milk of 17 British Saanen goats has been completed. ALP levels in goat milk are extremely variable but more importantly, levels are at least 10-fold lower than those found in cows’ milk. ALP levels in goat milk are not sufficiently high to be used as an index of effective pasteurisation. Levels are particularly low in the early stages of lactation when milk yields are highest and this is the period when current standard methods for assessing the effectiveness of pasteurisation would not adequately detect contamination of pasteurised goat milk with raw milk. Jean M Banks D Donald Muir

7
Table 1. Age distribution, casein genotype and kid births in the HRI goat herd
Goat ID Age (years) Birth of Kids No. of Kids Casein Genotype
601 4 10.4.01 2 EE
610 4 8.4.01 4 EO1
617 4 7.4.01 2 FF
618 4 6.4.01 2 FF
622 3 10.4.01 2 EE
639 2 12.4.01 2 EE
713 8 4.4.01 2 EE
806 7 9.4.01 1 EE
890 7 9.4.01 1 FF
891 6 11.4.01 1 FF
725 8 28.4.01 1 B2E
809 7 29.4.01 2 B2E
640 2 30.4.01 2 AbB2
605 4 30.4.01 2 B2E
637 1 17.5.01 2 B2E
705 8 11.5.01 2 (died at birth) -
899 7 21.5.01 2 FF

8
Table 2. Variability of alkaline phosphatase in individual morning goat milk samples in May 2001 Goat ID Age N Mean Median StDev SE Mean Minimum Maximum Q1 Q3
601 4 20 9734 9080 2849 451 7100 20710 7955 10326 610 4 20 6047 6170 1188 188 4300 9215 4895 6665 617 4 20 8777 9205 1506 238 5745 10825 7265 10045 618 4 20 10067 10010 2078 328 7010 13700 8155 12044 622 3 20 11045 9470 4687 741 7010 26780 8965 11114 639 2 20 8358 8195 4207 665 4135 25765 5769 9424 713 8 20 16989 14665 10463 1654 10390 60175 12385 16985 806 7 20 5823.9 5745.0 625.9 99.0 4825.0 7770.0 5400.0 6160.0 890 7 20 8868 9470 2592 410 4990 17080 6415 10005 891 6 Not in milk 725 8 16 20149 21468 9535 1686 6595 38615 10269 23561 809 7 19 23175 13228 26575 4311 8275 110950 10113 18256 640 2 19 16644 11448 13136 2131 5840 54430 7309 20429 605 4 19 12372 7135 12793 2075 3630 54430 4645 14635 637 1 4 12506 12078 2730 965 9285 16825 10245 15084 705 8 8 180903 149058 79493 19873 92540 369600 123603 222275 899 7 7 31501 17205 23053 6161 13445 79780 14003 45299
Table 3. Variability of alkaline phosphatase in individual evening goat milk samples in May 2001
Goat ID Age N Mean Median StDev SE Mean Min Max Q1 Q3 601 4 12 18517 18135 6321 1290 8460 29650 12874 24400 610 4 12 9475 9125 2045 417 7265 15375 8275 9845 617 4 12 13089 12885 2014 411 10390 18570 11658 14119 618 4 12 16399 15710 2446 499 12850 21490 14774 17964 622 3 12 14617 15250 2921 596 10230 20780 11899 16560 639 2 12 8323 7815 1483 303 6415 11770 7118 9356 713 8 12 24476 23445 6074 1240 17490 42340 20900 25928 806 7 12 9316 8413 2440 498 6850 16735 8018 9679 890 7 12 18814 15665 10650 2174 13515 54430 14611 17349 891 6 12 20510 19780 3159 645 16480 28225 17951 22560 725 8 12 32481 33800 13881 2833 11745 58820 17588 41355 809 7 12 16884 15838 4803 980 10895 30595 13700 18829 640 2 12 26001 14998 20770 4240 8205 69555 11403 43006 605 4 12 7918 6678 3114 636 4895 16620 5871 8940 637 1 7 17958 14998 4194 1121 13950 24410 14550 22663 705 8 7 242795 200450 99868 26691 132575 416050 168128 360688 899 7 6 37155 19650 28070 8103 16065 84930 18381 64978

9
Table 4. Variability of alkaline phosphatase in individual morning goat milk samples in June 2001 Goat ID Age N Mean Median StDev SE Mean Minimum Maximum Q1 Q3
601 4 19 20142 19675 8318 1908 623 39740 16493 23918 610 4 19 10865 10620 3998 917 530 19398 8575 13525 617 4 19 13854 12905 4402 1010 10920 31340 11928 13975 618 4 19 15769 14803 2835 651 12550 21883 13918 16618 622 3 19 19607 20330 4959 1138 12643 26305 14183 24353 639 2 19 9745 9505 2265 520 6860 16090 8045 10825 713 8 19 23371 22008 7303 1675 15470 44338 17940 25593 806 7 19 8360 7643 2278 523 5975 15298 6895 8838 890 7 19 13281 12905 3402 781 9815 24755 10953 15285 891 6 19 21221 19628 3579 821 16793 29088 18653 23870 725 8 19 34092 32570 16251 3728 15515 75058 18698 45580 809 7 19 30449 37615 14522 3331 7783 48223 14893 43855 640 2 19 15057 15078 8202 1882 5700 31075 7160 21088 605 4 19 7888 6985 2518 578 5218 14595 6103 9320 637 1 19 10190 10000 2489 571 6138 17503 8573 11413 705 8 19 426229 263850 306906 70409 188375 1170050 225250 513725 899 7 19 11113 10173 3036 696 7595 17238 8758 12148
Table 5. Variability of alkaline phosphatase in individual evening goat milk samples in June 2001
Goat ID Age N Mean Median StDev SE Mean Minimum Maximum Q1 Q3 601 4 10 26773 25903 8950 2830 15240 44383 19319 32146 610 4 10 13230 13308 2665 843 9988 19275 10685 14183 617 4 10 20252 18095 6445 2038 15388 37660 16864 21260 618 4 10 22612 22255 1624 514 20640 24835 21104 24368 622 3 10 22833 20383 5763 1822 17113 35810 18904 27049 639 2 10 11170 10406 2245 710 9553 17113 9955 11575 713 8 10 32372 27054 10471 3311 22318 53798 26689 38585 806 7 10 13173 10896 6797 2149 7918 31215 10090 13101 890 7 10 17797 17411 4935 1561 9378 28513 15858 19491 891 6 10 45277 24979 60500 19132 16618 216750 24358 32351 725 8 10 42214 39030 14490 4582 24400 74925 33621 47697 809 7 10 36228 37040 16337 5166 13883 57728 20638 52699 640 2 10 21129 15608 18201 5756 8310 71035 12291 23068 605 4 10 11669 11796 3375 1067 7873 17548 8033 13961 637 1 10 14196 13728 3386 1071 8803 22330 12853 14856 705 8 10 631615 404825 502705 158969 178925 1554125 237894 1002631 899 7 10 20262 16711 11703 3701 12998 52198 14426 19238

10
Table 6. Variability of alkaline phosphatase in individual morning goat milk samples in July 2001 Goat ID Age N Mean Median StDev SE Mean Minimum Maximum Q1 Q3
601 4 13 51638 46338 18031 5001 38995 109915 44005 51528 610 4 13 31179 19513 26809 7436 14908 97593 16344 31685 617 4 13 18603 12905 15178 4210 10380 55463 11101 14629 618 4 13 24429 18525 12968 3597 13503 60118 17210 30886 622 3 13 52912 31790 50225 13930 20515 167925 25974 50659 639 2 13 19710 17675 7379 2047 12263 33810 14153 24956 713 8 13 37140 30500 15507 4301 23835 72543 28536 40326 806 7 13 14693 11273 7162 1986 8540 31145 9683 18503 890 7 13 33292 16090 34671 9616 12020 108915 12935 47775 891 6 13 27474 25283 7815 2167 18825 40878 20291 33741 725 8 13 106022 106445 36561 10140 64070 187100 73754 128360 809 7 13 65012 49118 38636 10716 30640 150643 37414 74868 640 2 13 26995 20263 22573 6261 13608 99583 16044 27744 605 4 13 17691 15295 7300 2025 8435 32685 11378 23094 637 1 13 15612 14205 4006 1111 11125 24190 12759 18394 705 8 13 426517 415225 171161 47471 117270 810225 347538 524050 899 7 13 18276 17583 5807 1611 11125 34718 14590 20215
Table 7. Variability of alkaline phosphatase in individual morning goat milk samples in August 2001 Goat ID Age N Mean Median StDev SE Mean Minimum Maximum Q1 Q3 601 4 4 91870 89503 19528 9764 70675 117800 74790 111318 610 4 4 31215 30790 15310 7655 15610 47670 16978 45878 617 4 4 32615 15538 35401 17700 13720 85665 13778 68530 618 4 4 44556 24298 46020 23010 16800 112830 16899 92473 622 3 4 96263 42500 110678 55339 37860 262190 38135 208153 639 2 4 27818 24248 12354 6177 17125 45650 18860 40345 713 8 4 40896 38168 8307 4153 34315 52935 34930 49591 806 7 4 16048 14985 3508 1754 13170 21050 13418 19740 890 7 4 21818 20465 4588 2294 17950 28390 18375 26613 891 6 4 35150 31950 10848 5424 26085 50615 26959 46541 725 8 4 109971 110768 15691 7846 90120 128230 94725 124421 809 7 4 84446 87618 21006 10503 55990 106560 63506 102215 640 2 4 26838 27585 3947 1973 21700 30480 22740 30188 605 4 4 36001 33238 9317 4659 28065 49465 29191 45575 637 1 4 29605 29053 3495 1748 26115 34200 26556 33206 705 8 2 305345 305345 144186 101955 203390 407300 * * 899 7 4 33988 33728 642 321 33560 34935 33576 34659

11
Table 8. Variability of alkaline phosphatase in individual evening goat milk samples in August 2001 Goat ID Age N Mean Median StDev SE Mean Minimum Maximum Q1 Q3
601 4 4 121404 124008 17355 8677 100285 137315 103774 136430 610 4 4 31549 31710 5194 2597 25700 37075 26493 36444 617 4 4 29875 21400 18060 9030 19810 56890 19869 48356 618 4 4 46286 32123 33472 16736 24940 95960 25664 81073 622 3 4 101560 66485 83939 41969 46890 226380 49953 188243 639 2 4 30604 30490 5062 2531 25280 36155 25839 35483 713 8 4 56084 54293 9735 4868 46590 69160 47791 66168 806 7 4 21974 21640 2997 1499 18685 25930 19334 24948 890 7 4 29576 30350 1832 916 26850 30755 27688 30691 891 6 4 41424 41178 6488 3244 34820 48520 35406 47688 725 8 4 145156 144370 7443 3721 137540 154345 138409 152690 809 7 4 109781 110890 13329 6665 94420 122925 96586 121868 640 2 4 41949 41100 9331 4666 33305 52290 33691 51055 605 4 4 56595 56188 19280 9640 33855 80150 38280 75318 637 1 4 41826 43028 4660 2330 35280 45970 36953 45499 705 8 2 275095 275095 115478 81655 193440 356750 * * 899 7 4 50544 42085 19779 9889 38040 79965 38534 71013
Table 9. Variability of alkaline phosphatase in individual morning goat milk samples in September 2001
Goat ID Age N Mean Median StDev SE Mean Minimum Maximum Q1 Q3 601 4 4 196110 168838 95506 47753 120535 326230 122558 296935 610 4 4 83895 80930 78023 39011 10850 162870 13930 156825 617 4 4 36158 22425 32651 16326 15080 84700 16115 69933 618 4 4 33169 29365 21798 10899 13490 60455 14583 55559 622 3 4 156743 146958 140987 70494 28090 304965 32239 291031 639 2 4 27869 27018 5276 2638 22755 34685 23278 33311 713 8 4 59640 52753 31969 15984 29075 103980 33506 92661 806 7 4 26428 22663 9914 4957 19540 40845 19729 36891 890 7 4 95025 29365 137809 68905 19975 301395 20303 235408 891 6 4 37225 34513 10826 5413 27815 52060 28550 48613 725 8 4 143898 138118 49112 24556 92190 207165 99748 193828 809 7 4 98015 91205 24515 12257 78885 130765 79051 123789 640 2 4 49740 47523 16812 8406 32180 71735 34818 66880 605 4 4 73810 69358 33757 16878 37535 118990 44666 107406 637 1 4 31471 31650 2884 1442 27810 34775 28638 34126 705 8 Died on/about 20 August 899 7 4 56320 46433 20546 10273 45300 87115 45399 77129
12
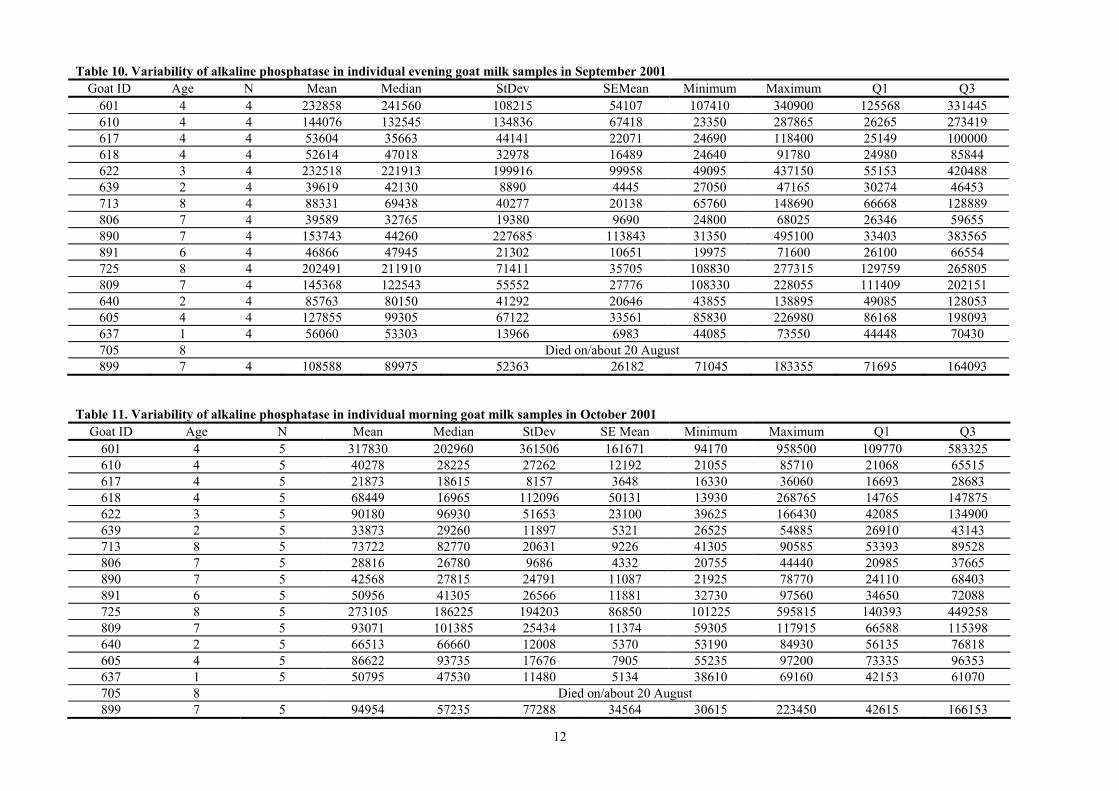
Table 10. Variability of alkaline phosphatase in individual evening goat milk samples in September 2001 Goat ID Age N Mean Median StDev SEMean Minimum Maximum Q1 Q3
601 4 4 232858 241560 108215 54107 107410 340900 125568 331445 610 4 4 144076 132545 134836 67418 23350 287865 26265 273419 617 4 4 53604 35663 44141 22071 24690 118400 25149 100000 618 4 4 52614 47018 32978 16489 24640 91780 24980 85844 622 3 4 232518 221913 199916 99958 49095 437150 55153 420488 639 2 4 39619 42130 8890 4445 27050 47165 30274 46453 713 8 4 88331 69438 40277 20138 65760 148690 66668 128889 806 7 4 39589 32765 19380 9690 24800 68025 26346 59655 890 7 4 153743 44260 227685 113843 31350 495100 33403 383565 891 6 4 46866 47945 21302 10651 19975 71600 26100 66554 725 8 4 202491 211910 71411 35705 108830 277315 129759 265805 809 7 4 145368 122543 55552 27776 108330 228055 111409 202151 640 2 4 85763 80150 41292 20646 43855 138895 49085 128053 605 4 4 127855 99305 67122 33561 85830 226980 86168 198093 637 1 4 56060 53303 13966 6983 44085 73550 44448 70430 705 8 Died on/about 20 August 899 7 4 108588 89975 52363 26182 71045 183355 71695 164093
Table 11. Variability of alkaline phosphatase in individual morning goat milk samples in October 2001 Goat ID Age N Mean Median StDev SE Mean Minimum Maximum Q1 Q3
601 4 5 317830 202960 361506 161671 94170 958500 109770 583325 610 4 5 40278 28225 27262 12192 21055 85710 21068 65515 617 4 5 21873 18615 8157 3648 16330 36060 16693 28683 618 4 5 68449 16965 112096 50131 13930 268765 14765 147875 622 3 5 90180 96930 51653 23100 39625 166430 42085 134900 639 2 5 33873 29260 11897 5321 26525 54885 26910 43143 713 8 5 73722 82770 20631 9226 41305 90585 53393 89528 806 7 5 28816 26780 9686 4332 20755 44440 20985 37665 890 7 5 42568 27815 24791 11087 21925 78770 24110 68403 891 6 5 50956 41305 26566 11881 32730 97560 34650 72088 725 8 5 273105 186225 194203 86850 101225 595815 140393 449258 809 7 5 93071 101385 25434 11374 59305 117915 66588 115398 640 2 5 66513 66660 12008 5370 53190 84930 56135 76818 605 4 5 86622 93735 17676 7905 55235 97200 73335 96353 637 1 5 50795 47530 11480 5134 38610 69160 42153 61070 705 8 Died on/about 20 August 899 7 5 94954 57235 77288 34564 30615 223450 42615 166153
13
Table 12. Variability in alkaline phosphatase in individual evening goat milk samples in October 2001 Goat ID Age N Mean Median StDev SE Mean Minimum Maximum Q1 Q3
601 4 5 379061 275085 371996 166362 121290 1032950 149703 660408 610 4 5 49207 34430 43669 19529 22070 126165 22748 83055 617 4 5 30286 26870 7028 3143 24345 38845 24413 37868 618 4 5 59265 24205 73246 32756 18800 189215 20123 115938 622 3 5 130867 133750 84908 37972 47510 254055 51600 208693 639 2 5 43970 36200 18865 8436 32730 77275 32995 58830 713 8 5 94382 84905 32718 14632 58040 142510 67325 126178 806 7 5 37781 37900 10055 4497 23790 51580 29293 46210 890 7 5 65562 53945 23345 10440 49305 105250 50360 86573 891 6 5 69787 52590 43595 19496 34180 139495 36375 111798 725 8 5 346846 326400 219067 97970 106900 630050 139390 564525 809 7 5 121269 102490 59478 26600 80860 226315 86458 165470 640 2 5 95001 101640 25304 11316 60615 127430 70805 115878 605 4 5 114952 117570 26212 11722 71505 141195 94168 134428 637 1 5 71109 69090 20256 9059 48405 96170 51818 91410 705 8 Died on/about 20 August 899 7 5 251825 83365 369205 165113 56060 910650 68565 519315
Table 13. Variability in alkaline phosphatase in individual morning goat milk samples in November 2001
Goat ID Age N Mean Median StDev SE Mean Minimum Maximum Q1 Q3 601 4 4 782000 662650 325347 162674 540400 1262300 570563 1112788 610 4 4 18658 19710 6177 3089 10410 24800 12284 23979 617 4 4 25888 20698 13886 6943 15790 46365 16698 40268 618 4 4 19818 19330 4319 2159 15650 24960 15966 24156 622 3 4 103778 109388 40268 20134 50520 145815 62749 139196 639 2 4 43948 43568 6632 3316 36525 52130 37738 50538 713 8 4 116998 125418 26080 13040 80330 136825 89359 136216 806 7 4 36068 32178 13851 6926 24705 55210 25326 50699 890 7 4 48045 53798 17921 8961 23190 61395 29063 61275 891 6 4 23784 22733 4135 2067 19995 29675 20656 27963 725 8 4 222080 221965 100409 50204 101940 342450 125516 318759 809 7 4 161235 155655 58430 29215 95690 237940 110635 217415 640 2 4 63395 60635 16405 8202 46530 85780 49603 79948 605 4 4 73489 73068 14553 7276 59625 88195 60325 87074 637 1 4 38664 34010 10035 5017 32940 53695 33159 48823 705 8 Died on/about 20 August 899 7 4 105308 85103 62820 31410 54340 196685 60499 170321

14
Table 14. Variability in alkaline phosphatase in individual evening goat milk samples in November 2001 Goat ID Age N Mean Median StDev SE Mean Minimum Maximum Q1 Q3
601 4 4 834750 755400 175358 87679 731600 1096600 733788 1015063 610 4 4 27336 26330 13317 6658 13220 43465 15013 40666 617 4 4 34373 36325 8623 4312 22275 42565 25538 41255 618 4 4 28420 30673 5895 2948 19765 32570 22243 32345 622 3 4 128814 123475 62196 31098 58360 209945 74398 188569 639 2 4 53286 55695 14746 7373 34845 66910 38161 66003 713 8 2 171283 171283 69887 49418 121865 220700 * * 806 7 4 33414 34373 8054 4027 22710 42200 25450 40419 890 7 4 68018 72538 19960 9980 40180 86815 47368 84148 891 6 4 45239 45083 15429 7715 27650 63140 30385 60249 725 8 2 243828 243828 142443 100723 143105 344550 * * 809 7 2 280690 280690 214762 151860 128830 432550 * * 640 2 4 97870 108223 28146 14073 56635 118400 68409 116979 605 4 4 105760 112143 24091 12045 71900 126855 80501 124636 637 1 4 66584 58798 25535 12767 45535 103205 47593 93361 705 8 Died on/about 20 August 899 7 4 151850 110558 100511 50256 85550 300735 88566 256426
Table 15. Variability in alkaline phosphatase in individual morning goat milk samples in December 2001
Goat ID Age N Mean Median StDev SE Mean Minimum Maximum Q1 Q3 601 4 3 548583 530500 79238 45748 479950 635300 479950 635300 610 4 617 4 3 26393 23260 7830 4521 20615 35305 20615 35305 618 4 3 16158 14525 3845 2220 13400 20550 13400 20550 622 3 3 94010 71990 65254 37674 42615 167425 42615 167425 639 2 3 46177 37100 21475 12399 30730 70700 30730 70700 713 8 2 289748 289748 122969 86953 202795 376700 * * 806 7 3 25673 22870 6301 3638 21260 32890 21260 32890 890 7 3 72068 75440 15044 8685 55625 85140 55625 85140 891 6 3 35172 33210 13713 7917 22545 49760 22545 49760 725 8 2 323380 323380 190523 134720 188660 458100 * * 809 7 Dried off 640 2 3 68080 76240 18240 10531 47185 80815 47185 80815 605 4 3 66772 78080 27519 15888 35400 86835 35400 86835 637 1 3 60497 53300 19972 11531 45120 83070 45120 83070 705 8 Died on/about 20 August 899 7 3 168352 99270 162241 93670 52085 353700 52085 353700

15
Table 16. Variability in alkaline phosphatase in individual evening goat milk samples in December 2001 Goat ID Age N Mean Median StDev SE Mean Minimum Maximum Q1 Q3
601 4 3 542850 508700 98757 57018 465700 654150 465700 654150 610 4 3 42605 21745 39583 22853 17815 88255 17815 88255 617 4 3 38630 29305 20707 11955 24225 62360 24225 62360 618 4 3 26677 27145 7513 4338 18940 33945 18940 33945 622 3 3 142068 74540 139997 80828 48635 303030 48635 303030 639 2 3 54543 62840 17293 9984 34665 66125 34665 66125 713 8 Dried off 806 7 3 37633 24320 23904 13801 23350 65230 23350 65230 890 7 3 81003 91730 29411 16980 47735 103545 47735 103545 891 6 3 43895 54015 19720 11385 21170 56500 21170 56500 725 8 Dried off 809 7 Dried off 640 2 3 103990 76655 49452 28551 74240 161075 74240 161075 605 4 3 110588 71505 95121 54918 41235 219025 41235 219025 637 1 3 102062 76885 58291 33655 60590 168710 60590 168710 705 8 Died on/about 20 August 899 7 3 211413 106170 194007 112010 92770 435300 92770 435300
Table 17. Variability in alkaline phosphatase in individual morning goat milk samples in January 2002
Goat ID Age N Mean Median StDev SE Mean Minimum Maximum Q1 Q3 601 4 2 234378 234378 24349 17217 217160 251595 * * 610 4 3 31890 19150 22929 13238 18160 58360 18160 58360 617 4 3 38293 33995 16547 9553 24320 56565 24320 56565 618 4 3 40928 28850 25538 14744 23670 70265 23670 70265 622 3 3 110450 72355 69251 39982 68610 190385 68610 190385 639 2 3 27007 24040 5746 3318 23350 33630 23350 33630 713 8 Dried off 806 7 3 25882 22480 6053 3495 22295 32870 22295 32870 890 7 1 191560 191560 * * 191560 191560 * * 891 6 3 68642 58680 27501 15878 47510 99735 47510 99735 725 8 Dried off 809 7 Dried off 640 2 3 62557 68630 14298 8255 46225 72815 46225 72815 605 4 3 77690 66790 24954 14407 60040 106240 60040 106240 637 1 3 75100 54590 37270 21518 52590 118120 52590 118120 705 8 Died on/about 20 August 899 7 3 101257 63325 68872 39763 59690 180755 59690 180755

16
Table 18. Variability in alkaline phosphatase in individual evening goat milk samples in January 2002 Goat ID Age N Mean Median StDev SE Mean Minimum Maximum Q1 Q3
601 4 2 262113 262113 42112 29777 232335 291890 * * 610 4 3 32408 25145 13731 7927 23835 48245 23835 48245 617 4 3 48683 42410 21774 12571 30735 72905 30735 72905 618 4 3 61743 42405 33794 19511 42060 100765 42060 100765 622 3 3 115510 95390 35226 20338 94955 156185 94955 156185 639 2 3 29612 29375 3511 2027 26225 33235 26225 33235 713 8 Dried off 806 7 3 29008 29675 3212 1855 25515 31835 25515 31835 890 7 1 231135 231135 * * 231135 231135 * * 891 6 3 85757 70540 35520 20507 60380 126350 60380 126350 725 8 Dried off 809 7 Dried off 640 2 3 78762 74495 11538 6661 69965 91825 69965 91825 605 4 3 93863 92535 7546 4357 87070 101985 87070 101985 637 1 3 114412 98080 44879 25911 79985 165170 79985 165170 705 8 Dried off 899 7 3 120502 85225 75653 43678 68930 207350 68930 207350
17
Figure 1a) Daily sampling of ALP in raw milk from goat 601 during May
0
5000
10000
15000
20000
25000
30000
Monday 30/4/01
Tues
Wed
Thur
Fri
Monday 7/5/01
Tues
Wed
Thur
Fri
Monday 14/5/01
Tues
Wed
Thur
Fri
Monday 21/5/01
Tues
Wed
Thur
Fri
Monday 28/5/01
Tues
Wed
Thur
Fri
Date
mU
/L A
LP
0.00
0.50
1.00
1.50
2.00
2.50
3.00
Milk
yie
ld (k
g)
601 am
601 pm
am milkyieldpm milkyield

18
Figure 1b) Daily sampling of ALP in raw milk from goat 610 during May
0
2000
4000
6000
8000
10000
12000
14000
16000
Monday 30/4/01
Tues
Wed
Thur
Fri
Monday 7/5/01
Tues
Wed
Thur
Fri
Monday 14/5/01
Tues
Wed
Thur
Fri
Monday 21/5/01
Tues
Wed
Thur
Fri
Monday 28/5/01
Tues
Wed
Thur
Fri
Date
mU
/L A
LP
0.00
0.50
1.00
1.50
2.00
2.50
Milk
yie
ld (k
g) 610 am610 pmam milk yieldpm milk yield
19
Figure 1c) Daily sampling of ALP in raw milk from goat 617 during May
0
2000
4000
6000
8000
10000
12000
14000
16000
18000
20000
Monday 30/4/01
Tues
Wed
Thur
Fri
Monday 7/5/01
Tues
Wed
Thur
Fri
Monday 14/5/01
Tues
Wed
Thur
Fri
Monday 21/5/01
Tues
Wed
Thur
Fri
Monday 28/5/01
Tues
Wed
Date
mU
/L A
LP
0.00
0.20
0.40
0.60
0.80
1.00
1.20
1.40
1.60
Milk
yie
ld (k
g)
617 am617 pmam milk yieldpm milk yield

20
Figure 1d) Daily sampling of ALP in raw milk from goat 618 during May
0
5000
10000
15000
20000
25000
Monday 30/4/01
Tues
Wed
Thur
Fri
Monday 7/5/01
Tues
Wed
Thur
Fri
Monday 14/5/01
Tues
Wed
Thur
Fri
Monday 21/5/01
Tues
Wed
Thur
Fri
Monday 28/5/01
Tues
Wed
Thur
Fri
Date
mU
/L A
LP
0.00
0.20
0.40
0.60
0.80
1.00
1.20
1.40
1.60
Milk
yiel
d (k
g)
618 am618 pmam milk yieldpm milk yield
21
Figure 1e) Daily sampling of ALP in raw milk from goat 622 during May
0
5000
10000
15000
20000
25000
30000
Monday 30/4/01
Tues
Wed
Thur
Fri
Monday 7/5/01
Tues
Wed
Thur
Fri
Monday 14/5/01
Tues
Wed
Thur
Fri
Monday 21/5/01
Tues
Wed
Thur
Fri
Monday 28/5/01
Tues
Wed
Thur
Fri
Date
mU
/L A
LP
0.00
0.20
0.40
0.60
0.80
1.00
1.20
1.40
1.60
Milk
yie
ld (k
g) 622 am622 pmam milk yieldpm milk yield
22
Figure 1f) Daily sampling of ALP in raw milk from goat 639 during May
0
2000
4000
6000
8000
10000
12000
14000
Monday 30/4/01
Tues
Wed
Thur
Fri
Monday 7/5/01
Tues
Wed
Thur
Fri
Monday 14/5/01
Tues
Wed
Thur
Fri
Monday 21/5/01
Tues
Wed
Thur
Fri
Monday 28/5/01
Tues
Wed
Thur
Fri
Date
mU
/L A
LP
0.00
0.20
0.40
0.60
0.80
1.00
1.20
Milk
yie
ld (k
g)
639 am639 pmam milk yieldpm milk yield
23
Figure 1g) Daily sampling of ALP in raw milk from goat 713 during May
0
10000
20000
30000
40000
50000
60000
70000
Monda
y 30/4
/01 Tues
Wed Thu
r Fri
Monda
y 7/5/
01Tue
sW
ed Thur Fri
Monda
y 14/5
/01 Tues
Wed Thu
r Fri
Monda
y 21/5
/01 Tues
Wed Thu
r Fri
Monda
y 28/5
/01 Tues
Wed Thu
r Fri
Date
mU
/L A
LP
0.00
0.20
0.40
0.60
0.80
1.00
1.20
1.40
1.60
Milk
yie
ld (k
g) 713 am713 pmam milk yieldpm milk yield
24
Figure 1h) Daily sampling of ALP in raw milk from goat 806 during May
0
2000
4000
6000
8000
10000
12000
14000
16000
18000
Monday 30/4/01
Tues
Wed
Thur
Fri
Monday 7/5/01
Tues
Wed
Thur
Fri
Monday 14/5/01
Tues
Wed
Thur
Fri
Monday 21/5/01
Tues
Wed
Thur
Fri
Monday 28/5/01
Tues
Wed
Thur
Fri
Date
mU
/L A
LP
0.00
0.20
0.40
0.60
0.80
1.00
1.20
1.40
1.60
1.80
2.00
Milk
yie
ld (k
g) 806 am806 pmam milk yieldpm milk yield
25
Figure 1i) Daily sampling of ALP in raw milk from goat 890 during May
0
10000
20000
30000
40000
50000
60000
Monday 30/4/01
Tues
Wed
Thur
Fri
Monday 7/5/01
Tues
Wed
Thur
Fri
Monday 14/5/01
Tues
Wed
Thur
Fri
Monday 21/5/01
Tues
Wed
Thur
Fri
Monday 28/5/01
Tues
Wed
Thur
Fri
Date
mU
/L A
LP
0.00
0.50
1.00
1.50
2.00
2.50
Milk
yie
ld (k
g)
890 am890 pmam milk yieldpm milk yield

26
Figure 1j) Daily sampling of ALP in raw milk from goat 891 during May
0
5000
10000
15000
20000
25000
30000
Monday 30/4/01
Tues
Wed
Thur
Fri
Monday 7/5/01
Tues
Wed
Thur
Fri
Monday 14/5/01
Tues
Wed
Thur
Fri
Monday 21/5/01
Tues
Wed
Thur
Fri
Monday 28/5/01
Tues
Wed
Thur
Fri
Date
mU
/L A
LP
0.00
0.20
0.40
0.60
0.80
1.00
1.20
1.40
Milk
yie
ld (k
g)
891 am891 pmam milk yieldpm milk yield
27
Figure 1k) Daily sampling of ALP in raw milk from goat 725 during May
0
10000
20000
30000
40000
50000
60000
70000
Monday 30/4/01
Tues
Wed
Thur
Fri
Monday 7/5/01
Tues
Wed
Thur
Fri
Monday 14/5/01
Tues
Wed
Thur
Fri
Monday 21/5/01
Tues
Wed
Thur
Fri
Monday 28/5/01
Tues
Wed
Thur
Fri
Date
mU
/L A
LP
0.00
0.20
0.40
0.60
0.80
1.00
1.20
1.40
1.60
Milk
yie
ld (k
g) 725 am725 pmam milk yieldpm milk yield

28
Figure 1l) Daily sampling of ALP in raw milk from goat 809 during May
0
20000
40000
60000
80000
100000
120000
Monda
y 30/4
/01 Tues
Wed Thu
r Fri
Monda
y 7/5/
01Tue
sW
ed Thur Fri
Monda
y 14/5
/01 Tues
Wed Thu
r Fri
Monda
y 21/5
/01 Tues
Wed Thu
r Fri
Monda
y 28/5
/01 Tues
Wed Thu
r Fri
Date
mU
/L A
LP
0.00
0.20
0.40
0.60
0.80
1.00
1.20
Milk
yie
ld (k
g) 809 am809 pmam milk yieldpm milk yield
29
Figure 1m) Daily sampling of ALP in raw milk from goat 640 during May
0
10000
20000
30000
40000
50000
60000
70000
80000
Monday 30/4/01
Tues
Wed
Thur
Fri
Monday 7/5/01
Tues
Wed
Thur
Fri
Monday 14/5/01
Tues
Wed
Thur
Fri
Monday 21/5/01
Tues
Wed
Thur
Fri
Monday 28/5/01
Tues
Wed
Thur
Fri
Date
mU
/L A
LP
0.00
0.20
0.40
0.60
0.80
1.00
1.20
1.40
1.60
Milk
yie
ld (k
g) 640 am640 pmam milk yieldpm milk yield

30
Figure 1n) Daily sampling of ALP in raw milk from goat 605 during May
0
10000
20000
30000
40000
50000
60000
Monday 30/4/01
Tues
Wed
Thur
Fri
Monday 7/5/01
Tues
Wed
Thur
Fri
Monday 14/5/01
Tues
Wed
Thur
Fri
Monday 21/5/01
Tues
Wed
Thur
Fri
Monday 28/5/01
Tues
Wed
Thur
Fri
Date
mU
/L A
LP
0.00
0.50
1.00
1.50
2.00
2.50
Milk
yie
ld (k
g) 605 am605 pmam milk yieldpm milk yield

31
Figure 1p) Daily sampling of ALP in raw milk from goat 637 during May
0
5000
10000
15000
20000
25000
30000
Monday 30/4/01
Tues
Wed
Thur
Fri
Monday 7/5/01
Tues
Wed
Thur
Fri
Monday 14/5/01
Tues
Wed
Thur
Fri
Monday 21/5/01
Tues
Wed
Thur
Fri
Monday 28/5/01
Tues
Wed
Thur
Fri
Date
mU
/L A
LP
0.00
0.20
0.40
0.60
0.80
1.00
1.20
1.40
Milk
yie
ld (k
g) 637 am637 pmam milk yieldpm milk yield
32
Figure 1q) Daily sampling of ALP in raw milk from goat 705 during May
0
50000
100000
150000
200000
250000
300000
350000
400000
450000
Monday 30/4/01
Tues
Wed
Thur
Fri
Monday 7/5/01
Tues
Wed
Thur
Fri
Monday 14/5/01
Tues
Wed
Thur
Fri
Monday 21/5/01
Tues
Wed
Thur
Fri
Monday 28/5/01
Tues
Wed
Thur
Fri
Date
mU
/L A
LP
0.00
0.20
0.40
0.60
0.80
1.00
1.20
Milk
yie
ld (k
g)
705 am705 pmam milk yieldpm milk yield
33
Figure 1r) Daily sampling of ALP in raw milk from goat 899 during May
0
10000
20000
30000
40000
50000
60000
70000
80000
90000
Monday 30/4/01
Tues
Wed
Thur
Fri
Monday 7/5/01
Tues
Wed
Thur
Fri
Monday 14/5/01
Tues
Wed
Thur
Fri
Monday 21/5/01
Tues
Wed
Thur
Fri
Monday 28/5/01
Tues
Wed
Thur
Fri
Date
mU
/L A
LP
0.00
0.20
0.40
0.60
0.80
1.00
1.20
1.40
Milk
yie
ld (k
g) 899 am899 pmam milk yieldpm milk yield

34
Figure 2a) Daily sampling of ALP in raw milk from goat 601 during June
0
5000
10000
15000
20000
25000
30000
35000
40000
45000
Monday 4/6/01
Tues
Wed
Thur
Fri
Monday 11/6/01
Tues
Wed
Thur
Fri
Monday 18/6/01
Tues
Wed
Thur
Fri
Monday 25/6/01
Tues
Wed
Thur
Fri
Date
mU
/L A
LP
0.00
0.50
1.00
1.50
2.00
2.50
Milk
yie
ld (k
g)
601 am
601 pm
am milkyieldpm milkyield

35
Figure 2b) Daily sampling of ALP in raw milk from goat 610 during June
0
2000
4000
6000
8000
10000
12000
14000
16000
18000
Monda
y 4/6/
01Tue
sW
ed Thur Fri
Monda
y 11/6
/01 Tues
Wed Thu
r Fri
Monda
y 18/6
/01 Tues
Wed Thu
r Fri
Monda
y 25/6
/01 Tues
Wed Thu
r Fri
mU
/L A
LP
0.00
0.50
1.00
1.50
2.00
2.50
Milk
yie
ld (k
g) 610 am610 pmam milk yieldpm milk yield

36
Figure 2c) Daily sampling of ALP in raw milk from goat 617 during June
0
5000
10000
15000
20000
25000
30000
35000
Monday 4/6/01
Tues
Wed
Thur
Fri
Monday 11/6/01
Tues
Wed
Thur
Fri
Monday 18/6/01
Tues
Wed
Thur
Fri
Monday 25/6/01
Tues
Wed
Thur
Fri
Date
mU
/L A
LP
0.00
0.20
0.40
0.60
0.80
1.00
1.20
1.40
1.60
Milk
yie
ld (k
g) 617 am617 pmam milk yieldpm milk yield
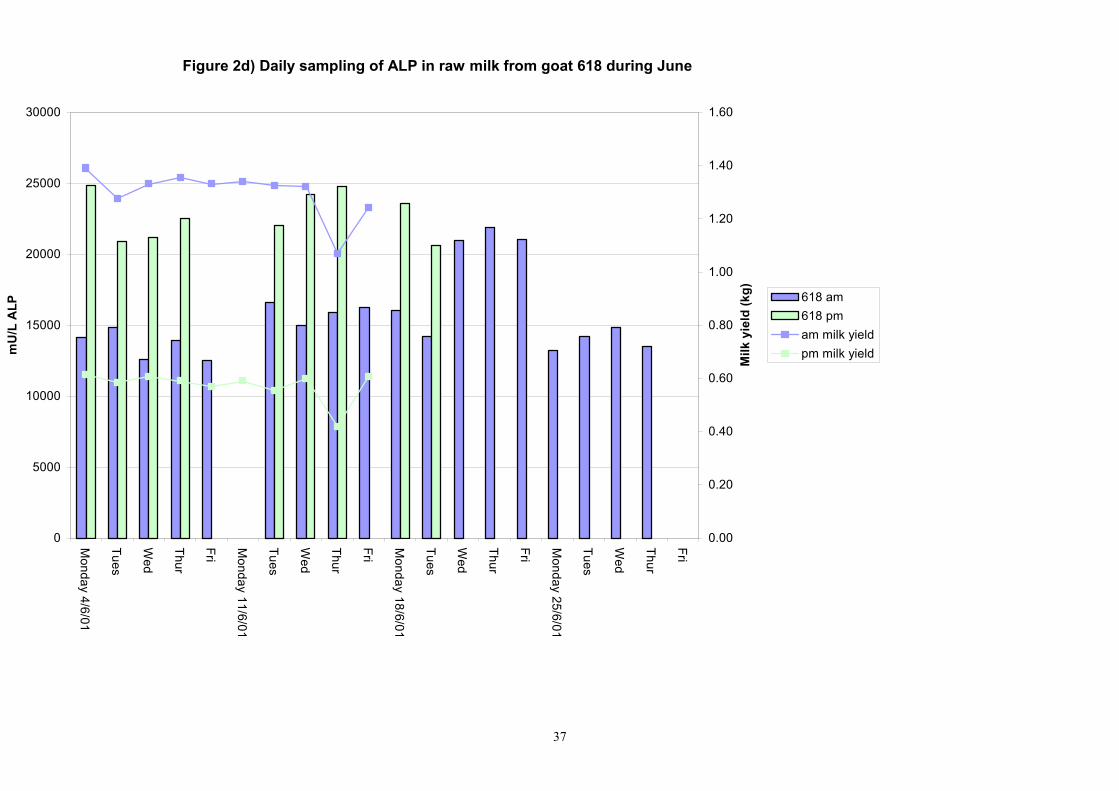
37
Figure 2d) Daily sampling of ALP in raw milk from goat 618 during June
0
5000
10000
15000
20000
25000
30000
Monday 4/6/01
Tues
Wed
Thur
Fri
Monday 11/6/01
Tues
Wed
Thur
Fri
Monday 18/6/01
Tues
Wed
Thur
Fri
Monday 25/6/01
Tues
Wed
Thur
Fri
mU
/L A
LP
0.00
0.20
0.40
0.60
0.80
1.00
1.20
1.40
1.60
Milk
yie
ld (k
g) 618 am618 pmam milk yieldpm milk yield

38
Figure 2e) Daily sampling of ALP in raw milk from goat 601 during June
0
5000
10000
15000
20000
25000
30000
Monday 4/6/01
Tues
Wed
Thur
Fri
Monday 11/6/01
Tues
Wed
Thur
Fri
Monday 18/6/01
Tues
Wed
Thur
Fri
Monday 25/6/01
Tues
Wed
Thur
Fri
mU
/L A
LP
0.00
0.20
0.40
0.60
0.80
1.00
1.20
1.40
1.60
1.80
Milk
yie
ld (k
g) 622 am622 pmam milk yieldpm milk yield
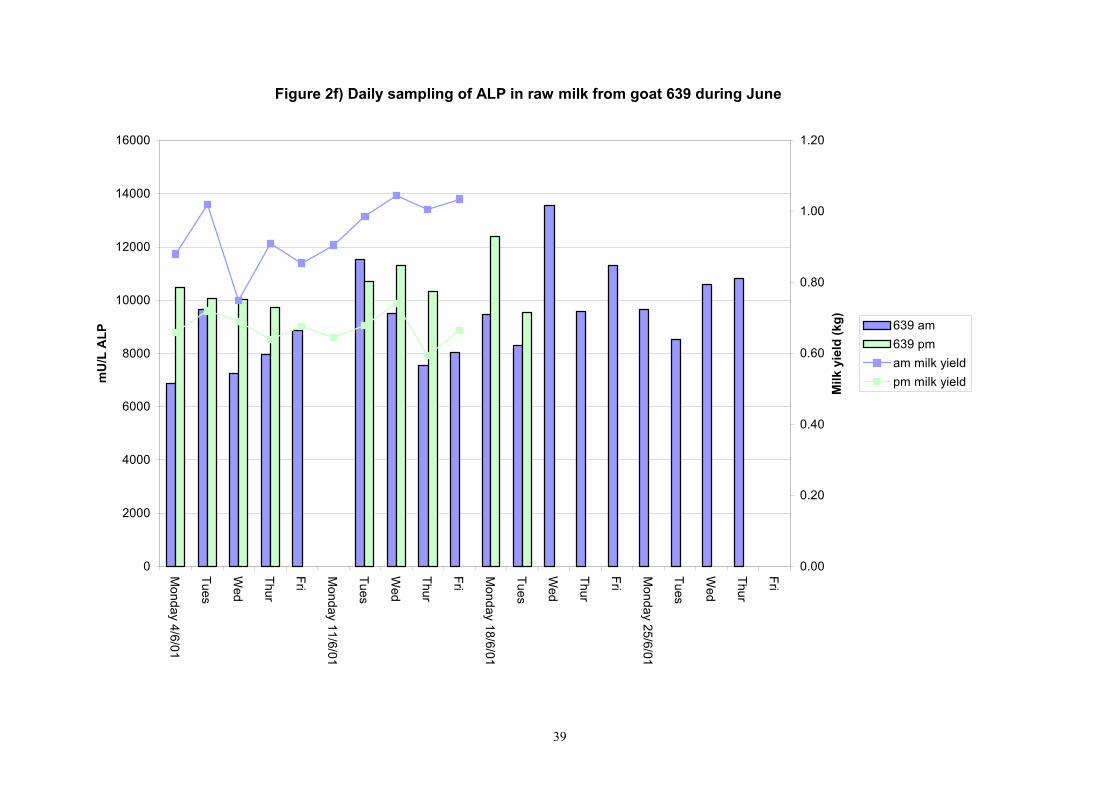
39
Figure 2f) Daily sampling of ALP in raw milk from goat 639 during June
0
2000
4000
6000
8000
10000
12000
14000
16000
Monday 4/6/01
Tues
Wed
Thur
Fri
Monday 11/6/01
Tues
Wed
Thur
Fri
Monday 18/6/01
Tues
Wed
Thur
Fri
Monday 25/6/01
Tues
Wed
Thur
Fri
mU
/L A
LP
0.00
0.20
0.40
0.60
0.80
1.00
1.20
Milk
yie
ld (k
g) 639 am639 pmam milk yieldpm milk yield
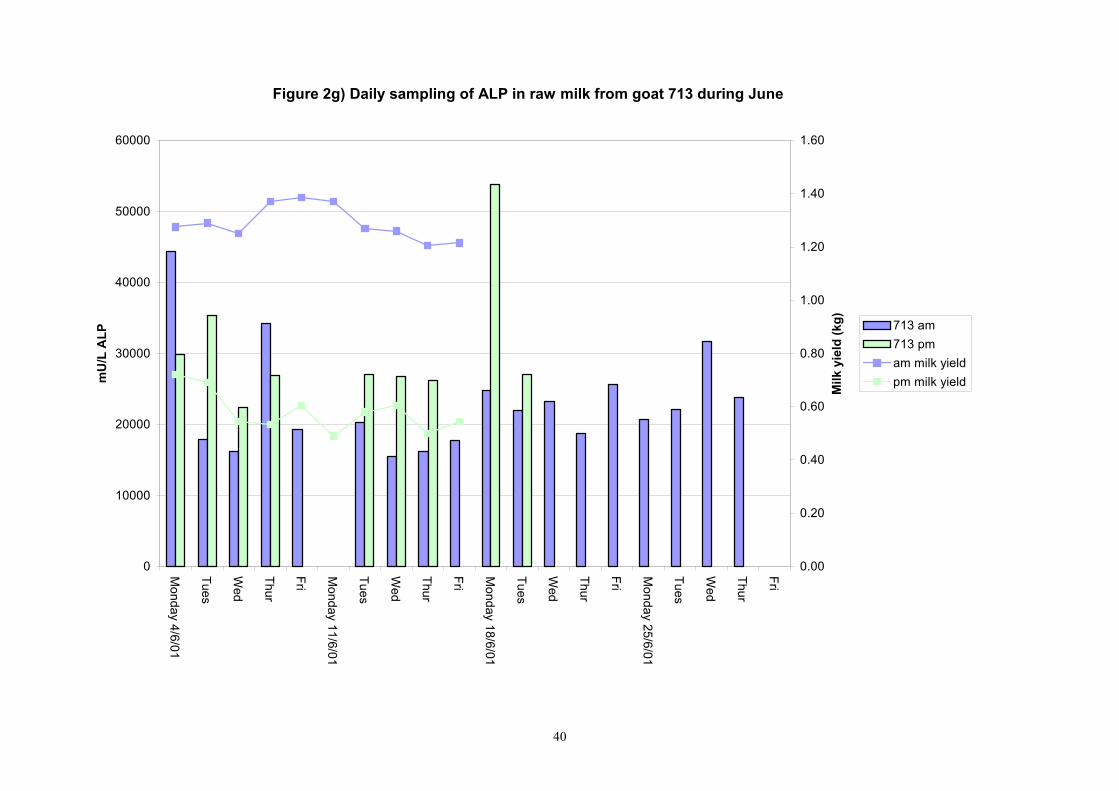
40
Figure 2g) Daily sampling of ALP in raw milk from goat 713 during June
0
10000
20000
30000
40000
50000
60000
Monday 4/6/01
Tues
Wed
Thur
Fri
Monday 11/6/01
Tues
Wed
Thur
Fri
Monday 18/6/01
Tues
Wed
Thur
Fri
Monday 25/6/01
Tues
Wed
Thur
Fri
mU
/L A
LP
0.00
0.20
0.40
0.60
0.80
1.00
1.20
1.40
1.60
Milk
yie
ld (k
g) 713 am713 pmam milk yieldpm milk yield
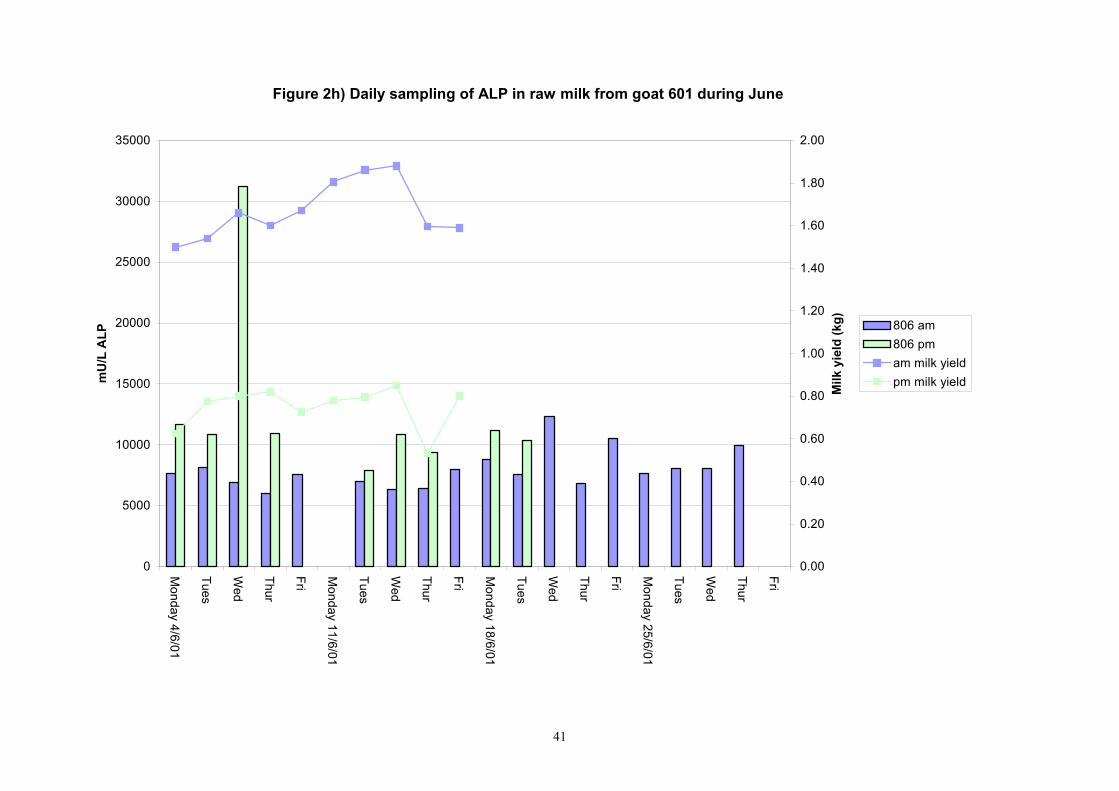
41
Figure 2h) Daily sampling of ALP in raw milk from goat 601 during June
0
5000
10000
15000
20000
25000
30000
35000
Monday 4/6/01
Tues
Wed
Thur
Fri
Monday 11/6/01
Tues
Wed
Thur
Fri
Monday 18/6/01
Tues
Wed
Thur
Fri
Monday 25/6/01
Tues
Wed
Thur
Fri
mU
/L A
LP
0.00
0.20
0.40
0.60
0.80
1.00
1.20
1.40
1.60
1.80
2.00
Milk
yie
ld (k
g) 806 am806 pmam milk yieldpm milk yield

42
Figure 2i) Daily sampling of ALP in raw milk from goat 890 during June
0
5000
10000
15000
20000
25000
Monday 4/6/01
Tues
Wed
Thur
Fri
Monday 11/6/01
Tues
Wed
Thur
Fri
Monday 18/6/01
Tues
Wed
Thur
Fri
Monday 25/6/01
Tues
Wed
Thur
Fri
mU
/L A
LP
0.00
0.50
1.00
1.50
2.00
2.50
Milk
yie
ld (k
g) 890 am890 pmam milk yieldpm milk yield

43
Figure 2j) Daily sampling of ALP in raw milk from goat 891 during June
0
50000
100000
150000
200000
250000
Monday 4/6/01
Tues
Wed
Thur
Fri
Monday 11/6/01
Tues
Wed
Thur
Fri
Monday 18/6/01
Tues
Wed
Thur
Fri
Monday 25/6/01
Tues
Wed
Thur
Fri
mU
/L A
LP
0.00
0.20
0.40
0.60
0.80
1.00
1.20
1.40
Milk
yie
ld (k
g) 891 am891 pmam milk yieldpm milk yield

44
Figure 2k) Daily sampling of ALP in raw milk from goat 725 during June
0
10000
20000
30000
40000
50000
60000
70000
80000
Monday 4/6/01
Tues
Wed
Thur
Fri
Monday 11/6/01
Tues
Wed
Thur
Fri
Monday 18/6/01
Tues
Wed
Thur
Fri
Monday 25/6/01
Tues
Wed
Thur
Fri
mU
/L A
LP
0.00
0.20
0.40
0.60
0.80
1.00
1.20
1.40
1.60
Milk
yie
ld (k
g)
725 am725 pmam milk yieldpm milk yield
45
Figure 2l) Daily sampling of ALP in raw milk from goat 809 during June
0
10000
20000
30000
40000
50000
60000
Monday 4/6/01
Tues
Wed
Thur
Fri
Monday 11/6/01
Tues
Wed
Thur
Fri
Monday 18/6/01
Tues
Wed
Thur
Fri
Monday 25/6/01
Tues
Wed
Thur
Fri
mU
/L A
LP
0.00
0.20
0.40
0.60
0.80
1.00
1.20
Milk
yie
ld (k
g) 809 am809 pmam milk yieldpm milk yield
46
Figure 2m) Daily sampling of ALP in raw milk from goat 640 during June
0
5000
10000
15000
20000
25000
30000
35000
Monday 4/6/01
Tues
Wed
Thur
Fri
Monday 11/6/01
Tues
Wed
Thur
Fri
Monday 18/6/01
Tues
Wed
Thur
Fri
Monday 25/6/01
Tues
Wed
Thur
Fri
mU
/L A
LP
0.00
0.20
0.40
0.60
0.80
1.00
1.20
1.40
1.60
Milk
yie
ld (k
g) 640 am640 pmam milk yieldpm milk yield

47
Figure 2n) Daily sampling of ALP in raw milk from goat 605 during June
0
2000
4000
6000
8000
10000
12000
14000
16000
Monday 4/6/01
Tues
Wed
Thur
Fri
Monday 11/6/01
Tues
Wed
Thur
Fri
Monday 18/6/01
Tues
Wed
Thur
Fri
Monday 25/6/01
Tues
Wed
Thur
Fri
0.00
0.20
0.40
0.60
0.80
1.00
1.20
1.40
1.60
1.80
2.00
605 am605 pmam milk yieldpm milk yield

48
Figure 2o) Daily sampling of ALP in raw milk from goat 637 during June
0
2000
4000
6000
8000
10000
12000
14000
16000
18000
Monday 4/6/01
Tues
Wed
Thur
Fri
Monday 11/6/01
Tues
Wed
Thur
Fri
Monday 18/6/01
Tues
Wed
Thur
Fri
Monday 25/6/01
Tues
Wed
Thur
Fri
mU
/L A
LP
0.00
0.20
0.40
0.60
0.80
1.00
1.20
1.40
Milk
yie
ld (k
g) 637 am637 pmam milk yieldpm milk yield

49
Figure 2p) Daily sampling of ALP in raw milk from goat 705 during June
0
200000
400000
600000
800000
1000000
1200000
1400000
1600000
1800000
Monday 4/6/01
Tues
Wed
Thur
Fri
Monday 11/6/01
Tues
Wed
Thur
Fri
Monday 18/6/01
Tues
Wed
Thur
Fri
Monday 25/6/01
Tues
Wed
Thur
Fri
mU
/L A
LP
0.00
0.20
0.40
0.60
0.80
1.00
1.20
1.40
Milk
yie
ld (k
g) 705 am705 pmam milk yieldpm milk yield
50
Figure 2r) Daily sampling of ALP in raw milk from goat 899 during June
0
10000
20000
30000
40000
50000
60000
Monday 4/6/01
Tues
Wed
Thur
Fri
Monday 11/6/01
Tues
Wed
Thur
Fri
Monday 18/6/01
Tues
Wed
Thur
Fri
Monday 25/6/01
Tues
Wed
Thur
Fri
Date
mU
/L A
LP
0.00
0.20
0.40
0.60
0.80
1.00
1.20
1.40
Milk
yie
ld (k
g) 899 am899 pmam milk yieldpm milk yield

51
Figure 3 a) ALP in raw milk from goat 601
0
200000
400000
600000
800000
1000000
1200000
1400000
Monday 14/5/01
Monday 28/5/01
Monday 11/6/01
Monday 25/6/01
Monday 9/7/01
Monday 23/7/01
Monday 6/8/01
Monday 20/8/01
Monday 3/9/01
Monday 17/9/01
Monday 1/10/01
Monday 15/10/01
Monday 29/10/01
Monday 12/11/01
Monday 26/11/01
Monday 10/12/01
Monday 07/01/02
Monday 21/01/02
Monday 04/02/02
Date
mU
/L A
LP
0
0.5
1
1.5
2
2.5
3
Milk
yie
ld (k
g)
am
pm
am milkyieldpm milkyield

52
Figure 3 b) ALP in raw milk from goat 610
0
50000
100000
150000
200000
250000
300000
350000
Monday 14/5/01
Monday 28/5/01
Monday 11/6/01
Monday 25/6/01
Monday 9/7/01
Monday 23/7/01
Monday 6/8/01
Monday 20/8/01
Monday 3/9/01
Monday 17/9/01
Monday 1/10/01
Monday 15/10/01
Monday 29/10/01
Monday 12/11/01
Monday 26/11/01
Monday 10/12/01
Monday 07/01/02
Monday 21/01/02
Monday 04/02/02
mU
/L A
LP
0
0.5
1
1.5
2
2.5
Milk
yie
ld (k
g) ampmam milk yieldpm milk yield

53
Figure 3 c) ALP in raw milk from goat 617
0
20000
40000
60000
80000
100000
120000
140000
Monday 14/5/01
Monday 28/5/01
Monday 11/6/01
Monday 25/6/01
Monday 9/7/01
Monday 23/7/01
Monday 6/8/01
Monday 20/8/01
Monday 3/9/01
Monday 17/9/01
Monday 1/10/01
Monday 15/10/01
Monday 29/10/01
Monday 12/11/01
Monday 26/11/01
Monday 10/12/01
Monday 07/01/02
Monday 21/01/02
Monday 04/02/02
mU
/L A
LP
0
0.2
0.4
0.6
0.8
1
1.2
1.4
1.6
Milk
yie
ld (k
g) ampmam milk yieldpm milk yield

54
Figure 3 d) ALP in raw milk from goat 618
0
50000
100000
150000
200000
250000
300000
Monday 14/5/01
Monday 28/5/01
Monday 11/6/01
Monday 25/6/01
Monday 9/7/01
Monday 23/7/01
Monday 6/8/01
Monday 20/8/01
Monday 3/9/01
Monday 17/9/01
Monday 1/10/01
Monday 15/10/01
Monday 29/10/01
Monday 12/11/01
Monday 26/11/01
Monday 10/12/01
Monday 07/01/02
Monday 21/01/02
Monday 04/02/02
mU
/L A
LP
0
0.2
0.4
0.6
0.8
1
1.2
1.4
1.6
Milk
yie
ld (k
g) ampmam milk yieldpm milk yield

55
Figure 3 e) ALP in raw milk from goat 622
0
50000
100000
150000
200000
250000
300000
350000
400000
450000
500000
Monday 14/5/01
Monday 28/5/01
Monday 11/6/01
Monday 25/6/01
Monday 9/7/01
Monday 23/7/01
Monday 6/8/01
Monday 20/8/01
Monday 3/9/01
Monday 17/9/01
Monday 1/10/01
Monday 15/10/01
Monday 29/10/01
Monday 12/11/01
Monday 26/11/01
Monday 10/12/01
Monday 07/01/02
Monday 21/01/02
Monday 04/02/02
mU
/L A
LP
0
0.2
0.4
0.6
0.8
1
1.2
1.4
1.6
Milk
yie
ld (k
g) ampmam milk yieldpm milk yield

56
Figure 3 f) ALP in raw milk from goat 639
0
20000
40000
60000
80000
100000
120000
140000
Monday 14/5/01
Monday 28/5/01
Monday 11/6/01
Monday 25/6/01
Monday 9/7/01
Monday 23/7/01
Monday 6/8/01
Monday 20/8/01
Monday 3/9/01
Monday 17/9/01
Monday 1/10/01
Monday 15/10/01
Monday 29/10/01
Monday 12/11/01
Monday 26/11/01
Monday 10/12/01
Monday 07/01/02
Monday 21/01/02
Monday 04/02/02
mU
/L A
LP
0
0.2
0.4
0.6
0.8
1
1.2
Milk
yie
ld (k
g)
ampmam milk yieldpm milk yield
57
Figure 3 g) ALP in raw milk from goat 713
0
50000
100000
150000
200000
250000
300000
350000
400000
Monday 14/5/01
Monday 28/5/01
Monday 11/6/01
Monday 25/6/01
Monday 9/7/01
Monday 23/7/01
Monday 6/8/01
Monday 20/8/01
Monday 3/9/01
Monday 17/9/01
Monday 1/10/01
Monday 15/10/01
Monday 29/10/01
Monday 12/11/01
Monday 26/11/01
Monday 10/12/01
Monday 07/01/02
Monday 21/01/02
Monday 04/02/02
mU
/L A
LP
0
0.2
0.4
0.6
0.8
1
1.2
1.4
1.6
Milk
yie
ld (k
g) ampmam milk yieldpm milk yield

58
Figure 3 h) ALP in raw milk from goat 806
0
10000
20000
30000
40000
50000
60000
70000
80000
Monday 14/5/01
Monday 28/5/01
Monday 11/6/01
Monday 25/6/01
Monday 9/7/01
Monday 23/7/01
Monday 6/8/01
Monday 20/8/01
Monday 3/9/01
Monday 17/9/01
Monday 1/10/01
Monday 15/10/01
Monday 29/10/01
Monday 12/11/01
Monday 26/11/01
Monday 10/12/01
Monday 07/01/02
Monday 21/01/02
Monday 04/02/02
mU
/L A
LP
0
0.2
0.4
0.6
0.8
1
1.2
1.4
1.6
1.8
2
Milk
yie
ld (k
g) ampmam milk yieldpm milk yield
59
Figure 3 i) ALP in raw milk from goat 890
0
100000
200000
300000
400000
500000
600000
Monday 14/5/01
Monday 28/5/01
Monday 11/6/01
Monday 25/6/01
Monday 9/7/01
Monday 23/7/01
Monday 6/8/01
Monday 20/8/01
Monday 3/9/01
Monday 17/9/01
Monday 1/10/01
Monday 15/10/01
Monday 29/10/01
Monday 12/11/01
Monday 26/11/01
Monday 10/12/01
Monday 07/01/02
Monday 21/01/02
Monday 04/02/02
mU
/L A
LP
0
0.5
1
1.5
2
2.5
Milk
yie
ld (k
g) ampmam milk yieldpm milk yield
60
Figure 3 j) ALP in raw milk from goat 891
0
20000
40000
60000
80000
100000
120000
140000
160000
Monday 14/5/01
Monday 28/5/01
Monday 11/6/01
Monday 25/6/01
Monday 9/7/01
Monday 23/7/01
Monday 6/8/01
Monday 20/8/01
Monday 3/9/01
Monday 17/9/01
Monday 1/10/01
Monday 15/10/01
Monday 29/10/01
Monday 12/11/01
Monday 26/11/01
Monday 10/12/01
Monday 07/01/02
Monday 21/01/02
Monday 04/02/02
mU
/L A
LP
0
0.2
0.4
0.6
0.8
1
1.2
1.4
Milk
yie
ld (k
g) ampmam milk yieldpm milk yield
61
Figure 3 k) ALP in raw milk from goat 725
0
100000
200000
300000
400000
500000
600000
700000
Monday 14/5/01
Monday 28/5/01
Monday 11/6/01
Monday 25/6/01
Monday 9/7/01
Monday 23/7/01
Monday 6/8/01
Monday 20/8/01
Monday 3/9/01
Monday 17/9/01
Monday 1/10/01
Monday 15/10/01
Monday 29/10/01
Monday 12/11/01
Monday 26/11/01
Monday 10/12/01
Monday 07/01/02
Monday 21/01/02
Monday 04/02/02
mU
/L A
LP
0
0.2
0.4
0.6
0.8
1
1.2
1.4
Milk
yie
ld (k
g) ampmam milk yieldpm milk yield

62
Figure 3 l) ALP in raw milk from goat 809
0
50000
100000
150000
200000
250000
300000
350000
400000
450000
500000
Monday 14/5/01
Monday 28/5/01
Monday 11/6/01
Monday 25/6/01
Monday 9/7/01
Monday 23/7/01
Monday 6/8/01
Monday 20/8/01
Monday 3/9/01
Monday 17/9/01
Monday 1/10/01
Monday 15/10/01
Monday 29/10/01
Monday 12/11/01
Monday 26/11/01
Monday 10/12/01
Monday 07/01/02
Monday 21/01/02
Monday 04/02/02
mU
/L A
LP
-0.2
0
0.2
0.4
0.6
0.8
1
1.2
Milk
yie
ld (k
g) ampmam milk yieldpm milk yield

63
Figure 3 m) ALP in raw milk from goat 640
0
20000
40000
60000
80000
100000
120000
140000
160000
180000
Monday 14/5/01
Monday 28/5/01
Monday 11/6/01
Monday 25/6/01
Monday 9/7/01
Monday 23/7/01
Monday 6/8/01
Monday 20/8/01
Monday 3/9/01
Monday 17/9/01
Monday 1/10/01
Monday 15/10/01
Monday 29/10/01
Monday 12/11/01
Monday 26/11/01
Monday 10/12/01
Monday 07/01/02
Monday 21/01/02
Monday 04/02/02
mU
/L A
LP
0
0.2
0.4
0.6
0.8
1
1.2
1.4
1.6
Milk
yie
ld (k
g) ampmam milk yieldpm milk yield

64
Figure 3 n) ALP in raw milk from goat 605
0
50000
100000
150000
200000
250000
Monday 14/5/01
Monday 28/5/01
Monday 11/6/01
Monday 25/6/01
Monday 9/7/01
Monday 23/7/01
Monday 6/8/01
Monday 20/8/01
Monday 3/9/01
Monday 17/9/01
Monday 1/10/01
Monday 15/10/01
Monday 29/10/01
Monday 12/11/01
Monday 26/11/01
Monday 10/12/01
Monday 07/01/02
Monday 21/01/02
Monday 04/02/02
mU
/L A
LP
0
0.2
0.4
0.6
0.8
1
1.2
1.4
1.6
1.8
2
Milk
yie
ld (k
g) ampmam milk yieldpm milk yield

65
Figure 3 p) ALP in raw milk from goat 637
0
50000
100000
150000
200000
250000
300000
Monday 14/5/01
Monday 28/5/01
Monday 11/6/01
Monday 25/6/01
Monday 9/7/01
Monday 23/7/01
Monday 6/8/01
Monday 20/8/01
Monday 3/9/01
Monday 17/9/01
Monday 1/10/01
Monday 15/10/01
Monday 29/10/01
Monday 12/11/01
Monday 26/11/01
Monday 10/12/01
Monday 07/01/02
Monday 21/01/02
Monday 04/02/02
mU
/L A
LP
0
0.2
0.4
0.6
0.8
1
1.2
Milk
yie
ld (k
g) ampmam milk yieldpm milk yield

66
Figure 3 q) ALP in raw milk from goat 705
0
200000
400000
600000
800000
1000000
1200000
1400000
1600000
1800000
Monday 14/5/01
Monday 28/5/01
Monday 11/6/01
Monday 25/6/01
Monday 9/7/01
Monday 23/7/01
Monday 6/8/01
Monday 20/8/01
Monday 3/9/01
Monday 17/9/01
Monday 1/10/01
Monday 15/10/01
Monday 29/10/01
Monday 12/11/01
Monday 26/11/01
Monday 10/12/01
Monday 07/01/02
Monday 21/01/02
Monday 04/02/02
mU
/L A
LP
0
0.2
0.4
0.6
0.8
1
1.2
1.4
Milk
yie
ld (k
g) ampmam milk yieldpm milk yield

67
Figure 3 r) ALP in raw milk from goat 899
0
100000
200000
300000
400000
500000
600000
700000
800000
900000
1000000
Monday 14/5/01
Monday 28/5/01
Monday 11/6/01
Monday 25/6/01
Monday 9/7/01
Monday 23/7/01
Monday 6/8/01
Monday 20/8/01
Monday 3/9/01
Monday 17/9/01
Monday 1/10/01
Monday 15/10/01
Monday 29/10/01
Monday 12/11/01
Monday 26/11/01
Monday 10/12/01
Monday 07/01/02
Monday 21/01/02
Monday 04/02/02
mU
/L A
LP
0
0.2
0.4
0.6
0.8
1
1.2
1.4
Milk
yie
ld (k
g) ampmam milk yieldpm milk yield

68
Fig 4 a)Total yield of ALP in morning and evening milk from 601
0.0
100.0
200.0
300.0
400.0
500.0
600.0
700.0
Monday 14/5/01
Monday 28/5/01
Monday 11/6/01
Monday 25/6/01
Monday 9/7/01
Monday 23/7/01
Monday 6/8/01
Monday 20/8/01
Monday 3/9/01
Monday 17/9/01
Monday 1/10/01
Monday 15/10/01
Monday 29/10/01
Monday 12/11/01
Monday 26/11/01
Monday 10/12/01
Monday 7/1/02
Monday 21/1/02
Monday 04/02/02
Date
Tota
l ALP
Uni
ts/M
ilkin
g
601 601am601 601 pm
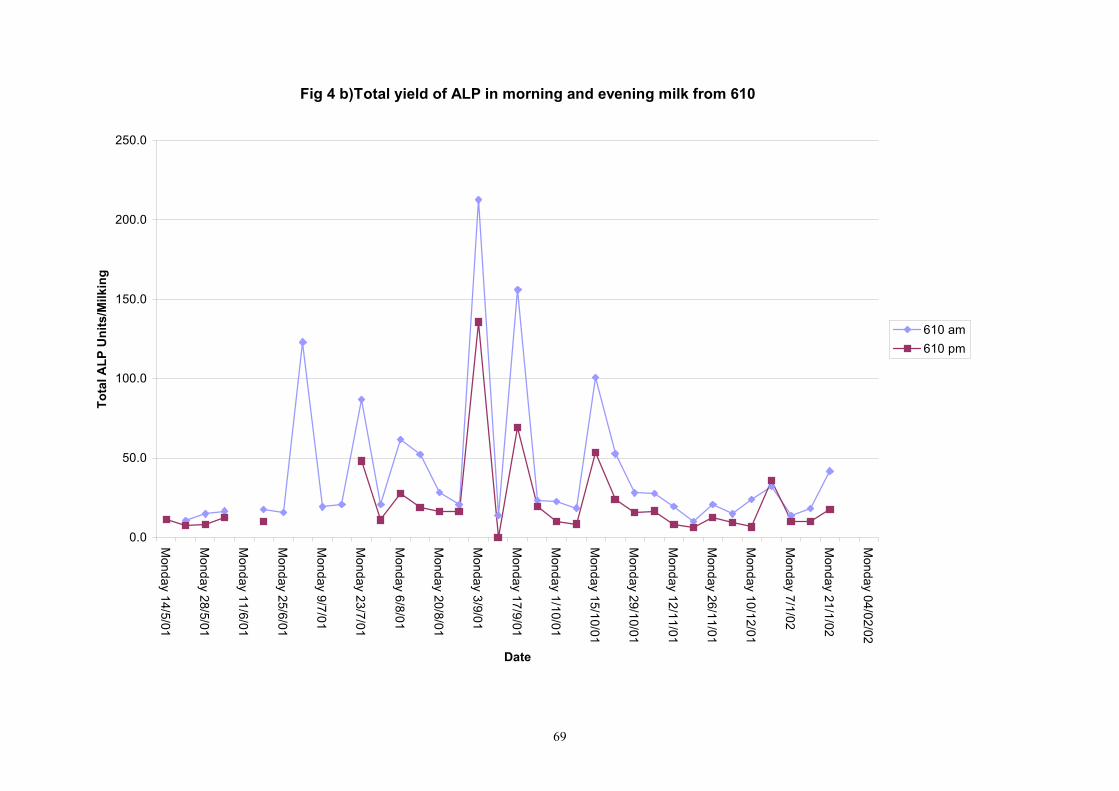
69
Fig 4 b)Total yield of ALP in morning and evening milk from 610
0.0
50.0
100.0
150.0
200.0
250.0
Monday 14/5/01
Monday 28/5/01
Monday 11/6/01
Monday 25/6/01
Monday 9/7/01
Monday 23/7/01
Monday 6/8/01
Monday 20/8/01
Monday 3/9/01
Monday 17/9/01
Monday 1/10/01
Monday 15/10/01
Monday 29/10/01
Monday 12/11/01
Monday 26/11/01
Monday 10/12/01
Monday 7/1/02
Monday 21/1/02
Monday 04/02/02
Date
Tota
l ALP
Uni
ts/M
ilkin
g
610 am610 pm
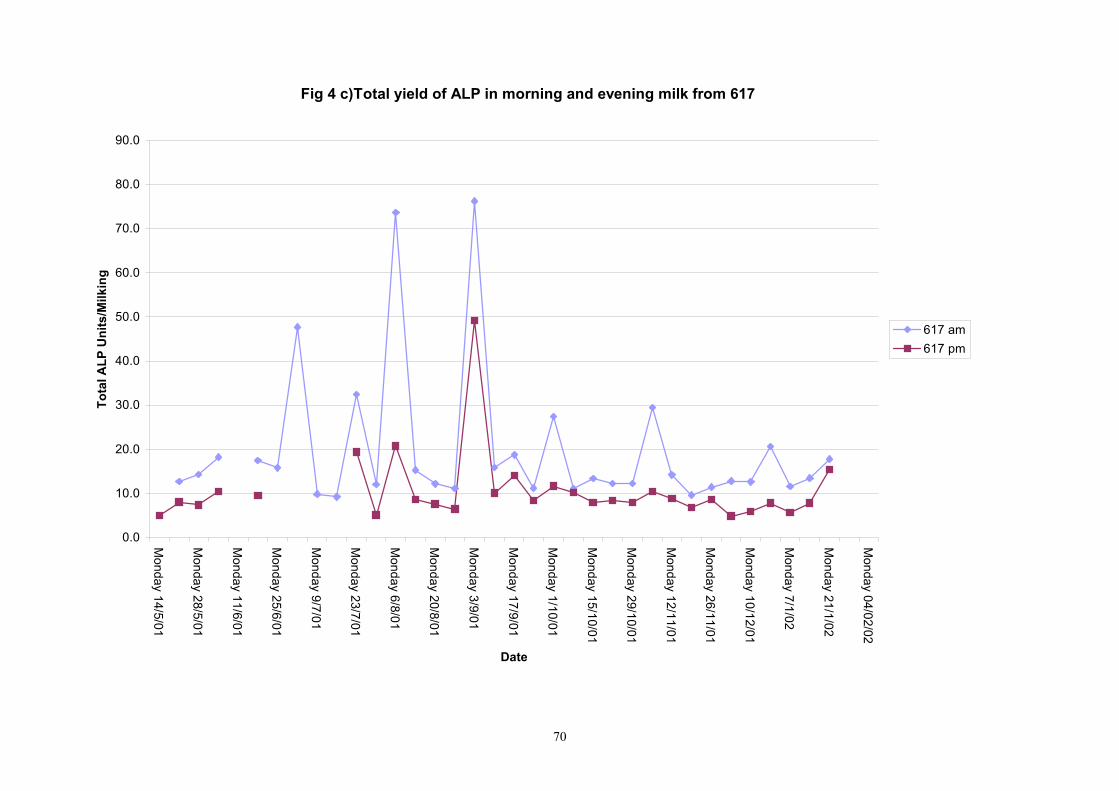
70
Fig 4 c)Total yield of ALP in morning and evening milk from 617
0.0
10.0
20.0
30.0
40.0
50.0
60.0
70.0
80.0
90.0
Monday 14/5/01
Monday 28/5/01
Monday 11/6/01
Monday 25/6/01
Monday 9/7/01
Monday 23/7/01
Monday 6/8/01
Monday 20/8/01
Monday 3/9/01
Monday 17/9/01
Monday 1/10/01
Monday 15/10/01
Monday 29/10/01
Monday 12/11/01
Monday 26/11/01
Monday 10/12/01
Monday 7/1/02
Monday 21/1/02
Monday 04/02/02
Date
Tota
l ALP
Uni
ts/M
ilkin
g
617 am617 pm
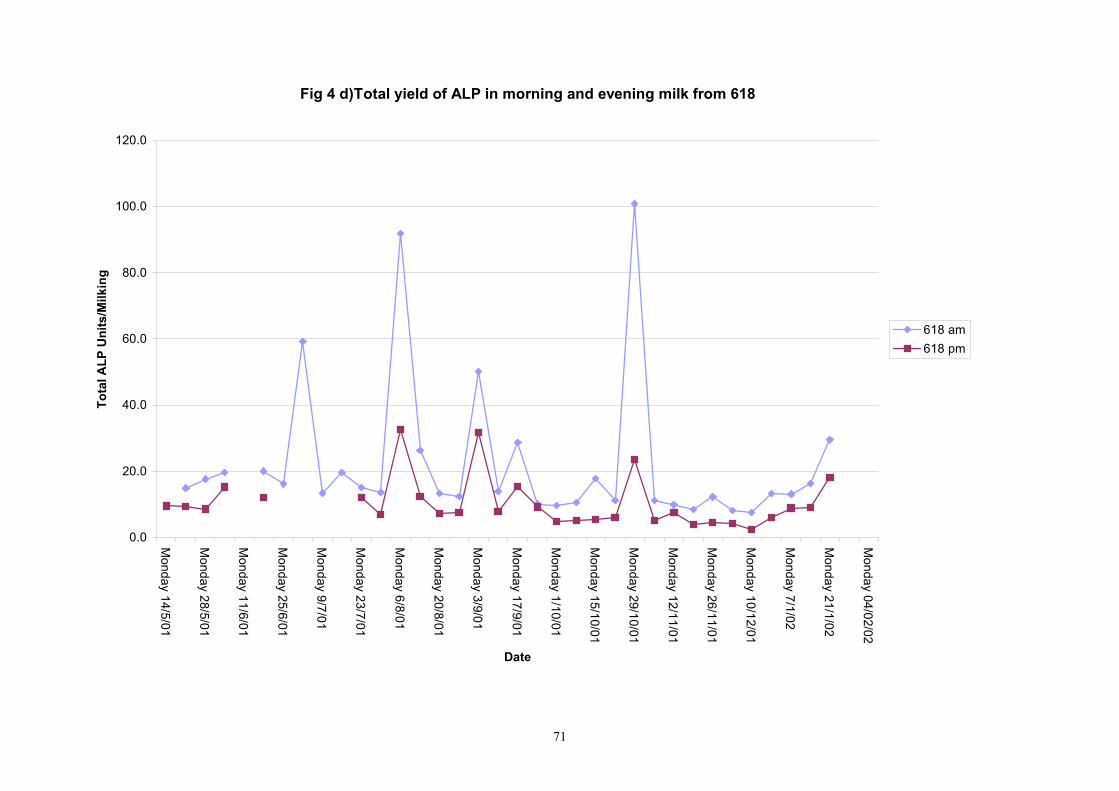
71
Fig 4 d)Total yield of ALP in morning and evening milk from 618
0.0
20.0
40.0
60.0
80.0
100.0
120.0
Monday 14/5/01
Monday 28/5/01
Monday 11/6/01
Monday 25/6/01
Monday 9/7/01
Monday 23/7/01
Monday 6/8/01
Monday 20/8/01
Monday 3/9/01
Monday 17/9/01
Monday 1/10/01
Monday 15/10/01
Monday 29/10/01
Monday 12/11/01
Monday 26/11/01
Monday 10/12/01
Monday 7/1/02
Monday 21/1/02
Monday 04/02/02
Date
Tota
l ALP
Uni
ts/M
ilkin
g
618 am618 pm
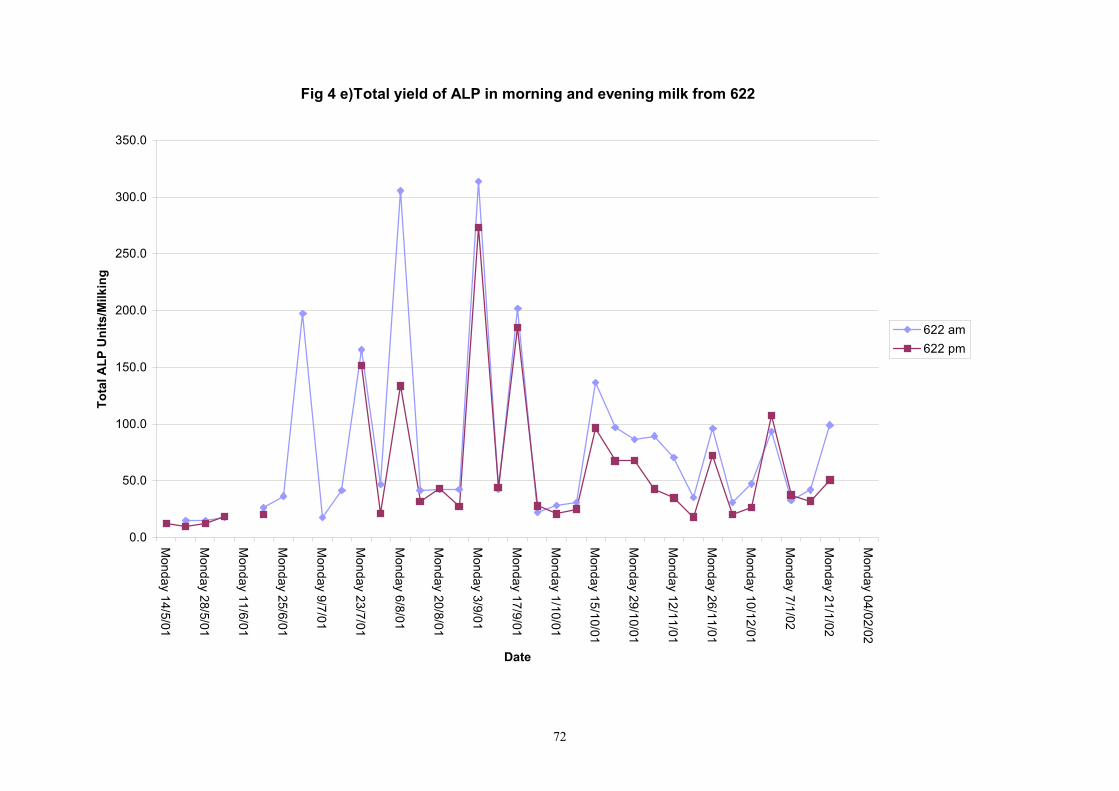
72
Fig 4 e)Total yield of ALP in morning and evening milk from 622
0.0
50.0
100.0
150.0
200.0
250.0
300.0
350.0
Monday 14/5/01
Monday 28/5/01
Monday 11/6/01
Monday 25/6/01
Monday 9/7/01
Monday 23/7/01
Monday 6/8/01
Monday 20/8/01
Monday 3/9/01
Monday 17/9/01
Monday 1/10/01
Monday 15/10/01
Monday 29/10/01
Monday 12/11/01
Monday 26/11/01
Monday 10/12/01
Monday 7/1/02
Monday 21/1/02
Monday 04/02/02
Date
Tota
l ALP
Uni
ts/M
ilkin
g
622 am622 pm

73
Fig 4 f)Total yield of ALP in morning and evening milk from 639
0.0
5.0
10.0
15.0
20.0
25.0
30.0
35.0
40.0
45.0
50.0
Monday 14/5/01
Monday 28/5/01
Monday 11/6/01
Monday 25/6/01
Monday 9/7/01
Monday 23/7/01
Monday 6/8/01
Monday 20/8/01
Monday 3/9/01
Monday 17/9/01
Monday 1/10/01
Monday 15/10/01
Monday 29/10/01
Monday 12/11/01
Monday 26/11/01
Monday 10/12/01
Monday 7/1/02
Monday 21/1/02
Monday 04/02/02
Date
Tota
l ALP
Uni
ts/M
ilkin
g
639 am639 pm
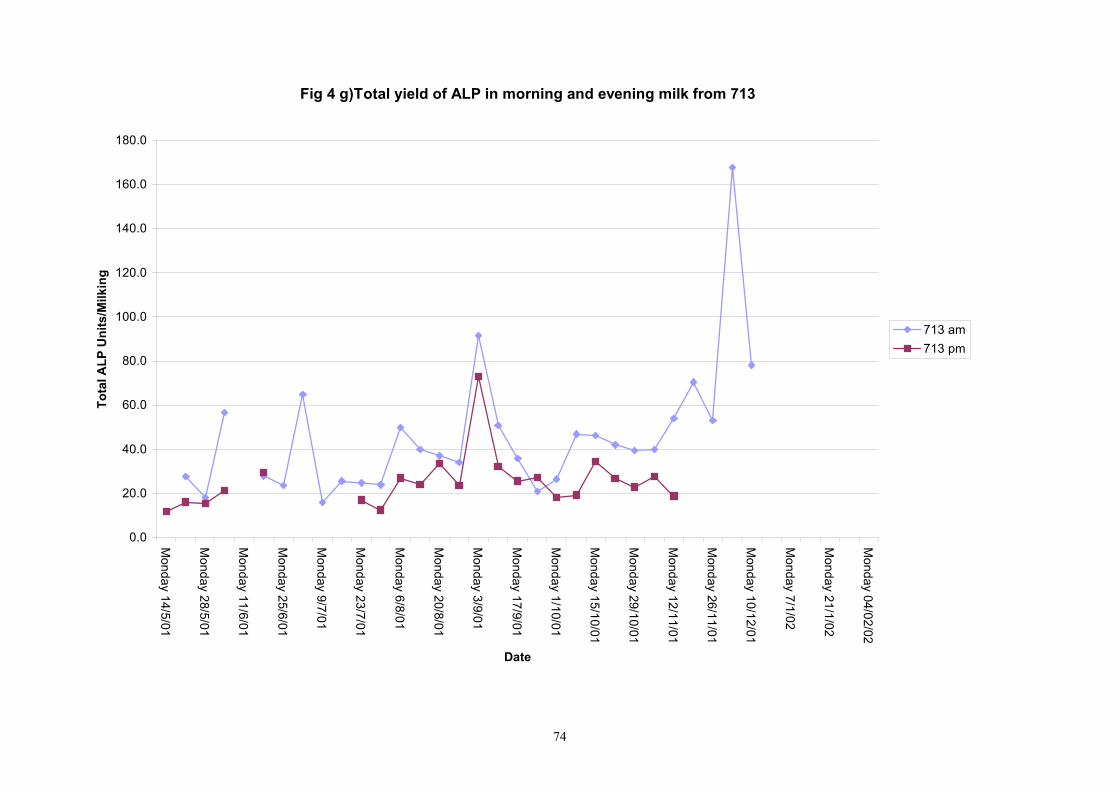
74
Fig 4 g)Total yield of ALP in morning and evening milk from 713
0.0
20.0
40.0
60.0
80.0
100.0
120.0
140.0
160.0
180.0
Monday 14/5/01
Monday 28/5/01
Monday 11/6/01
Monday 25/6/01
Monday 9/7/01
Monday 23/7/01
Monday 6/8/01
Monday 20/8/01
Monday 3/9/01
Monday 17/9/01
Monday 1/10/01
Monday 15/10/01
Monday 29/10/01
Monday 12/11/01
Monday 26/11/01
Monday 10/12/01
Monday 7/1/02
Monday 21/1/02
Monday 04/02/02
Date
Tota
l ALP
Uni
ts/M
ilkin
g
713 am713 pm

75
Fig 4 h)Total yield of ALP in morning and evening milk from 806
0.0
10.0
20.0
30.0
40.0
50.0
60.0
Monday 14/5/01
Monday 28/5/01
Monday 11/6/01
Monday 25/6/01
Monday 9/7/01
Monday 23/7/01
Monday 6/8/01
Monday 20/8/01
Monday 3/9/01
Monday 17/9/01
Monday 1/10/01
Monday 15/10/01
Monday 29/10/01
Monday 12/11/01
Monday 26/11/01
Monday 10/12/01
Monday 7/1/02
Monday 21/1/02
Monday 04/02/02
Date
Tota
l ALP
Uni
ts/M
ilkin
g
806 am806 pm
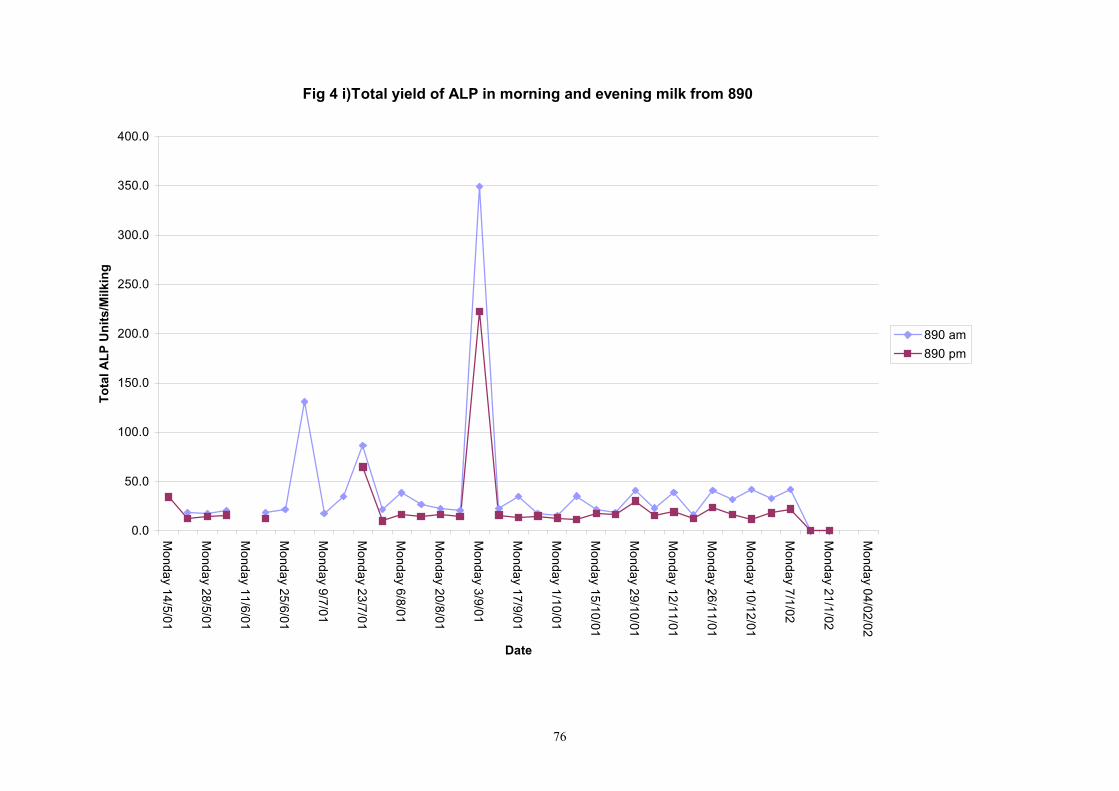
76
Fig 4 i)Total yield of ALP in morning and evening milk from 890
0.0
50.0
100.0
150.0
200.0
250.0
300.0
350.0
400.0
Monday 14/5/01
Monday 28/5/01
Monday 11/6/01
Monday 25/6/01
Monday 9/7/01
Monday 23/7/01
Monday 6/8/01
Monday 20/8/01
Monday 3/9/01
Monday 17/9/01
Monday 1/10/01
Monday 15/10/01
Monday 29/10/01
Monday 12/11/01
Monday 26/11/01
Monday 10/12/01
Monday 7/1/02
Monday 21/1/02
Monday 04/02/02
Date
Tota
l ALP
Uni
ts/M
ilkin
g
890 am890 pm

77
Fig 4 j)Total yield of ALP in morning and evening milk from 891
0.0
10.0
20.0
30.0
40.0
50.0
60.0
Monday 14/5/01
Monday 28/5/01
Monday 11/6/01
Monday 25/6/01
Monday 9/7/01
Monday 23/7/01
Monday 6/8/01
Monday 20/8/01
Monday 3/9/01
Monday 17/9/01
Monday 1/10/01
Monday 15/10/01
Monday 29/10/01
Monday 12/11/01
Monday 26/11/01
Monday 10/12/01
Monday 7/1/02
Monday 21/1/02
Monday 04/02/02
Date
Tota
l ALP
Uni
ts/M
ilkin
g
891 am891 pm

78
Fig 4 k)Total yield of ALP in morning and evening milk from 725
0.0
20.0
40.0
60.0
80.0
100.0
120.0
140.0
Monday 14/5/01
Monday 28/5/01
Monday 11/6/01
Monday 25/6/01
Monday 9/7/01
Monday 23/7/01
Monday 6/8/01
Monday 20/8/01
Monday 3/9/01
Monday 17/9/01
Monday 1/10/01
Monday 15/10/01
Monday 29/10/01
Monday 12/11/01
Monday 26/11/01
Monday 10/12/01
Monday 7/1/02
Monday 21/1/02
Monday 04/02/02
Date
Tota
l ALP
Uni
ts/M
ilkin
g
725 am725 pm

79
Fig 4 l)Total yield of ALP in morning and evening milk from 809
0.0
10.0
20.0
30.0
40.0
50.0
60.0
70.0
Monday 14/5/01
Monday 28/5/01
Monday 11/6/01
Monday 25/6/01
Monday 9/7/01
Monday 23/7/01
Monday 6/8/01
Monday 20/8/01
Monday 3/9/01
Monday 17/9/01
Monday 1/10/01
Monday 15/10/01
Monday 29/10/01
Monday 12/11/01
Monday 26/11/01
Monday 10/12/01
Monday 7/1/02
Monday 21/1/02
Monday 04/02/02
Date
Tota
l ALP
Uni
ts/M
ilkin
g
809 am809 pm

80
Fig 4 m)Total yield of ALP in morning and evening milk from 640
0.0
10.0
20.0
30.0
40.0
50.0
60.0
70.0
80.0
90.0
100.0
Monday 14/5/01
Monday 28/5/01
Monday 11/6/01
Monday 25/6/01
Monday 9/7/01
Monday 23/7/01
Monday 6/8/01
Monday 20/8/01
Monday 3/9/01
Monday 17/9/01
Monday 1/10/01
Monday 15/10/01
Monday 29/10/01
Monday 12/11/01
Monday 26/11/01
Monday 10/12/01
Monday 7/1/02
Monday 21/1/02
Monday 04/02/02
Date
Tota
l ALP
Uni
ts/M
ilkin
g
640 am640 pm

81
Fig 4 n)Total yield of ALP in morning and evening milk from 605
0.0
20.0
40.0
60.0
80.0
100.0
120.0
140.0
160.0
Monday 14/5/01
Monday 28/5/01
Monday 11/6/01
Monday 25/6/01
Monday 9/7/01
Monday 23/7/01
Monday 6/8/01
Monday 20/8/01
Monday 3/9/01
Monday 17/9/01
Monday 1/10/01
Monday 15/10/01
Monday 29/10/01
Monday 12/11/01
Monday 26/11/01
Monday 10/12/01
Monday 7/1/02
Monday 21/1/02
Monday 04/02/02
Date
Tota
l ALP
Uni
ts/M
ilkin
g
605 am605 pm
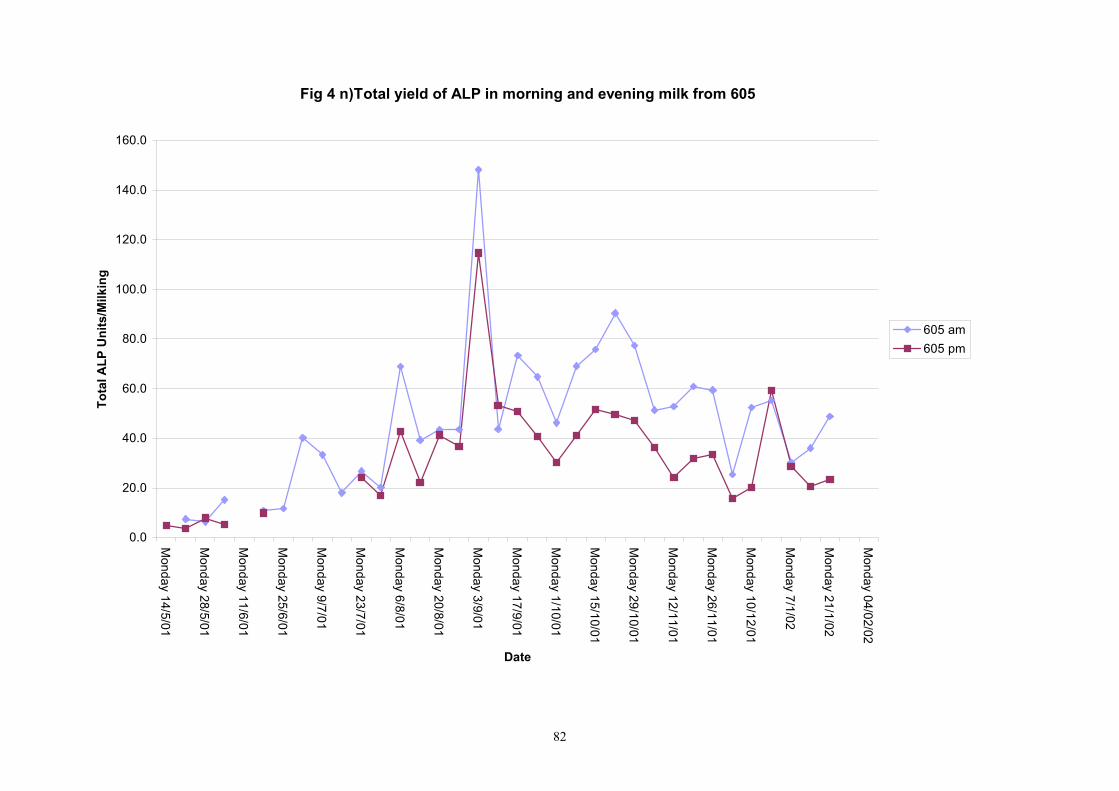
82
Fig 4 n)Total yield of ALP in morning and evening milk from 605
0.0
20.0
40.0
60.0
80.0
100.0
120.0
140.0
160.0
Monday 14/5/01
Monday 28/5/01
Monday 11/6/01
Monday 25/6/01
Monday 9/7/01
Monday 23/7/01
Monday 6/8/01
Monday 20/8/01
Monday 3/9/01
Monday 17/9/01
Monday 1/10/01
Monday 15/10/01
Monday 29/10/01
Monday 12/11/01
Monday 26/11/01
Monday 10/12/01
Monday 7/1/02
Monday 21/1/02
Monday 04/02/02
Date
Tota
l ALP
Uni
ts/M
ilkin
g
605 am605 pm

83
Fig 4 p)Total yield of ALP in morning and evening milk from 637
0.0
10.0
20.0
30.0
40.0
50.0
60.0
70.0
80.0
Monday 14/5/01
Monday 28/5/01
Monday 11/6/01
Monday 25/6/01
Monday 9/7/01
Monday 23/7/01
Monday 6/8/01
Monday 20/8/01
Monday 3/9/01
Monday 17/9/01
Monday 1/10/01
Monday 15/10/01
Monday 29/10/01
Monday 12/11/01
Monday 26/11/01
Monday 10/12/01
Monday 7/1/02
Monday 21/1/02
Monday 04/02/02
Date
Tota
l ALP
Uni
ts/M
ilkin
g
637 am637 pm

84
Fig 4 q)Total yield of ALP in morning and evening milk from 705
0.0
200.0
400.0
600.0
800.0
1000.0
1200.0
1400.0
Monday 14/5/01
Monday 28/5/01
Monday 11/6/01
Monday 25/6/01
Monday 9/7/01
Monday 23/7/01
Monday 6/8/01
Monday 20/8/01
Monday 3/9/01
Monday 17/9/01
Monday 1/10/01
Monday 15/10/01
Monday 29/10/01
Monday 12/11/01
Monday 26/11/01
Monday 10/12/01
Monday 7/1/02
Monday 21/1/02
Monday 04/02/02
Date
Tota
l ALP
Uni
ts/M
ilkin
g
705 am705 pm
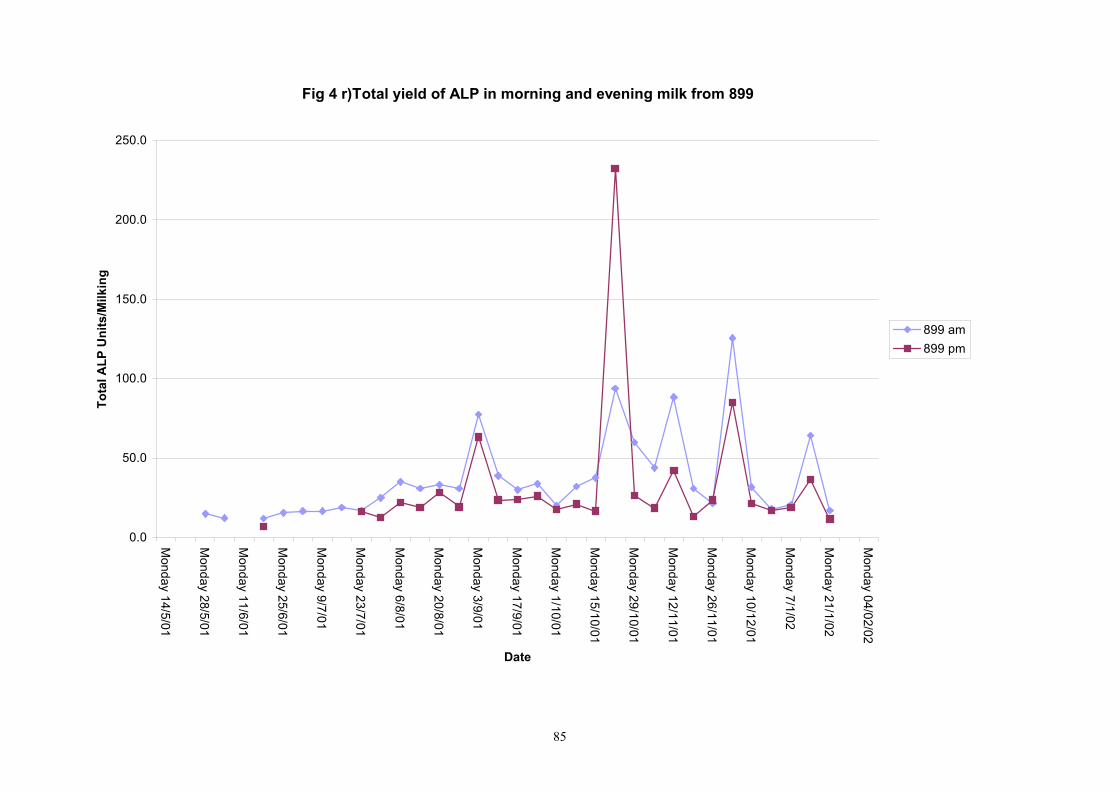
85
Fig 4 r)Total yield of ALP in morning and evening milk from 899
0.0
50.0
100.0
150.0
200.0
250.0
Monday 14/5/01
Monday 28/5/01
Monday 11/6/01
Monday 25/6/01
Monday 9/7/01
Monday 23/7/01
Monday 6/8/01
Monday 20/8/01
Monday 3/9/01
Monday 17/9/01
Monday 1/10/01
Monday 15/10/01
Monday 29/10/01
Monday 12/11/01
Monday 26/11/01
Monday 10/12/01
Monday 7/1/02
Monday 21/1/02
Monday 04/02/02
Date
Tota
l ALP
Uni
ts/M
ilkin
g
899 am899 pm

86
Fig 5a) Milk Composition Goat 601
0
2
4
6
8
10
12
14
16
30/07/01
6/8/01
13/08/01
20/08/01
27/08/01
3/9/01
10/9/01
17/09/01
24/09/01
1/10/01
8/10/01
15/10/01
22/10/01
29/10/01
5/11/01
12/11/01
19/11/01
26/11/01
Date
%
Fat amProtein amTotal Solid amFat pmProtein pmTotal Solid pm

87
Fig 5b) Milk Composition Goat 610
0
2
4
6
8
10
12
14
16
18
30/07/01
6/8/01
13/08/01
20/08/01
27/08/01
3/9/01
10/9/01
17/09/01
24/09/01
1/10/01
8/10/01
15/10/01
22/10/01
29/10/01
5/11/01
12/11/01
19/11/01
26/11/01
Date
%
Fat amProtein amTotal Solid amFat pmProtein pmTotal Solid pm

88
Fig 5c) Milk Composition Goat 617
0
2
4
6
8
10
12
14
16
18
30/07/01
6/8/01
13/08/01
20/08/01
27/08/01
3/9/01
10/9/01
17/09/01
24/09/01
1/10/01
8/10/01
15/10/01
22/10/01
29/10/01
5/11/01
12/11/01
19/11/01
26/11/01
Date
%
Fat amProtein amTotal Solid amFat pmProtein pmTotal Solid pm
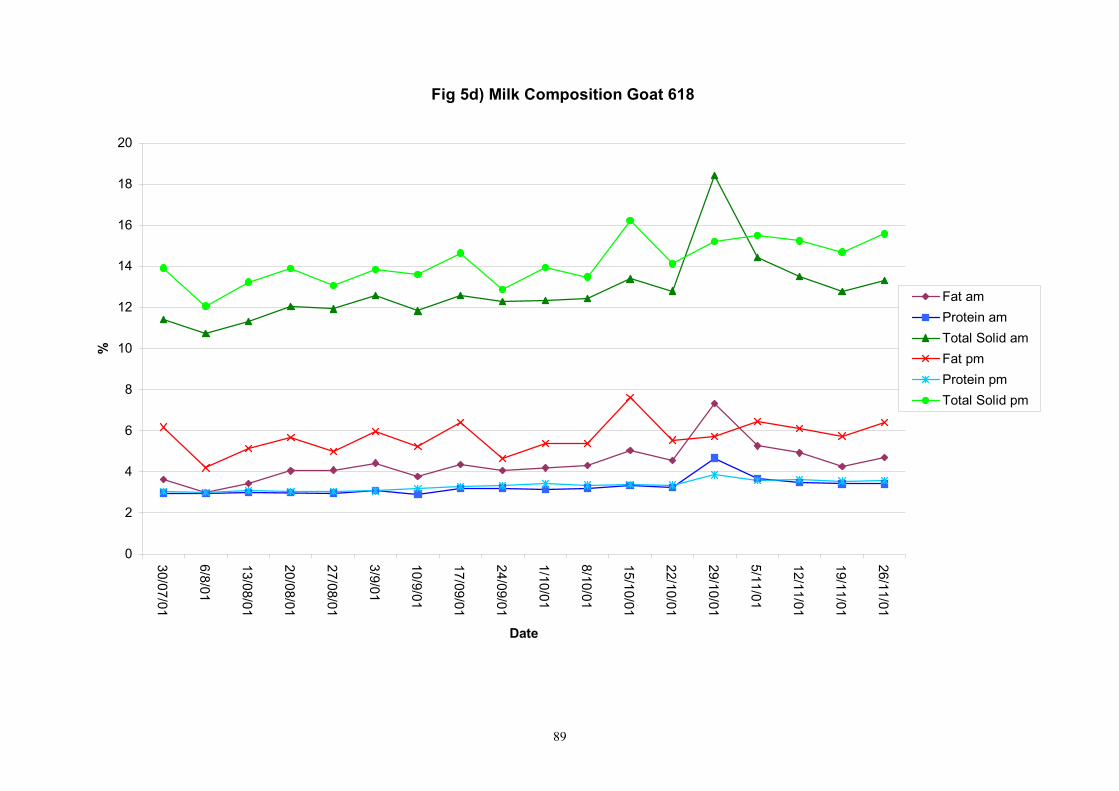
89
Fig 5d) Milk Composition Goat 618
0
2
4
6
8
10
12
14
16
18
20
30/07/01
6/8/01
13/08/01
20/08/01
27/08/01
3/9/01
10/9/01
17/09/01
24/09/01
1/10/01
8/10/01
15/10/01
22/10/01
29/10/01
5/11/01
12/11/01
19/11/01
26/11/01
Date
%
Fat amProtein amTotal Solid amFat pmProtein pmTotal Solid pm

90
Fig 5e) Milk Composition Goat 622
0
2
4
6
8
10
12
14
16
18
20
30/07/01
6/8/01
13/08/01
20/08/01
27/08/01
3/9/01
10/9/01
17/09/01
24/09/01
1/10/01
8/10/01
15/10/01
22/10/01
29/10/01
5/11/01
12/11/01
19/11/01
26/11/01
Date
%
Fat amProtein amTotal Solid amFat pmProtein pmTotal Solid pm

91
Fig 5f) Milk Composition Goat 639
0
2
4
6
8
10
12
14
16
18
30/07/01
6/8/01
13/08/01
20/08/01
27/08/01
3/9/01
10/9/01
17/09/01
24/09/01
1/10/01
8/10/01
15/10/01
22/10/01
29/10/01
5/11/01
12/11/01
19/11/01
26/11/01
Date
%
Fat amProtein amTotal Solid amFat pmProtein pmTotal Solid pm

92
Fig 5g) Milk Composition Goat 713
0
2
4
6
8
10
12
14
16
18
30/07/01
6/8/01
13/08/01
20/08/01
27/08/01
3/9/01
10/9/01
17/09/01
24/09/01
1/10/01
8/10/01
15/10/01
22/10/01
29/10/01
5/11/01
12/11/01
19/11/01
26/11/01
Date
%
Fat amProtein amTotal Solid amFat pmProtein pmTotal Solid pm
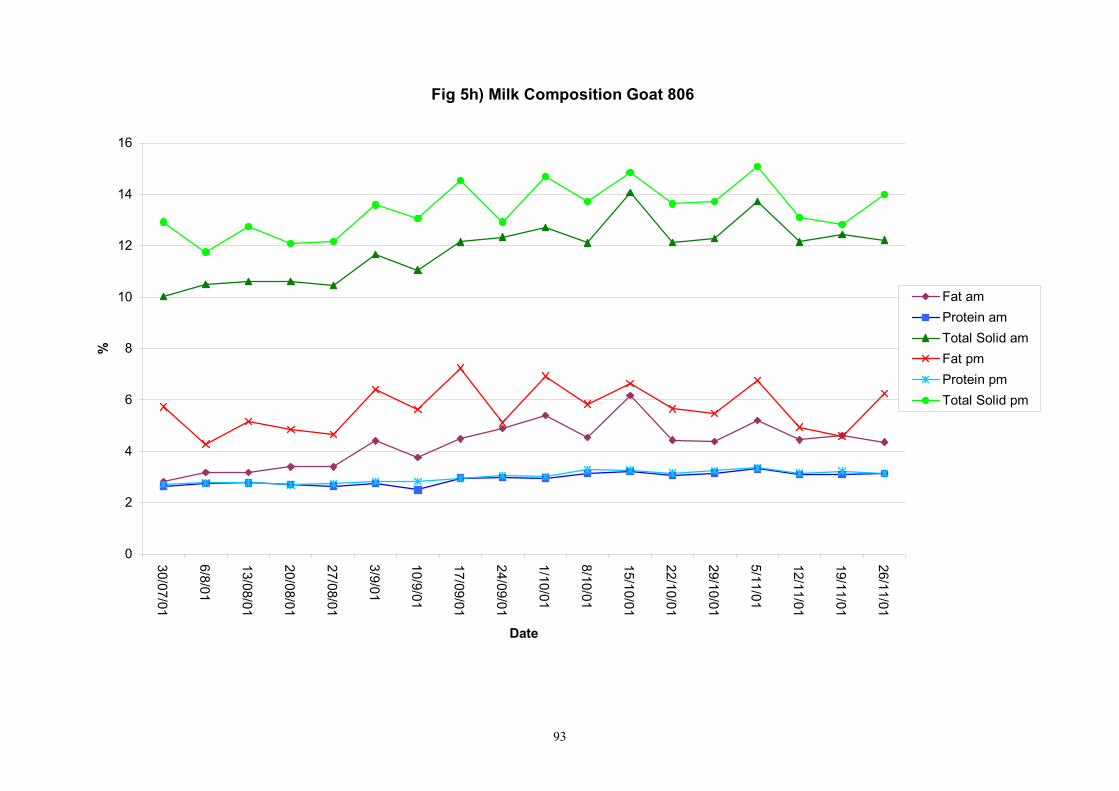
93
Fig 5h) Milk Composition Goat 806
0
2
4
6
8
10
12
14
16
30/07/01
6/8/01
13/08/01
20/08/01
27/08/01
3/9/01
10/9/01
17/09/01
24/09/01
1/10/01
8/10/01
15/10/01
22/10/01
29/10/01
5/11/01
12/11/01
19/11/01
26/11/01
Date
%
Fat amProtein amTotal Solid amFat pmProtein pmTotal Solid pm

94
Fig 5i) Milk Composition Goat 890
0
2
4
6
8
10
12
14
16
18
30/07/01
6/8/01
13/08/01
20/08/01
27/08/01
3/9/01
10/9/01
17/09/01
24/09/01
1/10/01
8/10/01
15/10/01
22/10/01
29/10/01
5/11/01
12/11/01
19/11/01
26/11/01
Date
%
Fat amProtein amTotal Solid amFat pmProtein pmTotal Solid pm

95
Fig 5j) Milk Composition Goat 891
0
2
4
6
8
10
12
14
16
30/07/01
6/8/01
13/08/01
20/08/01
27/08/01
3/9/01
10/9/01
17/09/01
24/09/01
1/10/01
8/10/01
15/10/01
22/10/01
29/10/01
5/11/01
12/11/01
19/11/01
26/11/01
Date
%
Fat amProtein amTotal Solid amFat pmProtein pmTotal Solid pm

96
Fig 5k) Milk Composition Goat 725
0
2
4
6
8
10
12
14
16
18
20
30/07/01
6/8/01
13/08/01
20/08/01
27/08/01
3/9/01
10/9/01
17/09/01
24/09/01
1/10/01
8/10/01
15/10/01
22/10/01
29/10/01
5/11/01
12/11/01
19/11/01
26/11/01
Date
%
Fat amProtein amTotal Solid amFat pmProtein pmTotal Solid pm

97
Fig 5l) Milk Composition Goat 809
0
5
10
15
20
25
30/07/01
6/8/01
13/08/01
20/08/01
27/08/01
3/9/01
10/9/01
17/09/01
24/09/01
1/10/01
8/10/01
15/10/01
22/10/01
29/10/01
5/11/01
12/11/01
19/11/01
26/11/01
Date
%
Fat amProtein amTotal Solid amFat pmProtein pmTotal Solid pm
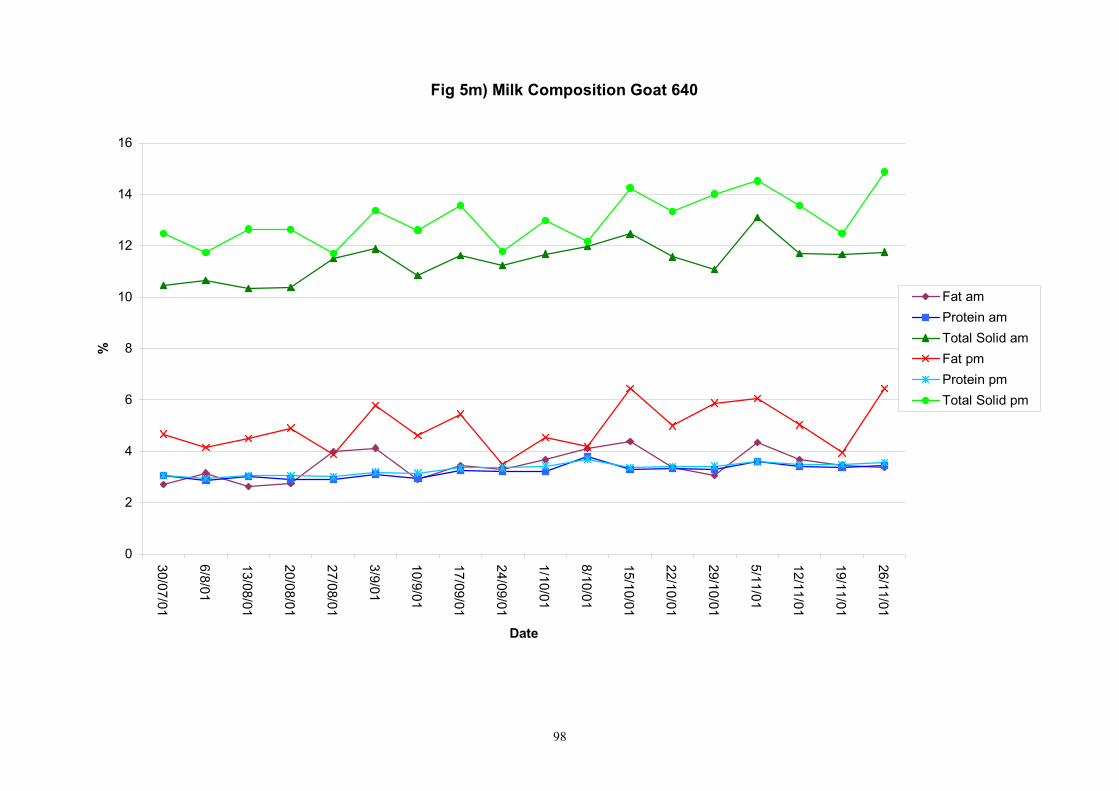
98
Fig 5m) Milk Composition Goat 640
0
2
4
6
8
10
12
14
16
30/07/01
6/8/01
13/08/01
20/08/01
27/08/01
3/9/01
10/9/01
17/09/01
24/09/01
1/10/01
8/10/01
15/10/01
22/10/01
29/10/01
5/11/01
12/11/01
19/11/01
26/11/01
Date
%
Fat amProtein amTotal Solid amFat pmProtein pmTotal Solid pm

99
Fig 5n) Milk Composition Goat 605
0
2
4
6
8
10
12
14
16
18
30/07/01
6/8/01
13/08/01
20/08/01
27/08/01
3/9/01
10/9/01
17/09/01
24/09/01
1/10/01
8/10/01
15/10/01
22/10/01
29/10/01
5/11/01
12/11/01
19/11/01
26/11/01
Date
%
Fat amProtein amTotal Solid amFat pmProtein pmTotal Solid pm
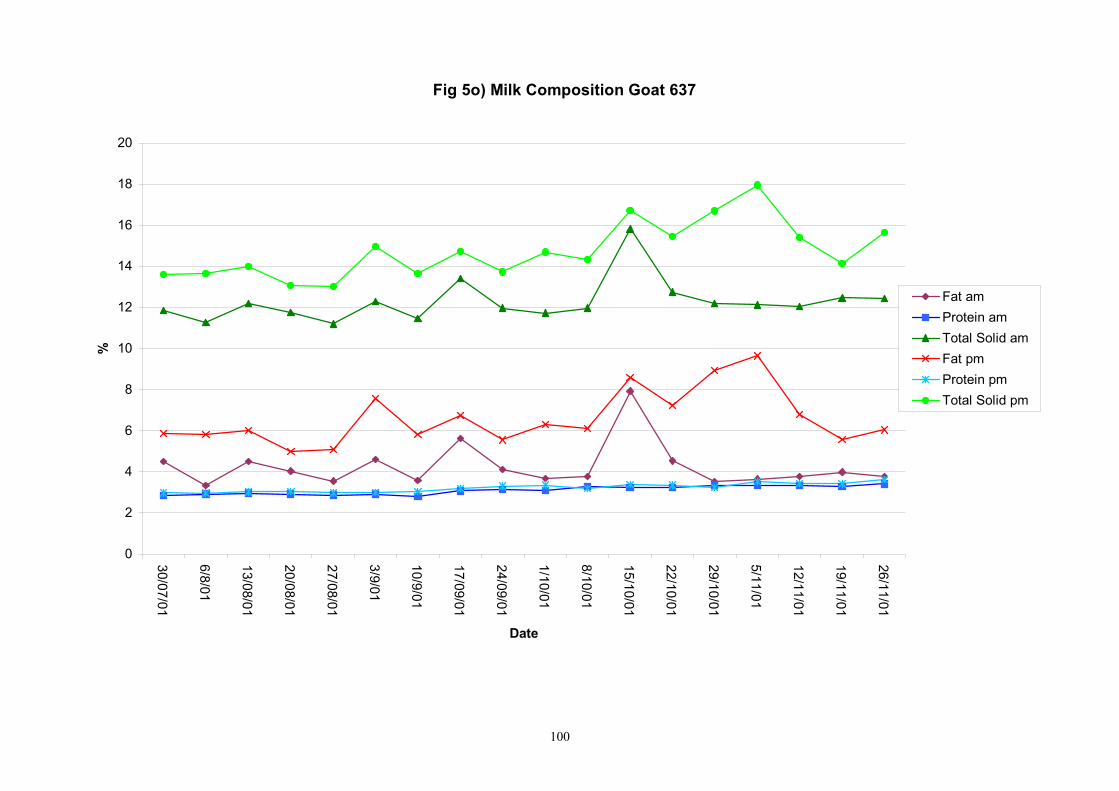
100
Fig 5o) Milk Composition Goat 637
0
2
4
6
8
10
12
14
16
18
20
30/07/01
6/8/01
13/08/01
20/08/01
27/08/01
3/9/01
10/9/01
17/09/01
24/09/01
1/10/01
8/10/01
15/10/01
22/10/01
29/10/01
5/11/01
12/11/01
19/11/01
26/11/01
Date
%
Fat amProtein amTotal Solid amFat pmProtein pmTotal Solid pm

101
Fig 5p) Milk Composition Goat 705
0
2
4
6
8
10
12
14
16
30/07/01
6/8/01
13/08/01
20/08/01
27/08/01
3/9/01
10/9/01
17/09/01
24/09/01
1/10/01
8/10/01
15/10/01
22/10/01
29/10/01
5/11/01
12/11/01
19/11/01
26/11/01
Date
%
Fat amProtein amTotal Solid amFat pmProtein pmTotal Solid pm

102
Fig 5q) Milk Composition Goat 899
0
2
4
6
8
10
12
14
16
18
30/07/01
6/8/01
13/08/01
20/08/01
27/08/01
3/9/01
10/9/01
17/09/01
24/09/01
1/10/01
8/10/01
15/10/01
22/10/01
29/10/01
5/11/01
12/11/01
19/11/01
26/11/01
Date
%
Fat amProtein amTotal Solid amFat pmProtein pmTotal Solid pm

103
Fig 6a) Somatic Cell Count Goat 601
0
5000
10000
15000
20000
25000
30000
35000
40000
30/07/01
6/8/01
13/08/01
20/08/01
27/08/01
3/9/01
10/9/01
17/09/01
24/09/01
1/10/01
8/10/01
15/10/01
22/10/01
29/10/01
5/11/01
12/11/01
19/11/01
26/11/01
Date
SCC
*100
0/m
l SCC am
SCC pm

104
Fig 6b) Somatic Cell Count Goat 610
0
5000
10000
15000
20000
25000
30000
30/07/01
6/8/01
13/08/01
20/08/01
27/08/01
3/9/01
10/9/01
17/09/01
24/09/01
1/10/01
8/10/01
15/10/01
22/10/01
29/10/01
5/11/01
12/11/01
19/11/01
26/11/01
Date
SCC
*100
0/m
l SCC am
SCC pm

105
Fig 6c) Somatic Cell Count Goat 617
0
200
400
600
800
1000
1200
1400
1600
1800
2000
30/07/01
6/8/01
13/08/01
20/08/01
27/08/01
3/9/01
10/9/01
17/09/01
24/09/01
1/10/01
8/10/01
15/10/01
22/10/01
29/10/01
5/11/01
12/11/01
19/11/01
26/11/01
Date
SCC
*100
0/m
l
SCC am
SCC pm
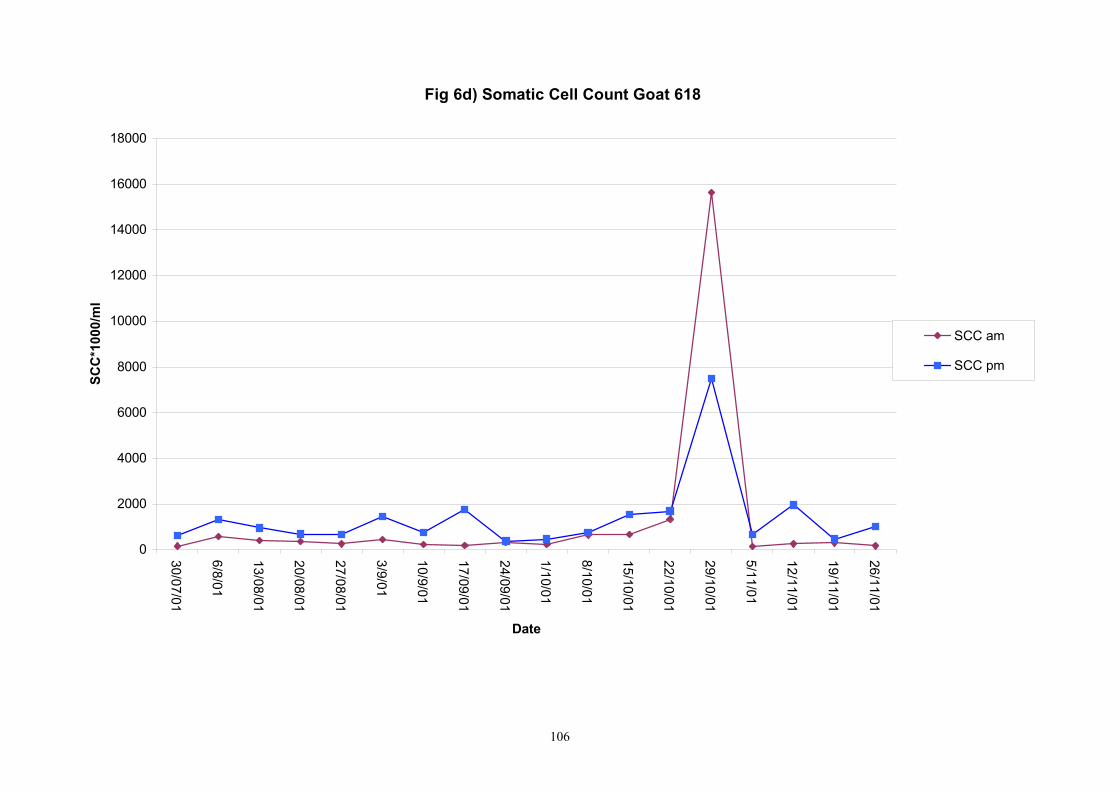
106
Fig 6d) Somatic Cell Count Goat 618
0
2000
4000
6000
8000
10000
12000
14000
16000
18000
30/07/01
6/8/01
13/08/01
20/08/01
27/08/01
3/9/01
10/9/01
17/09/01
24/09/01
1/10/01
8/10/01
15/10/01
22/10/01
29/10/01
5/11/01
12/11/01
19/11/01
26/11/01
Date
SCC
*100
0/m
l
SCC am
SCC pm

107
Fig 6e) Somatic Cell Count Goat 622
0
1000
2000
3000
4000
5000
6000
7000
30/07/01
6/8/01
13/08/01
20/08/01
27/08/01
3/9/01
10/9/01
17/09/01
24/09/01
1/10/01
8/10/01
15/10/01
22/10/01
29/10/01
5/11/01
12/11/01
19/11/01
26/11/01
Date
SCC
*100
0/m
l
SCC am
SCC pm

108
Fig 6f) Somatic Cell Count Goat 639
0
1000
2000
3000
4000
5000
6000
7000
8000
30/07/01
6/8/01
13/08/01
20/08/01
27/08/01
3/9/01
10/9/01
17/09/01
24/09/01
1/10/01
8/10/01
15/10/01
22/10/01
29/10/01
5/11/01
12/11/01
19/11/01
26/11/01
Date
SCC
*100
0/m
l
SCC am
SCC pm
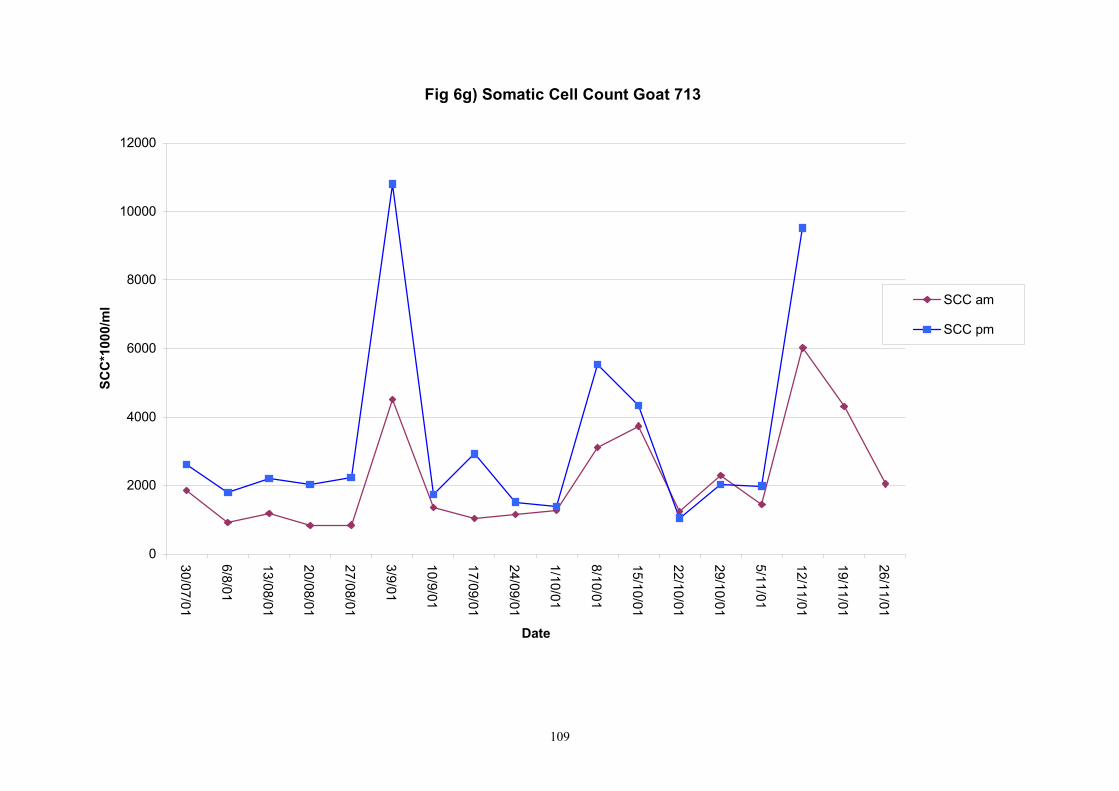
109
Fig 6g) Somatic Cell Count Goat 713
0
2000
4000
6000
8000
10000
12000
30/07/01
6/8/01
13/08/01
20/08/01
27/08/01
3/9/01
10/9/01
17/09/01
24/09/01
1/10/01
8/10/01
15/10/01
22/10/01
29/10/01
5/11/01
12/11/01
19/11/01
26/11/01
Date
SCC
*100
0/m
l SCC am
SCC pm

110
Fig 6h) Somatic Cell Count Goat 806
0
500
1000
1500
2000
2500
3000
3500
4000
30/07/01
6/8/01
13/08/01
20/08/01
27/08/01
3/9/01
10/9/01
17/09/01
24/09/01
1/10/01
8/10/01
15/10/01
22/10/01
29/10/01
5/11/01
12/11/01
19/11/01
26/11/01
Date
SCC
*100
0/m
l SCC am
SCC pm

111
Fig 6i) Somatic Cell Count Goat 890
0
2000
4000
6000
8000
10000
12000
14000
30/07/01
6/8/01
13/08/01
20/08/01
27/08/01
3/9/01
10/9/01
17/09/01
24/09/01
1/10/01
8/10/01
15/10/01
22/10/01
29/10/01
5/11/01
12/11/01
19/11/01
26/11/01
Date
SCC
*100
0/m
l
SCC am
SCC pm

112
Fig 6j) Somatic Cell Count Goat 891
0
500
1000
1500
2000
2500
3000
3500
30/07/01
6/8/01
13/08/01
20/08/01
27/08/01
3/9/01
10/9/01
17/09/01
24/09/01
1/10/01
8/10/01
15/10/01
22/10/01
29/10/01
5/11/01
12/11/01
19/11/01
26/11/01
Date
SCC
*100
0/m
l
SCC am
SCC pm

113
Fig 6k) Somatic Cell Count Goat 725
0
2000
4000
6000
8000
10000
12000
14000
16000
30/07/01
6/8/01
13/08/01
20/08/01
27/08/01
3/9/01
10/9/01
17/09/01
24/09/01
1/10/01
8/10/01
15/10/01
22/10/01
29/10/01
5/11/01
12/11/01
19/11/01
26/11/01
Date
SCC
*100
0/m
l SCC am
SCC pm
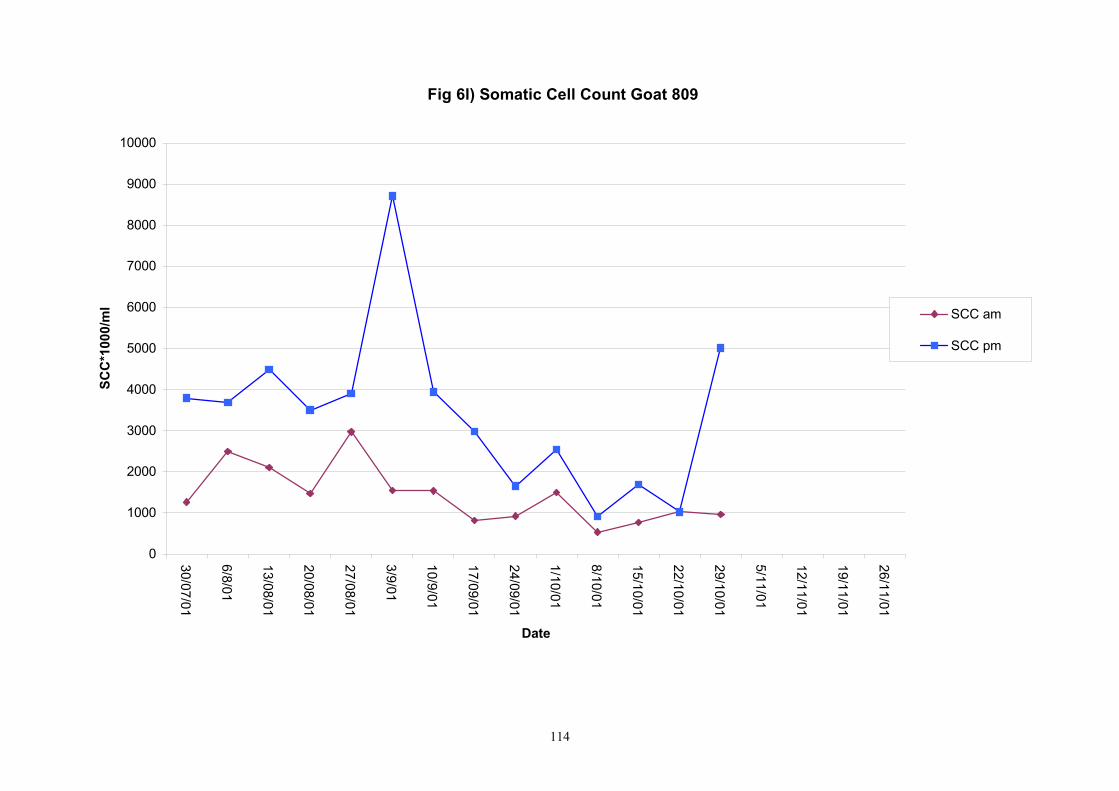
114
Fig 6l) Somatic Cell Count Goat 809
0
1000
2000
3000
4000
5000
6000
7000
8000
9000
10000
30/07/01
6/8/01
13/08/01
20/08/01
27/08/01
3/9/01
10/9/01
17/09/01
24/09/01
1/10/01
8/10/01
15/10/01
22/10/01
29/10/01
5/11/01
12/11/01
19/11/01
26/11/01
Date
SCC
*100
0/m
l SCC am
SCC pm

115
Fig 6m) Somatic Cell Count Goat 640
0
2000
4000
6000
8000
10000
12000
14000
16000
30/07/01
6/8/01
13/08/01
20/08/01
27/08/01
3/9/01
10/9/01
17/09/01
24/09/01
1/10/01
8/10/01
15/10/01
22/10/01
29/10/01
5/11/01
12/11/01
19/11/01
26/11/01
Date
SCC
*100
0/m
l
SCC am
SCC pm

116
Fig 6n) Somatic Cell Count Goat 605
0
2000
4000
6000
8000
10000
12000
30/07/01
6/8/01
13/08/01
20/08/01
27/08/01
3/9/01
10/9/01
17/09/01
24/09/01
1/10/01
8/10/01
15/10/01
22/10/01
29/10/01
5/11/01
12/11/01
19/11/01
26/11/01
Date
SCC
*100
0/m
l SCC am
SCC pm

117
Fig 6o) Somatic Cell Count Goat 637
0
200
400
600
800
1000
1200
1400
30/07/01
6/8/01
13/08/01
20/08/01
27/08/01
3/9/01
10/9/01
17/09/01
24/09/01
1/10/01
8/10/01
15/10/01
22/10/01
29/10/01
5/11/01
12/11/01
19/11/01
26/11/01
Date
SCC
*100
0/m
l
SCC am
SCC pm

118
Fig 6p) Somatic Cell Count Goat 705
0
5000
10000
15000
20000
25000
30000
35000
30/07/01
6/8/01
13/08/01
20/08/01
27/08/01
3/9/01
10/9/01
17/09/01
24/09/01
1/10/01
8/10/01
15/10/01
22/10/01
29/10/01
5/11/01
12/11/01
19/11/01
26/11/01
Date
SCC
*100
0/m
l
SCC am
SCC pm

119
Fig 6q) Somatic Cell CountGoat 899
0
2000
4000
6000
8000
10000
12000
14000
16000
18000
30/07/01
6/8/01
13/08/01
20/08/01
27/08/01
3/9/01
10/9/01
17/09/01
24/09/01
1/10/01
8/10/01
15/10/01
22/10/01
29/10/01
5/11/01
12/11/01
19/11/01
26/11/01
Date
SCC
*100
0/m
l
SCC am
SCC pm
120
Statistical Analysis of Lactational and Heat Stability Data INTRODUCTION Statistical analysis of lactational data was undertaken in order to understand further the determinants of ALP concentration in goats’ milk and how heat treatment affected ALP in these samples. Study Design Seventeen goats from the Hannah herd were observed during lactation between May 2001 and early February 2002. Goats were milked twice daily and a total of 8470 milk samples were collected. A subset of 1998 milk samples was tested for ALP concentration. ALP assessments were available for 1413 untreated samples. A further 17 samples were only tested for ALP after heat treatment at 95oC. The remaining 568 samples were split into sub-samples. This enabled 517 samples to be tested for ALP untreated and after heat treatment at both 63oC and 95oC. 17 samples were tested untreated and after 63oC heat treatment and 34 samples untreated and after 95oC heat treatment. For each goat data were available on its age, lactation number, number of kids and casein genotype. Throughout the study its milk yield, stage of lactation and pregnancy status were available. Milk compositional analysis providing protein, fat and total solids percentages and somatic cell counts was available for a subset of the milk samples collected between 30 July and 17 December inclusive. These variables and untreated ALP concentrations were all available for a subset of 625 milk samples. These were approximately equally split between the morning and afternoon milkings. If the dataset is further restricted to those samples where morning and the corresponding afternoon milkings are both present and goat 705 is excluded (due to health problems) then the subset is reduced slightly to 600 samples. Of these, 316 samples (all from morning milkings) were split into sub-samples and tested for ALP without heat treatment and after heat treatment at 63oC and 95oC. Statistical Analysis The study generated a complex and rich data set requiring a range of different models to be fitted. The range of untreated ALP concentrations (505-1554125) and somatic cell counts (68-36978) necessitated a log transformation of these variables prior to further investigation as values differed by many orders of magnitude. A constant of one was added to all ALP concentrations prior to log transformation as ALP was not detected in some of the samples heat treated at 95oC. As already stated, the study investigated both the determinants of ALP concentration prior to any heat treatment and also the effect of heat treatment. As only a subset of samples was heat treated and these were all confined to morning milkings, two separate sets of analyses have been undertaken. The first investigated the determinants of untreated ALP. The second investigated the effects of heat treatments (no heat treatment, 63oC and 95oC) and whether the magnitude of these effects was related to other recorded covariates. a) Untreated ALP The first stage was the application of a range of exploratory data analysis techniques to the data. Boxplots classified by goat and morning/afternoon milking were produced for each variable associated with milk (yield, compositional analysis components, ALP concentration and somatic cell counts) in order to identify potential outliers in the dataset. This is a univariate check which considers each variable in isolation from other variables. Clearly, however, if covariates are related then unusual values in one covariate may in fact be explainable in terms of unusually high or low values of another covariate. (For example, high ALP concentrations tended to be associated with high somatic cell counts.) Consequently,
121
samples with particularly high or low values were checked to see if they had unusual values for more than one covariate. Bivariate scatterplots for key covariates were also inspected. A preliminary investigation of whether ALP concentration in untreated milk differed between morning and afternoon milkings was undertaken by plotting afternoon concentrations against the corresponding morning samples. Similar plots were obtained for total ALP (i.e. after taking into account the lower milk yield in the afternoon which might influence concentration), somatic cell count concentration and total somatic cell count. (There were a total of 736 morning samples with corresponding afternoon ALP records.) Differences were compared formally by paired t-test. For the subset of 600 samples with all variables recorded and matching AM and PM data, three types of correlation matrices investigating linear relationships between all pairwise comparisons of variables were produced and interesting relationships with ALP explored graphically. Firstly, correlations between the variables using the raw data (after transformation where appropriate) were computed. However, this fails to separate out relationships between variables at the “between-goat” and “within-goat” level. It is questionable to assume a priori that relationships at these two levels are the same. For example, it could be that although goats with higher average values for one variable also had higher values for a second variable, within animals there was no relationship between the two variables. In order to investigate this matter further two additional correlation matrices were produced. Correlations between variables using goat means enabled linear relationships at the “between goat” level to be investigated. Within-goat linear relationships were studied by first subtracting from each variable the respective individual goat means. Consequently, values for each variable then represented deviations from the corresponding animal’s mean. Correlations between these deviations (standardised variables) reflected the strength of within-goat linear relationships. These methods were intended to give a feel for the data and also some preliminary indication of whether relationships existed between the same pairs of variables at both levels. Its usefulness as a general technique is not only in identifying which variables and factors were likely to be most promising when trying to predict ALP but also identifying whether there were alternative sets of variables and factors which were likely to give models with similar predictive power. As has already been indicated, observed relationships between pairs of variables might not a priori be the same at both the “between-goat” and “within-goat” levels. It was therefore important to model these two levels separately in order to check not only whether any relationship between a pair of variables existed at both levels but also whether any such relationship was similar. If there are different relationships at the two levels, this is informative and suggests that the relationship may be spurious. At both levels statistical modelling was carried out using stepwise regression techniques. This is an iterative technique which forms a final model by successively adding or removing terms from the model. Removal of a term already in the model or addition of a new term to the model is determined by which change will produce the largest drop in unexplained variation which is also statistically significant. The process stops when removing any more terms would reduce the fit of the model significantly and the inclusion of any more terms would not significantly improve the model. For within-goat modelling it is necessary to fit individual goat effects first before starting the stepwise procedure. Caution is required when using such techniques as model determination is totally data driven. There is the danger that spurious terms may be added to the model. When datasets are large (as is the case here at the within-

122
goat level), the addition of a term may prove to be statistically significant but provide little improvement in the fit. Indeed there is a risk that small improvements from adding an extra term may not be reproducible if more modelling was repeated on a separate dataset. It is known that, in general, models fit better to the data used to generate them than to predict responses from a new dataset’s explanatory variables. Additionally, since the technique adds and removes terms from a model following pre-specified rules, it does not consider all possible models that could be fitted. Indeed, given the number of variables recorded in this study, it would not be possible to consider all possible combinations of variables and factors which might be included in a model. There is therefore no absolute guarantee that the model fitted is the best possible model. In practice, we are likely to obtain a model which is close to the optimum but it should be remembered that there may well be other models that would perform equally well. Just because certain variables have been selected, it does not mean that other variables could not have served instead. Univariate regressions between ALP and individual explanatory variables were computed at both levels to check that the relationships were indeed similar both between and within animals. However, direct comparison of regression coefficients between two models when both have more than one explanatory variable in them is not usually possible as explanatory variables tend to be correlated with each other. There is also confounding and partial confounding in the dataset. This is possibly easiest seen in the context of the inter-relationship of goat effects, stage of lactation and sampling date. If a model includes differences between goats and also sampling date, the stage of lactation cannot be added to the model. This is because the difference between sampling date and the stage of lactation is a constant over time for any given individual animal. Other explanatory variables such as milk yield and compositional data are correlated (i.e. confounded) with each other to a greater or lesser extent. This means, for example, that variable A may be an important predictor before adjustment for variable B but not after adjustment for variable B. For each model fitted the percentage variation explained has been quoted. This is commonly known as the “adjusted R2”. This is the percentage variation in the response variable explained by the model after adjusting for the number of predictors included in the model. An adjustment is needed as the inclusion of further terms would inevitably increase the percentage variation accounted for although this might not be reproducible. b) Comparison of untreated and heat treated ALP There were a total of 316 morning milk samples which were split into triplicate sub-samples and tested without heat treatment and after heat treatment at 63oC and 95oC. By restricting attention to only milk samples tested under all heat conditions, this ensures that differences observed between heat treatments are not due to differences between milk samples. These 316 morning milk samples were approximately equally distributed across all the goats. Each goat provided between 16 and 21 samples towards the total of 316. Various graphical inspections of the data have been undertaken. Log transformed ALP concentrations for the three treatment group sub-samples were plotted against the rank of the corresponding untreated ALP concentration. This enabled a visual comparison of how heat treatment at 63oC and 95oC changed the concentration relative to each other and also relative to untreated ALP as untreated ALP concentration increased. Additionally, the three treatment sub-samples were plotted against their milk yield, protein, fat and total solid percentages. In order to formally test for overall effects of heat treatments, the three groups were compared by two-way analysis of variance using the 316 milk collection samples as a blocking factor. In order to investigate whether the extent of treatment effects was related to any of the covariates

123
collected, regression analyses were necessary. The same requirement to study both “between-goat” and “within-goat” relationships was necessary here as for when studying the determinants of untreated ALP. In order to study “between-goat” effects, a table of goat X treatment means for log transformed ALP and goat means for each covariate were calculated. Regression models were fitted to the log transformed ALP means to assess the improvement from fitting a common covariate slope or separate slopes for each treatment after allowing for separate intercepts. Each potential covariate was considered in turn. Models including more than one covariate were considered. Stepwise regression modelling was also investigated. At the within-goat level, goat means for each covariate were subtracted and similar regression approaches adopted. For each of the three treatment groups, separate correlation matrices for “between-goat” and “within-goat” linear relationships were constructed. Similarly, correlation matrices between the raw covariates were also produced which do not distinguish between relationships at the two levels. RESULTS a) Untreated ALP Morning and corresponding afternoon ALP concentrations have been plotted against each other in Figure 1. There were two very low morning ALP concentrations for Goats 601 (623) and 610 on 19 June (530). The corresponding afternoon ALP concentrations were 37085 and 12550 respectively. These two values have been checked and no error was found in data entry. Nevertheless, the values do look very suspicious indeed. For neither of these observations were compositional analysis or somatic cell counts available and so these data-points were automatically excluded when subsequently modelling ALP as a function of somatic cell counts. A line at 45o through the origin has been drawn on the graph. If there was no consistent difference between AM and PM ALP concentrations then points ought to be randomly scattered around the line. In practice, it can be seen that observations are almost entirely above the line. A formal statistical test by paired t-test showed that the afternoon ALP concentration was significantly higher (p<0.001) than the morning. The 95% confidence interval for the mean difference on the log scale between afternoon and morning was (0.3322, 0.3827). This corresponds very approximately on the back-transformed scale to a confidence interval for the ratio of PM:AM ALP concentrations of (1.39, 1.47). Milk yield was known to be lower (p<0.001) in the afternoon than the morning with a 95% confidence interval for the mean difference of (0.51,0.55) litres. Hence, as an aside, there was interest in whether total ALP differed between morning and afternoon collections. A similar plot for total ALP (Figure 2) showed that, in contrast, total ALP was higher in the morning than the afternoon. Formally, a paired t-test showed that the total ALP in the afternoon was significantly (p<0.001) lower than the morning with a 95% confidence interval for the mean difference between afternoon and morning of (-0.4249, -0.3679). This corresponds very approximately on the back-transformed scale to a confidence interval for the ratio of PM:AM total ALP of (0.65,0.69). Similar plots for somatic cell count concentration and total count are shown in Figures 3 & 4 respectively. Goat 640 had an exceptionally low somatic cell count (73) on the morning of 30 July. The corresponding afternoon count was 3705. Again, somatic cell count concentrations were significantly higher (p<0.001) in the afternoon than the morning with a 95% confidence interval on the log scale of (0.6437,0.7743). This corresponds very approximately on the back-transformed scale to a confidence interval for the ratio of PM:AM somatic cell concentrations of (1.90, 2.17). However, for total somatic cell count visual inspection did not indicate such a consistent pattern although the mean was significantly higher in the morning (p=0.008) than the afternoon with a 95% confidence interval on the log scale of (0.0242, 0.1581). This corresponds very approximately on the back-transformed scale to a confidence interval for the ratio of PM:AM total somatic cell count of (1.02, 1.17).

124
6 7 8 9 10 11 12 13 14 15
6
7
8
9
10
11
12
13
14
15
Log(ALP+1) - AM
Log(
ALP+
1) -
PM
Figure 1 : Comparison of AM & PM ALP concentrations

125
6 7 8 9 10 11 12 13 14 15
6
7
8
9
10
11
12
13
14
15
Log(ALP+1) - AM
Log(
ALP+
1) -
PMFigure 1 : Comparison of AM & PM ALP concentrations
1514131211109876
15
14
13
12
11
10
9
8
7
6
Log(Total ALP+1) - AM
Log(
Tota
l ALP
+1) -
PM
Figure 2 : Comparison of AM & PM Total ALP
1110987654
11
10
9
8
7
6
5
4
Log(Somatic) - AM
Log(
Som
atic
) - P
M
Figure 3 : Comparison of AM & PM ALP somatic cell counts

126
One goat (tag number 705) had considerably higher ALP concentrations than other animals. Both her kids died at birth and she herself died early in the study. Hence there is good reason to believe that she was atypical and perhaps ought to be excluded from statistical analyses. As somatic cell count and milk compositional data were collected less frequently than other variables and in any case only from 1 July onwards, the early death of this animal means that somatic cell counts are only available for her at three dates. Consequently, her subsequent omission from the dataset for formal analysis and correlation matrices has negligible impact on the results. For the 600 untreated milk samples on which all variables were recorded and for which both AM and corresponding PM milk samples were available, a correlation matrix (not distinguishing between “within goat” and “between goat” relationships is shown in Table 1. Indicator variables have been included for AM/PM and pregnancy status (using the values 1 and 2 to denote AM and PM respectively and “not pregnant” and pregnant respectively).
10987654
10
9
8
7
6
5
4
Log(Total somatic) - AM
Log(
Tota
l som
atic
) - P
MFigure 4: AM & PM ALP Total somatic cell count comparison

127
Table 1: Combined within & between correlation matrix based on 600 milk samples with complete data
Log (ALP+1) 1.000 Log (somatic) 0.744 1.000 [Log(somat)]^2 0.762 0.995 1.000 Milk yield -0.304 -0.359 -0.359 1.000 Log(Milk yld) -0.361 -0.397 -0.398 0.941 1.000 Protein 0.529 0.491 0.514 -0.563 -0.579 1.000 Fat 0.191 0.272 0.264 -0.566 -0.564 0.270 1.000 Total solids 0.310 0.366 0.365 -0.686 -0.691 0.566 0.917 1.000 Collection date 0.158 0.125 0.138 -0.360 -0.352 0.613 0.173 0.351 1.000 Lactation days 0.090 0.093 0.103 -0.300 -0.294 0.521 0.152 0.303 0.945 1.000 Pregnant 0.019 0.037 0.046 -0.190 -0.173 0.322 -0.052 0.073 0.748 0.710 1.000 AM/PM 0.181 0.319 0.305 -0.675 -0.674 0.108 0.595 0.545 0.000 0.000 0.000 1.000 Log
ALP Log Somat
[Log somat]^2
Milk yield
Log Milk
Protein Fat Total solids
Coll date
Lact days
Preg status
AM / PM
In Figure 5 all untreated ALP observations are plotted against their corresponding somatic cell count, from which a relationship between ALP and somatic cell concentrations is indicated. Hence some of the high ALP values can be seen to be associated with the corresponding high somatic cell counts. (Figure 6 shows total ALP plotted against total somatic cell count.)
AM PM
1110987654
14
13
12
11
10
9
8
Log(somatic)
Log(
ALP
+1)
Figure 5 : Plot of ALP and somatic cell concentrations
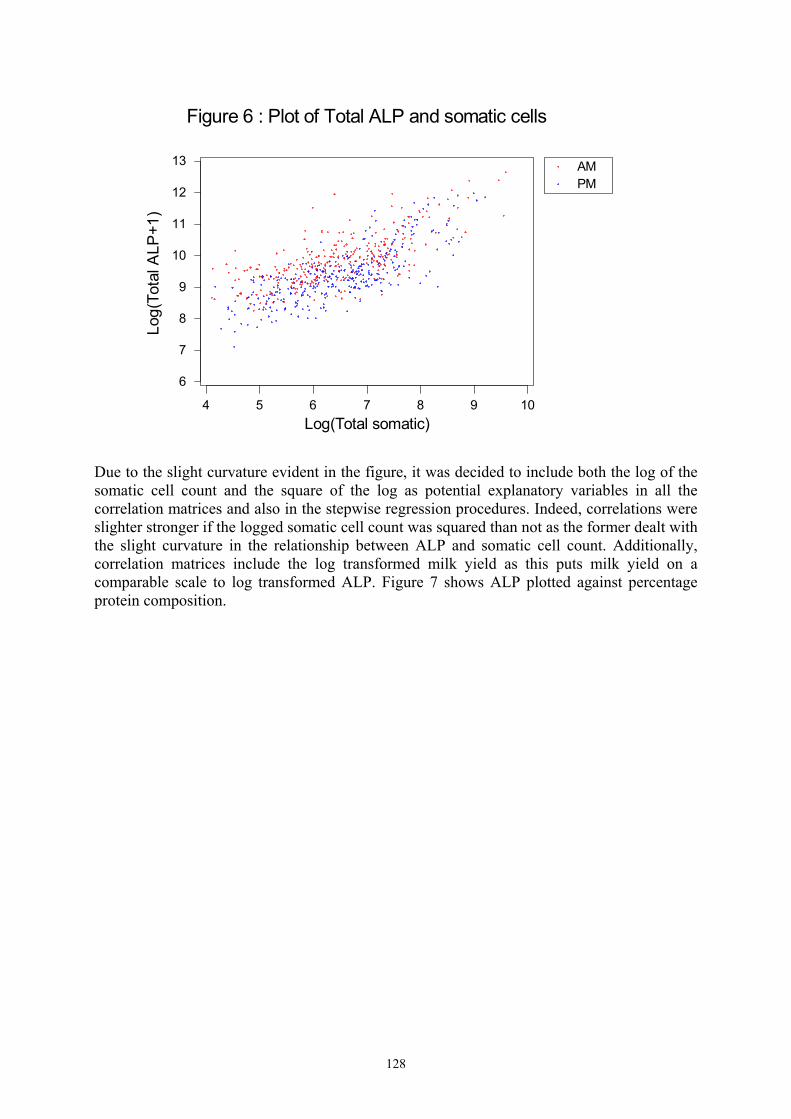
128
Due to the slight curvature evident in the figure, it was decided to include both the log of the somatic cell count and the square of the log as potential explanatory variables in all the correlation matrices and also in the stepwise regression procedures. Indeed, correlations were slighter stronger if the logged somatic cell count was squared than not as the former dealt with the slight curvature in the relationship between ALP and somatic cell count. Additionally, correlation matrices include the log transformed milk yield as this puts milk yield on a comparable scale to log transformed ALP. Figure 7 shows ALP plotted against percentage protein composition.
AM PM
10987654
13
12
11
10
9
8
7
6
Log(Total somatic)
Log(
Tota
l ALP
+1)
Figure 6 : Plot of Total ALP and somatic cells

129
Within-goat and between-goat correlation matrices are shown in Tables 2 & 3 respectively. It is evident from the between and within goat correlation matrices that the highest correlations at both levels with log(ALP+1) were for functions of logged somatic cell counts but protein was also correlated. Other variables such as milk yield, total solids and fat were correlated at the within-goat but not at the between-goat level. These correlations were investigated graphically. Within-goat scatterplots for ALP with squared log somatic cell concentrations, protein and milk yield are shown in Figures 8-10 respectively. Scatterplots for other covariates with ALP are included in appendix A. Table 2: Within-goat correlation matrix based on 600 milk samples with complete data
Log (ALP+1) 1.000 Log (somatic) 0.697 1.000 [Log(somat)]^2 0.716 0.992 1.000 Milk yield -0.462 -0.551 -0.548 1.000 Log (Milk yld) -0.478 -0.548 -0.545 0.935 1.000 Protein 0.525 0.438 0.470 -0.566 -0.576 1.000 Fat 0.389 0.522 0.506 -0.598 -0.613 0.297 1.000 Total solids 0.495 0.587 0.584 -0.699 -0.724 0.569 0.927 1.000 Collection date 0.294 0.222 0.234 -0.469 -0.477 0.740 0.204 0.415 1.000 Lactation days 0.294 0.222 0.234 -0.469 -0.477 0.740 0.204 0.415 1.000 1.000 Pregnant 0.118 0.129 0.135 -0.304 -0.303 0.427 -0.029 0.122 0.740 0.740 1.000 AM/PM 0.269 0.445 0.421 -0.751 -0.764 0.123 0.629 0.593 0.000 0.000 0.000 1.000 Log
ALP Log Somat
[Log somat] ^2
Milk yield
Log Milk
Protein Fat Total solids
Coll date
Lact days
Preg status
AM / PM
2 3 4 5
8
9
10
11
12
13
14
Protein
Log(
ALP+
1)
Figure 7: Plot of ALP concentration and %protein in milk

130
Table 3: Between-goat correlation matrix based on 600 milk samples with complete data
Log (ALP+1) 1.000
Log (somatic) 0.798 1.000
[Log(somat)]^2 0.817 0.998 1.000
Milk yield -0.146 -0.072 -0.063 1.000
Log (Milk yld) -0.286 -0.203 -0.200 0.973 1.000
Protein 0.646 0.663 0.667 -0.569 -0.610 1.000
Fat -0.138 -0.273 -0.284 -0.423 -0.379 0.226 1.000
Total solids 0.104 0.008 -0.002 -0.634 -0.583 0.616 0.874 1.000
Collection date -0.325 -0.285 -0.266 0.747 0.776 -0.325 -0.347 -0.393 1.000
Lactation days -0.360 -0.243 -0.243 0.556 0.549 -0.450 -0.252 -0.371 0.578 1.000
Age 0.194 0.268 0.252 -0.439 -0.514 0.045 0.098 0.069 -0.764 -0.341 1.000
Kids DOB 0.262 0.141 0.151 -0.273 -0.249 0.370 0.119 0.239 -0.165 -0.900 0.004 1.000
No. of kids -0.096 -0.143 -0.129 0.405 0.400 -0.212 0.155 0.012 0.278 0.140 -0.442 -0.021 1.000
Lactation no. 0.263 0.273 0.257 -0.419 -0.510 0.046 0.205 0.116 -0.810 -0.322 0.965 -0.043 -0.379 1.000
Log ALP
Log Somat
[Log somat] ^2
Milk yield
Log Milk
Protein Fat Total solids
Coll date
Lact days
Age Kids DOB
No. of kids
Lact no.
1.51.00.50.0-0.5-1.0
2.4
1.6
0.8
0.0
-0.8
-1.6
Protein deviations from goat mean
Log(
ALP
+1) d
evia
tions
Figure 9:Within goat ALP and protein variation
0.90.60.30.0-0.3-0.6
2.4
1.6
0.8
0.0
-0.8
-1.6
Milk yield deviations from goat mean
Log(
ALP
+1) d
evia
tions
Figure 10:Within goat ALP and milk yield variation6040200-20-40
2.4
1.6
0.8
0.0
-0.8
-1.6
Squared log(somatic conc) deviations from goat mean
Log(
ALP
+1) d
evia
tions
Figure 8:Within goat ALP and somatic cell concentrations variation

131
The corresponding between-goat scatterplots for ALP with squared log somatic cell concentrations, protein and milk yield are shown in Figures 11-13 respectively. Scatterplots for other covariates with ALP are included in appendix B.
30 40 50 60 70 80
9.5
10.0
10.5
11.0
11.5
12.0
Mean squared log(somatic concentration)
Mea
n lo
g(A
LP+1
)
Figure 11:Goat means for ALP concentration & somatic cells
3.00 3.12 3.24 3.36 3.48 3.60
9.5
10.0
10.5
11.0
11.5
12.0
Mean Protein
Mea
n lo
g(A
LP+1
)
Figure 12: Goat means for ALP concentration & Protein

132
The graphs show that at both levels, logged ALP increased as squared log somatic cell concentration increased. Similar patterns were observed (although less strongly) as percentage protein increased. There was the suggestion that ALP concentration decreased as milk yield increased at the within-goat level. This seemed more apparent at very low milk yields. However, at the between-goat level such a relationship was not clear. 53.6% of the variance in the ALP data could be attributed to differences between goats. The dominant term identified at the within-goat level was the squared logged somatic cell count. When added to a model already including goat, this increased the percentage variation accounted for up to 77.3% and explained 51.2% of the within-goat variation. Adding protein concentration to the model increased the percentage variation accounted for slightly to 79.4% and explained 55.7% of the within-goat variation. (Finally adding pregnancy status caused a negligible increase to 79.7% of variation explained with 56.1% of within-goat variation explained.) The first two stepwise models were :- Log(ALP+1)=Goat+0.03506*[log(somatic)]2 (0.00142) Log(ALP+1)=Goat+0.02948*[log(somatic)]2 +0.4678*Protein
(0.153) (0.0602) Alternatively, if protein was included in the model after goat but somatic cell count was not, then the total variance accounted for was 66.4% of which only 27.5% of the within-goat variation was explained.
0.3 0.4 0.5 0.6 0.7 0.8
9.5
10.0
10.5
11.0
11.5
12.0
Mean milk yield (litres)
Mea
n lo
g(A
LP+1
)
Figure 13:Goat means for ALP concentration & milk yield

133
Log(ALP+1)=Goat+1.0132*Protein (0.0680) At the between-goat level, stepwise regression only selected the squared logged somatic cell count and this explained 64.3% of the variation at this level. (In comparison to the within-goat level, the statistical power at the between-goat level was low.) None of the factors and variates which differed solely at the between-goat level (age differences, lactation number, genotype, number of kids or date of giving birth) were found to be related to between-goat ALP levels. It should be noted that the numbers of goats on each genotype were low as the sixteen animals covered five genotypes. Indeed there was only a single animal on each of B2E and AbB2 genotypes. There were four, five and five goats belonging to B2E, EE and FF genotypes respectively. These between-goat factors and variates were to a greater or lesser extent confounded with each other. The fitted model at the between-goat level was :- Log(ALP+1)=7.888 + 0.04599*[log(somatic)]2 (0.469) (0.00869) The regression coefficient for squared logged somatic cell count estimated at the between and within levels were consistent with each other. This would add weight to the justification for using somatic cell count as a predictor of ALP concentration Unlike at the within-goat level, stepwise regression did not include protein with somatic cell concentration in the model at the between-goat level. Indeed, if it was forced into the model then the percentage variance accounted for (adjusted R2) actually fell to 63.7%, indicating that it provided no additional predictive power over that already afforded by the squared log somatic cell concentration. If protein was included in the between level model when somatic cell count was excluded, then the total variance accounted for was only 37.5% and the fitted model was :- Log(ALP+1)=2.61 + 2.376*Protein (2.44) (0.751) Although the estimate of the coefficient for protein was larger at the between level than the within level, they were not statistically significantly different. very different at the two levels of modelling. However, the fact that protein did not improve a model at the between-goat level already including somatic cell count would cast some doubt on the usefulness of protein as a predictor. It would suggest that the overall model combining both levels should include somatic cell count but not protein with it. The proposed model combining both within-goat and between-goat variation in terms of explanatory variables is:- Log(ALP+1)=8.1854 + 0.04022 * [log(somatic)]2 (0.0770) (0.00140) This explained a total of 58% of the variation in the data. If only protein was included then only 27.8% of the variation is accounted for in the overall model.

134
Log(ALP+1)=5.998 + 1.3272*Protein (0.284) (0.0872)
As already explained, the predictive ability of protein is debatable. Even if a combined model including both somatic cell count and protein was fitted, it would only explain 60.5% of the variation which is a very small improvement over a model only including somatic cell count (58%). In order to determine how critical somatic cell count was to determining ALP, stepwise regression models explicitly excluding somatic cell counts were fitted at both levels. At the between-goat level protein was included in a model and the inclusion of total solids narrowly failed to give a significant improvement (p=0.065). This could either be because it is not important or due to lack of power. The inclusion of both these terms explained 48.7% of the variation at the between goat level. The between-goat model was :- Log(ALP+1)=5.20 + 3.449*Protein –0.464*Total_solids (2.56) (0.864) (0.230) No other variables approached statistically significance at the between-goat level. Attempting to fit a within-goat model including both protein and total solids explained 33.1% of the within-goat variation and both terms were statistically significant. However, if such a model was fitted to both levels simultaneously, the inclusion of total solids did not provide a statistically significant improvement over only including protein in the model and the percentage variation accounted for was unchanged. At the within-goat level, as has already been stated, somatic cell count alone explained 51.2% of the within-goat variation. In contrast, if somatic cell count was excluded, stepwise regression fitted a complex model involving protein, fat, collection date, log of milk yield and the morning/afternoon indicator variable but, even so, explained only 36.6% of the within-goat variation. (Most of these terms negligibly improved the percentage variation accounted for.) It may be noted that the inclusion of only log transformed milk yield and the morning/afternoon indicator (corresponding to different intercepts) explained 24.8% of the within-goat variation. Hence, even at the within-goat level it was evident that somatic cell count was critical. Given the critical importance of somatic cell count, there seemed little benefit from attempting to fit a model excluding compositional data to the complete set of untreated ALP samples which included samples omitted from the former models due to the lack of compositional data. b) Comparison of untreated and heat treated ALP Figure 14 shows the corresponding ALP concentrations for samples under the regimens against the rank of the untreated sample. From this it is evident that ALP concentration was substantially reduced by heat treatment. It is clear that ALP was generally lower after 95oC heat treatment than 63oC heat treatment. However, the precise pairing is difficult to see in this figure. It is clearer when considering a plot of ALP after 63oC heat treatment against ALP for the corresponding sub-sample at 95oC (see Figure 15). In fact 33 out of the 316 samples had higher ALP concentrations after the lower heat treatment than the higher. Table 4 shows the results of a formal test by analysis of variance with heat treatment modelled as a fixed factor and sample as a random factor. There was a highly significant (p<0.001) difference in ALP concentrations between each of the regimens. 95oC heat treated milk had lower ALP concentrations than 63oC heated treated milk which was in turn lower than untreated milk.

135
Table 4 : Log(ALP+1) means for regimens
Treatment Untreated 63oC 95oC s.e.d. P value Mean 10.182 4.314 2.831 0.070 P<0.001
From graphical inspection it would appear that there were two parallel bands for 63oC heat treated ALP. At the higher heat treatment (95oC) it is evident that a comparatively small number of samples (22) had no detectable ALP after heat treatment whilst the remaining 292 samples had higher ALP concentrations. The reason why these samples were so different could not be ascertained. Six of the 22 values were from the same day of milk collection. The values were not specific to only one or two goats. Figures 16-20 show ALP for the three regimens plotted against squared log transformed somatic cell count, protein, fat, total solids and milk yield. In each case the separation remained at the higher heat treatment. The cause of the seeming separation into two bands at the lower heat treatment becomes apparent when individual goat means for heat treated ALP are considered later.
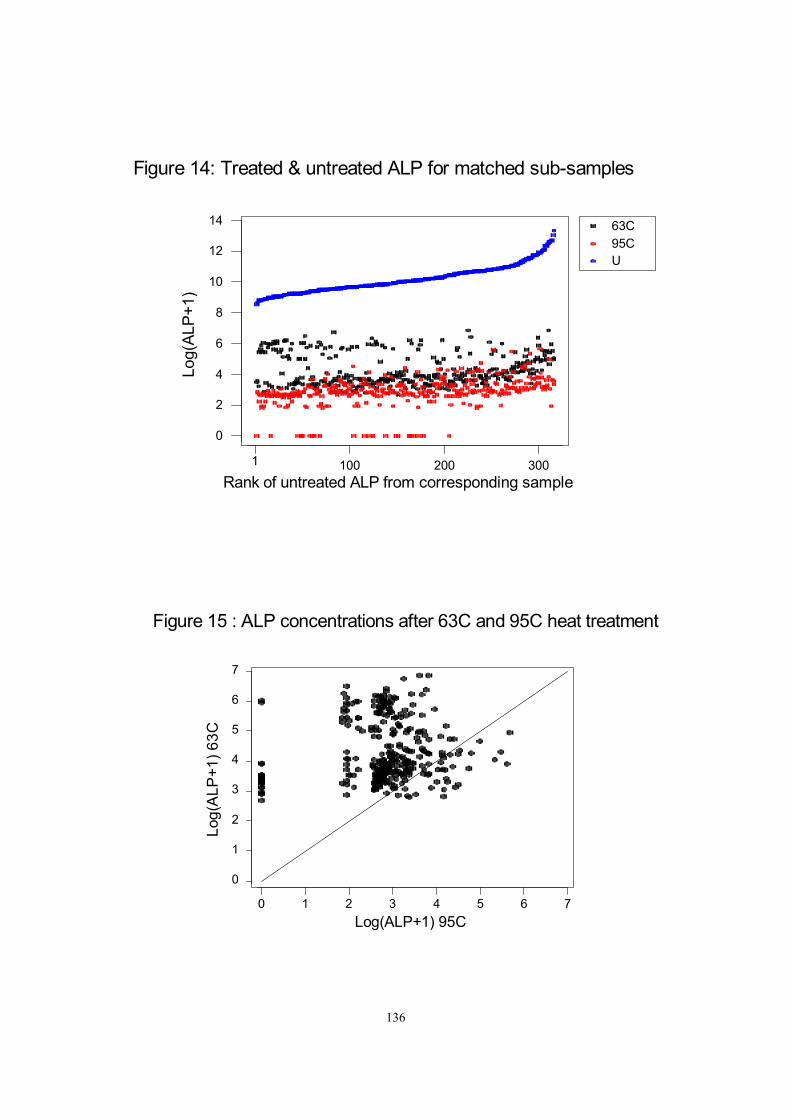
136
63C 95C U
3002001001
14
12
10
8
6
4
2
0
Rank of untreated ALP from corresponding sample
Log(
ALP+
1)Figure 14: Treated & untreated ALP for matched sub-samples
76543210
7
6
5
4
3
2
1
0
Log(ALP+1) 95C
Log(
ALP
+1) 6
3C
Figure 15 : ALP concentrations after 63C and 95C heat treatment

137
63C 95C U
110100908070605040302010
14
12
10
8
6
4
2
0
Square of log(somatic cell)
Log(
ALP+
1)Figure 16: ALP v Squared log somatic cells
63C 95C U
4.53.52.5
14
12
10
8
6
4
2
0
Protein %
Log(
ALP+
1)
Figure 17: ALP v Protein

138
63C 95C U
2 3 4 5 6 7 8 9
0
2
4
6
8
10
12
14
Fat %
Log(
ALP+
1)
Figure 18: ALP v Fat
63C 95C U
19181716151413121110
14
12
10
8
6
4
2
0
Total solids %
Log(
ALP+
1)
Figure 19: ALP v Total solids
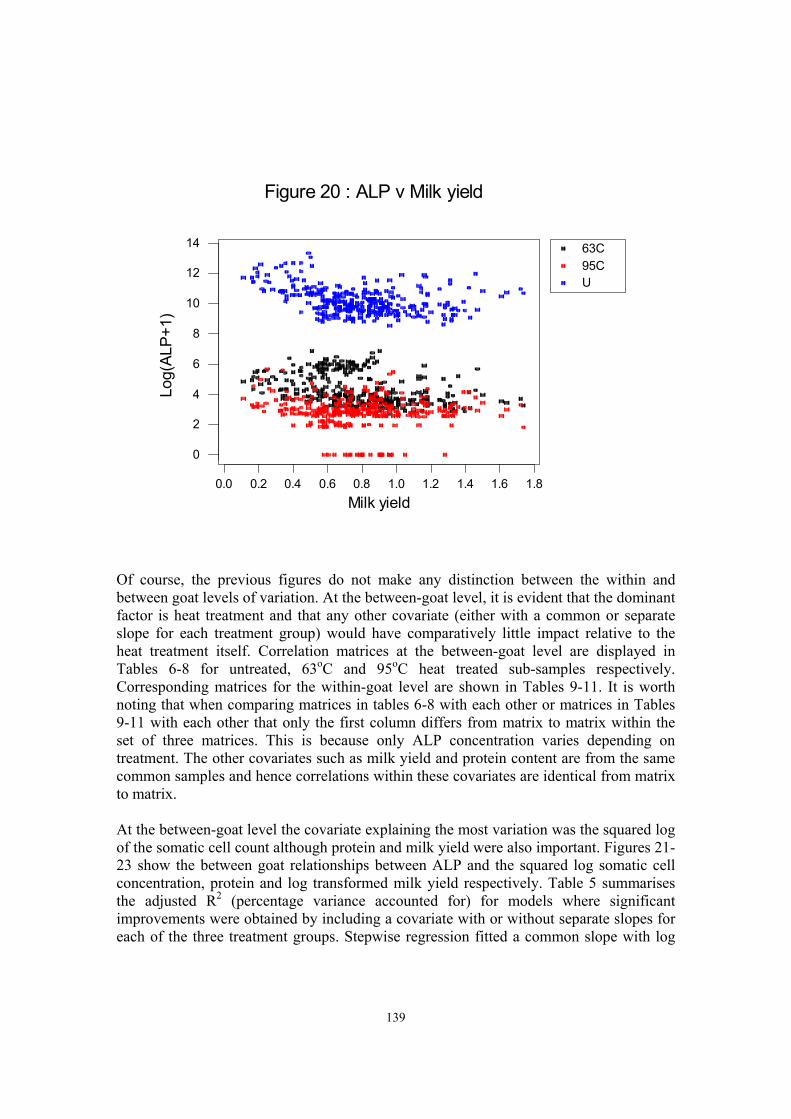
139
Of course, the previous figures do not make any distinction between the within and between goat levels of variation. At the between-goat level, it is evident that the dominant factor is heat treatment and that any other covariate (either with a common or separate slope for each treatment group) would have comparatively little impact relative to the heat treatment itself. Correlation matrices at the between-goat level are displayed in Tables 6-8 for untreated, 63oC and 95oC heat treated sub-samples respectively. Corresponding matrices for the within-goat level are shown in Tables 9-11. It is worth noting that when comparing matrices in tables 6-8 with each other or matrices in Tables 9-11 with each other that only the first column differs from matrix to matrix within the set of three matrices. This is because only ALP concentration varies depending on treatment. The other covariates such as milk yield and protein content are from the same common samples and hence correlations within these covariates are identical from matrix to matrix. At the between-goat level the covariate explaining the most variation was the squared log of the somatic cell count although protein and milk yield were also important. Figures 21-23 show the between goat relationships between ALP and the squared log somatic cell concentration, protein and log transformed milk yield respectively. Table 5 summarises the adjusted R2 (percentage variance accounted for) for models where significant improvements were obtained by including a covariate with or without separate slopes for each of the three treatment groups. Stepwise regression fitted a common slope with log
63C 95C U
1.81.61.41.21.00.80.60.40.20.0
14
12
10
8
6
4
2
0
Milk yield
Log(
ALP+
1)
Figure 20 : ALP v Milk yield

140
(milk yield) as an explanatory variable. It should be noted that none of these models explained a large proportion of the variation left unexplained by heat treatment alone. Table 5 : Summary of various between-goat models with significant covariates
Terms Covariate Slope for covariate Adjusted R2 Treatment group - - 95.4% Treatment + covariate Milk yield Common slope 95.9% Treatment + covariate Log(Milk yield) Common slope 96.0% Treatment + covariate Log(somatic conc) Separate slope 96.5% Treatment + covariate Squared log(somatic) Separate slope 96.6%
The addition of further covariates was investigated for models already including either somatic cell count or log milk yield. In both cases the inclusion of the other gave a statistically significant improvement. Separate slopes for protein were also found to give a statistically significant improvement to a model already including log(milk yield). However, these latter models should be viewed with extreme caution. A large number of possible models have been fitted and the best ones identified on the basis of their fit to data from a small number of goats and they therefore may not be reproducible. Additionally, correlation coefficients for ALP with somatic cells and protein were very different for the 63oC heat treatment than the other two groups which is of concern. It is apparent from Figure 21 that this was due to four goats having high ALP after 63oC heat treatment. (These were goats 617, 618, 890 and 891.) At the within-goat level, again treatment group was the dominant factor with other variables explaining comparatively little variation. The inclusion of squared log somatic cell count with a separate slope for each group was a statistically significant improvement although it only explained approximately 10% of the remaining variation. Protein and milk yield would seem to be other alternatives although they each explained less variation than somatic cell count. Figures 24-26 show the between goat relationships between ALP and the squared log somatic cell concentration, protein and log transformed milk yield respectively. Stepwise regression fitted a complex model including treatment group effects, squared log somatic cell counts, total solids and collection date. However the adjusted R2 value only increased from 93% to 93.8% with the addition of all these terms after treatment group and the inclusion of only a common slope for squared log somatic cell count increased it to 93.6%. The regression model at the within-goat level including somatic cell count was :- Log(ALP+1) = Goat effect + 4.4067 + 0.03732 *[log(somatic)]2 (Untreated) Log(ALP+1) = Goat effect -1.4617 + 0.02169 *[log(somatic)]2 (63oC) Log(ALP+1) = Goat effect -2.9450 + 0.0145 *[log(somatic)]2 (95oC) In all three cases the standard errors for the intercept and slope were 0.0467 and 0.00443 respectively.

141
The regression model at the between-goat level including somatic cell count was :- Log(ALP+1) = 7.976 + 0.0458 *[log(somatic)]2 (Untreated) Log(ALP+1) = 5.055 - 0.0148 *[log(somatic)]2 (63oC) Log(ALP+1) = 1.610 + 0.0255 *[log(somatic)]2 (95oC) In all three cases the standard errors for the intercept and slope were 0.637 and 0.0128 respectively. The slopes at the between and within levels were consistent for the untreated and 95oC heat treated ALP but the 63oC heat treated ALP differed between levels. Indeed, the estimated slope at the between goat level was negative for 63oC heat treated ALP in contrast to the other two groups due to four goats with high ALP levels. The regression model combining both levels was :- Log(ALP+1) = 8.152 + 0.04219*[log(somatic)]2 (Untreated) Log(ALP+1) = 4.224 + 0.00187*[log(somatic)]2 (63oC) Log(ALP+1) = 1.837 + 0.02064*[log(somatic)]2 (95oC) In all three cases the standard errors for the intercept and slope were 0.156 and 0.00308 respectively. Table 6: Between-goat correlation matrix for untreated milk based on 316 common samples
Log (ALP+1) 1.000
Log (somatic) 0.796 1.000
[Log(somat)]^2 0.814 0.997 1.000
Milk yield -0.296 -0.203 -0.200 1.000
Log (Milk yld) -0.463 -0.353 -0.355 0.966 1.000
Protein 0.680 0.653 0.657 -0.733 -0.794 1.000
Fat -0.107 0.075 0.073 -0.388 -0.374 0.405 1.000
Total solids 0.159 0.253 0.251 -0.664 -0.653 0.724 0.898 1.000
Collection date -0.188 -0.233 -0.206 0.548 0.553 -0.189 0.158 -0.008 1.000
Lactation days -0.242 -0.164 -0.164 0.391 0.392 -0.332 0.197 -0.034 0.493 1.000
Age 0.244 0.340 0.326 -0.445 -0.522 0.192 0.049 0.107 -0.644 -0.184 1.000
Kids DOB 0.212 0.110 0.119 -0.265 -0.265 0.311 -0.170 0.035 -0.238 -0.962 0.004 1.000
No. of kids -0.121 -0.174 -0.157 0.392 0.375 -0.242 -0.129 -0.165 0.319 0.108 -0.442 -0.021 1.000
Lactation no. 0.322 0.346 0.333 -0.442 -0.546 0.219 0.056 0.109 -0.627 -0.137 0.965 -0.043 -0.379 1.000
Log ALP
Log Somat
[Log somat]^2
Milk yield
Log Milk
Protein Fat Total solids
Coll date
Lact days
Age Kids DOB
No. of kids
Lact no.

142
Table 7: Between-goat correlation matrix for 63oC heat treated milk based on 316 common samples
Log (ALP+1) 1.000
Log (somatic) -0.210 1.000
[Log(somat)]^2 -0.199 0.997 1.000
Milk yield -0.375 -0.203 -0.200 1.000
Log (Milk yld) -0.313 -0.353 -0.355 0.966 1.000
Protein -0.016 0.653 0.657 -0.733 -0.794 1.000
Fat -0.012 0.075 0.073 -0.388 -0.374 0.405 1.000
Total solids -0.035 0.253 0.251 -0.664 -0.653 0.724 0.898 1.000
Collection date -0.246 -0.233 -0.206 0.548 0.553 -0.189 0.158 -0.008 1.000
Lactation days 0.291 -0.164 -0.164 0.391 0.392 -0.332 0.197 -0.034 0.493 1.000
Age 0.168 0.340 0.326 -0.445 -0.522 0.192 0.049 0.107 -0.664 -0.184 1.000
Kids DOB -0.402 0.110 0.119 -0.265 -0.265 0.311 -0.170 0.035 -0.238 -0.962 0.004 1.000
No. of kids -0.296 -0.174 -0.157 0.392 0.375 -0.242 -0.129 -0.165 0.319 0.108 -0.442 -0.021 1.000
Lactation no. 0.126 0.346 0.333 -0.442 -0.546 0.219 0.056 0.109 -0.627 -0.137 0.965 -0.043 -0.379 1.00
Log ALP
Log Somat
[Log somat]^2
Milk yield
Log Milk
Protein Fat Total solids
Coll date
Lact days
Age Kids DOB
No. of kids
Lact no.
Table 8: Between-goat correlation matrix for 95oC heat treated milk based on 316 common samples
Log (ALP+1) 1.000
Log (somatic) 0.744 1.000
[Log(somat)]^2 0.755 0.997 1.000
Milk yield -0.445 -0.203 -0.200 1.000
Log (Milk yld) -0.575 -0.353 -0.355 0.966 1.000
Protein 0.672 0.653 0.657 -0.733 -0.794 1.000
Fat 0.177 0.075 0.073 -0.388 -0.374 0.405 1.000
Total solids 0.397 0.253 0.251 -0.664 -0.653 0.724 0.898 1.000
Collection date -0.381 -0.233 -0.206 0.548 0.553 -0.189 0.158 -0.008 1.000
Lactation days -0.196 -0.164 -0.164 0.391 0.392 -0.332 0.197 -0.034 0.493 1.000
Age 0.378 0.340 0.326 -0.445 -0.522 0.192 0.049 0.107 -0.644 -0.184 1.000
Kids DOB 0.100 0.110 0.119 -0.265 -0.265 0.311 -0.170 0.035 -0.238 -0.962 0.004 1.000
No. of kids -0.020 -0.174 -0.157 0.392 0.375 -0.242 -0.129 -0.165 0.319 0.108 -0.442 -0.021 1.000
Lactation no. 0.424 0.346 0.333 -0.442 -0.546 0.219 0.056 0.109 -0.627 -0.137 0.965 -0.043 -0.379 1.000
Log ALP
Log Somat
[Log somat]^2
Milk yield
Log Milk
Protein Fat Total solids
Coll date
Lact days
Age Kids DOB
No. of kids
Lact no.
Table 9: Within-goat correlation matrix based for untreated milk based on 316 common samples.
Log (ALP+1) 1.000
Log (somatic) 0.499 1.000
[Log(somat)]^2 0.517 0.991 1.000
Milk yield -0.342 -0.434 -0.466 1.000
Log (Milk yld) -0.365 -0.431 -0.466 0.935 1.000
Protein 0.429 0.530 0.572 -0.780 -0.815 1.000
Fat 0.247 0.366 0.372 -0.438 -0.480 0.533 1.000
Total solids 0.351 0.469 0.492 -0.606 -0.659 0.764 0.930 1.000
Collection date 0.252 0.317 0.328 -0.779 -0.776 0.759 0.441 0.611 1.000
Lactation days 0.252 0.317 0.328 -0.779 -0.776 0.759 0.441 0.611 1.000 1.000
Log ALP
Log Somat
[Log somat]^2
Milk yield
Log Milk
Protein Fat Total solids
Coll date
Lact days

143
Table 10: Within-goat correlation matrix based for 63oC heat treated milk based on 316 common samples.
Log (ALP+1) 1.000
Log (somatic) 0.245 1.000
[Log(somat)]^2 0.263 0.991 1.000
Milk yield -0.250 -0.434 -0.466 1.000
Log (Milk yld) -0.266 -0.431 -0.466 0.935 1.000
Protein 0.252 0.530 0.572 -0.780 -0.815 1.000
Fat 0.165 0.366 0.372 -0.438 -0.480 0.533 1.000
Total solids 0.221 0.469 0.492 -0.606 -0.659 0.764 0.930 1.000
Collection date 0.181 0.317 0.328 -0.779 -0.776 0.759 0.441 0.611 1.000
Lactation days 0.181 0.317 0.328 -0.779 -0.776 0.759 0.441 0.611 1.000 1.000
Log ALP
Log Somat
[Log somat]^2
Milk yield
Log Milk
Protein Fat Total solids
Coll date
Lact days
Table 11: Within-goat correlation matrix based for 95oC heat treated milk based on 316 common samples.
Log (ALP+1) 1.000
Log (somatic) 0.154 1.000
[Log(somat)]^2 0.157 0.991 1.000
Milk yield 0.053 -0.434 -0.466 1.000
Log (Milk yld) 0.025 -0.431 -0.466 0.935 1.000
Protein 0.042 0.530 0.572 -0.780 -0.815 1.000
Fat 0.228 0.366 0.372 -0.438 -0.480 0.533 1.000
Total solids 0.178 0.469 0.492 -0.606 -0.659 0.764 0.930 1.000
Collection date -0.109 0.317 0.328 -0.779 -0.776 0.759 0.441 0.611 1.000
Lactation days -0.109 0.317 0.328 -0.779 -0.776 0.759 0.441 0.611 1.000 1.000
Log ALP
Log Somat
[Log somat]^2
Milk yield
Log Milk
Protein Fat Total solids
Coll date
Lact days
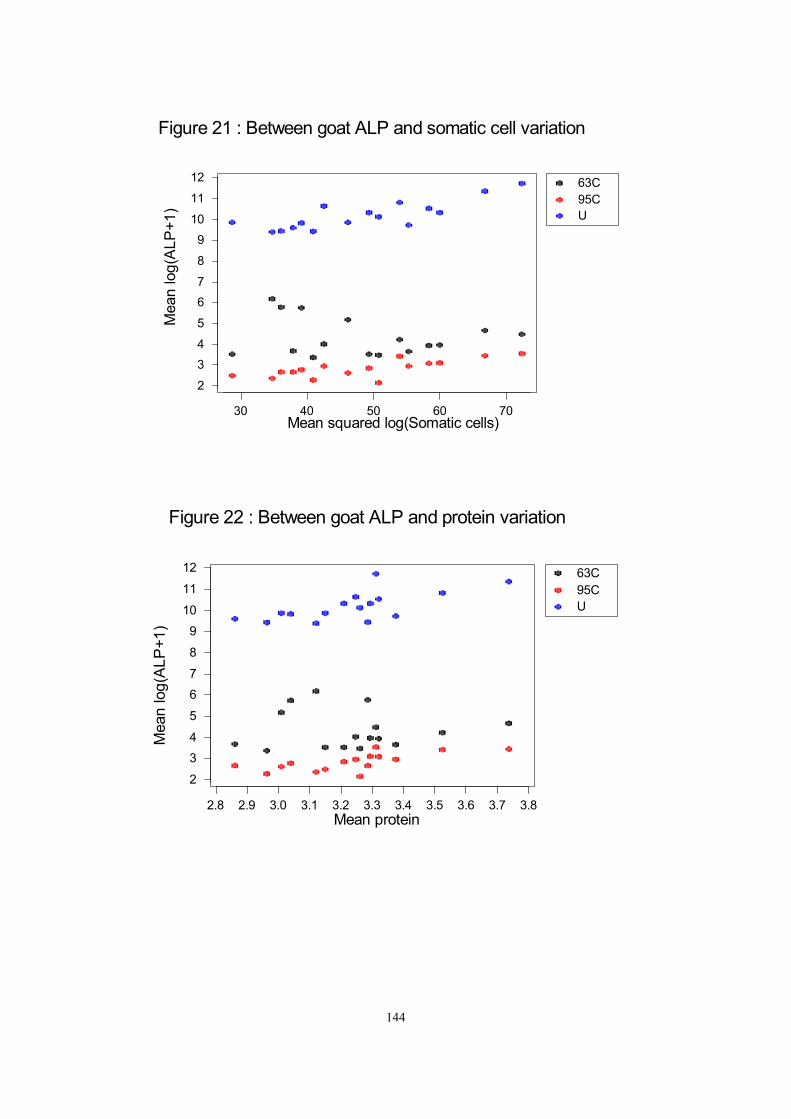
144
63C 95C U
7060504030
12
11
109
8
76
5
43
2
Mean squared log(Somatic cells)
Mea
n lo
g(A
LP+1
)
Figure 21 : Between goat ALP and somatic cell variation
63C 95C U
3.83.73.63.53.43.33.23.13.02.92.8
12
11
109
8
76
5
43
2
Mean protein
Mea
n lo
g(A
LP+1
)
Figure 22 : Between goat ALP and protein variation
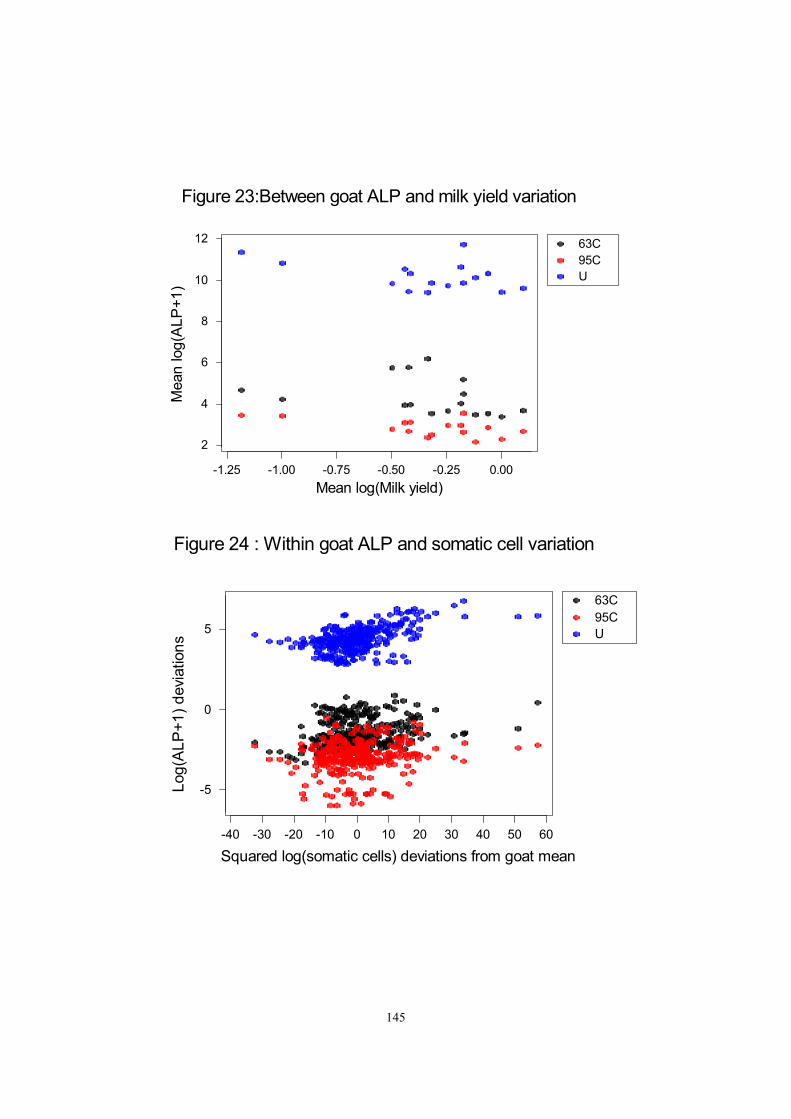
145
63C 95C U
-1.25 -1.00 -0.75 -0.50 -0.25 0.00
2
4
6
8
10
12
Mean log(Milk yield)
Mea
n lo
g(A
LP+1
)Figure 23:Between goat ALP and milk yield variation
63C 95C U
6050403020100-10-20-30-40
5
0
-5
Squared log(somatic cells) deviations from goat mean
Log(
ALP
+1) d
evia
tions
Figure 24 : Within goat ALP and somatic cell variation
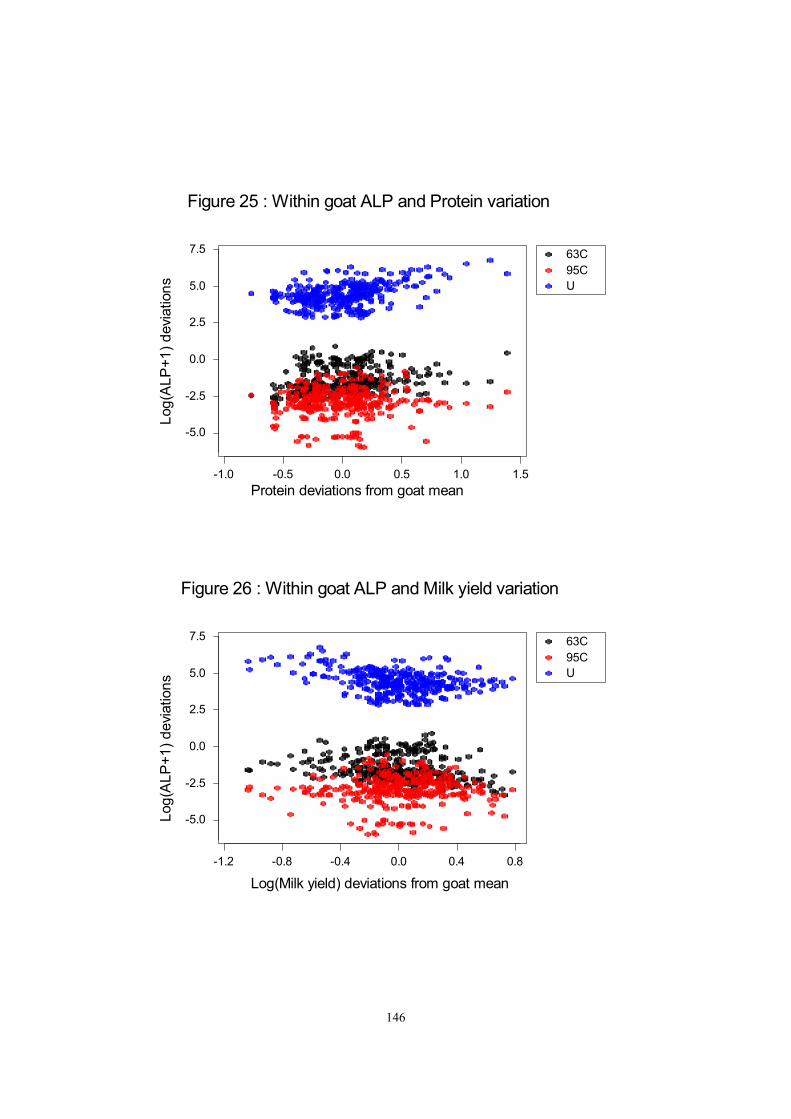
146
63C 95C U
-1.0 -0.5 0.0 0.5 1.0 1.5
-5.0
-2.5
0.0
2.5
5.0
7.5
Protein deviations from goat mean
Log(
ALP
+1) d
evia
tions
Figure 25 : Within goat ALP and Protein variation
63C 95C U
-1.2 -0.8 -0.4 0.0 0.4 0.8
-5.0
-2.5
0.0
2.5
5.0
7.5
Log(Milk yield) deviations from goat mean
Log(
ALP
+1) d
evia
tions
Figure 26 : Within goat ALP and Milk yield variation
147
CONCLUSIONS Both ALP and somatic cell concentrations from untreated samples were higher in the afternoon than in the morning. However, milk yield was significantly lower in the afternoon than the morning. When ALP was expressed as a total rather than a concentration, total ALP was higher in the morning than the afternoon. Total somatic cell counts were on average higher in the afternoon than the morning but this was not as consistent. The most effective single explanatory variable for logged ALP concentration was the square of the logged somatic cell count. There were two reasons for this. Firstly, within both morning and afternoon datasets there was a relationship between ALP and somatic cell concentrations. Secondly, since both somatic cell count and ALP concentrations were higher in the afternoon than the morning, regressing ALP as a function of somatic cell count was able to model variation due to the time of day effect on ALP without explicitly including a term for time of day. Thus it was not necessary to include a separate intercept or slope for time of day in the model. There was an indication that the very highest ALP concentrations occurred when milk yield was very low although this was not clear at the between-animal level. The only statistically significant and consistent relationship with ALP found at both levels was for somatic cell count. It was evident that inclusion of somatic cell count in modelling was very important and that alternative models including functions of milk yield, for example, were inferior. Heat treatment at both 63oC and 95oC significantly reduced ALP concentration compared to no heat treatment. On average, the higher heat treatment further reduced ALP concentration considerably more than the lower heat treatment although for 10% of samples the converse was the case. Four goats had very high ALP concentrations after heat treatment at 63oC. When modelling the heat treatment data, squared log somatic cell count with a separate intercept and slope for each treatment group appeared to offer the best fit to the ALP data from the heat treatment comparison component of the study. Ian Nevison BioSS Jean Banks Donald Muir Hannah Research Institute
148
Objective No. Objective Description
02 Comparison of effectiveness of bioluminescence, fluorescence and spectrophotometric methods in determining the efficiency of pasteurisation of goat, sheep and cow milk
INTRODUCTION Methods for testing residual ALP in pasteurised milk All raw milk contains alkaline phosphatase although the amounts vary between individual species of animal, and individual animals within each species. In the 1930's it was shown that on heat treatment of milk at between 65-75°C so that at least 96% of the original alkaline phosphatase present in milk was destroyed resulted in complete destruction of B. tuberculosis. (Kay and Graeme 1930). In a complementary study at the same time Kay and Neave found that over all ranges of temperature and time Mycobacterium tuberculosis was destroyed more quickly than phosphatase. They concluded that if the temperature time combination was sufficient to destroy all of the phosphatase originally present in milk, then all common pathogenic microorganisms that may have been present would also be destroyed. These findings subsequently formed the basis of tests to determine whether or not milk had been properly pasteurised. All tests are based on the premise that in alkaline conditions alkaline phosphatase is able to hydrolyse various phosphate esters. They concluded that if the temperature time combination was sufficient to destroy all of the phosphatase originally present in milk, then all common pathogenic microorganisms that may have been present would also be destroyed. These findings subsequently formed the basis of tests to determine whether or not milk had been properly pasteurised. All tests are based on the premise that in alkaline conditions, alkaline phosphatase is able to hydrolyse various phosphate esters. In the UK, the now obsolete Milk Special Designation Regulations required that pasteurised milk should satisfy a test for residual phosphatase. The test specified was the Aschaffenberg and Mullen test, under which milk is satisfactorily pasteurised if it produces no more than 10ug of p-nitrophenol during a two hour incubation period. These regulations were superseded by the EC Official method (Commission Decision 91/180/EEC). Pasteurised milk is still required to satisfy a phosphatase test but this is based on the Sanders and Sager method (1946). Milk that is satisfactorily pasteurised should liberate no more than 4 µg phenol during a one hour incubation period. This test is not more sensitive than the Aschaffenburg and Mullen test and the limiting values in each test represent equivalent phosphatase activities since incubation times during testing differ between methods (Bruce, 2001). Both methods are set to the same cut off point which is equivalent to a 0.1% contamination with raw milk. A number of variants of the test are used based on the fact that alkaline phosphatase will liberate phenol from disodium phenyl phosphate, p-nitrophenol from p-nitrophenyl
149
phosphate or phenolphthalein from phenolphthalein monophosphate, provided pH and temperature conditions are correct. The amount of phenol, p-nitrophenol or phenolphthalein released from the substrate is proportional to the activity of any phosphatase remaining in the heat treated milk. Any phosphatase activity in milk is expressed in terms of µg phenol per ml of milk In 1990 the USA-based Advanced Instruments developed a new substrate for use in the detection of alkaline phosphatase activity in milk. The substrate was known as Fluorophos, a non fluorescent monoester of orthophosphoric acid and an aromatic compound. When acted upon by alkaline phosphatase, the phosphate radical was cleaved from the Fluorophos molecule to produce a highly fluorescent molecule called fluoroyellow. Since the reaction product was fluorescent it was possible to determine the phosphatase activity of a milk sample in three minutes rather than the two hours required for the Aschaffenburg and Mullen method. A method for the determination of the phosphatase activity of milk and milk based drinks using a fluorometric method has been published as a dual British and ISO Standard (1997). When the Fluorophos method was introduced it was claimed that it was possible to detect the presence of as little as 0.006% raw milk in pasteurized milk. The limit for the Fluorophos was set at 500mU per litre, this value corresponding to the phosphatase activity of pasteurized milk containing approximately 0.1% raw milk. In practice the majority of commercially produced samples with values of less than 50mU per litre. Therefore if routine testing reveals a sudden increase in phosphatase activity to levels above those normally found this should act as a trigger to investigate the cause. This is the case, even if the elevated levels are still well below the generally recognized maximum limit of 500mU per litre. The Charm Pas Lite system was also introduced in the 1990's. This system is produced by Charm Sciences and is distributed by Foss in the UK. In the Charm Paslite system the substrate for alkaline phosphatase is a phosphorylated luminescent molecule. Hydrolysis of the substrate by alkaline phosphatase releases the phosphate radical, which allows the luminescent moiety to emit light. The method is rapid, producing a result for a single sample in 4 minutes. The pass level currently used for the Charm PasLite system in liquid milk is 350mU of phosphatase activity per litre of product, which equates to 0.1% raw milk in pasteurised milk. Application of tests to milk of different species Recent reports in the literature highlight differences between species in the level of alkaline phosphatase in raw milk. The pool of ALP in goats milk has been shown to be approximately 20% of that in cows milk, while sheep milk contains 5-fold more alkaline phosphatase than cows milk (Assis et al., 2000).
150
The statutory maximum level of residual alkaline phosphatase in correctly pasteurised sheep and goat milk is currently the same as for cows milk (500Mu per litre of milk). Because of the variation in the initial pool of indigenous alkaline phosphatase in milk, this leads to different amounts of raw milk being allowed in the pasteurised milk product at the statutory pass level. Lactational study on goat milk Bulk goat milk samples were collected during early, mid and late lactation and were pasteurised using the HRI pilot plant pasteuriser. The pasteurised milk samples were then contaminated with raw milk at levels ranging from 0.01 to 0.1%. In preliminary experiments this level of contamination was found to be too low for experiments with goat milk and none of the phosphatase methods for validating effectiveness of pasteurisation produced failures. The level of contamination for goat milk was therefore raised to between 0.1 and 1.0% for the lactation study. Goat milk samples Morning milk from 14 individual goats was collected and bulked at intervals of one week for a four week period in early, mid and late lactation. The bulked milk was pasteurised at 73±1°C for 16s using an APV pilot plant pasteuriser. The pasteurised milk was then re-contaminated with raw goat milk at levels of 0.1, 0.2, 0.3, 0.4, 0.5, 0.6, 0.7, 0.8, 0.9, and 1.0%. Methodology Phosphatase levels in milk were measured using the Fluorophos, Charm, and Sanders and Sager methods. ] (F-Fluorophos, Fail > 500 mU/L; C-Charm, Fail > 350mU/L; Phenol-Sanders and Sager method, Fail > 4µg/ml Phenol) Results Results for the Fluorophos, Charm and Sanders and Sager methods for phosphatase on goat milk are shown in Tables 1 to 3. In early lactation milk, none of the test methods produced failures on contamination of pasteurised milk with raw milk at a level of 1% (Table 1, August samples). The ALP activity in raw milk was between 19010 and 20077 mU/L as measured by the Fluorophos method. Measurements on raw milk ALP activity with the Charm instrument were ten fold lower than those obtained with Fluorophos. However values for contaminated milk using both methods were comparable. Results from mid lactation studies are shown in Table 2. In mid lactation the higher base level of phosphatase in goat milk resulted in some positive results with the Fluorophos and the Sanders and Sager methods. The effectiveness of methods in detection of raw milk contamination was related to the initial level of phosphatase in the raw goat milk. The Sanderson and Sagers method produced failures on four occasions and the level of contamination at which failure was detected was related to the initial phosphatase level in the milk.

151
At an initial level of 46983 mU/L ALP in raw milk, neither Fluorophos or Charm produced failures at 1% contamination of pasteurised milk with raw milk. However the Sanders and Sager method produced a positive phosphatase result at 0.9% contamination. At the highest initial level of 82750mU/L ALP in raw milk the Fluorophos and the Sanders and Sager methods produced positive results at levels of 0.7% and 0.4% respectively. The Charm test did not give a positive result at 1% contamination of pasteurised milk with raw milk in any of the mid lactation samples. For late lactation samples results are shown in Table 3. A limited number of goats were available and the samples taken had a low initial level of phosphatase in raw milk. Contamination of pasteurised milk with raw milk was therefore not detected in any of the samples examined.

152
Bovine milk samples – seasonal stud Samples of bulk milk were taken from the HRI bulk tank at weekly intervals from August 2001 until January 2002. The milk was pasteurised at 73±1°C for 16s using an APV pilot plant pasteuriser. Pasteurised milk was contaminated with a sample of raw bulk milk at levels of 0.01, 0.02, 0.03, 0.04, 0.05, 0.06, 0.07, 0.08, 0.09, 0.1, 0.11, and 0.12%. Phosphatase levels in contaminated milks, pasteurised milk and raw milk were measured using Fluorophos, Charm and the Sanders and Sager method. Results to date include those from 22 Fluorophos tests, 18 Charm tests and 7 tests using the Sanders and Sager method. Results are shown in Tables 4-8. Levels of phosphatase in raw cow milk are approximately ten-fold higher than those seen in goat milk. 78% of pasteurised samples had ALP levels of less than 40mU/L while 43% had levels less than 30mU/L. Of the 22 samples tested with Fluorophos 27% gave a positive result at 0.1%. Of the 18 samples tested by the Charm method, 33% gave a positive result at 0.1% contamination. Using the method of Sanders and Sager 85% of the 7 samples produced a positive result at 0.1% contamination.
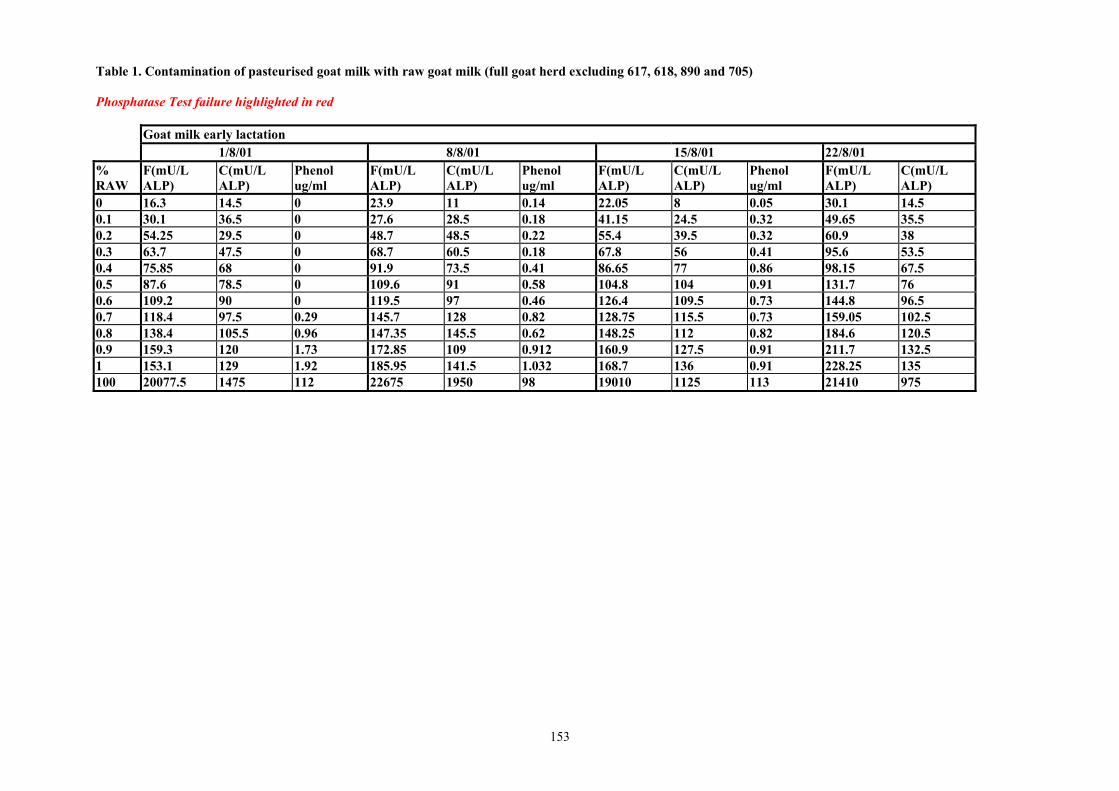
153
Table 1. Contamination of pasteurised goat milk with raw goat milk (full goat herd excluding 617, 618, 890 and 705) Phosphatase Test failure highlighted in red Goat milk early lactation 1/8/01 8/8/01 15/8/01 22/8/01 % RAW
F(mU/L ALP)
C(mU/L ALP)
Phenol ug/ml
F(mU/L ALP)
C(mU/L ALP)
Phenol ug/ml
F(mU/L ALP)
C(mU/L ALP)
Phenol ug/ml
F(mU/L ALP)
C(mU/L ALP)
0 16.3 14.5 0 23.9 11 0.14 22.05 8 0.05 30.1 14.5 0.1 30.1 36.5 0 27.6 28.5 0.18 41.15 24.5 0.32 49.65 35.5 0.2 54.25 29.5 0 48.7 48.5 0.22 55.4 39.5 0.32 60.9 38 0.3 63.7 47.5 0 68.7 60.5 0.18 67.8 56 0.41 95.6 53.5 0.4 75.85 68 0 91.9 73.5 0.41 86.65 77 0.86 98.15 67.5 0.5 87.6 78.5 0 109.6 91 0.58 104.8 104 0.91 131.7 76 0.6 109.2 90 0 119.5 97 0.46 126.4 109.5 0.73 144.8 96.5 0.7 118.4 97.5 0.29 145.7 128 0.82 128.75 115.5 0.73 159.05 102.5 0.8 138.4 105.5 0.96 147.35 145.5 0.62 148.25 112 0.82 184.6 120.5 0.9 159.3 120 1.73 172.85 109 0.912 160.9 127.5 0.91 211.7 132.5 1 153.1 129 1.92 185.95 141.5 1.032 168.7 136 0.91 228.25 135 100 20077.5 1475 112 22675 1950 98 19010 1125 113 21410 975

154
Table 2. Contamination of pasteurised goat milk with raw goat milk. (Full goat herd excluding 617, 618, 890 and 705) Phosphatase Test failure highlighted in red Goat milk mid lactation 17/10/01 24/10/01 31/10/01 7/11/01 % RAW
F(mU/L ALP)
C(mU/L ALP)
Phenol ug/ml
F(mU/L ALP)
C(mU/L ALP)
Phenol ug/ml
F(mU/L ALP)
C(mU/L ALP)
Phenol ug/ml
F(mU/L ALP)
C(mU/L ALP)
Phenol ug/ml
0 38.85 6.5 2.5 44.6 6.5 2.04 28.5 7 0.36 133.75 18.5 2.26 0.1 88.95 23.5 2.66 98.15 34.5 2.66 91.7 30.5 1.37 145.7 39 3.14 0.2 133.3 64 2.5 168.25 58 2.83 151.5 46 2.3 188 58 4.03 0.3 170.75 66.5 2.5 231 100 3.19 201.35 81 2.35 295.35 67.5 3.73 0.4 203.85 80.5 2.66 300.4 112.5 4.44 239.95 90.5 3.46 337.4 97.5 4.09 0.5 253.95 110 2.83 345 155.5 4.61 301.8 118 3.91 371.45 113 4.7 0.6 301.8 134.5 3.19 407.95 208 4.97 424.8 199 3.6 430.5 119.5 5.16 0.7 353.95 136 3.19 542.2 240 6.04 405.25 185.5 4.49 539.25 179.5 6.31 0.8 395.15 167 3.74 654.85 347 6.93 465.9 184.5 4.54 456.75 161.5 6.17 0.9 454.65 203 4.27 607 308 7.2 525.45 212.5 5.59 521.1 197.5 6.72 1 471.65 205 4.8 463.85 292.5 7.29 573.5 313.5 6.22 629.55 225.5 7.37 100 46982.5 3825 197 82780 6525 310 68242.5 2725 247 51315 2175 314
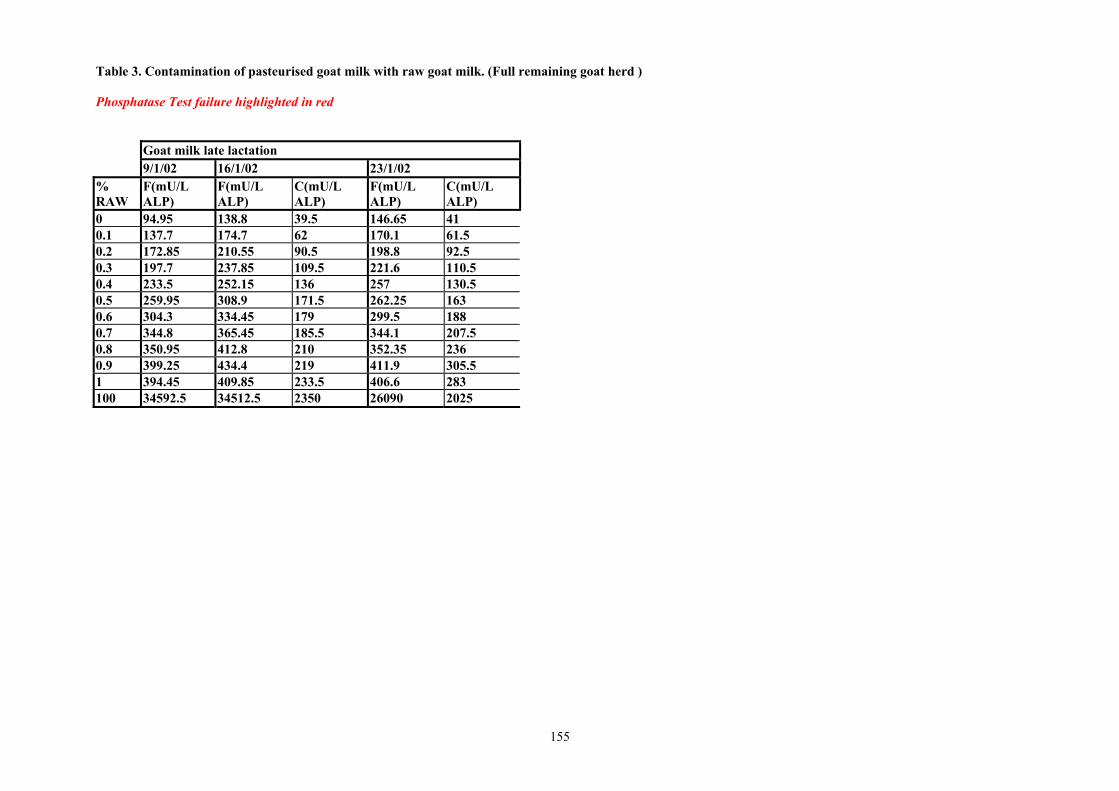
155
Table 3. Contamination of pasteurised goat milk with raw goat milk. (Full remaining goat herd ) Phosphatase Test failure highlighted in red Goat milk late lactation 9/1/02 16/1/02 23/1/02 % RAW
F(mU/L ALP)
F(mU/L ALP)
C(mU/L ALP)
F(mU/L ALP)
C(mU/L ALP)
0 94.95 138.8 39.5 146.65 41 0.1 137.7 174.7 62 170.1 61.5 0.2 172.85 210.55 90.5 198.8 92.5 0.3 197.7 237.85 109.5 221.6 110.5 0.4 233.5 252.15 136 257 130.5 0.5 259.95 308.9 171.5 262.25 163 0.6 304.3 334.45 179 299.5 188 0.7 344.8 365.45 185.5 344.1 207.5 0.8 350.95 412.8 210 352.35 236 0.9 399.25 434.4 219 411.9 305.5 1 394.45 409.85 233.5 406.6 283 100 34592.5 34512.5 2350 26090 2025

156
Table 4. Contamination of pasteurised bulk cow milk with raw cow milk (HRI bulk tank-August) Phosphatase Test failure highlighted in red Cows milk 2/8/01 9/8/01 16/8/01 % RAW F(mU/L ALP) C(mU/L ALP) Phenol ug/ml F(mU/L ALP) C(mU/L ALP) Phenol ug/ml F(mU/L ALP) C(mU/L ALP) Phenol ug/ml 0 28.3 39.5 0 40.45 28.5 1.99 155.85 115.5 0 0.01 63.2 69 0 75.6 59 2.67 87.1 55 0 0.02 92.9 99 0.91 114.5 108.5 3.12 132.85 63 0 0.03 120.45 137.5 1.36 152.2 127 3.98 178.8 102.5 0.22 0.04 153.1 170.5 2.44 182.5 150.5 4.26 287.05 147 0 0.05 183.4 186.5 2.81 212.15 189 4.57 251.2 136 0 0.06 196.05 210 2.99 249.6 198 4.57 154.25 113 0.18 0.07 228.95 262.5 3.17 300.85 222.5 5.03 343.6 188 1.8 0.08 284.1 296.5 3.44 322.25 238 5.34 374.2 209 2.3 0.09 313.3 324 3.89 322.25 284.5 5.39 409.35 230.5 2.4 0.1 350.5 334.5 4.26 402.45 292.5 5.21 459 291.5 3.07 0.11 436.3 513 5.07 428.45 356.5 5.93 510 271.5 2.81 0.12 485.7 427 5.43 478.8 379 6.25 553 334.5 5.98 100 574175 28000 1242 409350 12500 2465 550950 19750 1592

157
Table 5. Contamination of pasteurised bulk cow milk with raw cow milk (HRI bulk tank -August-September) Phosphatase Test failure highlighted in red 23/8/01 30/8/01 5/9/01 12/9/01 19/9/01 % RAW F(mU/L ALP) C(mU/L ALP) F(mU/L ALP) C(mU/L ALP) F(mU/L ALP) C(mU/L ALP) F(mU/L ALP) C(mU/L ALP) F(mU/L ALP) C(mU/L ALP) 0 20.7 12.5 21.4 8.5 28.3 20 32.2 26 30.1 30 0.01 61.1 38.5 65.05 40 77.9 50.5 72.85 62 81.15 66.5 0.02 109.85 70 115.6 52.5 134.9 85 123.65 98.5 129.2 91.5 0.03 149.15 104 150.55 92.5 181.8 124 162.3 183 178.6 143.5 0.04 203.45 126.5 188.25 103.5 233.55 162.5 205.95 159 211.7 162 0.05 258.55 157 246.2 153.5 296.75 195 263.4 238.5 259.75 200 0.06 301.55 204.5 283.2 203 354.4 231 309.4 280 312.15 246 0.07 321.8 217 309.85 164.5 381.05 230 340.2 287.5 340.6 246.5 0.08 372.15 258.5 354.45 241 440.4 273 374.45 380 381.8 331 0.09 405.7 269.5 405.5 265 489.35 294.5 433.95 351.5 433.7 328.5 0.1 455.3 317 442 277.5 528.65 369.5 476.25 400 480.85 410.5 0.11 532.6 389 482.7 330 578.3 396.5 521.05 454 520.85 490 0.12 550.5 404.5 509.35 303 630.25 426.5 558.55 489 588.2 458.5 100 612550 26250 544650 10500 518650 24250 454400 15250 590150 19500

158
Table 6. Contamination of pasteurised bulk cow milk with raw cow milk (HRI bulk tank- September to October) Phosphatase Test failure highlighted in red
26/9/2001 3/10/01 10/10/01 18/10/01 25/10/01 % RAW F(mU/L ALP) C(mU/L ALP) F(mU/L ALP) F(mU/L ALP) F(mU/L ALP) C(mU/L ALP) Phenol ug/ml F(mU/L ALP) C(mU/L ALP) Phenol ug/ml 0 59.3 45 33.3 30.1 31.3 15.5 0.72 43.2 19 0.89 0.01 136.1 69 90.3 74 103.4 47 0.89 82.05 38.5 0.41 0.02 169.9 98.5 122.7 123 145.5 78.5 0.43 129.2 68.5 1.2 0.03 214.9 148 159.1 172.2 191.5 101.5 1.61 179.5 85.5 1.63 0.04 276.5 185 196.3 214.9 246.85 118 1.78 220.7 126 3.7 0.05 299.95 190.5 234.2 246.4 310.3 186 2.57 271.7 134 2.98 0.06 328.45 258.5 300.6 282 385.9 195 3.55 306.4 167.5 3.55 0.07 354 240 349.4 335.6 411.4 220 3.91 362.9 223.5 3.19 0.08 470.7 316.5 360.2 388.7 438.75 302 4.8 396.25 239.5 4.54 0.09 505.4 257 405.7 415.1 514.4 309 4.61 460.6 235 4.08 0.1 482.2 308.5 487.05 458.3 567.3 352 4.97 499.9 315 5.86 0.11 562.4 331.5 508.65 505.4 539.25 340 5.78 497.65 306.5 5.9 0.12 618.3 458.5 546.35 538.1 673 307.5 6.05 590.5 361 6.1 100 641500 44300 561850 496600 755975 18250 2201 631950 16250 1706

159
Table 7. Contamination of pasteurised bulk cow milk with raw cow milk (HRI bulk tank- November) Phosphatase Test failure highlighted in red 1/11/01 8/11/01 14/11/01 21/11/01
% RAW F(mU/L ALP) C(mU/L ALP) Phenol ug/ml F(mU/L ALP) C(mU/L ALP) Phenol ug/ml F(mU/L ALP) C(mU/L ALP) F(mU/L ALP)0 28.7 9 0.31 25.05 7.5 0.26 25.5 26.5 26.2 0.01 77.9 41 0.98 72.4 30 0.48 73.1 85 80.9 0.02 123.65 52.5 1.68 135.6 51 0.74 111.25 138 126 0.03 167.1 93.5 2.5 151.45 73.5 1.15 167.3 203 163.7 0.04 204.8 108.5 1.78 191 101.5 2.2 195.8 237.5 204.6 0.05 285.25 151 3.19 227.55 124 1.68 278.35 323.5 232.15 0.06 322.25 166.5 3.86 278.6 145 2.98 274 415.5 301.3 0.07 339.3 181.5 4.18 299.05 169.5 3.19 314 419.5 334.4 0.08 385.7 230 4.8 326.4 190.5 3.29 382.7 511.5 421.3 0.09 435.1 243.5 4.8 385.95 187 3.65 450.5 522 436 0.1 492.3 285 5.16 415.6 187 4.01 484.5 554.5 460.6 0.11 514.9 303.5 5.42 476.5 203 6.05 550 605.5 461.3 0.12 571.85 354 6.74 488 268 6.22 511.4 651.5 563.4 100 456375 11500 1550 707475 12000 2801 621275 25500 521650
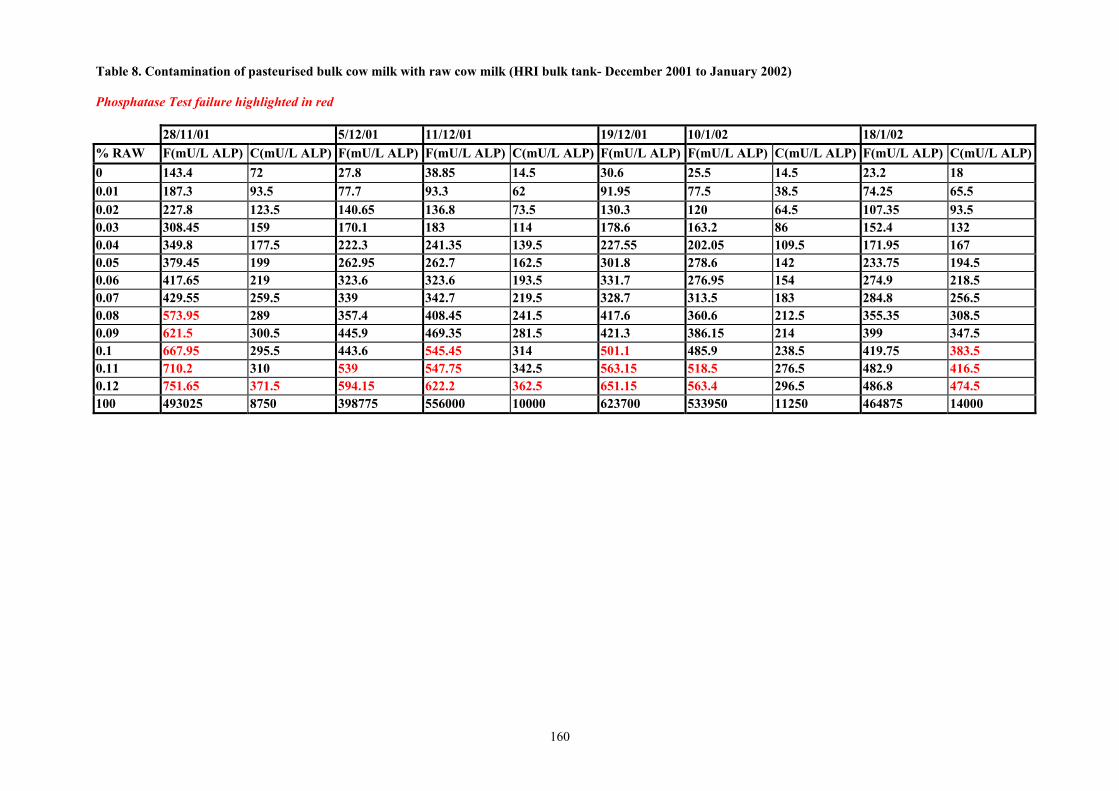
160
Table 8. Contamination of pasteurised bulk cow milk with raw cow milk (HRI bulk tank- December 2001 to January 2002) Phosphatase Test failure highlighted in red 28/11/01 5/12/01 11/12/01 19/12/01 10/1/02 18/1/02 % RAW F(mU/L ALP) C(mU/L ALP) F(mU/L ALP) F(mU/L ALP) C(mU/L ALP) F(mU/L ALP) F(mU/L ALP) C(mU/L ALP) F(mU/L ALP) C(mU/L ALP) 0 143.4 72 27.8 38.85 14.5 30.6 25.5 14.5 23.2 18 0.01 187.3 93.5 77.7 93.3 62 91.95 77.5 38.5 74.25 65.5 0.02 227.8 123.5 140.65 136.8 73.5 130.3 120 64.5 107.35 93.5 0.03 308.45 159 170.1 183 114 178.6 163.2 86 152.4 132 0.04 349.8 177.5 222.3 241.35 139.5 227.55 202.05 109.5 171.95 167 0.05 379.45 199 262.95 262.7 162.5 301.8 278.6 142 233.75 194.5 0.06 417.65 219 323.6 323.6 193.5 331.7 276.95 154 274.9 218.5 0.07 429.55 259.5 339 342.7 219.5 328.7 313.5 183 284.8 256.5 0.08 573.95 289 357.4 408.45 241.5 417.6 360.6 212.5 355.35 308.5 0.09 621.5 300.5 445.9 469.35 281.5 421.3 386.15 214 399 347.5 0.1 667.95 295.5 443.6 545.45 314 501.1 485.9 238.5 419.75 383.5 0.11 710.2 310 539 547.75 342.5 563.15 518.5 276.5 482.9 416.5 0.12 751.65 371.5 594.15 622.2 362.5 651.15 563.4 296.5 486.8 474.5 100 493025 8750 398775 556000 10000 623700 533950 11250 464875 14000

161
Objective No. Objective Description
03 Study of the origins and factors influencing the formation of heat stable alkaline phosphatases in goat milk
Preliminary studies on ALP activity in goat milk from 12 animals in late lactation milk indicated that almost 50% of animals produced ALP which was stable to pasteurisation by heat treatment. This heat stable ALP is thought to be microbial in origin. Formation of heat stable ALP in individual goats will be studied throughout lactation. In a selection of samples in which we identify heat stable ALP, attempts will be made to separate the heat stable enzyme from bovine ALP using non denaturing PAGE. The molecular weight of components of heat stable ALP will be determined.
Completion of the work described in this section satisfies objectives set in Milestones 03/01; 03/02; 03/03 and fulfil requirements for Deliverables 03/01; 03/02; 03/03. Milk samples Morning milk samples from individual goats were sampled each week from 6th August 2001 to the 21st January. ALP in raw milk was measured using the Fluorophos method. Raw milk was heat treated at 63˚C for 30 minutes or 95˚C for 2 minutes. The first treatment was used to establish if the goat ALP would survive pasteurisation, while the second treatment was to test for the presence of heat stable microbial phosphatase. The presence of heat stable ALP can result in false positives in phosphatase testing of bovine milk. Results Changes in heat stability throughout lactation are shown in Figs. 7a) to 7e). The graphs show the initial level of ALP in raw milk together with the residual ALP in the heat treated samples (Note these are on different scales). Substantial levels of heat stable microbial phosphatase were identified in only two samples whereas ALP stable to pasteurisation was identified in the majority of samples. Milk from goat 601 contained substantial levels of microbial heat stable ALP (i.e. in excess of 350 Mu/ml) in November and samples from goat 705 were high in August prior to death of the animal. Four of the goats produced milk with ALP stable to holder pasteurisation throughout lactation. This included goats 617, 618, 806 and 891. Goats 725 and 809 produced pasteurisation stable ALP in late lactation. In the remaining animals, pasteurisation stable ALP was observed on one or two occasions, and this was generally in late lactation. Conclusions ALP stable to pasteurisation was found in goats milk from individual animals throughout lactation. 15 of the animals produced pasteurisation stable ALP on one or two occasions during the lactation. Factors influencing the presence of heat stable ALP are considered in the report on the statistical analysis of the lactational data (Objective 01). High somatic cell counts were associated with a high incidence of heat stable ALP.
Completion of the work described in this section satisfied objectives set in Milestones 03/01; 03/02; 03/03 and fulfilled requirements for Deliverables 03/01; 03/02; 03/03.
Jean Banks Donald Muir

162
Fig 7a) Heat Treatment Goat 601
0.0
100.0
200.0
300.0
400.0
500.0
600.0
700.0
800.0
900.0
1000.0
Mon
day
6/8/
01
Mon
day
13/8
/01
Mon
day
20/8
/01
Mon
day
27/8
/01
Mon
day
3/9/
01
Mon
day
10/9
/01
Mon
day
17/9
/01
Mon
day
24/9
/01
Mon
day
1/10
/01
Mon
day
8/10
/01
Mon
day
15/1
0/01
Mon
day
22/1
0/01
Mon
day
29/1
0/01
Mon
day
5/11
/01
Mon
day
12/1
1/01
Mon
day
19/1
1/01
Mon
day
26/1
1/01
Mon
day
3/12
/01
Mon
day
10/1
2/01
Mon
day
17/1
2/01
Mon
day
07/0
1/02
Mon
day
14/0
1/02
Mon
day
21/0
1/02
Mon
day
28/0
1/02
Mon
day
04/0
1/02
Date
mU
/L A
LP (H
eat T
reat
men
t)
0
100000
200000
300000
400000
500000
600000
700000
mU
/L A
LP (R
aw)
Raw95o/2min63o/30min
Fig 7b) Heat Treatment Goat 610
0.0
10.0
20.0
30.0
40.0
50.0
60.0
70.0
80.0
90.0
100.0
Mon
day
6/8/
01
Mon
day
13/8
/01
Mon
day
20/8
/01
Mon
day
27/8
/01
Mon
day
3/9/
01
Mon
day
10/9
/01
Mon
day
17/9
/01
Mon
day
24/9
/01
Mon
day
1/10
/01
Mon
day
8/10
/01
Mon
day
15/1
0/01
Mon
day
22/1
0/01
Mon
day
29/1
0/01
Mon
day
5/11
/01
Mon
day
12/1
1/01
Mon
day
19/1
1/01
Mon
day
26/1
1/01
Mon
day
3/12
/01
Mon
day
10/1
2/01
Mon
day
17/1
2/01
Mon
day
07/0
1/02
Mon
day
14/0
1/02
Mon
day
21/0
1/02
Mon
day
28/0
1/02
Mon
day
04/0
1/02
Date
mU
/L A
LP (H
eat T
reat
men
t)
0
10000
20000
30000
40000
50000
60000
70000
80000
90000
mU
/L A
LP (R
aw)
Raw95o/2min63o/30min
Fig 7c) Heat Treatment Goat 617
0.0
200.0
400.0
600.0
800.0
1000.0
1200.0
Mon
day
6/8/
01
Mon
day
13/8
/01
Mon
day
20/8
/01
Mon
day
27/8
/01
Mon
day
3/9/
01
Mon
day
10/9
/01
Mon
day
17/9
/01
Mon
day
24/9
/01
Mon
day
1/10
/01
Mon
day
8/10
/01
Mon
day
15/1
0/01
Mon
day
22/1
0/01
Mon
day
29/1
0/01
Mon
day
5/11
/01
Mon
day
12/1
1/01
Mon
day
19/1
1/01
Mon
day
26/1
1/01
Mon
day
3/12
/01
Mon
day
10/1
2/01
Mon
day
17/1
2/01
Mon
day
07/0
1/02
Mon
day
14/0
1/02
Mon
day
21/0
1/02
Mon
day
28/0
1/02
Mon
day
04/0
1/02
Date
mU
/L A
LP (H
eat T
reat
men
t)
0
5000
10000
15000
20000
25000
30000
35000
40000
45000
mU
/L A
LP (R
aw)
Raw95o/2min63o/30min
Fig 7d) Heat Treatment Goat 618
0.0
100.0
200.0
300.0
400.0
500.0
600.0
700.0
Mon
day
6/8/
01
Mon
day
13/8
/01
Mon
day
20/8
/01
Mon
day
27/8
/01
Mon
day
3/9/
01
Mon
day
10/9
/01
Mon
day
17/9
/01
Mon
day
24/9
/01
Mon
day
1/10
/01
Mon
day
8/10
/01
Mon
day
15/1
0/01
Mon
day
22/1
0/01
Mon
day
29/1
0/01
Mon
day
5/11
/01
Mon
day
12/1
1/01
Mon
day
19/1
1/01
Mon
day
26/1
1/01
Mon
day
3/12
/01
Mon
day
10/1
2/01
Mon
day
17/1
2/01
Mon
day
07/0
1/02
Mon
day
14/0
1/02
Mon
day
21/0
1/02
Mon
day
28/0
1/02
Mon
day
04/0
1/02
Date
mU
/L A
LP (H
eat T
reat
men
t)
0
20000
40000
60000
80000
100000
120000
140000
160000
mU
/L A
LP (R
aw)
Raw95o/2min63o/30min

163
Fig 7e) Heat Treatment Goat 622
0.0
50.0
100.0
150.0
200.0
250.0
Mon
day
6/8/
01
Mon
day
13/8
/01
Mon
day
20/8
/01
Mon
day
27/8
/01
Mon
day
3/9/
01
Mon
day
10/9
/01
Mon
day
17/9
/01
Mon
day
24/9
/01
Mon
day
1/10
/01
Mon
day
8/10
/01
Mon
day
15/1
0/01
Mon
day
22/1
0/01
Mon
day
29/1
0/01
Mon
day
5/11
/01
Mon
day
12/1
1/01
Mon
day
19/1
1/01
Mon
day
26/1
1/01
Mon
day
3/12
/01
Mon
day
10/1
2/01
Mon
day
17/1
2/01
Mon
day
07/0
1/02
Mon
day
14/0
1/02
Mon
day
21/0
1/02
Mon
day
28/0
1/02
Mon
day
04/0
1/02
Date
mU
/L A
LP (H
eat T
reat
men
t)
0
20000
40000
60000
80000
100000
120000
140000
160000
180000
mU
/L A
LP (R
aw)
Raw95o/2min63o/30min
164
Objective No.
Objective Description
04 Survey of residual ALP activity in commercial pasteurised and unpasteurised goat and sheep milk on sale in Scotland
05 Survey of the microbiological quality of pasteurised and unpasteurised goat milk on sale in Scotland
Objective 04 Survey of residual ALP activity in commercial pasteurised and unpasteurised goat and sheep milk on sale in Scotland Samples of commercially produced pasteurised goat milk will be collected from retail outlets in the North (Aberdeen), East (Edinburgh), South West (Ayrshire) and Central (Glasgow) at intervals of 6 weeks between February and June. Residual ALP activity in milk will be measured by the Flourophos and Charm methods. Objective 05 Survey of the microbiological quality of pasteurised and unpasteurised goat milk on sale in Scotland The microbiological quality of commercially produced goat milks [which have been collected from retail outlets for estimation of residual ALP (Objective 04) activity] will be assessed. Total bacterial count, total psychrotroph count, Enterobacteriaceae and Listeria counts will be included. Completion of the work outlined above would satisfy requirements for Milestones 04/01; 05/01 and Deliverables 04/01; 05/01. Introduction A substantial market now exists for goat milk in the UK, and a small number of large-scale producers are supplying the main retail outlets. Twenty nine goat milk samples were purchased from retail outlets in Ayr. Residual ALP activity in milk was measured by the Flourophos and Charm methods. The microbiological quality of the goat milks was assessed. Total bacterial count, total psychrotroph count, Enterobacteriaceae and Listeria counts were assessed. Samples Twenty nine samples of goat milk were collected from retail outlets in Ayrshire. Samples included whole milk, and semi skim milk. Samples were obtained from three supermarkets which included Tesco, Asda, and Safeway. Details of date of purchase and sell by date for each sample are shown in Table 1. Samples purchased from Safeway were manufactured by the St Helens Farm company. Samples from Tesco and Asda were produced by the Delamere Dairy Company. All samples were placed in insulated cool boxes immediately after purchase, and temperatures on arrival at the laboratory were monitored. Samples were stored at 2°C prior to analysis. Although it had been intended to sample more extensively throughout Scotland it was clear that samples obtained locally were produced by the same manufacturer as those on sale in other parts of the country.
165
Results Residual phosphatase levels for all milk samples as measured by Fluorophos and Charm were within acceptable ranges for pasteurised milk. Results of the microbiological analysis are shown in Table 2. Total colony counts in goats drinking milk were within the regulations for heat treated drinking milk for the majority of samples, but two samples had a total count which was high. One sample was a semi skimmed goat milk, obtained from Tesco on the 11th March 2002, which had a total count of 1.34 x 10⁶ cfu/ml. The sell-by date was the 15th March 2002. The other sample was a full fat goats milk purchased in Asda on the 25th March which had a total count in excess of 1 x 10⁶ cfu/ml. The sell-by date was the 29th March. Both samples were from the Delamere Dairy Company. In both samples the high total count seemed to be associated with high psychrotrophic counts and Enterobacteriaceae were isolated from the milks. Listeria was absent from all samples. Conclusions Two of the 29 goat milk samples studied were found to have microbiological counts which are not acceptable for pasteurised milk. Residual phosphatase in milk samples suggested that the milk had been effectively pasturised. Completion of this work fulfils requirements for Milestones 04/01; 05/01 and Deliverables 04/01; 05/01. Jean Banks Donald Muir

166
Table 1. Goat milk retail samples Date Store Goat/Cow(PF) Milk Type Use by Date Temp (°C) 11/3/02 Safeways Goat Whole 16/3/02 -
Goat Semi Sk 15/3/02 - Tesco Goat Whole 17/3/02 - Goat Semi Sk 15/3/02 -
18/3/02 Safeways Goat Whole 22/3/02 - Goat Whole 23/3/02 - Goat Semi Sk 21/3/02 - Asda Goat Whole 25/3/02 - Tesco Goat Whole 25/3/02 - Goat Semi Sk 21/3/02 -
25/3/02 Safeways Goat Whole 29/3/02 6 Goat Semi Sk 26/3/02 6 Goat Semi Sk 27/3/02 5 Asda Goat Whole 29/3/02 8 Tesco Goat Whole 31/3/02 6 Goat Semi Sk 31/3/02 8
8/4/02 Safeways Goat Whole 13/4/02 7 Goat Semi Sk 12/4/02 6.5 Asda Goat Whole 12/4/02 7 Tesco Goat Whole 13/4/02 6.5 Goat Semi Sk 13/4/02 7
15/4/02 Asda Goat Whole 20/4/02 11 Tesco Goat Whole 22/4/02 9 Goat Semi Sk 22/4/02 9
22/4/02 Safeways Goat Whole 29/4/02 - Goat Semi Sk 29/4/02 - Asda Goat Whole 28/4/02 - Tesco Goat Whole 28/4/02 - Goat Semi Sk 28/4/02 -

167
Table 2a) 11/3/02 Total Colony Presumptive Psychrotrophic Listeria Listeria SAC no. Count cfu/ml Enterobacteriaceae colony count monocytogenes monocytogenes (30oC) cfu/ml cfu/ml @6.5oC in 25g cfu/ml
Asda Whole Goats Safeways Whole Goats GM02/4 95 <1 10 Absent <20
Semi Skimmed Goats GM02/2 155 <1 10 Absent <20
Tesco Whole Goats GM02/1 3,050 Estimate 3 4,300 Absent <20 Semi-Skimmed Goats GM02/3 1,340,000 21 2500000 Absent <21
Table 2b) 18/3/02 Total Colony Presumptive Psychrotrophic Listeria SAC no. Count cfu/ml Enterobacteriaceae colony count monocytogenes (30oC) cfu/ml cfu/ml @6.5oC in 25g
Asda Whole Goats GM02/10 460 <1 1,015 Absent Safeways Whole Goats GM02/11 1,565 <1 <10 Absent
GM02/12 165 <1 <10 Absent Semi Skimmed Goats GM02/13 135 <1 <10 Absent
Tesco Whole Goats GM02/8 565 <1 665 Absent Semi-Skimmed Goats GM02/9 3,500 213 790 Absent

168
Table 2c) 25/3/02
Total Colony Presumptive Psychrotrophic Listeria Listeria SAC no. Count cfu/ml Enterobacteriaceae colony count monocytogenes monocytogenes (30oC) cfu/ml cfu/ml @6.5oC in 25g cfu/ml
Asda Whole Goats GM02/22 Estimate >1,000,000
310 Estimate>1000,000
Absent Absent
Safeways Whole Goats GM02/21 105 <1 <10 Absent Absent Semi Skimmed Goats GM02/19 300 Estimate 2 10 Absent Absent GM02/20 180 <1 <10 Absent Absent
Tesco Whole Goats GM02/14 7,860 Estimate 3 905 Absent Absent Semi-Skimmed Goats GM02/15 1,600 8 580 Absent Absent
Table 2d) 15/4/02 Total Colony Presumptive Psychrotrophic Salmonella ssp. Listeria SAC no. Count cfu/ml Enterobacteriaceae colony count in 25g monocytogenes (30oC) cfu/ml cfu/ml @6.5oC in 25 g Whole Goats GM02/36 1,300 <1 1,000 Absent Absent
Asda Whole Goats Safeways
Semi Skimmed Goats Whole Goats GM02/34 545 <1 <10 Absent Absent
Tesco Semi-Skimmed Goats GM02/35 1,300 Estimate 1 410 Absent Absent

169
Table 2e) 22/4/02 Total Colony Presumptive Psychrotrophic Salmonella ssp. Listeria
SAC no. Count cfu/ml Enterobacteriaceae colony count in 25g monocytogenes (30oC) cfu/ml cfu/ml @6.5oC in 25 g Whole Goats GM02/44 735 <1 310 Absent Absent
Asda Whole Goats GM02/42 95 <1 <10 Absent Absent Safeways GM02/43 105 <1 <10 Absent Absent
Semi Skimmed Goats Whole Goats GM02/40 585 <1 <10 Absent Absent
Tesco Semi-Skimmed Goats GM02/41 765 <1 <10 Absent Absent
Related Documents