water Article Variabilities and Trends of Rainfall, Temperature, and River Flow in Sipi Sub-Catchment on the Slopes of Mt. Elgon, Uganda Justine Kilama Luwa 1, *, Jackson-Gilbert Mwanjalolo Majaliwa 2 , Yazidhi Bamutaze 2 , Isa Kabenge 3 , Petter Pilesjo 4 , George Oriangi 5 and Espoir Bagula Mukengere 6 Citation: Kilama Luwa, J.; Majaliwa, J.-G.M.; Bamutaze, Y.; Kabenge, I.; Pilesjo, P.; Oriangi, G.; Bagula Mukengere, E. Variabilities and Trends of Rainfall, Temperature, and River Flow in Sipi Sub-Catchment on the Slopes of Mt. Elgon, Uganda. Water 2021, 13, 1834. https:// doi.org/10.3390/w13131834 Academic Editor: Maria Mimikou Received: 11 May 2021 Accepted: 21 June 2021 Published: 30 June 2021 Publisher’s Note: MDPI stays neutral with regard to jurisdictional claims in published maps and institutional affil- iations. Copyright: © 2021 by the authors. Licensee MDPI, Basel, Switzerland. This article is an open access article distributed under the terms and conditions of the Creative Commons Attribution (CC BY) license (https:// creativecommons.org/licenses/by/ 4.0/). 1 Department of Biology, Faculty of Science, Gulu University, Awich Road, Gulu P.O. Box 166, Uganda 2 Department of Geography, Geoinformatics and Climatic Sciences, College of Agriculture and Environmental Sciences, Makerere University, Kampala P.O. Box 576, Uganda; [email protected] (J.-G.M.M.); [email protected] (Y.B.) 3 Department of Agriculture and Biosystems Engineering, College of Agriculture and Environmental Sciences, Makerere University, Kampala P.O. Box 576, Uganda; [email protected] 4 Centre for Geographic Information Systems, Centre for Middle Eastern Studies, Lund University, P.O. Box 117, 221 00 Lund, Sweden; [email protected] 5 Department of Geography, Faculty of Education and Humanities, Gulu University, Awich Road, Gulu P.O. Box 166, Uganda; [email protected] 6 Facultéd’ Agronomie et Environnement, Université Evangéliqueen Afrique, Bukavu B.P. 3323, Congo; [email protected] * Correspondence: [email protected] Abstract: The variabilities in rainfall and temperature in a catchment affect water availability and sustainability. This study assessed the variabilities in rainfall and temperature (1981–2015) and river flow (1998–2015) in the Sipi sub-catchment on annual and seasonal scales. Observed daily rainfall and temperature data for Buginyanya and Kapchorwa weather stations were obtained from the Uganda National Meteorological Authority (UNMA), while the daily river-flow data for Sipi were obtained from the Ministry of Water and Environment (MWE). The study used descriptive statistics, the Standardized Precipitation Index (SPI), Mann–Kendall trend analysis, and Sen’s slope estimator. Results indicate a high coefficient of variation (CV) (CV > 30) for August, September, October, and November (ASON) seasonal rainfall, while annual rainfall had a moderate coefficient of variation (20 < CV < 30). The trend analysis shows that ASON minimum and mean temperatures increased at α = 0.001 and α = 0.05 levels of significance respectively in both stations and over the entire catchment. Furthermore, annual and March, April, and May (MAM) river flows increased at an α = 0.05 level of significance. A total of 14 extremely wet and dry events occurred in the sub-catchment during the post-2000 period, as compared to five in the pre-2000. The significant increased trend of river flow could be attributed to the impacts of climate and land-use changes. Therefore, future studies may need to quantify the impacts of future climate and land-use changes on water resources in the sub-catchment. Keywords: annual and seasonal scales; variabilities; extremely wet and dry; water resources; Mt. Elgon; Uganda 1. Introduction Climate variability affects agricultural production, food and water security, and ecosys- tems’ health. Catchment scale knowledge of climate variability is vital for the sustainability of water resources and food production [1]. For decades, climate-variability and river-flow research has revolved around global [2], regional, and basin scales, with less emphasis on small catchments [3]. According to [4], research on climate variability and river flow should extend to small catchments to provide practical applications to multiple sectors. In the field of hydrology, such research can provide knowledge on hydrologic forecasting [4]. Moreover, agriculture extension officers can apply such knowledge in guiding farmers Water 2021, 13, 1834. https://doi.org/10.3390/w13131834 https://www.mdpi.com/journal/water

Welcome message from author
This document is posted to help you gain knowledge. Please leave a comment to let me know what you think about it! Share it to your friends and learn new things together.
Transcript

water
Article
Variabilities and Trends of Rainfall, Temperature, and River Flowin Sipi Sub-Catchment on the Slopes of Mt. Elgon, Uganda
Justine Kilama Luwa 1,*, Jackson-Gilbert Mwanjalolo Majaliwa 2, Yazidhi Bamutaze 2, Isa Kabenge 3,Petter Pilesjo 4, George Oriangi 5 and Espoir Bagula Mukengere 6
�����������������
Citation: Kilama Luwa, J.; Majaliwa,
J.-G.M.; Bamutaze, Y.; Kabenge, I.;
Pilesjo, P.; Oriangi, G.; Bagula
Mukengere, E. Variabilities and
Trends of Rainfall, Temperature, and
River Flow in Sipi Sub-Catchment on
the Slopes of Mt. Elgon, Uganda.
Water 2021, 13, 1834. https://
doi.org/10.3390/w13131834
Academic Editor: Maria Mimikou
Received: 11 May 2021
Accepted: 21 June 2021
Published: 30 June 2021
Publisher’s Note: MDPI stays neutral
with regard to jurisdictional claims in
published maps and institutional affil-
iations.
Copyright: © 2021 by the authors.
Licensee MDPI, Basel, Switzerland.
This article is an open access article
distributed under the terms and
conditions of the Creative Commons
Attribution (CC BY) license (https://
creativecommons.org/licenses/by/
4.0/).
1 Department of Biology, Faculty of Science, Gulu University, Awich Road, Gulu P.O. Box 166, Uganda2 Department of Geography, Geoinformatics and Climatic Sciences, College of Agriculture and Environmental
Sciences, Makerere University, Kampala P.O. Box 576, Uganda; [email protected] (J.-G.M.M.);[email protected] (Y.B.)
3 Department of Agriculture and Biosystems Engineering, College of Agriculture and Environmental Sciences,Makerere University, Kampala P.O. Box 576, Uganda; [email protected]
4 Centre for Geographic Information Systems, Centre for Middle Eastern Studies, Lund University,P.O. Box 117, 221 00 Lund, Sweden; [email protected]
5 Department of Geography, Faculty of Education and Humanities, Gulu University, Awich Road,Gulu P.O. Box 166, Uganda; [email protected]
6 Facultéd’ Agronomie et Environnement, Université Evangéliqueen Afrique, Bukavu B.P. 3323, Congo;[email protected]
* Correspondence: [email protected]
Abstract: The variabilities in rainfall and temperature in a catchment affect water availability andsustainability. This study assessed the variabilities in rainfall and temperature (1981–2015) and riverflow (1998–2015) in the Sipi sub-catchment on annual and seasonal scales. Observed daily rainfalland temperature data for Buginyanya and Kapchorwa weather stations were obtained from theUganda National Meteorological Authority (UNMA), while the daily river-flow data for Sipi wereobtained from the Ministry of Water and Environment (MWE). The study used descriptive statistics,the Standardized Precipitation Index (SPI), Mann–Kendall trend analysis, and Sen’s slope estimator.Results indicate a high coefficient of variation (CV) (CV > 30) for August, September, October, andNovember (ASON) seasonal rainfall, while annual rainfall had a moderate coefficient of variation(20 < CV < 30). The trend analysis shows that ASON minimum and mean temperatures increased atα = 0.001 and α = 0.05 levels of significance respectively in both stations and over the entire catchment.Furthermore, annual and March, April, and May (MAM) river flows increased at an α = 0.05 levelof significance. A total of 14 extremely wet and dry events occurred in the sub-catchment duringthe post-2000 period, as compared to five in the pre-2000. The significant increased trend of riverflow could be attributed to the impacts of climate and land-use changes. Therefore, future studiesmay need to quantify the impacts of future climate and land-use changes on water resources in thesub-catchment.
Keywords: annual and seasonal scales; variabilities; extremely wet and dry; water resources; Mt.Elgon; Uganda
1. Introduction
Climate variability affects agricultural production, food and water security, and ecosys-tems’ health. Catchment scale knowledge of climate variability is vital for the sustainabilityof water resources and food production [1]. For decades, climate-variability and river-flowresearch has revolved around global [2], regional, and basin scales, with less emphasison small catchments [3]. According to [4], research on climate variability and river flowshould extend to small catchments to provide practical applications to multiple sectors. Inthe field of hydrology, such research can provide knowledge on hydrologic forecasting [4].Moreover, agriculture extension officers can apply such knowledge in guiding farmers
Water 2021, 13, 1834. https://doi.org/10.3390/w13131834 https://www.mdpi.com/journal/water

Water 2021, 13, 1834 2 of 17
on when to prepare their land and when to plant which type of crops [1,5]. More still,environmentalists and other agencies can use this knowledge in early warning systems fordisaster risk reduction [6,7]. As argued by [1], investigation of catchments variability inrainfall and temperature is vital for determining the likelihood of occurrences of extremeprecipitation events to support adaptive management of water resources.
Many scholars have investigated the variations in rainfall and river flow in the hornof Africa in the last two decades [8–11]. To illustrate these, ref. [8] studied four selectedcatchments of River Nile; ref. [7] focused on the Tekeze River Basin in Ethiopia; ref. [9]studied the basin of Lake Tana in Ethiopia; ref. [10] conducted his study in the Iringaregion of Tanzania; and ref. [1] focused on the Tana River Basin in Kenya. All of theseauthors found significant variations in rainfall and river flows. On the other hand, ref. [11]employed trend analysis to inspect changes in both intra- and inter-annual variability ofrainfall and temperature in North–Central Ethiopia from 1901 to 2014. Annual rainfallwas found to have significantly declined in some stations while others had no significantdecline. The study also reported that annual mean temperature increased at statisticallysignificant levels. Similarly, ref. [12] analyzed the trends in extreme temperature and rainfallin major sesame producing areas in Western Tigray in Ethiopia and reported a significantdecrease in annual rainfall and number of heavy rainy days, while temperature showedno significant trend. Across Ghana, ref. [13] examined the spatiotemporal variations inrainfall and temperature and reported that Ghana’s climate had become progressivelydrier and prone to drought conditions over the last century. Furthermore, over East Africa,ref. [14] analyzed long-term trends in rainfall (1981–2016) and maximum and minimumtemperature (T-max and T-min) (1979–2010) on seasonal and annual scales. Results showedcontradicting statistically significant and non-significant decreasing and increasing trendsin rainfall and maximum temperature depending on the locations.
In Uganda, evidence on the variabilities in rainfall and temperature at different spa-tiotemporal scales is inconclusive and gives mixed results [15–17]. For example, the studyby [15] which covered the whole country reported insignificant variations in rainfall andtemperature between 1981 and 2008. In the study by [16], a significant decrease in seasonalrainfall in western and central regions of Uganda was reported during 1983–2012. Similarly,ref. [17] found significant decreased trends in the average annual rainfall, and March,April, and May (MAM); January, December, and February (JDF) seasons rainfall in Kasalisub-county in Western Uganda between 1987 and 2017 coupled with significant increasingtrends in average maximum, minimum, annual, and seasonal temperature. On the otherhand, refs. [18,19] reported significant increased trends in annual and MAM seasonalrainfall in the Mpologoma catchment in Eastern Uganda for the period 1948–2016 and inthe Albert-Victoria water catchment area in Uganda for the period 1943–1977, respectively.According to literature, variability in rainfall and temperature in different parts of Ugandaindicate variable results, thus underpinning the need to study the variability in rainfall andtemperature and how these may have impacted on river flow at micro catchment levels,particularly in the slopes of mount Elgon, which has suffered several climate disasters thathave claimed several lives and altered the general landscape over the last two decades.
The water-resources management in Uganda faces several problems, such as changesin rainfall patterns, prolonged droughts, increasing frequency of floods, increasing tem-peratures deterioration in water quality and quantity, and degradation of watersheds [20].According to [20], the drivers of lake levels fluctuation and reduced river flows are en-croachment on water catchments, increased water abstractions for domestic, industrial,infrastructure development, and production. Sipi sub-catchment on the slope of Mt. El-gon in Eastern Uganda is not an exception to the problems faced by other catchments inthe country. More so, the government has planned a water-supply investment project inthe sub-catchment. However, the proposed project is bound to reduce the flows in thetarget rivers, denying the ecosystems and social requirements downstream the opportunityfor the associated values [21]. The Sipi River is known for the spectacular Sipi falls andthe unique culturally blended recreational activities from the local communities. These
Water 2021, 13, 1834 3 of 17
activities attract between 10 and 20% of all tourists visiting Uganda every year [22]. Thegovernment collects revenue from these tourists and some of the revenue is used to supportlocal communities’ livelihoods. The Sipi sub-catchment also lies within one of the mostagriculturally productive rural regions of Uganda [23]. Agriculture employs 69% of theclose to 40 million Ugandans and contributes about 23% to annual Gross Domestic Product(GDP) [24]. Despite its importance, the sector is predominantly rain-fed and gets chal-lenged by the variability in rainfall. Understanding the variabilities and trends in rainfall,temperature, and river flows is vital for the planning and management of subsistencecropping systems and for the sustainability of water resources and livelihoods in Uganda.
The Sipi sub-catchment presents a diverse landscape of variable topography, discon-tinuous land cover types, and seasonally distinct rainfall patterns, all of which influencethe distribution of rainfall at fine spatial and temporal scales [25]. However, previousstudies [15–17] have not focused on fine-scale investigation of variabilities in rainfall,temperature, and river flow in the Sipi sub-catchment. It is therefore highly possibilitythat policy and management decisions in the sub-catchment have relied upon country-or regional-scale variabilities and trends analysis that are often of coarse resolution andare not able to capture important variabilities at a finer scale, where management actionsoperate [25]. This study aimed to investigate such fine-scale variabilities and trends inclimate and river flow. Therefore, the specific objective of this study was to determine thevariabilities in rain fall, temperature, and river flow in the Sipi sub-catchment, on annualand seasonal scales, for adaptive management of the water resources and the sustainabilityof subsistence farmers’ livelihood in the sub-catchment.
2. Materials and Methods
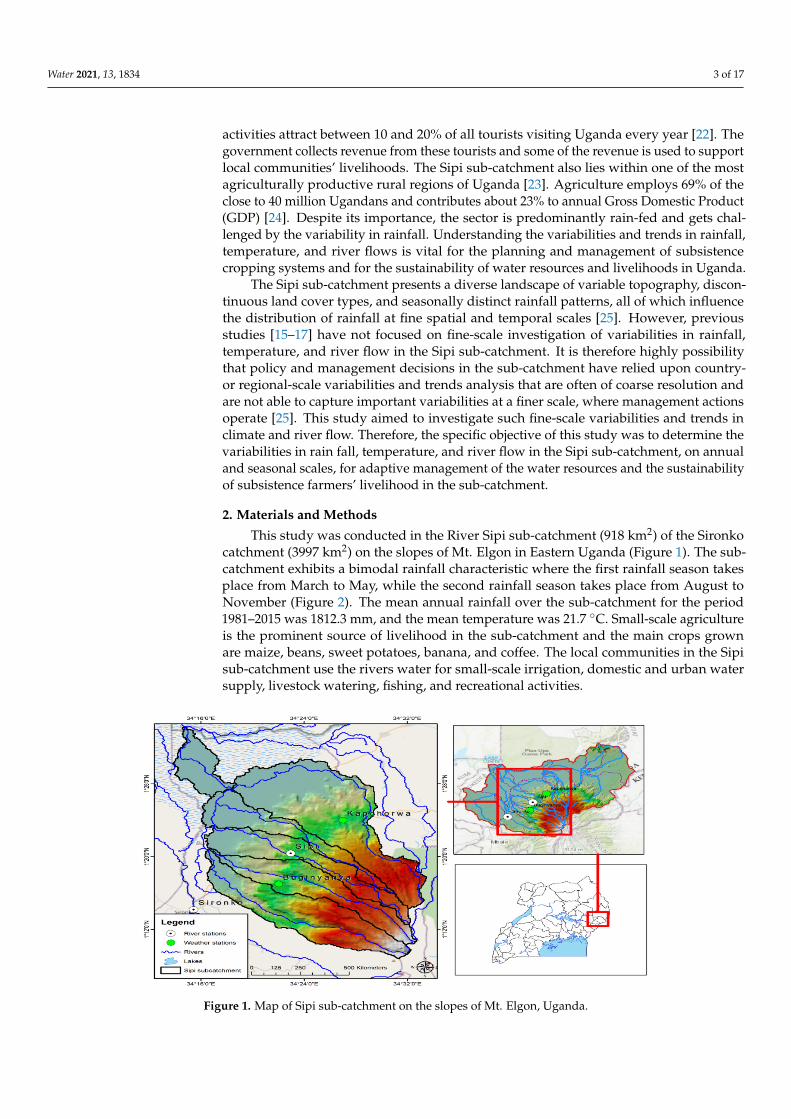
This study was conducted in the River Sipi sub-catchment (918 km2) of the Sironkocatchment (3997 km2) on the slopes of Mt. Elgon in Eastern Uganda (Figure 1). The sub-catchment exhibits a bimodal rainfall characteristic where the first rainfall season takesplace from March to May, while the second rainfall season takes place from August toNovember (Figure 2). The mean annual rainfall over the sub-catchment for the period1981–2015 was 1812.3 mm, and the mean temperature was 21.7 ◦C. Small-scale agricultureis the prominent source of livelihood in the sub-catchment and the main crops grownare maize, beans, sweet potatoes, banana, and coffee. The local communities in the Sipisub-catchment use the rivers water for small-scale irrigation, domestic and urban watersupply, livestock watering, fishing, and recreational activities.
Water 2021, 13, 1834 4 of 18
Figure 1. Map of Sipi sub-catchment on the slopes of Mt. Elgon, Uganda.
Figure 2. Monthly mean rainfall in Buginyanya and Kapchorwa weather stations (1981–2015).
2.1. Data and Methods Observed daily rainfall and temperature data (1981–2015) for Buginyanya and Kap-
chorwa weather stations were obtained from the Uganda National Meteorological Au-thority (UNMA), while daily river flow data for River Sipi (1998–2015) were obtained from the Ministry of Water and Environment (MWE) (Table 1).
Table 1. The altitudes, longitudes, and latitudes for Buginyanya and Kapchorwa weather stations and river Sipi gauge in the slopes of Mount Elgon.
Climate Data Altitude (m.a.s.l.) Longitude (Degrees)
Latitude (De-grees)
Buginyanya 1845 34.37 1.28 Kapchorwa 1920 34.45 1.40
Sipi River gauge 1075 34.15 1.14 Note: m.a.s.l. denotes meters above sea level.
0
50
100
150
200
250
300
Buginyanya Kapchorwa
Figure 1. Map of Sipi sub-catchment on the slopes of Mt. Elgon, Uganda.

Water 2021, 13, 1834 4 of 17
Water 2021, 13, 1834 4 of 18
Figure 1. Map of Sipi sub-catchment on the slopes of Mt. Elgon, Uganda.
Figure 2. Monthly mean rainfall in Buginyanya and Kapchorwa weather stations (1981–2015).
2.1. Data and Methods Observed daily rainfall and temperature data (1981–2015) for Buginyanya and Kap-
chorwa weather stations were obtained from the Uganda National Meteorological Au-thority (UNMA), while daily river flow data for River Sipi (1998–2015) were obtained from the Ministry of Water and Environment (MWE) (Table 1).
Table 1. The altitudes, longitudes, and latitudes for Buginyanya and Kapchorwa weather stations and river Sipi gauge in the slopes of Mount Elgon.
Climate Data Altitude (m.a.s.l.) Longitude (Degrees)
Latitude (De-grees)
Buginyanya 1845 34.37 1.28 Kapchorwa 1920 34.45 1.40
Sipi River gauge 1075 34.15 1.14 Note: m.a.s.l. denotes meters above sea level.
0
50
100
150
200
250
300
Buginyanya Kapchorwa
Figure 2. Monthly mean rainfall in Buginyanya and Kapchorwa weather stations (1981–2015).
2.1. Data and Methods
Observed daily rainfall and temperature data (1981–2015) for Buginyanya and Kap-chorwa weather stations were obtained from the Uganda National Meteorological Author-ity (UNMA), while daily river flow data for River Sipi (1998–2015) were obtained from theMinistry of Water and Environment (MWE) (Table 1).
Table 1. The altitudes, longitudes, and latitudes for Buginyanya and Kapchorwa weather stationsand river Sipi gauge in the slopes of Mount Elgon.
Climate Data Altitude (m.a.s.l.) Longitude (Degrees) Latitude (Degrees)
Buginyanya 1845 34.37 1.28Kapchorwa 1920 34.45 1.40
Sipi River gauge 1075 34.15 1.14Note: m.a.s.l. denotes meters above sea level.
2.2. Data Analysis
The mean, standard deviation (SD), and coefficient of variation (CV) in Equation (1)formed the first analysis for the rainfall, temperature, and river-flow data. These methodshave been used by [9,11,18,26]. The analysis was carried out at the individual stations’level and over the entire sub-catchment. The rainfall and temperature data for Buginyanyaand Kapchorwa were averaged in order to compute the variability over the sub-catchment.The annual, MAM, and ASON seasons were adopted (Figure 2).
CV =
[δ
µ
]× 100 (1)
where CV is the coefficient of variation, δ is the standard deviation and µ is the mean of thedataset. When the CV is high, the variability is considered to be high and when the CV islow, the variability is considered low. The rainfall is considered less variable when CV < 20,moderately variable when, 20 < CV < 30, and highly variable when CV > 30 [11,27].
The Standardized Precipitation Index (SPI) formed the second part of the analysis forrainfall data. It was used to determine the sensitivity of the sub-catchment to extremelywet and dry periods. SPI is calculated based on long-term precipitation data for a givenlocation and a specific period. The scale of SPI can start from 1 month, 3 months, 6 months,9 months, 12 months, 24 months, 36 months, and 48 months). The selection of the SPI scaleis determined by the purpose for which it is being calculated. However, irrespective of the

Water 2021, 13, 1834 5 of 17
scale, SPI gives information on the impacts of wet/dry conditions on water availability fordifferent needs. In this study, the 3-month, 6-month, and 12-month SPIs were calculatedusing the Meteorological Drought Monitor [28] method to determine extremely wet anddry periods in the Sipi sub-catchment Equation (2).
SPI =χ− µ
δ(2)
where χ is the SPI monthly total precipitation, µ is the SPI long-term mean precipitation,and δ is the standard deviation for the SPI precipitation. SPI measures the deviation instandard units between a dataset and its mean [29,30]. This study adopted the classificationscheme of Reference [28] in Table 2. The (3-month, 6-month, and 12-month) SPIs wereselected to identify the relative tendency towards above or below normal seasonal andannual precipitation [31]. Each SPI scale is a comparison between the specific SPI time scalefor the same period recorded in all the other years included in the dataset. A 3-month SPIestimated at the end of September 2010 compares the precipitation total recorded duringJuly, August, and September 2010 and the precipitation total recorded during the sameset of months in all years before 2010 in the same dataset. As stated before, a 3-monthSPI was selected to represent the seasonal estimations of precipitation and to providea measure of the short-term moisture conditions. The 6-month and 12-month SPIs, onthe other hand, were selected because they reflect the medium- and long-term moistureconditions, respectively. According to [32,33], information retrieved from the 6-month and12-month SPIs can be used to capture variability in streamflow regimes and reservoir levels.The 6-month and 12-month SPIs can also provide information about the precipitation fallenduring a 6-month and 12-month period [32]. According to [31], comparing short-term SPIwith medium- and longer-term scale SPIs is vital because a relatively normal or even a wet3-month period can occur in the middle of a long-term drought, and that, in turn, can becaptured only by a long-term SPI.
Table 2. SPI thresholds for wet and dry periods. Adopted from [34].
Extremely Wet 2.00 and Above
Very wet 1.5 to 1.99
Moderately wet 1.00 to 1.49
Normal −0.99 to 0.99
Moderately dry −1.00 to −1.49
Very dry −1.50 to −1.99
Extremely dry −2.00 and below
The Mann–Kendall trend analysis and Sen’s slope estimator [35] formed the last partof the analysis. The Mann–Kendall (MK) test is a nonparametric test, it was used because itdoes not require the data to be normally distributed, and is not very sensitive to missingdata values [35]. The test has been used to detect both trends and shifts in climate andhydrological time-series datasets [36,37]. The test statistic, S, is based on the null hypothesisthat there is no trend or serial correlation in a set of observations. S was calculated by usingEquations (3)–(5):
S =n−1
∑i=1
n
∑j=i+1
sgn(xj − xi
)(3)
where xj are xi the sequential data values, n is the length of the dataset, and we have thefollowing:
sgn (t) =
1, f or t > 00, f or t = 0−1 f or t < 0
(4)

Water 2021, 13, 1834 6 of 17
E(S) = 0 (5)
If n is 9 or less, the absolute value of S is compared directly with the theoreticaldistribution of S derived by Mann–Kendall [35]. In MAKESENS, the two-tailed test isused for four different significance levels of α: 0.1, 0.05, 0.01, and 0.001 [35]. At a certainprobability level, H0 is rejected in favor of H1 if the absolute value of S equals or exceedsa specified value Sα/2, where Sα/2 is the smallest S which has the probability less thanα/2 to appear in case of no trend [35]. A positive/(negative) value of S indicates anupward/(downward) trend. The significance level of 0.001 means that there is a 0.1%probability that the values xi is from a random distribution and with that probability wemake a mistake when rejecting H0 of no trend. Thus, the significance level of 0.001 meansthat the existence of a monotonic trend is very probable. In the same way, the significancelevel of 0.1 means there is a 10% probability that rejecting H0 is a mistake.
If n is at least 10, the normal approximation test is applied. The validity of the normalapproximation reduces for the number of data values close to 10 for several tied values inthe time series. The variance of S is first computed by following Equation (6) which takesinto account that ties may be present:
Var(S) =1
18
(n(n − 1)(2n + 5)−
m
∑i=1
ti(ti − 1)(2ti + 5)
)(6)
where m is the number of tied groups, and ti is the size of the ith tied group.The standardized test statistics, Z, is computed as from Equation (7):
Z =
(S − 1)/
√Var (S)
0(S + 1)/
√Var (S)
f or S > 0f or S = 0f or S < 0
(7)
The presence of a statistically significant trend is confirmed using the Z value. Apositive/(negative) value of Z indicates an upward/(downward) trend. The statistic Z hasa normal distribution. To test for either an upward or downward monotone trend (a two-tailed test) at α level of significance, H0 is rejected if the absolute value of Z is greater thanZ1-α/2, where Z1-α/2 is derived from the standard normal cumulative distribution [35].In MAKESENS, the tested significance levels α are 0.001, 0.01, 0.05, and 0.1. For the fourtested significance levels, the following symbols are used: *** if trend at α = 0.001 levelof significance, ** if trend at α = 0.01 level of significance, * if trend at α = 0.05 level ofsignificance, and + if trend at α = 0.1 level of significance. If the cell is blank, the significancelevel is greater than 0.1. In this study, trends were reported at (α = 0.001 and α = 0.05)levels of significance.
The Sen’s slope estimator, Q, is a nonparametric method developed by [38]. Sen’sslope estimated the magnitude of trends in time series data. For N pairs of data, Q is givenby Equations (8) and (9):
Q =xj − xi
tj − tifor i = 1, 2, . . . ..N (8)
where Q is the slope between xi, and xj at times ti and tj for (I < j). The value of Q is derivedfrom the median slope for N numbers of slope from the following equation:
Q =
{Q[(N+1)/2] if N is even
(Q[N/2]+Q(N+2)/2)2 if N is odd
(9)
3. Results3.1. Seasonal Variability in Rainfall and Temperature
Results indicate a general variability in mean seasonal rainfall (Table 3). The mean ofMAM rainfall was highest (190.58 mm) in Kapchorwa. This was followed by the mean of

Water 2021, 13, 1834 7 of 17
MAM rainfall (189.58 mm) over the sub-catchment. The lowest mean of MAM rainfall was188.87 mm recorded in Buginyanya. In ASON, however, Kapchorwa recorded the lowestmean rainfall of 187.8 mm, followed by the ASON mean rainfall of 194.94 mm over theentire sub-catchment, and the highest ASON mean rainfall was 202.08 mm recorded inBuginyanya. The CV for rainfall indicates that the ASON season varied more than MAMseason. The long-term mean minimum temperature recorded in MAM was 15.52 ◦C forKapchorwa station, 16.20 ◦C for Buginyanya, and 15.58 ◦C for the whole Sipi sub-catchment.Therefore, Kapchorwa is 0.68 ◦C cooler than Buginyanya, and this is because Kapchorwalies at a higher altitude compared to Buginyanya. Similarly, Kapchorwa recorded the lowestmean minimum temperature of 14.99 ◦C in ASON as compared to 15.51 ◦C for Buginyanya.In terms of the entire sub-catchment, the average mean temperature is 15.25 ◦C. Seasonalminimum temperature revealed that Kapchorwa is slightly colder than Buginyanya in boththe MAM and ASON seasons. The seasonal mean maximum temperature revealed thatBuginyanya recorded the highest 28.38 ◦C in MAM, followed by 28.26 ◦C recorded overthe sub-catchment, and the lowest was 28.14 ◦C recorded in Kapchorwa. The trend was thesame in ASON, where Buginyanya recorded a mean maximum temperature of 27.47 ◦C,followed by 27.23 ◦C recorded over the entire sub-catchment, and the lowest was 27.17 ◦C,recorded in Kapchorwa. Less surprising, therefore, the patterns were the same for meantemperature.
Table 3. Seasonal variabilities of rainfall and minimum, maximum, and mean temperature (1981–2015).
MAM ASONVariables Mean SD CV Mean SD CV (%)
Bugi
nyan
ya
Mean rainfall(mm) 188.87 46.84 24.8 202.08 76.1 37.66
T minimum(◦C) 16.2 0.48 2.94 15.51 0.53 3.42
T maximum(◦C) 28.38 0.84 2.96 27.47 0.94 3.42
T mean (◦C) 22.29 0.58 2.58 21.49 0.67 3.12
Kap
chor
wa
Mean rainfall(mm) 190.28 49.74 26.14 187.8 70.19 37.37
T minimum(◦C) 15.52 0.61 3.96 14.99 0.59 3.94
T maximum(◦C) 28.14 0.93 3.32 27.17 0.98 3.61
T mean (◦C) 21.83 0.7 3.19 21.08 0.72 3.42
Sub-
catc
hmen
t
Mean rainfall(mm) 189.58 47.61 25.11 194.94 72.85 37.37
T minimum(◦C) 15.86 0.53 3.36 15.25 0.55 3.59
T maximum(◦C) 28.26 0.87 3.09 27.32 0.95 3.48
T mean (◦C) 22.06 0.62 2.82 21.28 0.69 3.22
3.2. Annual Variability in Rainfall, Temperature, and River Flow
The results in (Table 4) indicate that annual rainfall has been very stable in Buginyanya,Kapchorwa, and over the sub-catchment. According to [11,27] annual rainfall in Buginyanya,Kapchorwa, and over the sub-catchment is moderately variable (20 < CV < 30). The annual-temperature minimum, maximum, and mean reflected seasonal variability. Table 4 also indicatesthat the minimum temperature in Buginyanya was more than that recorded in Kapchorwaby 0.61 ◦C and more than the average over the entire sub-catchment by 0.3 ◦C. Similarly, themaximum temperature in Buginyanya was higher than that recorded in Kapchorwa by 0.29 ◦Cand more than the average over the whole sub-catchment by 0.15 ◦C. The long-term meantemperature was similarly higher in Buginyanya by 0.45 ◦C and in Kapchorwa by 0.023 ◦C

Water 2021, 13, 1834 8 of 17
against that over the entire sub-catchment. As mentioned before, Buginyanya is slightly warmerthan Kapchorwa since Buginyanya is located at a lower altitude as compared to Kapchorwa(Table 1). Annual mean flow of River Sipi showed a very high level of variability CV = 45.66%.The very high variability in the river flow corresponds with the high variability in seasonalrainfall (Table 3) and could also indicate extreme events.
Table 4. Annual variability of rainfall; minimum, maximum, and mean temperature (1981–2015); and flow (1998–2015).
VariablesBuginyanya Kapchorwa Sub-Catchment
Mean SD CV (%) Mean SD CV Mean SD CV (%)
Rainfall (mm) 1851.57 466.1 25.17 1773.04 444.35 25.06 1812.3 451.56 24.92T min (◦C) 15.73 0.47 3.01 15.12 0.58 3.83 15.43 0.52 3.34T max (◦C) 28.07 0.85 3.02 27.78 0.9 3.25 27.92 0.87 3.1
T mean (◦C) 21.9 0.6 2.75 21.45 0.68 3.18 21.67 0.63 2.92Flow (m3/s) 2.36 1.08 45.66
3.3. Monthly and Annual Patterns of Rainfall and River Flow
In terms of monthly patterns of rainfall and river flow (Figure 3), the Sipi sub-catchment exhibits a bimodal rainfall characteristic. The months of MAM and ASONare the wet months. The river flow pattern mimics the rainfall seasons where the peak offlow pattern during the second rainfall season is higher than that of the first rainfall seasonfor reasons as later discussed.
Water 2021, 13, 1834 9 of 18
pattern during the second rainfall season is higher than that of the first rainfall season for reasons as later discussed.
Figure 3. Monthly patterns of mean rainfall and flow in Sipi sub-catchment (1998–2015).
According to (Figure 4), annual rainfall in both Buginyanya and Kapchorwa ranged from about 1500 to 2000 mm between 1998 and 2012 except in 2007 where Buginyanya received up to 3783.3 mm and Kapchorwa received 3403.2 mm of annual rainfall respec-tively. The figure also indicates a shift in annual rainfall amount above 2000 mm in both Buginyanya and Kapchorwa, starting from 2013. On the other hand, annual mean flow remained below 1.95 m3/s from 1998 to 2005, where it hiked to 3.43 m3/s in 2007 before dropping to 1.64 m3/s in 2009. However, there was a sharp rise in annual mean flow in 2009, reaching the highest peak ever of 5.37 m3/s in 2010, before sharply dropping to 3.35 m3/s in 2011, where it continued to decline to 1.87 m3/s in 2015. The highest annual mean flow in 2010 could be a result of extremely wet event in 2010, but the event was not cap-tured by the rainfall data.
Figure 4. Annual patterns of rainfall in Buginyanya and Kapchorwa and River Sioi flow (1998–2015).
0
1
2
3
4
5
6
0
500
1000
1500
2000
2500
3000
3500
4000
Flow
(m3 /
s)
Rain
fall
(mm
)
Buginyanya annual mean rainfall (mm)Kapchorwa annual mean rainfall (mm)River Sipi annual mean flow (m3/s)
Figure 3. Monthly patterns of mean rainfall and flow in Sipi sub-catchment (1998–2015).
According to (Figure 4), annual rainfall in both Buginyanya and Kapchorwa rangedfrom about 1500 to 2000 mm between 1998 and 2012 except in 2007 where Buginyanyareceived up to 3783.3 mm and Kapchorwa received 3403.2 mm of annual rainfall respec-tively. The figure also indicates a shift in annual rainfall amount above 2000 mm in bothBuginyanya and Kapchorwa, starting from 2013. On the other hand, annual mean flowremained below 1.95 m3/s from 1998 to 2005, where it hiked to 3.43 m3/s in 2007 beforedropping to 1.64 m3/s in 2009. However, there was a sharp rise in annual mean flowin 2009, reaching the highest peak ever of 5.37 m3/s in 2010, before sharply dropping to3.35 m3/s in 2011, where it continued to decline to 1.87 m3/s in 2015. The highest annualmean flow in 2010 could be a result of extremely wet event in 2010, but the event was notcaptured by the rainfall data.

Water 2021, 13, 1834 9 of 17
Water 2021, 13, 1834 9 of 18
pattern during the second rainfall season is higher than that of the first rainfall season for reasons as later discussed.
Figure 3. Monthly patterns of mean rainfall and flow in Sipi sub-catchment (1998–2015).
According to (Figure 4), annual rainfall in both Buginyanya and Kapchorwa ranged from about 1500 to 2000 mm between 1998 and 2012 except in 2007 where Buginyanya received up to 3783.3 mm and Kapchorwa received 3403.2 mm of annual rainfall respec-tively. The figure also indicates a shift in annual rainfall amount above 2000 mm in both Buginyanya and Kapchorwa, starting from 2013. On the other hand, annual mean flow remained below 1.95 m3/s from 1998 to 2005, where it hiked to 3.43 m3/s in 2007 before dropping to 1.64 m3/s in 2009. However, there was a sharp rise in annual mean flow in 2009, reaching the highest peak ever of 5.37 m3/s in 2010, before sharply dropping to 3.35 m3/s in 2011, where it continued to decline to 1.87 m3/s in 2015. The highest annual mean flow in 2010 could be a result of extremely wet event in 2010, but the event was not cap-tured by the rainfall data.
Figure 4. Annual patterns of rainfall in Buginyanya and Kapchorwa and River Sioi flow (1998–2015).
0
1
2
3
4
5
6
0
500
1000
1500
2000
2500
3000
3500
4000
Flow
(m3 /
s)
Rain
fall
(mm
)
Buginyanya annual mean rainfall (mm)Kapchorwa annual mean rainfall (mm)River Sipi annual mean flow (m3/s)
Figure 4. Annual patterns of rainfall in Buginyanya and Kapchorwa and River Sioi flow (1998–2015).
3.4. Frequency of Extremely Wet and Dry Events in Sipi Sub-Catchment
The occurrence of extremely wet and dry events in the Sipi sub-catchment (Table 5)and (Figure 5) based on the 3-month SPI revealed that there were six extremely wet yearsin the Sipi sub-catchment between 1990 and 2015. The first extremely wet period occurredfrom March to August 1990. In 1998 it occurred in February and then it started from July2007 and lasted till April 2008. In 2015, it was from April to September 2015. On the otherhand, there were five extreme dry periods under the 3-month SPI in the Sipi sub-catchmentfor the period 1981–2015. The first dry period was between January 1994 and April 1994.In 2004, it was from July to October. In 2006, it began in June and lasted till August. In2009, it was from August to October, and in 2012, it was from March to June. Most of theextreme events were in the second rainfall season.
Table 5. Frequency and percentage of extremely wet and dry years in the Sipi sub-catchment between1981 and 2015 under the 3-month, 6-month, and 12-month SPIs.
Frequency Frequency
%SPI Extremely Wet Extremely Dry Extreme EventsPre-2000
Extreme EventsPost-2000s
3 Months 4 5 3 66 Months 3 2 2 4
12 Months 2 2 0 4
It is seen from Table 5 that there were more extreme events (14) during the post-2000 period as compared with five in the pre-2000. It, therefore, implies that the Sipisub-catchment has become more prone to extreme events in the recent period than before.
The 6-month SPI (Figure 6) revealed that there were four extremely wet periodsduring the period 1981–2015. The first extremely wet months occurred from March toJuly 1990. The second extremely wet months were from April to May 1998. The thirdextremely wet months lasted from July 2007 to May 2008. The fourth was from June 2015 toSeptember 2015. On the other hand, there were two extremely dry periods recorded underthe 6-month SPI. The first one occurred between July and October 2004 while the secondoccurred between July and October 2006. All the extremely dry periods under 6-monthSPI were in the second rainfall season. On the other hand, two out of three of the extremewet months under the 6-month SPI were also in the second rainfall season. Therefore, the

Water 2021, 13, 1834 10 of 17
extreme events under the 6-month SPI were more pronounced in the second rainfall season.
Water 2021, 13, 1834 10 of 18
3.4. Frequency of Extremely Wet and Dry Events in Sipi Sub-Catchment The occurrence of extremely wet and dry events in the Sipi sub-catchment (Table 5)
and (Figure 5) based on the 3-month SPI revealed that there were six extremely wet years in the Sipi sub-catchment between 1990 and 2015. The first extremely wet period occurred from March to August 1990. In 1998 it occurred in February and then it started from July 2007 and lasted till April 2008. In 2015, it was from April to September 2015. On the other hand, there were five extreme dry periods under the 3-month SPI in the Sipi sub-catch-ment for the period 1981–2015. The first dry period was between January 1994 and April 1994. In 2004, it was from July to October. In 2006, it began in June and lasted till August. In 2009, it was from August to October, and in 2012, it was from March to June. Most of the extreme events were in the second rainfall season.
Table 5. Frequency and percentage of extremely wet and dry years in the Sipi sub-catchment be-tween 1981 and 2015 under the 3-month, 6-month, and 12-month SPIs.
Frequency Frequency
%SPI Extremely Wet Extremely Dry Extreme Events
Pre-2000 Extreme Events Post-
2000s 3 Months 4 5 3 6 6 Months 3 2 2 4 12 Months 2 2 0 4
It is seen from Table 5 that there were more extreme events (14) during the post-2000 period as compared with five in the pre-2000. It, therefore, implies that the Sipi sub-catch-ment has become more prone to extreme events in the recent period than before.
Figure 5. Three-month SPI over Sipi sub-catchment (1981–2015).
The 6-month SPI (Figure 6) revealed that there were four extremely wet periods dur-ing the period 1981–2015. The first extremely wet months occurred from March to July
-4-3-2-1012345
Jan,
198
1Ju
n, 1
982
Nov
, 198
3A
pr, 1
985
Sep,
198
6Fe
b, 1
988
Jul,
1989
Dec
, 199
0M
ay, 1
992
Oct
, 199
3M
ar, 1
995
Aug
, 199
6Ja
n, 1
998
Jun,
199
9N
ov, 1
900
Apr
, 190
2Se
p, 1
903
Feb,
190
5Ju
l, 19
06D
ec, 1
907
May
, 190
9O
ct, 1
910
Mar
, 191
2A
ug, 1
913
Jan,
191
5
SPI
3-spi Wet Moderately Wet Extremely Wet
Dry Moderately Dry Extremely Dry
Figure 5. Three-month SPI over Sipi sub-catchment (1981–2015).
Water 2021, 13, 1834 11 of 18
1990. The second extremely wet months were from April to May 1998. The third extremely wet months lasted from July 2007 to May 2008. The fourth was from June 2015 to Septem-ber 2015. On the other hand, there were two extremely dry periods recorded under the 6-month SPI. The first one occurred between July and October 2004 while the second oc-curred between July and October 2006. All the extremely dry periods under 6-month SPI were in the second rainfall season. On the other hand, two out of three of the extreme wet months under the 6-month SPI were also in the second rainfall season. Therefore, the ex-treme events under the 6-month SPI were more pronounced in the second rainfall season.
Figure 6. Six-month SPI over Sipi sub-catchment (1981–2015).
The 12-month SPI (Figure 7) revealed that there were two extremely wet periods and two extremely dry periods over the sub-catchment. The first extremely wet event occurred between September 2007 and October 2008. The second one occurred between June and August 2015. For the extremely dry periods, the first occurred between August and Sep-tember 2004, while the second period started in February 2005 and lasted until April. The 12-month SPI revealed that the two extremely wet events and one extremely dry event all occurred in the second rainfall season.
-3
-2
-1
0
1
2
3
4
Jan,
198
1Ju
l, 19
82Ja
n, 1
984
Jul,
1985
Jan,
198
7Ju
l, 19
88Ja
n, 1
990
Jul,
1991
Jan,
199
3Ju
l, 19
94Ja
n, 1
996
Jul,
1997
Jan,
199
9Ju
l, 19
00Ja
n, 1
902
Jul,
1903
Jan,
190
5Ju
l, 19
06Ja
n, 1
908
Jul,
1909
Jan,
191
1Ju
l, 19
12Ja
n, 1
914
Jul,
1915
SPI
6-spi Wet Moderately WetExtremely Wet Dry Moderately DryExtremely Dry
Figure 6. Six-month SPI over Sipi sub-catchment (1981–2015).

Water 2021, 13, 1834 11 of 17
The 12-month SPI (Figure 7) revealed that there were two extremely wet periodsand two extremely dry periods over the sub-catchment. The first extremely wet eventoccurred between September 2007 and October 2008. The second one occurred betweenJune and August 2015. For the extremely dry periods, the first occurred between Augustand September 2004, while the second period started in February 2005 and lasted untilApril. The 12-month SPI revealed that the two extremely wet events and one extremely dryevent all occurred in the second rainfall season.
Water 2021, 13, 1834 12 of 18
Figure 7. Twelve-month SPI over Sipi sub-catchment (1981–2015).
3.5. Seasonal and Annual Trends Trend analysis revealed increasing seasonal and annual minimum and mean temper-
ature (Table 6), though not significant for rainfall (Figures 8 and 9). MAM rainfall in-creased at a range of 0.27 mm in Buginyanya to 3.41 mm over the entire sub-catchment. In ASON, the increase in rainfall ranged from 1.25 mm in Buginyanya to 1.78 mm in Kap-chorwa. Similarly, annual rainfall increased from 8.68 mm in Buginyanya to 18.32 mm over the sub-catchment. MAM minimum temperature significantly increased at α = 0.05 level of significance in Kapchorwa and α = 0.001 in ASON in Buginyanya, Kapchorwa, and over the entire sub-catchment. Generally, the minimum temperature for MAM in-creased by 0.02 °C, while, in ASON, it increased by 0.02 °C in Buginyanya and by 0.04 °C in Kapchorwa and over the sub-catchment, respectively. The annual minimum tempera-ture increased at a range of 0.03 °C in Kapchorwa to 0.04 °C, over the sub-catchment. The maximum temperature did not increase significantly over the entire sub-catchment. The mean temperature increased at α = 0.05 level of significance in ASON across the whole sub-catchment, with an overall increase of 0.03 °C. Similarly, both MAM and annual river flow (Figure 9) increased at α = 0.05. A study by [39] also found minimal variation (less than 1 °C) and a very similar CV below 5% between the average maximum and minimum temperature in MAM and ASON for Uganda.
-3
-2
-1
0
1
2
3
4
Jan,
198
1Ju
n, 1
982
Nov
, 198
3A
pr, 1
985
Sep,
198
6Fe
b, 1
988
Jul,
1989
Dec
, 199
0M
ay, 1
992
Oct
, 199
3M
ar, 1
995
Aug
, 199
6Ja
n, 1
998
Jun,
199
9N
ov, 1
900
Apr
, 190
2Se
p, 1
903
Feb,
190
5Ju
l, 19
06D
ec, 1
907
May
, 190
9O
ct, 1
910
Mar
, 191
2A
ug, 1
913
Jan,
191
5
12-spi Wet Moderately WetExtremely Wet Dry Moderately Dry
Figure 7. Twelve-month SPI over Sipi sub-catchment (1981–2015).
3.5. Seasonal and Annual Trends
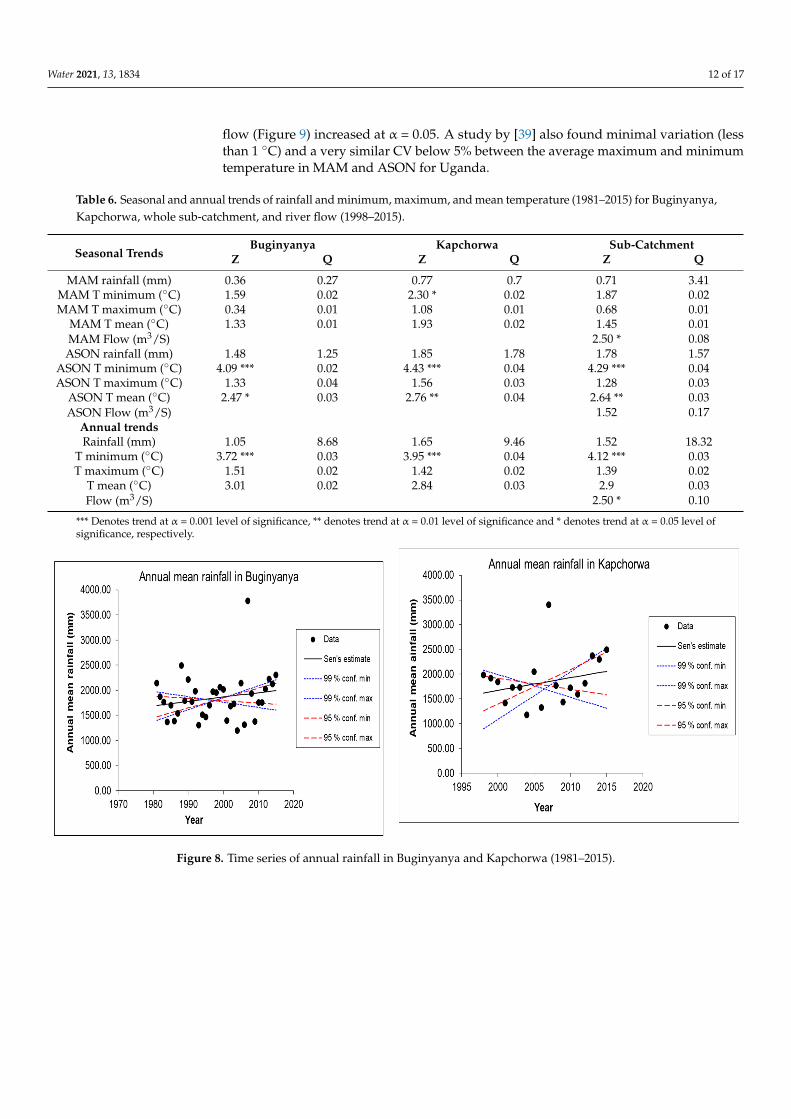
Trend analysis revealed increasing seasonal and annual minimum and mean tempera-ture (Table 6), though not significant for rainfall (Figures 8 and 9). MAM rainfall increasedat a range of 0.27 mm in Buginyanya to 3.41 mm over the entire sub-catchment. In ASON,the increase in rainfall ranged from 1.25 mm in Buginyanya to 1.78 mm in Kapchorwa.Similarly, annual rainfall increased from 8.68 mm in Buginyanya to 18.32 mm over thesub-catchment. MAM minimum temperature significantly increased at α = 0.05 levelof significance in Kapchorwa and α = 0.001 in ASON in Buginyanya, Kapchorwa, andover the entire sub-catchment. Generally, the minimum temperature for MAM increasedby 0.02 ◦C, while, in ASON, it increased by 0.02 ◦C in Buginyanya and by 0.04 ◦C inKapchorwa and over the sub-catchment, respectively. The annual minimum temperatureincreased at a range of 0.03 ◦C in Kapchorwa to 0.04 ◦C, over the sub-catchment. Themaximum temperature did not increase significantly over the entire sub-catchment. Themean temperature increased at α = 0.05 level of significance in ASON across the wholesub-catchment, with an overall increase of 0.03 ◦C. Similarly, both MAM and annual river
Water 2021, 13, 1834 12 of 17
flow (Figure 9) increased at α = 0.05. A study by [39] also found minimal variation (lessthan 1 ◦C) and a very similar CV below 5% between the average maximum and minimumtemperature in MAM and ASON for Uganda.
Table 6. Seasonal and annual trends of rainfall and minimum, maximum, and mean temperature (1981–2015) for Buginyanya,Kapchorwa, whole sub-catchment, and river flow (1998–2015).
Seasonal TrendsBuginyanya Kapchorwa Sub-Catchment
Z Q Z Q Z Q
MAM rainfall (mm) 0.36 0.27 0.77 0.7 0.71 3.41MAM T minimum (◦C) 1.59 0.02 2.30 * 0.02 1.87 0.02MAM T maximum (◦C) 0.34 0.01 1.08 0.01 0.68 0.01
MAM T mean (◦C) 1.33 0.01 1.93 0.02 1.45 0.01MAM Flow (m3/S) 2.50 * 0.08
ASON rainfall (mm) 1.48 1.25 1.85 1.78 1.78 1.57ASON T minimum (◦C) 4.09 *** 0.02 4.43 *** 0.04 4.29 *** 0.04ASON T maximum (◦C) 1.33 0.04 1.56 0.03 1.28 0.03
ASON T mean (◦C) 2.47 * 0.03 2.76 ** 0.04 2.64 ** 0.03ASON Flow (m3/S) 1.52 0.17
Annual trendsRainfall (mm) 1.05 8.68 1.65 9.46 1.52 18.32
T minimum (◦C) 3.72 *** 0.03 3.95 *** 0.04 4.12 *** 0.03T maximum (◦C) 1.51 0.02 1.42 0.02 1.39 0.02
T mean (◦C) 3.01 0.02 2.84 0.03 2.9 0.03Flow (m3/S) 2.50 * 0.10
*** Denotes trend at α = 0.001 level of significance, ** denotes trend at α = 0.01 level of significance and * denotes trend at α = 0.05 level ofsignificance, respectively.
Water 2021, 13, 1834 13 of 18
Table 6. Seasonal and annual trends of rainfall and minimum, maximum, and mean temperature (1981–2015) for Buginyanya, Kapchorwa, whole sub-catchment, and river flow (1998–2015).
Seasonal trends Buginyanya Kapchorwa Sub-Catchment Z Q Z Q Z Q
MAM rainfall (mm) 0.36 0.27 0.77 0.7 0.71 3.41 MAM T minimum (°C) 1.59 0.02 2.30 * 0.02 1.87 0.02 MAM T maximum (°C) 0.34 0.01 1.08 0.01 0.68 0.01
MAM T mean (°C) 1.33 0.01 1.93 0.02 1.45 0.01 MAM Flow (m3/S) 2.50 * 0.08
ASON rainfall (mm) 1.48 1.25 1.85 1.78 1.78 1.57 ASON T minimum (°C) 4.09 *** 0.02 4.43 *** 0.04 4.29 *** 0.04 ASON T maximum (°C) 1.33 0.04 1.56 0.03 1.28 0.03
ASON T mean (°C) 2.47 * 0.03 2.76 ** 0.04 2.64 ** 0.03 ASON Flow (m3/S) 1.52 0.17
Annual trends Rainfall (mm) 1.05 8.68 1.65 9.46 1.52 18.32
T minimum (°C) 3.72 *** 0.03 3.95 *** 0.04 4.12 *** 0.03 T maximum (°C) 1.51 0.02 1.42 0.02 1.39 0.02
T mean (°C) 3.01 0.02 2.84 0.03 2.9 0.03 Flow (m3/S) 2.50 * 0.10
*** Denotes trend at α = 0.001 level of significance, ** denotes trend at α = 0.01 level of significance and * denotes trend at α = 0.05 level of significance, respectively.
Figure 8. Time series of annual rainfall in Buginyanya and Kapchorwa (1981–2015). Figure 8. Time series of annual rainfall in Buginyanya and Kapchorwa (1981–2015).

Water 2021, 13, 1834 13 of 17Water 2021, 13, 1834 14 of 18
Figure 9. Tine series of annual rainfall over Sipi sub-catchment (1981–2015) and River Sipi flow (1998–2015).
4. Discussion The results revealed inter-seasonal variation in mean rainfall across the sub-catch-
ment, with ASON rainfall varying more than MAM rainfall. According to [27], ASON mean rainfall across the entire sub-catchment is categorized as highly variable CV > 30, whereas MAM rainfall is grouped under moderately variable 20 < CV < 30. However, the mean of rainfall in MAM and ASON for Buginyanya, Kapchorwa, and the mean of rainfall over the sub-catchment have not varied much. This suggests that the inter-seasonal vari-abilities could be a result of extreme events, as depicted by the SPIs. In fact, [40] also found variations in the amount of annual and seasonal precipitation in the greater Mt. Elgon region between 1993 and 2013. Looking at the results on seasonal and annual rainfall var-iabilities from the perspective of water availability, Sipi sub-catchment gets, on average, an equal amount of water in both the MAM and ASON seasons. However, results depict high river flows in the catchment during the ASON season as compared to MAM. The observed patterns of monthly rainfall and river flows can be attributed to many factors, including the following: (a) the development of the tropical cyclone during December, January, and February (DJF); (b) the influence of the El Nino Southern Oscillation (ENSO); (c) during that period, the region had gone through a long dry season (DJF) where the volume of most rivers was reduced due to high evaporation and low rainfall. According to [31] the climate of Uganda is influenced by the Inter-Tropical Convergence Zone (ITCZ), varied relief, geo-location, and inland lakes. In the second rainfall season, the flow pattern pick-up, together with the rainfall, reaches its peak, which is more than the peak of the second rainfall season. This can be attributed to accumulation of water in the river and ground during the first rainfall season. The pattern also indicates no major abstrac-tions of water from the river.
Results of seasonal and annual variabilities therefore point out that water is available (in terms of quantity) in the soil in both MAM and ASON rainfall season and in the river throughout the year. Trend analysis results showed that both annual flow and minimum temperature have increased significantly but annual mean rainfall did not increase signif-icantly. Although result suggests water availability in the catchment throughout the years, the finding presents both opportunities and challenges to water resources management in the future. The opportunity that presents itself is that the Sipi sub-catchment has the po-tential for irrigation agriculture to support food production even in times of droughts and, hence, increased productivity. However, irrigation agriculture has been associated with
Figure 9. Tine series of annual rainfall over Sipi sub-catchment (1981–2015) and River Sipi flow (1998–2015).
4. Discussion
The results revealed inter-seasonal variation in mean rainfall across the sub-catchment,with ASON rainfall varying more than MAM rainfall. According to [27], ASON meanrainfall across the entire sub-catchment is categorized as highly variable CV > 30, whereasMAM rainfall is grouped under moderately variable 20 < CV < 30. However, the mean ofrainfall in MAM and ASON for Buginyanya, Kapchorwa, and the mean of rainfall over thesub-catchment have not varied much. This suggests that the inter-seasonal variabilitiescould be a result of extreme events, as depicted by the SPIs. In fact, ref. [40] also foundvariations in the amount of annual and seasonal precipitation in the greater Mt. Elgonregion between 1993 and 2013. Looking at the results on seasonal and annual rainfallvariabilities from the perspective of water availability, Sipi sub-catchment gets, on average,an equal amount of water in both the MAM and ASON seasons. However, results depicthigh river flows in the catchment during the ASON season as compared to MAM. Theobserved patterns of monthly rainfall and river flows can be attributed to many factors,including the following: (a) the development of the tropical cyclone during December,January, and February (DJF); (b) the influence of the El Nino Southern Oscillation (ENSO);(c) during that period, the region had gone through a long dry season (DJF) where thevolume of most rivers was reduced due to high evaporation and low rainfall. Accordingto [31] the climate of Uganda is influenced by the Inter-Tropical Convergence Zone (ITCZ),varied relief, geo-location, and inland lakes. In the second rainfall season, the flow patternpick-up, together with the rainfall, reaches its peak, which is more than the peak of thesecond rainfall season. This can be attributed to accumulation of water in the river andground during the first rainfall season. The pattern also indicates no major abstractions ofwater from the river.
Results of seasonal and annual variabilities therefore point out that water is available(in terms of quantity) in the soil in both MAM and ASON rainfall season and in the riverthroughout the year. Trend analysis results showed that both annual flow and minimumtemperature have increased significantly but annual mean rainfall did not increase signifi-cantly. Although result suggests water availability in the catchment throughout the years,the finding presents both opportunities and challenges to water resources managementin the future. The opportunity that presents itself is that the Sipi sub-catchment has thepotential for irrigation agriculture to support food production even in times of droughtsand, hence, increased productivity. However, irrigation agriculture has been associated

Water 2021, 13, 1834 14 of 17
with intensification and high applications of fertilizers and other agrochemicals that arebound to exacerbate non-point pollution of water resources in the sub-catchment [41,42].
From another angle, the findings suggest that the limiting factor in the Sipi sub-catchment in the two rain fall seasons is not water but could be the variation in temperature.Different crops are known to respond differently to small differences in temperature whichmay have a direct link to sunshine hours’/day length [43]. Such variation may affectthe flowering patterns and may lead to delayed or early maturity in fruits [44,45], whichmay also exacerbate pre and post-harvest loses. Similarly, little difference in temperaturemay provide ambient conditions for pest and diseases [46] and hence leading to pre- andpostharvest loss or reduced crop yields. In Mt. Elgon, ref. [47] reported that the incidenceof coffee leaf miners (CLM) increased significantly (p = 0.0152) with increasing altitude. Theauthors linked the result to variation of rainfall and ambient temperatures which affect thecoffee plant and thus, the pest and its natural enemies. A study by [15] found that variationin rainfall and temperature from the long-term mean has significant effects on crop output,while an exponential increase in rainfall has detrimental effect on crop output. In the studyby [46], local farmers in Rakai and Hoima districts in Western Uganda reported erraticrainfall onset and cessation, poor seasonal distribution of rainfall and decreased rainfall,variations in temperatures, drought, increasing disease and pest incidences, decreasingwater sources, lack of pasture, bush fires, hailstorms, and changes in crop flowering andfruiting times as the major climate-related risks being experienced.
4.1. Conclusions
For the period 1981–2015, there was high variability in ASON rainfall in the Sipisub-catchment, as indicated by high CV values. Additionally, more extremely wet and dryperiods occurred in the Sipi sub-catchment in the post-2000s as compared to pre-2000. Thisimplies that the future is more likely to have more extremely wet and dry events that arelikely to pose threats to the surrounding communities; thus, there is a need to develop morecapacities by the government and the surrounding communities to anticipate, prepare, andadapt for sustained livelihoods.
The increase in the Sipi river flow in the second seasons may imply more floods tothe surrounding areas and policy makers and other relevant stakeholders need to take thisinto consideration to prepare for such anomalies in order to reduce the associated losses.
A significant increase in the minimum temperature across the Sipi sub-catchment,especially in ASON and in annual scales, may imply a reduction in water availabilitydue to increased evaporation. This may also affect several production sectors, such asagriculture, since an increase in temperature may promote breading grounds for croppests and diseases. Therefore, policy makers and other stakeholders need to developstrategies for water investment, food security, flood and drought mitigation within the Sipisub-catchment and the Mt. Elgon region at large.
Future research should investigate and disentangle the impacts of climate and land-use changes on water resources in the Sipi sub-catchment for adaptive management of theresources in the catchment.
4.2. Limitations
Most weather stations in Uganda are agro-metrological and rainfall stations estab-lished in the colonial times. Unfortunately, the majority of the stations collapsed in the1970s, due to insecurity, vandalisms, and lack of maintenance [48]. As a result, there is aserious problem with hydro-meteorological data in Uganda in general [26,39], and in thestudy catchment specifically. Consequently, data used in this study came from only twoweather station within the sub-catchment, and we consider this a limitation. Effort to over-come this limitation by supplementing observed data with the Modern-Era RetrospectiveAnalysis for Research and Applications (MERRA) daily rainfall and maximum and mini-mum temperatures were rendered fruitless after it was found that the sub-catchment lieswithin the same grid. Therefore, irrespective of the location of extraction, one would obtain

Water 2021, 13, 1834 15 of 17
the same data in the 918 km2 sub-catchment, possibly due to the steep slopes. However, webelieve that our results represent close to the best reality in the sub-catchment, consideringthe data availability. The situation could be improved in the future if more meteorologicalstations are established in the sub-catchment.
Author Contributions: Conceptualization, J.K.L.; Methodology, J.K.L.; Y.B., and J.-G.M.M.; formalAnalysis, J.K.L. and G.O.; writing, J.K.L.; writing, review and editing J.K.L., G.O., Y.B., J.-G.M.M.,I.K., and P.P.; study-area visualization, E.B.M.; supervision, Y.B., J.-G.M.M., and P.P. All authors haveread and agreed to the published version of the manuscript.
Funding: This research was funded in part by the Swedish International Development CooperationAgency (Sida) and Makerere University, under Sida contribution No. 51180060.
Data Availability Statement: The Uganda National Meteorological Authority (UNMA) providedthe daily rainfall data of Buginyanya and Kapchorwa weather stations. The Ministry of Water andEnvironment Uganda provided the daily river-flow data for Sipi.
Acknowledgments: The authors are grateful for the financial support for this research from theSwedish International Development Agency (SIDA); they thank the Uganda National MetrologicalAuthority (UNMA) and Ministry of Water and Environment (MWE) Uganda for providing rainfalland river flows data, respectively.
Conflicts of Interest: Authors declare no conflict of interest or state.
References1. Langat, P.; Kumar, L.; Koech, R. Temporal Variability and Trends of Rainfall and Streamflow in Tana River Basin, Kenya.
Sustainability 2017, 9, 1963. [CrossRef]2. Guo, H.D.; Zhang, L.; Zhu, L.W. Earth observation big data for climate change research. Adv. Clim. Chang. Res. 2015, 6, 108–117.
[CrossRef]3. Poortinga, A.; Bastiaanssen, W.; Simons, G.; Saah, D.; Senay, G.; Fenn, M.; Bean, B.; Kadyszewski, J. A self-calibrating runoff
and streamflow remote sensing model for ungauged basins using open-access earth observation data. Remote Sens. 2017, 9, 86.[CrossRef]
4. Marques, R.; Santos, C.A.G.; Moreira, M.; Valeriano, C.; Isabella, C.L.S. Rainfall and river flow trends using Mann—Kendall andSen’ s slope estimator statistical tests in the Cobres River basin. Nat. Hazards 2015, 77, 1205–1221.
5. Bekele, D.; Alamirew, T.; Kebede, A.; Zeleke, G.; Melese, A.M.; Bekele, D. Analysis of rainfall trend and variability for agriculturalwater management in Awash River Basin, Ethiopia. J. Water Clim. Chang. 2016, 8, 127–141. [CrossRef]
6. Onyutha, C. Geospatial trends and decadal anomalies in extreme rainfall over Uganda, East Africa. Adv. Meteorol. 2016, 2016.[CrossRef]
7. Fentaw, F.; Hailu, D.; Nigussie, A. Trend and Variability Analysis of Rainfall & Stream Flow Series at Tekeze River Basin, Ethiopia.Int. J. Sci. Eng. Res. 2017, 8, 11.
8. Onyutha, C.; Willems, P. Investigation of flow-rainfall co-variation for catchments selected based on the two main sources ofRiver Nile. Stoch. Environ. Res. Risk Assess. 2017, 32, 623–641. [CrossRef]
9. Tigabu, T.B.; Hörmann, G.; Wagner, P.D.; Fohrer, N. Statistical analysis of rainfall and streamflow time series in the Lake TanaBasin, Ethiopia. J. Water Clim. Chang. 2018, 11, 258–273. [CrossRef]
10. Kassian, L.M.; Tenywa, M.; Liwenga, E.T.; Dyer, K.W.; Bamutaze, Y. Implication of climate change and variability on stream flowin Iringa region, Tanzania. J. Water Clim. Chang. 2017, 8, 336–347. [CrossRef]
11. Asfaw, A.; Simane, B.; Hassen, A.; Bantider, A. Variability and time series trend analysis of rainfall and temperature in northcentralEthiopia: A case study in Woleka sub-basin. Weather Clim. Extrem. 2018, 19, 29–41. [CrossRef]
12. Berhane, A.; Hadgu, G.; Worku, W.; Abrha, B. Trends in extreme temperature and rainfall indices in the semi-arid areas of WesternTigray, Ethiopia. Environ. Syst. Res. 2020, 9, 1–20. [CrossRef]
13. Abbam, T.; Johnson, F.A.; Dash, J.; Padmadas, S.S. Spatiotemporal Variations in Rainfall and Temperature in Ghana over theTwentieth Century, 1900–2014. Earth Sp. Sci. 2018, 5, 120–132. [CrossRef]
14. Gebrechorkos, S.H.; Hülsmann, S.; Bernhofer, C. Long-term trends in rainfall and temperature using high-resolution climatedatasets in East Africa. Sci. Rep. 2019, 9, 1–9.
15. Mwaura, F.M.; Okoboi, G. Climate variability and crop production in Uganda. J. Sustain. Dev. 2014, 7, 159–172. [CrossRef]16. Diem, J.E.; Ryan, S.J.; Hartter, J.; Palace, M.W. Satellite-based rainfall data reveal a recent drying trend in central equatorial Africa.
Clim. Chang. 2014, 126, 263–272. [CrossRef]17. Mukasa, J.; Olaka, L.; Said, M.Y. Drought and households’ adaptive capacity to water scarcity in Kasali, Uganda. J. Water Clim.
Chang. 2020, 11, 217–232. [CrossRef]

Water 2021, 13, 1834 16 of 17
18. Mubialiwo, A.; Onyutha, C.; Abebe, A. Historical Rainfall and Evapotranspiration Changes over Mpologoma Catchment inUganda. Adv. Meteorol. 2020, 9, 2020. [CrossRef]
19. Nsubuga, F.N.W.; Olwoch, J.M.; de Rautenbach, C.J.W.; Botai, O.J. Analysis of mid-twentieth century rainfall trends and variabilityover southwestern Uganda. Theor. Appl. Climatol. 2014, 115, 53–71. [CrossRef]
20. MWE. Government of Uganda Ministry of Water and Environment Water and Environment Sector Performance Report 2019; MWE:Kampala, Uganda, 2019.
21. Amoti, C.K.; Moses, O.; Harrison, N.W.; Moenga, N.J.; Edward, K.; Simon, N. The Republic of Uganda: Feasibility Study andDetailed Engineering Design for Bukedea Water Supply and Sanitation System in Bukedea District in Uganda Proposed BukedeaGravity Flow Water Supply Sanitation System (Bukedea District in Uganda). Ministry of Water and Environment Uganda, 2015.Consultant: Harrison W. Ngirigacha. Available online: www.mwe.og.ug/sites/default/files/Bukedea%20GFS%20ESIA%20Report.pdf (accessed on 7 May 2018).
22. Fodor, M.; Messerli, H. Economic and Statistical Analysis of Tourism in Uganda; The World Bank Group Washington: Washington,DC, USA, 2013.
23. UBOS. National Population and Housing Census 2014; UBOS: Kampala, Uganda, 2014.24. FAO. Food and Agricultural Organization of the United Nations: Small Family Farms Country Factsheet; FAO: Kampala, Uganda, 2018.
Available online: http://www.fao.org/3/i8359en/I8359EN.pdf (accessed on 7 May 2018).25. Stampone, M.; Hartter, J.; Chapman, C.; Ryan, S. Trends and variability in localized precipitation around Kibale National Park,
Uganda, Africa. Res. J. Environ. Earth Sci. 2011, 3, 14–23.26. Egeru, A.; Barasa, B.; Nampijja, J.; Siya, A.; Makooma, M.T.; Majaliwa, M.G.J. Past, present and future climate trends under varied
representative concentration pathways for a sub-humid region in Uganda. Climate 2019, 7, 35. [CrossRef]27. Hare, W. Assessment of Knowledge on Impacts of Climate Change—Contribution to the Specification of Art. 2 of the UNFCCC: Im-
pacts on Ecosystems, Food Production, Water and Socio-Economic Systems; Wissenschaftlicher Beirat der Bundesregierung GlobaleUmweltveränderungen Geschäftsstelle Reichpietschufer 60–62; WBGU: Berlin, Germany, 2003.
28. Salehnia, N.; Bannayan, M.; Co, T.L.; Zarrin, A.; Hoogenboom, G. Estimation of meteorological drought indices based onAgMERRA precipitation data and station-observed precipitation data. Arid Land 2017, 9, 797–809. [CrossRef]
29. Larbi, I.; Hountondji, F.C.C.; Annor, T.; Agyare, W.A.; Gathenya, J.M.; Amuzu, J. Spatio-temporal trend analysis of rainfall andtemperature extremes in the Vea catchment, Ghana. Climate 2018, 6, 87. [CrossRef]
30. Funk, C.; Peterson, P.; Landsfeld, M.; Pedreros, D.; Verdin, J.; Shukla, S.; Husak, G.; Rowland, J.; Harrison, L.; Hoell, A.; et al. Theclimate hazards infrared precipitation with stations—new environmental record for monitoring extremes. Sci. Data 2015, 2, 1–21.[CrossRef]
31. Oriangi, G. Urban Resilience to Climate Change Shocks and Stresses in Mbale Municipality in Uganda; Dept of Physical Geography andEcosystem Science: Lund, Sweden, 2019.
32. Hayes, M.; Svoboda, M.; Whilhite, D.A.; Wilhite, D.A. Monitoring drought using the standardized precipitation index. Drought aGlob. Assess. 2000, 1, 168–180.
33. Nsubuga, F.N.W.; Mearns, K.F.; Adeola, A.M. Lake Sibayi variations in response to climate variability in northern KwaZulu-Natal,South Africa. Theor. Appl. Climatol. 2019, 137, 1233–1245. [CrossRef]
34. World Meteorological Organization. Standardized Precipitation Index User Guide; Svoboda, M., Hayes, M., Wood, D., Eds.; WorldMeteorological Organization: Geneva, Switzerland, 2012.
35. Salmi, T.; Määttä, A.; Anttila, P.; Ruoho-Airola, T.; Amnell, T. Detecting Trends of Annual Values of Atmospheric Pollutants byMann-Kendal Test and Sen’s Slope Estimates-The Excel Template Application MAKESENS; Air Quality: Helsinki, Finland, 2002.
36. Jana, C.; Alam, N.M.; Mandal, D.; Shamim, M.; Kaushal, R. Spatio-temporal rainfall trends in the twentieth century forBundelkhand region, India. J. Water Clim. Chang. 2017, 8, 441–455. [CrossRef]
37. Ndulue, E.L.; Mbajiorgu, C.C. Modeling climate and landuse change impacts on streamflow and sediment yield of an agriculturalwatershed using SWAT. CIGR J. 2018, 20, 15–25.
38. Sen, P.K. Journal of the American Statistical Estimates of the Regression Coefficient Based on Kendall’s Tau. J. Am. Stat. Assoc.1968, 63, 1379–1389. [CrossRef]
39. Majaliwa, J.G.M.; Tenywa, M.M.; Bamanya, D.; Majugu, W.; Isabirye, P.; Nandozi, C.; Nampijja, J.; Musinguzi, P.; Nimusiima,A.; Luswata, K.C.; et al. Characterization of Historical Seasonal and Annual Rainfall and Temperature Trends in SelectedClimatological Homogenous Rainfall Zones of Uganda. Glob. J. Sci. Front. Res. 2015, 15, 21.
40. Bomuhangi, A.; Nabanoga, G.; Namaalwa, J.J.; Jacobson, M.G. Local communities’ perceptions of climate variability in the Mt.Elgon region, eastern Uganda. Cogent Environ. Sci. 2016, 1–16. [CrossRef]
41. Chen, H.; Chen, A.; Xu, L.; Xie, L.; Qiao, H.; Lin, Q.; Cai, K. A deep learning CNN architecture applied in smart near-infraredanalysis of water pollution for agricultural irrigation resources. Agric. Water Manag. 2020, 240, 106303. [CrossRef]
42. Kourgialas, N.N.; Karatzas, G.P.; Koubouris, G.C. A GIS policy approach for assessing the effect of fertilizers on the quality ofdrinking and irrigation water and wellhead protection zones (Crete, Greece). J. Environ. Manag. 2017, 189, 150–159. [CrossRef][PubMed]
43. Benedict, H.M. Effect of Day Length and Temperature on the. J. Agric. Res. 1940, 61, 9.44. Sawan, Z.M. Climatic variables: Evaporation, sunshine, relative humidity, soil and air temperature and its adverse effects on
cotton production. Inf. Process. Agric. 2018, 5, 134–148. [CrossRef]

Water 2021, 13, 1834 17 of 17
45. Wang, H.; Zhong, S.; Tao, Z.; Dai, J.; Ge, Q. Changes in flowering phenology of woody plants from 1963 to 2014 in North China.Int. J. Biometeorol. 2019, 63, 579–590. [CrossRef]
46. Mubiru, D.N.; Radeny, M.; Kyazze, F.B.; Zziwa, A.; Lwasa, J.; Kinyangi, J.; Mungai, C. Climate trends, risks and coping strategiesin smallholder farming systems in Uganda. Clim. Risk Manag. 2018, 22, 4–21. [CrossRef]
47. Godfrey, H.; Patrick, K.; Judith, K.; Nicholas, O.D.; Lilian, N.; William, W. Predicting the Response of Insect Pests and Diseases ofArabica Coffee to Climate Change along an Altitudinal Gradient in Mt. Elgon Region, Uganda. J. Agric. Environ. Sci. 2018, 7,2334–2412.
48. MDA Information Systemsm LLC. A Modernization Plan for Uganda’s Meteorological Services; Global Facility for Disaster Reductionand Recovery (GFDRR): Kampala, Uganda, 2013.
Related Documents