BBA-13 Financial Management Vardhaman Mahaveer Open University, Kota

Welcome message from author
This document is posted to help you gain knowledge. Please leave a comment to let me know what you think about it! Share it to your friends and learn new things together.
Transcript
BBA-13
Financial Management
Vardhaman Mahaveer Open University, Kota
5. Prof. Shyam Gopal SharmaProfessor & Former Head,Deptt. of ABST,University of Rajasthan, Jaipur (Raj.)
6. Prof. M.C. GovilPrincipal,Govt. Women Engineering College, Ajmer (Raj.)
7. Prof. Navin MathurProfessor, Deptt. of Business AdministrationUniversity of Rajasthan, Jaipur (Raj.)
8. Prof. Karunesh SaxenaProfessor, Faculty of Management Studies,Mohanlal Sukhadia University, Udaipur (Raj.)
1. Prof. Parimal H. VyasDean & Head,Deptt. of Commerce and Business Management,Faculty of Commerce,The M.S. University of Baroda, Vadodara (Gujarat)
2. Prof. R.C.S. RajpurohitDean & Professor,Deptt. of Business Administration,J.N.V. University, Jodhpur (Raj.)
3. Prof. N.D. MathurProfessor, Deptt. of EAFMUniversity of Rajasthan, Jaipur (Raj.)
4. Prof. Rajeev JainFormer Director & Dean,Faculty of Management Studies,J.R.N. Rajasthan Vidyapeeth University, Udaipur (Raj.)
Prof. (Dr.) L.R. Gurjar Director (Academic)
Vardhaman Mahaveer Open University,Kota
Prof. (Dr.) Ashok SharmaVice-Chancellor
Vardhaman Mahaveer Open University,Kota
Course Development CommitteeChairmanProf. (Dr.) Naresh DadhichVice-ChancellorVardhaman Mahaveer Open University, Kota
Convener and MembersSubject Co-ordinatorDr. R. K. JainAssociate Professor, Department of Management,Vardhaman Mahaveer Open University, Kota
Members:
Editing and Course WritingEditorDr. Anurodh GodhaAssistant Professor, School of Commerce & Management,Vardhaman Mahaveer Open University, Kota
Writers:
Academic and Administrative Management
Dr. Subodh AgnihotriAsstt. Director , MP&D
Vardhaman Mahaveer Open University,Kota
Prof. (Dr.) Karan Singh Director, MP&D
Vardhaman Mahaveer Open University,Kota
PRODUCTION ISBN -
All rights reserved. No part of this book may be reproduced in any form by mimeograph or any othermeans without permission in writing from the V.M. Open University, KotaPrinters:
1. Dr. Meenu Maheshwari (Unit no. 1, 2)2. Dr. Ashok Gupta (Unit no. 3)3. CA Anirudh Dani (Unit no. 4, 7)4. Dr. Shailash Mathur (Unit no. 5, 6)5. Dr. Prerna Jain (Unit no. 8, 9)
6. Prof. Raman Kumar Dave (Unit no. 10, 11)7. Dr. Neel Kamal Purohit (Unit no 12, 13)8. Dr. Usha Shankar (Unit 14, 15)9. Prof. Shiv Prasad (Unit 16, 17)
Vardhman Mahaveer Open University, KotaBBA-13
Financial Management
CONTENTS
Unit No. Name of Unit Page No.
Unit - 1 Financial Management: An Introduction 1
Unit - 2 Financial Statements 13
Unit - 3 Techniques of Financial Statement Analysis 28
Unit - 4 Ratio Analysis 39
Unit - 5 Funds Flow Statement 57
Unit - 6 Cash Flow Statement 74
Unit - 7 Management of Working Capital 89
Unit - 8 Management of Inventories 104
Unit - 9 Management of Cash and Marketable Securities 121
Unit - 10 Cost of Capital 136
Unit - 11 Capital Budgetings 165
Unit - 12 Dividend Policy 197
Unit - 13 Operating and Financial Leverages 210
Unit - 14 Capital Structure: Theories 222
Unit - 15 Capital Structure: Planning 236
Unit - 16 Sources of Long-term Finance 247
Unit - 17 Sources of Short-term Finance 264
1
Unit - 1 : Financial Management: An Introduction
Structure of Unit:
1.0 Objectives1.1 Meaning and Definition of Financial Management1.2 Nature or Characteristics of Financial Management1.3 Objectives of Financial Management1.4 Approaches of Financial Management1.5 Scope or Functions of Financial Management1.6 Importance of Financial Management1.7 Limitations of Financial Management1.8 Functions of Chief Financial Officer1.9 Changing Role of Financial Manager1.10 Summary1.11 Keywords1.12 Self Assessment Questions1.13 Reference Books
1.0 Objectives
After completing this unit, you would be able to:
Know the meaning and nature of financial management. Understand the approaches of financial management. Know the functions of financial management. Understand the role of financial manager.
1.1 Meaning and Definition of Financial Management
Production, marketing and finance are three important line functions of an organisation but finance is themost important function which is treated as the life blood of any organisation. Without effective utilization offinance, no business can survive long. Meaning of Financial Management can be best described by thewords ‘Effective Utilization of Funds’.Financial Management is mainly a part of general managementwhich utilizes available financial funds in optimum way for smooth functioning of business. It starts withplanning, administration and control of funds. The nature of Financial Management refers to its function,scope and objectivity. Finance is required till business is running and without proper management of fundssurvival becomes a difficulty. Long run business requires huge capital fund for their business and withoutproper discipline it becomes difficult to procure and allocate funds. Anything to do with cost, finance,money, capital are all covered under the ‘financial management’. By implementing proper system of financialmanagement business can invest in profitable avenues which yields high returns. Financial management alsotakes into account the future requirement of funds and keeps proper arrangements in present for the same.Hence the financial management is the study of income, expenses, capital investments, capital issues etc.
In the words of Ezra Soloman, “Financial Management is concerned with the efficient use of an importanteconomic resource, namely capital fund”.
Weston and Brigham states that “Financial Management is an area of financial decision making harmonizingindividual motives and enterprise goals.”
2
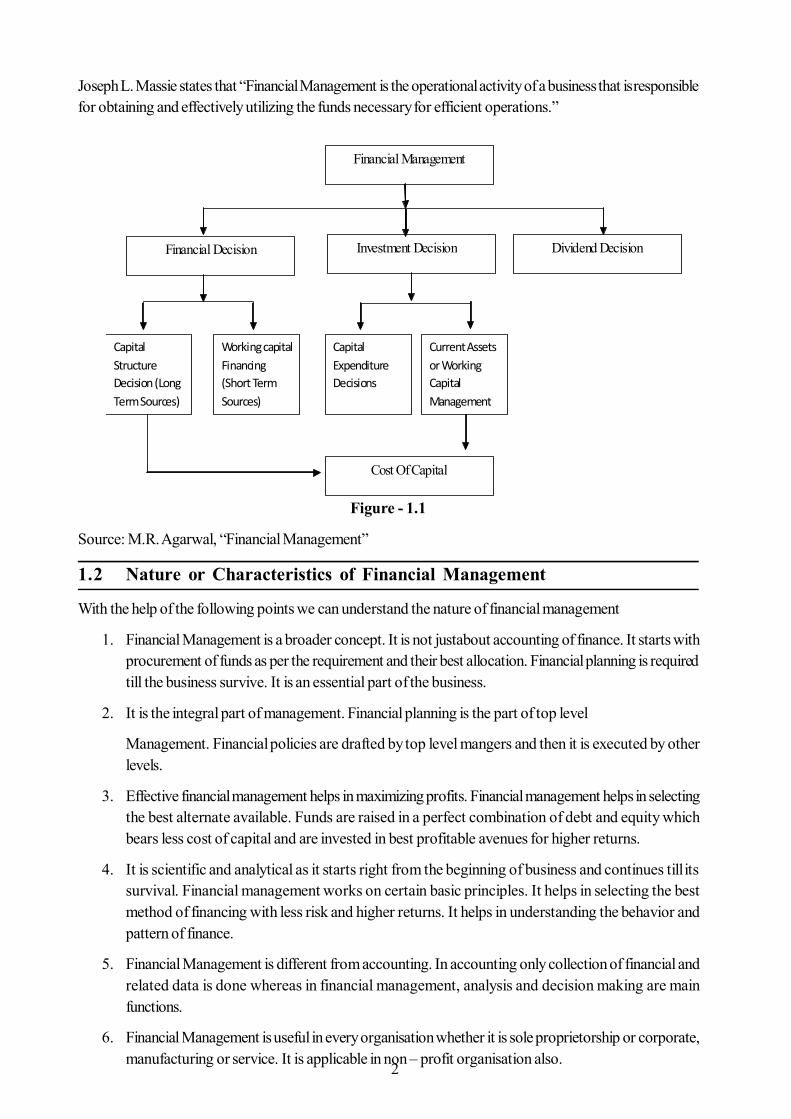
Joseph L. Massie states that “Financial Management is the operational activity of a business that is responsiblefor obtaining and effectively utilizing the funds necessary for efficient operations.”
Figure - 1.1
Source: M.R. Agarwal, “Financial Management”
1.2 Nature or Characteristics of Financial Management
With the help of the following points we can understand the nature of financial management
1. Financial Management is a broader concept. It is not justabout accounting of finance. It starts withprocurement of funds as per the requirement and their best allocation. Financial planning is requiredtill the business survive. It is an essential part of the business.
2. It is the integral part of management. Financial planning is the part of top level
Management. Financial policies are drafted by top level mangers and then it is executed by otherlevels.
3. Effective financial management helps in maximizing profits. Financial management helps in selectingthe best alternate available. Funds are raised in a perfect combination of debt and equity whichbears less cost of capital and are invested in best profitable avenues for higher returns.
4. It is scientific and analytical as it starts right from the beginning of business and continues till itssurvival. Financial management works on certain basic principles. It helps in selecting the bestmethod of financing with less risk and higher returns. It helps in understanding the behavior andpattern of finance.
5. Financial Management is different from accounting. In accounting only collection of financial andrelated data is done whereas in financial management, analysis and decision making are mainfunctions.
6. Financial Management is useful in every organisation whether it is sole proprietorship or corporate,manufacturing or service. It is applicable in non – profit organisation also.
Financial Management
Financial Decision Investment Decision Dividend Decision
Capital Structure Decision (Long Term Sources)
Working capital Financing (Short Term Sources)
Capital Expenditure Decisions
Current Assets or Working Capital Management
Cost Of Capital
3
7. Financial Management is helpful for top management in decision making.
1.3 Objectives of Financial Management
Objectives may be expressed as goals, purpose, targets, aims to be attained over a period of time. Theyalso provide the standards to be judged or evaluate the performance of a business.
The main purpose of financial management is to help the firm in achievement of its predetermined objectives.
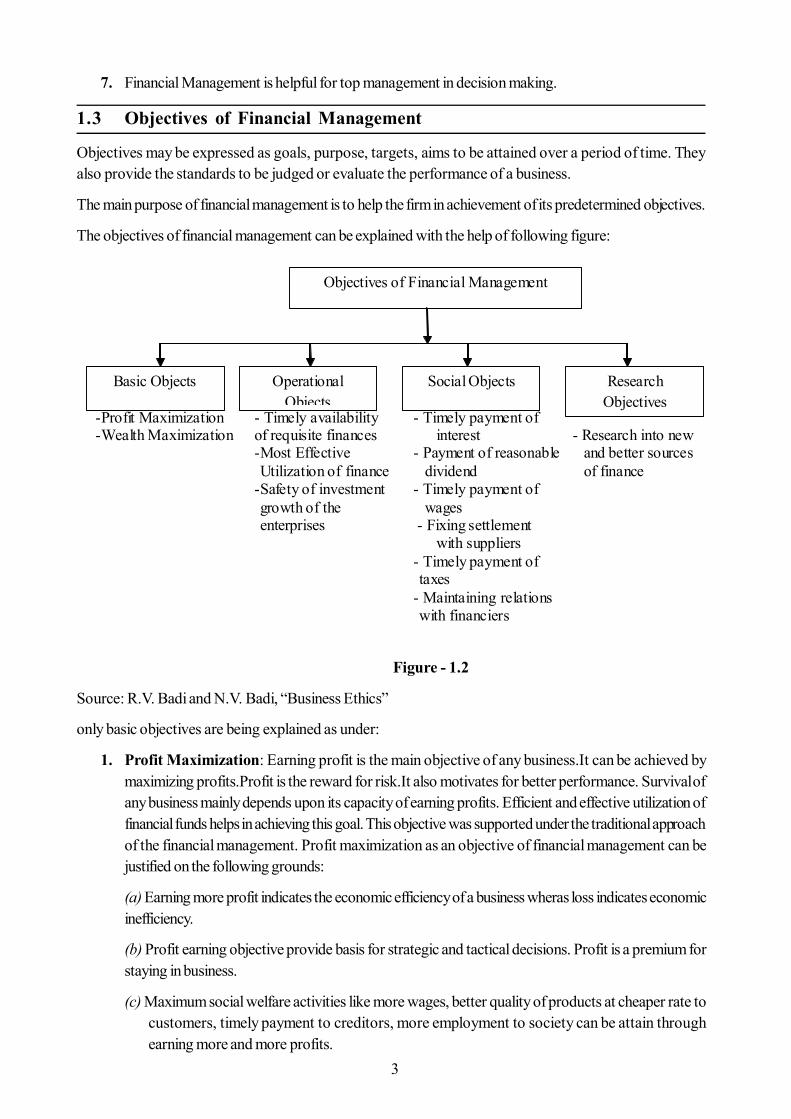
The objectives of financial management can be explained with the help of following figure:
Figure - 1.2
Source: R.V. Badi and N.V. Badi, “Business Ethics”
only basic objectives are being explained as under:
1. Profit Maximization: Earning profit is the main objective of any business.It can be achieved bymaximizing profits.Profit is the reward for risk.It also motivates for better performance. Survival ofany business mainly depends upon its capacity of earning profits. Efficient and effective utilization offinancial funds helps in achieving this goal. This objective was supported under the traditional approachof the financial management. Profit maximization as an objective of financial management can bejustified on the following grounds:
(a) Earning more profit indicates the economic efficiency of a business wheras loss indicates economicinefficiency.
(b) Profit earning objective provide basis for strategic and tactical decisions. Profit is a premium forstaying in business.
(c) Maximum social welfare activities like more wages, better quality of products at cheaper rate tocustomers, timely payment to creditors, more employment to society can be attain throughearning more and more profits.
- Profit Maximization - Timely availability - Timely payment of - Wealth Maximization of requisite finances interest - Research into new
- Most Effective - Payment of reasonable and better sources Utilization of finance dividend of finance
- Safety of investment - Timely payment of growth of the wages enterprises - Fixing settlement with suppliers
- Timely payment of taxes
- Maintaining relations with financiers
Objectives of Financial Management
Basic Objects Research Objectives
Social Objects Operational Objects
4
(d) Profits can be said as major source of incentives in a business. If there is no profit incentives ina business, then there will be no competition and thus all the development process will be zero.
(e) The objective of profit maximization seems rational because it is a device which stimulatesmankind into channels of useful services.
But like traditional approach it has been also criticized on some grounds which are as follows:
It is narrow concept. It gives stress only on generating higher profits. It is not clear under thisconcept as which profit should be focused like gross profit, net profit, profit before tax or profitafter tax.
Earning profits give benefits only to its owners. It does not add much benefit to the society. Socialresponsibility is not fulfilled under this concept.
Decisions taken for earning profits sometimes endangers the stability of the long run of business.
The biggest disadvantage of this objective is that it ignores time value of money. Profits generatedtoday do not have the same value as it is today. Rupee earned today has more value than its valueafter one or two years.
This concept registers progress in monetary terms only. It completely ignores qualitative aspect.Contribution of humans is ignored under this.
The objective of profit maximisation ignores the time value of money. Because profit received todayis not same as it received after 1 or 2 years.
It is vague term as it do not clear that profit increase in short term or long term.
Earning more and more profit may be immoral and leads to corrupt practices.
Profit maximisation objective sometimes degrades human ethical values.
The objective of profit maximisation ignores social responsibility of a business.
(f) Wealth Maximization: The profit maximisation objective is not only a vague term but it alsoignores risk and time value of money. Therefore, the wealth maximisation objective is considered asbasic objective rather than profit maximisation. According to Ezra Soloman, the ultimate objectiveof financial management should be maximisation of wealth. It is modern approach of FinancialManagement. It is also known as ‘Value maximizing’ or ‘Net worth Maximizing’. FinancialManagement helps in effective utilisation of its assets which is viewed in terms of benefits it canproduce.Wealth maximisation objective means maximizing the wealth of the shareholders, byincreasing the value of the firm. Increasing value of the firm means increasing the market price of acompany’s share. The value of the firm is affected by many ways i.e. the firm’s growth, risk acceptableto the investors, efficiency and effectiveness of the firm, dividend policy etc.
A firm must consider following points to increase market value of shares.
Customer should be managed properly. Maintain satisfactory dividend policy. Increase employees satisfaction level. Enhance information system. Improve quality of the products. Increase the market share by launching new products.
5
Wealth maximizing policy advocates following objectives:-
It ensures long run survival and growth of the business. It increases the value of shares as high dividends are distributed under this. Dividend policy is designed in such a way to satisfy shareholders. A perfect combination of debt and equity mix is carried out. It reduces risk as projects having positive net present value are selected after careful and
detailed investigation. Stakeholders are also satisfied as they feel connected with business.
1.4 Approaches of Financial Management
1. Traditional Approach: Success of any business depends upon profit which is directly relatedwith financial management. Financial Management starts with acquisition, financing and managementof business assets. By investing funds in best ventures a firm can maximize its wealth by obtaininghigher returns. Traditional concept shows one basic function of financial management i.e. procurementof funds. Traditional approach of financial management is limited and narrow.It limits the role offinance manager to collecting funds. According to Hunt, William and Donaldson”the finance functionwas viewed as the task of providing the funds needed by the enterprise on the terms most favorablein the light of the objective of the business.” Following are the functions of financial managementunder traditional approach:
(a) Making arrangements of funds keeping in mind the short term and long term requirement of thebusiness. Appropriate financial institutions are selected which suits the capacity of the enterprise tobear the cost.
(b) Making perfect combination of debt and equity as a source of internal finance. Funds aremobilized through equity, preference, debentures, bonds etc. in a perfect combination which bearsless cost of capital.
Following are the grounds on which this approach has been criticized According to this approach financial management does not get involve in day to day businessactivities. Under this, funds are only generated. Proper attention is not given towards theirappropriate use. Allocation of funds is not considered here.It does not form part of integral management. Once funds are generated finance managers arecalled up again only when additional funds are required for promotion, expansion, merging,amalgamation etc. It makes arrangements of funds only for long term requirement. Short term requirements areignored. There are many day-to-day problems related with finance which are not coveredunder this approach
According to Soloman ‘central issues of the financial management’ are Should an enterprise commit capital funds to certain purposes? Do the expected returns met financial standards of performance? How should these standards be set and what is the cost of capital funds to the enterprise? How does the cost vary with the mixture of financing method used?
Keeping in mind, the narrow concept of traditional approach and requirement of modern competitivesituation of business new concept was developed.
6
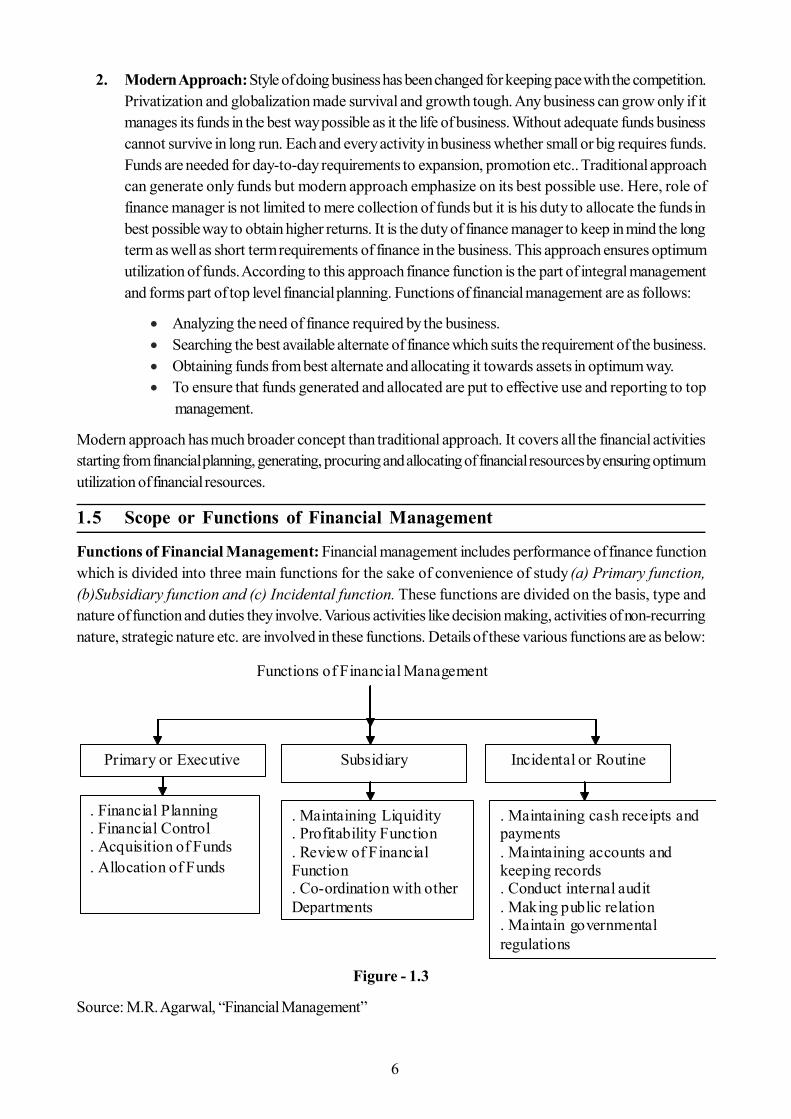
2. Modern Approach: Style of doing business has been changed for keeping pace with the competition.Privatization and globalization made survival and growth tough. Any business can grow only if itmanages its funds in the best way possible as it the life of business. Without adequate funds businesscannot survive in long run. Each and every activity in business whether small or big requires funds.Funds are needed for day-to-day requirements to expansion, promotion etc.. Traditional approachcan generate only funds but modern approach emphasize on its best possible use. Here, role offinance manager is not limited to mere collection of funds but it is his duty to allocate the funds inbest possible way to obtain higher returns. It is the duty of finance manager to keep in mind the longterm as well as short term requirements of finance in the business. This approach ensures optimumutilization of funds. According to this approach finance function is the part of integral managementand forms part of top level financial planning. Functions of financial management are as follows:
Analyzing the need of finance required by the business. Searching the best available alternate of finance which suits the requirement of the business. Obtaining funds from best alternate and allocating it towards assets in optimum way. To ensure that funds generated and allocated are put to effective use and reporting to top
management.
Modern approach has much broader concept than traditional approach. It covers all the financial activitiesstarting from financial planning, generating, procuring and allocating of financial resources by ensuring optimumutilization of financial resources.
1.5 Scope or Functions of Financial Management
Functions of Financial Management: Financial management includes performance of finance functionwhich is divided into three main functions for the sake of convenience of study (a) Primary function,(b)Subsidiary function and (c) Incidental function. These functions are divided on the basis, type andnature of function and duties they involve. Various activities like decision making, activities of non-recurringnature, strategic nature etc. are involved in these functions. Details of these various functions are as below:
Figure - 1.3
Source: M.R. Agarwal, “Financial Management”
Functions of Financial Management
Primary or Executive Incidental or Routine Subsidiary
. Financial Planning
. Financial Control
. Acquisition of Funds
. Allocation of Funds
. Maintaining cash receipts and payments . Maintaining accounts and keeping records . Conduct internal audit . Making public relation . Maintain governmental regulations
. Maintaining Liquidity
. Profitability Function
. Review of Financial Function . Co-ordination with other Departments
7
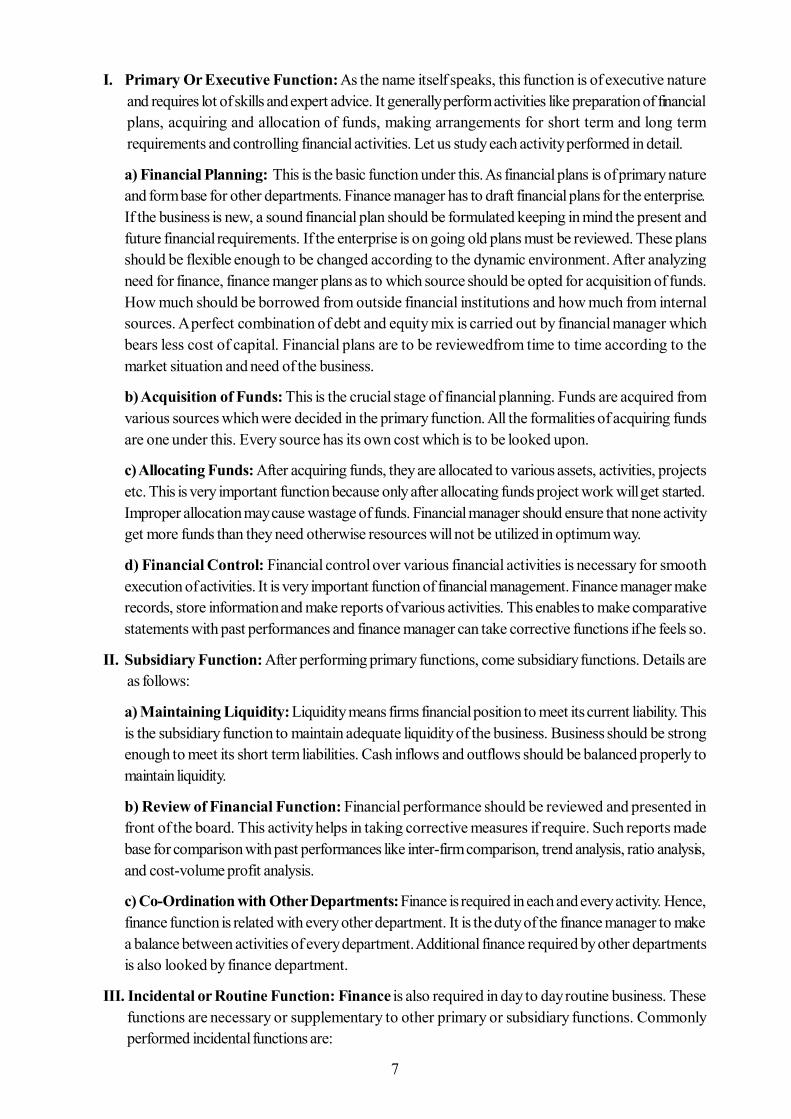
I. Primary Or Executive Function: As the name itself speaks, this function is of executive natureand requires lot of skills and expert advice. It generally perform activities like preparation of financialplans, acquiring and allocation of funds, making arrangements for short term and long termrequirements and controlling financial activities. Let us study each activity performed in detail.
a) Financial Planning: This is the basic function under this. As financial plans is of primary natureand form base for other departments. Finance manager has to draft financial plans for the enterprise.If the business is new, a sound financial plan should be formulated keeping in mind the present andfuture financial requirements. If the enterprise is on going old plans must be reviewed. These plansshould be flexible enough to be changed according to the dynamic environment. After analyzingneed for finance, finance manger plans as to which source should be opted for acquisition of funds.How much should be borrowed from outside financial institutions and how much from internalsources. A perfect combination of debt and equity mix is carried out by financial manager whichbears less cost of capital. Financial plans are to be reviewedfrom time to time according to themarket situation and need of the business.
b) Acquisition of Funds: This is the crucial stage of financial planning. Funds are acquired fromvarious sources which were decided in the primary function. All the formalities of acquiring fundsare one under this. Every source has its own cost which is to be looked upon.
c) Allocating Funds: After acquiring funds, they are allocated to various assets, activities, projectsetc. This is very important function because only after allocating funds project work will get started.Improper allocation may cause wastage of funds. Financial manager should ensure that none activityget more funds than they need otherwise resources will not be utilized in optimum way.
d) Financial Control: Financial control over various financial activities is necessary for smoothexecution of activities. It is very important function of financial management. Finance manager makerecords, store information and make reports of various activities. This enables to make comparativestatements with past performances and finance manager can take corrective functions if he feels so.
II. Subsidiary Function: After performing primary functions, come subsidiary functions. Details areas follows:
a) Maintaining Liquidity: Liquidity means firms financial position to meet its current liability. Thisis the subsidiary function to maintain adequate liquidity of the business. Business should be strongenough to meet its short term liabilities. Cash inflows and outflows should be balanced properly tomaintain liquidity.
b) Review of Financial Function: Financial performance should be reviewed and presented infront of the board. This activity helps in taking corrective measures if require. Such reports madebase for comparison with past performances like inter-firm comparison, trend analysis, ratio analysis,and cost-volume profit analysis.
c) Co-Ordination with Other Departments: Finance is required in each and every activity. Hence,finance function is related with every other department. It is the duty of the finance manager to makea balance between activities of every department. Additional finance required by other departmentsis also looked by finance department.
III. Incidental or Routine Function: Finance is also required in day to day routine business. Thesefunctions are necessary or supplementary to other primary or subsidiary functions. Commonlyperformed incidental functions are:
8
Maintaining cash receipts, payments and checking cash balances. Maintaining accounts and keeping records Conducting internal audit Making public relation Keeping in mind the present governmental regulations.
John J. Hampton has written about the following functions in Handbook for financial decision makers:
(1) Managing funds,
(2) Managing assets,
(3) Liquidity functions
(a) Forecasting cash flows(b) Raising of funds(c) Managing the flow of internal funds
(4) Profitability functions
(a) Cost control(b) Pricing(c) Forecasting future profits(d) Measuring cost of capital
1.6 Importance of Financial Management
Maximum utilization of financial resources to earn maximum profit is the main aim of financial management.The success of every business depends upon sufficient finance as per its requirement. The study of financialmanagement is indispensible for both profit earning and non – profit earning organisations. Even the industrialprogress of the country depends upon effective financial management.
In the words of Ezra Soloman, “Financial Management is properly viewed as an integral part of overallmanagement rather than as a staff specially concerned with fund raising operations. In addition to raisingfunds, financial management is directly concerned with production, marketing and other functions within anenterprise whether decisions are made about the acquisitions or distribution of assets.” The same viewshave also been expressed by Irwin Friend who said, “a firm’s success and even survival, its ability andwillingness to maintain production and to invest in the fixed or working capital are to a very considerableextent, determined by its financial policies, both past and present.”
Not only finance officers are related with financial management but every activity of business planning andcontrol has become very significant. As Husband and Dockery have said, “something must direct the flowof economic activity that facilitates its smooth operations. Finance is the agent that produces this results.
Significance of financial management is being discussed under the following points:
a) Reduces Chances of Failure: Implementation of proper system of financial management bringsfinancial discipline in the organization. Every project is overlooked and carried out by detailedinvestigation which reduces chances of failure. Strong financial position ensures smooth functioningof the business.
9
b) Maximization of Returns: Good financial planning maximizes returns on investment as financialmanagement is of scientific and analytical nature. Under modern approach of financial management,main objective is of wealth maximization. These keep shareholders and other stakeholders satisfy.
c) Broader Concept: Study of financial management has its applicability to each type of businessfrom sole proprietorship to large business enterprises. It covers each and every financial activity inthe business.
d) Makes Base for Planning and Control: Financial planning forms base for planning of otherdepartments. As it is noted that each departments depends upon financial department to starts theirfunctioning. Various budget plans are drafted on the basis of financial availability.
e) Optimum and Effective Utilization of Resources: Financial planning ensures optimum utilizationof financial resources. Each and every stage is carefully planned under this beginning from generatingfunds to allocation and disposal of profits. Higher returns are expected for smooth functioning andsurvival of the business which can be only achieved by properly managing funds.
f) Useful for Stakeholders: Various stakeholders like business managers, investors, financialinstitutions, economist, politicians etc. are always interested in knownig financial position of thecompany as they maintain financial relation with business in some way.
1.7 Limitations of Financial Management
Besides its above importance, it has some limitations which are as follows
a) Sometimes it becomes difficult to compute the effect of financial decisions on various otherdepartments. It is very complex procedure which requires careful analysis.
b) It requires deep knowledge of finance to perform various finance functions. No professional can beexpert in each and every aspect of finance behavior which limits its skills.
c) In India, financial management is still in its developing stage. We lack in expertise knowledge whichlimits the full use of the subject.
d) Sometimes financial decisions may get affected by the personal point of view of the finance officer.It is human nature which sometimes gets biased which may sometimes adversely affect the financialdecision.
e) Proper implementation of financial management is of expensive nature. It is not possible for thesmall enterprise to appoint and get services of experts nor they implement proper system of financialmanagement
1.8 Functions of Chief Financial Officer
Every organization has finance head as ‘Chief Financial Officer’. Division of responsibility has createdpost for this officer. This is also called ‘Director of Finance’. Chief Financial Officer (CFO) has differentfunctions depending upon the size, nature and type of business. Basic function of CFO is as follows:
Formation of Financial Policies and Forecasting: This is the main function of CFO to makesound financial policies keeping in mind the nature and size of the business, long term financial goalsand objectives of the business. Policies must be dynamic enough to face dynamic business environment.It also includes analyzing the need of fund and its source from where it is to be raised.
10
Managing Fund: Funds are needed to be managed for fulfilling business objective. It starts withacquisition of funds which involve generating or mobilizing funds from various sources. Beforethis, a detailed study is carried out of available alternatives and a best combination is selected havingminimum cost. After this allocation of funds is done which means effective distribution of acquiredfunds to various projects. This stage is very important because if allocation or distribution is notdone properly than desired objectives will not be achieved. Utilization of funds comes after theabove which means having proper control over cash flows and inflows.
Appropriate Disposal of Profits is very important stage under financial management as it decidesthe future of the company. After generating profits, it becomes very important to invest and distributeit in optimum way. Appropriate profits should be retained in the business for future requirementsand satistfactory amount should be distributed among shareholders to keep share price up anshareholders happy.
It is the primary duty of CFO to report to the top management about the financial position of thecompany. Current year progress report compare with past performances must be drafted andsubmitted so that an evaluation can be made and necessary steps should be taken for future courseof action.
Keeping an Eye on Marketis another important function of done by CFO. Keeping updates ofdynamic environment helps in surviving competition. Global market makes it tough in long runbusiness to stand without support. A CFO makes financial plans in such a way to handle competition.
Making Relations with Financial resourcesenables CFO to raise require funds easily fromfinancial institutions and other sources. Good relations with outside parties enhance credibility of thebusiness and also ensures steadily arrangement of funds required in future.
CFO is not only accountable to parties from which it generates funds but he Dischargehis DutyTowards Various Partieslike creditors , suppliers, debtors in many ways.
Modern approach of financial management has objective of maximization of shareholders’ wealth.CFO formulates policies in such a way to enhance shareholders wealth and thus achieving its objective.This is also important for the image of the business in the market as it appreciates market price andgoodwill.
1.9 Changing Role of Financial Manager
In this fast changing market, role of finance manger becomes very challenging. It is in the hands of financemanager to keep financial health of the company in good position. Future is uncertain. Unforeseen situationdemands to keep proper arrangements in case of their occurrence. Role of CFO has been changed by thetimes. Earlier it was limited to accounting, auditing, budgeting, mobilizing etc. But today his role and powerhas gone far beyond. Today’s world is of information technology, rapid computing and tele communication.Globalization makes it easy to approach to latest upgrades. In the past few years role of CFO has beencriticized because of their doubtful role in scandals like Enron, Global Crossing, Tyco, WorldCom etc.Following are the main challenges faced by CFO in present context.
1. Evaluating Financial Statements: Company’s financial statements is its face. Financial statementsshows perfect picture about financial position, mission and vision, future project etc. CFO mustensure that financial statements are prepared in such a way that other departments and other interestedparties can avail information easily by reading them. Meaningful statements are also helpful inperformance measurement with past results.
11
2. Maintaining Cash Flows: A CFO should strike a balance between cash inflows and outflows formaintaining liquidity. CFO must ensure that liquidity is maintained adequately. Proper relations shouldbe maintained with financial resources like banks, investors, vendors etc. so that they can also becalled at the time of emergencies.
3. Risk Management: A CFO should be aware of external and internal risks that can cause threat tothe organization. It becomes necessary to make financial plans risk proof in dynamic market situation.A CFO must keep himself aware about the market situation and should have knowledge of riskmanagement tools so that he can use them when time comes.
1.10 Summary
Financial Management is the most important functional area of business management. It is mainly relatedwith the acquisition and profitable use of funds. Now a days it is an indispensable and in continous process.
In the changing business scenario, wealth maximisation is considered as the basic objective of financialmanagement, rather than profit maximisation.Sound financial management is the index of the success of anenterprise. Financial management includes mainly three types of function viz: primary function, subsidiaryfunction and incidental function. Primary functions includes acquisition, allocation of funds and financialplanning and controlling. Subsidiary functions are related with review of financial function and co-ordinationwith other department. Supplementary functions include maintaining accounts and keeping records. In thefield of business, functions of financial management are becoming very complex because of increasingcompetition, entry of foreign institutes, globalization of business, corporate governance, corporate scandalsetc. As a result the chief financial officer has to face many challenges. He has to ensure that company isstaying financially healthy and good governance.
1.11 Key Words
Financial Management: -financial management is the planning, organising, directing and controllingof the procurement and utilization of funds and safe disposal of profit to the end that individual,organizational and social objectives are accomplished.
Profit Maximisation: - A firm should take financial decision for maximisation of profits.
Wealth Maximization: - Wealth maximisation means to maximize the net present value of a courseof action.
Financing Decisions: - Decide about the amount of capital required; proportion of debt andequity and selection of the sources of funds.
Investment Decisions: -investment decisions mean the allocation of funds with a view to acquireassets.
Dividend Decisions: - allocation of income between its owners.
1.12 Self Assessment Questions
1. What do you mean by financial management? Explain functions and importance of financialmanagement.
2. Discuss the scope and limitations of financial management.
12
3. What do you understand by financial function? Describe various finance functions.
4. Explain as to how the Wealth Maximisation objective is superior to Profit Maximisation objective.
5. “Sound Financial Management is a key to the progress for corporations”. Explain.
6. “The importance of financial management has increased in modern time”. Elucidate.
7. Discuss the objectives and goals of financial management.
8. It has traditionally been argued that the objective of financial management is to earn profit hence theobjective of Financial Management is also profit maximisation? Comment.
9. What is financial management? How does a modern financial management differs from traditionalfinancial management?
1.13 Reference Books
- Financial Management: I.M.Pandey
- Financial Management: M.R. Agarwal
- Financial Management: M.D. Agarwal and N.P. Agarwal
- Financial Management: S.N. Maheshwari
13
Unit - 2 : Financial Statements
Structure of Unit:
2.0 Objectives2.1 Introduction2.2 Objectives of Financial Statements2.3 Nature of Financial Statements2.4 Importance of Financial Statements2.5 Limitations of Financial Statements2.6 Characteristics of Ideal Financial Statements2.7 Main Financial Statements
· Balance Sheet· Profit and Loss Account/Income Statement
2.8 Summary2.9 Key words2.10 Self Assessment Questions2.11 Reference Books
2.0 Objectives
After studying this unit, you will be able to:
Understand the meaning of financial statements; Prepare Income Statement and Balance Sheet; Identify various types of assets and liabilities; Explain the importance of financial statements.
2.1 Introduction
Manager of every firm is engaged in the process of planning and decision making. In order to take rightdecision at right time, he should have sufficient informations of past and future. Information that is mostlyused by a manager is known as financial information and this is taken from financial statements.
Financial statements contain summarised information about the firm’s financial affairs. It’s main purpose isto present the firm’s financial situation to the users. The financial statements are the end-product of thefinancial accounting process. These statements present financial information in concise and capsule form.Financial statements are prepared by top management and these should be prepared in a very carefulmanner.
According to Hampton John J., “A financial statement is an organised collection of data according to logicaland consistent accounting procedures. It’s purpose is to convey an understanding of some financial aspectsof business firm. It may show a position at a moment of time as in the case of a balance sheet, or may reveala series of activities over a given period of time, as in the case of an Income Statement”.
Thus, the term ‘financial statements’ generally refer to basic statements prepared for the purpose of externalreporting to owners, investors and creditors are (i) profit and loss or income statement (ii) balance sheet orstatement of financial position.
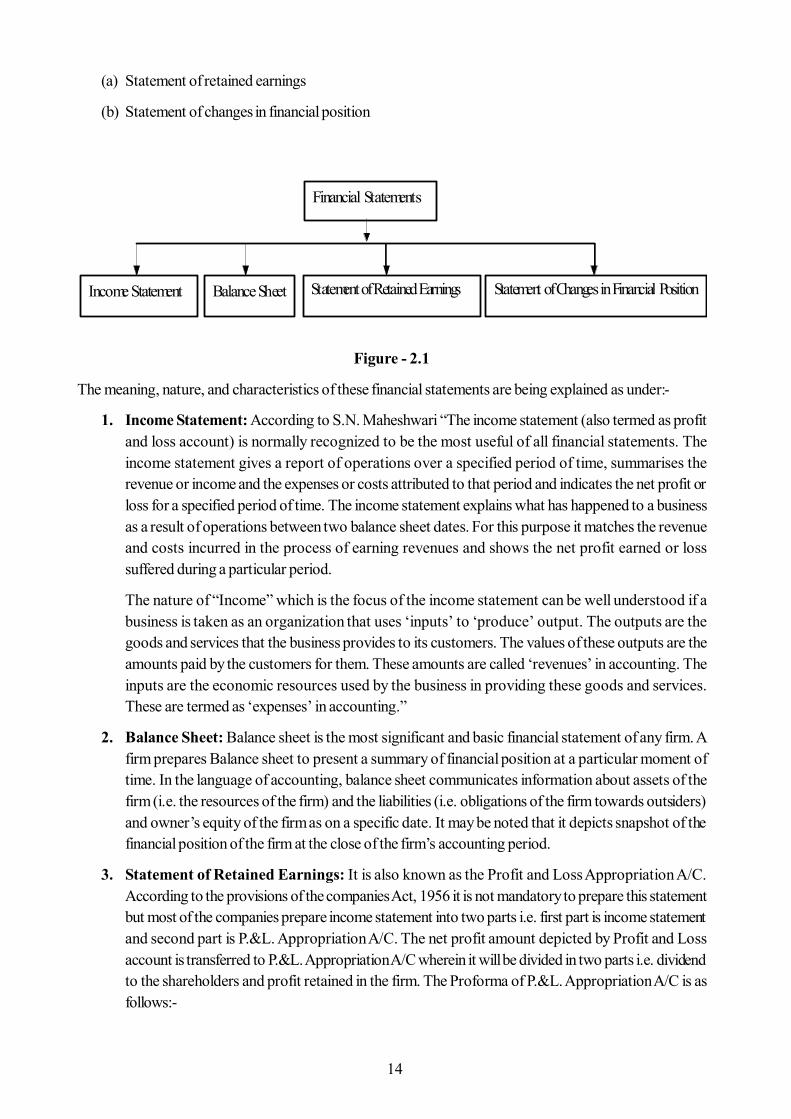
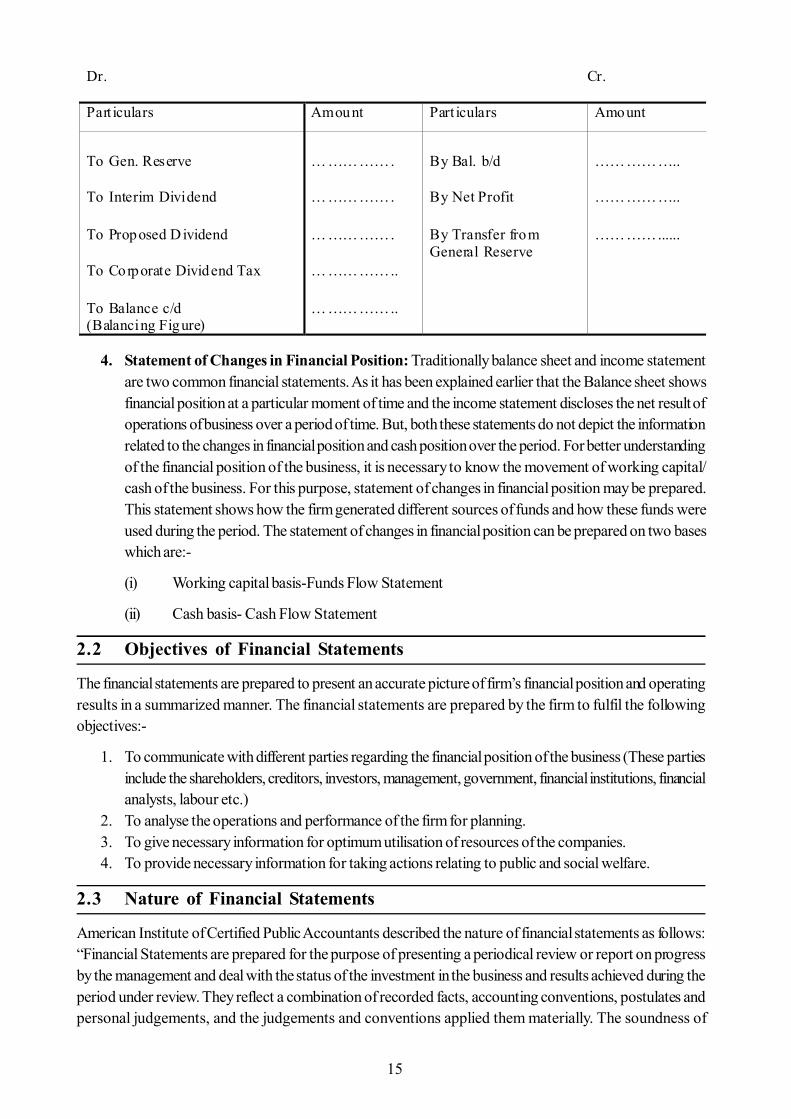
Two other key financial statements which are usually prepared by corporate firms are:-
14
(a) Statement of retained earnings
(b) Statement of changes in financial position
Figure - 2.1
The meaning, nature, and characteristics of these financial statements are being explained as under:-
1. Income Statement: According to S.N. Maheshwari “The income statement (also termed as profitand loss account) is normally recognized to be the most useful of all financial statements. Theincome statement gives a report of operations over a specified period of time, summarises therevenue or income and the expenses or costs attributed to that period and indicates the net profit orloss for a specified period of time. The income statement explains what has happened to a businessas a result of operations between two balance sheet dates. For this purpose it matches the revenueand costs incurred in the process of earning revenues and shows the net profit earned or losssuffered during a particular period.
The nature of “Income” which is the focus of the income statement can be well understood if abusiness is taken as an organization that uses ‘inputs’ to ‘produce’ output. The outputs are thegoods and services that the business provides to its customers. The values of these outputs are theamounts paid by the customers for them. These amounts are called ‘revenues’ in accounting. Theinputs are the economic resources used by the business in providing these goods and services.These are termed as ‘expenses’ in accounting.”
2. Balance Sheet: Balance sheet is the most significant and basic financial statement of any firm. Afirm prepares Balance sheet to present a summary of financial position at a particular moment oftime. In the language of accounting, balance sheet communicates information about assets of thefirm (i.e. the resources of the firm) and the liabilities (i.e. obligations of the firm towards outsiders)and owner’s equity of the firm as on a specific date. It may be noted that it depicts snapshot of thefinancial position of the firm at the close of the firm’s accounting period.
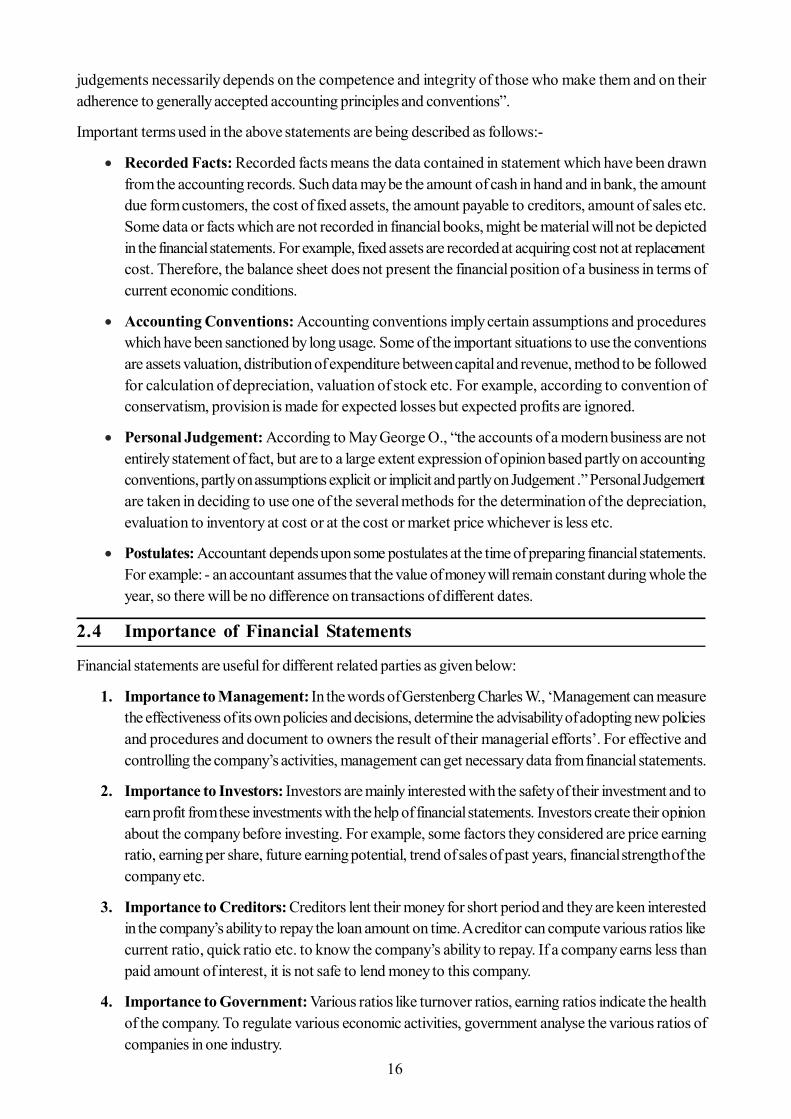
3. Statement of Retained Earnings: It is also known as the Profit and Loss Appropriation A/C.According to the provisions of the companies Act, 1956 it is not mandatory to prepare this statementbut most of the companies prepare income statement into two parts i.e. first part is income statementand second part is P.&L. Appropriation A/C. The net profit amount depicted by Profit and Lossaccount is transferred to P.&L. Appropriation A/C wherein it will be divided in two parts i.e. dividendto the shareholders and profit retained in the firm. The Proforma of P.&L. Appropriation A/C is asfollows:-
(a)
Financial Statements
Income Statement Balance Sheet Statement of Retained Earnings Statement of Changes in Financial Position
15
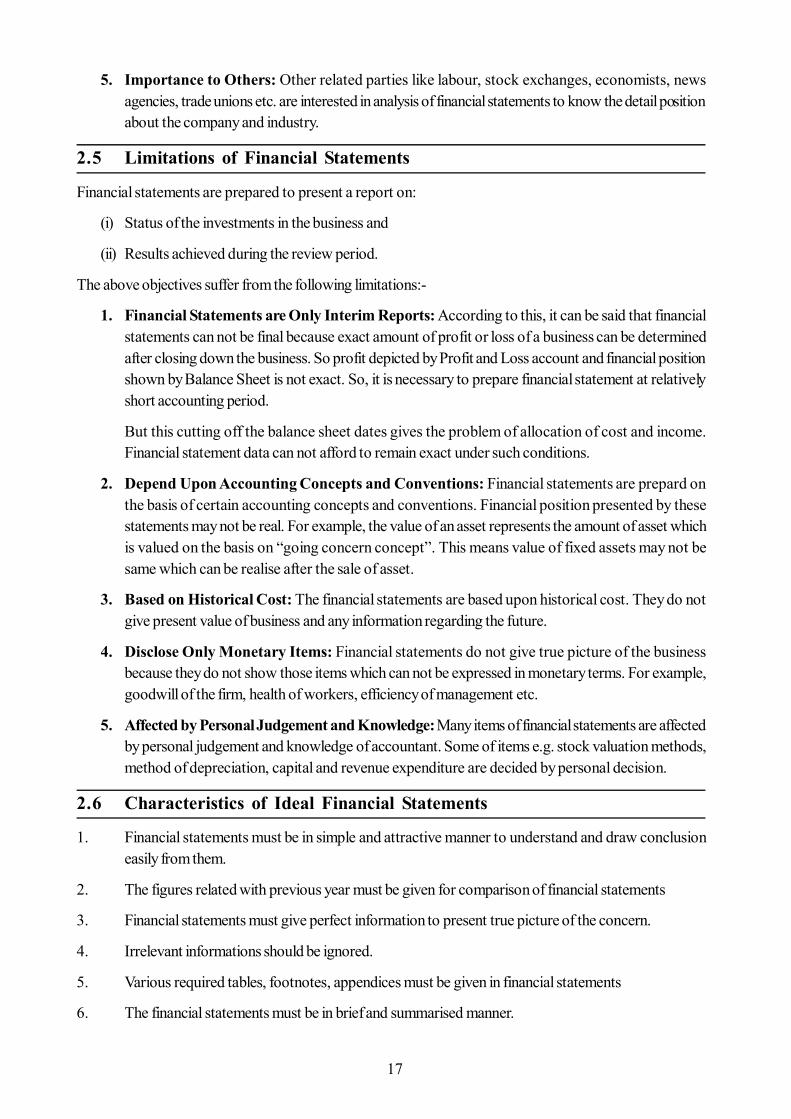
4. Statement of Changes in Financial Position: Traditionally balance sheet and income statementare two common financial statements. As it has been explained earlier that the Balance sheet showsfinancial position at a particular moment of time and the income statement discloses the net result ofoperations of business over a period of time. But, both these statements do not depict the informationrelated to the changes in financial position and cash position over the period. For better understandingof the financial position of the business, it is necessary to know the movement of working capital/cash of the business. For this purpose, statement of changes in financial position may be prepared.This statement shows how the firm generated different sources of funds and how these funds wereused during the period. The statement of changes in financial position can be prepared on two baseswhich are:-
(i) Working capital basis-Funds Flow Statement
(ii) Cash basis- Cash Flow Statement
2.2 Objectives of Financial Statements
The financial statements are prepared to present an accurate picture of firm’s financial position and operatingresults in a summarized manner. The financial statements are prepared by the firm to fulfil the followingobjectives:-
1. To communicate with different parties regarding the financial position of the business (These partiesinclude the shareholders, creditors, investors, management, government, financial institutions, financialanalysts, labour etc.)
2. To analyse the operations and performance of the firm for planning.3. To give necessary information for optimum utilisation of resources of the companies.4. To provide necessary information for taking actions relating to public and social welfare.
2.3 Nature of Financial Statements
American Institute of Certified Public Accountants described the nature of financial statements as follows:“Financial Statements are prepared for the purpose of presenting a periodical review or report on progressby the management and deal with the status of the investment in the business and results achieved during theperiod under review. They reflect a combination of recorded facts, accounting conventions, postulates andpersonal judgements, and the judgements and conventions applied them materially. The soundness of
Dr. Cr.
Part iculars Amount Part iculars Amount
To Gen. Reserve To Interim Dividend To Proposed D ividend To Corporate Dividend Tax To Balance c/d (Balancing Figure)
……………. ……………. ……………. …………….. ……………..
By Bal. b/d By Net Profit By Transfer from General Reserve
…………….. …………….. …………......
16
judgements necessarily depends on the competence and integrity of those who make them and on theiradherence to generally accepted accounting principles and conventions”.
Important terms used in the above statements are being described as follows:-
Recorded Facts: Recorded facts means the data contained in statement which have been drawnfrom the accounting records. Such data may be the amount of cash in hand and in bank, the amountdue form customers, the cost of fixed assets, the amount payable to creditors, amount of sales etc.Some data or facts which are not recorded in financial books, might be material will not be depictedin the financial statements. For example, fixed assets are recorded at acquiring cost not at replacementcost. Therefore, the balance sheet does not present the financial position of a business in terms ofcurrent economic conditions.
Accounting Conventions: Accounting conventions imply certain assumptions and procedureswhich have been sanctioned by long usage. Some of the important situations to use the conventionsare assets valuation, distribution of expenditure between capital and revenue, method to be followedfor calculation of depreciation, valuation of stock etc. For example, according to convention ofconservatism, provision is made for expected losses but expected profits are ignored.
Personal Judgement: According to May George O., “the accounts of a modern business are notentirely statement of fact, but are to a large extent expression of opinion based partly on accountingconventions, partly on assumptions explicit or implicit and partly on Judgement .” Personal Judgementare taken in deciding to use one of the several methods for the determination of the depreciation,evaluation to inventory at cost or at the cost or market price whichever is less etc.
Postulates: Accountant depends upon some postulates at the time of preparing financial statements.For example: - an accountant assumes that the value of money will remain constant during whole theyear, so there will be no difference on transactions of different dates.
2.4 Importance of Financial Statements
Financial statements are useful for different related parties as given below:
1. Importance to Management: In the words of Gerstenberg Charles W., ‘Management can measurethe effectiveness of its own policies and decisions, determine the advisability of adopting new policiesand procedures and document to owners the result of their managerial efforts’. For effective andcontrolling the company’s activities, management can get necessary data from financial statements.
2. Importance to Investors: Investors are mainly interested with the safety of their investment and toearn profit from these investments with the help of financial statements. Investors create their opinionabout the company before investing. For example, some factors they considered are price earningratio, earning per share, future earning potential, trend of sales of past years, financial strength of thecompany etc.
3. Importance to Creditors: Creditors lent their money for short period and they are keen interestedin the company’s ability to repay the loan amount on time. A creditor can compute various ratios likecurrent ratio, quick ratio etc. to know the company’s ability to repay. If a company earns less thanpaid amount of interest, it is not safe to lend money to this company.
4. Importance to Government: Various ratios like turnover ratios, earning ratios indicate the healthof the company. To regulate various economic activities, government analyse the various ratios ofcompanies in one industry.
17
5. Importance to Others: Other related parties like labour, stock exchanges, economists, newsagencies, trade unions etc. are interested in analysis of financial statements to know the detail positionabout the company and industry.
2.5 Limitations of Financial Statements
Financial statements are prepared to present a report on:
(i) Status of the investments in the business and
(ii) Results achieved during the review period.
The above objectives suffer from the following limitations:-
1. Financial Statements are Only Interim Reports: According to this, it can be said that financialstatements can not be final because exact amount of profit or loss of a business can be determinedafter closing down the business. So profit depicted by Profit and Loss account and financial positionshown by Balance Sheet is not exact. So, it is necessary to prepare financial statement at relativelyshort accounting period.
But this cutting off the balance sheet dates gives the problem of allocation of cost and income.Financial statement data can not afford to remain exact under such conditions.
2. Depend Upon Accounting Concepts and Conventions: Financial statements are prepard onthe basis of certain accounting concepts and conventions. Financial position presented by thesestatements may not be real. For example, the value of an asset represents the amount of asset whichis valued on the basis on “going concern concept”. This means value of fixed assets may not besame which can be realise after the sale of asset.
3. Based on Historical Cost: The financial statements are based upon historical cost. They do notgive present value of business and any information regarding the future.
4. Disclose Only Monetary Items: Financial statements do not give true picture of the businessbecause they do not show those items which can not be expressed in monetary terms. For example,goodwill of the firm, health of workers, efficiency of management etc.
5. Affected by Personal Judgement and Knowledge: Many items of financial statements are affectedby personal judgement and knowledge of accountant. Some of items e.g. stock valuation methods,method of depreciation, capital and revenue expenditure are decided by personal decision.
2.6 Characteristics of Ideal Financial Statements
1. Financial statements must be in simple and attractive manner to understand and draw conclusioneasily from them.
2. The figures related with previous year must be given for comparison of financial statements
3. Financial statements must give perfect information to present true picture of the concern.
4. Irrelevant informations should be ignored.
5. Various required tables, footnotes, appendices must be given in financial statements
6. The financial statements must be in brief and summarised manner.
18
2.7 Main Financial Statements
The financial statement of a business consists of two statements:-
1. Balance Sheet: The balance sheet is prepared by a firm to present financial position at a givenpoint of time. Balance sheet can be titled as statement of financial position, statement of assets andliabilities, position statement etc.
Balance sheet can be defined as:-
(i) According to Francis R. Stead, “Balance sheet is a screen picture of the financial positionof a going business at a certain moment.
(ii) According to John N. Myer, “The balance sheet is thus a detailed form of the fundamentalor structural equation, it sets forth the nature and amount of each of the various assets ofeach of liabilities, and of the proprietary interest of the owners.”
Balance sheet presents the assets and liabilities of a firm at a point of time which may be shown in either ofthe following order:
(i) Permanency order: In this method, the assets which are more permanent come first and which areless permanent appear later. Similarly permanent liabilities come first and then less permanent liabilities.
(ii)Liquidity order: In this method, the assets which are more liquid appear first, followed by otherassets which are less liquid or take long time to convert into cash. Similarly liabilities which areimmediately are payable comes first followed by liabilities which are payable later.
Characteristics of Balance Sheet
1. It is a statement not an account hence the words ‘To’ and ‘By’ are not used here.2. The balance sheet is prepared on a particular point of time so, it presents the value of assets and
liabilities of a firm on that point of time.3. Balance sheet presents the financial value of the business on going concern value.4. Both sides of balance sheet must be same i.e. Assets = Liabilities5. Balance sheet is prepared by using accounting concepts, conventions, postulates and personal
judgements etc.
Proforma of Balance Sheet
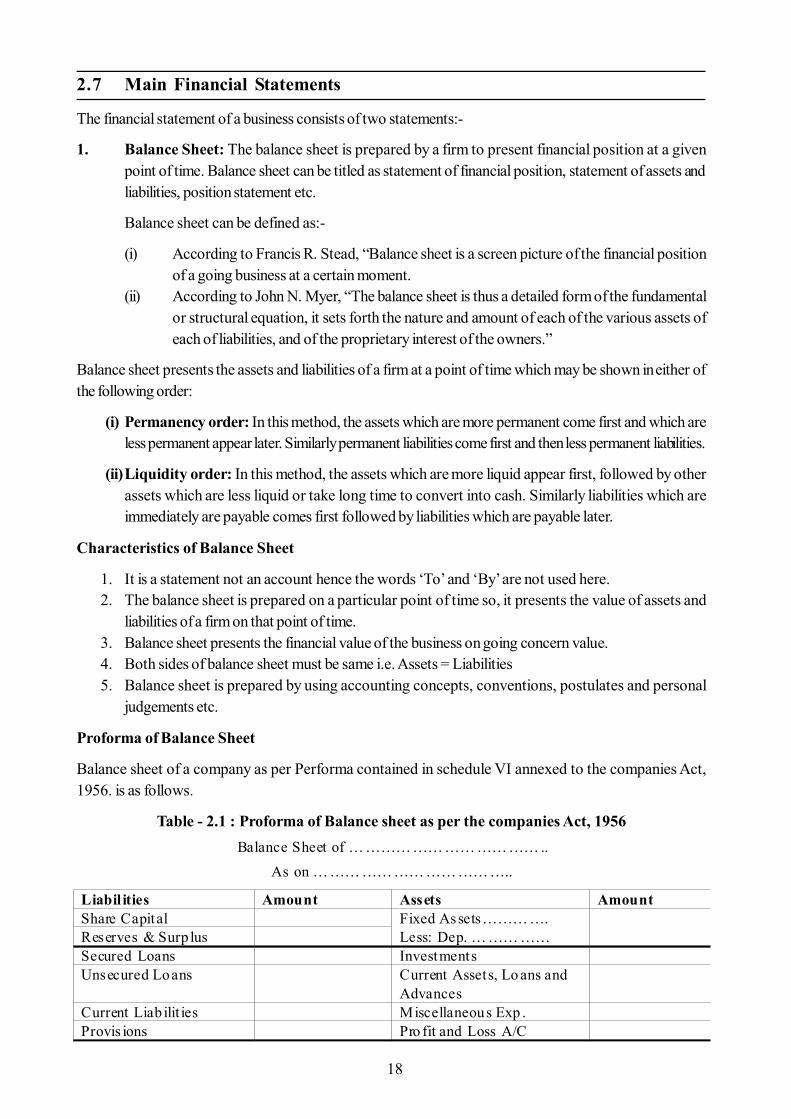
Balance sheet of a company as per Performa contained in schedule VI annexed to the companies Act,1956. is as follows.
Table - 2.1 : Proforma of Balance sheet as per the companies Act, 1956Balance Sheet of … ……… …… …… …… …… ..
As on … …… …… …… …… …… …..
Liabil ities Amount Assets Amount Share Capital Fixed Assets……… ….
Less: Dep. … …… ……
Reserves & Surp lus Secured Loans Investments Unsecured Loans Current Assets, Lo ans and
Advances
Current Liab ilit ies Miscellaneous Exp . Provis ions Pro fit and Loss A/C
19
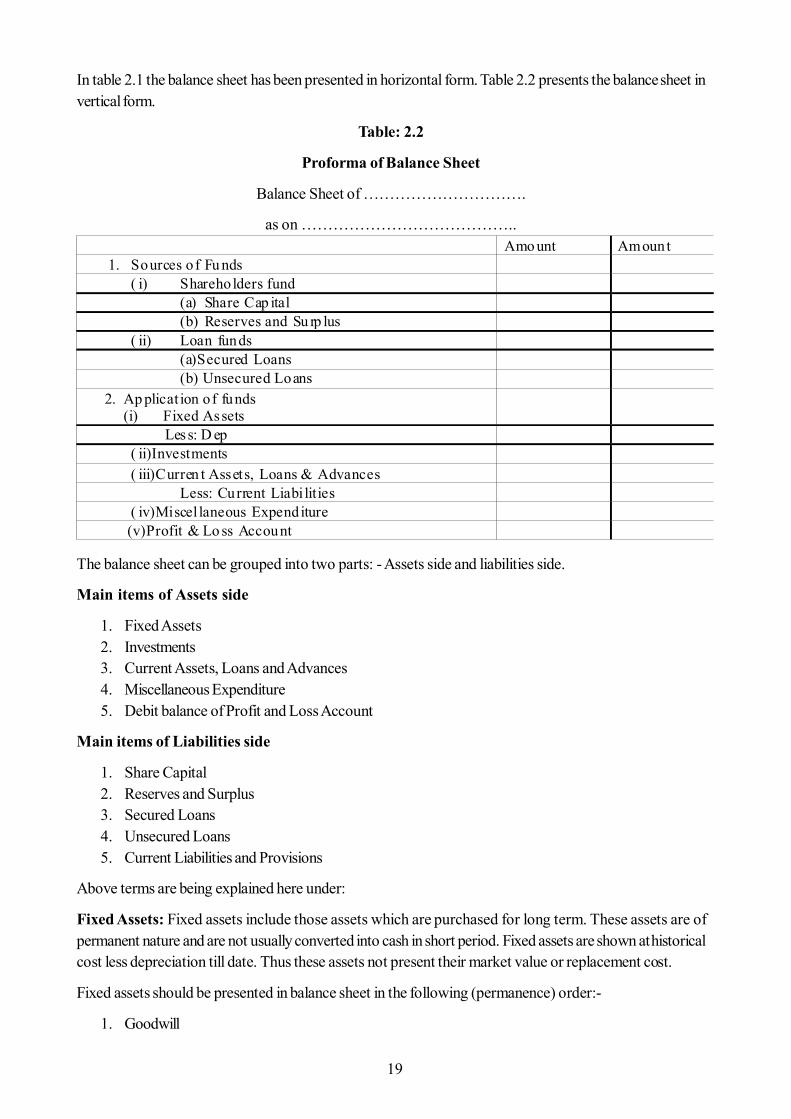
In table 2.1 the balance sheet has been presented in horizontal form. Table 2.2 presents the balance sheet invertical form.
Table: 2.2
Proforma of Balance Sheet
Balance Sheet of ………………………….
as on …………………………………..
The balance sheet can be grouped into two parts: - Assets side and liabilities side.
Main items of Assets side
1. Fixed Assets2. Investments3. Current Assets, Loans and Advances4. Miscellaneous Expenditure5. Debit balance of Profit and Loss Account
Main items of Liabilities side
1. Share Capital2. Reserves and Surplus3. Secured Loans4. Unsecured Loans5. Current Liabilities and Provisions
Above terms are being explained here under:
Fixed Assets: Fixed assets include those assets which are purchased for long term. These assets are ofpermanent nature and are not usually converted into cash in short period. Fixed assets are shown at historicalcost less depreciation till date. Thus these assets not present their market value or replacement cost.
Fixed assets should be presented in balance sheet in the following (permanence) order:-
1. Goodwill
Amo unt Amount 1. Sources o f Fu nds
( i) Shareholders fund (a) Share Cap ital (b) Reserves and Su rp lus
( ii) Loan funds (a)Secured Loans (b) Unsecured Loans
2. Ap plicat ion of funds (i) Fixed Assets
Less: D ep ( ii)Investments ( iii)Curren t Assets, Loans & Advances
Less: Current Liabi lities ( iv)Miscel laneous Expenditure
(v)Profit & Lo ss Account
20
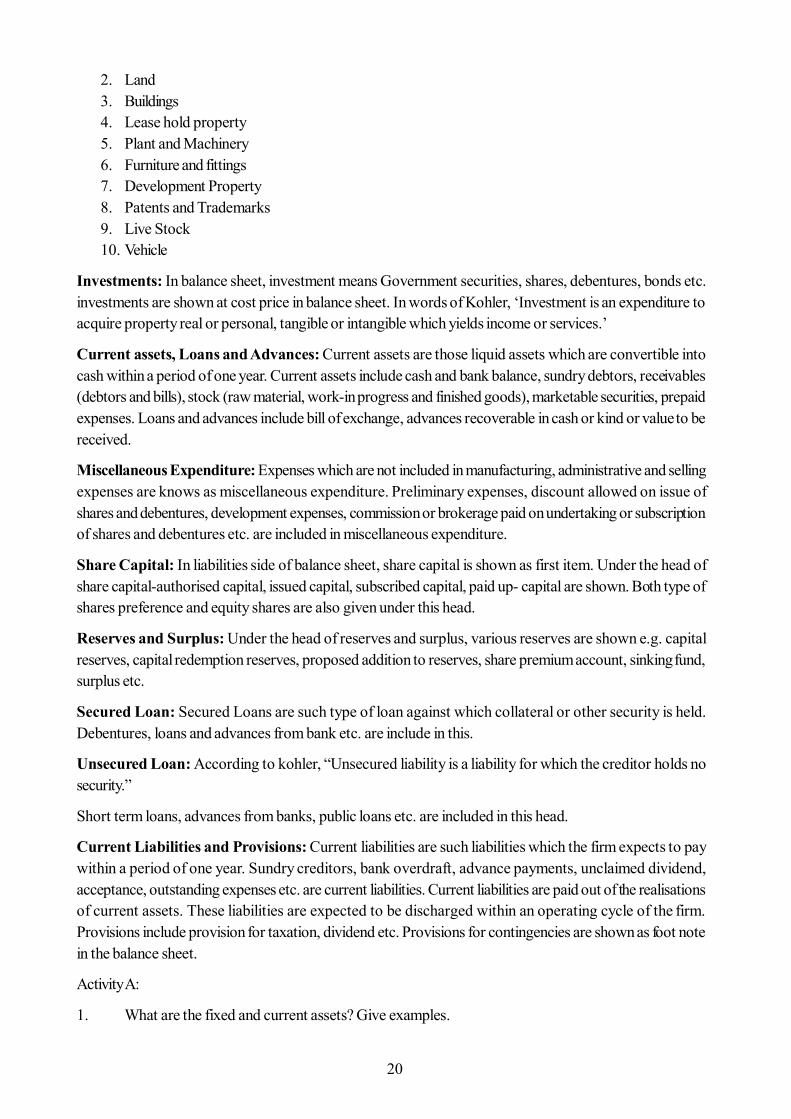
2. Land3. Buildings4. Lease hold property5. Plant and Machinery6. Furniture and fittings7. Development Property8. Patents and Trademarks9. Live Stock10. Vehicle
Investments: In balance sheet, investment means Government securities, shares, debentures, bonds etc.investments are shown at cost price in balance sheet. In words of Kohler, ‘Investment is an expenditure toacquire property real or personal, tangible or intangible which yields income or services.’
Current assets, Loans and Advances: Current assets are those liquid assets which are convertible intocash within a period of one year. Current assets include cash and bank balance, sundry debtors, receivables(debtors and bills), stock (raw material, work-in progress and finished goods), marketable securities, prepaidexpenses. Loans and advances include bill of exchange, advances recoverable in cash or kind or value to bereceived.
Miscellaneous Expenditure: Expenses which are not included in manufacturing, administrative and sellingexpenses are knows as miscellaneous expenditure. Preliminary expenses, discount allowed on issue ofshares and debentures, development expenses, commission or brokerage paid on undertaking or subscriptionof shares and debentures etc. are included in miscellaneous expenditure.
Share Capital: In liabilities side of balance sheet, share capital is shown as first item. Under the head ofshare capital-authorised capital, issued capital, subscribed capital, paid up- capital are shown. Both type ofshares preference and equity shares are also given under this head.
Reserves and Surplus: Under the head of reserves and surplus, various reserves are shown e.g. capitalreserves, capital redemption reserves, proposed addition to reserves, share premium account, sinking fund,surplus etc.
Secured Loan: Secured Loans are such type of loan against which collateral or other security is held.Debentures, loans and advances from bank etc. are include in this.
Unsecured Loan: According to kohler, “Unsecured liability is a liability for which the creditor holds nosecurity.”
Short term loans, advances from banks, public loans etc. are included in this head.
Current Liabilities and Provisions: Current liabilities are such liabilities which the firm expects to paywithin a period of one year. Sundry creditors, bank overdraft, advance payments, unclaimed dividend,acceptance, outstanding expenses etc. are current liabilities. Current liabilities are paid out of the realisationsof current assets. These liabilities are expected to be discharged within an operating cycle of the firm.Provisions include provision for taxation, dividend etc. Provisions for contingencies are shown as foot notein the balance sheet.
Activity A:
1. What are the fixed and current assets? Give examples.
21
2. Profit and Loss Account/Income Statement: The income statement is also known as profit andloss account, statement of earnings, statement of income and expenditure, statement of profit andloss etc. Income statement provides the summary of the operating results of the firm of a accountingperiod. In this statement revenues are match with the costs and shows the difference between thetwo as the net profit/loss for a specific period. In America, the profit or loss is calculated in astatement form, so it is known as income statement. While in India, the profit or loss calculated inaccount form, so, it is known here as profit and loss account. With the help of income statement wecan understand the performance of the firm for a specific period. Income statement is prepared aparticular period, no standard format for income statement is provided by Companies Act, 1956.
Some definitions of income statement are given below;
Accounting to Howard and Upton, “The summary of changes in owners’ claim or equity resultingfrom operations of period of time, properly arranged, is called the profit and loss statement.”
According to Robert N. Anthony, “The accounting report which summarises the revenue items, theexpense items and the difference between them (net income) for an accounting period is called theincome statement (or the profit and loss statement, statement of earnings or statement of operations).”
The debit side of profit and loss account includes all business expenses and losses where as creditside includes all incomes and gains. Difference of both sides is called profit or loss as the case maybe.
As the companies Act, 1956, does not state any standard format of profit and loss account. Differentbusiness firms prepare this account according to the nature and requirement of the business. Theprofit and loss account is divided into these four parts:
1. Manufacturing account2. Trading account3. Profit and loss account4. Profit and loss appropriation account
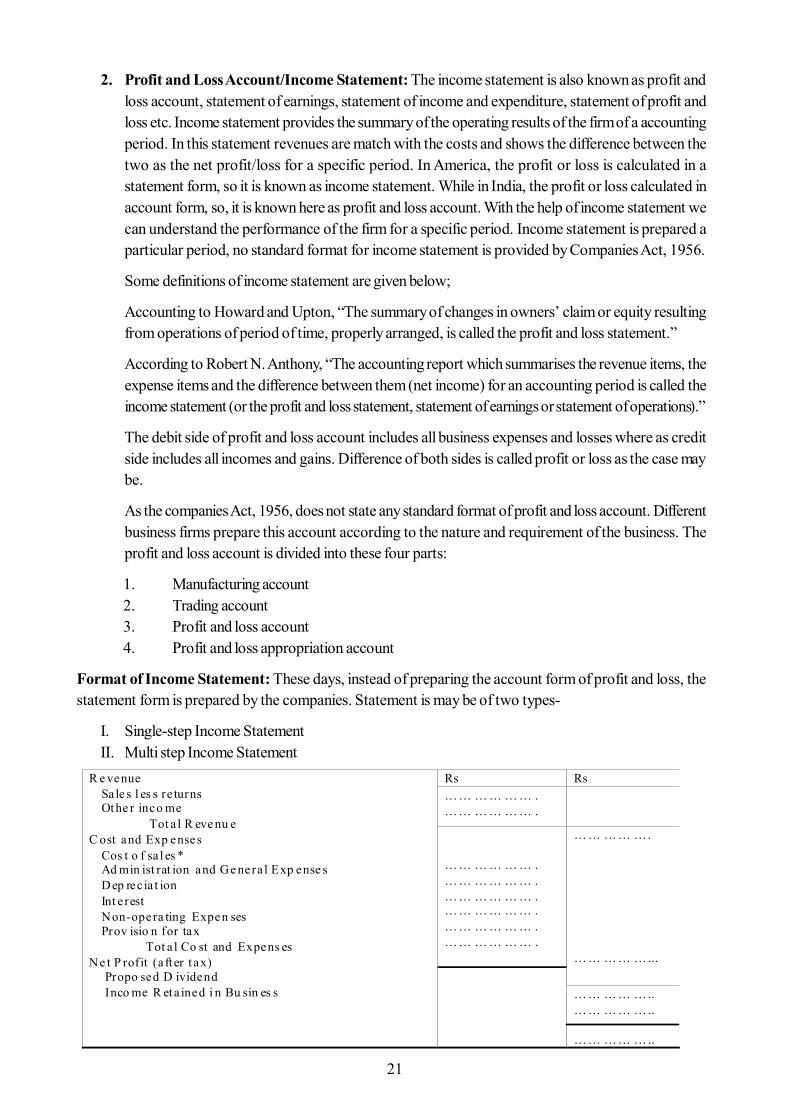
Format of Income Statement: These days, instead of preparing the account form of profit and loss, thestatement form is prepared by the companies. Statement is may be of two types-
I. Single-step Income StatementII. Multi step Income Statement
R e venue Sa le s l es s re turns Ot he r inco me Tot a l R eve nu e C ost and Exp enses Cos t o f sa l es * Ad min ist rat ion and Ge nera l Exp ense s Dep rec ia t ion Int e rest Non-opera ting Expen ses Prov isio n for tax Tot a l Co st and Expens es Ne t P rofit (a ft er t ax) Propo sed D ividend Inco me R et a ined i n Bu sin es s
Rs Rs …… … … … … . …… … … … … .
…… … … … … . …… … … … … . …… … … … … . …… … … … … . …… … … … … . …… … … … … .
…… …… …. …… …… …...
…… …… ….. …… …… ….. …… …… …..
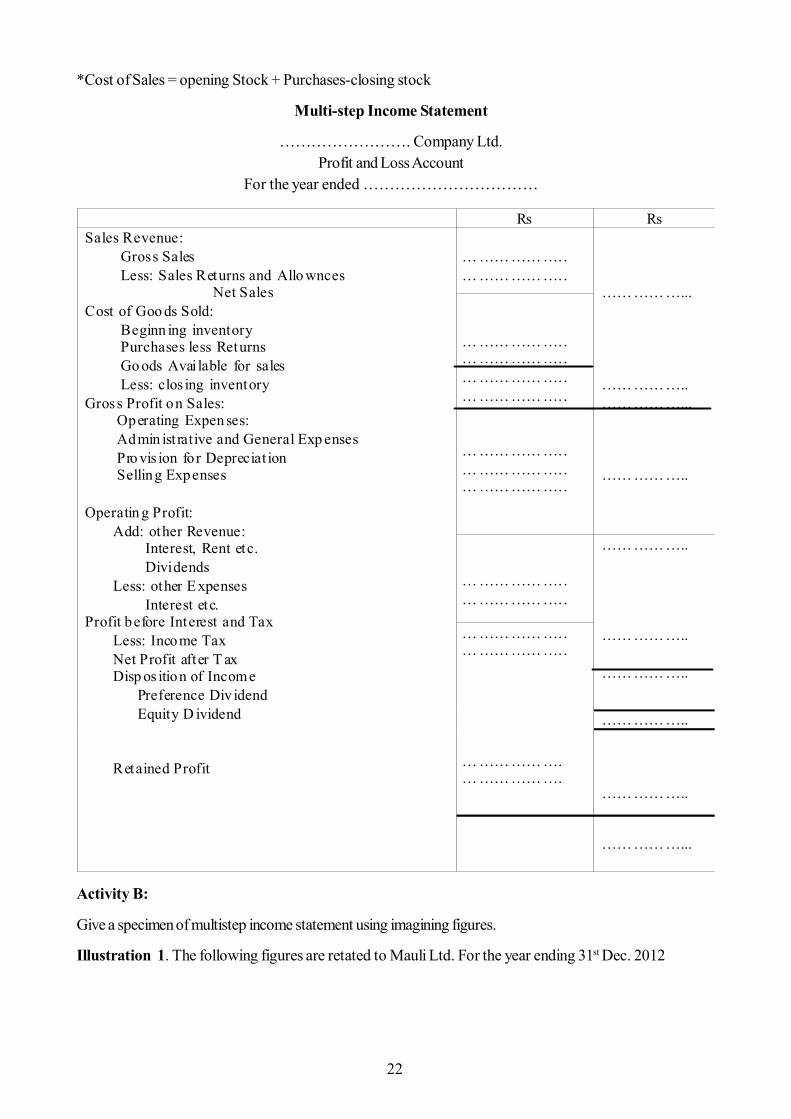
22
*Cost of Sales = opening Stock + Purchases-closing stock
Multi-step Income Statement
……………………. Company Ltd.Profit and Loss Account
For the year ended ……………………………
Activity B:
Give a specimen of multistep income statement using imagining figures.
Illustration 1. The following figures are retated to Mauli Ltd. For the year ending 31st Dec. 2012
Rs Rs Sales Revenue: Gross Sales Less: Sales Returns and Allo wnces Net Sales Cost of Goo ds Sold: Beginn ing inventory Purchases less Returns Go ods Avai lable for sales Less: clos ing inventory Gross Profit on Sales: Operating Expen ses: Admin ist rative and General Exp enses Pro vis ion fo r Depreciat ion Selling Expenses Operatin g Profit: Add: other Revenue: Interest, Rent etc. Dividends Less: other E xpenses Interest etc. Profit before Interest and Tax Less: Income Tax Net Profit after T ax Disp os ition of Income Preference Div idend Equity D ividend Retained Profit
… …………….. … ……………..
……………... …………….. ……………... ……………..
… …………….. … …………….. … …………….. … …………….. … …………….. … …………….. … ……………..
… …………….. … ……………..
…………….. …………….. ……………..
… …………….. … …………….. … ……………. … …………….
…………….. ……………..
……………...
23
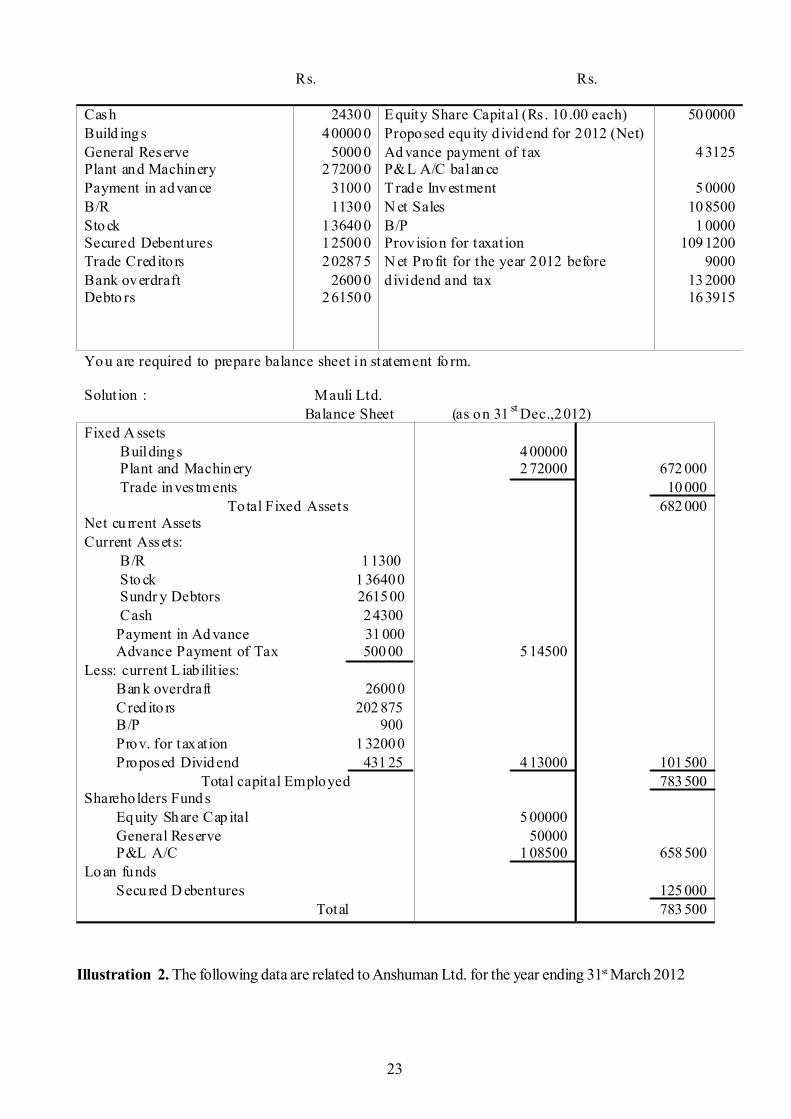
Illustration 2. The following data are related to Anshuman Ltd. for the year ending 31st March 2012
Rs. Rs.
Cash Build ing s General Reserve Plant and Machinery Payment in advance B/R Sto ck Secured Debentures Trade Cred ito rs Bank overdraft Debto rs
2430 0 40000 0
5000 0 27200 0
3100 0 1130 0
13640 0 12500 0 20287 5
2600 0 26150 0
E quity Share Capital (Rs. 10 .00 each) Propo sed equ ity d ividend for 2012 (Net) Ad vance payment of tax P&L A/C balan ce T rade Inv estment N et Sales B/P Prov ision for taxat ion N et Profit for the year 2012 before d ividend and tax
50 0000
4 3125
5 0000 10 8500 1 0000
109 1200 9000
13 2000 16 3915
Yo u are required to prepare balance sheet in statement fo rm.
Solut ion : Mauli Ltd. Balance Sheet (as on 31 st Dec.,2012) Fixed A ssets Buildings Plant and Machin ery Trade inves tments To tal Fixed Assets Net cu rrent Assets Current Assets: B/R 11300 Sto ck 1 36400 Sundr y Debtors 261500 Cash 24300 Payment in Ad vance 31 000 Advance Payment of Tax 500 00 Less: current L iab ilities: Ban k overdraft 26000 Cred ito rs 202 875 B/P 900 Prov. for taxat ion 1 32000 Proposed Divid end 431 25 Total capital Employed Shareho lders Fund s Equity Share Cap ital General Reserve P&L A/C Lo an funds Secu red D ebentures Total
4 00000 2 72000
5 14500
4 13000
5 00000 50000
1 08500
672 000 10 000
682 000
101 500 783 500
658 500
125 000 783 500
24
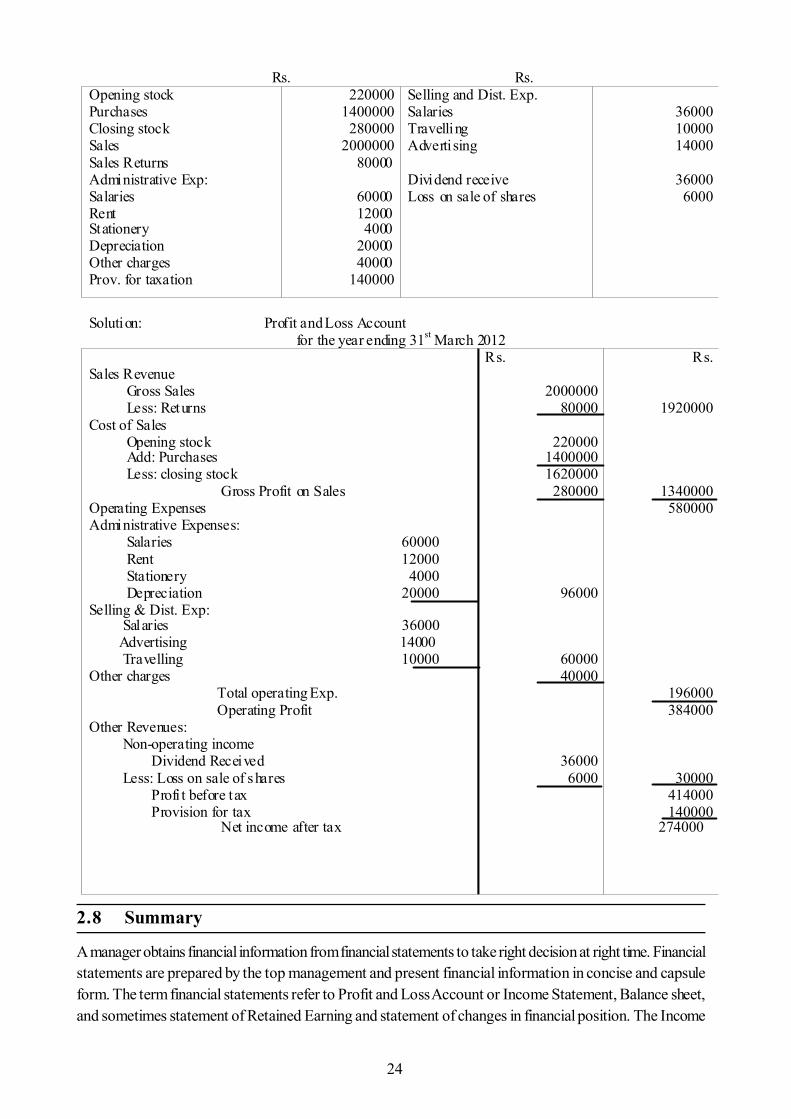
2.8 Summary
A manager obtains financial information from financial statements to take right decision at right time. Financialstatements are prepared by the top management and present financial information in concise and capsuleform. The term financial statements refer to Profit and Loss Account or Income Statement, Balance sheet,and sometimes statement of Retained Earning and statement of changes in financial position. The Income
Rs. Rs. Opening stock Purchases Closing stock Sales Sales Returns Administrative Exp: Salaries Rent Stationery Depreciation Other charges Prov. for taxation
220000 1400000
280000 2000000
80000
60000 12000 4000
20000 40000
140000
Selling and Dist. Exp. Salaries Travelling Advertising Dividend receive Loss on sale of shares
36000 10000 14000
36000
6000
Solution: Profit and Loss Account
for the year ending 31st March 2012 Sales Revenue Gross Sales Less: Returns Cost of Sales Opening stock Add: Purchases Less: closing stock Gross Profit on Sales Operating Expenses Administrative Expenses: Salaries 60000 Rent 12000 Stationery 4000 Depreciation 20000 Selling & Dist. Exp: Salaries 36000 Advertising 14000 Travelling 10000 Other charges Total operating Exp. Operating Profit Other Revenues: Non-operating income Dividend Received Less: Loss on sale of shares Profi t before tax Provision for tax Net income after tax
Rs.
2000000 80000
220000
1400000 1620000
280000
96000
60000 40000
36000 6000
Rs.
1920000
1340000 580000
196000 384000
30000 414000 140000
274000
25
statement gives a report of operations over a specified period of time, summarises the revenue or incomeand the expenses or cost attributed to that period and indicates the net profit or loss for a specified periodof time. The Balance sheet presents a summary of financial position at a particular moment of time. The netprofit depicted by Profit and Loss account is transferred to Profit and Loss Appropriation account whereinit will be divided in two parts i.e. dividends to shareholders and profit retained in the firm. Statement ofchanges in Financial Position depicts how the firm generated different sources of funds and how these fundswere used during the period. It comprises Fund Flow Statement and Cash Flow Statement.
The financial statements are prepared to communicate with different parties regarding the financial positionof the business and to analyse the operations and performance of the firm for planning. Financial Statementsreflect a combination of recorded facts, accounting conventions, postulates and personal judgements. Financialstatements are important to management, investors, creditors, government and other stakeholders. Financialstatements are only interim reports, depend upon accounting concepts and conventions based on historicalcost. Financial statements disclose only monetary items and affected by personal judgement and knowledge.Financial statements must be in simple and attractive manner. Irrelevant informations should be ignored.Various required tables, footnotes, appendices must be given in financial statement.
2.9 Key Words
Balance Sheet: It is a statement of financial position of a business at a specified point of time. Itrepresents all assets owned and the claims of the owners and outsiders against those assets at thattime.
Current Assets: Current assets are the liquid assets of the firm and are convertible into cash withina period of one year.
Current Liabilities: The current liabilities are those liabilities which the firm expect to pay within aperiod of 1 year.
Fixed Assets: Fixed assets are those assets which are of permanent nature relatively less liquidand are not usually converted into cash in the short run.
Profit and Loss Account: Profit and loss account summarizes the revenues and expenses of thefirm for an accounting period.
2.10 Self Assessment Questions
1. Explain the meaning of the term “Financial Statements”. State their nature and limitations.
2. What are financial statements. Why are these prepared?
3. Discuss the utility and importance of financial statements for the various parties interested in abusiness concern.
4. Explain the essential qualities financial statements.
5. Explain the statement “Financial Statements reflect a combination of recorded facts, accountingconventions and personal judgement.”
6. Following is the Profit and Loss account of ABC Ltd. You are required to redraft it in statement(vertical) form.
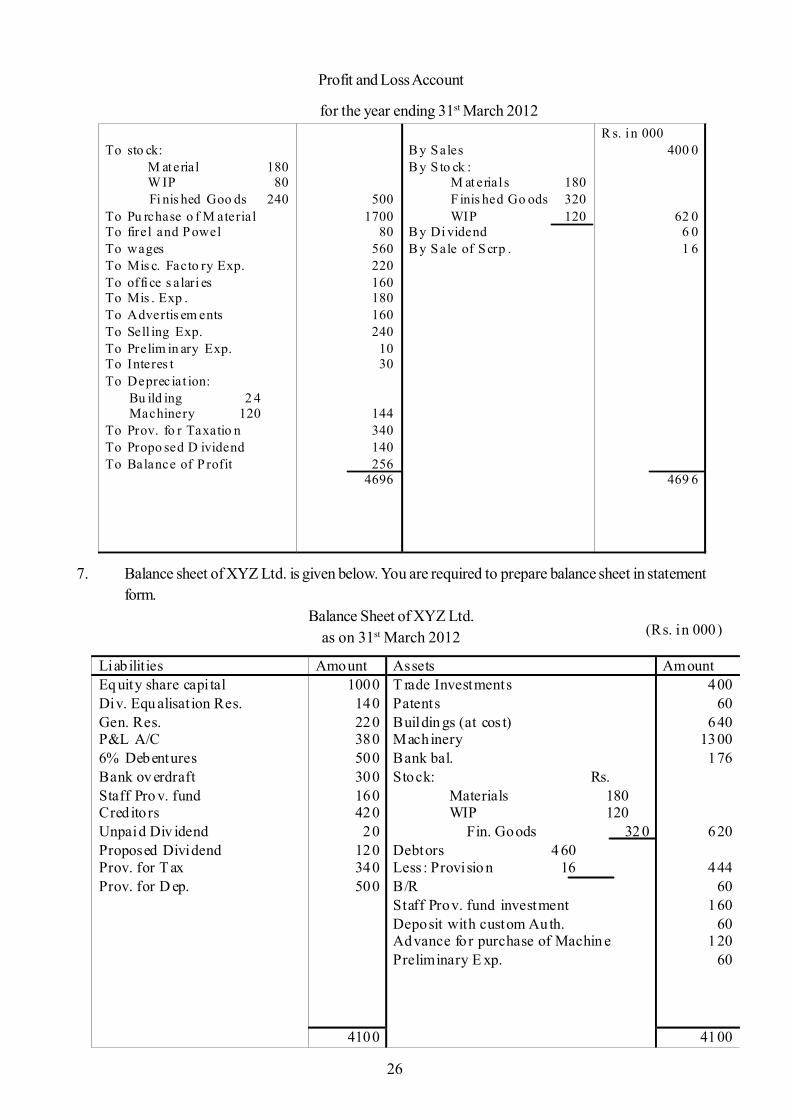
26
Profit and Loss Account
for the year ending 31st March 2012
7. Balance sheet of XYZ Ltd. is given below. You are required to prepare balance sheet in statementform.
Balance Sheet of XYZ Ltd.as on 31st March 2012
To sto ck:
M aterial 180 W IP 80 Fi nis hed Goo ds 240
To Pu rchase o f M aterial To firel and Powel To wages To Mis c. Facto ry Exp. To offi ce s alari es To Mis . Exp . To Advertis em ents To Sell ing Exp. To Prelim in ary Exp. To Interes t To Deprec iat ion: Bu ild ing 2 4 Machinery 120 To Prov. fo r Taxatio n To Propo sed D ividend To Balance of P rofit
500 1700
80 560 220 160 180 160 240
10 30
144 340 140 256
4696
B y Sales B y S to ck :
M at erial s 180 F inis hed Go ods 320 WIP 120
B y Di vidend B y Sale of Scrp .
R s. i n 000 400 0
62 0 6 0 1 6
469 6
(Rs. in 000)
Liab ilities Amount Assets Amount Eq uity share capi tal Div. Equ alisat ion Res. Gen. Res. P&L A/C 6% Debentures Bank ov erdraft Staff Pro v. fund Cred ito rs Unpaid Div idend Proposed Dividend Prov. for T ax Prov. for D ep.
1000 140 220 380 500 300 160 420
20 120 340 500
T rade Investments Patents Buildin gs (at cos t) Machinery Bank bal. Stock: Rs.
Materials 180 WIP 120
Fin. Goods 32 0 Debtors 4 60 Less : Provisio n 16 B/R Staff Prov. fund investment Deposit with custom Auth. Advance for purchase of Machin e Preliminary E xp.
400 60
640 1300
176
620
444 60
160 60
120 60
4100 4100
27
2.11 Reference Books
- Financial Management - S.N. Mahaeshwari
- Management Accounting - R.P. Rustagi
- Financial Management - M.R. Agrawal
- Financial Management - M.R. Agrawal and N.P. Agrawal
- Financial Management - I.M. Pandey
28
Unit - 3 : Techniques of Financial Statement Analysis
Structure of Unit
3.0 Objectives3.1 Introduction3.2 Objective of Financial Statement Analysis and Interpretation3.3 Types of Financial Statement Analysis3.4 Procedure of Financial Statement Analysis3.5 Importance of Financial Statement Analysis3.6 Techniques of Financial Statement Analysis3.7 Summary3.8 Key words3.9 Self Assessment Questions3.10 Reference Books
3.0 Objectives
After completing this unit, you would be able to:
Understand financial statement analysis Know the procedure of financial statement analysis Prepare comparative balance sheet and profit and loss account Prepare common size financial statements
3.1 Introduction
Financial statements comprising the balance sheet and the profit and loss account donot provide all theinformation in relation to the financial operation of a business enterprise, The balance sheet depicts thefinancial position on a particular date and the profit and loss account reveals the results of financial activitiesduring a certain period of time. Merely figures shown in financial statements donot serve the purpose ofdecision making for all stakeholders. Analysis and interpretation of financial statements help to diagnosis theprofitability and financial soundness of the business. Analysis and interpretation are two different terms.S.N. Maheshwari states” the term analysis means methodical classification of data given in the financialstatements. The figures given in the financial statements will not help one unless they are put in a simplifiedform. For example, all items relating to current assets are put at one place while all items relating to currantliabilities’ are put another place. The term ‘Interpretation’ means explaining the meaning and significance ofthe data so simplified. According to Metcalf and Titard “ The analysis of financial statements as a process ofevaluating the relationship between component parts of financial statements to obtain a better understandingof the firm’s position and performance.” The financial analyst selects the information related to the decisionunder consideration from total information available in financial statements. Thereafter he arranges theinformation in a way to establish significant relationships. The last step is to interpret and to draw inferencesand conclusions. According to Spicer and pegelar” Interpretation of accounts may be defined as the art andscience of translating the figures in such a way as to reveal the financial strength and weakness of a businessand the causeswhich have contributed therein.”
29
3.2 Objective of Financial Statement Analysis and Interpretation
The objectives of financial statements analysis and interpretation may differ from the point of view of differentstakeholders. Shareholders are generally interested in earning per share while debentureholders have focuson capital structure and projected earnings. According to Anthony, Robert N. “The overall objective of abusiness is to earn a satisfactory return on the funds invested in it,consistent with maintaining a soundfinancial position. Hence the purpose of analysis of financial statement is a detailed cause and effect study ofprofitability and financial position. Although analysis of financial statement is not an automatic and authenticprocess but it helps in answering the questions of financial analyst. The main objectives of analysis andinterpretation of financial statements are being explained hereunder:
1. To measure profitability and to find out responsible factors in case of declining and improvingprofitability ratios.
2. To measure financial soundness with the help of various ratios for corrective actions in case ofadverse position.
3. To measure operating efficiency through comparison of current year’s production, sales, expenseswith last year’s figures of these items.
4. To assessshortterm as well as long term solvency for creditors, debenture holders etc.
5. To show trend of various items of financial statements e.g. sales, purchases, profits, expenses andto make strategies for future. This information will also help in budgeting and planning.
6. To conduct inter-firm and intra-firm comparison for self evaluation and for operating efficiency totake corrective actions.
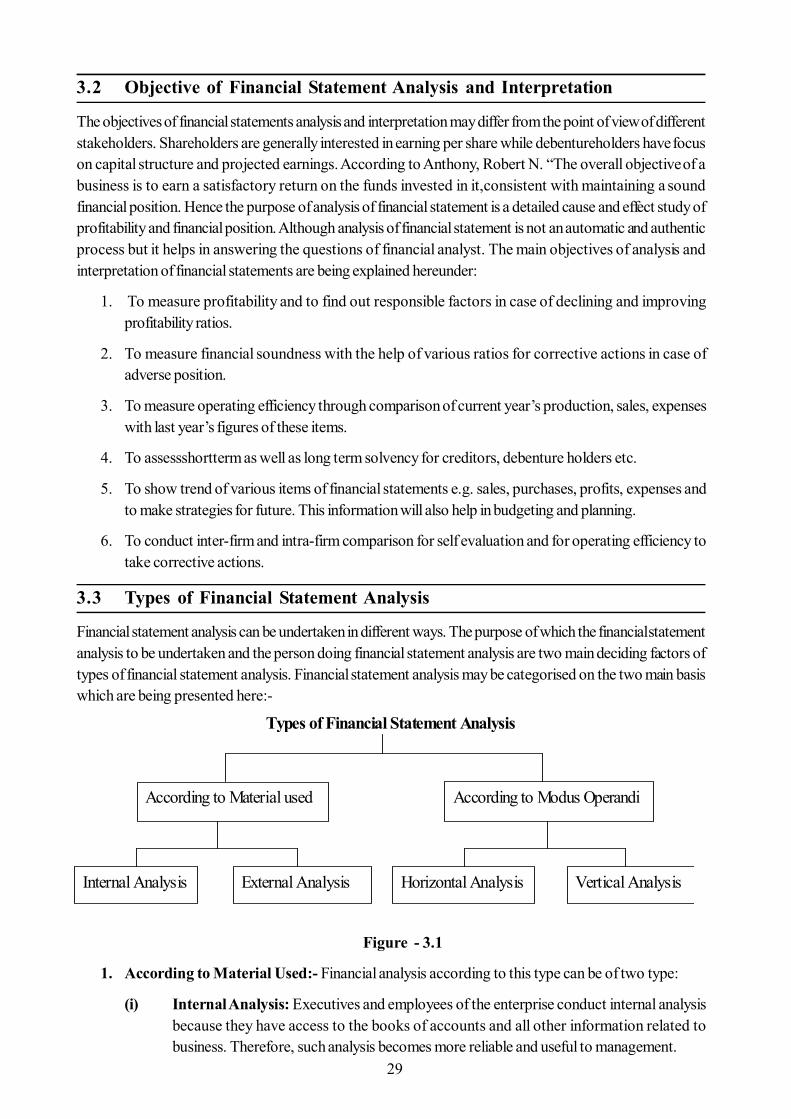
3.3 Types of Financial Statement Analysis
Financial statement analysis can be undertaken in different ways. The purpose of which the financial statementanalysis to be undertaken and the person doing financial statement analysis are two main deciding factors oftypes of financial statement analysis. Financial statement analysis may be categorised on the two main basiswhich are being presented here:-
Figure - 3.1
1. According to Material Used:- Financial analysis according to this type can be of two type:
(i) Internal Analysis: Executives and employees of the enterprise conduct internal analysisbecause they have access to the books of accounts and all other information related tobusiness. Therefore, such analysis becomes more reliable and useful to management.
Types of Financial Statement Analysis
According to Material used According to Modus Operandi
Internal Analysis External Analysis Horizontal Analysis Vertical Analysis
30
(ii) External Analysis: - An external analysis is done by those who are outsiders for thebusiness and do not have access to the detailed records of the company. Shareholders,prospective investors, creditors, bankers, governmental agencies, researchers are outsiderswho conduct such analysis on the basis of published financial statements. Increasedgovernmental control over companies and governmental regulations have directed companiesto disclose more detailed informations in order to improve analysis.
2. According to Modus Operandi: This type of analysis can be classified in two categories:-
(i) Horizontal Analysis: - when financial statements for a number of years are reviewed andanalysed, it is termed as ‘Horizontal Analysis’.Under this method, figures of two or moreyears regarding each items are shown with changes from the base year. Generally, the firstyear is assumed as base or standard year. Increase or decrease in each item as comparedto base year is shown in percentage form. For example, creditors shown in the balancesheet have increased or decreased as compared to the year 2011, and 2012. Horizontalanalysis is used in comparative balance sheet and profit and loss account and in trendanalysis. Area of strength and weakness from considerable insight are given to themanagement by this analysis. It is also known as ‘Dynamic Analysis’.
(ii) Vertical Analysis:- It is a study of quantitative relationship of the various items in thefinancial statements on a particular date. It is related to one date or one accounting period.Therefore, it is termed as ‘Static Analysis’. Common size balance sheet and profit andlossaccount are examples of vertical analysis. Totals of financial statements of a particularaccounting period are taken as 100 and then all items related to that statement are convertedinto percentage. For example, each item of Balance sheet is stated as a percentage of thetotal of the Balance sheet.
3.4 Procedure of Financial Statement Analysis
The analysis process of financial statements involves the compilation and study of financial and operatingdata. Analytical representation and promptness are attributes of ideal financial analysis. The followingprocedure has to be adopted for financial statement analysis:-
(1) Re-arrangement of Financial statements: First of all a financial statement analyst must knowthe object of financial statements analysis. Profit and loss account reveals trend of progress andBalance sheet depicts financial position. Director’s report and chairman speech are useful to knowfuture plans. Financial data should be presented in a condensed form according to the object.
(2) Study of Financial Statements: Detailed study of Balance sheet and Profit and loss account ofcurrent year and past years should be made to create a comprehensive vision and to guess aboutfuture.
(3) Approximation of Figures And Classification of Items: The figures should be approximated tothe nearest thousand or lakh of rupees to remove complexity of process. The items related toparticular heading should be put at one place. Such classification of items will help in analysis.
(4) Comparison by Establishing Relationship Between Items: Absolute figure is useless until it iscompared with another figure. Various items are taken and a relationship with other item is establishedaccording to the object. An item of current year may be compared with its past year figures or maybe compared with an other item. For example sales of current year may be compared with last
31
year’s sales or may be compared with gross profit, net profit or with different assets. Figures of aparticular company may be compared with the figures of other company. All these depend on theobject of analysis.
(5) Analysis and Interpretation: On the basis of a comparative study, the analyst puts trend andchanges. It presents important facts to take corrective action and to help in decision making accordingto object.
(6) Presentation: After analysis and interpretation financial analysis draws inferences. These inferencesmay be presented either through report or diagrams.
3.5 Importance of Financial Statement Analysis
Financial statement analysis is useful for stakeholders because it helps in decision making form their point ofview. The importance of financial statement analysis may be understood from the points given below:-
1. Disclosure of Facts: -Financial statements presents only figure of related various items. They donot provide information regarding solvency, requirement of working capital, liquidity position, debtor’scollection policy etc. Analysis of financial statements helps to answer of such questions and providesexplanation about all required informations.
2. Comparative Study of Efficiency:- various items are compared with past data of the firm andalso with other firms engaged in the same business. It measures efficiency of business itself and incomparison to others.
3. Help in Planning and Decision Making:-After analysis of financial statements, a firm may knowincreasing or decreasing trend of various items. It will provide a base for future planning and remedialmeasures can be planned for solution of future problems.There is no room for personal biasness indecision making because data are scientifically analysed.
4. Effective Control: - Control can be exercised effectively in case of variations. Analysis of financialstatement provides information regarding day to day activity of business. If there is any negativesign, corrective actions may be taken.
5. Importance to Various Stakeholders. Investor, debenture holders, employees, management,government and researchers are various stakeholders who want to know different informationsrelated to them. Analysis of financial statement provides informations to various stakeholders.
3.6 Techniques of Financial Statement Analysis
Different persons undertake analysis of financial statement for different purposes. The methodology foranalysis may vary from one situation to other. Horizontal or vertical analysis of items given in financialstatements shows profitability and financial position of firm. The techniques which help to study the relationshipof horizontal and vertical analysis are termed as Techniques of Financial Statement Analysis. The maintechniques are being explained here :-
1. Comparative Financial Statements
2. Common-size Financial Statements
3. Trend Percentages
4. Ratio Analysis
32
5. Fund Flow Analysis
6. Cash Flow Analysis
7. Break-Even Analysis
A technique useful for one analyst may be useless for another to their different objects. It is not necessary touse all above techniques. The analyst should adopt only these techniques which are helpful in their object ofinvestigation. The above techniques are being explained here in detail with suitable examples:
Activity A:
1. Prepare a list of techniques of financial statement analysis
Comarative Financial Statements: Now-a-days companies have started to provide important statisticalinformation in condensed form for the last so many years. Financial statements of a single period representonly one phase of the long and continuous history of the firm, therefore data related to a period of a numberof years will be more significant and meaningful for comparative study. Comparative financial statements arepresented in a way so as to provide time perspective to the consideration of various elements of financialposition embodied in such statement. The financial data are placed in columnar form. Comparative statementsare made to show-
(i) Absolute data (money value)
(ii) Decrease or increase in absolute data in terms of money values.
(iii) Decrease or increase in absolute data in terms of percentage.
(iv) Comparison expressed in ratios
(v) Percentage of totals.
It should be kept in mind while preparing comparative financial statements that the methods of collection ofdata, presentation of date, accounting policies and principles followed are same otherwise these will givemisleading results. If there is any change, it should be indicated in the footnotes. Classification of elements ofassets and liabilities in Balance sheet and elements of income and expenditure in Profit and Loss accountshould be same during the period of comparison.
Generally comparative Balance sheet and comparative Profit and Loss account are prepared. The bothcomparative statements are being explained here:-
(i) Comparative Balance Sheet: Comparative Balance Sheet depicts decrease and increase in variousitems of assets and liabilities. Data at the beginning and at the end of the period are taken forcomparison. A single balance sheet shows only the balance of accounts but the comparative balancesheet shows increase or decrease in each item. The comparative Balance sheet has two columns forthe data of the original balance sheet and a third column for increase or decrease in various items.The fourth column contains the percentage of increase or decrease.
(ii) Comparative Profit and Loss Account: A comparative profit and loss account shows the absolutefigures for two or more periods of different items, the absolute changes from one period to anotherand if desired, the changes in terms of percentages form. A financial analyst can quickly ascertainwhether sales, cost of goods sold and other different items have increased or decreased and byhow much percentage.
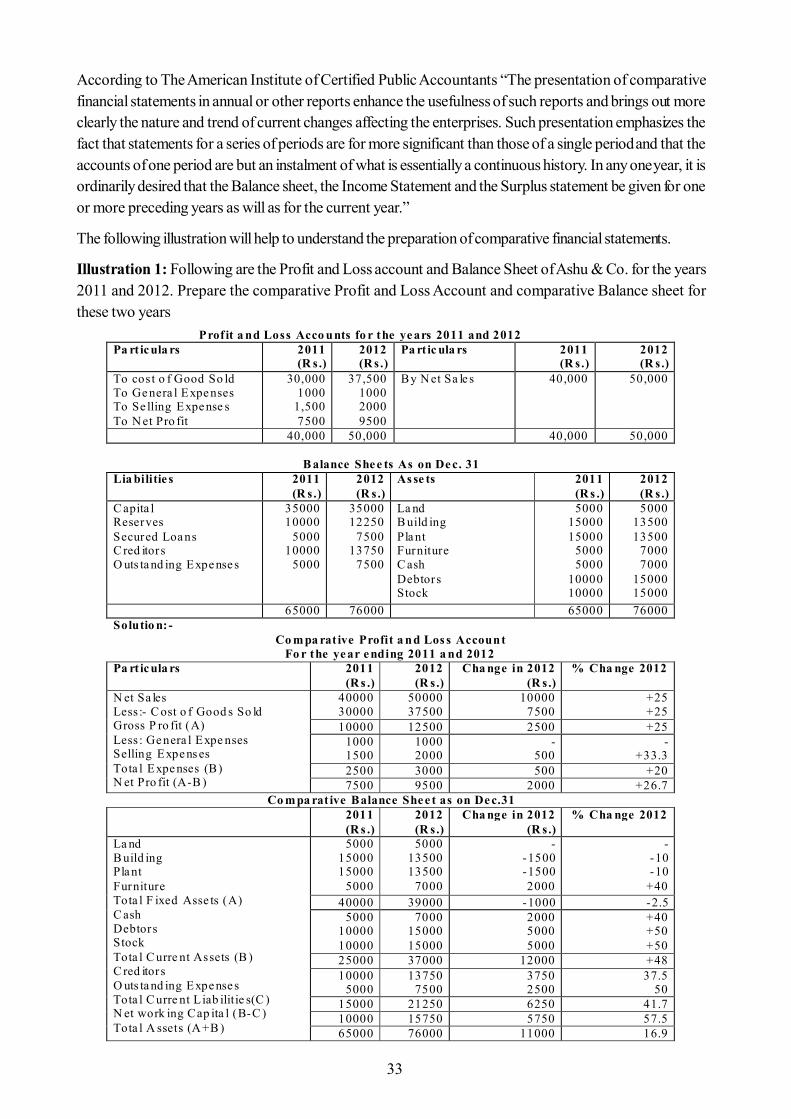
33
According to The American Institute of Certified Public Accountants “The presentation of comparativefinancial statements in annual or other reports enhance the usefulness of such reports and brings out moreclearly the nature and trend of current changes affecting the enterprises. Such presentation emphasizes thefact that statements for a series of periods are for more significant than those of a single period and that theaccounts of one period are but an instalment of what is essentially a continuous history. In any one year, it isordinarily desired that the Balance sheet, the Income Statement and the Surplus statement be given for oneor more preceding years as will as for the current year.”
The following illustration will help to understand the preparation of comparative financial statements.
Illustration 1: Following are the Profit and Loss account and Balance Sheet of Ashu & Co. for the years2011 and 2012. Prepare the comparative Profit and Loss Account and comparative Balance sheet forthese two years
Prof it a nd Loss Acco unts fo r the ye ars 2011 and 2012 Pa rt ic ula rs 2011
(R s.) 2012 (R s.)
Pa rt ic ula rs 2011 (R s.)
2012 (R s.)
To cost o f Good So ld To Ge nera l Expe nses To Se lling Expe nse s To N et Pro fit
30,000 1000
1,500 7500
37,500 1000 2000 9500
By N et Sa le s 40,000 50,000
40,000 50,000 40,000 50,000
B alance She e ts As on De c. 31 Lia bilitie s 2011
(R s.) 2012 (R s.)
As se ts 2011 (R s .)
2012 (R s.)
C apita l Reserves Secured Loa ns C red itors O uts ta nd ing Expe nse s
35000 10000
5000 10000
5000
35000 12250
7500 13750
7500
La nd B uild ing Pla nt Furniture C ash Debtors Stock
5000 15000 15000
5000 5000
10000 10000
5000 13500 13500
7000 7000
15000 15000
65000 76000 65000 76000 Solutio n: -
Co mpa rat ive Profit a nd Los s Account Fo r the ye ar e nding 2011 a nd 2012
Pa rt ic ula rs 2011 (R s .)
2012 (R s.)
Cha nge in 2012 (R s.)
% Cha nge 2012
N et Sa les Less :- C ost o f Good s So ld Gross P ro fit (A) Less : Ge nera l Expe nses Selling Expe ns es Tota l Expe nses (B) N et Pro fit (A-B )
40000 30000
50000 37500
10000 7500
+25 +25
10000 12500 2500 +25 1000 1500
1000 2000
- 500
- +33.3
2500 3000 500 +20 7500 9500 2000 +26.7
Co mpa rat ive Balance She e t as on De c.31 2011
(R s .) 2012 (R s.)
Cha nge in 2012 (R s.)
% Cha nge 2012
La nd B uild ing Pla nt Furniture Tota l F ixed Asse ts (A) C ash Debtors Stock Tota l C urre nt Assets (B ) C red itors O uts ta nd ing Expe nse s Tota l C urre nt L iab ilitie s(C ) N et work ing Cap ita l (B-C ) Tota l A ssets (A +B )
5000 15000 15000
5000
5000 13500 13500
7000
- -1500 -1500 2000
- -10 -10
+40 40000 39000 -1000 -2.5
5000 10000 10000
7000 15000 15000
2000 5000 5000
+40 +50 +50
25000 37000 12000 +48 10000
5000 13750
7500 3750 2500
37.5 50
15000 21250 6250 41.7 10000 15750 5750 57.5 65000 76000 11000 16.9
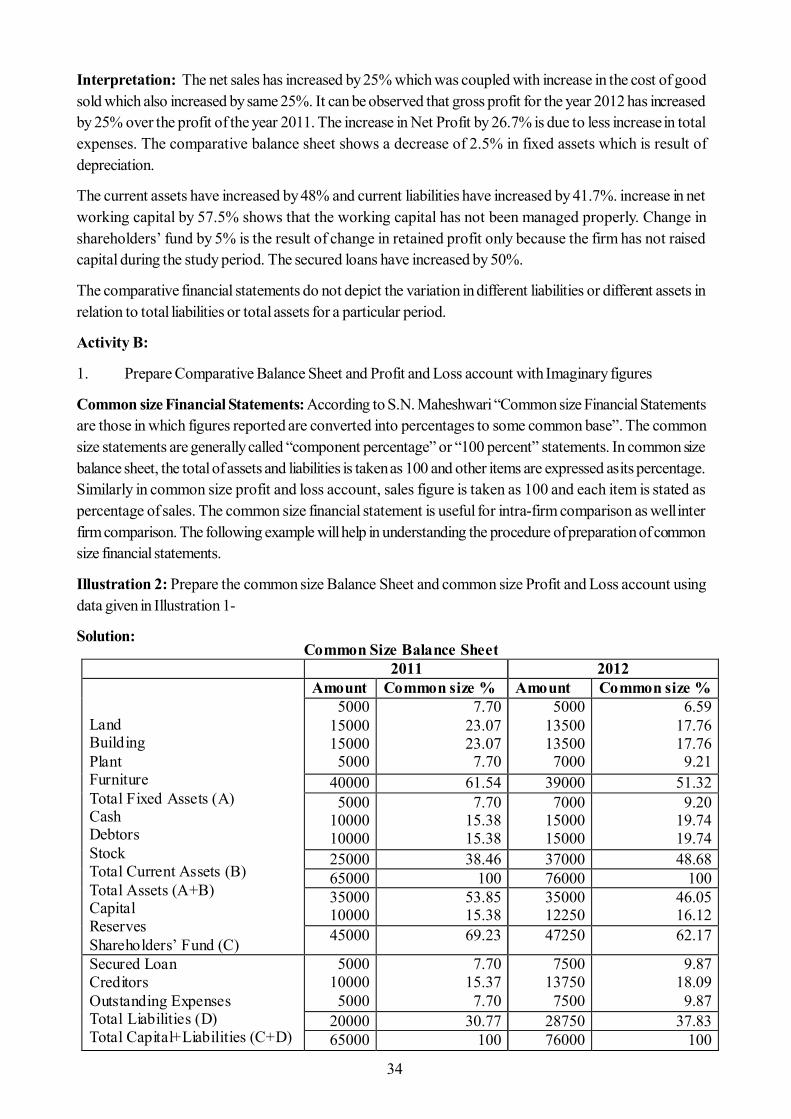
34
Interpretation: The net sales has increased by 25% which was coupled with increase in the cost of goodsold which also increased by same 25%. It can be observed that gross profit for the year 2012 has increasedby 25% over the profit of the year 2011. The increase in Net Profit by 26.7% is due to less increase in totalexpenses. The comparative balance sheet shows a decrease of 2.5% in fixed assets which is result ofdepreciation.
The current assets have increased by 48% and current liabilities have increased by 41.7%. increase in networking capital by 57.5% shows that the working capital has not been managed properly. Change inshareholders’ fund by 5% is the result of change in retained profit only because the firm has not raisedcapital during the study period. The secured loans have increased by 50%.
The comparative financial statements do not depict the variation in different liabilities or different assets inrelation to total liabilities or total assets for a particular period.
Activity B:
1. Prepare Comparative Balance Sheet and Profit and Loss account with Imaginary figures
Common size Financial Statements: According to S.N. Maheshwari “Common size Financial Statementsare those in which figures reported are converted into percentages to some common base”. The commonsize statements are generally called “component percentage” or “100 percent” statements. In common sizebalance sheet, the total of assets and liabilities is taken as 100 and other items are expressed as its percentage.Similarly in common size profit and loss account, sales figure is taken as 100 and each item is stated aspercentage of sales. The common size financial statement is useful for intra-firm comparison as well interfirm comparison. The following example will help in understanding the procedure of preparation of commonsize financial statements.
Illustration 2: Prepare the common size Balance Sheet and common size Profit and Loss account usingdata given in Illustration 1-
Solution:Common Size Balance Sheet
2011 2012 Land Building Plant Furniture Total Fixed Assets (A) Cash Debtors Stock Total Current Assets (B) Total Assets (A+B) Capital Reserves Shareholders’ Fund (C)
Amount Common size % Amount Common size % 5000
15000 15000 5000
7.70 23.07 23.07 7.70
5000 13500 13500 7000
6.59 17.76 17.76 9.21
40000 61.54 39000 51.32 5000
10000 10000
7.70 15.38 15.38
7000 15000 15000
9.20 19.74 19.74
25000 38.46 37000 48.68 65000 100 76000 100 35000 10000
53.85 15.38
35000 12250
46.05 16.12
45000 69.23 47250 62.17
Secured Loan Creditors Outstanding Expenses Total Liabilities (D) Total Capital+Liabilities (C+D)
5000 10000 5000
7.70 15.37 7.70
7500 13750 7500
9.87 18.09 9.87
20000 30.77 28750 37.83 65000 100 76000 100
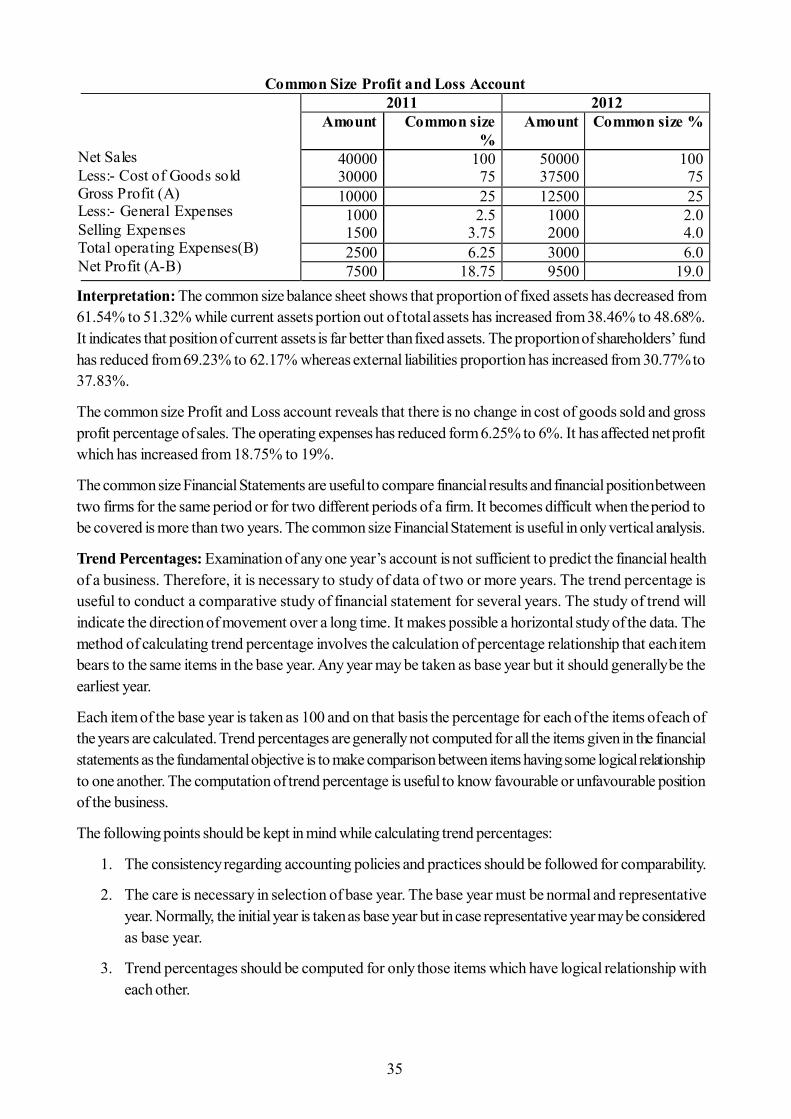
35
Interpretation: The common size balance sheet shows that proportion of fixed assets has decreased from61.54% to 51.32% while current assets portion out of total assets has increased from 38.46% to 48.68%.It indicates that position of current assets is far better than fixed assets. The proportion of shareholders’ fundhas reduced from 69.23% to 62.17% whereas external liabilities proportion has increased from 30.77% to37.83%.
The common size Profit and Loss account reveals that there is no change in cost of goods sold and grossprofit percentage of sales. The operating expenses has reduced form 6.25% to 6%. It has affected net profitwhich has increased from 18.75% to 19%.
The common size Financial Statements are useful to compare financial results and financial position betweentwo firms for the same period or for two different periods of a firm. It becomes difficult when the period tobe covered is more than two years. The common size Financial Statement is useful in only vertical analysis.
Trend Percentages: Examination of any one year’s account is not sufficient to predict the financial healthof a business. Therefore, it is necessary to study of data of two or more years. The trend percentage isuseful to conduct a comparative study of financial statement for several years. The study of trend willindicate the direction of movement over a long time. It makes possible a horizontal study of the data. Themethod of calculating trend percentage involves the calculation of percentage relationship that each itembears to the same items in the base year. Any year may be taken as base year but it should generally be theearliest year.
Each item of the base year is taken as 100 and on that basis the percentage for each of the items of each ofthe years are calculated. Trend percentages are generally not computed for all the items given in the financialstatements as the fundamental objective is to make comparison between items having some logical relationshipto one another. The computation of trend percentage is useful to know favourable or unfavourable positionof the business.
The following points should be kept in mind while calculating trend percentages:
1. The consistency regarding accounting policies and practices should be followed for comparability.
2. The care is necessary in selection of base year. The base year must be normal and representativeyear. Normally, the initial year is taken as base year but in case representative year may be consideredas base year.
3. Trend percentages should be computed for only those items which have logical relationship witheach other.
Common Size Profit and Loss Account Net Sales Less:- Cost of Goods sold Gross Profit (A) Less:- General Expenses Selling Expenses Total operating Expenses(B) Net Profit (A-B)
2011 2012 Amount Common size
% Amount Common size %
40000 30000
100 75
50000 37500
100 75
10000 25 12500 25 1000 1500
2.5 3.75
1000 2000
2.0 4.0
2500 6.25 3000 6.0 7500 18.75 9500 19.0
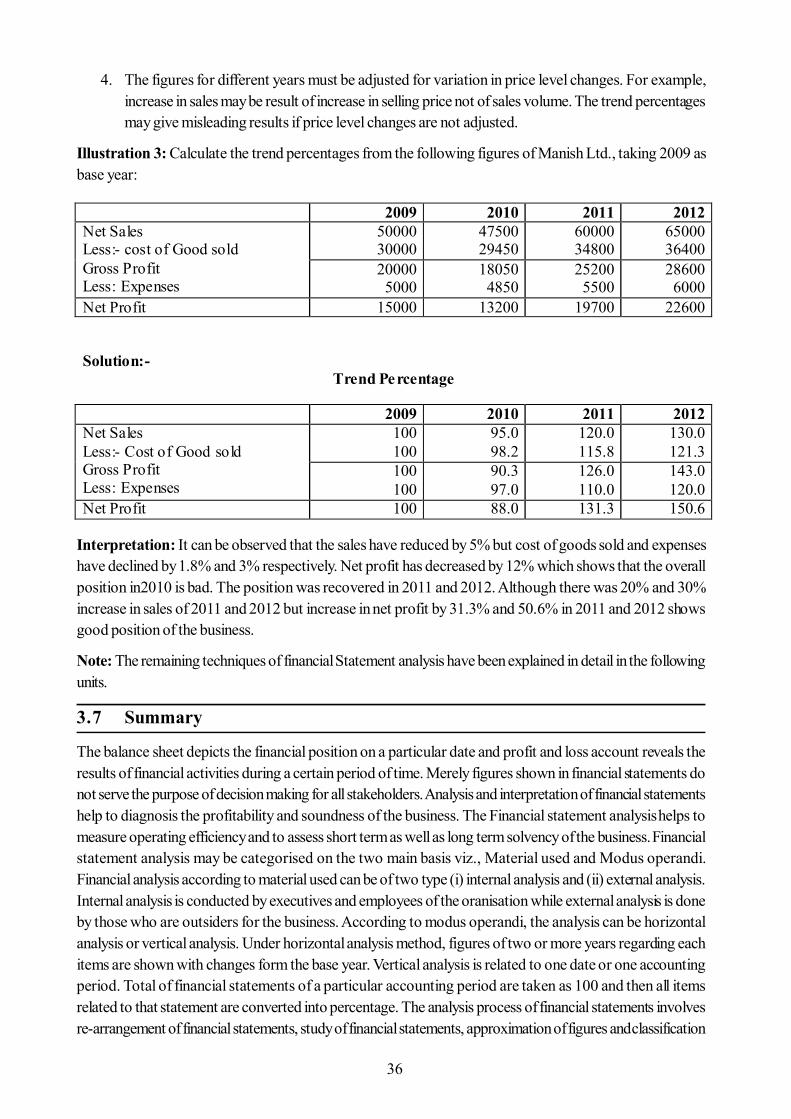
36
4. The figures for different years must be adjusted for variation in price level changes. For example,increase in sales may be result of increase in selling price not of sales volume. The trend percentagesmay give misleading results if price level changes are not adjusted.
Illustration 3: Calculate the trend percentages from the following figures of Manish Ltd., taking 2009 asbase year:
Interpretation: It can be observed that the sales have reduced by 5% but cost of goods sold and expenseshave declined by 1.8% and 3% respectively. Net profit has decreased by 12% which shows that the overallposition in2010 is bad. The position was recovered in 2011 and 2012. Although there was 20% and 30%increase in sales of 2011 and 2012 but increase in net profit by 31.3% and 50.6% in 2011 and 2012 showsgood position of the business.
Note: The remaining techniques of financial Statement analysis have been explained in detail in the followingunits.
3.7 Summary
The balance sheet depicts the financial position on a particular date and profit and loss account reveals theresults of financial activities during a certain period of time. Merely figures shown in financial statements donot serve the purpose of decision making for all stakeholders. Analysis and interpretation of financial statementshelp to diagnosis the profitability and soundness of the business. The Financial statement analysis helps tomeasure operating efficiency and to assess short term as well as long term solvency of the business. Financialstatement analysis may be categorised on the two main basis viz., Material used and Modus operandi.Financial analysis according to material used can be of two type (i) internal analysis and (ii) external analysis.Internal analysis is conducted by executives and employees of the oranisation while external analysis is doneby those who are outsiders for the business. According to modus operandi, the analysis can be horizontalanalysis or vertical analysis. Under horizontal analysis method, figures of two or more years regarding eachitems are shown with changes form the base year. Vertical analysis is related to one date or one accountingperiod. Total of financial statements of a particular accounting period are taken as 100 and then all itemsrelated to that statement are converted into percentage. The analysis process of financial statements involvesre-arrangement of financial statements, study of financial statements, approximation of figures and classification
2009 2010 2011 2012 Net Sales Less:- cost of Good sold Gross Profit Less: Expenses
50000 30000
47500 29450
60000 34800
65000 36400
20000 5000
18050 4850
25200 5500
28600 6000
Net Profit 15000 13200 19700 22600
Solution:- Trend Percentage
2009 2010 2011 2012 Net Sales Less:- Cost of Good sold Gross Profit Less: Expenses
100 100
95.0 98.2
120.0 115.8
130.0 121.3
100 100
90.3 97.0
126.0 110.0
143.0 120.0
Net Profit 100 88.0 131.3 150.6
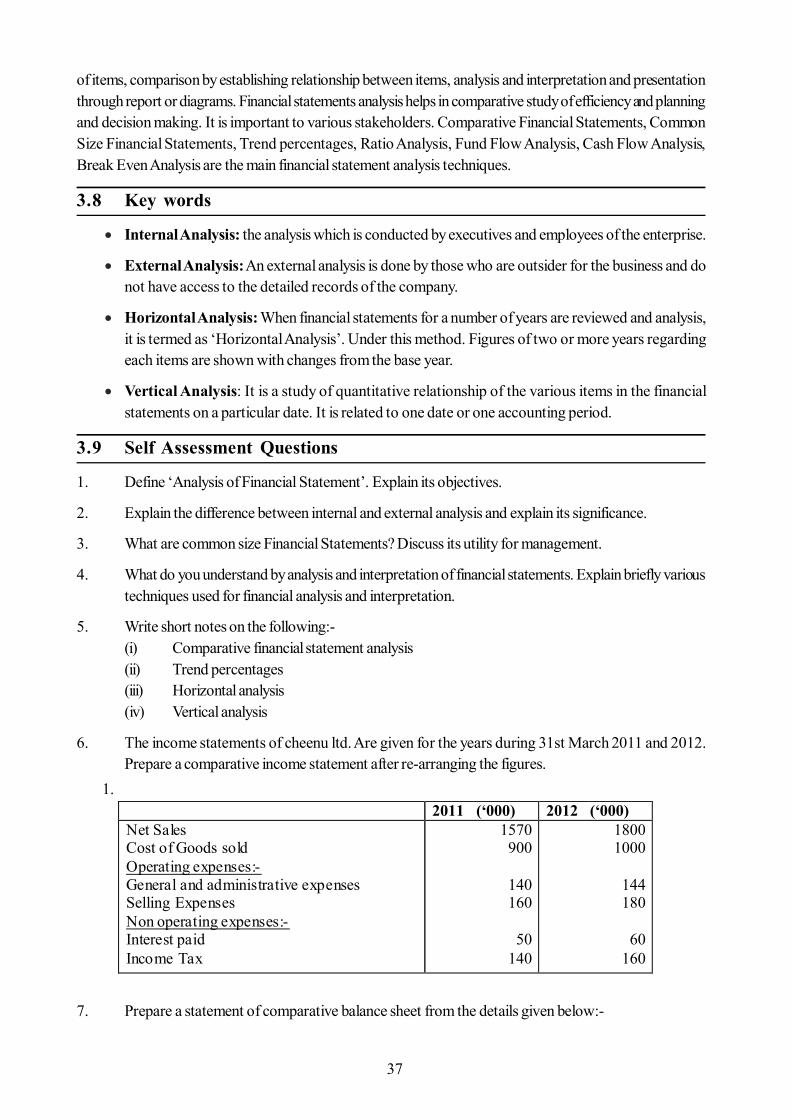
37
of items, comparison by establishing relationship between items, analysis and interpretation and presentationthrough report or diagrams. Financial statements analysis helps in comparative study of efficiency and planningand decision making. It is important to various stakeholders. Comparative Financial Statements, CommonSize Financial Statements, Trend percentages, Ratio Analysis, Fund Flow Analysis, Cash Flow Analysis,Break Even Analysis are the main financial statement analysis techniques.
3.8 Key words
Internal Analysis: the analysis which is conducted by executives and employees of the enterprise.
External Analysis: An external analysis is done by those who are outsider for the business and donot have access to the detailed records of the company.
Horizontal Analysis: When financial statements for a number of years are reviewed and analysis,it is termed as ‘Horizontal Analysis’. Under this method. Figures of two or more years regardingeach items are shown with changes from the base year.
Vertical Analysis: It is a study of quantitative relationship of the various items in the financialstatements on a particular date. It is related to one date or one accounting period.
3.9 Self Assessment Questions
1. Define ‘Analysis of Financial Statement’. Explain its objectives.
2. Explain the difference between internal and external analysis and explain its significance.
3. What are common size Financial Statements? Discuss its utility for management.
4. What do you understand by analysis and interpretation of financial statements. Explain briefly varioustechniques used for financial analysis and interpretation.
5. Write short notes on the following:-(i) Comparative financial statement analysis(ii) Trend percentages(iii) Horizontal analysis(iv) Vertical analysis
6. The income statements of cheenu ltd. Are given for the years during 31st March 2011 and 2012.Prepare a comparative income statement after re-arranging the figures.
7. Prepare a statement of comparative balance sheet from the details given below:-
1. 2011 (‘000) 2012 (‘000) Net Sales Cost of Goods sold Operating expenses:- General and administrative expenses Selling Expenses Non operating expenses:- Interest paid Income Tax
1570 900
140 160
50
140
1800 1000
144 180
60
160
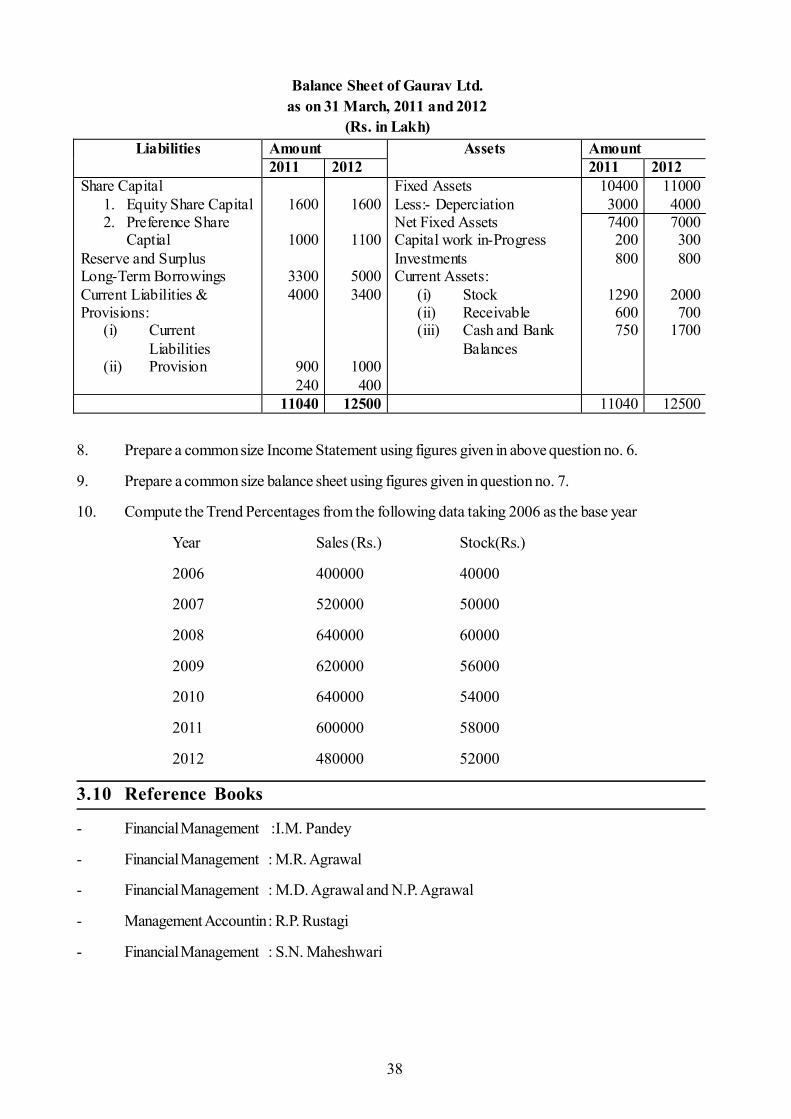
38
8. Prepare a common size Income Statement using figures given in above question no. 6.
9. Prepare a common size balance sheet using figures given in question no. 7.
10. Compute the Trend Percentages from the following data taking 2006 as the base year
Year Sales (Rs.) Stock(Rs.)
2006 400000 40000
2007 520000 50000
2008 640000 60000
2009 620000 56000
2010 640000 54000
2011 600000 58000
2012 480000 52000
3.10 Reference Books
- Financial Management :I.M. Pandey
- Financial Management : M.R. Agrawal
- Financial Management : M.D. Agrawal and N.P. Agrawal
- Management Accountin: R.P. Rustagi
- Financial Management : S.N. Maheshwari
Balance Sheet of Gaurav Ltd. as on 31 March, 2011 and 2012
(Rs. in Lakh) Liabilities Amount Assets Amount
2011 2012 2011 2012 Share Capital
1. Equity Share Capital 2. Preference Share
Captial Reserve and Surplus Long-Term Borrowings Current Liabilities & Provisions:
(i) Current Liabilities
(ii) Provision
1600
1000
3300 4000
900 240
1600
1100
5000 3400
1000 400
Fixed Assets Less:- Deperciation Net Fixed Assets Capital work in-Progress Investments Current Assets:
(i) Stock (ii) Receivable (iii) Cash and Bank
Balances
10400 3000 7400 200 800
1290 600 750
11000 4000 7000 300 800
2000 700
1700
11040 12500 11040 12500
39
Unit - 4 : Ratio Analysis
Structure of Unit:
4.0 Objectives4.1 Introduction4.2 Meaning and Nature4.3 Different Approaches of Interpretation4.4 Advantages of Ratio a Analysis4.5 Limitations of Ratio Analysis4.6 Classification of Ratios4.7 Analysis of liquidity4.8 Analysis of Activity4.9 Analysis of Profitability (Based on Sales, Capital)4.10 Analysis of Longterm Solvency4.11 Analysis of Investment4.12 Preparation of Financial Statements from Ratios4.13 Summary4.14 Self Assessment Questions4.15 Reference Books
4.0 Objectiv1es
After completing this unit, you would be able to:
Under stand nature & importance of Ratio Analysis Know about different approaches of interpretation Point out the limitations and classifications. Analyse and intrepret liquidity of the firm Analyse and intrepret activity of the firm Analyse and intrepret longterm solvency of the firm To learn how ratios are useful in decision for investment
4.1 Introduction
A basic limitation of the traditional financial statement comprising the balance sheet and the profit and lossaccount, provides a summarised view of the financial position and operations of a firm. Different parties areinterested in the financial statement for different purposes and look at them from different angles. Forexample. the debentureholders analyse the statements in order to ascertain the ability to pay
interest and maturity amount. The prospective shareholders would like to know whether the business isprofitable and is progressing on sound lines. The management is interested in the operational efficiency as-well-as financial position of the business. Hence, the main objective of financial analysis is to make detailstudy about the cause and effect of the profitability and financial condition of the firm. Hence, ratio analysisis a tool to predict operational as-well-as financial efficiency of business through analysis & intrepretation offinancial data.
So analysis of financial statement is a process of selection, relation and evaluation. The first task of thefinancial analyst is to select the information relevant to the decision under consideration. The second step is
40
to arrange the information in a way to highlight significant relationships. The final step is interpretation anddrawing of inferences and conclusions.
The present chapter involves an in-depth analysis of financial statements and its use for decision making byvarious parties interested in them.
4.2 Meaning and Nature
The term “Ratio” simply means one number expressed in terms of another. It describes in mathematicalterms the quantitative relationship that exists between two numbers. The term “Accounting Ratio” is used todescribe significant relationship between figures shown on a Balance Sheet, in a Profit and Loss Account.Ratio analysis refers to the analysis and interpretation of financial statements through ratios.
Ratios are customarily presented either in the form of a coefficient or a percentage or as a proportion.Absolute figures may be misleading unless compared, one with another. Ratios provie the means of showingthe relationship that exists between figures. However, the numerical relationships of the kind expressed byratio analysis are not an end in themselves but are a means for understanding the financial position of abusiness. Ratios, by themselves, are meaningless, simple ratrios compiled from a single years’ financialstatements of an enterprise may not serve the real purpose. Besides, in order to reach valid conclusions,ratios are to be worked out from the financial statement of a number of years and have to be compared withsome standards that are established after a systematic review of past experiences. A single ideal standardcannot be applied for all types of business. Each business have its own limitations, hence ideal ratio willdiffer between industries and also differ with size, capital and other factors.
4.3 Different Approaches of Interpretation
Generally, there are four different approaches are available for interpreting ratios.
(A) Interpretation of Individual Ratios: A single ratio fails to reveal the true position. If it relates topreceeding years or compared with same type of other business or studied with reference to somestandards, may be useful. Hence this approach is to be combined with others.
(B) Interpretation by Referring to a Group of Ratios: The analysis could be made more meaningfulby computing some of the additional related ratios. A Change in one ratio may have significanceonly when viewed in relation to other ratios.
(C) Interpetation of Ratios by Trend: It involves a comparison of ratios of a firm overtime. Thetrend ratios indicate the directon of change over the years.
(D) Interpretation by Inter-firm Comparsions: It involves comparison of the ratios of a firm withthose of others in the same line of business or for the industry as a whole reflects its performance inrelation to its competitors.
4.4 Advantages of Ratio a Analysis
1. It is an invaluable aid to management for planning, forecasting, control and decision making.
2. Ratios enable the mass of accounting data to be summarized and simplified.
3. It facilitates better co-ordination and control of performance as-well-as control of costs.
4. It is a tool to assess important characteristics of business like liquidity, solvency, profitabilityetc.
41
5. It is an effective tool of analysis for intra-firm and inter-firm comparisons.
6. It enables a firm to take time dimension into account by using trend analysis of ratios.
7. It enables the easy under standibility for accounting figures, for those who do not know thelanguage of accounting.
8. It is a effective means of communication to the owners and other parties interested therein.
4.5 Limitations of Ratio Analysis
Ratio analysis is a widely used tool of financial analysis yet it suffers from various limitations such as:
1. There are no ideal standards for comparison.
2. Ratios are calculated on the basis of financial statements, but financial statements himself sufferfrom a number of limitations. Hence ratio analysis may fail to serve its purpose.
3. Impact of inflation reflects misleading results, because ratios are calculated on the basis of histori-cal data. Hence inflationary conditions are ignored.
4. Ratios are based on historical data and it is used for future prediction. Hence, forecast for futuremay be wrong.
5. Ratio is just an aid and cannot replace thinking and personal judgement employed in the decisionmaking process.
6. There are no standard formulae for working out ratios and it makes comparison very difficult.
7. Ratios are tools of quantitative analysis only and normal qualitative factors that may generally influenceconclusions derived are ignored while computing ratios.
8. Ratio alone is not adequate. It will be useful when it is used in a group of ratios or compare withover a period of time.
The reliability and significance attached to ratios will largely depend upon the quality of data on which theyare based. They are as good as data itself.
4.6 Classification of Ratios
Ratios may be classified in a number of ways to suit any particular purpose. Different kinds of ratios areselected for different types of situation. In general, the following bases of classification are in vogue.
(A) Classification According to Accounting Statement: This classification is based on the nature ofaccounting statement such as Balance sheet ratios. Profit and loss Account Ratios, combined ratiosetc.
(B) Classification According to Importance: It’s like primary ratios and secondary ratios. Some ofthe ratios are termed as primary and others are termed as subsidiary or supporting ratios.
(C) Classification According to Functions: ratios are grouped as liquidity, Activity, Profitability,longterm solvency and Market analysis ratios.
From the above discussion , it may be observed that one basis of classification blends to another. We aretaking classification according to functions for description.
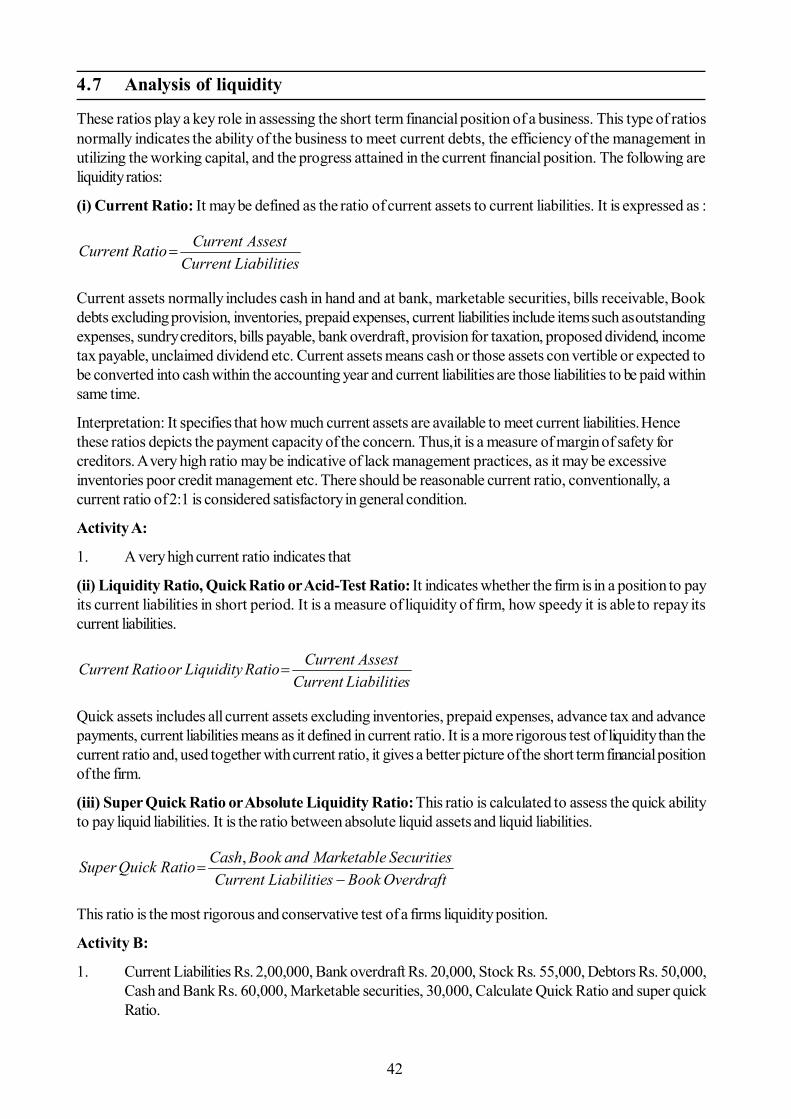
42
4.7 Analysis of liquidity
These ratios play a key role in assessing the short term financial position of a business. This type of ratiosnormally indicates the ability of the business to meet current debts, the efficiency of the management inutilizing the working capital, and the progress attained in the current financial position. The following areliquidity ratios:
(i) Current Ratio: It may be defined as the ratio of current assets to current liabilities. It is expressed as :
sLiabilitieCurrentAssestCurrentRatioCurrent
Current assets normally includes cash in hand and at bank, marketable securities, bills receivable, Bookdebts excluding provision, inventories, prepaid expenses, current liabilities include items such as outstandingexpenses, sundry creditors, bills payable, bank overdraft, provision for taxation, proposed dividend, incometax payable, unclaimed dividend etc. Current assets means cash or those assets con vertible or expected tobe converted into cash within the accounting year and current liabilities are those liabilities to be paid withinsame time.
Interpretation: It specifies that how much current assets are available to meet current liabilities. Hencethese ratios depicts the payment capacity of the concern. Thus,it is a measure of margin of safety forcreditors. A very high ratio may be indicative of lack management practices, as it may be excessiveinventories poor credit management etc. There should be reasonable current ratio, conventionally, acurrent ratio of 2:1 is considered satisfactory in general condition.
Activity A:
1. A very high current ratio indicates that
(ii) Liquidity Ratio, Quick Ratio or Acid-Test Ratio: It indicates whether the firm is in a position to payits current liabilities in short period. It is a measure of liquidity of firm, how speedy it is able to repay itscurrent liabilities.
sLiabilitieCurrentAssestCurrentRatioLiquidityorRatioCurrent
Quick assets includes all current assets excluding inventories, prepaid expenses, advance tax and advancepayments, current liabilities means as it defined in current ratio. It is a more rigorous test of liquidity than thecurrent ratio and, used together with current ratio, it gives a better picture of the short term financial positionof the firm.
(iii) Super Quick Ratio or Absolute Liquidity Ratio: This ratio is calculated to assess the quick abilityto pay liquid liabilities. It is the ratio between absolute liquid assets and liquid liabilities.
OverdraftBooksLiabilitieCurrentSecuritiesMarketableandBookCashRatioQuickSuper
,
This ratio is the most rigorous and conservative test of a firms liquidity position.
Activity B:
1. Current Liabilities Rs. 2,00,000, Bank overdraft Rs. 20,000, Stock Rs. 55,000, Debtors Rs. 50,000,Cash and Bank Rs. 60,000, Marketable securities, 30,000, Calculate Quick Ratio and super quickRatio.
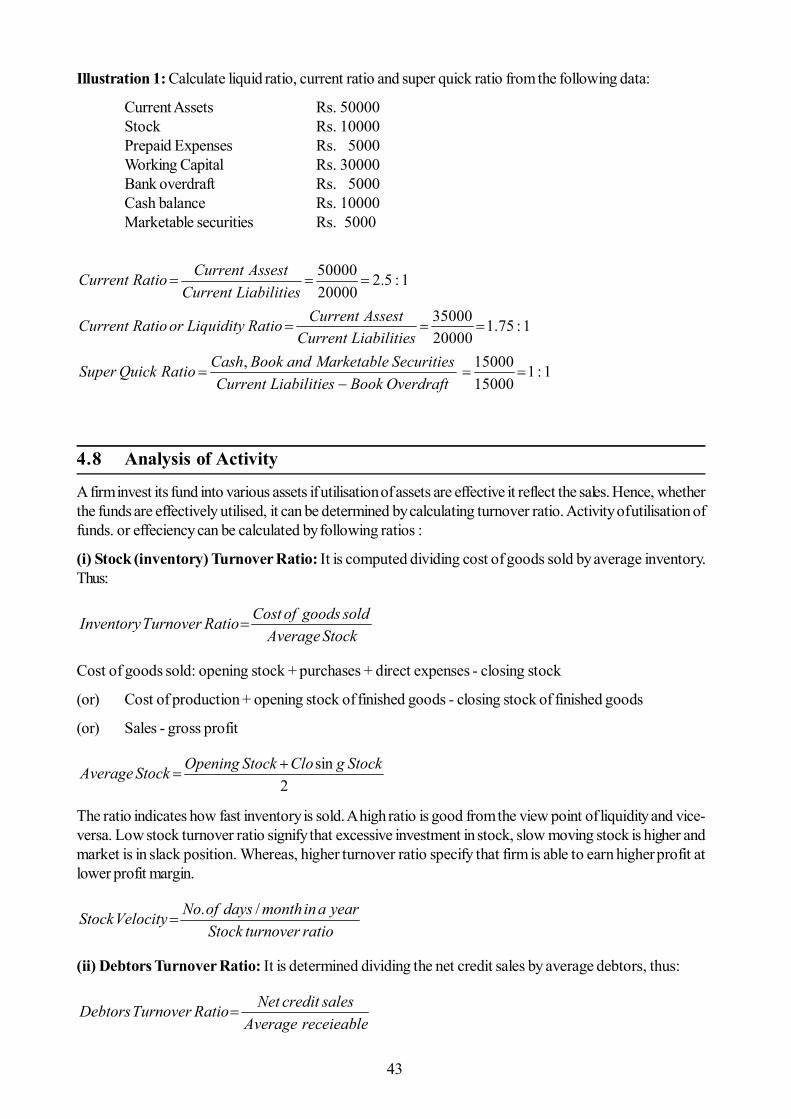
43
Illustration 1: Calculate liquid ratio, current ratio and super quick ratio from the following data:
Current Assets Rs. 50000Stock Rs. 10000Prepaid Expenses Rs. 5000Working Capital Rs. 30000Bank overdraft Rs. 5000Cash balance Rs. 10000Marketable securities Rs. 5000
1:11500015000,
1:75.12000035000
1:5.22000050000
OverdraftBooksLiabilitieCurrentSecuritiesMarketableandBookCashRatioQuickSuper
sLiabilitieCurrentAssestCurrentRatioLiquidityorRatioCurrent
sLiabilitieCurrentAssestCurrentRatioCurrent
4.8 Analysis of Activity
A firm invest its fund into various assets if utilisation of assets are effective it reflect the sales. Hence, whetherthe funds are effectively utilised, it can be determined by calculating turnover ratio. Activity of utilisation offunds. or effeciency can be calculated by following ratios :
(i) Stock (inventory) Turnover Ratio: It is computed dividing cost of goods sold by average inventory.Thus:
StockAveragesoldgoodsofCostRatioTurnoverInventory
Cost of goods sold: opening stock + purchases + direct expenses - closing stock
(or) Cost of production + opening stock of finished goods - closing stock of finished goods
(or) Sales - gross profit
2sin StockgCloStockOpeningStockAverage
The ratio indicates how fast inventory is sold. A high ratio is good from the view point of liquidity and vice-versa. Low stock turnover ratio signify that excessive investment in stock, slow moving stock is higher andmarket is in slack position. Whereas, higher turnover ratio specify that firm is able to earn higher profit atlower profit margin.
ratioturnoverStockyearainmonthdaysofNoVelocityStock /.
(ii) Debtors Turnover Ratio: It is determined dividing the net credit sales by average debtors, thus:
receieableAveragesalescreditNetRatioTurnoverDebtors
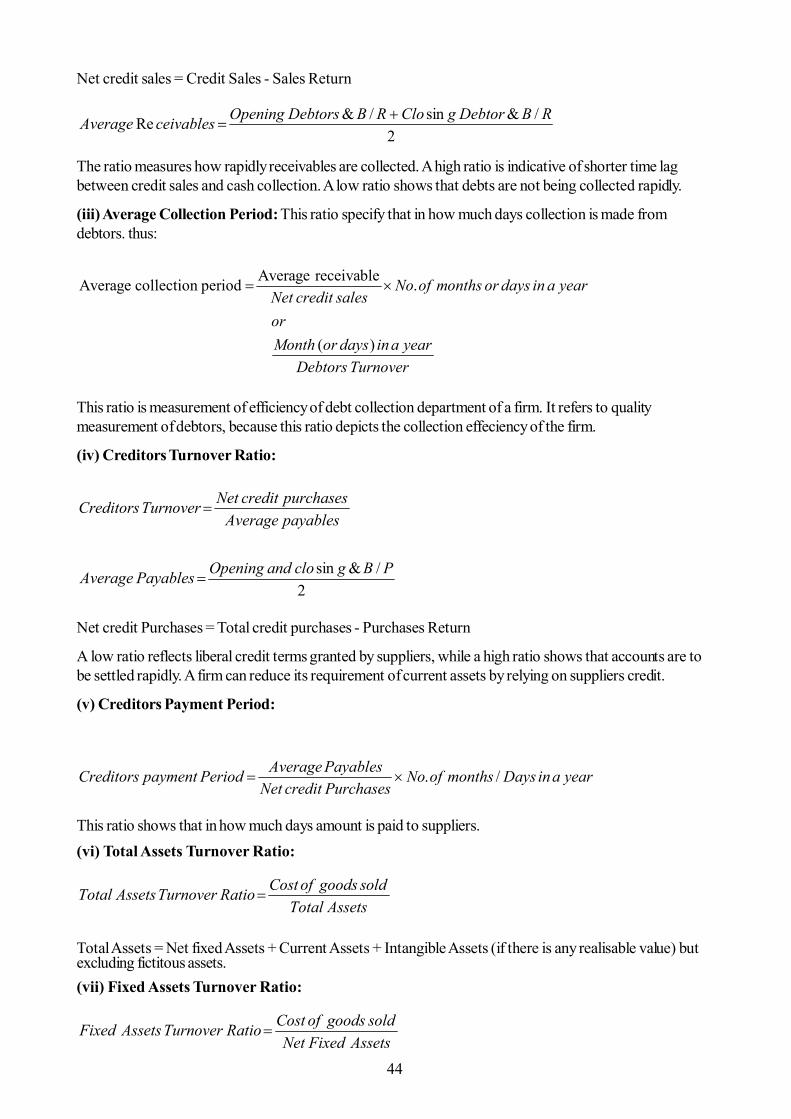
44
Net credit sales = Credit Sales - Sales Return
2/&sin/&Re RBDebtorgCloRBDebtorsOpeningceivablesAverage
The ratio measures how rapidly receivables are collected. A high ratio is indicative of shorter time lagbetween credit sales and cash collection. A low ratio shows that debts are not being collected rapidly.
(iii) Average Collection Period: This ratio specify that in how much days collection is made fromdebtors. thus:
TurnoverDebtorsyearaindaysorMonth
or
yearaindaysormonthsofNosalescreditNet
)(
.receivable Average period collectionAverage
This ratio is measurement of efficiency of debt collection department of a firm. It refers to qualitymeasurement of debtors, because this ratio depicts the collection effeciency of the firm.
(iv) Creditors Turnover Ratio:
2/&sin PBgcloandOpeningPayablesAverage
payablesAveragepurchasescreditNetTurnoverCreditors
Net credit Purchases = Total credit purchases - Purchases Return
A low ratio reflects liberal credit terms granted by suppliers, while a high ratio shows that accounts are tobe settled rapidly. A firm can reduce its requirement of current assets by relying on suppliers credit.
(v) Creditors Payment Period:
yearainDaysmonthsofNoPurchasescreditNetPayablesAveragePeriodpaymentCreditors /.
This ratio shows that in how much days amount is paid to suppliers.(vi) Total Assets Turnover Ratio:
AssetsTotalsoldgoodsofCostRatioTurnoverAssetsTotal
Total Assets = Net fixed Assets + Current Assets + Intangible Assets (if there is any realisable value) butexcluding fictitous assets.(vii) Fixed Assets Turnover Ratio:
AssetsFixedNetsoldgoodsofCostRatioTurnoverAssetsFixed
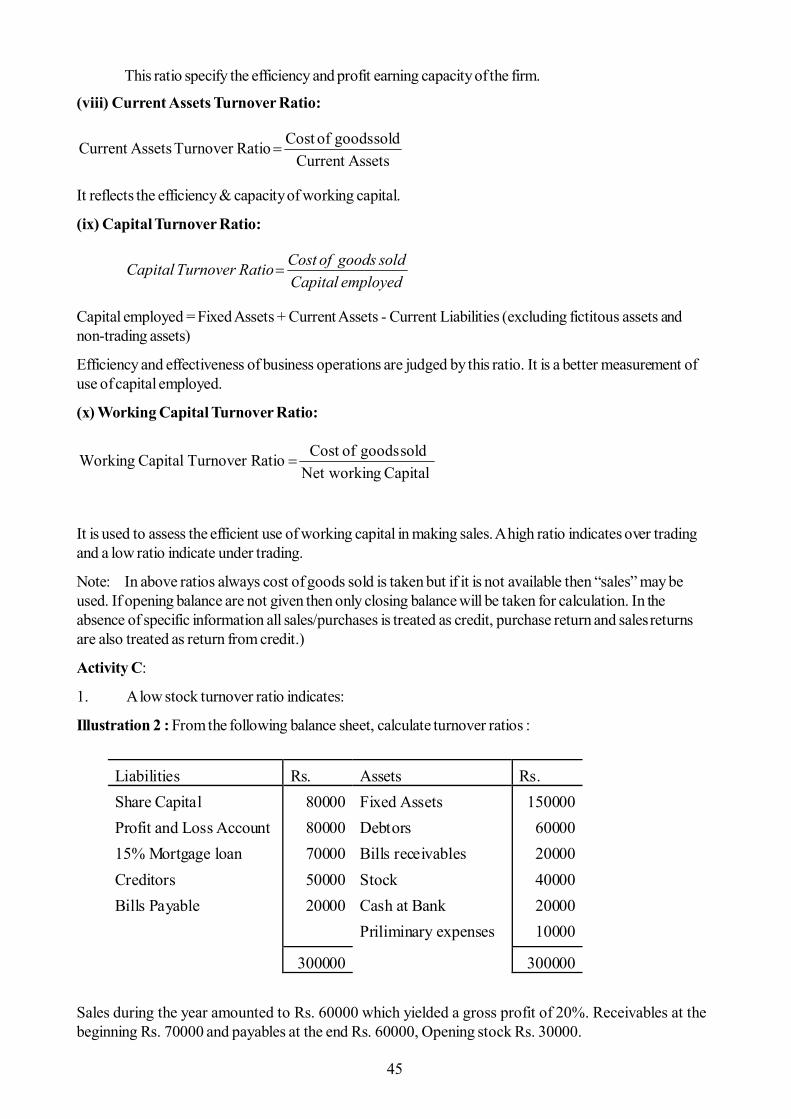
45
This ratio specify the efficiency and profit earning capacity of the firm.
(viii) Current Assets Turnover Ratio:
AssetsCurrentsoldgoodsofCostRatioTurnoverAssetsCurrent
It reflects the efficiency & capacity of working capital.
(ix) Capital Turnover Ratio:
employedCapitalsoldgoodsofCostRatioTurnoverCapital
Capital employed = Fixed Assets + Current Assets - Current Liabilities (excluding fictitous assets andnon-trading assets)
Efficiency and effectiveness of business operations are judged by this ratio. It is a better measurement ofuse of capital employed.
(x) Working Capital Turnover Ratio:
Capital gNet workinsold goods ofCost atioTurnover R Capital Working
It is used to assess the efficient use of working capital in making sales. A high ratio indicates over tradingand a low ratio indicate under trading.
Note: In above ratios always cost of goods sold is taken but if it is not available then “sales” may beused. If opening balance are not given then only closing balance will be taken for calculation. In theabsence of specific information all sales/purchases is treated as credit, purchase return and sales returnsare also treated as return from credit.)
Activity C:
1. A low stock turnover ratio indicates:
Illustration 2 : From the following balance sheet, calculate turnover ratios :
Sales during the year amounted to Rs. 60000 which yielded a gross profit of 20%. Receivables at thebeginning Rs. 70000 and payables at the end Rs. 60000, Opening stock Rs. 30000.
Liabilities Rs. Assets Rs. Share Capital Profit and Loss Account 15% Mortgage loan Creditors Bills Payable
80000 80000 70000 50000 20000
Fixed Assets Debtors Bills receivables Stock Cash at Bank Priliminary expenses
150000 60000 20000 40000 20000 10000
300000 300000
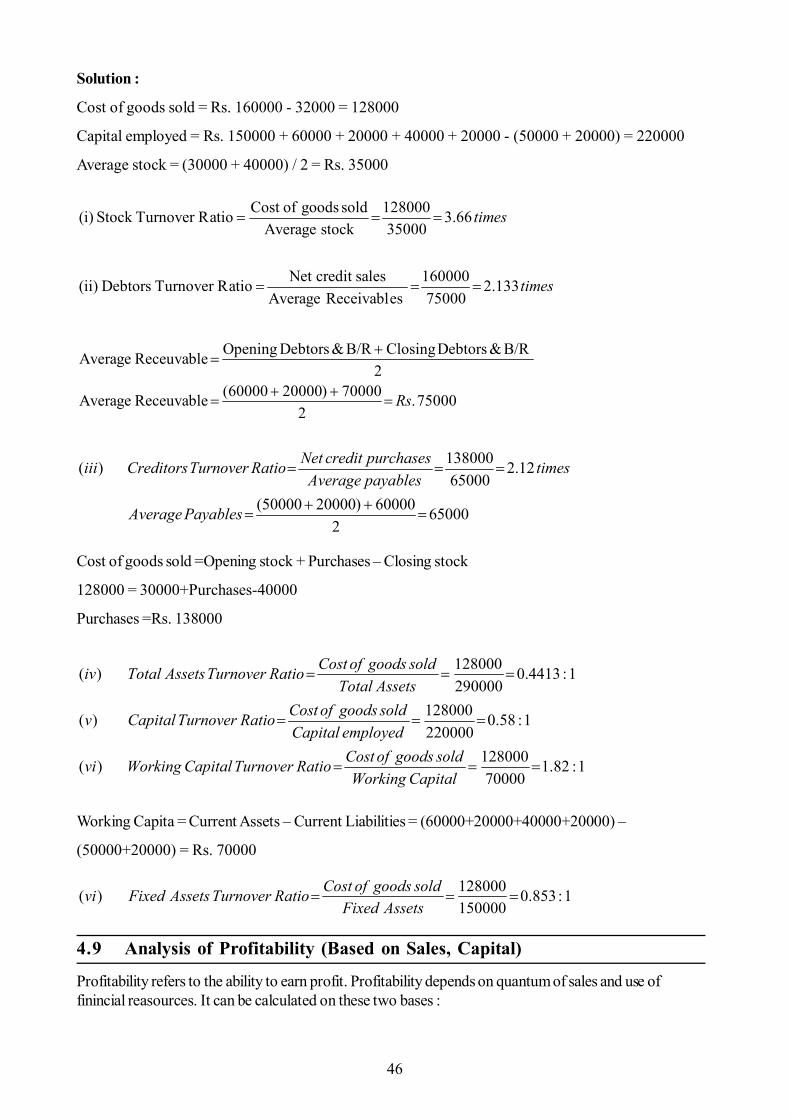
46
Solution :
Cost of goods sold = Rs. 160000 - 32000 = 128000
Capital employed = Rs. 150000 + 60000 + 20000 + 40000 + 20000 - (50000 + 20000) = 220000
Average stock = (30000 + 40000) / 2 = Rs. 35000
times
times
133.275000
160000 es ReceivablAverage
salescredit Net atioTurnover R Debtors(ii)
66.335000
128000stock Average
sold goods ofCost atioTurnover RStock (i)
75000.2
70000)2000060000(ReceuvableAverage
2B/R&DebtorsClosingB/R&DebtorsOpeningReceuvableAverage
Rs
650002
60000)2000050000(
12.265000
138000)(
PayablesAverage
timespayablesAveragepurchasescreditNetRatioTurnoverCreditorsiii
Cost of goods sold =Opening stock + Purchases – Closing stock
128000 = 30000+Purchases-40000
Purchases =Rs. 138000
1:82.170000
128000)(
1:58.0220000128000)(
1:4413.0290000128000)(
CapitalWorkingsoldgoodsofCostRatioTurnoverCapitalWorkingvi
employedCapitalsoldgoodsofCostRatioTurnoverCapitalv
AssetsTotalsoldgoodsofCostRatioTurnoverAssetsTotaliv
Working Capita = Current Assets – Current Liabilities = (60000+20000+40000+20000) –
(50000+20000) = Rs. 70000
1:853.0150000128000)(
AssetsFixedsoldgoodsofCostRatioTurnoverAssetsFixedvi
4.9 Analysis of Profitability (Based on Sales, Capital)
Profitability refers to the ability to earn profit. Profitability depends on quantum of sales and use offinincial reasources. It can be calculated on these two bases :
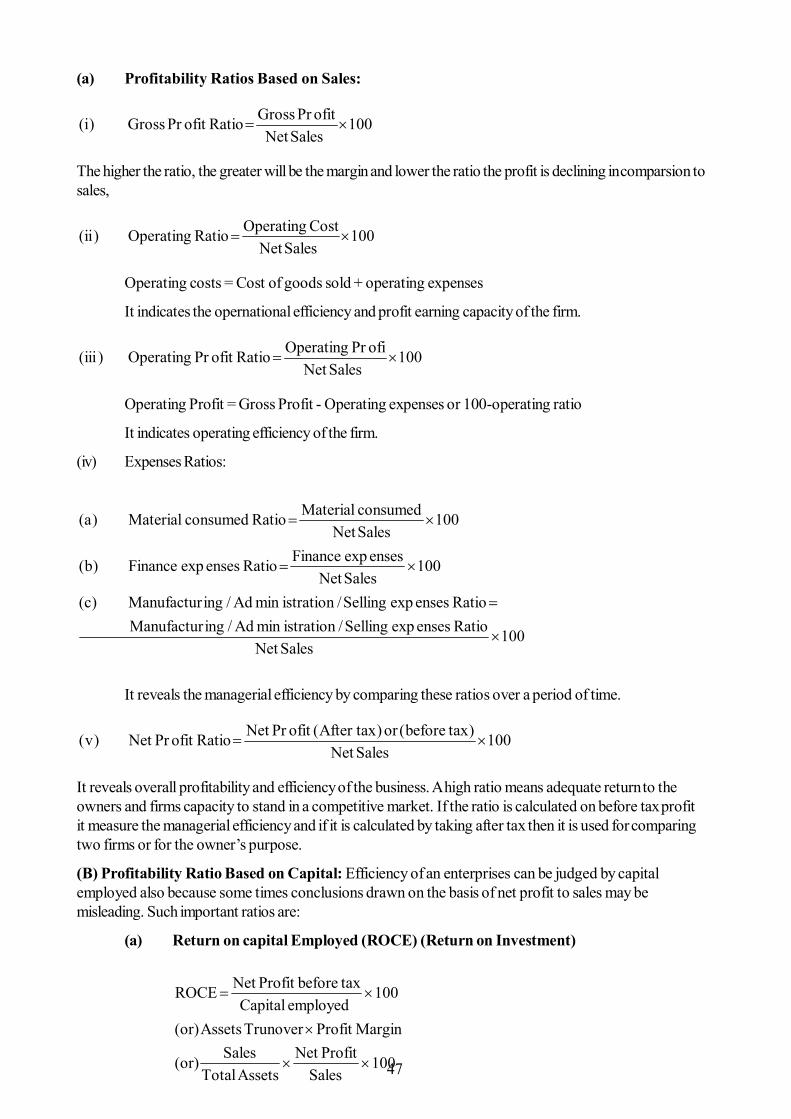
47
(a) Profitability Ratios Based on Sales:
100SalesNet
ofitPrGrossRatioofitPrGross)i(
The higher the ratio, the greater will be the margin and lower the ratio the profit is declining in comparsion tosales,
100SalesNet
CostOperatingRatioOperating)ii(
Operating costs = Cost of goods sold + operating expenses
It indicates the opernational efficiency and profit earning capacity of the firm.
100SalesNet
ofiPrOperatingRatioofitPrOperating)iii(
Operating Profit = Gross Profit - Operating expenses or 100-operating ratio
It indicates operating efficiency of the firm.
(iv) Expenses Ratios:
100SalesNet
RatioensesexpSelling/istrationminAd/ingManufacturRatioensesexpSelling/istrationminAd/ingManufactur)c(
100SalesNet
ensesexpFinanceRatioensesexpFinance)b(
100SalesNetconsumedMaterialRatioconsumedMaterial)a(
It reveals the managerial efficiency by comparing these ratios over a period of time.
100SalesNet
)taxbefore(or)taxAfter(ofitPrNetRatioofitPrNet)v(
It reveals overall profitability and efficiency of the business. A high ratio means adequate return to theowners and firms capacity to stand in a competitive market. If the ratio is calculated on before tax profitit measure the managerial efficiency and if it is calculated by taking after tax then it is used for comparingtwo firms or for the owner’s purpose.
(B) Profitability Ratio Based on Capital: Efficiency of an enterprises can be judged by capitalemployed also because some times conclusions drawn on the basis of net profit to sales may bemisleading. Such important ratios are:
(a) Return on capital Employed (ROCE) (Return on Investment)
100Sales
ProfitNetAssetsTotal
Sales(or)
MarginProfitTrunoverAssets(or)
100employedCapital
taxbeforeProfitNetROCE
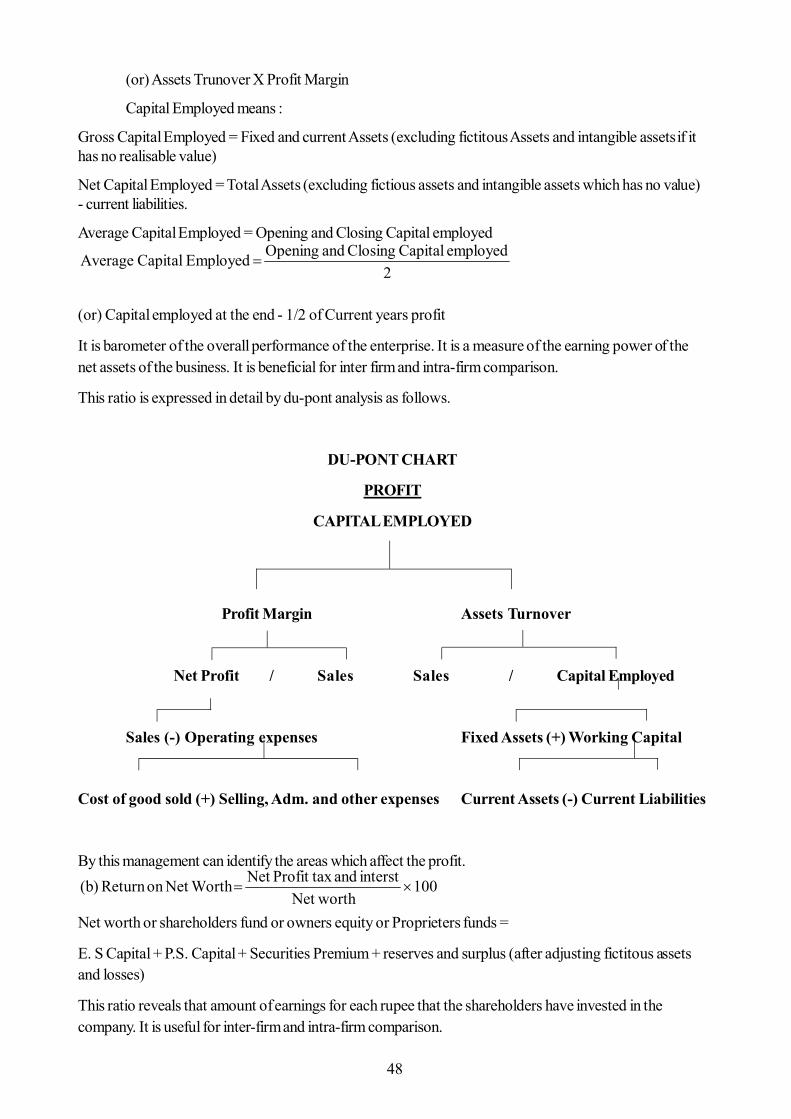
48
(or) Assets Trunover X Profit Margin
Capital Employed means :
Gross Capital Employed = Fixed and current Assets (excluding fictitous Assets and intangible assets if ithas no realisable value)
Net Capital Employed = Total Assets (excluding fictious assets and intangible assets which has no value)- current liabilities.
Average Capital Employed = Opening and Closing Capital employed
2employedCapitalClosingandOpeningEmployedCapital Average
(or) Capital employed at the end - 1/2 of Current years profit
It is barometer of the overall performance of the enterprise. It is a measure of the earning power of thenet assets of the business. It is beneficial for inter firm and intra-firm comparison.
This ratio is expressed in detail by du-pont analysis as follows.
DU-PONT CHART
PROFIT
CAPITAL EMPLOYED
Profit Margin Assets Turnover
Net Profit / Sales Sales / Capital Employed
Sales (-) Operating expenses Fixed Assets (+) Working Capital
Cost of good sold (+) Selling, Adm. and other expenses Current Assets (-) Current Liabilities
By this management can identify the areas which affect the profit.100
worthNetinterstandtaxProfitNetWorthNetonReturn(b)
Net worth or shareholders fund or owners equity or Proprieters funds =
E. S Capital + P.S. Capital + Securities Premium + reserves and surplus (after adjusting fictitous assetsand losses)
This ratio reveals that amount of earnings for each rupee that the shareholders have invested in thecompany. It is useful for inter-firm and intra-firm comparison.
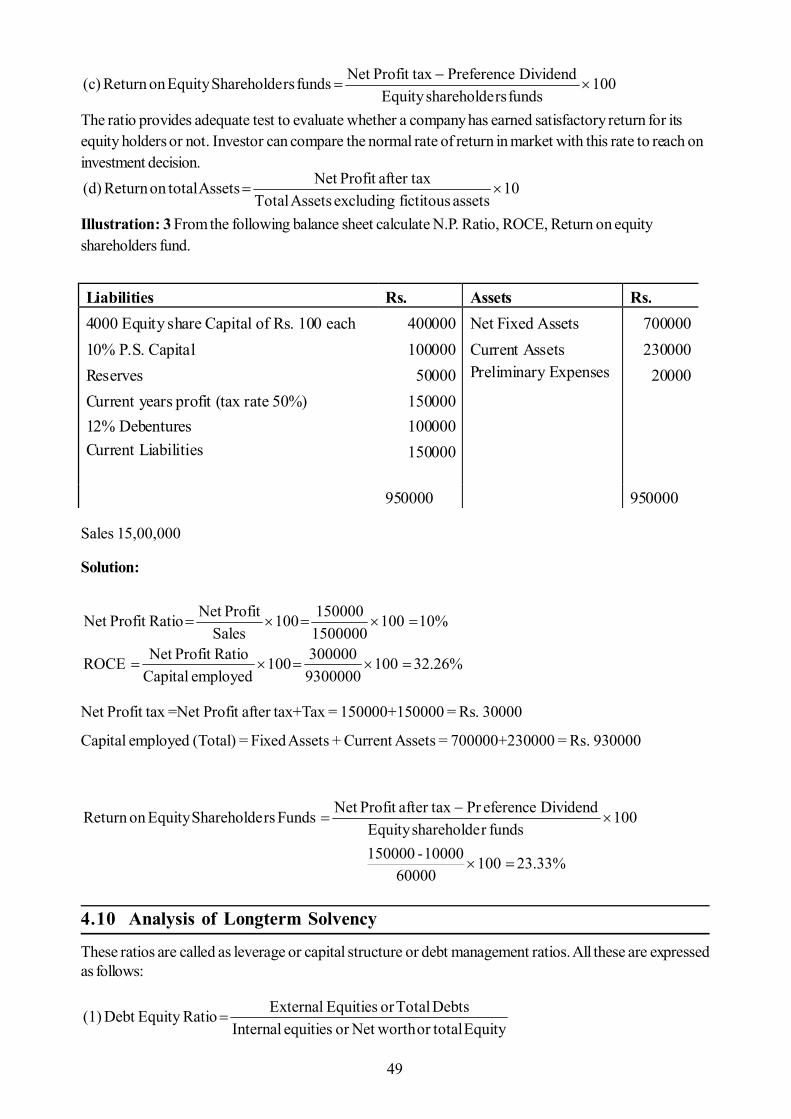
49
100fundsrsshareholdeEquity
DividendPreferencetaxProfitNetfundsrsShareholdeEquityonReturn(c)
The ratio provides adequate test to evaluate whether a company has earned satisfactory return for itsequity holders or not. Investor can compare the normal rate of return in market with this rate to reach oninvestment decision.
10assetsfictitousexcludingAssetsTotal
taxafterProfitNetAssetstotalonReturn(d)
Illustration: 3 From the following balance sheet calculate N.P. Ratio, ROCE, Return on equityshareholders fund.
Sales 15,00,000
Solution:
%26.231009300000300000100
employedCapitalRatioProfitNetROCE
10%1001500000150000100
SalesProfitNetRatioProfitNet
Net Profit tax =Net Profit after tax+Tax = 150000+150000 = Rs. 30000
Capital employed (Total) = Fixed Assets + Current Assets = 700000+230000 = Rs. 930000
100
%33.2310060000
10000-150000fundsrshareholdeEquity
DividendeferencePrtaxfteraProfitNetFundsrsShareholdeEquityoneturnR
4.10 Analysis of Longterm Solvency
These ratios are called as leverage or capital structure or debt management ratios. All these are expressedas follows:
EquitytotalorworthNetorequitiesInternalDebtsTotalorEquitiesExternalRatioEquityDebt(1)
Liabilities Rs. Assets Rs. 4000 Equity share Capital of Rs. 100 each 10% P.S. Capital Reserves Current years profit (tax rate 50%) 12% Debentures Current Liabilities
400000 100000
50000 150000 100000 150000
Net Fixed Assets Current Assets Preliminary Expenses
700000 230000
20000
950000 950000
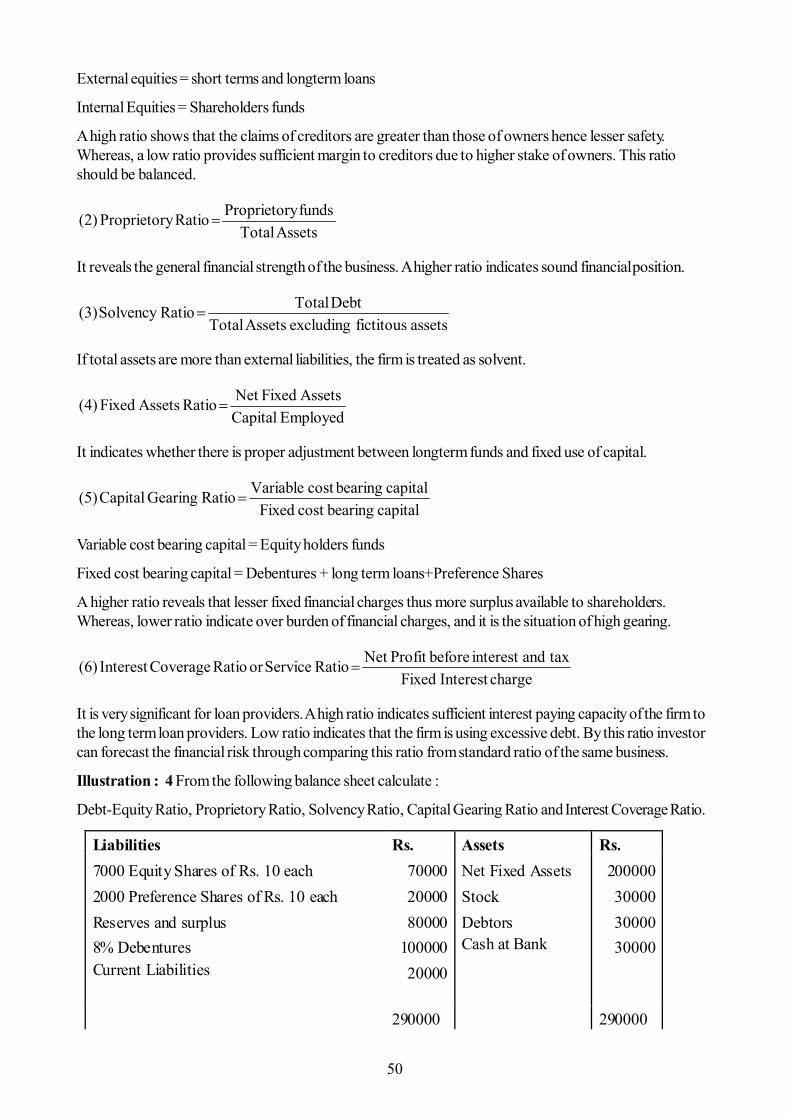
50
External equities = short terms and longterm loans
Internal Equities = Shareholders funds
A high ratio shows that the claims of creditors are greater than those of owners hence lesser safety.Whereas, a low ratio provides sufficient margin to creditors due to higher stake of owners. This ratioshould be balanced.
AssetsTotalfundsroprietoryPRatioroprietoryP(2)
It reveals the general financial strength of the business. A higher ratio indicates sound financial position.
assets fictitous excluding AssetsTotalDebtTotalRatioSolvency(3)
If total assets are more than external liabilities, the firm is treated as solvent.
EmployedCapitalAssetsFixedNetRatioAssetsFixed(4)
It indicates whether there is proper adjustment between longterm funds and fixed use of capital.
capitalbearingcost FixedcapitalbearingcostVariableRatioGearingCapital(5)
Variable cost bearing capital = Equity holders funds
Fixed cost bearing capital = Debentures + long term loans+Preference Shares
A higher ratio reveals that lesser fixed financial charges thus more surplus available to shareholders.Whereas, lower ratio indicate over burden of financial charges, and it is the situation of high gearing.
chargeInterestFixed taxandinterest beforeProfitNetRatioServiceorRatioCoverageInterest(6)
It is very significant for loan providers. A high ratio indicates sufficient interest paying capacity of the firm tothe long term loan providers. Low ratio indicates that the firm is using excessive debt. By this ratio investorcan forecast the financial risk through comparing this ratio from standard ratio of the same business.
Illustration : 4 From the following balance sheet calculate :
Debt-Equity Ratio, Proprietory Ratio, Solvency Ratio, Capital Gearing Ratio and Interest Coverage Ratio.
Liabilities Rs. Assets Rs. 7000 Equity Shares of Rs. 10 each 2000 Preference Shares of Rs. 10 each Reserves and surplus 8% Debentures Current Liabilities
70000 20000 80000
100000 20000
Net Fixed Assets Stock Debtors Cash at Bank
200000 30000 30000 30000
290000 290000
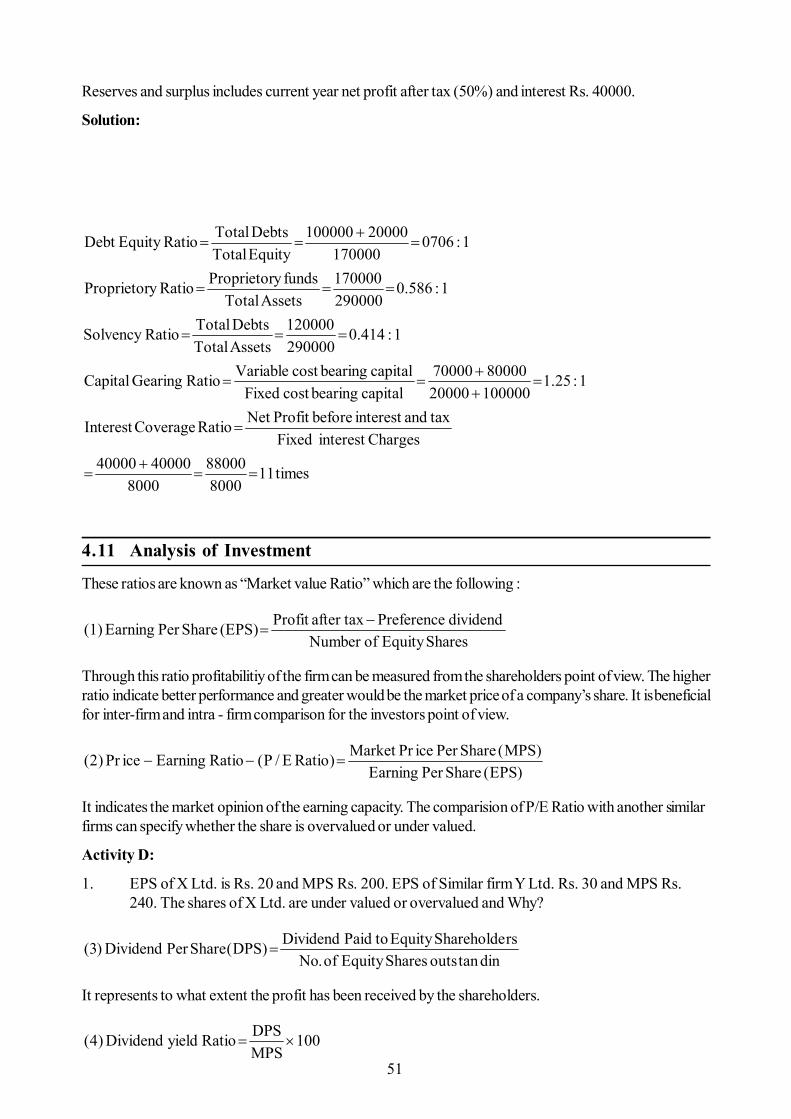
51
Reserves and surplus includes current year net profit after tax (50%) and interest Rs. 40000.
Solution:
times11800088000
80004000040000
ChargesinterestFixedtaxandinterestbeforeProfitNetRatioCoverageInterest
1:1.25100000200008000070000
capitalbearingcostFixedcapitalbearingcostVariableRatioGearingCapital
1:0.414290000120000
AssetsTotalDebtsTotalRatioSolvency
1:0.586290000170000
AssetsTotalfundsyProprietorRatioyProprietor
1:0706170000
20000100000EquityTotalDebtsTotalRatioEquityDebt
4.11 Analysis of Investment
These ratios are known as “Market value Ratio” which are the following :
SharesEquityofNumberdividendPreferencetaxafterProfit(EPS)SharePerEarning(1)
Through this ratio profitabilitiy of the firm can be measured from the shareholders point of view. The higherratio indicate better performance and greater would be the market price of a company’s share. It is beneficialfor inter-firm and intra - firm comparison for the investors point of view.
)EPS(SharePerEarning)MPS(SharePericePrMarket)RatioE/P(RatioEarningicePr)2(
It indicates the market opinion of the earning capacity. The comparision of P/E Ratio with another similarfirms can specify whether the share is overvalued or under valued.
Activity D:
1. EPS of X Ltd. is Rs. 20 and MPS Rs. 200. EPS of Similar firm Y Ltd. Rs. 30 and MPS Rs.240. The shares of X Ltd. are under valued or overvalued and Why?
dintanoutsSharesEquityof.NorsShareholdeEquitytoPaidDividend)DPS(SharePerDividend)3(
It represents to what extent the profit has been received by the shareholders.
100MPSDPSRatioyieldDividend)4(
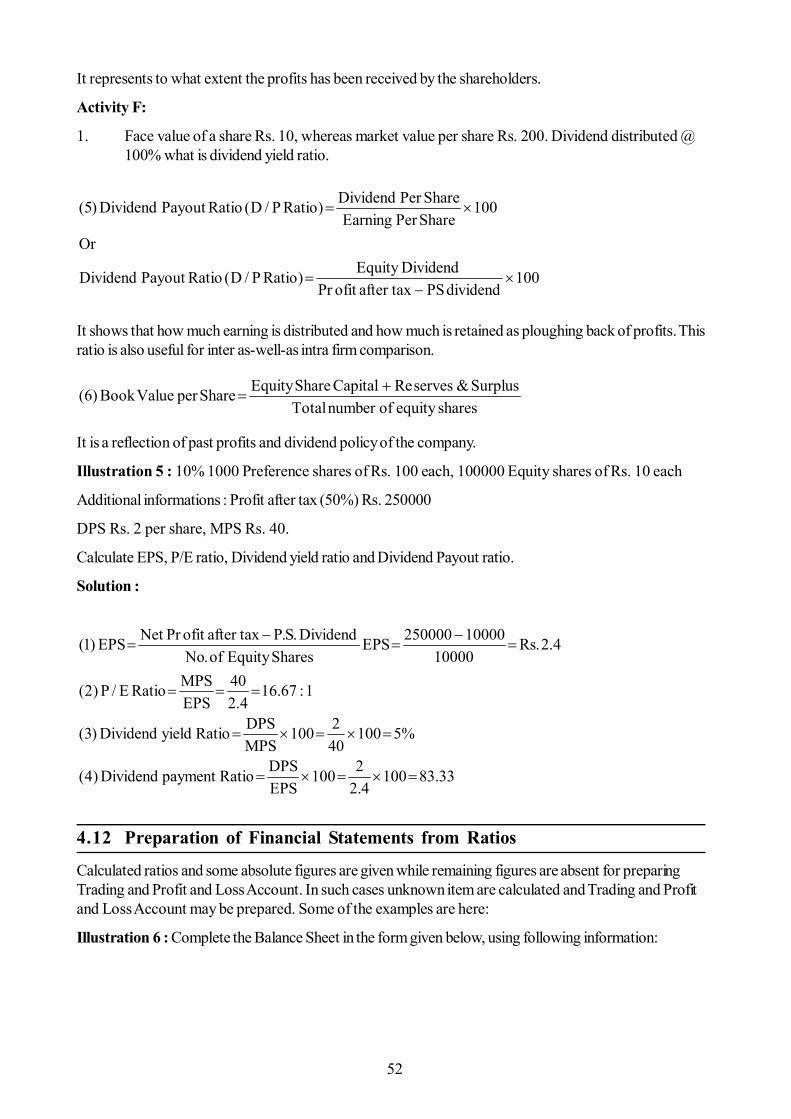
52
It represents to what extent the profits has been received by the shareholders.
Activity F:
1. Face value of a share Rs. 10, whereas market value per share Rs. 200. Dividend distributed @100% what is dividend yield ratio.
100dividendPStaxafterofitPr
DividendEquity)RatioP/D(RatioPayoutDividend
Or
100SharePerEarningSharePerDividend)RatioP/D(RatioPayoutDividend)5(
It shows that how much earning is distributed and how much is retained as ploughing back of profits. Thisratio is also useful for inter as-well-as intra firm comparison.
sharesequityofnumberTotalSurplus&servesReCapitalShareEquityShareperValueBook)6(
It is a reflection of past profits and dividend policy of the company.
Illustration 5 : 10% 1000 Preference shares of Rs. 100 each, 100000 Equity shares of Rs. 10 each
Additional informations : Profit after tax (50%) Rs. 250000
DPS Rs. 2 per share, MPS Rs. 40.
Calculate EPS, P/E ratio, Dividend yield ratio and Dividend Payout ratio.
Solution :
33.831004.2
2100EPSDPSRatiopaymentDividend)4(
%5100402100
MPSDPSRatioyieldDividend)3(
1:67.164.2
40EPSMPSRatioE/P)2(
4.2.Rs10000
10000250000EPSSharesEquityof.No
Dividend.S.PtaxafterofitPrNetEPS)1(
4.12 Preparation of Financial Statements from Ratios
Calculated ratios and some absolute figures are given while remaining figures are absent for preparingTrading and Profit and Loss Account. In such cases unknown item are calculated and Trading and Profitand Loss Account may be prepared. Some of the examples are here:
Illustration 6 : Complete the Balance Sheet in the form given below, using following information:
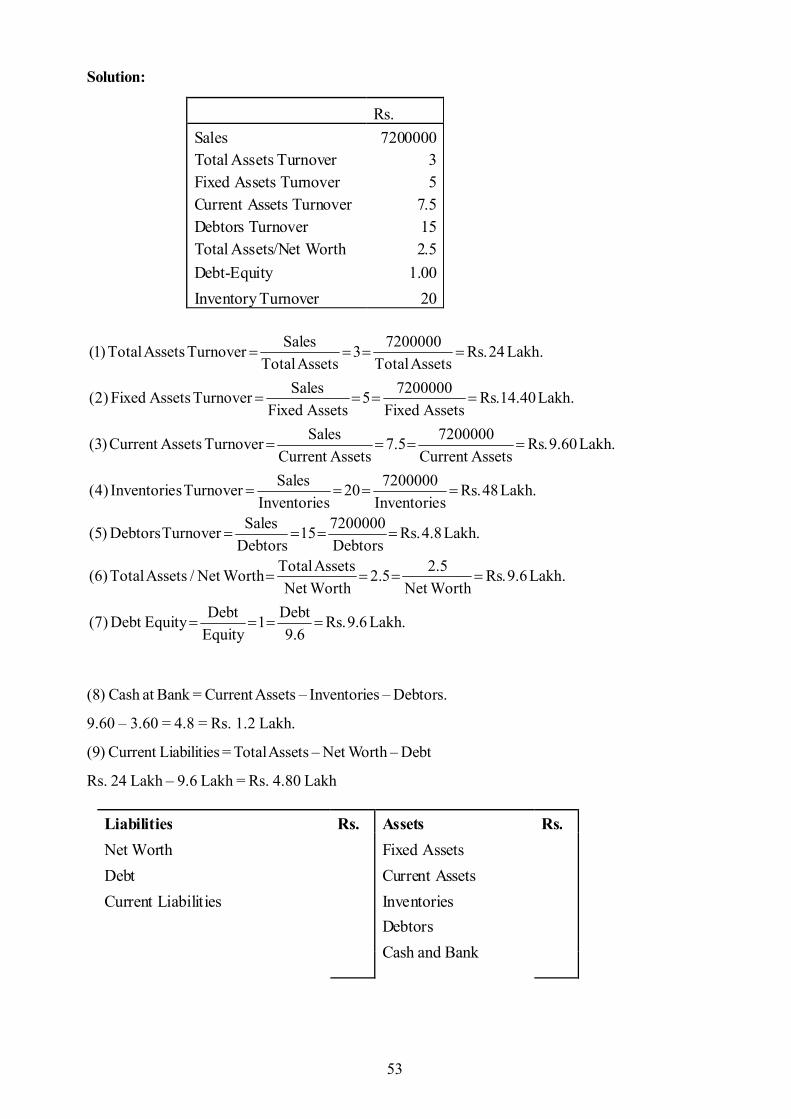
53
Solution:
.Lakh6.9.Rs6.9
Debt1EquityDebtEquityDebt)7(
.Lakh6.9.RsWorthNet
5.25.2WorthNetAssetsTotalWorthNet/AssetsTotal)6(
.Lakh8.4.RsDebtors720000015
DebtorsSalesTurnoverDebtors)5(
.Lakh48.RssInventorie
720000020sInventorie
SalesTurnoversInventorie)4(
.Lakh60.9.RsAssetsCurrent
72000005.7AssetsCurrent
SalesTurnoverAssetsCurrent)3(
.Lakh40.14.RsAssetsFixed
72000005AssetsFixed
SalesTurnoverAssetsFixed)2(
.Lakh24.RsAssetsTotal
72000003AssetsTotal
SalesTurnoverAssetsTotal)1(
(8) Cash at Bank = Current Assets – Inventories – Debtors.
9.60 – 3.60 = 4.8 = Rs. 1.2 Lakh.
(9) Current Liabilities = Total Assets – Net Worth – Debt
Rs. 24 Lakh – 9.6 Lakh = Rs. 4.80 Lakh
Rs. Sales Total Assets Turnover Fixed Assets Turnover Current Assets Turnover Debtors Turnover Total Assets/Net Worth Debt-Equity Inventory Turnover
7200000 3 5
7.5 15 2.5
1.00 20
Liabilities Rs. Assets Rs. Net Worth Debt Current Liabilities
Fixed Assets Current Assets Inventories Debtors Cash and Bank
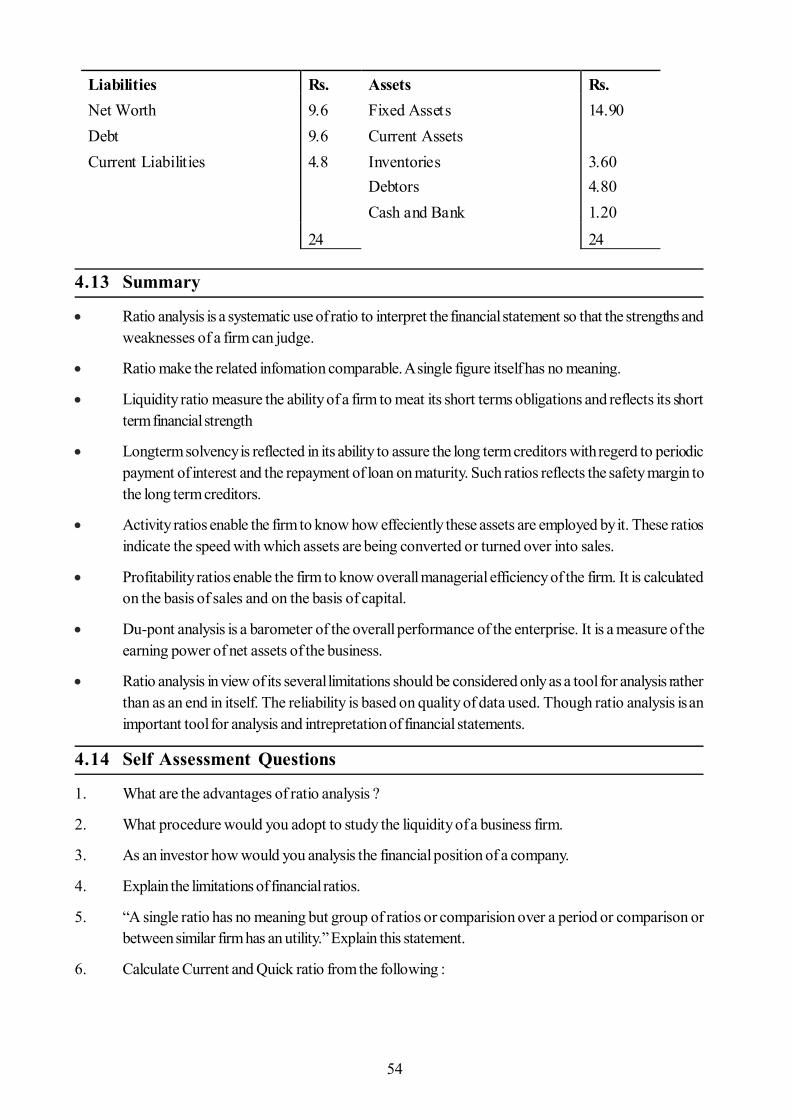
54
4.13 Summary
Ratio analysis is a systematic use of ratio to interpret the financial statement so that the strengths andweaknesses of a firm can judge.
Ratio make the related infomation comparable. A single figure itself has no meaning.
Liquidity ratio measure the ability of a firm to meat its short terms obligations and reflects its shortterm financial strength
Longterm solvency is reflected in its ability to assure the long term creditors with regerd to periodicpayment of interest and the repayment of loan on maturity. Such ratios reflects the safety margin tothe long term creditors.
Activity ratios enable the firm to know how effeciently these assets are employed by it. These ratiosindicate the speed with which assets are being converted or turned over into sales.
Profitability ratios enable the firm to know overall managerial efficiency of the firm. It is calculatedon the basis of sales and on the basis of capital.
Du-pont analysis is a barometer of the overall performance of the enterprise. It is a measure of theearning power of net assets of the business.
Ratio analysis in view of its several limitations should be considered only as a tool for analysis ratherthan as an end in itself. The reliability is based on quality of data used. Though ratio analysis is animportant tool for analysis and intrepretation of financial statements.
4.14 Self Assessment Questions
1. What are the advantages of ratio analysis ?
2. What procedure would you adopt to study the liquidity of a business firm.
3. As an investor how would you analysis the financial position of a company.
4. Explain the limitations of financial ratios.
5. “A single ratio has no meaning but group of ratios or comparision over a period or comparison orbetween similar firm has an utility.” Explain this statement.
6. Calculate Current and Quick ratio from the following :
Liabilities Rs. Assets Rs. Net Worth Debt Current Liabilities
9.6 9.6 4.8
Fixed Assets Current Assets Inventories Debtors Cash and Bank
14.90 3.60 4.80 1.20
24 24
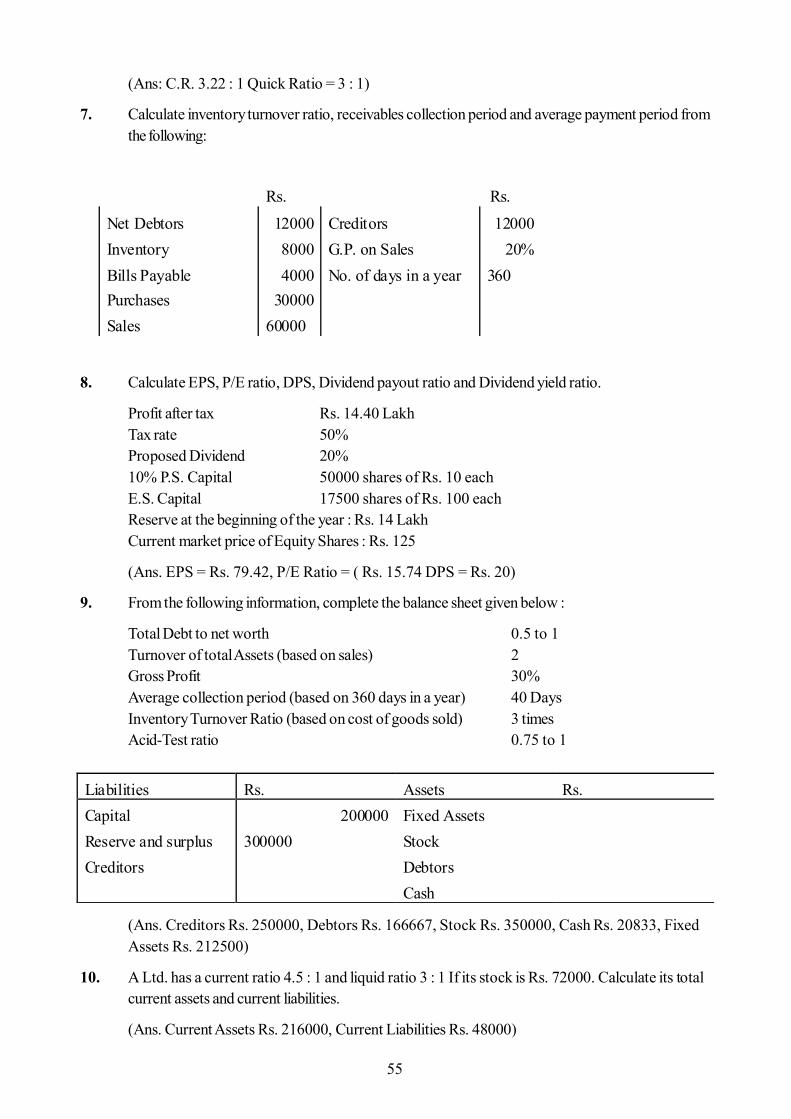
55
(Ans: C.R. 3.22 : 1 Quick Ratio = 3 : 1)
7. Calculate inventory turnover ratio, receivables collection period and average payment period fromthe following:
8. Calculate EPS, P/E ratio, DPS, Dividend payout ratio and Dividend yield ratio.
Profit after tax Rs. 14.40 LakhTax rate 50%Proposed Dividend 20%10% P.S. Capital 50000 shares of Rs. 10 eachE.S. Capital 17500 shares of Rs. 100 eachReserve at the beginning of the year : Rs. 14 LakhCurrent market price of Equity Shares : Rs. 125
(Ans. EPS = Rs. 79.42, P/E Ratio = ( Rs. 15.74 DPS = Rs. 20)
9. From the following information, complete the balance sheet given below :
Total Debt to net worth 0.5 to 1Turnover of total Assets (based on sales) 2Gross Profit 30%Average collection period (based on 360 days in a year) 40 DaysInventory Turnover Ratio (based on cost of goods sold) 3 timesAcid-Test ratio 0.75 to 1
(Ans. Creditors Rs. 250000, Debtors Rs. 166667, Stock Rs. 350000, Cash Rs. 20833, FixedAssets Rs. 212500)
10. A Ltd. has a current ratio 4.5 : 1 and liquid ratio 3 : 1 If its stock is Rs. 72000. Calculate its totalcurrent assets and current liabilities.
(Ans. Current Assets Rs. 216000, Current Liabilities Rs. 48000)
Rs. Rs.
Net Debtors Inventory Bills Payable Purchases Sales
12000 8000 4000
30000 60000
Creditors G.P. on Sales No. of days in a year
12000 20%
360
Liabilities Rs. Assets Rs. Capital Reserve and surplus Creditors
200000 300000
Fixed Assets Stock Debtors Cash

56
11. Rs. 200000 is net sales of a firm. If stock turnover ratio is 4 times. calculate the stock at the end ofthe year. If stock at the end is 1.5 times of that in the beginning
(Ans : Stock at the end Rs. 60000)
4.15 Reference Books
- Higgin R.C.: Analysis for financial management (Irwin, Megraw-Hill, Boston) 2000
- Khan M.Y. : Financial management, Text, Problems and cases (Tata Mcgraw-Hill Publishing companyLtd., New Delhi) 2007a
- Agrawal M.R. : Financial Management (Garima Publications, Jaipur) 2012
- Maheshwari S.N. : Management Accountancy (Sultan chand and sons, New Delhi) 2010
57
Unit - 5 : Funds Flow Statement
Structure of Unit:
5.0 Objectives5.1 Introduction5.2 Meaning of Fund Funds Flow Statement5.3 Objectives of Fund Flow Statement5.4 Sources and Uses of Fund5.5 Difference Between Fund Flow Statement and Other Financial Statements5.6 Techniques of Preparing Fund Flow Statement5.7 Importance of Fund Flow Statement5.8 Limitation of Fund Flow Statement5.9 Summary5.10 Self Assessment Questions5.11 Reference Books
5.0 Objectives
After completing this lesson, you will able to:
Understand the meaning of Fund Flow Statement Know the difference between fund flow statement and other financial statement Know the purpose of preparing fund flow statement Prepare fund flow statement Identified the sources and uses of fund Describe the importance and limitation of fund flow statement
5.1 Introduction
The main financial statements of business are Balance Sheet and Profit and Loss Account. These financialstatements show the financial passions as on a particular date and the profit or loss of the particular period.But these statements do not provide the information about the availability of fund, the sources of fund andwhere the funds were utilized during the particular period. It is necessary to management to know about theavailability of fund, sources of fund and uses of fund for the future planning and decision making. Therefore,a fund flow statement is prepared. Fund flow statement provides the information about availability, sourcesand uses of fund.
In India, the institute of Charted Accounts has issued Accounting Standard-3 for preparing the statement onthe basis of working capital called ‘Statement of Change in Financial Position’. But in March, 1997, theinstitute of Charted Accounts has issued Accounting Standard-3 (Revised), which is on cash basis anddiscard the working capital definition of fund. Now, in India it is not compulsory to prepare fund flowstatement by Indian companies.
5.2 Meaning of Fund Funds Flow Statement
The fund flow statement reveals the information about the sources and uses of fund during the particularfinancial period. But here the question arises, what is the meaning of fund and flow of fund?
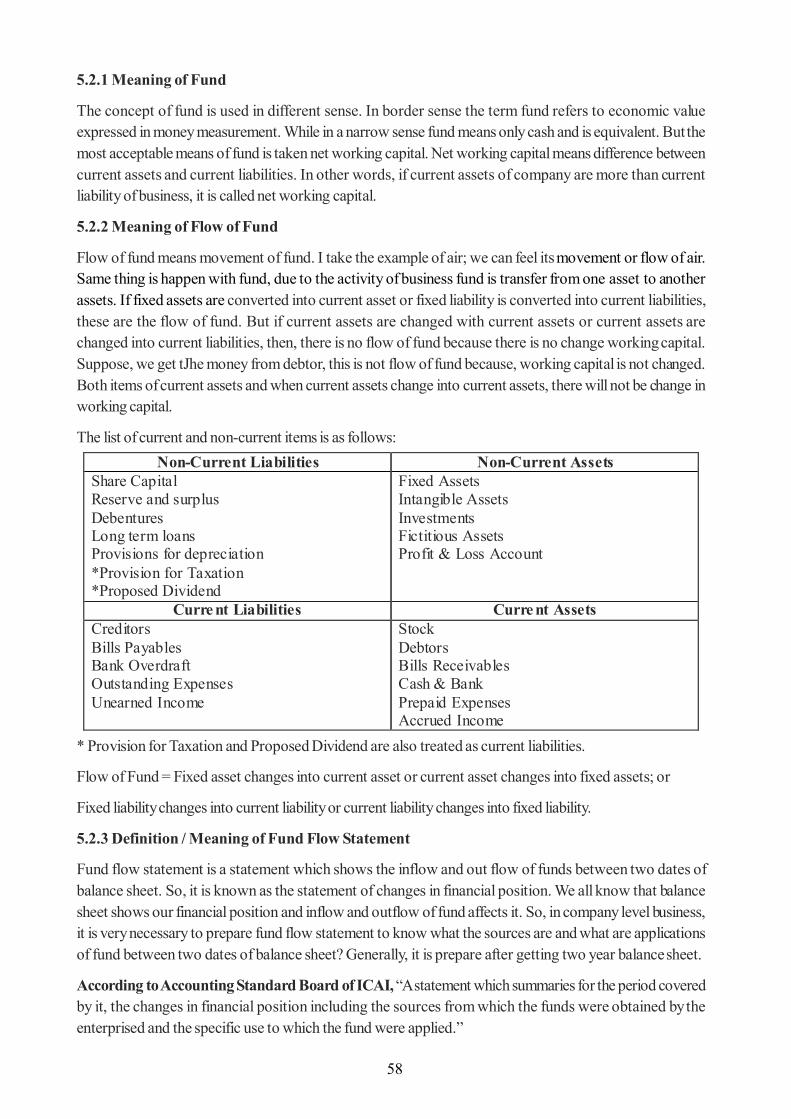
58
5.2.1 Meaning of Fund
The concept of fund is used in different sense. In border sense the term fund refers to economic valueexpressed in money measurement. While in a narrow sense fund means only cash and is equivalent. But themost acceptable means of fund is taken net working capital. Net working capital means difference betweencurrent assets and current liabilities. In other words, if current assets of company are more than currentliability of business, it is called net working capital.
5.2.2 Meaning of Flow of Fund
Flow of fund means movement of fund. I take the example of air; we can feel its movement or flow of air.Same thing is happen with fund, due to the activity of business fund is transfer from one asset to anotherassets. If fixed assets are converted into current asset or fixed liability is converted into current liabilities,these are the flow of fund. But if current assets are changed with current assets or current assets arechanged into current liabilities, then, there is no flow of fund because there is no change working capital.Suppose, we get tJhe money from debtor, this is not flow of fund because, working capital is not changed.Both items of current assets and when current assets change into current assets, there will not be change inworking capital.
The list of current and non-current items is as follows:
* Provision for Taxation and Proposed Dividend are also treated as current liabilities.
Flow of Fund = Fixed asset changes into current asset or current asset changes into fixed assets; or
Fixed liability changes into current liability or current liability changes into fixed liability.
5.2.3 Definition / Meaning of Fund Flow Statement
Fund flow statement is a statement which shows the inflow and out flow of funds between two dates ofbalance sheet. So, it is known as the statement of changes in financial position. We all know that balancesheet shows our financial position and inflow and outflow of fund affects it. So, in company level business,it is very necessary to prepare fund flow statement to know what the sources are and what are applicationsof fund between two dates of balance sheet? Generally, it is prepare after getting two year balance sheet.
According to Accounting Standard Board of ICAI, “A statement which summaries for the period coveredby it, the changes in financial position including the sources from which the funds were obtained by theenterprised and the specific use to which the fund were applied.”
Non-Current Liabilities Non-Current Assets Share Capital Reserve and surplus Debentures Long term loans Provisions for depreciation *Provision for Taxation *Proposed Dividend
Fixed Assets Intangible Assets Investments Fictitious Assets Profit & Loss Account
Curre nt Liabilities Curre nt Assets Creditors Bills Payables Bank Overdraft Outstanding Expenses Unearned Income
Stock Debtors Bills Receivables Cash & Bank Prepaid Expenses Accrued Income
59
According to Robert N. Anthony, “The fund flow statement describes the sources from which additionalfunds were derived and the uses to which these funds were put.”
According to Foulke R. A., “A statement of sources and application of funds is a technical device designedto analyse the changes in the financial conditions of business enterprise between two dates.”
Thus fund flow statement is a statement which shows where funds come from and in what way they wereused and the causes of changes in working capital. In other words it is a statement which shows the changes,inflow or outflow or the movement of fund.
Fund flow statements are known with different names
Statement of source and uses of funds summary of financial operations Movement of working capital statement Fund received and distributed statement Fund generated and expended statement.
5.3 Objectives of Fund Flow Statement
Generally the fund flow statement provides the information about the different sources and application offund during the particular period. The main objectives of fund flow statement are:
a) The basic object of preparing the statement is to have a rich into the financial operations of theconcern. It analyses how the funds were obtained and used in the past.
b) One important object of the statement is that it evaluates the firm’ financing capacity. The analysis ofsources of funds reveals how the firm’s financed its development projects in the past i.e., frominternal sources or from external sources. It also reveals the rate of growth of the firm.
c) To provide the information about the important items like fixed assets, long term loans, capital etc.,relating to sources and applications of fund.
d) To provide the information about the difference sources of fund, i.e., how much fund is beingcollected from the issuing shares or debenture, how much from long term or short term loans, howmuch from disposal of fixed assets and how much from operational activities?
e) To help to understand the changes in assets and asset sources which are not readily evident in theincome statement or financial statement.
f) To inform as to how the loans to the business have been used.g) To point out the financial strengths and weaknesses of the business.
5.4 Sources and Uses of Fund
5.4.1 Sources of Fund
Sources of fund are indicated by increase in liability and decrease in assets. The main sources of funds are:1. Fund from operation activities2. Issue of shares capital3. Issue of debentures4. Raising of long term loans5. Receipts from partly paid shares , called up6. Amount received from sales of non current or fixed assets7. Non trading receipts such as dividend received
60
8. Sale of investments ( Long term )9. Decrease in working capital (as per schedule of changes in working capital)
5.4.2 Applications or Uses of Funds
Applications of fund are indicated by decrease in liability and increase in assets. The main uses of funds are:
1. Funds lost in operations ( Balance negative in second step )2. Redemption of preference share capital3. Redemption of debentures4. Repayment of long term loans5. Purchase of long term loans6. Purchase of long term investments7. Non trading payments8. Payment of tax9. Payment of dividends10. Increase in working capital (as per schedule of changes in working capital)
5.5 Difference Between Fund Flow Statement and Other Financial Statements
5.5.1 Difference Between Fund Flow Statement and Profit & Loss Account
1. Fund Flow Statement shows the change in sources and applications of fund between two dateswhile Profit & loss account shows the results of operations of one organization during the relatedperiod.
2. In Fund Flow Statement funds raised are matched with funds applied disregarding the distinction ofcapital and revenue concept while in Profit & Loss Account expenses are matched against incomeand capital & revenue concept are predominant.
3. Profit & Loss Account facilitates preparation of the fund flow statement while fund flow statementdoes not help in preparation of the Profit & Loss Account.
5.5.2 Difference Between Fund Flow Statement and Balance Sheet
1. Fund Flow Statement shows the changes in working capital between two dates while BalanceSheet shows the financial position of a business on a particular date.
2. Fund Flow Statement incorporates items casing change in working capital while Balance Sheetincorporates the balance of real and personal accounts.
3. Fund Flow Statement is basically an analytical tool and therefore, it is very good for decisionmaking while Balance Sheet is not an analytical tool and it is simply a summary of assets andliabilities on a particular date.
4. Fund Flow Statement is prepared for the use of internal management; hence its publication isobligatory while Balance Sheet is prepared for the use of external parties of the business, hence itspublication is mandatory.
5.6 Techniques of Preparing Fund Flow Statement
The fund flow statement is prepared on the basis of treating net working capital as fund. Such statementshows the causes of changes in working capital during two accounting periods. For preparing fund flow
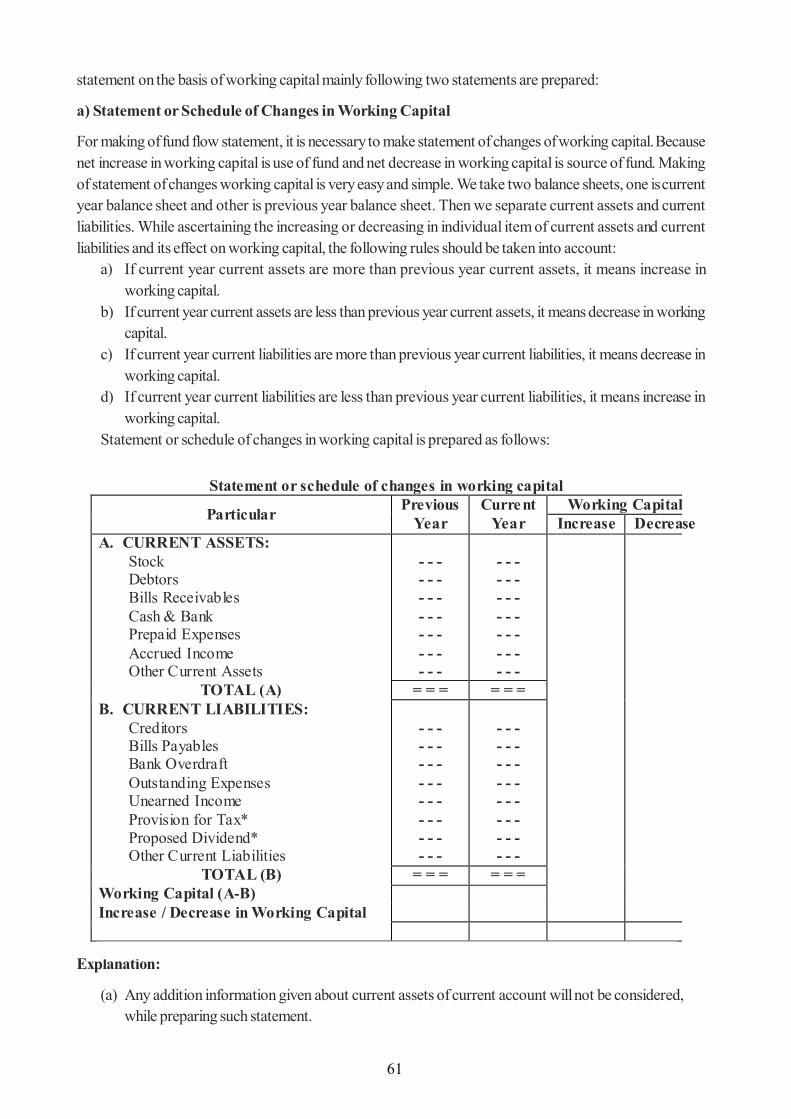
61
statement on the basis of working capital mainly following two statements are prepared:
a) Statement or Schedule of Changes in Working Capital
For making of fund flow statement, it is necessary to make statement of changes of working capital. Becausenet increase in working capital is use of fund and net decrease in working capital is source of fund. Makingof statement of changes working capital is very easy and simple. We take two balance sheets, one is currentyear balance sheet and other is previous year balance sheet. Then we separate current assets and currentliabilities. While ascertaining the increasing or decreasing in individual item of current assets and currentliabilities and its effect on working capital, the following rules should be taken into account:
a) If current year current assets are more than previous year current assets, it means increase inworking capital.
b) If current year current assets are less than previous year current assets, it means decrease in workingcapital.
c) If current year current liabilities are more than previous year current liabilities, it means decrease inworking capital.
d) If current year current liabilities are less than previous year current liabilities, it means increase inworking capital.
Statement or schedule of changes in working capital is prepared as follows:
Explanation:
(a) Any addition information given about current assets of current account will not be considered,while preparing such statement.
Statement or schedule of changes in working capital
Particular Previous Year
Current Year
Working Capital Increase Decrease
A. CURRENT ASSETS: Stock Debtors Bills Receivables Cash & Bank Prepaid Expenses Accrued Income Other Current Assets
- - - - - - - - - - - - - - - - - - - - -
- - - - - - - - - - - - - - - - - - - - -
TOTAL (A) = = = = = = B. CURRENT LIABILITIES:
Creditors Bills Payables Bank Overdraft Outstanding Expenses Unearned Income Provision for Tax* Proposed Dividend* Other Current Liabilities
- - - - - - - - - - - - - - - - - - - - - - - -
- - - - - - - - - - - - - - - - - - - - - - - -
TOTAL (B) = = = = = = Working Capital (A-B) Increase / Decrease in Working Capital
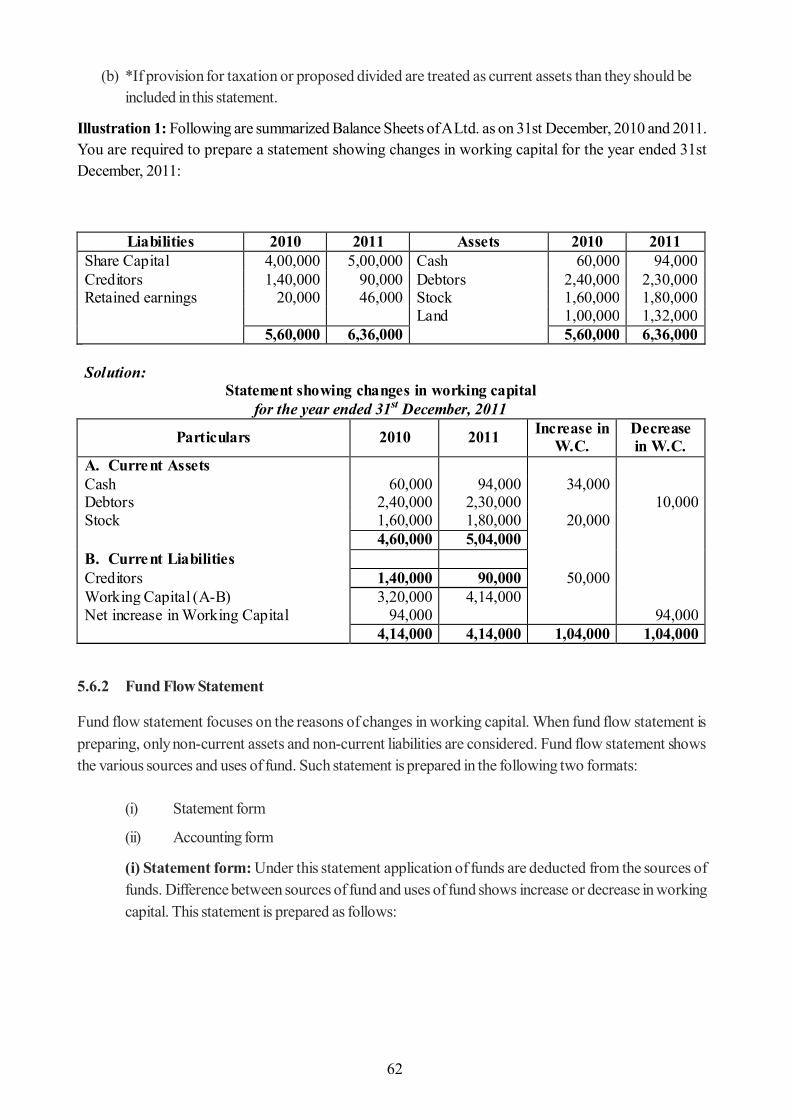
62
Liabilities 2010 2011 Assets 2010 2011
Share Capital 4,00,000 5,00,000 Cash 60,000 94,000 Creditors 1,40,000 90,000 Debtors 2,40,000 2,30,000 Retained earnings 20,000 46,000 Stock 1,60,000 1,80,000 Land 1,00,000 1,32,000
5,60,000 6,36,000 5,60,000 6,36,000 Solution:
Statement showing changes in working capital for the year ended 31st December, 2011
Particulars 2010 2011 Increase in W.C.
Decrease in W.C.
A. Current Assets Cash 60,000 94,000 34,000 Debtors 2,40,000 2,30,000 10,000 Stock 1,60,000 1,80,000 20,000 4,60,000 5,04,000 B. Current Liabilities Creditors 1,40,000 90,000 50,000 Working Capital (A-B) 3,20,000 4,14,000 Net increase in Working Capital 94,000 94,000 4,14,000 4,14,000 1,04,000 1,04,000
(b) *If provision for taxation or proposed divided are treated as current assets than they should beincluded in this statement.
Illustration 1: Following are summarized Balance Sheets of A Ltd. as on 31st December, 2010 and 2011.You are required to prepare a statement showing changes in working capital for the year ended 31stDecember, 2011:
5.6.2 Fund Flow Statement
Fund flow statement focuses on the reasons of changes in working capital. When fund flow statement ispreparing, only non-current assets and non-current liabilities are considered. Fund flow statement showsthe various sources and uses of fund. Such statement is prepared in the following two formats:
(i) Statement form
(ii) Accounting form
(i) Statement form: Under this statement application of funds are deducted from the sources offunds. Difference between sources of fund and uses of fund shows increase or decrease in workingcapital. This statement is prepared as follows:
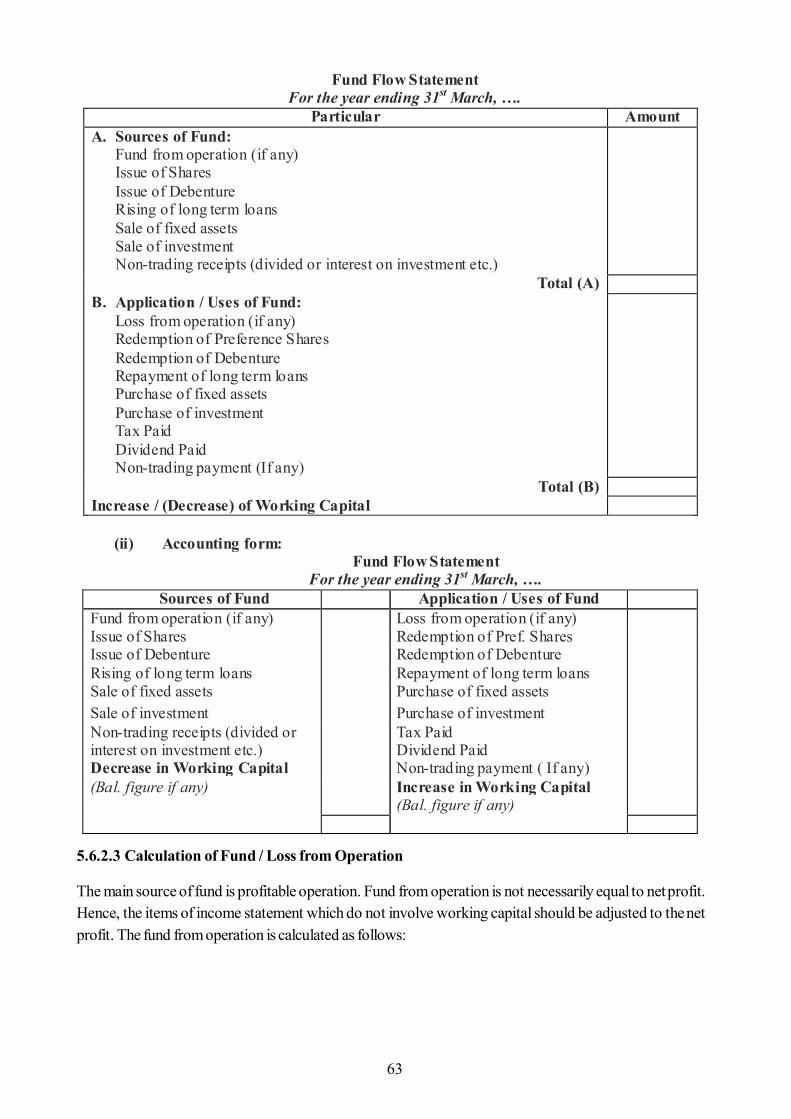
63
5.6.2.3 Calculation of Fund / Loss from Operation
The main source of fund is profitable operation. Fund from operation is not necessarily equal to net profit.Hence, the items of income statement which do not involve working capital should be adjusted to the netprofit. The fund from operation is calculated as follows:
Fund Flow Statement For the year ending 31st March, ….
Particular Amount A. Sources of Fund:
Fund from operation (if any) Issue of Shares Issue of Debenture Rising of long term loans Sale of fixed assets Sale of investment Non-trading receipts (divided or interest on investment etc.)
Total (A) B. Application / Uses of Fund:
Loss from operation (if any) Redemption of Preference Shares Redemption of Debenture Repayment of long term loans Purchase of fixed assets Purchase of investment Tax Paid Dividend Paid Non-trading payment (If any)
Total (B) Increase / (Decrease) of Working Capital
(ii) Accounting form: Fund Flow Statement
For the year ending 31st March, …. Sources of Fund Application / Uses of Fund
Fund from operation (if any) Loss from operation (if any) Issue of Shares Redemption of Pref. Shares Issue of Debenture Redemption of Debenture Rising of long term loans Repayment of long term loans Sale of fixed assets Purchase of fixed assets Sale of investment Purchase of investment Non-trading receipts (divided or interest on investment etc.)
Tax Paid Dividend Paid
Decrease in Working Capital Non-trading payment ( If any) (Bal. figure if any) Increase in Working Capital
(Bal. figure if any)
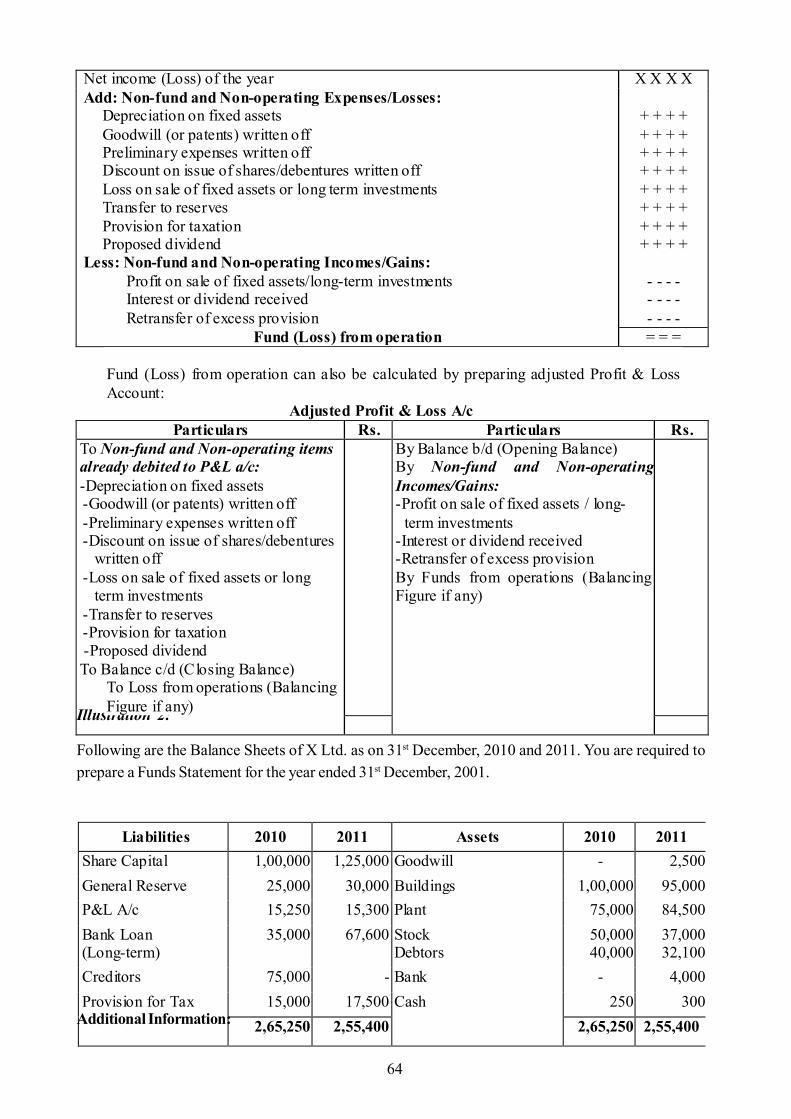
64
Liabilities 2010 2011 Assets 2010 2011
Share Capital 1,00,000 1,25,000 Goodwill - 2,500 General Reserve 25,000 30,000 Buildings 1,00,000 95,000 P&L A/c 15,250 15,300 Plant 75,000 84,500 Bank Loan (Long-term)
35,000 67,600 Stock Debtors
50,000 40,000
37,000 32,100
Creditors 75,000 - Bank - 4,000 Provision for Tax 15,000 17,500 Cash 250 300 2,65,250 2,55,400 2,65,250 2,55,400
Illustration 2:
Following are the Balance Sheets of X Ltd. as on 31st December, 2010 and 2011. You are required toprepare a Funds Statement for the year ended 31st December, 2001.
Additional Information:
Net income (Loss) of the year X X X X Add: Non-fund and Non-operating Expenses/Losses:
Depreciation on fixed assets Goodwill (or patents) written off Preliminary expenses written off Discount on issue of shares/debentures written off Loss on sale of fixed assets or long term investments Transfer to reserves Provision for taxation Proposed dividend
Less: Non-fund and Non-operating Incomes/Gains: Profit on sale of fixed assets/long-term investments Interest or dividend received Retransfer of excess provision
+ + + + + + + + + + + + + + + + + + + + + + + + + + + + + + + +
- - - - - - - - - - - -
Fund (Loss) from operation = = = Fund (Loss) from operation can also be calculated by preparing adjusted Profit & Loss Account:
Adjusted Profit & Loss A/c Particulars Rs. Particulars Rs.
To Non-fund and Non-operating items already debited to P&L a/c: -Depreciation on fixed assets -Goodwill (or patents) written off -Preliminary expenses written off -Discount on issue of shares/debentures
written off -Loss on sale of fixed assets or long
term investments -Transfer to reserves -Provision for taxation -Proposed dividend To Balance c/d (Closing Balance)
To Loss from operations (Balancing Figure if any)
By Balance b/d (Opening Balance) By Non-fund and Non-operating Incomes/Gains: -Profit on sale of fixed assets / long-
term investments -Interest or dividend received -Retransfer of excess provision By Funds from operations (Balancing Figure if any)
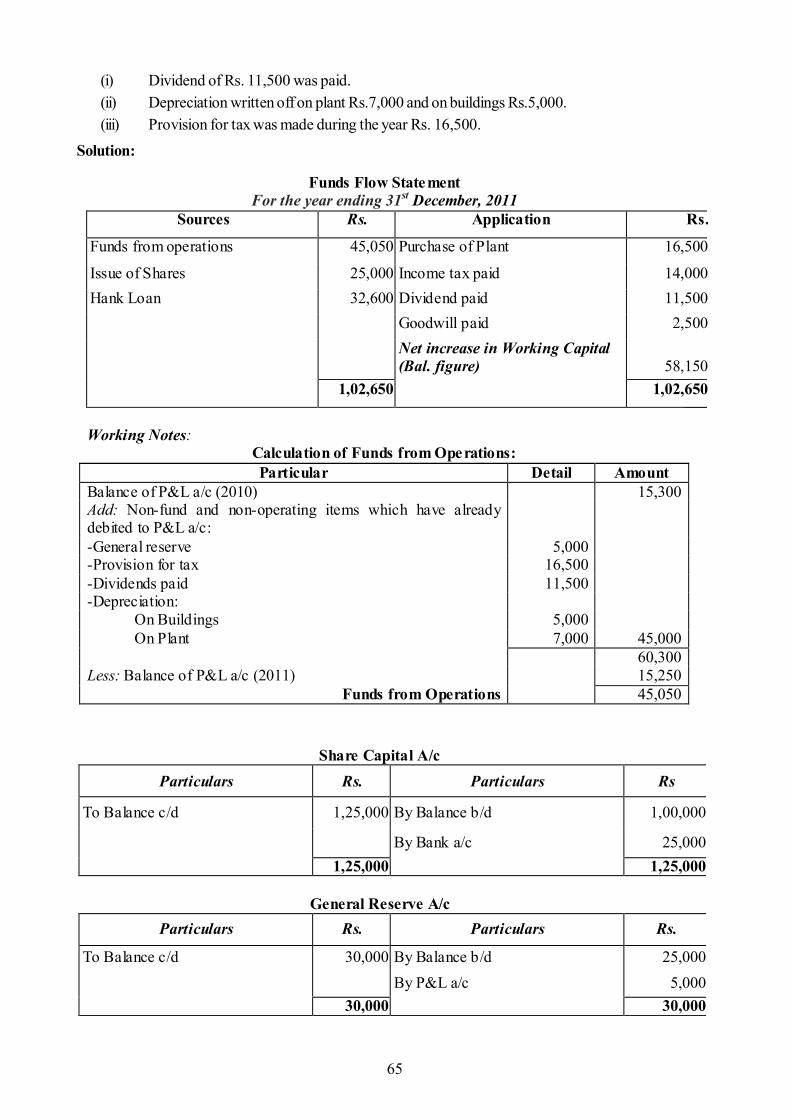
65
(i) Dividend of Rs. 11,500 was paid.(ii) Depreciation written off on plant Rs.7,000 and on buildings Rs.5,000.(iii) Provision for tax was made during the year Rs. 16,500.
Solution:
Funds Flow Statement For the year ending 31st December, 2011
Sources Rs. Application Rs.
Funds from operations 45,050 Purchase of Plant 16,500
Issue of Shares 25,000 Income tax paid 14,000 Hank Loan 32,600 Dividend paid 11,500 Goodwill paid 2,500 Net increase in Working Capital
(Bal. figure)
58,150 1,02,650 1,02,650
Working Notes:
Calculation of Funds from Operations: Particular Detail Amount
Balance of P&L a/c (2010) 15,300 Add: Non-fund and non-operating items which have already debited to P&L a/c:
-General reserve 5,000 -Provision for tax 16,500 -Dividends paid 11,500 -Depreciation: On Buildings 5,000 On Plant 7,000 45,000 60,300 Less: Balance of P&L a/c (2011) 15,250
Funds from Operations 45,050
Share Capital A/c Particulars Rs. Particulars Rs
To Balance c/d 1,25,000 By Balance b/d 1,00,000 By Bank a/c 25,000 1,25,000 1,25,000
General Reserve A/c Particulars Rs. Particulars Rs.
To Balance c/d 30,000 By Balance b/d 25,000 By P&L a/c 5,000 30,000 30,000
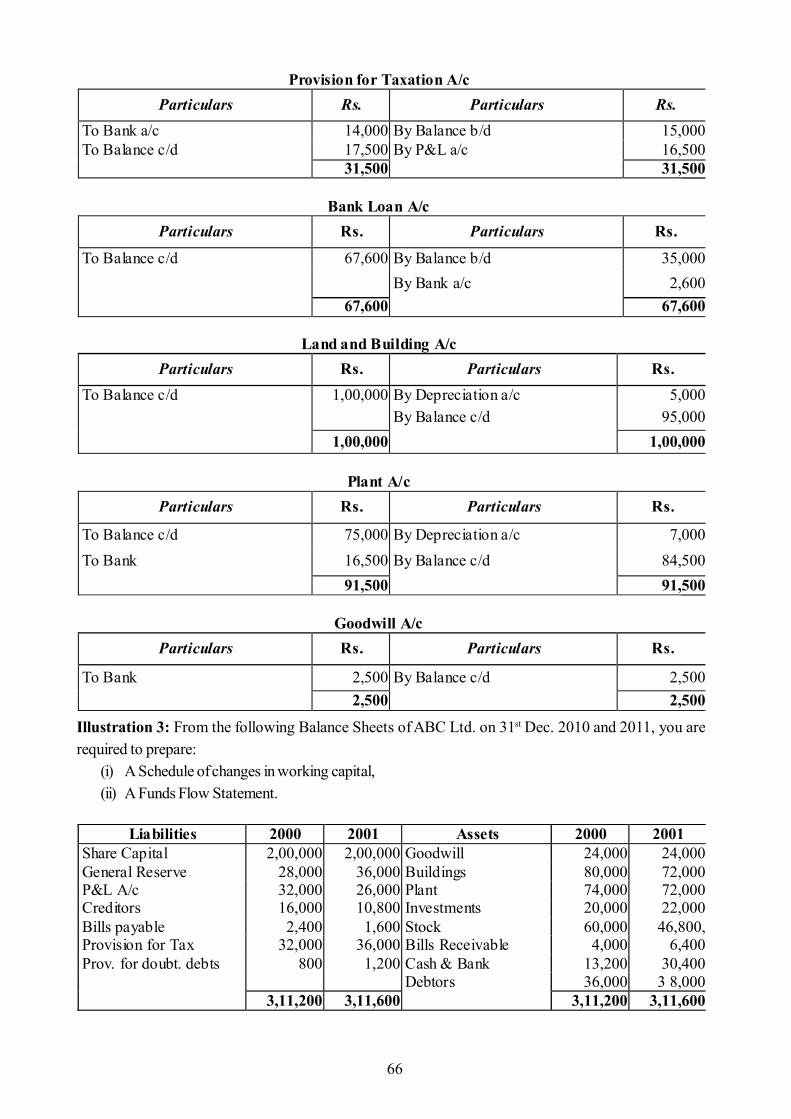
66
Provision for Taxation A/c Particulars Rs. Particulars Rs.
To Bank a/c 14,000 By Balance b/d 15,000 To Balance c/d 17,500 By P&L a/c 16,500 31,500 31,500
Bank Loan A/c Particulars Rs. Particulars Rs.
To Balance c/d 67,600 By Balance b/d 35,000 By Bank a/c 2,600
67,600 67,600
Land and Building A/c Particulars Rs. Particulars Rs.
To Balance c/d 1,00,000 By Depreciation a/c 5,000 By Balance c/d 95,000 1,00,000 1,00,000
Plant A/c Particulars Rs. Particulars Rs.
To Balance c/d 75,000 By Depreciation a/c 7,000 To Bank 16,500 By Balance c/d 84,500 91,500 91,500
Goodwill A/c Particulars Rs. Particulars Rs.
To Bank 2,500 By Balance c/d 2,500 2,500 2,500
Liabilities 2000 2001 Assets 2000 2001
Share Capital 2,00,000 2,00,000 Goodwill 24,000 24,000 General Reserve 28,000 36,000 Buildings 80,000 72,000 P&L A/c 32,000 26,000 Plant 74,000 72,000 Creditors 16,000 10,800 Investments 20,000 22,000 Bills payable 2,400 1,600 Stock 60,000 46,800, Provision for Tax 32,000 36,000 Bills Receivable 4,000 6,400 Prov. for doubt. debts 800 1,200 Cash & Bank 13,200 30,400 Debtors 36,000 3 8,000 3,11,200 3,11,600 3,11,200 3,11,600
Illustration 3: From the following Balance Sheets of ABC Ltd. on 31st Dec. 2010 and 2011, you arerequired to prepare:
(i) A Schedule of changes in working capital,(ii) A Funds Flow Statement.
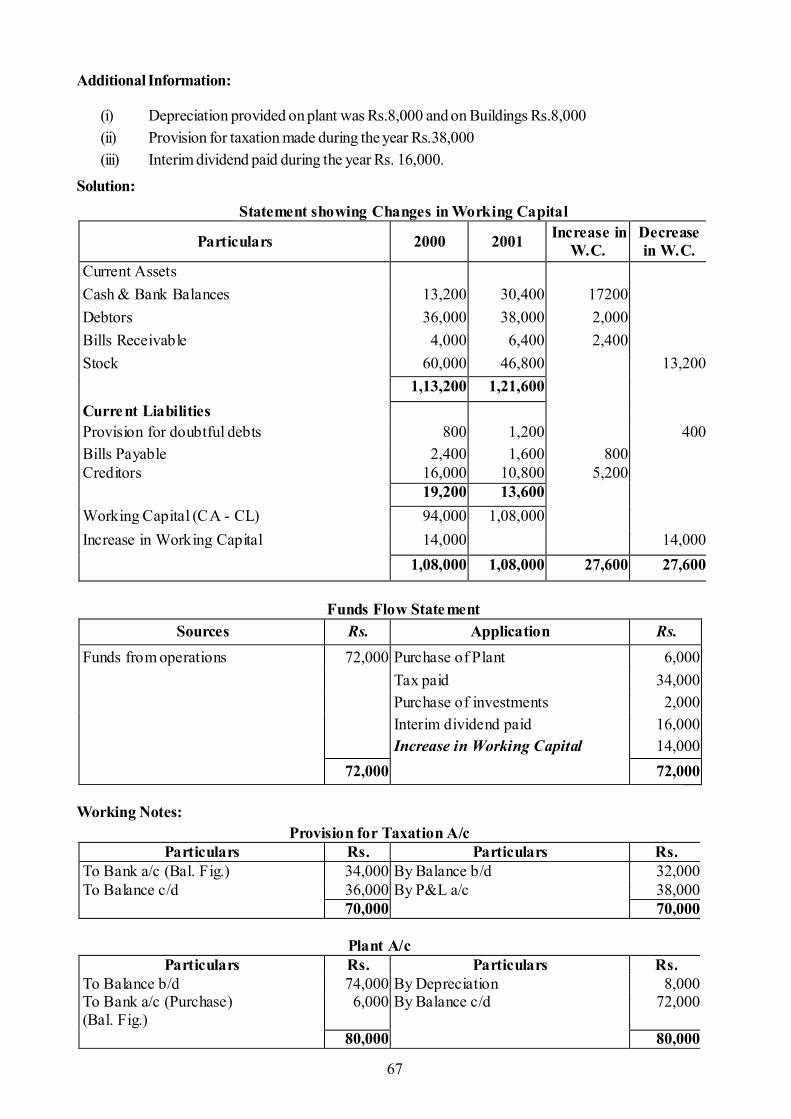
67
Additional Information:
(i) Depreciation provided on plant was Rs.8,000 and on Buildings Rs.8,000(ii) Provision for taxation made during the year Rs.38,000(iii) Interim dividend paid during the year Rs. 16,000.
Solution:
Working Notes:
Statement showing Changes in Working Capital
Particulars 2000 2001 Increase in W.C.
Decrease in W.C.
Current Assets Cash & Bank Balances 13,200 30,400 17200 Debtors 36,000 38,000 2,000 Bills Receivable 4,000 6,400 2,400 Stock 60,000 46,800 13,200 1,13,200 1,21,600 Current Liabilities Provision for doubtful debts 800 1,200 400 Bills Payable 2,400 1,600 800 Creditors 16,000 10,800 5,200 19,200 13,600 Working Capital (CA - CL) 94,000 1,08,000 Increase in Working Capital 14,000 14,000 1,08,000 1,08,000 27,600 27,600
Funds Flow Statement
Sources Rs. Application Rs. Funds from operations 72,000 Purchase of Plant 6,000 Tax paid 34,000 Purchase of investments 2,000 Interim dividend paid 16,000 Increase in Working Capital 14,000
72,000 72,000
Provision for Taxation A/c Particulars Rs. Particulars Rs.
To Bank a/c (Bal. Fig.) 34,000 By Balance b/d 32,000 To Balance c/d 36,000 By P&L a/c 38,000
70,000 70,000
Plant A/c Particulars Rs. Particulars Rs.
To Balance b/d 74,000 By Depreciation 8,000 To Bank a/c (Purchase) (Bal. Fig.)
6,000 By Balance c/d 72,000
80,000 80,000
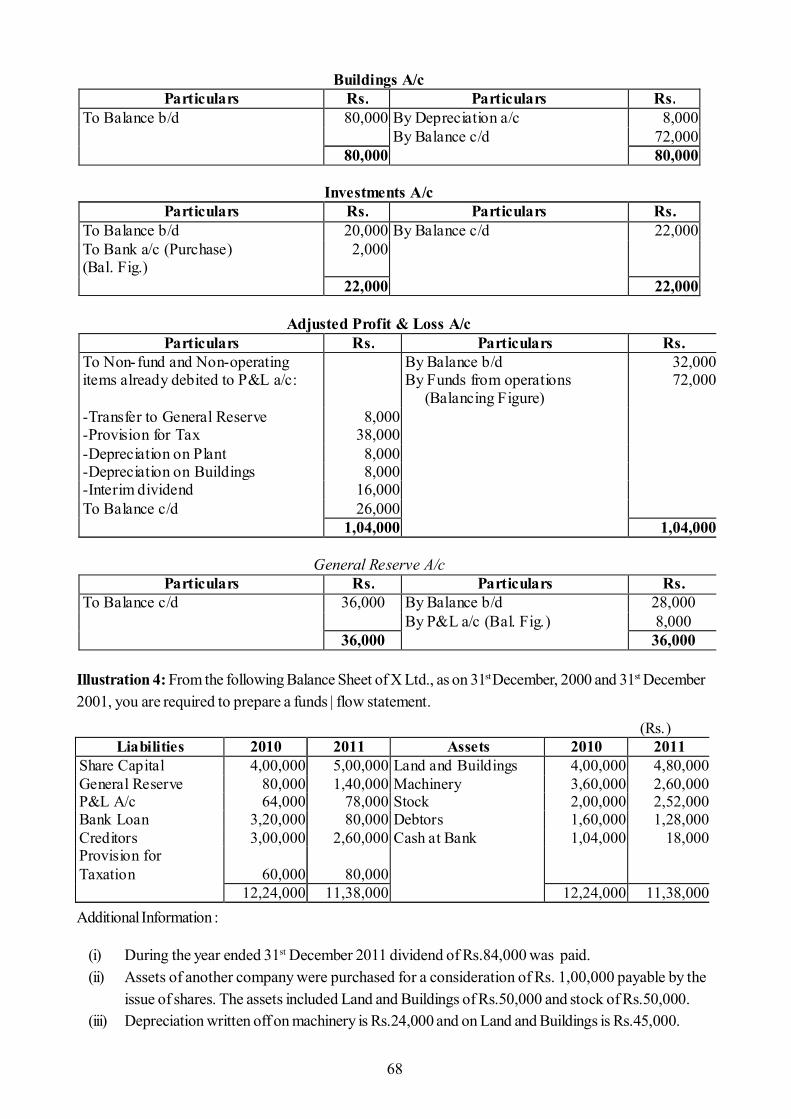
68
Illustration 4: From the following Balance Sheet of X Ltd., as on 31st December, 2000 and 31st December2001, you are required to prepare a funds | flow statement.
Additional Information :
(i) During the year ended 31st December 2011 dividend of Rs.84,000 was paid.(ii) Assets of another company were purchased for a consideration of Rs. 1,00,000 payable by the
issue of shares. The assets included Land and Buildings of Rs.50,000 and stock of Rs.50,000.(iii) Depreciation written off on machinery is Rs.24,000 and on Land and Buildings is Rs.45,000.
Buildings A/c Particulars Rs. Particulars Rs.
To Balance b/d 80,000 By Depreciation a/c 8,000 By Balance c/d 72,000 80,000 80,000
Investments A/c
Particulars Rs. Particulars Rs. To Balance b/d 20,000 By Balance c/d 22,000 To Bank a/c (Purchase) (Bal. Fig.)
2,000
22,000 22,000
Adjusted Profit & Loss A/c Particulars Rs. Particulars Rs.
To Non-fund and Non-operating items already debited to P&L a/c:
By Balance b/d By Funds from operations (Balancing Figure)
32,000 72,000
-Transfer to General Reserve 8,000 -Provision for Tax 38,000 -Depreciation on Plant 8,000 -Depreciation on Buildings 8,000 -Interim dividend 16,000 To Balance c/d 26,000 1,04,000 1,04,000
General Reserve A/c Particulars Rs. Particulars Rs.
To Balance c/d 36,000 By Balance b/d 28,000 By P&L a/c (Bal. Fig.) 8,000
36,000 36,000
(Rs.) Liabilities 2010 2011 Assets 2010 2011
Share Capital 4,00,000 5,00,000 Land and Buildings 4,00,000 4,80,000 General Reserve 80,000 1,40,000 Machinery 3,60,000 2,60,000 P&L A/c 64,000 78,000 Stock 2,00,000 2,52,000 Bank Loan 3,20,000 80,000 Debtors 1,60,000 1,28,000 Creditors 3,00,000 2,60,000 Cash at Bank 1,04,000 18,000 Provision for Taxation
60,000
80,000
12,24,000 11,38,000 12,24,000 11,38,000
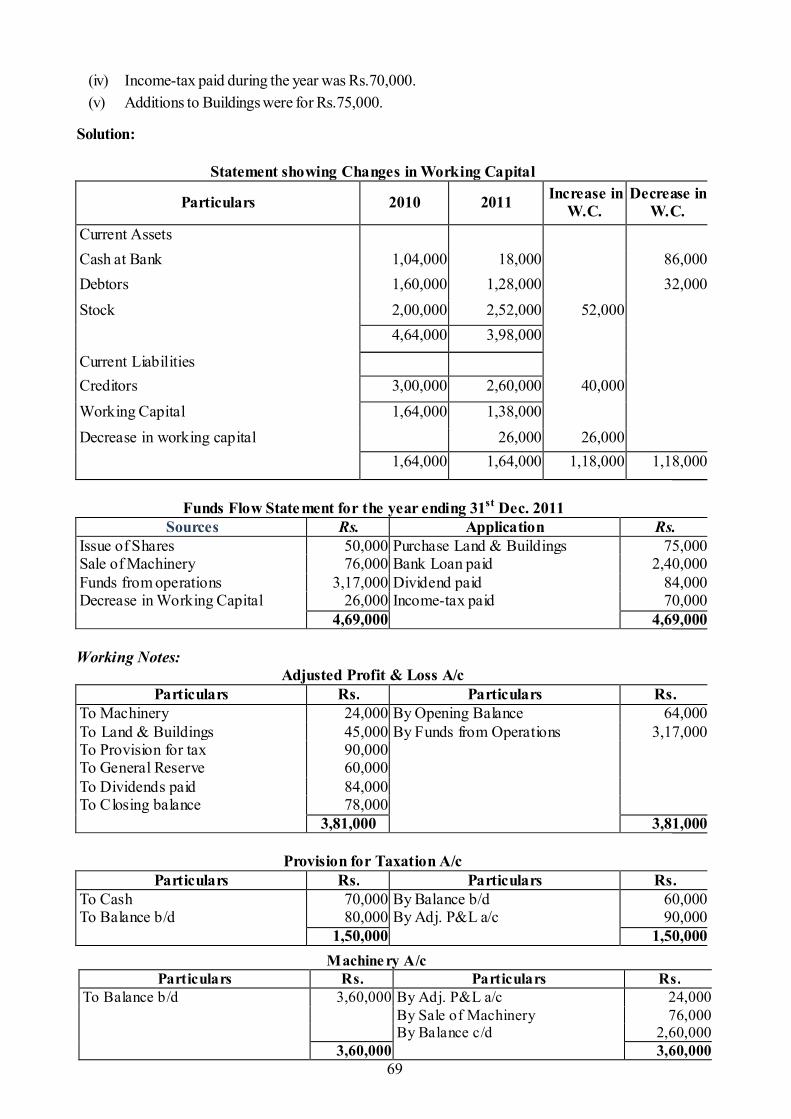
69
(iv) Income-tax paid during the year was Rs.70,000.(v) Additions to Buildings were for Rs.75,000.
Solution:
Statement showing Changes in Working Capital
Particulars 2010 2011 Increase in W.C.
Decrease in W.C.
Current Assets Cash at Bank 1,04,000 18,000 86,000 Debtors 1,60,000 1,28,000 32,000 Stock 2,00,000 2,52,000 52,000 4,64,000 3,98,000
Current Liabilities Creditors 3,00,000 2,60,000 40,000 Working Capital 1,64,000 1,38,000 Decrease in working capital 26,000 26,000 1,64,000 1,64,000 1,18,000 1,18,000
Funds Flow Statement for the year ending 31st Dec. 2011
Sources Rs. Application Rs. Issue of Shares 50,000 Purchase Land & Buildings 75,000 Sale of Machinery 76,000 Bank Loan paid 2,40,000 Funds from operations 3,17,000 Dividend paid 84,000 Decrease in Working Capital 26,000 Income-tax paid 70,000 4,69,000 4,69,000 Working Notes:
Adjusted Profit & Loss A/c Particulars Rs. Particulars Rs.
To Machinery 24,000 By Opening Balance 64,000 To Land & Buildings 45,000 By Funds from Operations 3,17,000 To Provision for tax 90,000 To General Reserve 60,000 To Dividends paid 84,000 To Closing balance 78,000
3,81,000 3,81,000
Provision for Taxation A/c Particulars Rs. Particulars Rs.
To Cash 70,000 By Balance b/d 60,000 To Balance b/d 80,000 By Adj. P&L a/c 90,000 1,50,000 1,50,000 Machine ry A/c
Particulars Rs. Particulars Rs. To Balance b/d 3,60,000 By Adj. P&L a/c 24,000 By Sale of Machinery 76,000 By Balance c/d 2,60,000 3,60,000 3,60,000
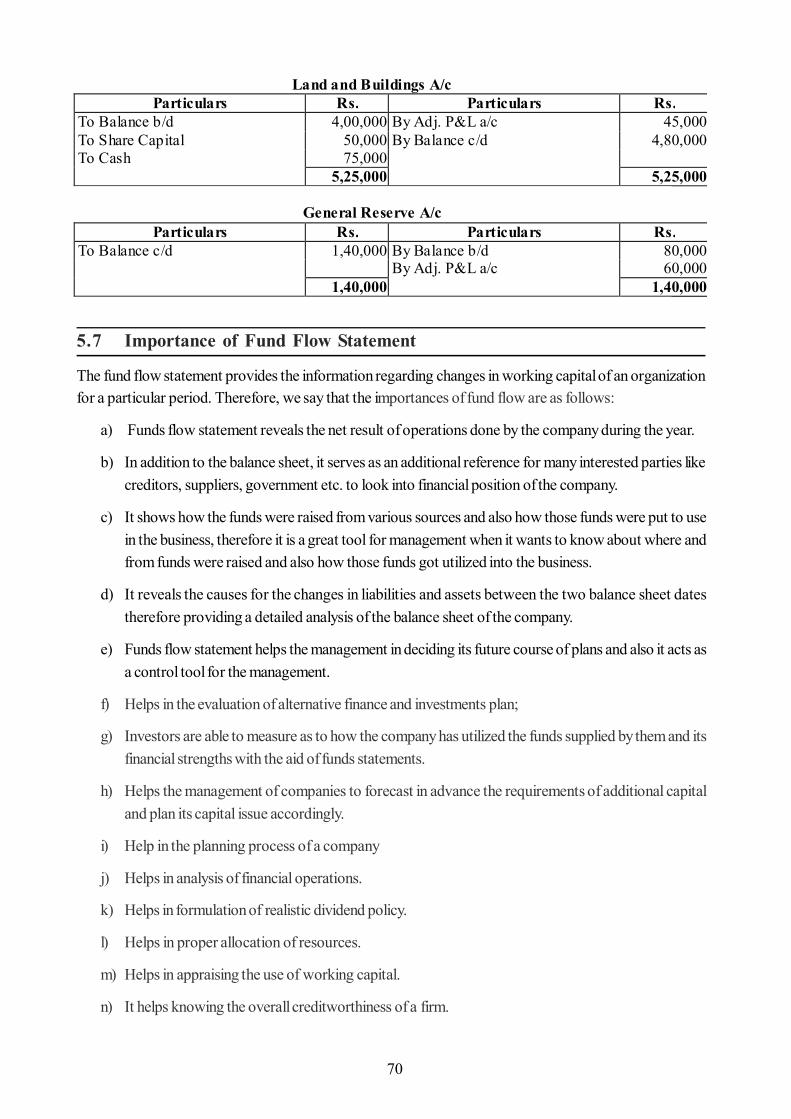
70
5.7 Importance of Fund Flow Statement
The fund flow statement provides the information regarding changes in working capital of an organizationfor a particular period. Therefore, we say that the importances of fund flow are as follows:
a) Funds flow statement reveals the net result of operations done by the company during the year.
b) In addition to the balance sheet, it serves as an additional reference for many interested parties likecreditors, suppliers, government etc. to look into financial position of the company.
c) It shows how the funds were raised from various sources and also how those funds were put to usein the business, therefore it is a great tool for management when it wants to know about where andfrom funds were raised and also how those funds got utilized into the business.
d) It reveals the causes for the changes in liabilities and assets between the two balance sheet datestherefore providing a detailed analysis of the balance sheet of the company.
e) Funds flow statement helps the management in deciding its future course of plans and also it acts asa control tool for the management.
f) Helps in the evaluation of alternative finance and investments plan;
g) Investors are able to measure as to how the company has utilized the funds supplied by them and itsfinancial strengths with the aid of funds statements.
h) Helps the management of companies to forecast in advance the requirements of additional capitaland plan its capital issue accordingly.
i) Help in the planning process of a company
j) Helps in analysis of financial operations.
k) Helps in formulation of realistic dividend policy.
l) Helps in proper allocation of resources.
m) Helps in appraising the use of working capital.
n) It helps knowing the overall creditworthiness of a firm.
Land and Buildings A/c Particulars Rs. Particulars Rs.
To Balance b/d 4,00,000 By Adj. P&L a/c 45,000 To Share Capital 50,000 By Balance c/d 4,80,000 To Cash 75,000 5,25,000 5,25,000
General Reserve A/c
Particulars Rs. Particulars Rs. To Balance c/d 1,40,000 By Balance b/d 80,000 By Adj. P&L a/c 60,000 1,40,000 1,40,000
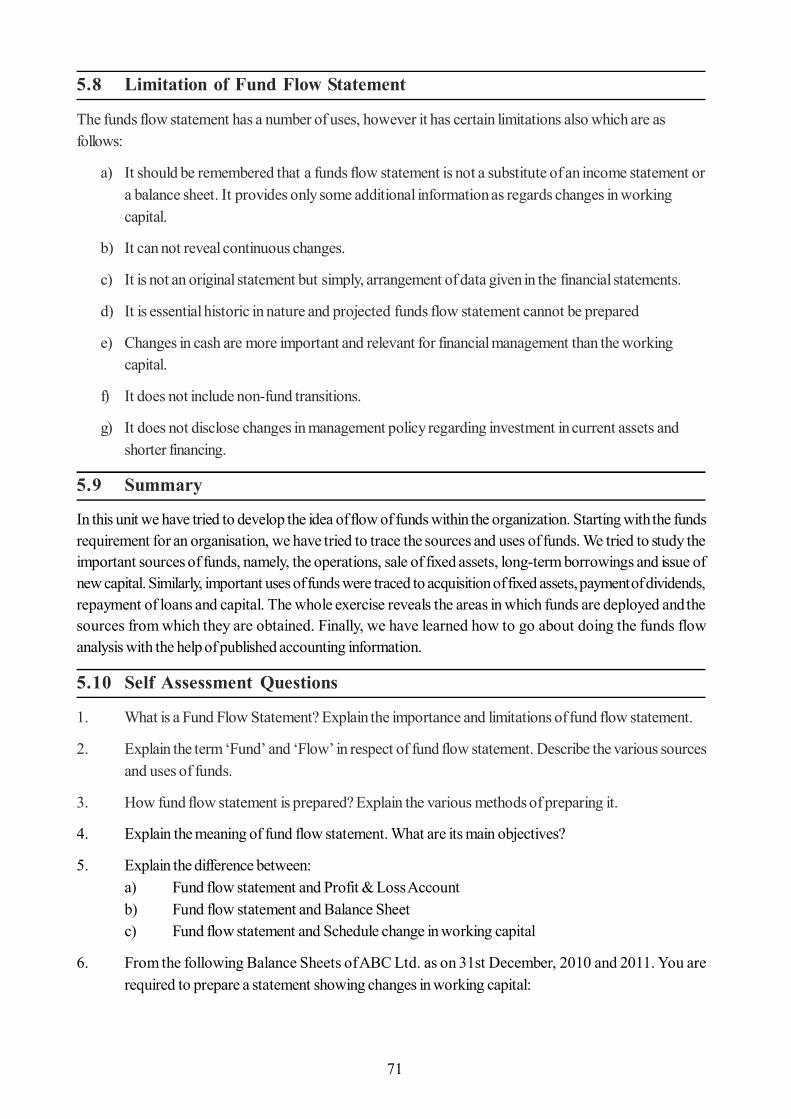
71
5.8 Limitation of Fund Flow Statement
The funds flow statement has a number of uses, however it has certain limitations also which are asfollows:
a) It should be remembered that a funds flow statement is not a substitute of an income statement ora balance sheet. It provides only some additional information as regards changes in workingcapital.
b) It can not reveal continuous changes.
c) It is not an original statement but simply, arrangement of data given in the financial statements.
d) It is essential historic in nature and projected funds flow statement cannot be prepared
e) Changes in cash are more important and relevant for financial management than the workingcapital.
f) It does not include non-fund transitions.
g) It does not disclose changes in management policy regarding investment in current assets andshorter financing.
5.9 Summary
In this unit we have tried to develop the idea of flow of funds within the organization. Starting with the fundsrequirement for an organisation, we have tried to trace the sources and uses of funds. We tried to study theimportant sources of funds, namely, the operations, sale of fixed assets, long-term borrowings and issue ofnew capital. Similarly, important uses of funds were traced to acquisition of fixed assets, payment of dividends,repayment of loans and capital. The whole exercise reveals the areas in which funds are deployed and thesources from which they are obtained. Finally, we have learned how to go about doing the funds flowanalysis with the help of published accounting information.
5.10 Self Assessment Questions
1. What is a Fund Flow Statement? Explain the importance and limitations of fund flow statement.
2. Explain the term ‘Fund’ and ‘Flow’ in respect of fund flow statement. Describe the various sourcesand uses of funds.
3. How fund flow statement is prepared? Explain the various methods of preparing it.
4. Explain the meaning of fund flow statement. What are its main objectives?
5. Explain the difference between:a) Fund flow statement and Profit & Loss Accountb) Fund flow statement and Balance Sheetc) Fund flow statement and Schedule change in working capital
6. From the following Balance Sheets of ABC Ltd. as on 31st December, 2010 and 2011. You arerequired to prepare a statement showing changes in working capital:
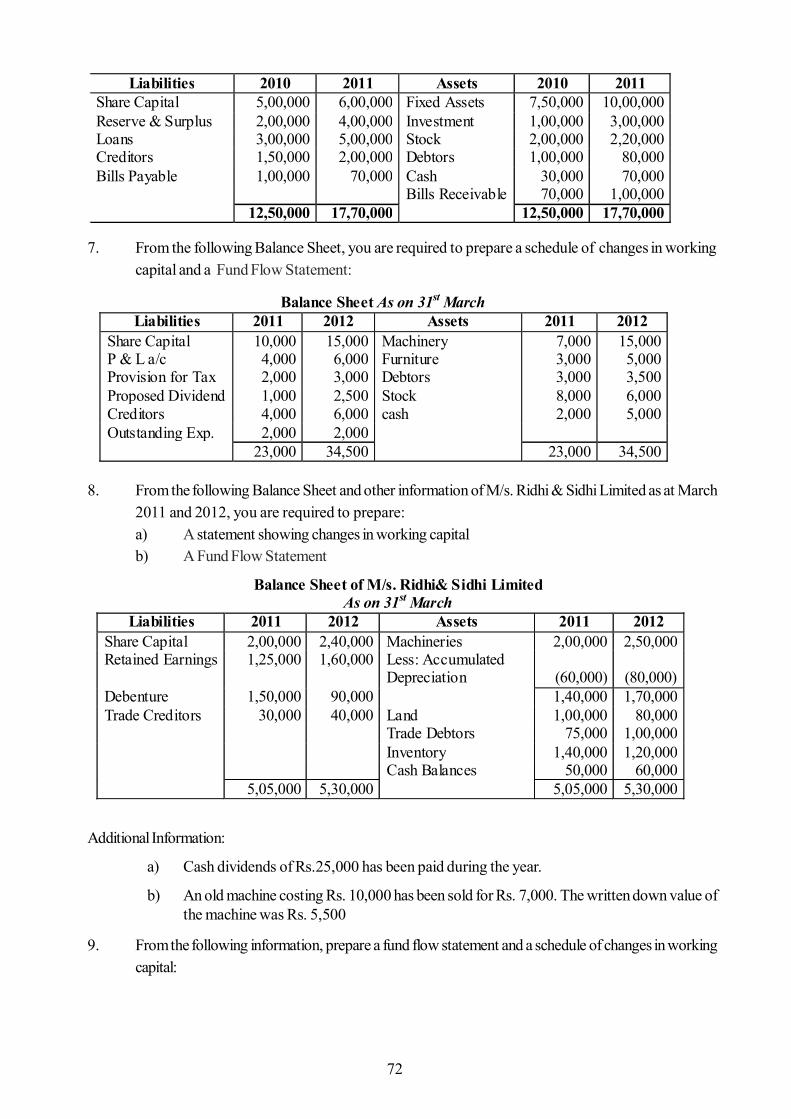
72
Liabilities 2010 2011 Assets 2010 2011
Share Capital 5,00,000 6,00,000 Fixed Assets 7,50,000 10,00,000 Reserve & Surplus 2,00,000 4,00,000 Investment 1,00,000 3,00,000 Loans 3,00,000 5,00,000 Stock 2,00,000 2,20,000 Creditors 1,50,000 2,00,000 Debtors 1,00,000 80,000 Bills Payable 1,00,000 70,000 Cash 30,000 70,000 Bills Receivable 70,000 1,00,000
12,50,000 17,70,000 12,50,000 17,70,000
Balance Sheet As on 31st March
Liabilities 2011 2012 Assets 2011 2012 Share Capital 10,000 15,000 Machinery 7,000 15,000 P & L a/c 4,000 6,000 Furniture 3,000 5,000 Provision for Tax 2,000 3,000 Debtors 3,000 3,500 Proposed Dividend 1,000 2,500 Stock 8,000 6,000 Creditors 4,000 6,000 cash 2,000 5,000 Outstanding Exp. 2,000 2,000 23,000 34,500 23,000 34,500
Balance Sheet of M/s. Ridhi& Sidhi Limited As on 31st March
Liabilities 2011 2012 Assets 2011 2012 Share Capital 2,00,000 2,40,000 Machineries 2,00,000 2,50,000 Retained Earnings 1,25,000 1,60,000 Less: Accumulated
Depreciation
(60,000)
(80,000) Debenture 1,50,000 90,000 1,40,000 1,70,000 Trade Creditors 30,000 40,000 Land 1,00,000 80,000 Trade Debtors 75,000 1,00,000 Inventory 1,40,000 1,20,000 Cash Balances 50,000 60,000 5,05,000 5,30,000 5,05,000 5,30,000
7. From the following Balance Sheet, you are required to prepare a schedule of changes in workingcapital and a Fund Flow Statement:
8. From the following Balance Sheet and other information of M/s. Ridhi & Sidhi Limited as at March2011 and 2012, you are required to prepare:a) A statement showing changes in working capitalb) A Fund Flow Statement
Additional Information:
a) Cash dividends of Rs.25,000 has been paid during the year.
b) An old machine costing Rs. 10,000 has been sold for Rs. 7,000. The written down value ofthe machine was Rs. 5,500
9. From the following information, prepare a fund flow statement and a schedule of changes in workingcapital:
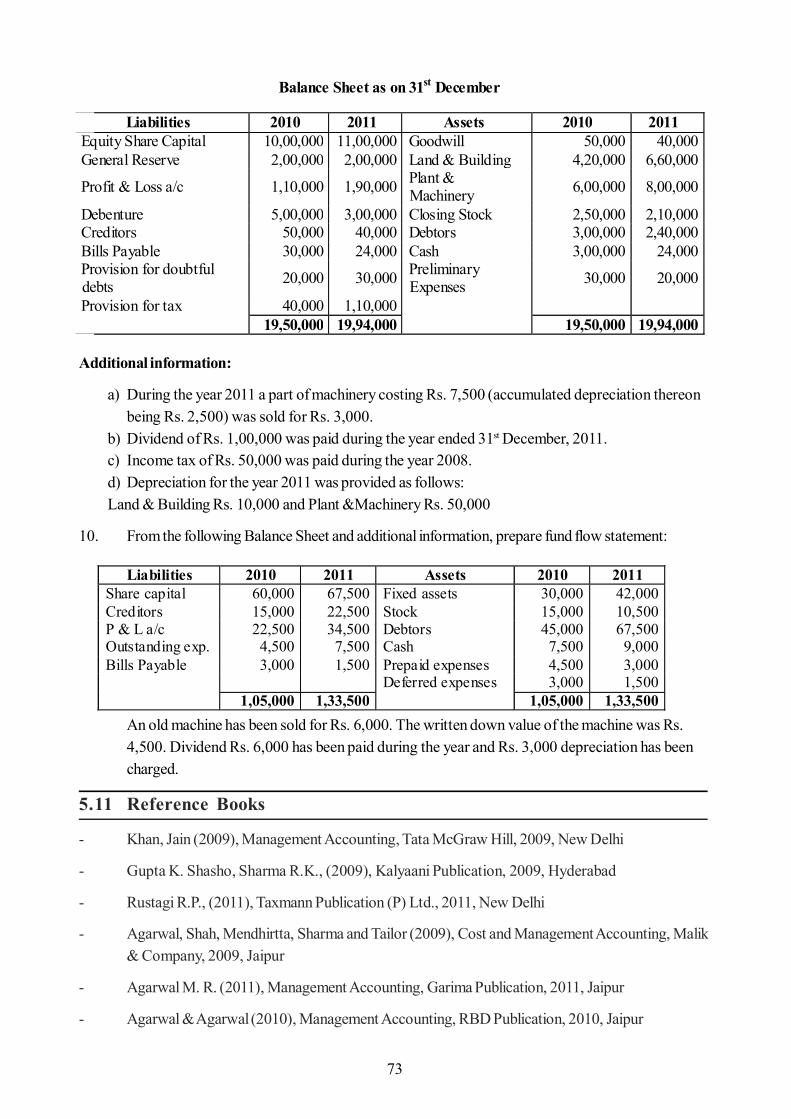
73
Balance Sheet as on 31st December
Liabilities 2010 2011 Assets 2010 2011 Equity Share Capital 10,00,000 11,00,000 Goodwill 50,000 40,000 General Reserve 2,00,000 2,00,000 Land & Building 4,20,000 6,60,000
Profit & Loss a/c 1,10,000 1,90,000 Plant & Machinery 6,00,000 8,00,000
Debenture 5,00,000 3,00,000 Closing Stock 2,50,000 2,10,000 Creditors 50,000 40,000 Debtors 3,00,000 2,40,000 Bills Payable 30,000 24,000 Cash 3,00,000 24,000 Provision for doubtful debts 20,000 30,000 Preliminary
Expenses 30,000 20,000
Provision for tax 40,000 1,10,000 19,50,000 19,94,000 19,50,000 19,94,000
Liabilities 2010 2011 Assets 2010 2011
Share capital 60,000 67,500 Fixed assets 30,000 42,000 Creditors 15,000 22,500 Stock 15,000 10,500 P & L a/c 22,500 34,500 Debtors 45,000 67,500 Outstanding exp. 4,500 7,500 Cash 7,500 9,000 Bills Payable 3,000 1,500 Prepaid expenses 4,500 3,000 Deferred expenses 3,000 1,500 1,05,000 1,33,500 1,05,000 1,33,500
Additional information:
a) During the year 2011 a part of machinery costing Rs. 7,500 (accumulated depreciation thereonbeing Rs. 2,500) was sold for Rs. 3,000.
b) Dividend of Rs. 1,00,000 was paid during the year ended 31st December, 2011.c) Income tax of Rs. 50,000 was paid during the year 2008.d) Depreciation for the year 2011 was provided as follows:Land & Building Rs. 10,000 and Plant &Machinery Rs. 50,000
10. From the following Balance Sheet and additional information, prepare fund flow statement:
An old machine has been sold for Rs. 6,000. The written down value of the machine was Rs.4,500. Dividend Rs. 6,000 has been paid during the year and Rs. 3,000 depreciation has beencharged.
5.11 Reference Books
- Khan, Jain (2009), Management Accounting, Tata McGraw Hill, 2009, New Delhi
- Gupta K. Shasho, Sharma R.K., (2009), Kalyaani Publication, 2009, Hyderabad
- Rustagi R.P., (2011), Taxmann Publication (P) Ltd., 2011, New Delhi
- Agarwal, Shah, Mendhirtta, Sharma and Tailor (2009), Cost and Management Accounting, Malik& Company, 2009, Jaipur
- Agarwal M. R. (2011), Management Accounting, Garima Publication, 2011, Jaipur
- Agarwal & Agarwal (2010), Management Accounting, RBD Publication, 2010, Jaipur
74
Unit - 6 : Cash Flow Statement
Structure of Unit:
6.0 Objectives6.1 Introduction6.2 Meaning of Cash Flow Statement6.3 Objectives of Cash Flow Statement6.4 Importance of Cash Flow Statement6.5 Limitation of Cash Flow Statement6.6 Difference Between Funds Flow Statement Vs. Cash Flow Statement6.7 Classification of Cash Flow6.8 Techniques of Preparing Cash Flow Statement6.9 Summary6.10 Self Assessment Questions6.11 Reference Books
6.0 Objectives
After completing this lesson, you will able to:
Recall the meaning of Cash Flow Statement Know the purpose of preparing Cash flow statement Prepare Cash flow statement Identified the various activities which generate cash Describe the importance and limitation of Cash flow statement Know the difference between fund flow statement and other financial statement
6.1 Introduction
Company final accounts include Profit and loss account and balance sheet. Profit and loss account presentnet profit or loss of specified period and Balance sheet show financial possession of the company. But theyare not present cash inflow or outflow, which effect by the decision based on final account. Cash flowstatement provides information about the cash receipt and payment of the company for specified period.
Cash flow statement is required by Accounting Standard 3 (revised) issued by the Institute of CharteredAccounts of India in March 1997. Accounting Standard 3 is mandatory in nature in respect of accountingperiods commencing on or after 1.04.2001 for an enterprises whose equity or debt securities are listed ona recognised stock exchange in India and enterprises that are in the process of issuing equity or debtsecurities that will be listed on a recognised stock exchange in India as evidence by the board of director’sresolution in this regard. And all other commercial, industrial and business reporting enterprises, whoseturnover for the accounting period exceed Rs. 50 corer.
6.2 Meaning of Cash Flow Statement
Cash flow statement is a statement of inflow or outflow of cash or cash equivalent of the company in thespecified period. In other words, cash flow statement present the reason of changes in cash passion in twoBalance Sheet date.
75
Cash flow includes inflow or outflow of cash or cash equivalent. It’s means, the movement of cash into thecompany and out of the company. Hear ‘cash’ include cash in hand and cash at bank and ‘cash equivalent’include short term investment that are quickly converted into cash. Information about inflow of cash orsources of cash and outflow of cash or application of cash are required for cash flow statement. Accordingto Accounting Standard 3, cash flow statement is classified into the following three categories of cash inflowor outflow:
Cash flow from operating activities. Cash flow from investing activities. Cash flow from financial activities.
6.3 Objectives of Cash Flow Statement
Information about the cash flows of an enterprise is useful in providing users of financial statements with abasis to assess the ability of the enterprise to generate cash and cash equivalents and the needs of theenterprise to utilise those cash flows. The economic decisions that are taken by users require an evaluationof the ability of an enterprise to generate cash and cash equivalents and the timing and certainty of theirgeneration. The Statement deals with the provision of information about the historical changes in cash andcash equivalents of an enterprise by means of a cash flow statement which classifies cash flows during theperiod from operating, Investing and financing activities. The cash flow statement reflects a firm’s liquidity orsolvency. The main objects of cash flow statement are:
a) To provide information on a firms liquidity and solvency to change cash flow in future circumstances
b) To provide additional information for evaluating changes in assets, liabilities and equity
c) To improve the comparability of different firms’ operating performance by eliminating the effects ofdifferent accounting methods
d) To indicate the amount, timing and probability of future cash flows
6.4 Importance of Cash Flow Statement
The cash flow statement provides information regarding inflows and outflows of cash of an organization fora particular period. Therefore, we say that the following are the importance of cash flow statement:
a) Cash flow statement helps to identify the sources from where cash inflows have arisen and where inthe cash was utilized within a particular period.
b) Cash flow statement is significant to management for proper cash planning and maintaining a propermatching between cash inflows and outflows
c) Cash flow statement shows efficiency of a firm in generating cash inflows from its regular operations
d) Cash flow statement reports the amount of cash used during the period in various long-term investingactivities, such as purchase of fixed assets
e) Cash flow statement reports the amount of cash received during the period through various financingactivities, such as issue of shares, debentures and raising long-term loan
f) Cash flow statement helps for appraisal of various capital investment programmes to determinetheir profitability and viability
g) Cash flow statement helps the investors to judge whether the company is financially sound or not.
76
6.5 Limitation of Cash Flow Statement
Despite a number of uses, Cash Flow Statement suffers from the following limitations:
a) Ignore Accounting Concept of Accrual Basis: As CFS is based on cash basis of accounting, itignores the basic accounting concept of accrual basis
b) Ignores Non-cash Transactions: CFS ignores the non-cash transactions. In other words, it does notconsider those transactions which do not affect the cash e.g., issue of shares against the purchase offixed assets, conversion of debentures into equity shares, etc
c) Not Suitable for Judging the profitability: CFS is not suitable for judging the profitability of a firm asnon-cash charges are ignored while calculating cash flows from operating activities
d) Based on Secondary Data: CFS is based on secondary data. It merely rearranges the primary dataalready appearing in other statements i.e., Balance Sheet and Income Statement
e) Short-term analysis: CFS is a technique of short-term financial analysis. It does not help much inknowing the long-term financial position
f) Not based on full information: CFS does not present true picture of the liquidity of a firm. Liquiditydoes not depend upon ‘cash’ alone. Liquidity, also affected by the assets which can be easilyconverted into cash. Exclusion of these assets obstruct the true reporting of the ability of the firm tomeet its liabilities
g) By itself, it cannot provide a complete analysis of the financial position of the firm.
h) It can be interpreted only when it is in confirmation with other financial statements and other analyticaltools like ratio analysis.
6.6 Difference Between Funds Flow Statement Vs. Cash Flow Statement
Funds flow and cash flow statements both are used in analysis of business transactions particular period.But there are some differences between these two statements which are given below:
a) Funds flow statements is based on the accrual accounting system but in case of cash flow statementsonly those transactions are taken into consideration which affecting the cash or cash equivalentsonly.
b) Funds flow statement analysis the sources and application of funds of long-term nature and the netincrease or decrease in long-term funds will be reflected on the working capital of the firm. The cashflow statement will only consider the increase or decrease in current assets and current’ liabilities incalculating the cash flow of funds from operations.
c) Funds Flow analysis is more useful for long range financial planning while cash flow analysis is moreuseful for identifying and correcting die current liquidity problems of the firm.
d) Funds flow statement analysis is a broader concept, it takes into account both long-term and short-term funds into account in analysis. But cash flow statement deals with the one of the current assetson balance sheet assets side only.
e) Funds flow statement tallies the funds generated from various sources with various uses to whichthey are put. Cash flow statements start with the opening balance of cash and reach to the closingbalance of cash by proceeding through sources and uses.
77
6.7 Classification of Cash Flow
Cash flow includes inflow or outflow of cash or cash equivalent. It means the movement of cash into thecompany and out of the company. Cash flows can be classified into the following three categories:
Cash Flow from Operating Activities: Operation activities include those activities from which businessincome are generated and these are not investing or financing activities. Operation activities are result of thenet profit or loss of the organisation. For example cash receipts from sales of goods and rendering ofservices, royalties, fees, commission and other receiving. And cash payment to supplier of goods andprovider of services, to employees and to other in behalf of employees and for revenue expenses.
Operating activities include the production, sales and delivery of the company’s product as well ascollecting payment from its customers. This could include purchasing raw materials, building inventory,advertising and shipping the product etc.
Cash flows from operating activities generally result from the transactions and other events that enter intothe determination of net profit or loss. Examples of cash flows from operating activities are:
a) Cash receipts from the sale of goods and the rendering of services;b) Cash receipts from royalties, fees, commissions and other revenue;c) Cash payments to suppliers for goods and services;d) Cash payments to and on behalf of employees;e) Cash receipts and cash payments of an insurance enterprise for premiums and claims, annuities and
other policy benefits;f) Cash payments or refunds of income taxes unless they can be specifically identified with financing
and investing activities; andg) Cash receipts and payments relating to futures contracts, forward contracts, option contracts and
swap contracts when the contracts are held for dealing or trading purposes.
Cash Flow from Investing Activities: The separate disclosure of cash flows arising from investingactivities is important because the cash flows represent the extent to which expenditures have been madefor resources intended to generate future income and cash flows. Examples of cash flows arising frominvesting activities are:
a) Cash payments to acquire fixed assets (including intangibles);b) Cash receipts from disposal of fixed assets (including intangibles);c) Cash payments to acquire investments in shares, warrants or debt instruments of other enterprises;d) Cash payments to disposal of investments in shares, warrants or debt instruments of other enterprises;e) Cash advances and loans made to third parties;f) Cash receipts from the repayment of advances and loans made to third parties;
Cash Flow from Financial Activities: The separate disclosure of cash flows arising from financingactivities is important because it is useful in predicting claims on future cash flows by providers of funds(both capital and borrowings) to the enterprise. Examples of cash flows arising from financing activities are:
a) Cash receipts from issuing shares;b) Cash proceeds from issuing debentures, loans, notes, bonds, and other short or long-term borrowings;
andc) Cash payment on redemption of preference shares or debentures;d) Cash repayments of amounts borrowed.
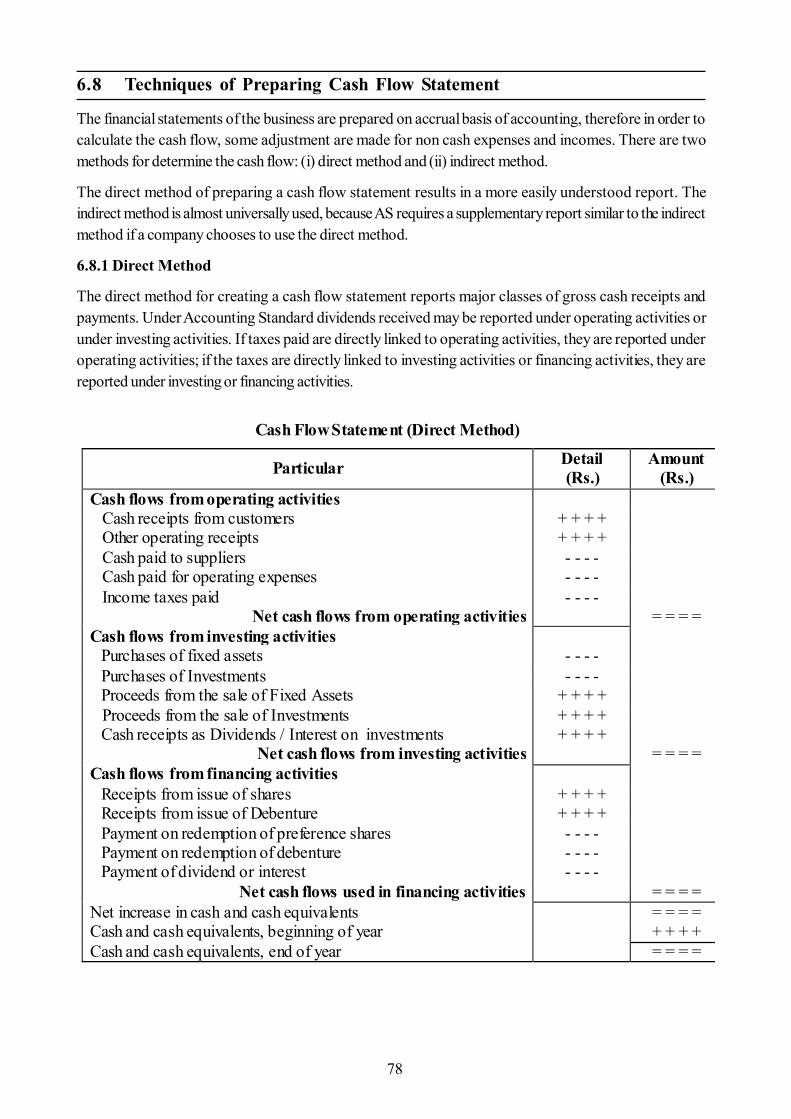
78
6.8 Techniques of Preparing Cash Flow Statement
The financial statements of the business are prepared on accrual basis of accounting, therefore in order tocalculate the cash flow, some adjustment are made for non cash expenses and incomes. There are twomethods for determine the cash flow: (i) direct method and (ii) indirect method.
The direct method of preparing a cash flow statement results in a more easily understood report. Theindirect method is almost universally used, because AS requires a supplementary report similar to the indirectmethod if a company chooses to use the direct method.
6.8.1 Direct Method
The direct method for creating a cash flow statement reports major classes of gross cash receipts andpayments. Under Accounting Standard dividends received may be reported under operating activities orunder investing activities. If taxes paid are directly linked to operating activities, they are reported underoperating activities; if the taxes are directly linked to investing activities or financing activities, they arereported under investing or financing activities.
Cash Flow Statement (Direct Method)
Particular Detail (Rs.)
Amount (Rs.)
Cash flows from operating activities Cash receipts from customers + + + + Other operating receipts + + + + Cash paid to suppliers - - - - Cash paid for operating expenses - - - - Income taxes paid - - - -
Net cash flows from operating activities = = = = Cash flows from investing activities
Purchases of fixed assets - - - - Purchases of Investments - - - - Proceeds from the sale of Fixed Assets + + + +
Proceeds from the sale of Investments + + + + Cash receipts as Dividends / Interest on investments + + + +
Net cash flows from investing activities = = = = Cash flows from financing activities
Receipts from issue of shares + + + + Receipts from issue of Debenture + + + + Payment on redemption of preference shares - - - - Payment on redemption of debenture - - - - Payment of dividend or interest - - - -
Net cash flows used in financing activities = = = = Net increase in cash and cash equivalents = = = = Cash and cash equivalents, beginning of year + + + + Cash and cash equivalents, end of year = = = =
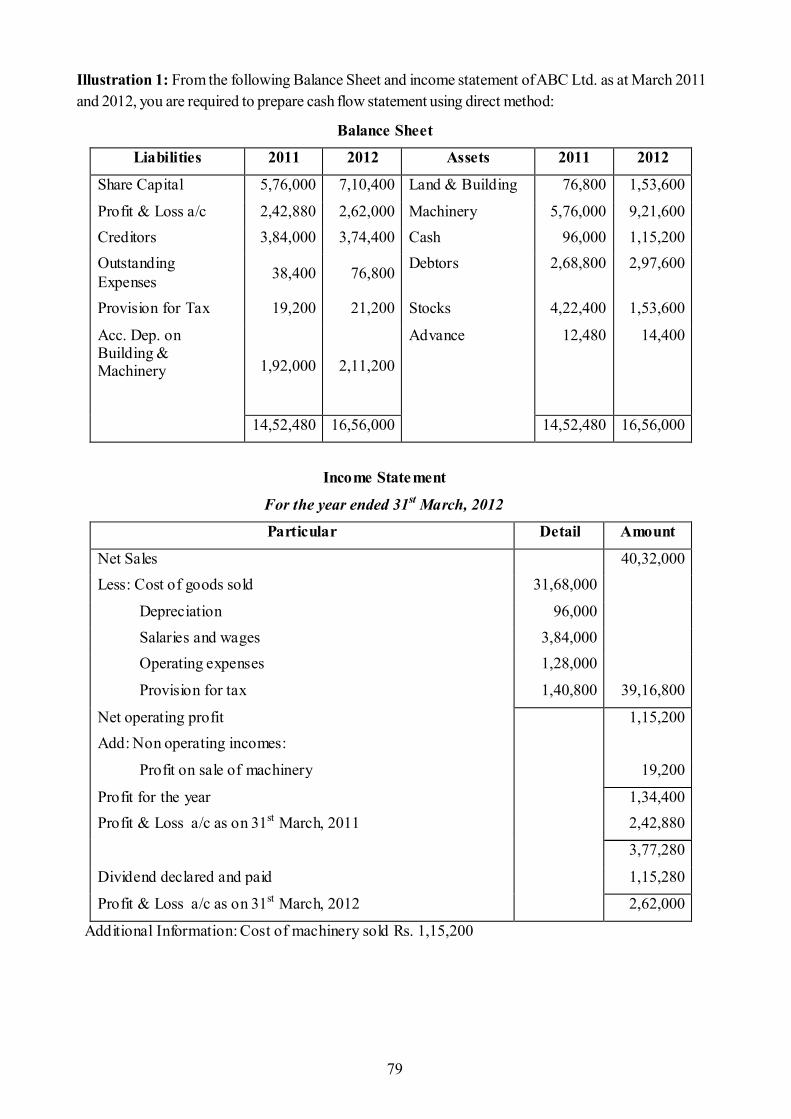
79
Illustration 1: From the following Balance Sheet and income statement of ABC Ltd. as at March 2011and 2012, you are required to prepare cash flow statement using direct method:
Balance Sheet
Liabilities 2011 2012 Assets 2011 2012
Share Capital 5,76,000 7,10,400 Land & Building 76,800 1,53,600
Profit & Loss a/c 2,42,880 2,62,000 Machinery 5,76,000 9,21,600 Creditors 3,84,000 3,74,400 Cash 96,000 1,15,200 Outstanding Expenses 38,400 76,800 Debtors 2,68,800 2,97,600
Provision for Tax 19,200 21,200 Stocks 4,22,400 1,53,600
Acc. Dep. on Building & Machinery
1,92,000
2,11,200
Advance 12,480 14,400
14,52,480 16,56,000 14,52,480 16,56,000
Income Statement
For the year ended 31st March, 2012
Particular Detail Amount
Net Sales 40,32,000 Less: Cost of goods sold 31,68,000
Depreciation 96,000 Salaries and wages 3,84,000 Operating expenses 1,28,000
Provision for tax 1,40,800 39,16,800
Net operating profit 1,15,200 Add: Non operating incomes:
Profit on sale of machinery 19,200
Profit for the year 1,34,400 Profit & Loss a/c as on 31st March, 2011 2,42,880
3,77,280
Dividend declared and paid 1,15,280
Profit & Loss a/c as on 31st March, 2012 2,62,000
Additional Information: Cost of machinery sold Rs. 1,15,200
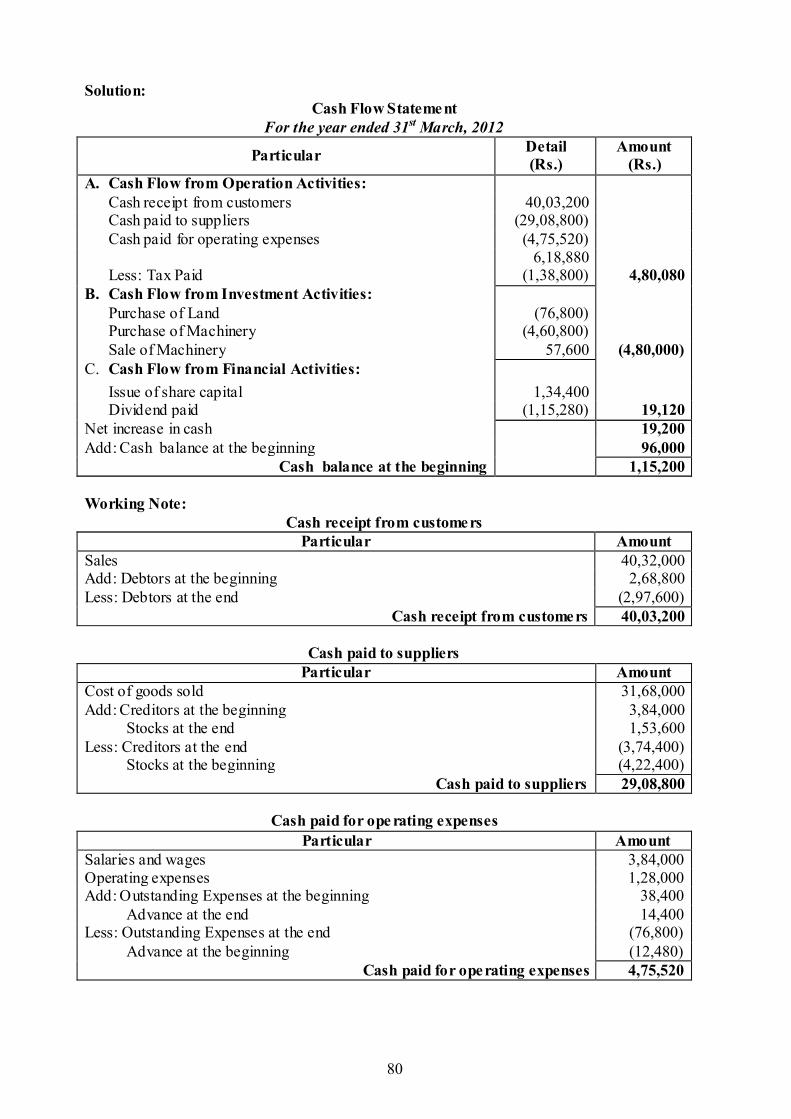
80
Solution: Cash Flow Statement
For the year ended 31st March, 2012
Particular Detail (Rs.)
Amount (Rs.)
A. Cash Flow from Operation Activities: Cash receipt from customers 40,03,200 Cash paid to suppliers (29,08,800) Cash paid for operating expenses (4,75,520) 6,18,880 Less: Tax Paid (1,38,800) 4,80,080
B. Cash Flow from Investment Activities: Purchase of Land (76,800) Purchase of Machinery (4,60,800) Sale of Machinery 57,600 (4,80,000)
C. Cash Flow from Financial Activities: Issue of share capital 1,34,400 Dividend paid (1,15,280) 19,120
Net increase in cash 19,200 Add: Cash balance at the beginning 96,000
Cash balance at the beginning 1,15,200 Working Note:
Cash receipt from customers Particular Amount
Sales 40,32,000 Add: Debtors at the beginning 2,68,800 Less: Debtors at the end (2,97,600)
Cash receipt from customers 40,03,200
Cash paid to suppliers Particular Amount
Cost of goods sold 31,68,000 Add: Creditors at the beginning 3,84,000
Stocks at the end 1,53,600 Less: Creditors at the end (3,74,400)
Stocks at the beginning (4,22,400) Cash paid to suppliers 29,08,800
Cash paid for ope rating expenses
Particular Amount Salaries and wages 3,84,000 Operating expenses 1,28,000 Add: Outstanding Expenses at the beginning 38,400
Advance at the end 14,400 Less: Outstanding Expenses at the end (76,800)
Advance at the beginning (12,480) Cash paid for operating expenses 4,75,520
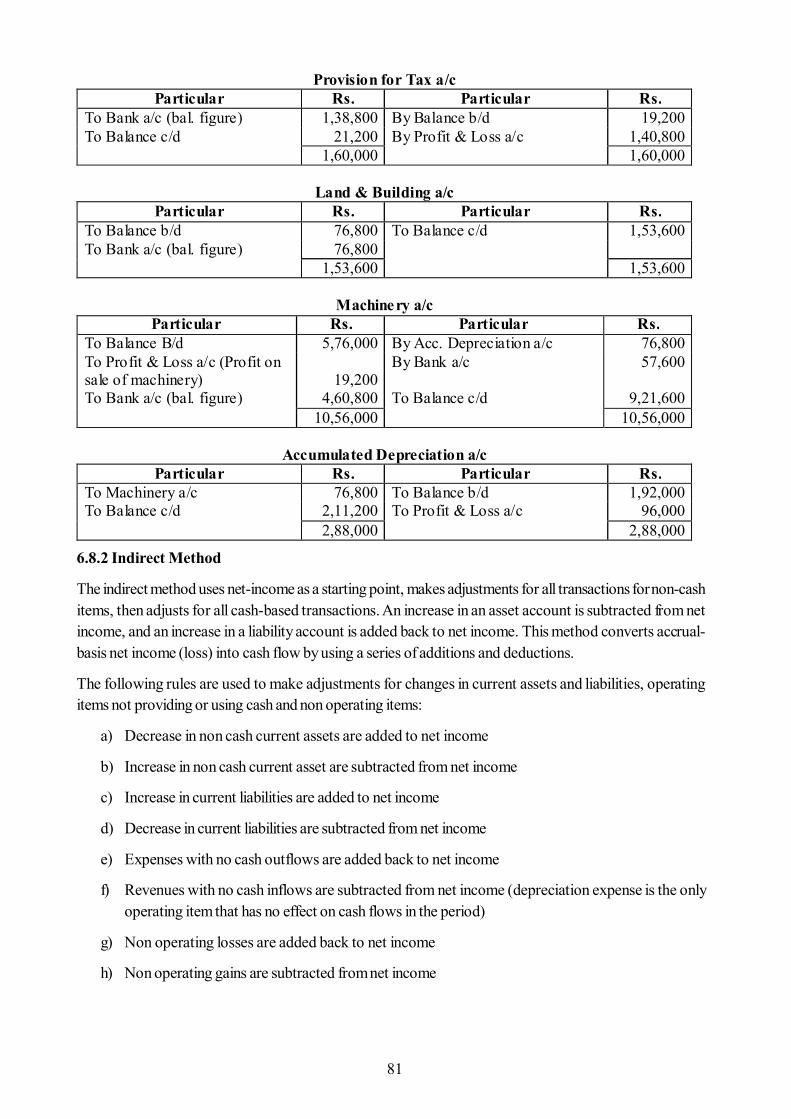
81
6.8.2 Indirect Method
The indirect method uses net-income as a starting point, makes adjustments for all transactions for non-cashitems, then adjusts for all cash-based transactions. An increase in an asset account is subtracted from netincome, and an increase in a liability account is added back to net income. This method converts accrual-basis net income (loss) into cash flow by using a series of additions and deductions.
The following rules are used to make adjustments for changes in current assets and liabilities, operatingitems not providing or using cash and non operating items:
a) Decrease in non cash current assets are added to net income
b) Increase in non cash current asset are subtracted from net income
c) Increase in current liabilities are added to net income
d) Decrease in current liabilities are subtracted from net income
e) Expenses with no cash outflows are added back to net income
f) Revenues with no cash inflows are subtracted from net income (depreciation expense is the onlyoperating item that has no effect on cash flows in the period)
g) Non operating losses are added back to net income
h) Non operating gains are subtracted from net income
Provision for Tax a/c Particular Rs. Particular Rs.
To Bank a/c (bal. figure) 1,38,800 By Balance b/d 19,200 To Balance c/d 21,200 By Profit & Loss a/c 1,40,800 1,60,000 1,60,000
Land & Building a/c Particular Rs. Particular Rs.
To Balance b/d 76,800 To Balance c/d 1,53,600 To Bank a/c (bal. figure) 76,800 1,53,600 1,53,600
Machinery a/c Particular Rs. Particular Rs.
To Balance B/d 5,76,000 By Acc. Depreciation a/c 76,800 To Profit & Loss a/c (Profit on sale of machinery)
19,200
By Bank a/c 57,600
To Bank a/c (bal. figure) 4,60,800 To Balance c/d 9,21,600 10,56,000 10,56,000
Accumulated Depreciation a/c Particular Rs. Particular Rs.
To Machinery a/c 76,800 To Balance b/d 1,92,000 To Balance c/d 2,11,200 To Profit & Loss a/c 96,000 2,88,000 2,88,000
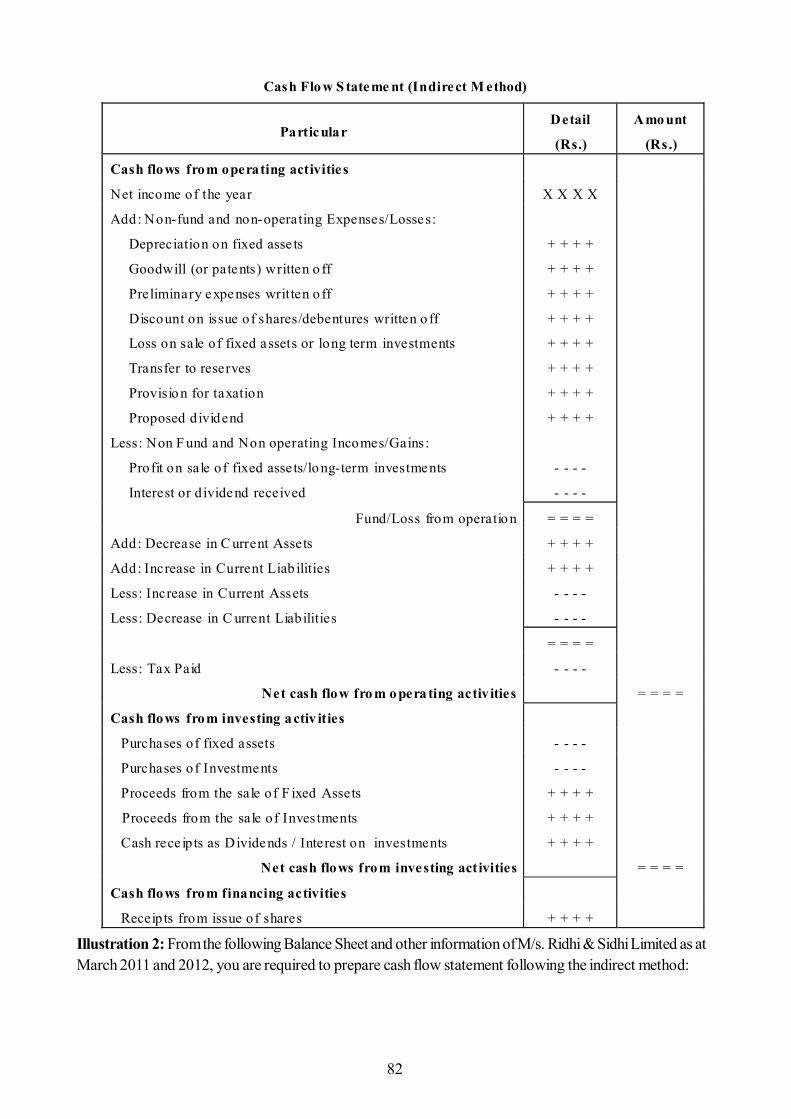
82
Illustration 2: From the following Balance Sheet and other information of M/s. Ridhi & Sidhi Limited as atMarch 2011 and 2012, you are required to prepare cash flow statement following the indirect method:
Cash Flo w S tateme nt (Indirect M ethod)
Particular Detail
(Rs.)
Amo unt
(Rs.)
Cash flows from operating activitie s
Net income of the year X X X X
Add: Non-fund and non-operating Expenses/Losses:
Depreciation on fixed asse ts
Goodwill (or patents) written o ff
Preliminary expenses written o ff
Discount on issue of shares/debentures written o ff
Loss on sale of fixed assets or long term investments
Transfer to reserves
Provisio n for taxation
Proposed dividend
Less: Non F und and Non operating Incomes/Gains :
Profit on sale of fixed asse ts/lo ng-term investments
Interest or d ividend received
+ + + +
+ + + +
+ + + +
+ + + +
+ + + +
+ + + +
+ + + +
+ + + +
- - - -
- - - -
Fund/Loss from operatio n = = = =
Add: Decrease in C urrent Assets + + + +
Add: Increase in Current Liab ilities + + + +
Less: Increase in Current Assets - - - -
Less: Decrease in C urrent Liabilities - - - -
= = = =
Less: Tax Paid - - - -
Net cash flow fro m o pera ting activ ities = = = =
Cash flows from investing a ctiv ities
Purchases of fixed assets - - - -
Purchases of Investments - - - -
Proceeds from the sale of F ixed Assets + + + +
Proceeds from the sale of Inves tments + + + +
Cash rece ip ts as Dividends / Interest on investments + + + +
Net cash flows from investing activities = = = =
Cash flows from financing activities
Receipts from issue of shares + + + +
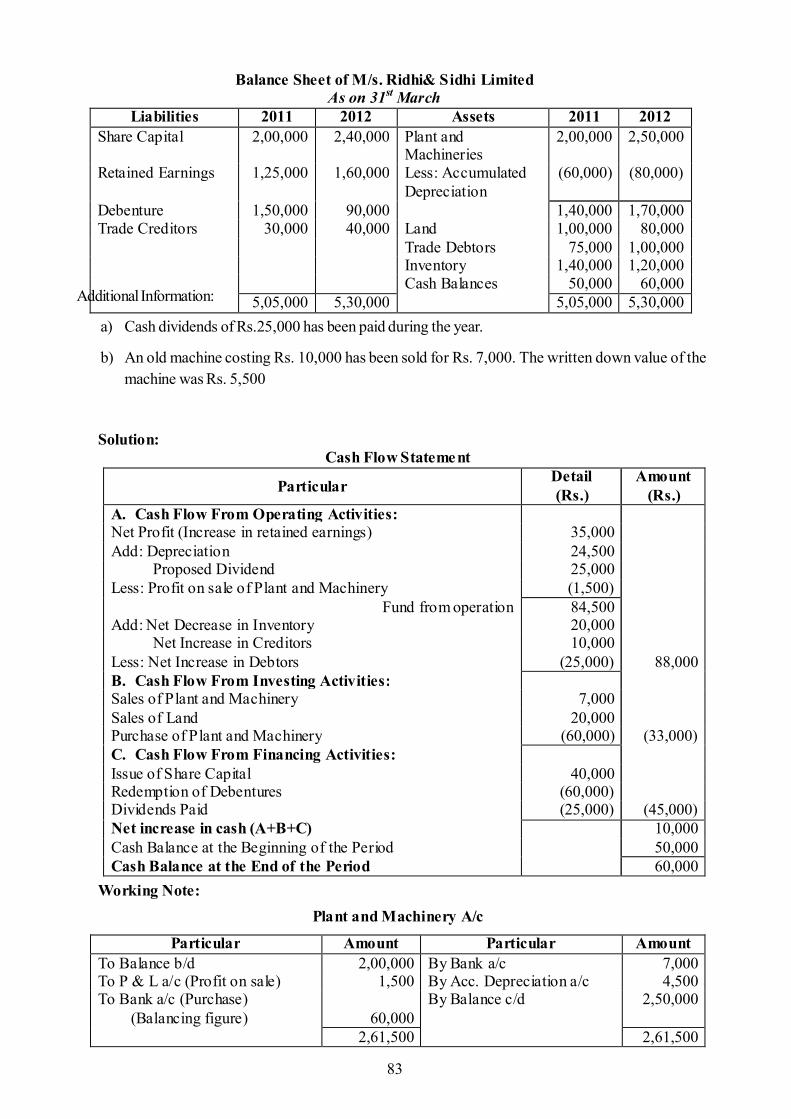
83
Additional Information:
a) Cash dividends of Rs.25,000 has been paid during the year.
b) An old machine costing Rs. 10,000 has been sold for Rs. 7,000. The written down value of themachine was Rs. 5,500
Balance Sheet of M/s. Ridhi& Sidhi Limited As on 31st March
Liabilities 2011 2012 Assets 2011 2012 Share Capital 2,00,000 2,40,000 Plant and
Machineries 2,00,000 2,50,000
Retained Earnings 1,25,000 1,60,000 Less: Accumulated Depreciation
(60,000) (80,000)
Debenture 1,50,000 90,000 1,40,000 1,70,000 Trade Creditors 30,000 40,000 Land 1,00,000 80,000 Trade Debtors 75,000 1,00,000 Inventory 1,40,000 1,20,000 Cash Balances 50,000 60,000 5,05,000 5,30,000 5,05,000 5,30,000
Solution: Cash Flow Statement
Particular Detail (Rs.)
Amount (Rs.)
A. Cash Flow From Operating Activities: Net Profit (Increase in retained earnings) 35,000 Add: Depreciation 24,500
Proposed Dividend 25,000 Less: Profit on sale of Plant and Machinery (1,500)
Fund from operation 84,500 Add: Net Decrease in Inventory 20,000
Net Increase in Creditors 10,000 Less: Net Increase in Debtors (25,000) 88,000 B. Cash Flow From Investing Activities: Sales of Plant and Machinery 7,000 Sales of Land 20,000 Purchase of Plant and Machinery (60,000) (33,000) C. Cash Flow From Financing Activities: Issue of Share Capital 40,000 Redemption of Debentures (60,000) Dividends Paid (25,000) (45,000) Net increase in cash (A+B+C) 10,000 Cash Balance at the Beginning of the Period 50,000 Cash Balance at the End of the Period 60,000
Working Note: Plant and Machinery A/c
Particular Amount Particular Amount To Balance b/d 2,00,000 By Bank a/c 7,000 To P & L a/c (Profit on sale) 1,500 By Acc. Depreciation a/c 4,500 To Bank a/c (Purchase)
(Balancing figure)
60,000 By Balance c/d 2,50,000
2,61,500 2,61,500
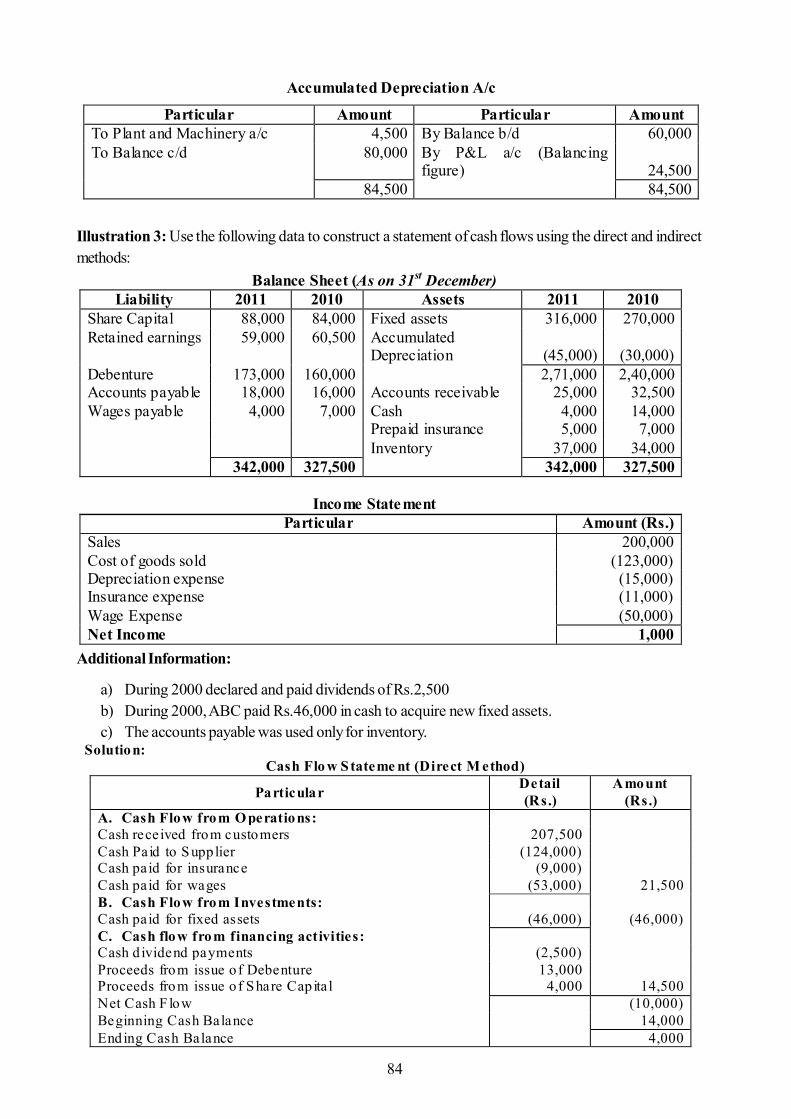
84
Illustration 3: Use the following data to construct a statement of cash flows using the direct and indirectmethods:
Additional Information:
a) During 2000 declared and paid dividends of Rs.2,500b) During 2000, ABC paid Rs.46,000 in cash to acquire new fixed assets.c) The accounts payable was used only for inventory.
Accumulated Depreciation A/c
Particular Amount Particular Amount To Plant and Machinery a/c 4,500 By Balance b/d 60,000 To Balance c/d 80,000 By P&L a/c (Balancing
figure)
24,500 84,500 84,500
Balance Sheet (As on 31st December) Liability 2011 2010 Assets 2011 2010
Share Capital 88,000 84,000 Fixed assets 316,000 270,000 Retained earnings 59,000 60,500 Accumulated
Depreciation
(45,000)
(30,000) Debenture 173,000 160,000 2,71,000 2,40,000 Accounts payable 18,000 16,000 Accounts receivable 25,000 32,500 Wages payable 4,000 7,000 Cash 4,000 14,000 Prepaid insurance 5,000 7,000 Inventory 37,000 34,000 342,000 327,500 342,000 327,500
Income Statement
Particular Amount (Rs.) Sales 200,000 Cost of goods sold (123,000) Depreciation expense (15,000) Insurance expense (11,000) Wage Expense (50,000) Net Income 1,000
Solution: Cash Flo w S tateme nt (Direct M ethod)
Particular Detail (Rs.)
Amount (Rs.)
A. Cash Flow from Operations: Cash received from customers 207,500 Cash Paid to Supplier (124,000) Cash paid for insurance (9,000) Cash paid for wages (53,000) 21,500 B. Cash Flow from Investments: Cash paid for fixed assets (46,000) (46,000) C. Cash flow from financing activities: Cash d ividend payments (2,500) Proceeds from issue o f Debenture 13,000 Proceeds from issue o f Share Capita l 4,000 14,500 Net Cash F low (10,000) Beginning Cash Balance 14,000 Ending Cash Balance 4,000
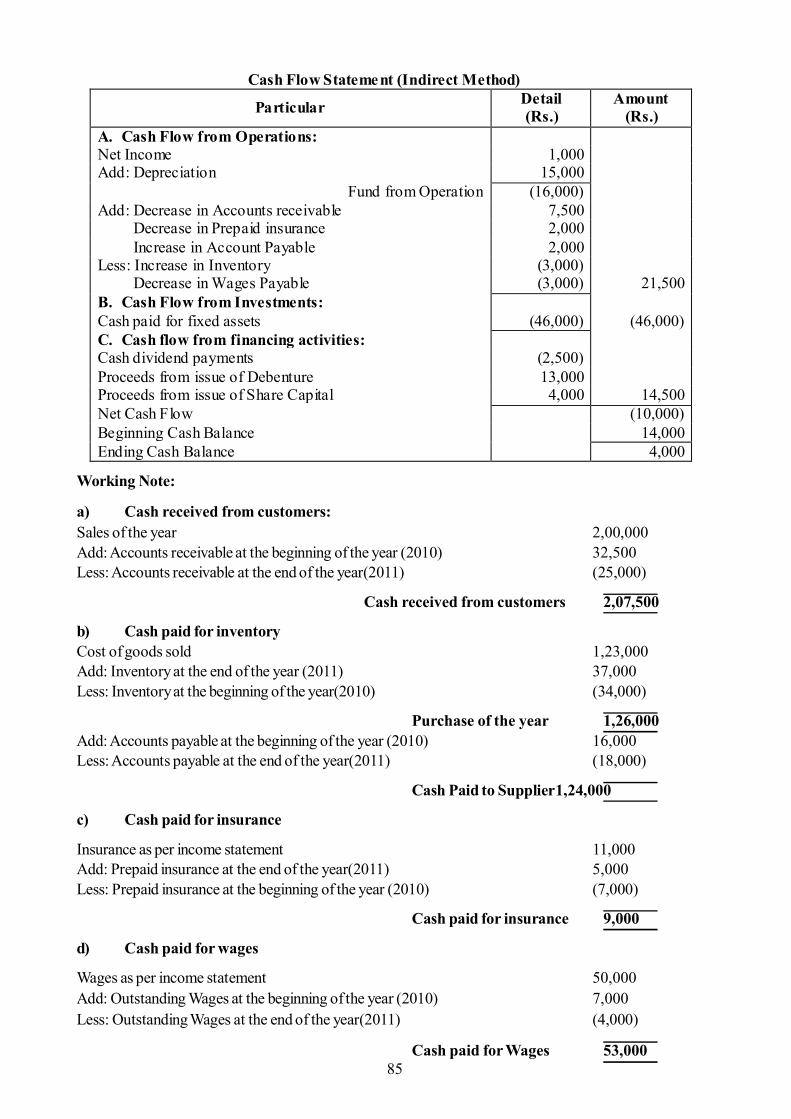
85
Working Note:
a) Cash received from customers:Sales of the year 2,00,000Add: Accounts receivable at the beginning of the year (2010) 32,500Less: Accounts receivable at the end of the year(2011) (25,000)
Cash received from customers 2,07,500
b) Cash paid for inventoryCost of goods sold 1,23,000Add: Inventory at the end of the year (2011) 37,000Less: Inventory at the beginning of the year(2010) (34,000)
Purchase of the year 1,26,000Add: Accounts payable at the beginning of the year (2010) 16,000Less: Accounts payable at the end of the year(2011) (18,000)
Cash Paid to Supplier1,24,000
c) Cash paid for insurance
Insurance as per income statement 11,000Add: Prepaid insurance at the end of the year(2011) 5,000Less: Prepaid insurance at the beginning of the year (2010) (7,000)
Cash paid for insurance 9,000
d) Cash paid for wages
Wages as per income statement 50,000Add: Outstanding Wages at the beginning of the year (2010) 7,000Less: Outstanding Wages at the end of the year(2011) (4,000)
Cash paid for Wages 53,000
Cash Flow Statement (Indirect Method)
Particular Detail (Rs.)
Amount (Rs.)
A. Cash Flow from Operations: Net Income 1,000 Add: Depreciation 15,000
Fund from Operation (16,000) Add: Decrease in Accounts receivable 7,500
Decrease in Prepaid insurance 2,000 Increase in Account Payable 2,000
Less: Increase in Inventory (3,000) Decrease in Wages Payable (3,000) 21,500
B. Cash Flow from Investments: Cash paid for fixed assets (46,000) (46,000) C. Cash flow from financing activities: Cash dividend payments (2,500) Proceeds from issue of Debenture 13,000 Proceeds from issue of Share Capital 4,000 14,500 Net Cash Flow (10,000) Beginning Cash Balance 14,000 Ending Cash Balance 4,000
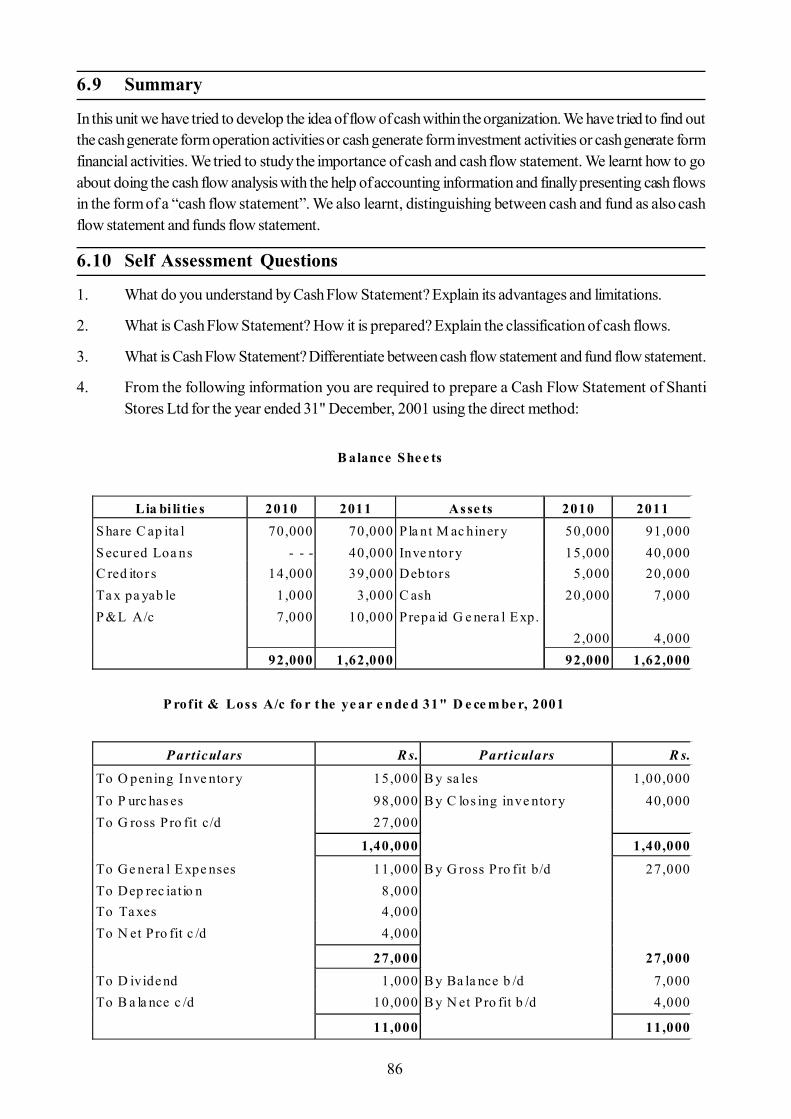
86
6.9 Summary
In this unit we have tried to develop the idea of flow of cash within the organization. We have tried to find outthe cash generate form operation activities or cash generate form investment activities or cash generate formfinancial activities. We tried to study the importance of cash and cash flow statement. We learnt how to goabout doing the cash flow analysis with the help of accounting information and finally presenting cash flowsin the form of a “cash flow statement”. We also learnt, distinguishing between cash and fund as also cashflow statement and funds flow statement.
6.10 Self Assessment Questions
1. What do you understand by Cash Flow Statement? Explain its advantages and limitations.
2. What is Cash Flow Statement? How it is prepared? Explain the classification of cash flows.
3. What is Cash Flow Statement? Differentiate between cash flow statement and fund flow statement.
4. From the following information you are required to prepare a Cash Flow Statement of ShantiStores Ltd for the year ended 31" December, 2001 using the direct method:
B alance She e ts
Lia bi li tie s 2010 2011 Asse ts 2010 2011 S hare C ap ita l 70,000 70,000 P la nt M ac hiner y 50,000 91,000 S ecur ed Loa ns - - - 40,000 Inve ntor y 15,000 40,000 C red itor s 14,000 39,000 Debtors 5 ,000 20,000 Ta x pa yab le 1 ,000 3,000 C ash 20,000 7,000 P &L A/c 7,000 10,000 Prepa id G e nera l E xp.
2 ,000
4 ,000 92,000 1,62,000 92,000 1,62,000
P rof it & Loss A/c fo r t he ye ar e nde d 31" D e ce m be r, 2001
P articulars R s. P art iculars R s.
To O pening Inve ntor y 15,000 B y sa les 1 ,00,000 To P urc has es 98,000 B y C los ing inve ntor y 40,000 To G ross Pro fit c/d 27,000
1,40,000 1,40,000
To Ge nera l E xpe nses 11,000 B y G ross Pro fit b/d 27,000 To Dep rec iatio n 8,000 To Ta xes 4,000 To N et Pro fit c /d 4 ,000
27,000 27,000 To D ivide nd 1 ,000 B y Ba la nce b /d 7 ,000 To B a la nce c /d 10,000 B y N et Pro fit b /d 4,000
11,000 11,000
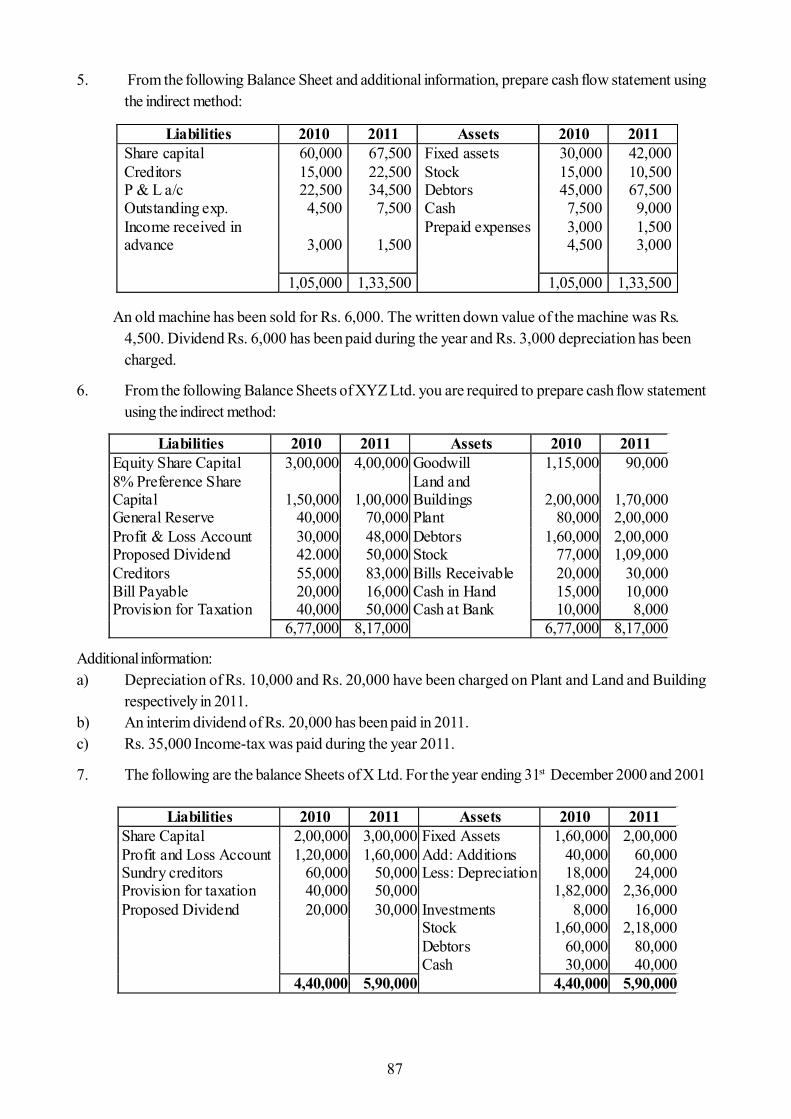
87
Liabilities 2010 2011 Assets 2010 2011
Equity Share Capital 3,00,000 4,00,000 Goodwill 1,15,000 90,000 8% Preference Share Capital
1,50,000
1,00,000
Land and Buildings
2,00,000
1,70,000
General Reserve 40,000 70,000 Plant 80,000 2,00,000 Profit & Loss Account 30,000 48,000 Debtors 1,60,000 2,00,000 Proposed Dividend 42.000 50,000 Stock 77,000 1,09,000 Creditors 55,000 83,000 Bills Receivable 20,000 30,000 Bill Payable 20,000 16,000 Cash in Hand 15,000 10,000 Provision for Taxation 40,000 50,000 Cash at Bank 10,000 8,000 6,77,000 8,17,000 6,77,000 8,17,000
Liabilities 2010 2011 Assets 2010 2011 Share capital 60,000 67,500 Fixed assets 30,000 42,000 Creditors 15,000 22,500 Stock 15,000 10,500 P & L a/c 22,500 34,500 Debtors 45,000 67,500 Outstanding exp. 4,500 7,500 Cash 7,500 9,000 Income received in advance
3,000
1,500
Prepaid expenses 3,000 4,500
1,500 3,000
1,05,000 1,33,500 1,05,000 1,33,500
5. From the following Balance Sheet and additional information, prepare cash flow statement usingthe indirect method:
An old machine has been sold for Rs. 6,000. The written down value of the machine was Rs.4,500. Dividend Rs. 6,000 has been paid during the year and Rs. 3,000 depreciation has beencharged.
6. From the following Balance Sheets of XYZ Ltd. you are required to prepare cash flow statementusing the indirect method:
Additional information:a) Depreciation of Rs. 10,000 and Rs. 20,000 have been charged on Plant and Land and Building
respectively in 2011.b) An interim dividend of Rs. 20,000 has been paid in 2011.c) Rs. 35,000 Income-tax was paid during the year 2011.
7. The following are the balance Sheets of X Ltd. For the year ending 31st December 2000 and 2001
Liabilities 2010 2011 Assets 2010 2011 Share Capital 2,00,000 3,00,000 Fixed Assets 1,60,000 2,00,000 Profit and Loss Account 1,20,000 1,60,000 Add: Additions 40,000 60,000 Sundry creditors 60,000 50,000 Less: Depreciation 18,000 24,000 Provision for taxation 40,000 50,000 1,82,000 2,36,000 Proposed Dividend 20,000 30,000 Investments 8,000 16,000 Stock 1,60,000 2,18,000 Debtors 60,000 80,000 Cash 30,000 40,000 4,40,000 5,90,000 4,40,000 5,90,000
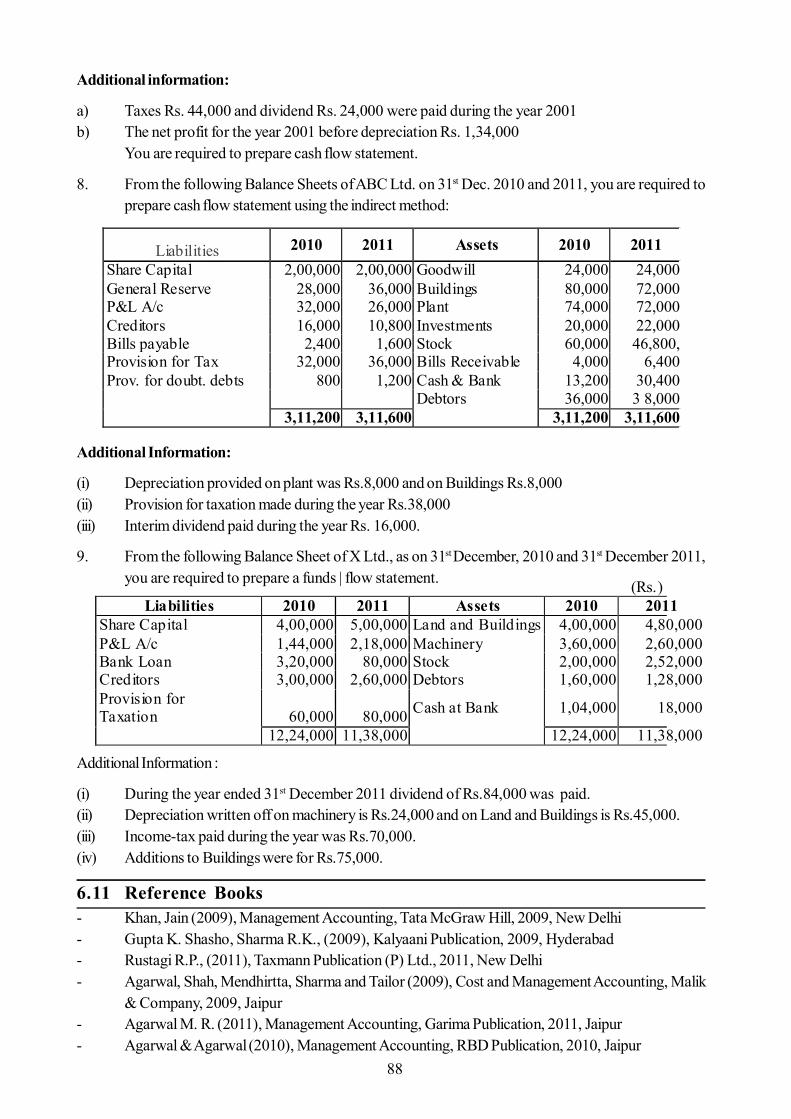
88
(Rs.) Liabilities 2010 2011 Assets 2010 2011
Share Capital 4,00,000 5,00,000 Land and Buildings 4,00,000 4,80,000 P&L A/c 1,44,000 2,18,000 Machinery 3,60,000 2,60,000 Bank Loan 3,20,000 80,000 Stock 2,00,000 2,52,000 Creditors 3,00,000 2,60,000 Debtors 1,60,000 1,28,000 Provision for Taxation
60,000
80,000 Cash at Bank 1,04,000 18,000
12,24,000 11,38,000 12,24,000 11,38,000
Liabilities 2010 2011 Assets 2010 2011 Share Capital 2,00,000 2,00,000 Goodwill 24,000 24,000 General Reserve 28,000 36,000 Buildings 80,000 72,000 P&L A/c 32,000 26,000 Plant 74,000 72,000 Creditors 16,000 10,800 Investments 20,000 22,000 Bills payable 2,400 1,600 Stock 60,000 46,800, Provision for Tax 32,000 36,000 Bills Receivable 4,000 6,400 Prov. for doubt. debts 800 1,200 Cash & Bank 13,200 30,400 Debtors 36,000 3 8,000 3,11,200 3,11,600 3,11,200 3,11,600
Additional information:
a) Taxes Rs. 44,000 and dividend Rs. 24,000 were paid during the year 2001b) The net profit for the year 2001 before depreciation Rs. 1,34,000
You are required to prepare cash flow statement.
8. From the following Balance Sheets of ABC Ltd. on 31st Dec. 2010 and 2011, you are required toprepare cash flow statement using the indirect method:
Additional Information:
(i) Depreciation provided on plant was Rs.8,000 and on Buildings Rs.8,000(ii) Provision for taxation made during the year Rs.38,000(iii) Interim dividend paid during the year Rs. 16,000.
9. From the following Balance Sheet of X Ltd., as on 31st December, 2010 and 31st December 2011,you are required to prepare a funds | flow statement.
Additional Information :
(i) During the year ended 31st December 2011 dividend of Rs.84,000 was paid.(ii) Depreciation written off on machinery is Rs.24,000 and on Land and Buildings is Rs.45,000.(iii) Income-tax paid during the year was Rs.70,000.(iv) Additions to Buildings were for Rs.75,000.
6.11 Reference Books- Khan, Jain (2009), Management Accounting, Tata McGraw Hill, 2009, New Delhi- Gupta K. Shasho, Sharma R.K., (2009), Kalyaani Publication, 2009, Hyderabad- Rustagi R.P., (2011), Taxmann Publication (P) Ltd., 2011, New Delhi- Agarwal, Shah, Mendhirtta, Sharma and Tailor (2009), Cost and Management Accounting, Malik
& Company, 2009, Jaipur- Agarwal M. R. (2011), Management Accounting, Garima Publication, 2011, Jaipur- Agarwal & Agarwal (2010), Management Accounting, RBD Publication, 2010, Jaipur
89
Unit - 7 : Management of Working Capital
Structure of Unit:
7.0 Objectives7.1 Introduction7.2 Concept of Working Capital7.3 Types of Working Capital7.4 Determinants of Working Capital7.5 Advantages of Adequate Working Capital7.6 Disadvantages from Redundant or Excess Working Capital7.7 Estimation of Working Capital Requirements
Percentage of Sales Method Regression Analysis Method Operating Cycle Method Forecasting Net Current Assets Method Projected Balance Sheet Method
7.8 Summary7.9 Self Assessment Questions7.10 Reference Books
7.0 Objectives
After completing this unit you will be able to:
to understand concept of Working Capital to know the types of Working Capital to understand determinants of Working Capital to point out advantages and disadvantages due to adequate and excessive Working Capital to learn the methods of estimation of Working Capital requirements
7.1 Introduction
Working Capital is the part of the firms capital which is required for financing short term or current assetssuch as stock, receivables, marketable securities and cash. Money invested in these current assets keeprevolving with relative rapidity and are being constantly converted into cash. This cash flows rotat again inexchange of other such assets. Working Capital is also called as “short term capital”. “Liquid Capital”,“Ciculating or revolving capital”, The Working Capital management refers to management of the workingcapital or to be more precise the management of current assets and current liabilities. The goal of workingcapital management is to manage the firms’ current assets and current liabilities in such a way that a satisfac-tory level of working capital is maintained. This is so because, if the firm cannot maintain a satisfactory levelof working capital, it is likely to become insolvent and may even be forced into bankruptcy. Each of theshort term sources of financing must be continuously managed to ensure that they are obtained and used inthe best possible way. The current assets should be large enough to cover its current liabilities in order toensure a reasonable margin of safety.
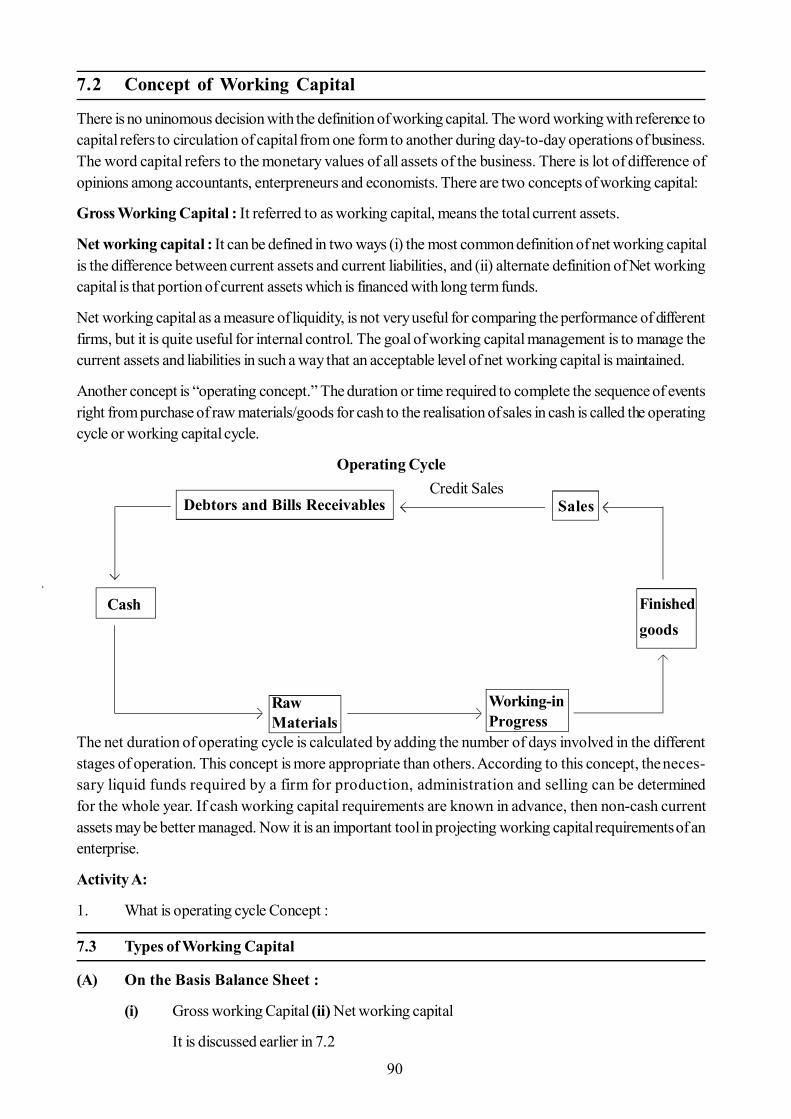
90
7.2 Concept of Working Capital
There is no uninomous decision with the definition of working capital. The word working with reference tocapital refers to circulation of capital from one form to another during day-to-day operations of business.The word capital refers to the monetary values of all assets of the business. There is lot of difference ofopinions among accountants, enterpreneurs and economists. There are two concepts of working capital:
Gross Working Capital : It referred to as working capital, means the total current assets.
Net working capital : It can be defined in two ways (i) the most common definition of net working capitalis the difference between current assets and current liabilities, and (ii) alternate definition of Net workingcapital is that portion of current assets which is financed with long term funds.
Net working capital as a measure of liquidity, is not very useful for comparing the performance of differentfirms, but it is quite useful for internal control. The goal of working capital management is to manage thecurrent assets and liabilities in such a way that an acceptable level of net working capital is maintained.
Another concept is “operating concept.” The duration or time required to complete the sequence of eventsright from purchase of raw materials/goods for cash to the realisation of sales in cash is called the operatingcycle or working capital cycle.
Operating Cycle
The net duration of operating cycle is calculated by adding the number of days involved in the differentstages of operation. This concept is more appropriate than others. According to this concept, the neces-sary liquid funds required by a firm for production, administration and selling can be determinedfor the whole year. If cash working capital requirements are known in advance, then non-cash currentassets may be better managed. Now it is an important tool in projecting working capital requirements of anenterprise.
Activity A:
1. What is operating cycle Concept :
7.3 Types of Working Capital
(A) On the Basis Balance Sheet :
(i) Gross working Capital (ii) Net working capital
It is discussed earlier in 7.2
Debtors and Bills Receivables SalesCredit Sales
Finishedgoods
Cash
RawMaterials
Working-inProgress
91
(B) On the Basis of Time :
(i) Permanent working capital
(ii) Variable (Temporary) working capital
(a) seasonal working capital
(b) specific working capital
Permanent Working Capital : It means that minimum amount which is parmanently blocked in the busi-ness and that cannot be converted into cash in the normal course of business. This amount is definitelyrequired throughout the year on a continuous basis for maintaining the circulation of current assets. Tondoncommittee has identified this capital as core current assets. As the business grows the requirement of per-manent working capital also increased due to increase in current assets. This portion of working capital isfinanced through longterm sources.
Variable Working Capital : The amount which is above the permanent level of working capital is called astemporary working capital. Such requirement of this part of working capital financed from shortterm funds,whenever needed. It is classified further : (A) seasonal working capital : Some of the industries likerefrigertors and coolers may need extra fund to carry on production and to accumulate stock before the saleoperations. It is of short term nature, it has to be financed from short term sources like bank loan etc. (B)Specific working Capital : Such capital is required to meet unforseen contingencies like slumps andothers. It is arranged to meet special exigencies.
Activity B:
1. Defind Gross Working Capital :
7.4 Determinants of Working Capital
In order to determine the proper amount of working capital of a firm, the following factors should beconsidered carefully :
1. Seasonal nature of the firm
2. Firm’s credit policy
3. Size of Business
4. Nature of business
5. Rate of growth of business
6. Business cycle
7. Duration of operating cycle
8. Change in terms of purchase and sales.
The amount of working capital required depends upon a large number of other factors like political stability,means of transport, co-ordination of activities, rate of industrial development, speed of circulation of work-ing capital, profit margin etc. The above determinants should be considered, because no certain criterian todetermine the amount of working capital needs that may be applied to all firms.
92
7.5 Advantages of Adequate Working Capital
Inadequate working Capital is harmful for a business organisation. It is a source of energy to a business. Theprofitability of a business also depends upon planning of adequate working capital. Following are the ad-vantages to a business enterprise if adequate working capital is available with the firm.
1. Adequate working capital enables a firm to pay its suppliers immediately.
2. Adequate working capital creates an environment of confidence, high morale, confidence and in-creases overall efficiency of the business.
3. Adequate working capital increases the productivity and efficiency of fixed assets in the business.Adequacy of working capital aftects the use of fixed assets.
4. Due to adequate working capital a firm can pay its debt in time and also its collection from debtorsis relatively in time. Hence it increases goodwill of the firm because adequate working capital pro-vides better security.
5. Despite of sufficient profits, if a firm has unadequate working capital, then it cannot distribute ap-propriate and enough dividentd. Hence, if there is adequate working capital a firm can distributesufficient profits and it can bring satisfaction amoung shareholders.
6. Due to a better credit worthiness, a firm can easily fetch shortterm loans and advances from banksfor completing its seasonal and short period needs.
Activity C:
1. Adequate Working Capital enable the firm and create an environment of
7.6 Disadvantages from Redundant or Excess Working Capital
Excess working capital refers to idle funds which do not earnany profit for the firm. If there is idle funds witha firm following disadvantages are :
1. If management is not utilising its current resources than it indicate inefficient management.
2. Excess working capital means, there is a defective credit policy and collection policy.
3. There may be more change of holding excess inventory, if there is excess working capital suchsituation results upon companies profitability and efficiency in using its resources.
4. Excess working capital results, the low rate of return, and it will causing dissatisfaction amongshareholders.
5. Due to idle funds the efficacy of firm to earn profits is effected, hence due to more interest liability,it reduces the amount of profits.
Hence, if can be concluded that excess working capital reduces return on investment while adequate work-ing capital increase the firms profitability as-well-as goodwill.
7.7 Estimation of Working Capital Requirements
There are following methods for estimation of working capital :
1. Percantage of Sales Method: Relationship between sales and working capital is calculated over theyear, if it is found stable then it is taken as a base for determining working capital. In this method, percentage
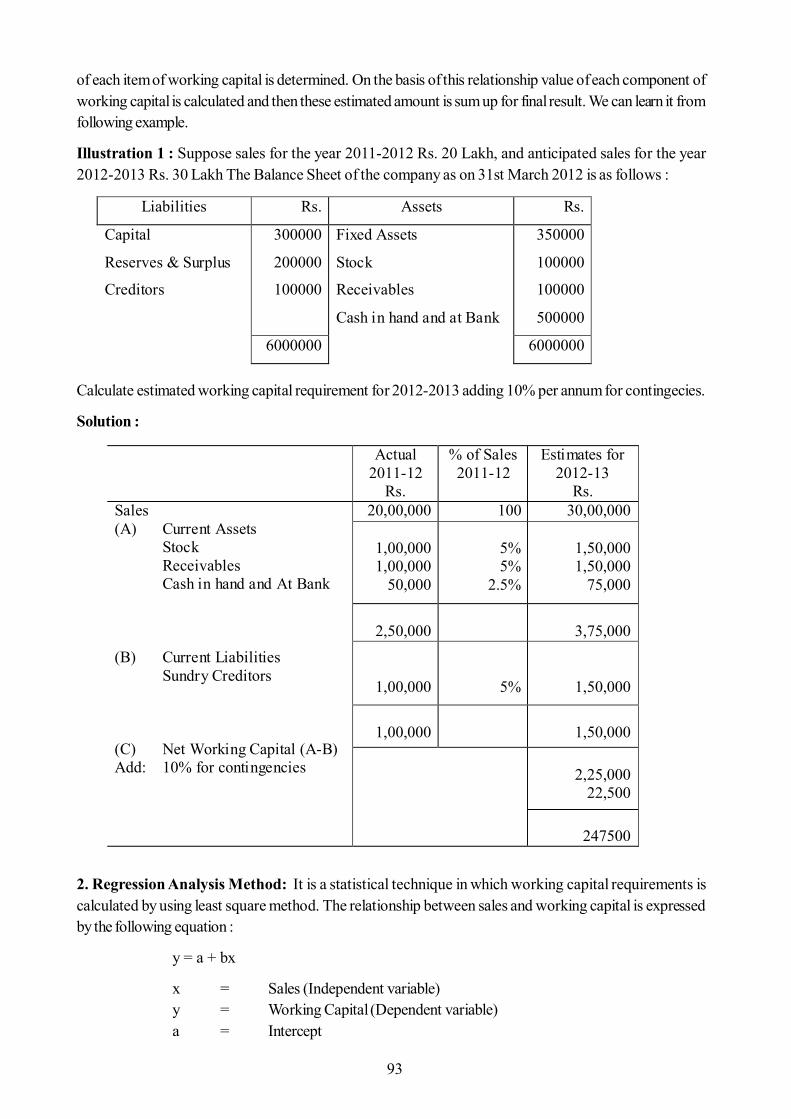
93
of each item of working capital is determined. On the basis of this relationship value of each component ofworking capital is calculated and then these estimated amount is sum up for final result. We can learn it fromfollowing example.
Illustration 1 : Suppose sales for the year 2011-2012 Rs. 20 Lakh, and anticipated sales for the year2012-2013 Rs. 30 Lakh The Balance Sheet of the company as on 31st March 2012 is as follows :
Calculate estimated working capital requirement for 2012-2013 adding 10% per annum for contingecies.
Solution :
2. Regression Analysis Method: It is a statistical technique in which working capital requirements iscalculated by using least square method. The relationship between sales and working capital is expressedby the following equation :
y = a + bx
x = Sales (Independent variable)y = Working Capital (Dependent variable)a = Intercept
Liabilities Rs. Assets Rs.
Capital
Reserves & Surplus
Creditors
300000
200000
100000
Fixed Assets
Stock
Receivables
Cash in hand and at Bank
350000
100000
100000
500000
6000000 6000000
Actual 2011-12
Rs.
% of Sales 2011-12
Estimates for 2012-13
Rs. Sales (A) Current Assets Stock Receivables Cash in hand and At Bank (B) Current Liabilities Sundry Creditors (C) Net Working Capital (A-B) Add: 10% for contingencies
20,00,000 100 30,00,000
1,00,000 1,00,000
50,000
5% 5%
2.5%
1,50,000 1,50,000
75,000
2,50,000
3,75,000
1,00,000
5%
1,50,000
1,00,000
1,50,000
2,25,000
22,500
247500
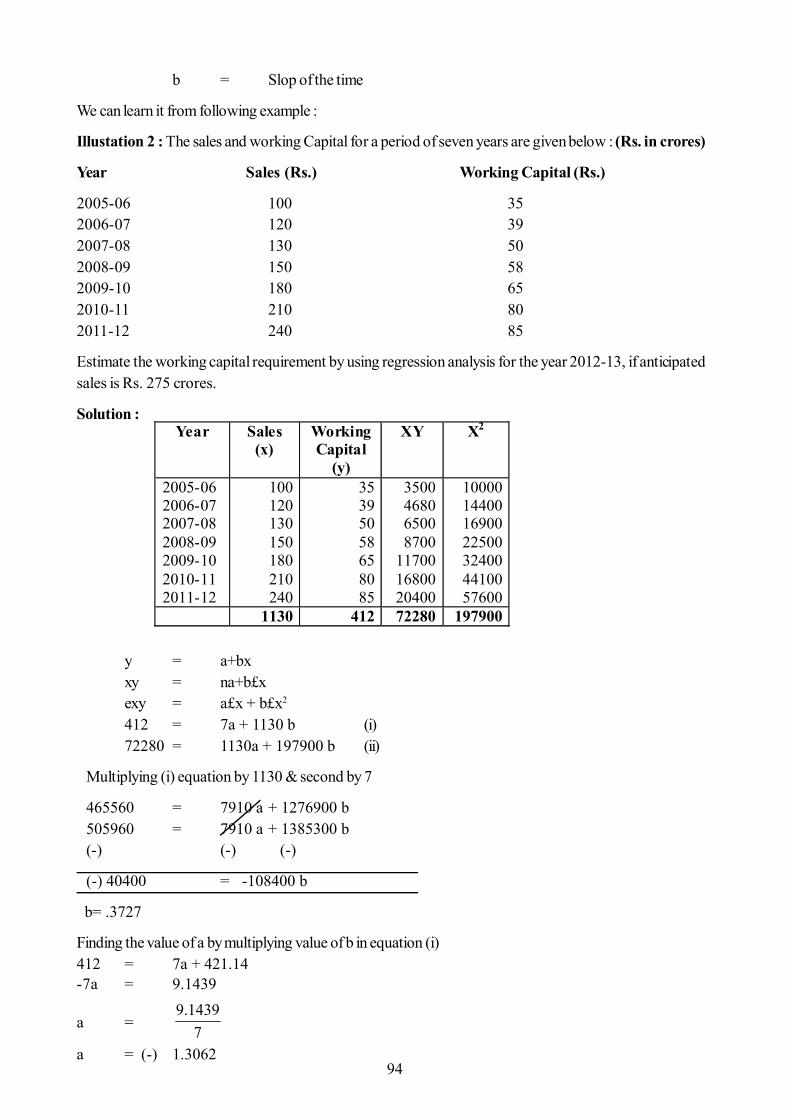
94
b = Slop of the time
We can learn it from following example :
Illustation 2 : The sales and working Capital for a period of seven years are given below : (Rs. in crores)
Year Sales (Rs.) Working Capital (Rs.)
2005-06 100 352006-07 120 392007-08 130 502008-09 150 582009-10 180 652010-11 210 802011-12 240 85
Estimate the working capital requirement by using regression analysis for the year 2012-13, if anticipatedsales is Rs. 275 crores.
Solution :
y = a+bxxy = na+b£xexy = a£x + b£x2
412 = 7a + 1130 b (i)72280 = 1130a + 197900 b (ii)
Multiplying (i) equation by 1130 & second by 7
465560 = 7910 a + 1276900 b505960 = 7910 a + 1385300 b(-) (-) (-)
(-) 40400 = -108400 b
b= .3727
Finding the value of a by multiplying value of b in equation (i)412 = 7a + 421.14-7a = 9.1439
a = 71439.9
a = (-) 1.3062
Year Sales (x)
Working Capital
(y)
XY X2
2005-06 2006-07 2007-08 2008-09 2009-10 2010-11 2011-12
100 120 130 150 180 210 240
35 39 50 58 65 80 85
3500 4680 6500 8700
11700 16800 20400
10000 14400 16900 22500 32400 44100 57600
1130 412 72280 197900
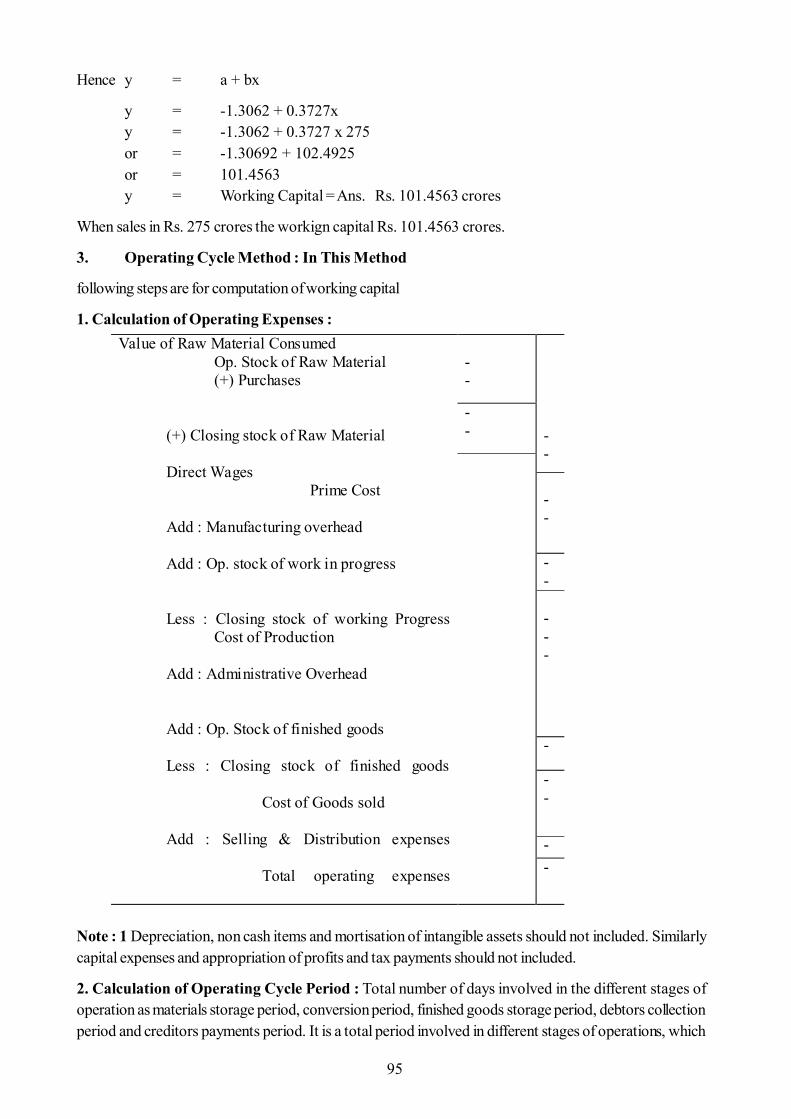
95
Hence y = a + bx
y = -1.3062 + 0.3727xy = -1.3062 + 0.3727 x 275or = -1.30692 + 102.4925or = 101.4563y = Working Capital = Ans. Rs. 101.4563 crores
When sales in Rs. 275 crores the workign capital Rs. 101.4563 crores.
3. Operating Cycle Method : In This Method
following steps are for computation of working capital
1. Calculation of Operating Expenses :
Note : 1 Depreciation, non cash items and mortisation of intangible assets should not included. Similarlycapital expenses and appropriation of profits and tax payments should not included.
2. Calculation of Operating Cycle Period : Total number of days involved in the different stages ofoperation as materials storage period, conversion period, finished goods storage period, debtors collectionperiod and creditors payments period. It is a total period involved in different stages of operations, which
Value of Raw Material Consumed Op. Stock of Raw Material (+) Purchases (+) Closing stock of Raw Material Direct Wages Prime Cost Add : Manufacturing overhead Add : Op. stock of work in progress Less : Closing stock of working Progress Cost of Production Add : Administrative Overhead Add : Op. Stock of finished goods Less : Closing stock of finished goods Cost of Goods sold Add : Selling & Distribution expenses Total operating expenses
- -
- -
- -
- -
- - - - -
-
- -
- -
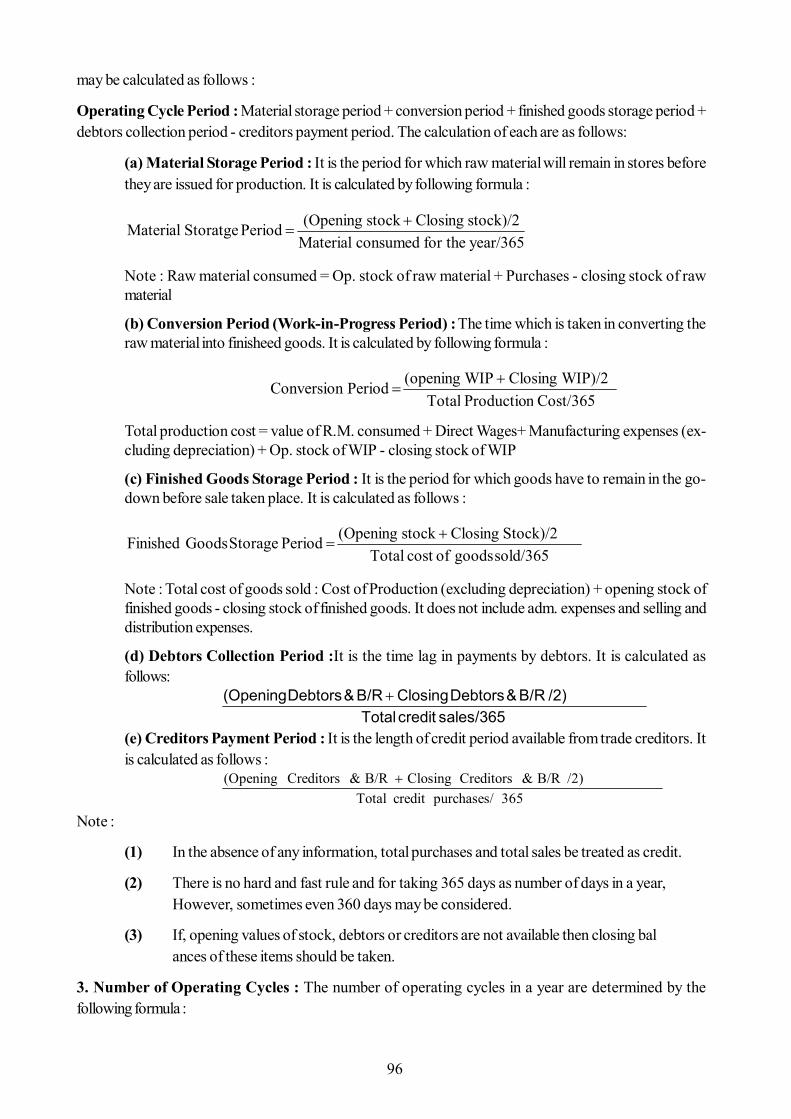
96
may be calculated as follows :
Operating Cycle Period : Material storage period + conversion period + finished goods storage period +debtors collection period - creditors payment period. The calculation of each are as follows:
(a) Material Storage Period : It is the period for which raw material will remain in stores beforethey are issued for production. It is calculated by following formula :
year/365for the consumed Materialstock)/2 Closing stock (Opening PeriodStoratge Material
Note : Raw material consumed = Op. stock of raw material + Purchases - closing stock of rawmaterial
(b) Conversion Period (Work-in-Progress Period) : The time which is taken in converting theraw material into finisheed goods. It is calculated by following formula :
Cost/365 n ProductioTotal WIP)/2 Closing WIP (opening PeriodConversion
Total production cost = value of R.M. consumed + Direct Wages+ Manufacturing expenses (ex-cluding depreciation) + Op. stock of WIP - closing stock of WIP
(c) Finished Goods Storage Period : It is the period for which goods have to remain in the go-down before sale taken place. It is calculated as follows :
sold/365 goods ofcost Total Stock)/2 Closing stock (Opening PeriodStorage Goods Finished
Note : Total cost of goods sold : Cost of Production (excluding depreciation) + opening stock offinished goods - closing stock of finished goods. It does not include adm. expenses and selling anddistribution expenses.
(d) Debtors Collection Period :It is the time lag in payments by debtors. It is calculated asfollows:
sales/365 credit Total /2)B/R & Debtors Closing B/R & Debtors (Opening
(e) Creditors Payment Period : It is the length of credit period available from trade creditors. Itis calculated as follows :
365purchases/credit Total /2) B/R& Creditors Closing B/R& Creditors (Opening
Note :
(1) In the absence of any information, total purchases and total sales be treated as credit.
(2) There is no hard and fast rule and for taking 365 days as number of days in a year,However, sometimes even 360 days may be considered.
(3) If, opening values of stock, debtors or creditors are not available then closing balances of these items should be taken.
3. Number of Operating Cycles : The number of operating cycles in a year are determined by thefollowing formula :
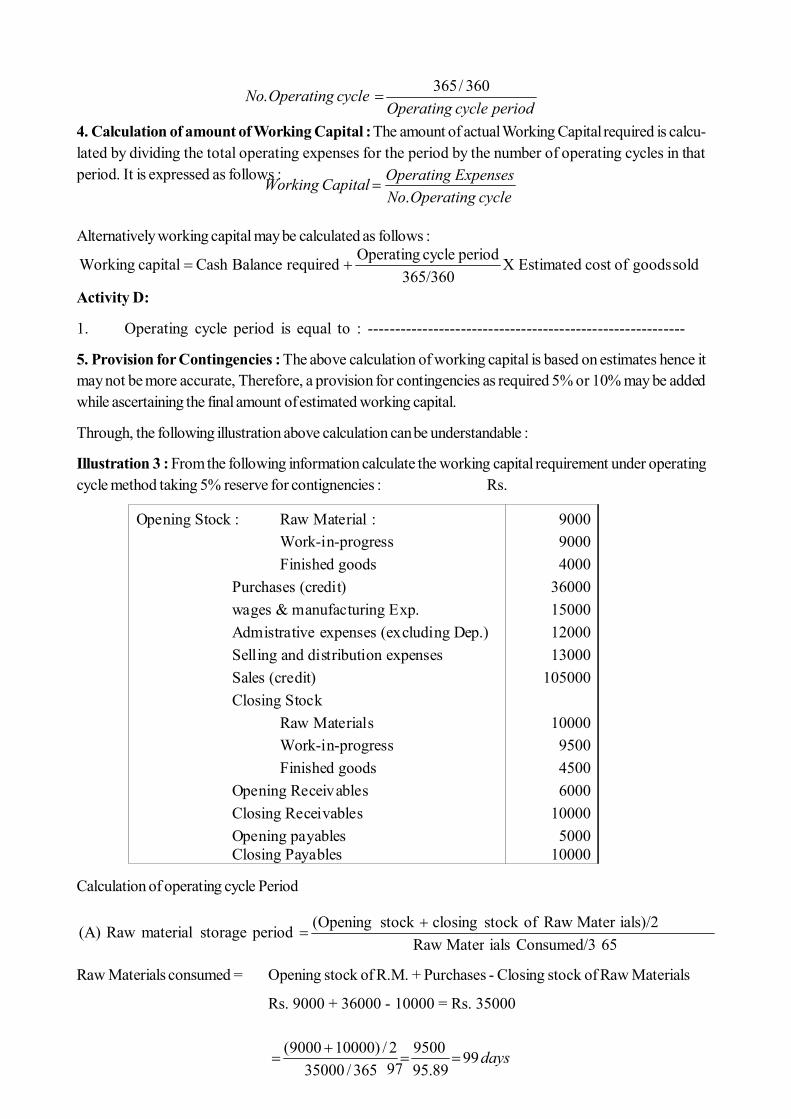
97
periodcycleOperatingcycleOperatingNo 360/365.
4. Calculation of amount of Working Capital : The amount of actual Working Capital required is calcu-lated by dividing the total operating expenses for the period by the number of operating cycles in thatperiod. It is expressed as follows :
cycleOperatingNoExpensesOperatingCapitalWorking
.
Alternatively working capital may be calculated as follows :
sold goods ofcost EstimatedX365/360
periodcycleOperating required BalanceCash capital Working
Activity D:
1. Operating cycle period is equal to : ----------------------------------------------------------
5. Provision for Contingencies : The above calculation of working capital is based on estimates hence itmay not be more accurate, Therefore, a provision for contingencies as required 5% or 10% may be addedwhile ascertaining the final amount of estimated working capital.
Through, the following illustration above calculation can be understandable :
Illustration 3 : From the following information calculate the working capital requirement under operatingcycle method taking 5% reserve for contignencies : Rs.
Calculation of operating cycle Period
65Consumed/3 ials Raw Mater ials)/2 Raw Materofstock closing stock (Opening period storage material Raw (A)
Raw Materials consumed = Opening stock of R.M. + Purchases - Closing stock of Raw Materials
Rs. 9000 + 36000 - 10000 = Rs. 35000
days9989.95
9500365/35000
2/)100009000(
Opening Stock : Raw Material : Work-in-progress Finished goods Purchases (credit) wages & manufacturing Exp. Admistrative expenses (excluding Dep.) Selling and distribution expenses Sales (credit) Closing Stock Raw Materials Work-in-progress Finished goods Opening Receivables Closing Receivables Opening payables Closing Payables
9000 9000 4000
36000 15000 12000 13000
105000
10000 9500 4500 6000
10000 5000
10000
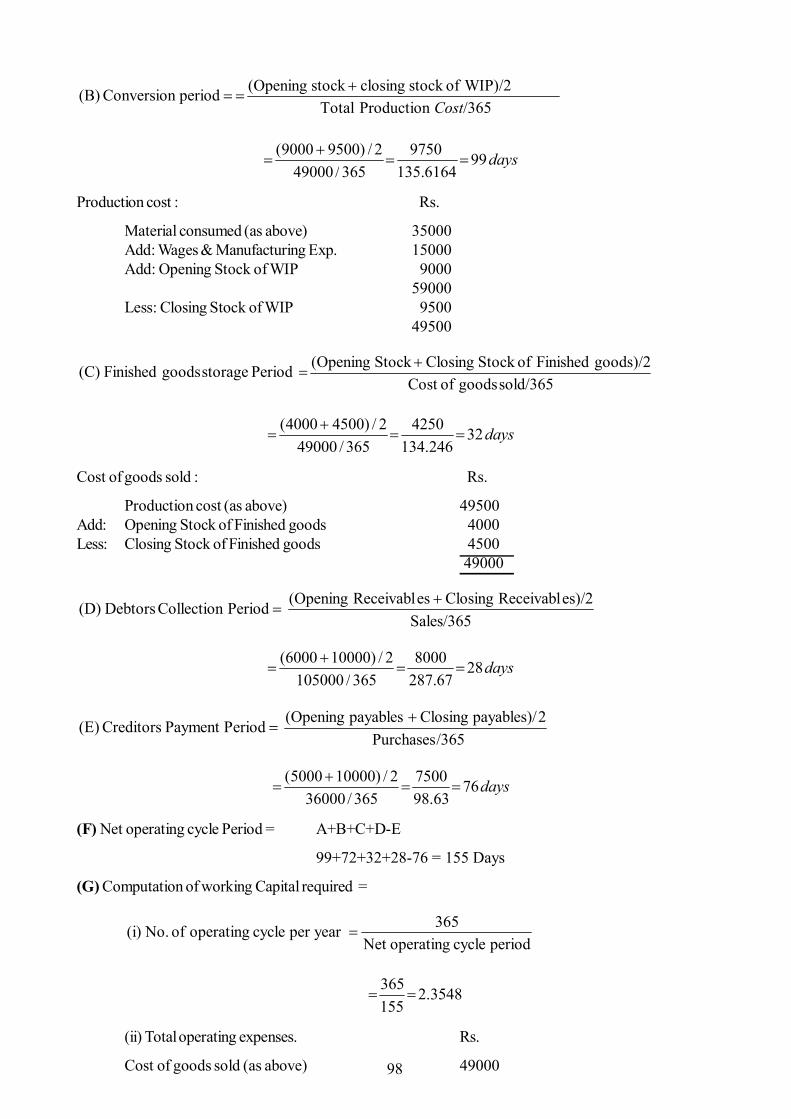
98
/365ProductionTotal WIP)/2 ofstock closing stock (Opening period Conversion (B)
Cost
days996164.135
9750365/49000
2/)95009000(
Production cost : Rs.
Material consumed (as above) 35000Add: Wages & Manufacturing Exp. 15000Add: Opening Stock of WIP 9000
59000Less: Closing Stock of WIP 9500
49500
sold/365 goods ofCost goods)/2 FinishedofStock Closing Stock (Opening Periodstorage goods Finished(C)
days32246.134
4250365/49000
2/)45004000(
Cost of goods sold : Rs.
Production cost (as above) 49500Add: Opening Stock of Finished goods 4000Less: Closing Stock of Finished goods 4500
49000
Sales/365es)/2 ReceivablClosing es Receivabl(Opening PeriodCollection Debtors(D)
days2867.287
8000365/105000
2/)100006000(
/365 Purchases2payables)/ Closing payables (Opening eriod Payment PCreditors (E)
days7663.98
7500365/36000
2/)100005000(
(F) Net operating cycle Period = A+B+C+D-E
99+72+32+28-76 = 155 Days
(G) Computation of working Capital required =
period cycle operatingNet
365 per year cycle operating of No. (i)
3548.2155365
(ii) Total operating expenses. Rs.
Cost of goods sold (as above) 49000
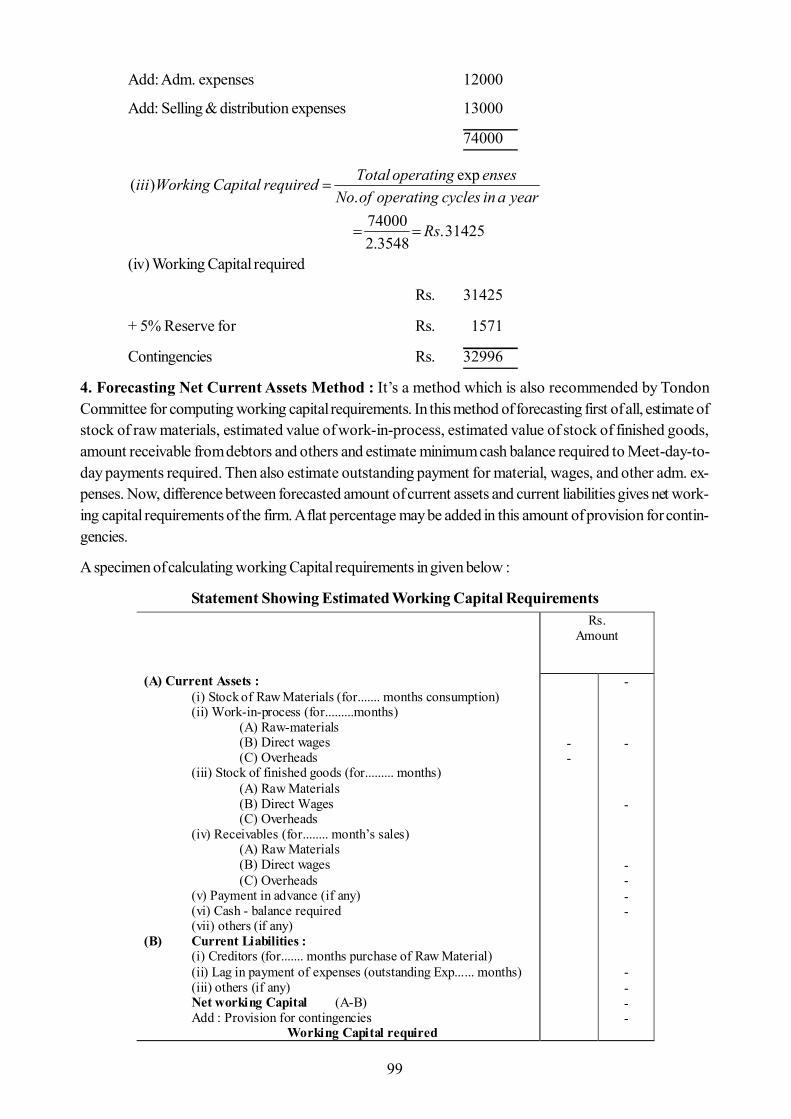
99
Add: Adm. expenses 12000
Add: Selling & distribution expenses 13000
74000
yearaincyclesoperatingofNoensesoperatingTotalrequiredCapitalWorkingiii
.exp)(
31425.3548.2
74000 Rs
(iv) Working Capital required
Rs. 31425
+ 5% Reserve for Rs. 1571
Contingencies Rs. 32996
4. Forecasting Net Current Assets Method : It’s a method which is also recommended by TondonCommittee for computing working capital requirements. In this method of forecasting first of all, estimate ofstock of raw materials, estimated value of work-in-process, estimated value of stock of finished goods,amount receivable from debtors and others and estimate minimum cash balance required to Meet-day-to-day payments required. Then also estimate outstanding payment for material, wages, and other adm. ex-penses. Now, difference between forecasted amount of current assets and current liabilities gives net work-ing capital requirements of the firm. A flat percentage may be added in this amount of provision for contin-gencies.
A specimen of calculating working Capital requirements in given below :
Statement Showing Estimated Working Capital Requirements (A) Current Assets : (i) Stock of Raw Materials (for....... months consumption) (ii) Work-in-process (for.........months) (A) Raw-materials (B) Direct wages (C) Overheads (iii) Stock of finished goods (for......... months) (A) Raw Materials (B) Direct Wages (C) Overheads (iv) Receivables (for........ month’s sales) (A) Raw Materials (B) Direct wages (C) Overheads (v) Payment in advance (if any) (vi) Cash - balance required (vii) others (if any) (B) Current Liabilities : (i) Creditors (for....... months purchase of Raw Material) (ii) Lag in payment of expenses (outstanding Exp...... months) (iii) others (if any) Net working Capital (A-B) Add : Provision for contingencies Working Capital required
Rs. Amount
- -
- - - - - - - - - - -
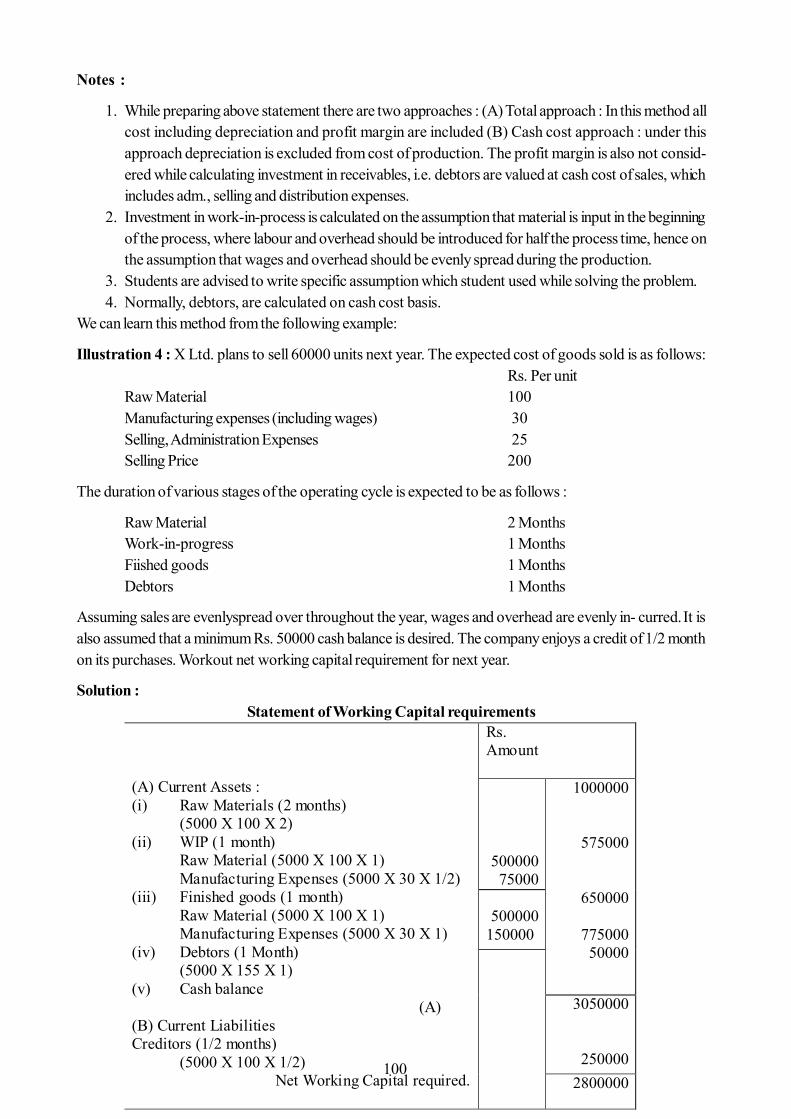
100
Notes :
1. While preparing above statement there are two approaches : (A) Total approach : In this method allcost including depreciation and profit margin are included (B) Cash cost approach : under thisapproach depreciation is excluded from cost of production. The profit margin is also not consid-ered while calculating investment in receivables, i.e. debtors are valued at cash cost of sales, whichincludes adm., selling and distribution expenses.
2. Investment in work-in-process is calculated on the assumption that material is input in the beginningof the process, where labour and overhead should be introduced for half the process time, hence onthe assumption that wages and overhead should be evenly spread during the production.
3. Students are advised to write specific assumption which student used while solving the problem.4. Normally, debtors, are calculated on cash cost basis.
We can learn this method from the following example:
Illustration 4 : X Ltd. plans to sell 60000 units next year. The expected cost of goods sold is as follows:Rs. Per unit
Raw Material 100Manufacturing expenses (including wages) 30Selling, Administration Expenses 25Selling Price 200
The duration of various stages of the operating cycle is expected to be as follows :
Raw Material 2 MonthsWork-in-progress 1 MonthsFiished goods 1 MonthsDebtors 1 Months
Assuming sales are evenlyspread over throughout the year, wages and overhead are evenly in- curred. It isalso assumed that a minimum Rs. 50000 cash balance is desired. The company enjoys a credit of 1/2 monthon its purchases. Workout net working capital requirement for next year.
Solution :Statement of Working Capital requirements
(A) Current Assets : (i) Raw Materials (2 months) (5000 X 100 X 2) (ii) WIP (1 month) Raw Material (5000 X 100 X 1) Manufacturing Expenses (5000 X 30 X 1/2) (iii) Finished goods (1 month) Raw Material (5000 X 100 X 1) Manufacturing Expenses (5000 X 30 X 1) (iv) Debtors (1 Month) (5000 X 155 X 1) (v) Cash balance (A) (B) Current Liabilities Creditors (1/2 months) (5000 X 100 X 1/2) Net Working Capital required.
Rs. Amount
500000 75000
1000000
575000
650000
775000 50000
500000
150000
3050000
250000 2800000
101
Working notes :1. It is assumed that all sales and purchases are on credit.2. Debtors are calculated on the basis of cash cost of sales.
5. Projected Balance Sheet Method: In this method, estimates of different assets (excluding cash) andliabilities are made, with taking into consideration the transcations in the ensuing period. After that, a “Pro-jected Balance Sheet is prepared on the basis of these forecasts. If the total of assets side is more than thetotal of liabilities side, then it indicates the deficiency of working capital which is to be collected by themanagement either taking bank loan or from other sources. On the contrary, if total of liabilities side is morethen total of assets side than it represents cash balance available to the firm. Such surplus cash may investoutside the business or as management plans for it.
This method is not a popular method and calculations made through this method are not more scientific.
7.8 Summary
Working Capital is that part of the total Assets of the business that changes from one form toanother form in the ordinary course of business operations.
Gross working capital means the sum of the current assets of the business.
Net working capital is the difference between current assets and current liabilities of the business.
The time required to complete the sequence of business events starting from cash raw materialwork-in-process finished goods debtors cash is called as operating cycle or working capital cycle.
As per Balance-Sheet concept Working Capital is classified as Gross Working Capital and NetWorking Capital.
Inadequate working capital as-well-as excessive working capital is disastrous for the business.
A Corporation can preserve its image with meeting all the expenses and liabilities promptly and takecare for emergency needs, if its hold adequate working capital.
Return on investment will reduce if a Corporation have excessive or redundant working capital.
There are so many factors which should be considered for determination of working capital.
Most popular method for estimating Working Capital requirement is forecasting Net Current
Assets Method
7.9 Self Assessment Questions
1. Explain the concept of working capital.
2. What are the types of working capital ? Explain it
3. What are the determinants of working capital ?
4. “Profitability of the business also depends upon working capital”. Explain the statement.
5. “Excessive working capital is harmful for the business”. Explain the statement.
6. From the following information, calculate the estimated working capital by using regressionanalysis method.
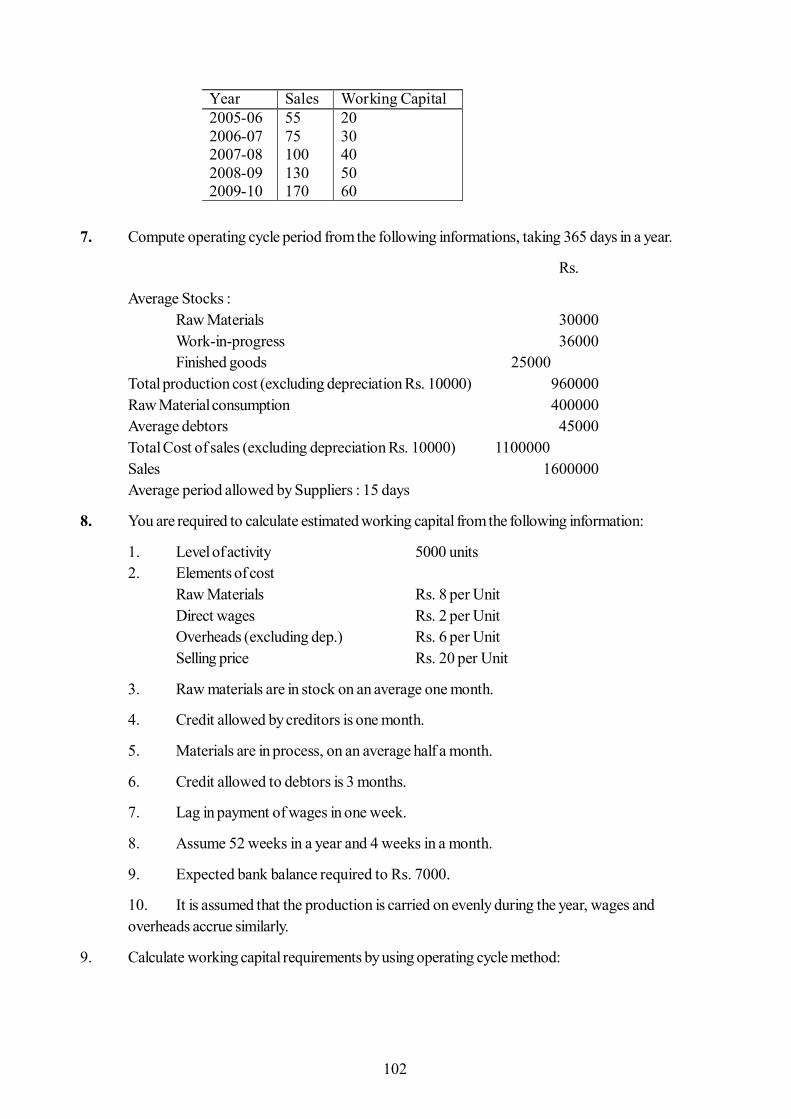
102
7. Compute operating cycle period from the following informations, taking 365 days in a year.
Rs.
Average Stocks :Raw Materials 30000Work-in-progress 36000Finished goods 25000
Total production cost (excluding depreciation Rs. 10000) 960000Raw Material consumption 400000Average debtors 45000Total Cost of sales (excluding depreciation Rs. 10000) 1100000Sales 1600000Average period allowed by Suppliers : 15 days
8. You are required to calculate estimated working capital from the following information:
1. Level of activity 5000 units2. Elements of cost
Raw Materials Rs. 8 per UnitDirect wages Rs. 2 per UnitOverheads (excluding dep.) Rs. 6 per UnitSelling price Rs. 20 per Unit
3. Raw materials are in stock on an average one month.
4. Credit allowed by creditors is one month.
5. Materials are in process, on an average half a month.
6. Credit allowed to debtors is 3 months.
7. Lag in payment of wages in one week.
8. Assume 52 weeks in a year and 4 weeks in a month.
9. Expected bank balance required to Rs. 7000.
10. It is assumed that the production is carried on evenly during the year, wages andoverheads accrue similarly.
9. Calculate working capital requirements by using operating cycle method:
Year Sales Working Capital 2005-06 2006-07 2007-08 2008-09 2009-10
55 75 100 130 170
20 30 40 50 60
103
7.10 Reference Books
- Khan, Jain : Management Accountancy
- S.N. Maheshwari : Management Accountancy
- Saxena, Vasistha : Management Accountancy
- Agrawal, Agrawal : Management Accountancy
Stocks: Opening Rs .
Clo sing Rs.
Raw Material Work-in -process
Finished go ods
Purchases (all credit) Cost of goo ds sold
Sales (all Cred it)
Debto rs Cred ito rs
2000 0 1200 0 2000 0
26 000 16 000
24 000
140 000 200 000
240 000
40 000 16 000
Assume 3 60 days in a year.
104
Unit - 8 : Management of Inventories
Structure of Unit:
8.0 Objectives8.1 Introduction8.2 Meaning of Inventory and Inventory Management8.3 Objectives of Inventory Management8.4 Benefits of Holding Inventory8.5 Factors Affecting Level of Inventory8.6 Risk and Costs Associated With Holding Inventory8.7 Techniques of Inventory Management8.8 Summary8.9 Keywords8.10 Self Assessment Questions8.11 Reference Books
8.0 Objectives
After Studying this unit you should be able to:
Understand the concept of inventory management. List out various objectives for holding inventories. Identify the factors affecting investment level in inventory. Pin point risk and cost associated with holding inventory. Explain re-ordering, physical verification systems of inventory management. Determine stock levels, reorder point and economic order quantity. Use selective inventory management techniques like ABC,VED etc.
8.1 Introduction
The role of capital is crucial in this increased pace of industrialization. The capital raised by a firm is investedin fixed assets and current assets for carrying on its activities. Inventory constitutes the largest portion ofcurrent assets. As such, inventories are a vital element in the efforts of the firm to achieve desired goals.
The concept of inventory management has been one of the many analytical aspects of management. Itinvolves optimization of resources available for holding stock of various materials. Excessive inventoryleads to unnecessarily blockage of funds, resulting decreased profit. On the other hand, lack of inventorynot only impairs the profitability but also results in interruption in production and causes inefficiencies. Oftenone is inclined to agree with the observation that "when you need money, look at your inventories, beforeyou look at your banker.' Even, if there is no shortage of funds in a business the financial manager has toparticipate actively in the formulation of inventory policies with a view to speeding inventory turnover ratioand maximising return on investment.
8.2 Meaning of Inventory and Inventory Management
Inventories are resources of any kind having an economic value.
S.E. Bolten defines it as "The term 'Inventory' refers to the stockpile of the product, a firm is offering for saleand the components that make up the product."
105
The Accounting Research and Terminology Bulletin defines the term inventory as "The aggregate of thoseitems of tangible personal property which;
(a) are held for sale in the ordinary course of business,(b)are in the process of production for such sales or(c) are to be currently consumed in the production of goods or services to be available for sale."
ICMA defines it as "The function of ensuring that sufficient goods are retained in stock to meet all requirementswithout carrying unnecessarily large stocks."
The following items are included in inventory:
1. Raw Materials:- These are goods that have not yet been committed to production in a manufacturingfirm i.e. stored for use in future production.
2. Works-in-Progress:- This category includes those materials that have been committed to theproduction process but have not been completed at the end of a financial year. Thus, these areneither raw materials nor finished goods.
3. Finished Goods:- These are completed products awaiting sale. For a trading concern inventoryalways means finished goods, while for a manufacturing firm they are the final output of the productionprocess.
4. Consumables and Stores:- Loose tools, cotton, lubricant, oil, grease etc. which are required forrunning and maintenance of plant and machineries are called consumables and stores. Though theseare not held for sale, but have significant importance.
The problems of managing inventories in manufacturing enterprises are relatively complex.
Inventory Management:- The area of inventory management covers the following individual phases:determining the size of inventory to be carried and lot sizes for new orders, establishing timing schedules andprocedures, ascertaining safety levels, providing proper storage facilities, co-ordinating inventory policieswith sales and production, arranging the procurement and disbursement of materials, record keeping, assigningresponsibilities for carrying out the inventory control functions and providing necessary reports for supervisingthe overall activity. Within these individual phases acquisition, Unit/physical control i.e. material handlingand production related decision are made by persons within purchasing and production departments. Thefinancial executive is only one of the persons in top management who is concerned with the levels andfluctuations of investment in inventories. He is concerned with any aspect of inventory management that iscontrollable from the stand point of reducing inventory costs and risks. This is also called value control.
As per Gordon B. Carson, "Inventory control refers to the process by which the investment in materials andparts carried in stock are regulated within pre-determined limits set in accordance with the inventory policyestablished by the management".
Thus, inventory management refers to a system which ensures the supply of required quantity and quality ofinventory at the required time and at the same time prevents unnecessary investment in inventories.
8.3 Objectives of Inventory Management
Reducing inventories without impairing operating efficiency frees working capital that can be effectivelyemployed elsewhere. The aim of a sound inventory management system is to secure the best balancebetween "too much and too little." Too much inventory carries financial burden and too little reacts adversely
106
on continuity of productions and competitive dynamics. The real problem is not the reduction of the size ofthe inventory as a whole but to secure a scientifically determined balance between several items that makeup the inventory. Thus, Inventory management should strike a balance between excess inventory and toolittle inventory. The primary objects of inventory management are-
I. to minimize wastage and losses of material in course of purchase, storage, handling and uses,II. to achieve maximum economy in purchasing and inventory holding,III.to make minimum investment in working capital by forecasting the demand and production in advance,IV.to ensure uninterrupted flow of materials of the right quality for continuous production,V. to provide better service to customers by maintaining an adequate inventory level.
8.4 Benefits of Holding Inventory
Primarily, inventory is held for transaction purposes. Today's inventory is tomorrow's consumption. Anenterprise cannot ensure uninterrupted production unless it maintains adequate inventory of raw materials.By holding inventories the firm is able to separate the processes of purchasing, producing and selling. Bydoing the separation of these functions, the firm realizes a number of specific benefits:-
1. Avoid Losses of Sale:- Inadequate inventory may disturb the production function and resultingthe firm may not be in a position to deliver the goods within the scheduled time to its customers andit may lose customer forever. The ability of the firm to give quick service and to provide promptdelivery is closely tied to the proper management of inventory.
2. Gaining Quantity Discounts:- If a firm is willing to maintain large inventory in selected productlines, it may be able to make bulk purchases of goods at heavy discount. Suppliers frequently offera greatly reduced price if the firm orders double or triple of its normal order. By paying less for itsgoods, the firm can increase profits, as long as the costs of maintaining the inventories are less thanthe amount of the discount.
3. Continuity in Production:- Inadequate inventory may cause production interruption andinefficiencies . It is very difficult to procure raw material whenever it is needed. If the firm hasscheduled a long run and begins production, only due to shortage of a vital raw material, the productionmay be halted at considerable cost to the firm. So it is necessary to maintain an adequate level ofinventory to continue the production process without any interruption.
4. Low Ordering Cost:- Every time a firm places an order it incurs certain costs. The variable costassociated with individual orders can be reduced if the firm places a few large rather than numeroussmall orders.
5. To Meet Contingencies:- Inventory is also held as a precaution or as a contingency for increasein lead time or consumption rate. This increase may be due to suppliers strike, labour strike,transporters strike, short supplies or bulk orders etc.
6. Optimum Utilization of Resources:- In a manufacturing concern production planning can bedone with an object to have optimum utilization of resources namely men, machines and materials.This objective can be achieved only if we hold sufficient inventory.
8.5 Factors Affecting Level of Inventory
As stated above, a firm should maintain its inventory at reasonable level. There are different factors, whichdetermine the level of inventory, the important among them are as follows.
107
1. Nature of the Product:- The nature of the product greatly affect the quantity of inventory, like incase of perishable and fashion goods. It is not feasible to store large quantity. If the firm deals insuch type of products for which raw material is available only in a particular season, then theorganisation has to invest a huge fund in the season.
2. Nature of Business:- If the business deals with luxury and consumer products, then it may maintainlower level of inventory. But if it deals with industrial goods it has to maintain a higher level ofinventory.
3. Terms of Purchase:- If supplier provides heavy discount and liberal credit facilities on bulk purchase,then firm may maintain high level of inventory. Similarly, if supply conditions are favourable, nodisturbance in supply chain then inventory level can be low, but in adverse condition or uncertainty,firm should main high level of inventory.
4. State of Economy:- In case of booming economy, firm will maintain high level of inventory to grabthe high chances of emerging large orders and vice-versa.
5. Inventory Turnover Rate:- When the turnover rate is high, investment in inventories tends to below and vice-versa.
6. Value of the Product:- In case of high value product, firm cannot afford to have large inventory. Incase of low value products, firm can keep large quantities in stock.
7. Attitude of Management:- Conservative management does not bother much in forecasting, demandand consider it safer to carry large stocks, while energetic or dynamic manager decides this by usingadvanced techniques of forecasting.
8. Other Factors:- Many other factors like market structure, fluctuations in price level, availability offunds, government policies, period of operating cycle etc. also affect the level of inventories.
8.6 Risk and Costs Associated With Holding Inventory
When a firm holds goods for future sale, it exposes itself to a number of risks and costs. Inventoriesconstitute a large percentage of the total cost. Inventory management is one of balancing tactics of variouscosts so that the total cost can be minimized. These costs are as follows;
1. Material Cost:- These are the cost of purchasing the goods plus transportation and handlingcharges. This may be calculated by adding the purchase price, the delivery charges and the sales taxcharged by the supplier (if any).
2. Cost of Ordering:- It is the cost of placing an order and securing the supplies. The ordering costis of variable nature and increases in proportion to the number of orders placed but has negativerelation with level of inventory. It includes the following;
Preparation of purchase order. Documentation processing costs. Costs of receiving goods(Inspection and handling). Quality analysis expenses. Transport costs. Addition costs of frequent or small quantity order, rejecting faulty goods. Follow up costs.
108
Where goods are manufactured internally, the set up and tooling costs associated with each productionrun, which is also known as 'set up cost'.
3. Cost of Holding or Carrying Inventory:- These are the expenses of storing goods. Once thegoods have been accepted, they become part of the firm's inventories. It comes around 30% of thetotal inventory cost in most of the industrial undertakings. Cost of carrying stocks includes thefollowing:
Storage costs (rent, lighting, heating, refrigeration, air conditioning etc.) Stores staffing, equipment maintenance and running costs. Material handling costs. Capital cost and opportunity cost. Accounting, audit, stock taking or perpetual inventory costs. Product risk costs (deterioration and obsolescence) Insurance and security costs. Pilferage, damage and theft cost.
4. Under Stocking Costs:- It is the penalty incurred to the concern on account of the inability to meetthe demand in time. It includes the following:
Loss of goodwill. Loss of profit due to reduction in sales. Machine and man hours lost due to unavailability of materials. Loss of future sales because customers go elsewhere. Compensation payable on account of non- fulfilment of orders. Extra costs associated with urgent purchases.
5. Over Stocking Costs:- In situations where disproportionate amount of funds are invested ininventories, excessive borrowing or financing would be required. It increases interest expenses andreduces profits. It also involves increase in associated costs like opportunity, obsolescence, lossdue to decline in prices etc.
The costs of ordering opposes the cost of carrying while the under stocking costs opposes overstockingcosts. If these costs operate in the same direction, there will be no inventory problem. The under stockingand overstocking costs, help an industrial unit to determine the service level that has to be maintained for theinventory. The costs of ordering and the cost of carrying enable us to optimize on the number of orders andthe quantity of inventory to be ordered.
8.7 Techniques of Inventory Management
Designing a sound inventory management system is a large pre-requisite for balancing operations. Reducinginventories without impairing operating efficiency frees working capital that can be effectively employedelsewhere. Various techniques applied for inventory management are as follows:
1. Reordering systems(a) Two bins system(b) Order cycling system(c) Min max system
2. Physical verification systems
(a) Continuous stock taking
109
(b) Periodic stock taking
3. Accounting systems(a) Perpetual inventory system(b) Establishment of system of budgets
4. Inventories control ratios(a) Input output ratio(b) Inventory turnover ratio
5. Setting of various stock levels
6. Economic order quantity
7. Selective inventory control techniques
1. Reordering Systems
(a) Two Bin System: Bin means the drawer, almirah or other place of keeping the goods. Undertwo bin system, each item of material is stored in two bins and material is continuously issued fromone bin until the stock of materials is emptied in that bin. Then material from the second bin is startedusing and action will be taken to replenish the materials in the first bin. The material in the second binwill be sufficient enough until the fresh delivery is received. The major advantage of this system isthat stock can be kept at a lower level because of the ability to re-order whenever stock fall to alow level, rather than waiting for the next re-order date.
(b) Order Cycling System: In case of this system the review of materials in hand is undertakenperiodically. If the review discloses that stock of a particular material will last before the next reviewdate keeping in view of its consumption rate, an order for replenishment of that material is madeimmediately. The review period differs from material to material. Critical items of stock have ashorter review period; on the other hand less critical stock items will have a larger interval. Thistechnique is also called as periodic order system.
(c) Min Max System: According to this plan, for every material two levels are fixed (i) minimumlevel and (ii) the maximum level. The minimum level functions as the re-order point. As soon as thestock of material comes down to minimum level a new order is placed for quantity which will bringit to the maximum level. This method is one of the oldest methods of materials control. It is verysimple to operate and easy to understand.
2. Physical Verification Systems
(a) Continuous Stock Taking: Under this system, physical stock verification is made for eachitem of stock on continuous basis. It is physical checking of the stock records with actual stock oncontinuous basis. It is a method of verification of physical stock on a continuous basis instead of atthe end of the accounting period. It is a verification conducted round the year, thus covering eachitem of store twice or thrice. Valuable items are checked more frequently than the stocks with lesservalue.
CIMA defines "Continuous stock taking is the process of counting and valuing selected items atdifferent times on a rotating basis."
The main benefits of this technique are that day to day work is not disturbed, discrepancies, irregularitiesor changes are detected at early stage. Thus it acts as an effective deterrent to malpractices.
110
Continuous stock taking is not, however without disadvantages. It imposes regular strain on thestores staff and unless carried out very carefully, may lead to misplacement of materials.
(b) Periodic Stock Taking:- Under this system the stock levels are reviewed at fixed intervals e.g.,at the end of every month or three months. All the items of stocks in the store are reviewed periodically.
CIMA defines periodic stock taking as "a process where by all stock items are physically counted and thenvalued". The aim of periodic stock taking is to find out the physical quantities of materials of all types arephysically counted at a given date.
3. Accounting Systems:
(a) Perpetual Inventory System: Basically it is a method of accounting for inventory. Under thissystem inventory records are maintained in such a way that it can show the balance of the stockafter each receipt and issue. Bin cards and stores ledger are used under this system.
CIMA defines perpetual inventory system as "the recording as they occur of receipts, issues and theresulting balances of individual items of stock in either quantity or quantity and value".
The main benefit of this system is that every time we have updated record of inventory and thechecking and verification is done at any time without disturbing the normal function.
It is worthwhile to mention the difference between perpetual inventory system and physical verificationsystem. Under the perpetual inventory system only balances are updated on concurrent basis whilein the physical verification system the inventory is physically verified and checked with the actualbalances drawn from the stores ledger.
(b) Establishment of Systems Of Budgets: To control investment in the inventories, it is necessaryto know in advance about the inventories requirement during a specific period usually a year. Underthis technique estimates are prepared regarding the requirement of various material and on the basisof these estimate budget is prepared. Such a budget will discourage the unnecessary investment ininventories.
4. Inventory Control Ratios: Inventory control ratios also play a vital role in controlling the inventory.The ratios work as a comparison tool. The various ratios are as given below:(a) Input Output Ratio:- This ratio indicates the relation between the quantity of material used inthe production and the quantity of final output. This acts as a performance indicator of a particularproduction centre.
Input Units Input output ratio = x 100
Output Units
(b) Inventory Turnover Ratio: This ratio indicates the movement of average stock holding ofeach item of material in relation to its consumption during the accounting period
Cost of materials consumed Inventory Turnover ratio =
Costs of average stock held during the period
Days during the period Inventory Turnover ratio (in days) =
Inventory turnover ratio
111
Stock turnover figures may reveal the following types of stocks:
I. Fast Moving Stock: These are materials which are in great demand. An attempt should bemade to keep these materials in stock at all the times.
II. Slow Moving Stock: These are materials which have a low turnover ratio. Thus inventory ofsuch materials should be maintained at very low level.
III. Dormant Stock: Materials which have no demand are classified as dormant stocks. Thepurchase officer, the store-keeper, the production controller and cost accountant should sit togetherto decide whether to retain these materials because of good chance of future demand or to decidewhether demand or to cut losses by scrapping the materials while they may have some marketvalue.
IV. Obsolete Stock: These are materials which are no longer in demand because a better substitutehas been found. These materials should either be scrapped or discarded.
Other ratio like inventory as a percentage of current assets, total assets are also useful.
5. Setting of Various Stock Levels: Various stock levels are fixed for effective management ofinventories. These levels serve as indices for initiating action on time so that the quantity of each itemof inventory is controlled.
" Re-Order Level:- Re-order level is the level of stock availability when a new order should beraised. The stores department will initiate the purchase of material when the stock of material reaches at thispoint. This level is fixed between the minimum and maximum stock levels. The re-order level can be determinedby applying the following formula:
Re-Order level= (Maximum consumption rate x Maximum re-order period)
Or
Re-order level= (Lead time x Usage rate per day) + Safety stock
While deciding this level (i) the rate of consumption of the material, and (ii) the time required in receiving thesupply are kept in mind. Re- order level is the determined so much above the minimum stock level that bythe time new stock is received, if the material is consumed at the normal rate, actual stock in the store maynot go below the minimum stock level.
Minimum Stock Level: Minimum stock level is the lower limit below which the stock of any stock itemshould not normally be allowed to fall. This level is also called safety stock or buffer stock level. The mainobject of establishing this level is to protect against stock- out of a particular stock item. The following twopoints are kept in view while determining the minimum stock level:
(a) Time Required for Receiving Fresh Stock: After order for purchase of some item is placedit takes some time in receiving the goods. If this time is more, the minimum stock level should bekept more; and if the time taken is less, minimum stock level will also be kept low.
(b) Rate of Consumption of the Material: If a material is consumed in large quantity per day, itsminimum stock level has to be kept higher. If the consumption per day is in small quantity, itsminimum stock level is kept low.
Minimum stock level is computed by using following formula:
112
Minimum stock level = Re-order level - (Normal consumption rate x Normal re-order period)
Or
Minimum stock level = Usage rate per day x Days of safety
Maximum Stock Level:- Maximum stock level represents the upper limit beyond which the quantityof any item is not normally allowed to rise to ensure that unnecessary working capital is not blockedin stock items. The maximum level of stock is fixed after due consideration of the storage costs ofholding excessive stock, cost of insurance, cost of obsolescence, risk of deterioration, cost ofcapital, time required in receiving fresh stock and average rate of consumption. It represents thetotal of safety stock level and economic order quantity. It is computed by the following formula:
Maximum stock level = (Re-order level + Re-order quantity) - (Minimum consumption rate xMinimum re-order period)
Or
Maximum stock level = Economic order quantity + Safety stock
Average Stock Level:- Average stock level is obtained by adding the minimum and maximumstock levels and diving the sum by two.
Average stock level = (Minimum stock level + Maximum stock level)/2
Or
Average stock level = Minimum stock level +1/2 Re-order quantity
Danger Level:- Danger level of stock is fixed below the minimum stock level and if stock reachesbelow this level, urgent action for replenishment of stock should be taken to prevent stock outposition.
Danger Stock level= Minimum rate of consumption x Minimum re-order period.
Illustration 1: In a factory components A and B are used weekly as follows:Normal Usage 50 unitsMaximum Usage 75 unitsMinimum Usage 25 unitsRe-order Quantity A = 300 units
B = 500 unitsRe- order Period A = 4 to 6 weeks
B = 2 to 4 weeks
Calculate for each component:(i) Re-order Level(ii) Maximum Stock Level(iii) Minimum Stock Level
Solution: Calculation of various stock levels(1) Re- Order Level = ( Max. Usage x Max. re-order period)Component A = (6 x 75) = 450 unitsComponent B = (4 x 75) = 300 units
113
(2) Maximum Stock Level = (Re-order level + Re-order quantity) - (Minimumconsumption rate x Minimum re-order period)
Component A = (450+300) - (25 x 4)= 650 unitsComponent B = (300+500) - (25 x 2) =750 units
(3) Minimum Stock Level = Re-order level - ( Normal Usage x Normal re-order period)Component A = 450 - (50 x 5) = 200 unitsComponent B = 300 - (50 x 3) = 150 units
6. Economic Order Quantity:- The economic order quantity refers to the order size that will result isthe lowest total of order and carrying costs for an item of inventory. If a firm places unnecessaryorders, it will incur unneeded ordering cost. If it places too few orders, it must maintain large stocksof goods and will have excessive carrying cost. So it is clear that there is negative co-relationbetween ordering cost and carrying cost. By calculating an economic order quantity, the firm identifiesthe number of units to order that results in the lowest total of these two costs.
Assumption of economic order quantity:
The rate of demand is known and sales occur at a constant rate. Lead time is constant and known. Stock holding costs not changes with time factor and are known. There is no price discount. Lead time is constant and known. Ordering costs are in proportion to number of orders. The replenishment is made instantaneously.
Economic order quantity can be determined by(i) Algebraic method(ii) Graphic method
(1) Algebraic Method:- Economic order quantity can be computed by using the following formula:
EOQ = √ 2AB/ CS
Here, EOQ = Economic order quantityA= Annual consumptionB = Buying or ordering cost per orderC = Cost per unitS = Storage or inventory carrying cost
Illustration 2: The annual usage of a refrigerator manufacturing company is 1,60,000 units of a certaincomponent. The order placing cost is Rs. 100 per order and the cost of carrying one unit for a year is 10%of the cost per unit which is Rs. 80. Calculate the economic order quantity.
Solution:
EOQ = √ 2AB/ CS
= √2 x 1,60,000 x 100 /10% of Rs. 80
= 2,000 units
114
Illustration 3: From the following information find out economic order quantity-
1. Annual usage = 3,200 units2. Price per unit : Rs. 303. Cost of placing an order : Rs. 1004. Cost of working capital : 10 % per annum5. Cost of rent, insurance, tax etc. per unit per annum: Re. 1
Solution:
EOQ = √2AB/CS
= √2 x 3,200 x 100 /4
= 400 units
Note:- Inventory carrying cost = Cost of rent, insurance etc.+ Interest= 1+30*10%= 1+3 = Rs. 4 per unit
(2) Graphic Method: The EOQ can also be calculated by graphic method. While using this methodvarious costs related to inventory like stock holding cost, ordering cost and total cost are plotted on Y axis,while order size is plotted on X axis. The point at which total cost is minimum is EOQ. Total cost is minimumat that point where the line of ordering cost intersects the line of carrying cost. The graphical presentation ofthe behaviour of ordering cost and carrying cost can be illustrated as follows:
EOQ with Quantity Discount:- A particularly unrealistic assumption with the basic EOQ calculation is thatthe price per item remains constant. Usually some form of discount can be obtained by ordering largequantities. When a quantity discount is offered, three things can happen:-
(i) Reduction in the yearly acquisition cost of the item.
(ii) Increase in the cost of holding inventory as now a larger average inventory will have to be carried.
(iii) Decrease in ordering cost as now less orders will have to be initiated.
If the increase in carrying cost is less than, the savings due to ordering cost and quantity discount offered, theorder of large quantity ( more than EOQ) should be given.
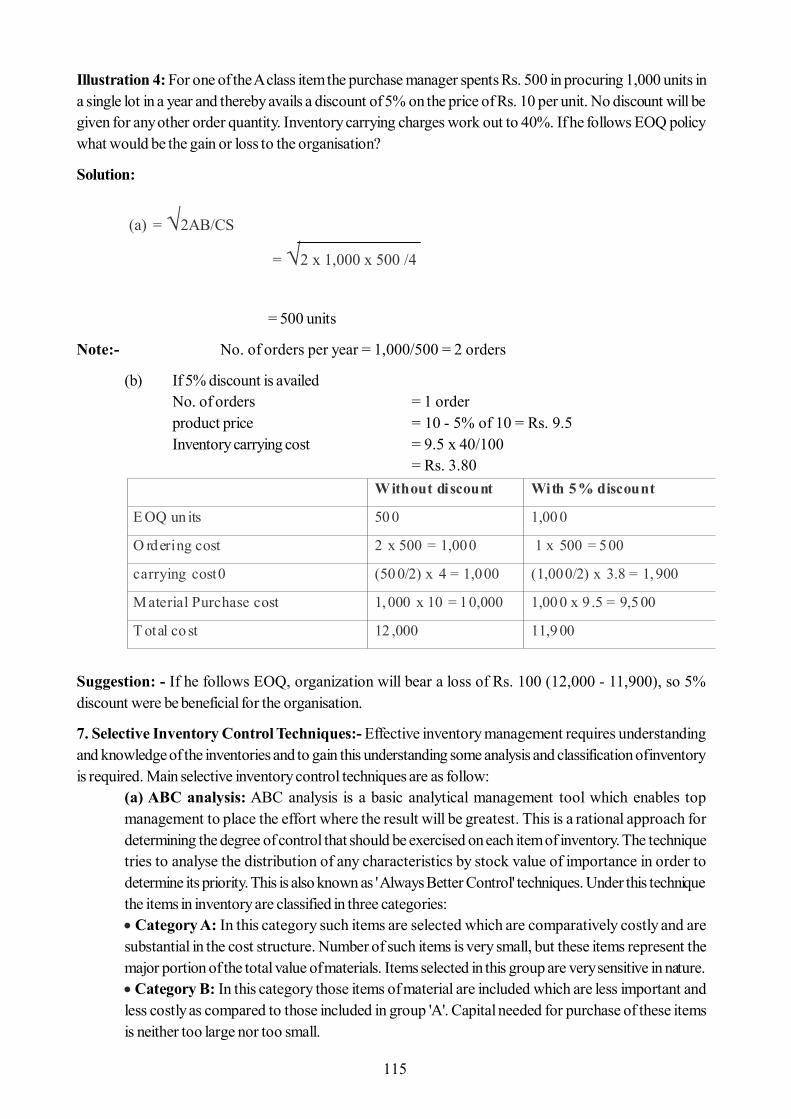
115
Illustration 4: For one of the A class item the purchase manager spents Rs. 500 in procuring 1,000 units ina single lot in a year and thereby avails a discount of 5% on the price of Rs. 10 per unit. No discount will begiven for any other order quantity. Inventory carrying charges work out to 40%. If he follows EOQ policywhat would be the gain or loss to the organisation?
Solution:
(a) = √2AB/CS
= √2 x 1,000 x 500 /4
= 500 units
Note:- No. of orders per year = 1,000/500 = 2 orders
(b) If 5% discount is availedNo. of orders = 1 orderproduct price = 10 - 5% of 10 = Rs. 9.5Inventory carrying cost = 9.5 x 40/100
= Rs. 3.80
Suggestion: - If he follows EOQ, organization will bear a loss of Rs. 100 (12,000 - 11,900), so 5%discount were be beneficial for the organisation.
7. Selective Inventory Control Techniques:- Effective inventory management requires understandingand knowledge of the inventories and to gain this understanding some analysis and classification of inventoryis required. Main selective inventory control techniques are as follow:
(a) ABC analysis: ABC analysis is a basic analytical management tool which enables topmanagement to place the effort where the result will be greatest. This is a rational approach fordetermining the degree of control that should be exercised on each item of inventory. The techniquetries to analyse the distribution of any characteristics by stock value of importance in order todetermine its priority. This is also known as ' Always Better Control' techniques. Under this techniquethe items in inventory are classified in three categories: Category A: In this category such items are selected which are comparatively costly and aresubstantial in the cost structure. Number of such items is very small, but these items represent themajor portion of the total value of materials. Items selected in this group are very sensitive in nature. Category B: In this category those items of material are included which are less important andless costly as compared to those included in group 'A'. Capital needed for purchase of these itemsis neither too large nor too small.
Without discount With 5 % discount
E OQ un its 50 0 1,00 0
O rdering cost 2 x 500 = 1,000 1 x 500 = 500
carrying cost0 (50 0/2) x 4 = 1,000 (1,000/2) x 3.8 = 1, 900
Material Purchase cost 1, 000 x 10 = 10,000 1,00 0 x 9 .5 = 9,5 00
T otal co st 12 ,000 11,9 00
116
Category C: Items of the material in the store which have very low cost are included in thiscategory. Number of such items is large, but these represent a very small fraction of the total cost ofmaterial. As the purchase of these items requires only a small capital, such items are purchased inlarge quantity at a time.
Obviously, 'A' class items should be subject to strict management control under either continuous review orperiodic review with short review cycles. Constant attention is paid by purchases and stores managementi.e. no or very low safety stock is maintained, centralised and frequent purchase system is followed, rigorousvalue analysis is done, efforts for minimisation of wastage are done etc. 'C' class items require little attentionand can be relegated down the line for periodic review. Control over 'B' class items should be somewherein between.
The graphic presentation of ABC classification is as follows;
Note: The number ( percentage) are just indicative and actual break up can vary from situation to situation.In inventory management, this technique has been applied in those areas which need selective control, suchas criticality of items, obsolete stocks, purchasing orders, receipts of materials, inspection, store keepingand verification of bills. This approach helps the material manager to exercise selective control and focus hisattention only on a few items when he is confronted with lakhs of stores items. Many organisations thoseadopted this technique have claimed that ABC analysis has helped in reducing the clerical costs and resultedin better planning and improved inventory turnover.
Limitations: Though, ABC analysis is a powerful scientific and systematic approach in the direction of costreduction and saving time as it helps to control items with a selective approach. Some items though negligiblein monetary value, may be vital for smooth functioning of plant and constant attention is needed. For examplediesel, oil is categorised in class 'C' items in most of the manufacturing firms, will become the most high valueitem during power crises. So, the results of ABC analysis have to be periodically reviewed and updated.
Classification of Inventory Category % of
items % of value
Contro l Requ ired Superv isio n
A 10% to 15%
50% to 70%
Strict con trol system Top manag ement
B 25% to30%
25% to 30%
Continuou s watch o ver inventory
Midd le management
C 60% to 65%
10% to 15%
General co ntrol Lower management
117
(b) VED Classification: This type of classification divides items into three categories in the decendingorder of their criticality. Here 'V' stands for Vital items and their stock analysis requires moreattention, because out of stock situation will result in stoppage of production for example, needlefor the machine. Thus, 'V' items must be stored adequately to ensure smooth operation of the plant.'E' means Essential items. Such items are considered essential for efficient running but without theseitems the system would not fail but production capacity will be affected. Example, lubricant oil formachine. Care must be taken to see that they are always in stock. 'D' stands for Desirable itemswhich do not affect the production immediately but availability of such items will lead to moreefficiency and less fatigue.
This technique is mainly used in the storage of spare parts and more suitable method for automobileindustries.
(c) FSND Classification: FSND classification divides the items into four categories according totheir material turnover ratio:
(i) F = Fast moving items. Stocks of such items are consumed in a short span of time.(ii) N = Normal moving items. Normally such items are exhausted over a period of a year or so.(iii) S = Slow moving items. Though moves slowly but it is still expected to be used up.(iv) D = Dead items. The material which is dormant and obsolete covered under this category.
Stock of fast moving items must be observed continuously and replenishment orders be placed intime to avoid stock out situations. The reorder level and quantities of slow moving items should bebased on estimate of future demand to minimize the risks of surplus stock. For dead items, effortsmust be made to find alternative uses. Otherwise, it must be disposed of.
(d) Just In Time (JIT) Approach: Under this technique, the material is purchased only when it isrequired. The basic principle of this philosophy is to produce at each manufacturing stage, only thenecessary products at the necessary time in the necessary quantity to hold the successive inmanufacturing stages together. Thus efforts are made to maintain the stock at zero level. This techniqueis also called as 'Zero Inventory Production System' or 'Material As Needed System'. The purposebehind the technique is to eliminate waste not only the conventional form of waste such as scrap,rework and equipment down time but also excess lead time over production and poor spaceutilization.
(e) Value Analysis: This technique was developed by Lawrence D. Miles, to obtain optimum benefitfrom materials. Value analysis investigation of material is usually carried out every year in order to-(i) Minimize consumption.(ii) Maximize the utilization.(iii) Substitute indigenous materials for imported ones without sacrificing quality or
performance.(iv) Substitute it with cheaper material. Value analysis aims at assessing the value of an items
and then enhancing it systematically.(f) Other Techniques-
(i) HML Classification: To control purchases the material is classified into High, Mediumand Low value items depending on the unit price of material.
(ii) SDE Analysis: Materials can be classified according to their availability at the time ofprocurement in Scarce, Difficult and Easy to obtain category. Lead time analysis and specialpurchasing strategies can be used for scarcely available items.
118
(iii) Statistical Techniques: Operation Research (OR), Linear Programming (LP),Programme Evaluation Review Technique (PERT) can be used by the manager for thepurpose of planning and control of inventory.
(iv) Application of Computers: The scope of application of computers in inventorymanagement is really immense. With the basic issues and receipts, documents billing, inventoryplanning, material budgeting, inventory valuation, fixation of inventory levels can be efficientlycomputerized. Moreover, if the manual and mechanized system has been properly designed,the implementation of a computerized system will not pose any problem.
8.8 Summary
Inventory represents the major portion of the total current assets in most of the concerns. Every businessconcern maintains some level of inventory, therefore it is important to manage and control the inventory forsmooth functioning of business. The basic problem of inventory management is to strike a balance betweenthe operating efficiency and the cost of investment and other costs associated with large inventories.
The greater the efficiency with which the firm manages its inventory, the lower the required investment ininventory. The financial officer should pay attention to the following aspects of inventory management (a)Action taken against imbalances of raw material and work in progress inventory that may limit the utility ofstocks of that item which is in shortest supply. (b) Production schedules as far as possible, should be firmlyadhered to for reducing inventory of raw materials and in progress goods. Any change should get earlynotification. (c) Continuous efforts should be made to shorten the production cycle. (d) There should bereasonable procurement lead time assumptions and safety stock levels. (e) There should be an efficientsystem to dispose of goods that are unusable or obsolete for production. (f) Special pricing policy may berequired to move extremely slow moving finished items. Various techniques like two bin system, setting ofreorder point, fixation of stock levels, determination of economic order quantity, selective inventorymanagement techniques (ABC, VED, SDE, FSND etc.) can be used to maintain optimum level and controlof inventory. Thus inventory management helps to reduce inventory without any adverse effect on productionand sale.
8.9 Key Words
Inventory Management: The function of ensuring that sufficient goods are retained for smoothfunctioning of the business operations.
Ordering Cost: The cost which is associated with the purchasing or ordering of material.
Carrying Cost: The cost incurred for handling/ holding the material in stores.
Lead Time: This is the time gap between placing of an order and the time of actual supply.
Minimum Stock Level: The lowest figure of inventory balance, which must be maintained, so thatthere is no stoppage of production.
Maximum Stock Level: That quantity of material above which the stock of any item should notgenerally be allowed to go.
Re-order Level: It is the level at which fresh order should be placed for replenishment of stock.
ABC Analysis: The system which exercises discriminating control over different items of storesclassified on the basis of the investment involved.
119
Economic Order Quantity: The size of the order for the total of both ordering and carrying costis minimum is known as economic order quantity.
Two Bin System: If items in one bin exhausts new order is placed and till the mean time quantityfrom the other bin is used.
8.10 Self Assessment Questions
1. What is inventory management?
2. The major objective of inventory management is 'to minimise cash outlays for inventories'. Explainhow this can be achieved.
3. Write short notes on :-(a) ABC analysis(b) Just in time approach(c) Double bin system(d) Perpetual inventory system
4. What do you mean by 'Economic order quantity'? How is it determined?
5. How would you determine the optiomal order size when quantity discounts are available? Illustrateyour answer with a suitable example?
6. Discuss the selective inventory management techniques.
7. Explain the formulas of determination of minimum and maximum stock levels. What factors aretaken into account in fixing these limits?
8. Explain the concept of 'ABC analysis' as a technique of inventory control.
9. The average annual consumption of a material is 18,250 units at a price of Rs. 36.50 per units. Thecost of placing an order is Rs. 50 and the storage cost is 20% on average inventory. How muchquantity is to be purchased at a time.
Ans. 500 units
10. A company manufactures a special product which requires a component 'A'. The following detail isavailable-(i) Annual demand= 8000 units(ii) Cost per unit = Rs. 400(iii) Carrying cost = 20%(iv) Cost of placing an order = Rs. 200 per order.
The company has been offered a quantity discount of 4% on the purchase of 'A' provided the ordersize is 4000 components at a time.
You are required to(a) Calculate the economic order quantity.(b) Advise whether the company should avail quantity discount.Ans . ( EOQ = 200 units; Not to accept the quantity discount)
11. The following information is supplied to you in respect of an item of stores.Minimum usage = 50 units
120
Maximum usage = 150 unitsReorder quantity = 600 unitsReorder period = 4 to 6 weeksYou are required to ascertain.
(i) Reorder level(ii) Minimum stock level(iii) Maximum stock level(iv) Average stock level
Ans. (Reorder level = 900 units; Minimum stock level = 400 units; Maximum stock level = 1300units; Average stock Level = 850 units)
8.11 Reference Books
- Chandra, Prasanna - Financial Management : Theory and Practice, Tata Mcgraw Hills, New Delhi.
- Mehta, D. R. - Working Capital Management, Printice Hall, New Delhi.
- Agarwal, M. R. - Management Accounting; National Publishing House, Jaipur.
- Hampton, John J. - Financial Decision Making Concepts, Problems and Cases, Printice Hall, NewDelhi.
- Kuchhal, S. C. - Financial Management - An analytical and conceptual approach. Chaitanya,Allahabad.
- Khan, Jain - Principals of Financial Management, Tata Mcgraw Hills, New Delhi
- Pandey, I. M. - Financial Management, Vikas, New Delhi.
- Chandra, Bose D. - Fundamentals of Financial Management, PHI Learning Pvt. Ltd., New Delhi.
121
Unit - 9 : Management of Cash and Marketable Securities
Structure of Unit:
9.0 Objectives9.1 Introduction9.2 Meaning of Cash9.3 Motives of Holding Cash9.4 Meaning and Objectives of Cash Management9.5 Factors Affecting the Cash Requirement9.6 Functions of Cash Management
9.6.1 Cash Planning and Control9.6.2 Management of Cash inflows and Outflows9.6.3 Determination of Optimum Level of Cash9.6.4 Optimum investment of Surplus Cash
9.7 Cash Management Models9.7.1 Baumol’s Model9.7.2 Miller-Orr Model
9.8 Investment in Marketable Securities9.9 Summary9.10 Key Words9.11 Self Assessment Questions9.12 Reference Books
9.0 Objectives
The main objectives to study this unit are:
To explain the reasons of holding cash. To describe the meaning and objectives of cash management. To explain the factors which affect the cash requirement. To discuss the techniques of cash planning and control. To focus on the management of cash collection and disbursement. To highlight the need for investing surplus cash in marketable securities. To understand cash management models to determine the optimum cash balance.
9.1 Introduction
Since cash is the medium of exchange, it is the most important component of working capital. Cash is thebasic input required to keep the organisation running on a continuous basis and the ultimate output expectedto be realised by selling goods and services. It can be compared to the blood in the human body which giveslife and strength to the body. Similarly, Cash keeps the organisation as a vital entity. The firm should keepsufficient cash, neither more nor less. Cash shortage will disrupt the firm’s manufacturing operations whileexcessive cash remaining idle will increase the cost without contributing anything towards the profitability ofthe organisation and since cash is the most sensitive and fraud prone asset, there will be high chances ofembezzlement. Therefore, for smooth functioning and for higher profitability effective cash management is ofparamount importance. Apart from the fact that it is the most liquid current asset, it is the common denominatorto which all current assets get converted eventually. This underlines the significance of cash management.
122
9.2 Meaning of Cash
Cash in the money which a firm can disburse immediately without any restriction. In cash management, theterm cash is used in both narrow and broad senses. In narrow sense, it includes coins, currency, cheques,drafts held by the firm and demand deposits in its bank accounts.
In broader sense, it also covers near cash assets, i.e. marketable securities and time deposits in banks andother financial institution. The word ‘cash management’ is, generally used for cash and near cash assets i.e.for both type of assets.
Cash has the following characteristics : -
1. Cash itself does not produce goods or services. Interest can be earned by depositing or lending itbut it does not earn any profit like other assets. So it is called an unproductive asset. Shortage ofcash is likely to harm the operations of a firm.
2. Every business needs to show a minimum cash to carry its business activities. If busines does notshow sufficient cash balance, it will not be able to pay its creditors on time. This may be calledcritical level of cash.
3. Cash is a medium of exchange and plays an important role as most of the transactions involve flowof cash funds.
4. Deploying extra funds always involves opportunity cost. Therefore, excess cash should be investedin a profitable way to yield something in the form of interest and dividend rather than remaining idle.
9.3 Motives of Holding Cash
Although cash does not earn any substantial return for the business on its own, a firm holds cash by virtue ofthe following motives : -
a) Transaction Motives:Transaction motive is the most important reason for which cash balance ismaintained by a firm. This motive refers to the holding of cash for meeting the day-to-day transactionsof business. Firms hold cash to make the necessary payments for the goods and services theyrequire i.e. purchase of raw material, hiring of labour, repair and maintenance of fixed assets etc.Similarly, there is a regular inflow of cash in the form of interest, dividend, cash sales, collection fromdebtors etc.
The need to hold cash arises because cash receipts and cash payments do not coincide perfectly.Sometimes cash receipts (inflows) exceed cash payments (outflows) or vice versa. So, the firmshould maintain adequate cash balance to meet its obligations when outflows exceed inflows,otherwise firm will loose it’s reputation in the market. When cash is retained by a firm, it is said tohave been held for transaction motive. Thus, transaction motive refers to holding of cash to meetanticipated obligations whose timings do not perfectly synchronise with cash receipts.
b) Precautionary Motives: The second motive of holding cash is to make the business to cope withunforeseen contingencies. It provides a cushion or buffer to withstand some unexpected emergency.“The cash balance held in reserve for random and unforeseen fluctuations in cash flow are called asPrecautionary Motive”.
Unexpected cash needs at short notices may arise as a result of:a) uncontrollable situations like floods, droughts, fire, accidents, strike, lockouts etc.,
123
b) presentation of bill for settlement earlier than expected,c) slow recovery of tradebills,d) sheer rise in material and labour cost;e) cancellation of some orders for goods on account of poor quality andf) some penalty is imposed under some court orders.
The quantum of precautionary cash will depend upon the predictibility of cash inflows. Michealfirth say’s, “the more uncertain the cash flows are, the greater the precautionary balances that haveto kept.” If a firm can borrow at short notice to pay the unforeseen obligations, it will need tomaintain a relatively small balance and vice-versa. Some times, a portion of such cash balance mayalso be held in marketable securities to earn some return.
c) Speculative Motive: Speculative motive refers to the holding of cash to take advantage ofunexpected opportunities which may emerge suddenly. Sometimes firms hold cash balances abovethe precautionary level of cash balance to ; (a) take advantage of speculative investment opportunities(b) exploit discounts for prompt payment, (c) improve credit rating, (d) make purchases at reducedprice by paying immediate cash (e) delay the purchase in anticipation of decline in price.
while the precautionary motive is defensive in nature, the speculative motive represents positive andaggressive approach.
“The speculative motive is the desire of the firm to take advantage of opportunities which presentthemselves at unexpected moments or which are typically outside the normal course of business”.In addition to above some firms have cash balance for compensation motive discussed as below.
d) Compensation Motive: Another motive to hold cash balance is to compensate banks for providingcertain free services like clearance of cheques, transfer of funds etc. and loans. Usually clients arerequired to maintain a minimum balance in there accounts, which cannot be utilized by the firm fortransaction motives. The banks themselves can use the amount to earn a return. Such balances arecompensating balances.
e) Statutory Motive: This motive is applicable particularly in case of banking industry, where as perthe provisions of sec. 42 (1) of Reserve Bank of India Act 1935 and as per the provisions of sec.18 of Banking Regulation Act 1949, all the commercial banks are required to maintain some minimumamount of cash with themselves, with their branches and in a current account with RBI. If a bankfails to meet the minimum cash reserve requirements, it will be levied with civil and criminal penalties.
9.4 Meaning and Objectives of Cash Management
Cash flows are inseparable parts of the business operations of firms. While inadequacy of cash disturbs thefunctional schedule and payment which can cause the firms failure, excess of cash means blockage of funds,which lowers the profitability of firm. Cash Management is a technique to plan and control of cash in such away that sufficient cash is always available to meet the obligations of the firms and excess balances, if any,may invested to enhance profitability.
A cash management scheme therefore, is a delicate balance between the twin objectives of liquidity andcosts.
Objectives of Cash Management: The main objective of cash management is to trade-off liquidity andprofitability in order to maximise the firms value. The larger the cash balance, the greater the degree of
124
liquidity, the lesser will be profit earning capacity of the firm. Similarly, the lesser the cash balance and thedegree of liquidity, the more will be the profit earning capacity. So every firm needs optimum level of cash.The basic objectives of cash management are : -
i to meet the cash disbursement needs as per the payment schedule,ii) to minimize the cash balance.iii) effective control of cash.
These are conflicting and mutual contradictory and the task of cash management is to reconcile them.
i) Meeting the Cash disbursement Needs: In the normal course of business firms need cash toinvest in inventory, pay to short term lenders and to make payment for operating expenses. If thesepayment are not meet on time, the business operations may be disturbed.
Thus it is needless to say that all the business activities would remain stand still if proper paymentschedule is not maintained. The primary objectives of cash management is to ensure the meeting ofcash outflows or disbursements as and when required.
ii) Minimising Funds Locked Up as Cash Balances: Another objectives of cash management is tominimise the amount locked up as cash balance because whatever cash balance is maintained, thefirm looses interest income on that balance. Therefore, investment in idle cash balance must bereduced to minimum.
iii) Effective Control of Cash: Usually, the financial manager is confronted with two conflicting views.On one hand, although the higher cash balance ensures proper payment which will prevent the firmfrom bankruptcy or insolvency, will make good relations with suppliers, firms can bargain for discount,but it also implies that large funds will remain idle as cash is a non earning asset and the firm will haveto forgo profits. On the other hand, if a firm keeps its cash balance at low level, it cannot meet itspayment schedule. The aim of cash management should be to try to have an optimum level of cashby taking into account the above facts.
9.5 Factors Affecting the Cash Requirement
A firm must have so much of cash balance, that daily requirements and unexpected demands can be metout. The factors affecting cash requirements and their effect on cash management are as follows:
1. Credit Position of the Firm: Firms with good and sound credit standing and goodwill need not tomaintain separate cash for unforeseen situations, as cash is available to such firms whenever needed.They can get liberal credit facilities to purchase necessary material. On the contrary, firms with badcredit position shall have to maintain high level of cash balance.
2. Relation With Banks: If firm has good relation with banks, it can get the facility of cash credit andbank overdraft resulting less requirement of maintaining cash balance.
3. Terms of Purchase and Sale: Terms of purchase and sale also affect the level of cash balance. Ifa firm has facilities to buy material on credit terms but sells its products on cash, it can operate itsbusiness affairs with a little cash balance. On the other hand, if the firm makes purchases on cashbasis but sells its products to customers on credit terms, larger cash balance will have to be maintained.
4. Nature of Demand of Goods: If there is a steady demand of product in the market i.e. productsof day to day requirement (necessary items) and the product is sold for cash or for short creditperiod, firm will need low level of cash. On the contrary, firm’s engaged in the production of luxuryitems have to maintain high level of cash.
125
5. Inventory Policy: If high level of inventory is maintained by the firm, large amount is required forthis, while if a firm follows just in time inventory system, it need not to maintain large cash funds.
6. Production Process: Longer the production process, higher the requirement of cash balance but ifproduction process is short, the need of maintaining cash balance will be low.
7. Collection Period of Receivables: If, in a firm, speed of collection of accounts receivable isquick, the cash will be available at all time, bad debts will be lower and, the firm is not required tocarry large cash balance. However, if collection period is large, high balance will have to be maintained.
8. Management Policy: Cash balance held by a firm also depends upon management policies andattitude towards the liquidity preference, risk bearing capacity, sales and purchases policy, quantityof investment and inventory etc. If the owners and managers of the firm want strict plans of cashmanagement, it can work with lower cash balance otherwise high balance will be required.
9. Matching of Cash Inflows and Outflows: The extent of non synchronization between cash inflowand outflow determines the requirement of cash . Higher the degree of variance between cashcollection and disbursement, higher will be the requirement of cash and vice versa.
9.6 Functions of Cash Management
Management of cash is an important function of the finance manager. He should formulate strategies for thefollowing areas : -
9.6.1 Cash planning and Control
Cash planning is a process of predicting cash inflows and cash outflows of the firm so as to determinesurplus or shortage of cash. At times, a firm can have idle cash with it if its cash inflows are more than itsoutflows. Such excess can be anticipated and properly invested if cash planning is resorted to. Similarly,cash poor position can be corrected if the cash needs are planned in advance. Thus, cash planning is atechnique to plan and control the use of cash. This may be done on daily, weekly or monthly basis dependingupon the size of the firm and policies of management. Cash budget is the most significant tool for cashplanning and control.
a) Cash Budget: A firm should hold adequate cash balances but should avoid excessive balances.The firms has therefore to assess its need for cash properly. “A cash budget is a statement showinganticipated cash inflow, outflow and net cash balance for a future period of time”.
Cash budget is an important device to forecast the predictable discrepencies between cash inflowsand outflows over a projected time period. It is a summary statement which shows the estimatedcash inflows and cash outflows over the firms planning horizon. The time period for which cashbudget can be prepared depends upon the following points : -i) Impact of seasonal variations on cash flows;ii) Degree and pattern of fluctuations in cash flows, andiii) Preciseness in prediction of cash flows.
A Cash Budget has the following benefits:
It coordinates the timings of cash needs. It identifies the period(s) when there might either be ashortage of cash or remain an abnormally large balance.
It also helps to pinpoint period(s) when there is likely to be excess cash to take advantage like cashdiscounts on its accounts payable, capital expenditure decision etc.
126
Lastly it helps to plan/arrange adequately needed funds (avoiding excess/shortage of cash) onfavorable terms.
There are three methods to prepare the cash budget:
Receipt and Payment Method.
Adjusted Profit and Loss Account Method, and
Projected Balance Sheet Method.
For short term (monthly, weekly, quarterly) cash budget, receipt and payment method is used whilefor long term cash budget other methods can be used.
Methodology of preparing cash budget is explained in detail in the chapter - ‘Finacial Forecasting’.
With advance planning through cash budget firms get adequate time to take the necessary action forborrowing and lending of cash on the terms which are most advantageous to the firm.
b) Cash Flow Analysis: A simple definition of a cash flow statement is - ‘a statement which disclosesthe causes of changes in cash position between the two periods’.
As per ICWAI, “Cash flow statement is a statement setting out the flow of cash under differentheads of sources and their utilizations to determine the requirements of cash during the given periodand to prepare for its adequate provisions”. Thus along with changes in the cash position the cashflow statement also outlines the reasons for such inflows or outflows of cash which in turn helps toanalyze the functioning of the business. Cash flow analysis is based on historical data while cashbudget is a technique for future estimation.
c) Ratio Analysis: Ratios like cash turnover ratio, cash flow coverage ratio, cash payment ratio arealso important techniques of cash planning and control.
9.6.2 Management of Cash Inflows and Outflows
After knowing the cash position with the help of cash budget, the management should work out the basicstrategies to be employed to manage its cash flows. So that there does not exist a significant deviationbetween projected cash flows and actual cash flows. In the words of Van Horne, “Optimising cash availabilityinvolves accelerating collections as much as possible and delaying payments as long as is realistically possible”.The methods used for accelerating the collections and decelerating disbursements are as follows -
(A) Accelerating Cash Collections: In order to accelerate cash inflows, the collection from customersshould be prompt. The finance manager has to devise action not only to fraudelent diversion of cashbut also to speed up collection of cash.
A firm can conserve cash and reduce its requirements for cash balances if it can speed up its cashcollections by issuing invoices quickly or by reducing the time lag between a customer pays bill andthe cheque is collected and funds become available for the firm’s use i.e. first of all customers shouldbe encouraged to make the payments as early as possible and secondly efforts should be made toquickly process and collect the cheques and drafts deposited by the customers. There are basicallythree tyeps of floats that create the difference : -
(i) Mail Float: The time gap between the postage of cheques / drafts by the debtors and thereceipt of the same in the firm is called mail or postal float.
127
(ii) Processing Float: Time taken in processing the cheque within the firm before they are depositedin the bank due to lethargy of employees is termed as processing float.
(iii) Collection Float: The time difference between the cheque is deposited into the bank and itsactual realisation is called collection float.
Decentralised collection systems known as concentration banking and lock box systems can helpus to speed up collection of cash and in reducing the time involved in these floats considerably.
(a) Concentration Banking: A large firm operating over wide geographical areas can speedup its collection by following a decentralised collection procedure. In concentration bankingthe company establishes a number of strategic collection centres in different regions instead ofa single collection centre at the head office. Payments received by the different collection centresare deposited with their respective local banks which in turn transfer all surplus funds to theconcentration bank of head office. The concentration bank with which the company has itsmajor bank account is generally located at the headquarters. Concentration banking is oneimportant and popular way of reducing the size of the float as it helps in -
i) Reduction of Mailing Time: Under the system of concentration banking, as the collectioncentres themselves collect cheques from the customers and immediately deposit them inlocal bank account, the mailing time is reduced. If collection centres are allowed to sendbills to the customers of their respective areas, the time required for mailing is less than thebills are mailed from the head office.
ii) Reduction of Time Required to Collect Cheques: As the cheques deposited in thelocal bank accounts are usually drawn on banks in that area, the average collection periodalso comes down.
iii) Expediting Collection of Cash: The system of concentration banking also helps inquicker collection of cash as it reduces the size of deposit float.
Thus, in case of business organisations having large number of branches located at differentplaces all over the country, this system helps a lot in the quick collection of money. Under thismethod, the firm will have to bear additional costs for establishing collection centres in differentareas. Therefore, the criterion for adopting this system of concentration banking is that savingor benefits from this should exceed the cost of using this system. Generally, this system may bebeneficial for firms having large business and scattered customers.
(b) Lock - Box System: Lock-box system is another step in expediting collection of cash.Lock-Box is a post office box maintained by a firm’s bank that is used as a receiving point forcustomer remittance. Collection centre and its actual depositing in the local bank account.Under lock-box system, the firm hires a post-office box and instructs its customers to mail theirremittances to the box. The firm’s local bank is given the authority to pick up the remittancesdirectly from the lock box. The bank collects from the box several times a day. It deposits thecheques, clears them locally and credits the cash in the firm’s account. Local banks are givenstanding instructions to transfer funds to the Head Office when they exceed a particular limit.
The local bank sends a deposit slip together with the list of payments and other enclosures tothe firm for proof, record and information after crediting the respective account of the firm.
The selection of the cities for lock-boxes depends upon the geographic coverage of business
128
area; number of customers in a particular area; frequency of receiving remittances from customersand the cost of renting out and using post boxes. Lock box system in a sense, is like concentrationbanking since the collection is decentralised. The only significant difference between the two isthat, under concentration banking system the customers send the cheques to the collectioncentres, while under lock-box system, they send them to post-office box.
In a way, the lock box arrangement is an improvement over the concentration banking systembecause one step in the collection process is eliminated with the use of lock box. This systemsaves (i) processing time within the firm before depositing a cheque in the bank and (ii) thecheques received in the lock box are not delivered by the post office or the firm itself to thebank, rather, the bank itself picks them up saves this mailing time.
The following are the advantages of lock-box system : -
(i) It helps to eliminate the time lag between the receipt of cheques by a firm and theirdeposit into the bank.
(ii) The system reduces the overhead expenses as the firm is free from botheration of receiving,processing, endorsing and depositing remitted cheques.
Although, the use of lock-box system accelerates the collection of receivables, the set up of thissystem involves cost as firms have to pay compensation to the bank for services. Therefore, thelock-box system will prove useful and economical for large firms which receive a large number ofcheques from a wide geographical area.
(c) Minimum Number of Bank Accounts: Sometimes a firm may have more bank accounts andwe know it is the policy of banks to have some specified minimum balance in the account, resultingblocking of some part of the cash in each such account. So, by closing the super flous accounts thefirm can release funds for investment in profitable channels.
(d) Other Methods: Some other methods for managing collection of cash are -
Offering cash discounts so that in their anxiety to avail this facility, the customers would beeager to make payments early.
What a customer has to pay, the period of payment etc. should be notified accurately andin advance i.e. prompt billing.
Personal visit to customers for receiving cheques particularly of large amounts.
Control on inter-bank transfer of cash.
Setting a maximum limit of cash which each bank of the firm will maintain at a time. Theexcess balance should be immediately transferred by wire to the principal bank of the firm.
(B) Slowing Disbursement: The operating cash requirement can be reduced by slow disbursement ofaccounts payables. Slow disbursements represent a source of funds requiring no interest payments.But this should not impair the credit rating or reputation of the firm. There are several techniques todelay payment of accounts payable. Some of important method are as below : -
1. Centralised Disbursement Centre: The firm should follow the centralised system fordisbursements as against decentralised system for collections. Under centralised system, as allpayments are made from a single control account, there will be delay in presentation of cheques for
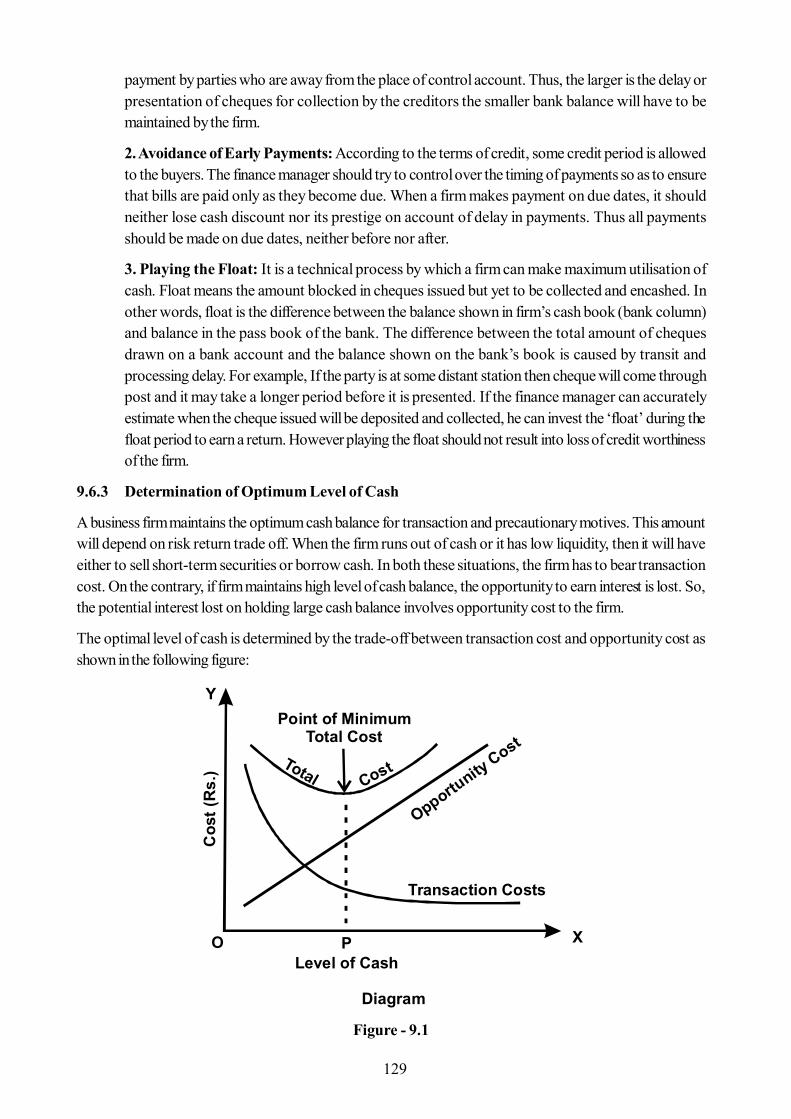
129
payment by parties who are away from the place of control account. Thus, the larger is the delay orpresentation of cheques for collection by the creditors the smaller bank balance will have to bemaintained by the firm.
2. Avoidance of Early Payments: According to the terms of credit, some credit period is allowedto the buyers. The finance manager should try to control over the timing of payments so as to ensurethat bills are paid only as they become due. When a firm makes payment on due dates, it shouldneither lose cash discount nor its prestige on account of delay in payments. Thus all paymentsshould be made on due dates, neither before nor after.
3. Playing the Float: It is a technical process by which a firm can make maximum utilisation ofcash. Float means the amount blocked in cheques issued but yet to be collected and encashed. Inother words, float is the difference between the balance shown in firm’s cash book (bank column)and balance in the pass book of the bank. The difference between the total amount of chequesdrawn on a bank account and the balance shown on the bank’s book is caused by transit andprocessing delay. For example, If the party is at some distant station then cheque will come throughpost and it may take a longer period before it is presented. If the finance manager can accuratelyestimate when the cheque issued will be deposited and collected, he can invest the ‘float’ during thefloat period to earn a return. However playing the float should not result into loss of credit worthinessof the firm.
9.6.3 Determination of Optimum Level of Cash
A business firm maintains the optimum cash balance for transaction and precautionary motives. This amountwill depend on risk return trade off. When the firm runs out of cash or it has low liquidity, then it will haveeither to sell short-term securities or borrow cash. In both these situations, the firm has to bear transactioncost. On the contrary, if firm maintains high level of cash balance, the opportunity to earn interest is lost. So,the potential interest lost on holding large cash balance involves opportunity cost to the firm.
The optimal level of cash is determined by the trade-off between transaction cost and opportunity cost asshown in the following figure:
Figure - 9.1
Y
Cos
t (R
s.)
O P XLevel of Cash
Diagram
Point of MinimumTotal Cost
Total Cost
Opportunity Cost
Transaction Costs
130
It is clear from the above diagram that if the firm maintains large cash balances, its transaction cost willdecline but opportunity cost will increase or vice-versa. At point P the sum of the two costs i.e. total cost isthe minimum. This is the point of optimal cash balance which a firm should seek to achieve.
9.6.4 Optimum investment of surplus cash
Cash kept by the firm in excess of its normal need is called the surplus cash. Due to changing workingcapital needs or unpredictable requirements the finance manager is required to consider the minimum cashbalance that the firm should keep to avoid the cost of running out of funds. This minimum level may betermed as’Safety level of Cash’. Formula’s used for this level are :-
a) During Normal Periods: Safety level of cash = Desired days of cash x Average daily cash outflows.
b) During Peak Periods:Safety level of cash = Desired days of cash at the peak period x Average ofhighest daily cash outflows Firm can breakup its surplus into these categories:
i) Surplus which is made available for meeting unforeseen disbursements should be invested inassets which can be immediately sold without much loss.
ii) Surplus which is made available for some specific payments like dividend, capital expenditureshould be invested in securities whose maturities coincide with the date of payments.
iii) Surplus which is not required for any specific purpose like general reserve, can be invested insecurities with long term maturity and thus firm can earn more return. Having determined both thetemporary and permanent cash surplus and after considering the following factors, the finance managershould decide the channels of investment : -
a) Safety: Safety in investment means absence of risk. The risk associated with a loss invalue of principal amount invested in marketable securities is the most important aspect ofselection process. Therefore, the firm should select those securities which have no risk ofdefault of interest or recovery of principal. The rule of selction of marketable securities is toinvest in less risky securities and be prepared to sacrifice extra return for the sake of safety.
b) Liquidy: Liquidy refers to the abiliy to transform a security into cash. To ensure liquidity,the money should be invested in marketable (short term) securities including Governmenttreasury bills and short term fixed deposits with banks.
c) Maturity: Maturity refers to the time period over which interest and principal are to bepaid. The price of long-term securities fluctuates more widely with the interest rate changesthan the price of short term securities. Hence, long-term securities are relatively more risky.Therefore, for safety reasons, the firm prefers to invest excess cash in short-term securities.
9.7 Cash Management Models
To help in determining optimum cash balance, several types of cash management models have been designed.Out of such models, two of them are : (1) Baumol’s Model, i.e., optimum cash balance under certainty, and(2) The Miller-Orr Model i.e., Optimum cash balance under uncertainty are quite popular.
9.7.1 Baumol’s Model : (Economic Order Quantity Model, 1952)
Baumol’s model, suggested by William J. Baumol, considers cash management similar to an inventorymanagement problem. It is a formal approach in determining a firm’s optimum cash balance under certainty.According to this model, optimum cash level is that level of cash where the carrying costs and transactions
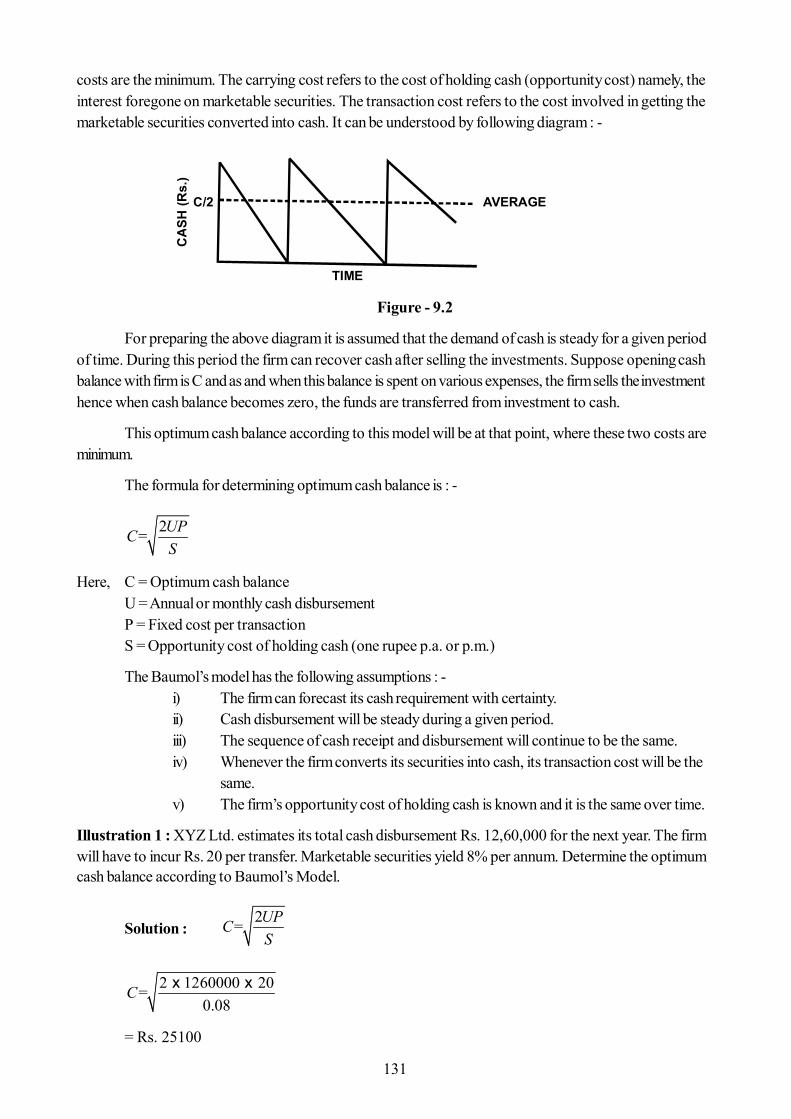
131
costs are the minimum. The carrying cost refers to the cost of holding cash (opportunity cost) namely, theinterest foregone on marketable securities. The transaction cost refers to the cost involved in getting themarketable securities converted into cash. It can be understood by following diagram : -
Figure - 9.2
For preparing the above diagram it is assumed that the demand of cash is steady for a given periodof time. During this period the firm can recover cash after selling the investments. Suppose opening cashbalance with firm is C and as and when this balance is spent on various expenses, the firm sells the investmenthence when cash balance becomes zero, the funds are transferred from investment to cash.
This optimum cash balance according to this model will be at that point, where these two costs areminimum.
The formula for determining optimum cash balance is : -
2UPCS
=
Here, C = Optimum cash balanceU = Annual or monthly cash disbursementP = Fixed cost per transactionS = Opportunity cost of holding cash (one rupee p.a. or p.m.)
The Baumol’s model has the following assumptions : -i) The firm can forecast its cash requirement with certainty.ii) Cash disbursement will be steady during a given period.iii) The sequence of cash receipt and disbursement will continue to be the same.iv) Whenever the firm converts its securities into cash, its transaction cost will be the
same.v) The firm’s opportunity cost of holding cash is known and it is the same over time.
Illustration 1 : XYZ Ltd. estimates its total cash disbursement Rs. 12,60,000 for the next year. The firmwill have to incur Rs. 20 per transfer. Marketable securities yield 8% per annum. Determine the optimumcash balance according to Baumol’s Model.
Solution :2UPC
S=
2 1260000 200.08
x x C=
= Rs. 25100
TIME
CA
SH (R
s.)
AVERAGEC/2
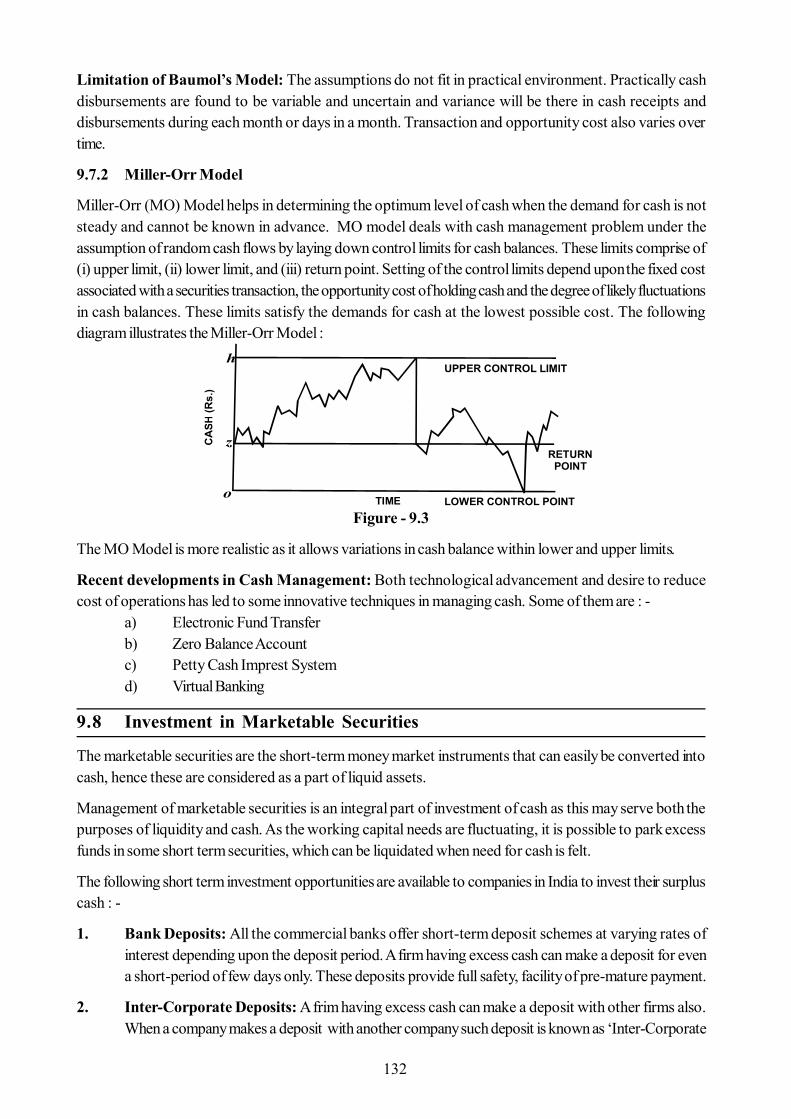
132
Limitation of Baumol’s Model: The assumptions do not fit in practical environment. Practically cashdisbursements are found to be variable and uncertain and variance will be there in cash receipts anddisbursements during each month or days in a month. Transaction and opportunity cost also varies overtime.
9.7.2 Miller-Orr Model
Miller-Orr (MO) Model helps in determining the optimum level of cash when the demand for cash is notsteady and cannot be known in advance. MO model deals with cash management problem under theassumption of random cash flows by laying down control limits for cash balances. These limits comprise of(i) upper limit, (ii) lower limit, and (iii) return point. Setting of the control limits depend upon the fixed costassociated with a securities transaction, the opportunity cost of holding cash and the degree of likely fluctuationsin cash balances. These limits satisfy the demands for cash at the lowest possible cost. The followingdiagram illustrates the Miller-Orr Model :
Figure - 9.3
The MO Model is more realistic as it allows variations in cash balance within lower and upper limits.
Recent developments in Cash Management: Both technological advancement and desire to reducecost of operations has led to some innovative techniques in managing cash. Some of them are : -
a) Electronic Fund Transferb) Zero Balance Accountc) Petty Cash Imprest Systemd) Virtual Banking
9.8 Investment in Marketable Securities
The marketable securities are the short-term money market instruments that can easily be converted intocash, hence these are considered as a part of liquid assets.
Management of marketable securities is an integral part of investment of cash as this may serve both thepurposes of liquidity and cash. As the working capital needs are fluctuating, it is possible to park excessfunds in some short term securities, which can be liquidated when need for cash is felt.
The following short term investment opportunities are available to companies in India to invest their surpluscash : -
1. Bank Deposits: All the commercial banks offer short-term deposit schemes at varying rates ofinterest depending upon the deposit period. A firm having excess cash can make a deposit for evena short-period of few days only. These deposits provide full safety, facility of pre-mature payment.
2. Inter-Corporate Deposits: A frim having excess cash can make a deposit with other firms also.When a company makes a deposit with another company such deposit is known as ‘Inter-Corporate
TIME
CA
SH (R
s.)
h
z
oLOWER CONTROL POINT
RETURN POINT
UPPER CONTROL LIMIT
133
deposit’. These deposits are usually for a period of three months to one year. Higher rate of interestis an important feature of these deposits. However, these are generally unsecure and this lack ofsafety is the main drawback of these type of short-term investments, but returns are quite attractive.
3. Treasury Bills: Treasury bills are short-term government securities. The usual practice in India isto sell treasury bills at a discount and redeem them at par on maturity. The difference between theissue price and the redemption price, adjusted for the time value of money is return on treasury bills.These bills are highly safe investments and are easily marketable.
4. Bill Discounting: A frim having excess cash can also discount the bills of other firms in the sameway as commercial banks do. On the maturity date of the bill, the firm will get the money. However,the discounting of bill as a marketable security is subject to two limitations. i.e. (i) the safety of thisinvestment depends upon the credit rating of the acceptor of the bill, and (ii) usually the pre-maturepayment of the bill is not available.
5. Negotiable Certificates of Deposits: NCD’s are papers issued by banks acknowledging fixeddeposits for a specified period of time. Commercial Papers are negotiable instruments.
6. Money Market Mutual Funds: Money market mutual funds (MMMFs) focus on short-termfunds like marketable securities such as TBs, CPs, CDs or call money. They have a minimum lock-in period of 30 days, and after this period, an investor can withdraw his or her money any time at ashort notice or even across the counter in some cases. They offer attractive yields. MMMFs havebecome quite popular with institutional investors and some companies. UTI’s MMMF schemes aremost successful so far.
9.9 Summary
Management of cash and marketable securities is one of the key areas of working capital management.Cash is required to meet a firm’s transaction and precautionary needs. A firm needs cash to make paymentsfor acquisition of resources and services for the normal conduct of business. It keeps additional funds tomeet any emergency situation. Some firms may also maintain cash for taking advantages of speculativechanges in prices of input and output.
The aim of finance manager in cash management is to minimize the investments in cash and at the same timeensure that the firm has sufficient liquidity.
The main objective of cash management is to trade-off liquidity and profitability in order to maximise thefirm’s value. Credit standing of the firm, relations with bank, management policies regarding holding inventory,liquidity preference etc. effects cash requirement of a firm. The finance manager can formulate strategies ofcash management by (i) determining optimum level of cash (ii) cash planning and control (iii) managing thecash flows (iv) investing surplus cash. Cash budget is probably the most important tool of cash management.
The basic strategies that can be employed to minimise the operating cash balance are (a) Accelerating cashcollection - Concentration banking, Lock box system deserve specific mention as principal methods ofestablishing a decentralised collection network. (b) Slowing disbursements - Centralised disbursement centre,Avoidance of early payments and Playing the float are the important techniques for slowing disbursement,but this slow down should not impair the credit rating or reputation of the firm.
A firm should hold an optimum balance of cash, and invest any temporary excess amount in marketablesecurities. In choosing these securities, the firm must keep in mind safety, maturity and liquidity of its investment.
134
9.10 Key Words
Cash Planning: It is a technique to plan and control the use of cash.
Cash Budget: A cash budget is a summary statement of the firm’s expected cash inflows andoutflows over a projected time period.
Cash Turnover: The number of times the firm’s cash is used during each year.
Transaction Motive: It refers to holding cash to meet anticipated obligations whose timing do notperfectly coincide with cash inflows.
Precautionary Motive: Holding cash to meet the unpredictable cash obligations of the firm.
Cash Management: It involves the management of cash in such a way that sufficient cash isalways available to meet the obligations of the firm.
Concentration Banking: A mean of accelerating the flow of cash of a firm by establishing strategiccollection centres.
Marketable Securities: Short term money market instruments that can easily be converted intocash.
Mail Float: The time gap between the postage of cheques by the debtors and the receipt of thesame in the firm is called mail float.
Processing Float: Time taken within the firm before depositing the cheque in the bank.
Collection Float: Time difference between depositing the cheques and their actual realisation.
9.11 Self Assessment Questions
1. What is ‘cash’ in cash management? What are the motives of holding cash?
2. “A number of methods are being employed to speed up the collection process and maximise availablecash”. Explain these methods.
3. What are the objectives of cash management?
4. Discuss the functions of cash management?
5. What is Baumol Model of cash management?
6. What is Miller-Orr Model of cash management?
7. Write a short note on the investment of idle cash in readily marketable securities.
8. Write short notes on : -a) Concentration Banking b) Lock Box Systemc) Optimum Cash Balance d) Playing the Float
9. Explain the techniques that can be used to accelerate the firm’s collection.
10. How can the optimum level of operating cash balance be determined?
11. Explain the criteria that a firm should use in choosing the short term investment alternative in orderto invest surplus cash.
135
12. From the following information compute optimum cash balance of a firm by using Baumol’s Model.
Monthly cash requirement Rs. 6,000Fixed cost per transaction Rs. 10Interest rate on marketable securities 6%
(Ans. - Rs. 15422)
9.12 Reference Books
- Chandra Prasanna - Financial Management : Theory and Practice, Tata Mcgraw Hills, New Delhi
- Mehta D.R. - Working Capital Management, Printice Hall, New Delhi.
- Agarwal M.R. - Management Accounting ; National Publishing House, Jaipur.
- Hampton John J. - Financial Decision Making Concepts, Problems and Cases, Printice Hall, NewDelhi.
- Kuchhal S.C. - Financial Management - An analytical and conceptual approach, Chaitanya,Allahabad.
- Khan, Jain - Principal of Financial Management, Tata Mcgraw Hills, New Delhi.
- Pandey I. M. - Financial Management, Vikas, New Delhi.
136
Unit - 10 : Cost of Capital
Structure of Unit:
10.0 Objectives10.1 Introduction10.2 Meaning and Definitions of Cost of Capital10.3 Classification of Cost of Capital10.4 Cost of Different Sources of Capital
10.4.1 Debt Capital10.4.2 Preference Shares10.4.3 Equity Shares10.4.4 Retained Earnings
10.5 Weighted Average Cost of Capital (WACC)10.6 Significance of Cost of Capital10.7 Problems in Determining Cost of Capital10.8 Summary10.9 Self Assessment Questions10.10 Reference Books
10.0 Objectives
After completing this unit, you would be able to:
Meaning and definitions of cost of capital Classification of cost of capital Cost of different sources of capital Debt capital, Preference shares, Equity shares, Retained earnings Weighted average cost of capital (WACC) Significance of cost of capital Problems in determining cost of capital
10.1 Introduction
The cost of capital is an important factor while planning the capital structure of an organization. The cost ofcapital is concerned with what a firm has to pay for the capital it uses to finance new investments. The capitalmay be in the form of debt, retained earnings, preference shares and equity shares. Every firm, for itssurvival and growth, has to earn a sufficient return to cover its costs of capital and also to have surplus forits growth. If a firm’s rate of return on its investment exceeds its cost of capital, the wealth of equity stockholdersis enhanced. It is, because, the firm’s rate of return on its investments is greater than its cost of capital, therate of return earned on equity capital (after nearing the costs of other forms of financing) will exceed therate of return required by equity stockholders. Hence, the wealth of equity stockholders will increase.
10.2 Meaning and Definitions of Cost of Capital
‘Cost of Capital’ is a concept having manifold meanings. Cost of capital, for an investor is the measurementof disutility of funds in the present as compared to the return expected in the future. From the firm’s point ofview, its meaning is somewhat different. From its point of view, cost of capital is the required rate of returnneeded to justify the use of capital. This very idea has been subscribed by the following authorities also:
137
“The cost of capital is the minimum required rate of earnings or the cut off rate for capital expenditure”.Solomon Ezra
“The cost of capital is the rate of return a company must earn on an investment to maintain the value of thecompany”. M.J. Gorden
‘’Cost of capital is the rate of return, the firm requires from investment in order to increase the value of thefirm in the market rate”. John J. H.
“The cost of capital is the minimum rate of return which a firm requires as a condition for undertaking aninvestment”. Milton H. Spencer
“The cost of capital represents a cut off rate for the allocation of capital to investment of projects. It is therate of return on a project that will leave unchanged the market price of the stock”.
James C. Van Home
Conclusion : Thus, it is clear from the above that the cost of capital is the minimum rate of return which acompany is expected to earn from a proposed project so as to make no reduction in the earning per shareto equity shareholders and Its market price. It is the combined coal of each type of source by which a firmraises the funds.
10.3 Classification of Cost of Capital
1. Historical Cost and Future Cost: Historical cost are those which are calculated on the basis ofexisting capital structure. Future cost relates to the cost of funds intended to finance the expectedproject, historical costs are useful for analyzing the existing capital structures. Future costs arewidely used in capital budgeting and capital structure designing decisions.
2. Specific Cost and Composite Cost: The cost of individual source of capital is referred to as thespecific cost and the cost of capital of all the sources combined is termed as composite cost. It is,thus the weighted cost of capital.
3. Average Cost and Marginal Cost: The average cost is the average of the various specific costsof the different components of capital structure at a given time. The average cost is relevant foroverall investment decision as on enterprise employs a mix of different sources. The marginal costof capital is that average cost which is concerned with the additional funds raised by the firm. It isvery important in capital budgeting decisions. Marginal cost tends to increase proportionately as theamount of debt increases.
4. Explicit Cost and Implicit Cost: An explicit cost is the discount rate which equates the presentvalue of cash inflows with the present value of cash outflows. In other words, it is the internal rate ofreturn of cash flows.
Implicit cost is also known as opportunity cost. It may be defined as the rate of return associated with thebest investment opportunity for the firm. It is generally said that cost of retained earnings is an opportunitycost in the sense that it is the rate of return at which the shareholders could have invested these funds hadthey been distributed among them.
10.4 Cost of Different Sources of Capital
In making investment decisions, cost of different types of capital is measured and compared. The source,which is the cheapest is chosen and than capital is raised. It is necessary to determine the specific cost of
138
each source in order to determine the minimum obligation on a company. (Generally, the following are thesources of capital:
Specific cost of different sources of raising funds are calculated In the following manner :
10.4.1 Cost of Debt Capital
Funds can be borrowed both for short term as well as for long term. Short term debt is required to satisfyworking capital needs. The cost of debt finance can be defined in terms of the required rate of return that thedebt financed investment must yield to prevent damage to the stockholders position. The cost of debt canbe computed in the following manner:
(a) Cost of Short Term Debt: Short term funds are borrowed for short period of time and repaidwithin the operating period. Cost of short term debt is the percentage of burden in relation to netproceeds of the debt. In this context, burden can be defined as the annual rate of interest acceptedto be paid plus other related costs. When funds are borrowed, some expenses such as brokerage,stamps duty, legal expenses etc. are to be incurred by borrower. So, it is necessary to compute costof debt on net proceeds. It can be understood with the help of the following example.
Illustration 1: Mr. X wants to borrow Rs. 1,00,000 from State Bank of India. The rate of interestis 14% p.a. The loan is repayable in one year. For this purpose Rs. 1,000 will be incurred by Mr. X.The actual cost of loan will be as follows :
Solution :
Net Proceeds = Rs. 1,00,000 – Rs. 1,000 = Rs. 99,000
Annual Interest charges = Rs. 14,000
Cost of Loan (before tax) = Interest 100
Net Proceeds
= Rs.14,000 100 14.14%Rs.99,000
The above cost is before tax. Interest is a deductible expense for the purpose of income tax. Hence,the cost of loan after tax will be reduced. In the above example, if tax rate is 50%. The cost of loanafter tax will be as follows :
Cost of Loan (after tax) = Before Tax Cost (I-T)
= 14.14% (1-.50)
= 7.07%
(b) Cost of Long Term Debt: According to Weston and Brigham, “The cost of debt is definedas the rate of return that must be earned on debt financed investment in order to keep unchangedthe earning available to equity shareholders”. Long term debts include bonds, debentures, bankloan, term loan, public deposits etc. A company must earn minimum return on debt capital to protectthe interest of shareholders. For example. A company issues 12% debentures for Rs. 10 lakhs atpar. It must earn at least Rs. 1,20,000 p.a. to protect the interest of shareholders. If company earnsless than Rs. 1,20,000, the return to shareholders will be affected adversely and the market value,of share will also decrease.
Cost of Debentures or Bonds: A company borrows capital in order to maximize the profits for itsshareholders i.e., to pay higher dividend to them. It continues to use this source of finance until the incrementalreturn is higher than the incremental cost of debt capital.
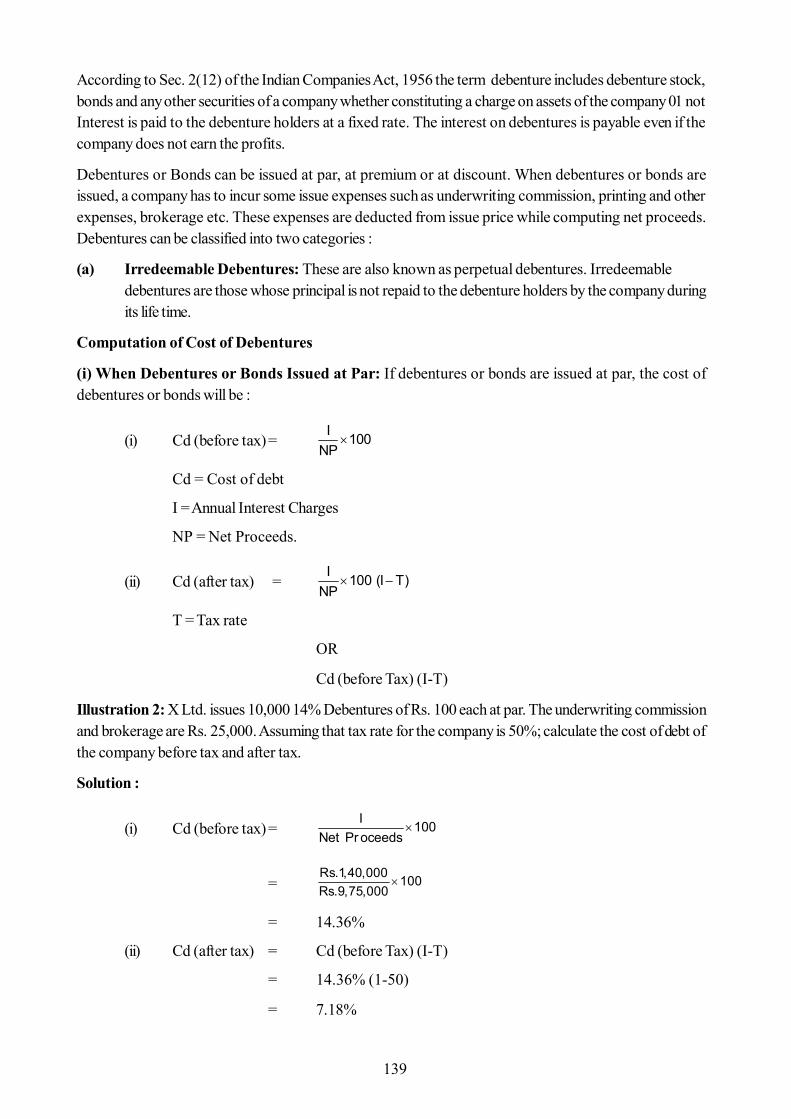
139
According to Sec. 2(12) of the Indian Companies Act, 1956 the term debenture includes debenture stock,bonds and any other securities of a company whether constituting a charge on assets of the company 01 notInterest is paid to the debenture holders at a fixed rate. The interest on debentures is payable even if thecompany does not earn the profits.
Debentures or Bonds can be issued at par, at premium or at discount. When debentures or bonds areissued, a company has to incur some issue expenses such as underwriting commission, printing and otherexpenses, brokerage etc. These expenses are deducted from issue price while computing net proceeds.Debentures can be classified into two categories :
(a) Irredeemable Debentures: These are also known as perpetual debentures. Irredeemabledebentures are those whose principal is not repaid to the debenture holders by the company duringits life time.
Computation of Cost of Debentures
(i) When Debentures or Bonds Issued at Par: If debentures or bonds are issued at par, the cost ofdebentures or bonds will be :
(i) Cd (before tax)= I 100
NP
Cd = Cost of debt
I = Annual Interest Charges
NP = Net Proceeds.
(ii) Cd (after tax) = I 100 (I T)
NP
T = Tax rate
OR
Cd (before Tax) (I-T)
Illustration 2: X Ltd. issues 10,000 14% Debentures of Rs. 100 each at par. The underwriting commissionand brokerage are Rs. 25,000. Assuming that tax rate for the company is 50%; calculate the cost of debt ofthe company before tax and after tax.
Solution :
(i) Cd (before tax)= I 100
Net Pr oceeds
= Rs.1,40,000 100Rs.9,75,000
= 14.36%
(ii) Cd (after tax) = Cd (before Tax) (I-T)
= 14.36% (1-50)
= 7.18%
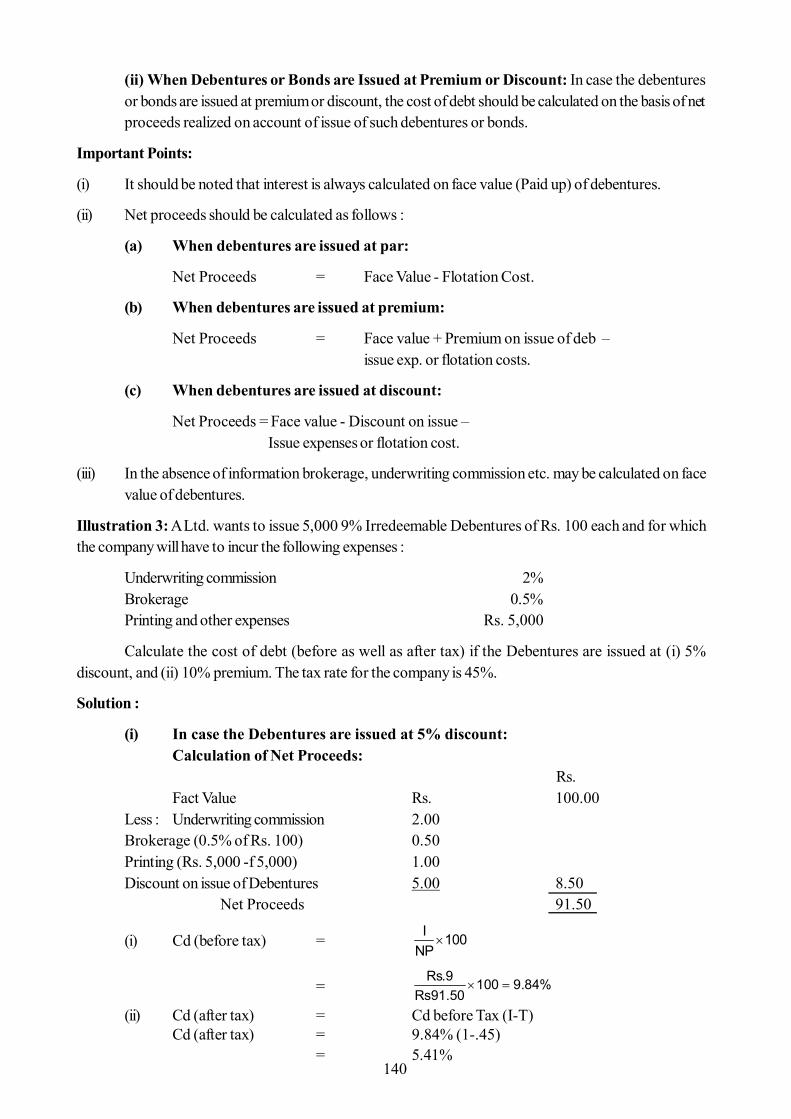
140
(ii) When Debentures or Bonds are Issued at Premium or Discount: In case the debenturesor bonds are issued at premium or discount, the cost of debt should be calculated on the basis of netproceeds realized on account of issue of such debentures or bonds.
Important Points:
(i) It should be noted that interest is always calculated on face value (Paid up) of debentures.
(ii) Net proceeds should be calculated as follows :
(a) When debentures are issued at par:
Net Proceeds = Face Value - Flotation Cost.
(b) When debentures are issued at premium:
Net Proceeds = Face value + Premium on issue of deb –issue exp. or flotation costs.
(c) When debentures are issued at discount:
Net Proceeds = Face value - Discount on issue –Issue expenses or flotation cost.
(iii) In the absence of information brokerage, underwriting commission etc. may be calculated on facevalue of debentures.
Illustration 3: A Ltd. wants to issue 5,000 9% Irredeemable Debentures of Rs. 100 each and for whichthe company will have to incur the following expenses :
Underwriting commission 2%Brokerage 0.5%Printing and other expenses Rs. 5,000
Calculate the cost of debt (before as well as after tax) if the Debentures are issued at (i) 5%discount, and (ii) 10% premium. The tax rate for the company is 45%.
Solution :
(i) In case the Debentures are issued at 5% discount:Calculation of Net Proceeds:
Rs.Fact Value Rs. 100.00
Less : Underwriting commission 2.00Brokerage (0.5% of Rs. 100) 0.50Printing (Rs. 5,000 -f 5,000) 1.00Discount on issue of Debentures 5.00 8.50
Net Proceeds 91.50
(i) Cd (before tax) =
I 100
NP
=
Rs.9 100 9.84%
Rs91.50(ii) Cd (after tax) = Cd before Tax (I-T)
Cd (after tax) = 9.84% (1-.45)= 5.41%
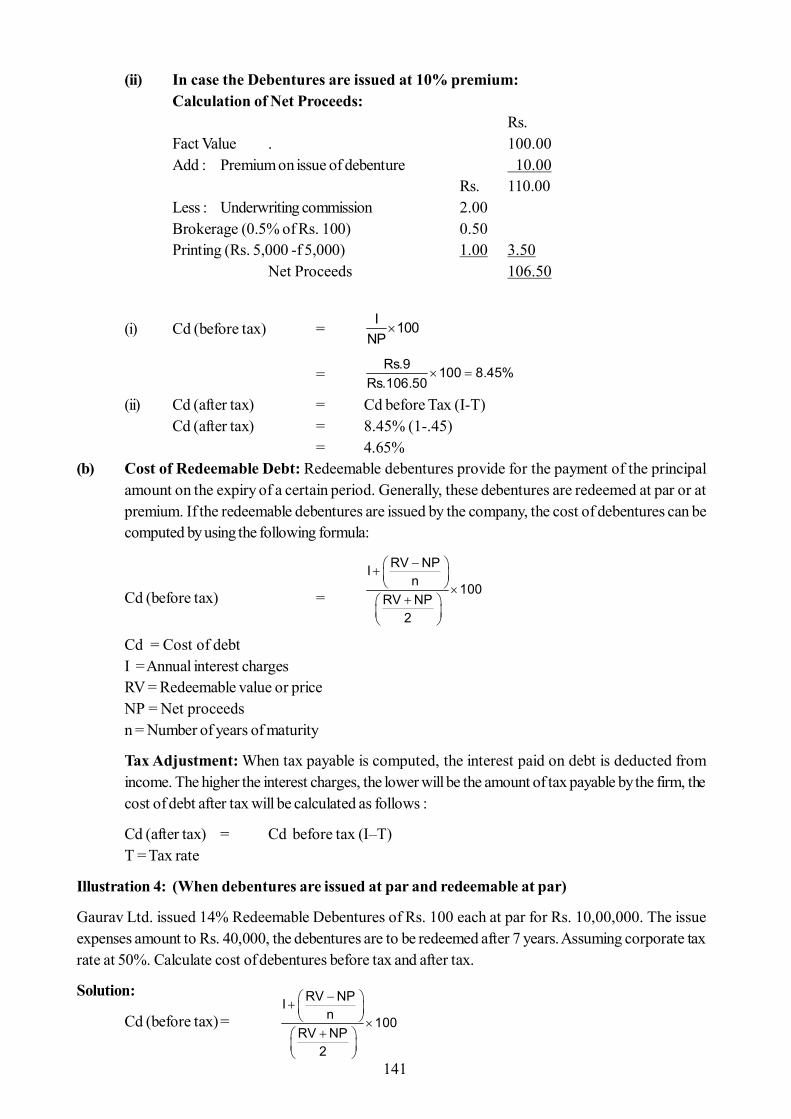
141
(ii) In case the Debentures are issued at 10% premium:Calculation of Net Proceeds:
Rs.Fact Value . 100.00Add : Premium on issue of debenture 10.00
Rs. 110.00Less : Underwriting commission 2.00Brokerage (0.5% of Rs. 100) 0.50Printing (Rs. 5,000 -f 5,000) 1.00 3.50
Net Proceeds 106.50
(i) Cd (before tax) =
I 100
NP
=
Rs.9 100 8.45%
Rs.106.50(ii) Cd (after tax) = Cd before Tax (I-T)
Cd (after tax) = 8.45% (1-.45)= 4.65%
(b) Cost of Redeemable Debt: Redeemable debentures provide for the payment of the principalamount on the expiry of a certain period. Generally, these debentures are redeemed at par or atpremium. If the redeemable debentures are issued by the company, the cost of debentures can becomputed by using the following formula:
Cd (before tax) =
RV NPIn 100
RV NP2
Cd = Cost of debtI = Annual interest chargesRV = Redeemable value or priceNP = Net proceedsn = Number of years of maturity
Tax Adjustment: When tax payable is computed, the interest paid on debt is deducted fromincome. The higher the interest charges, the lower will be the amount of tax payable by the firm, thecost of debt after tax will be calculated as follows :
Cd (after tax) = Cd before tax (I–T)T = Tax rate
Illustration 4: (When debentures are issued at par and redeemable at par)
Gaurav Ltd. issued 14% Redeemable Debentures of Rs. 100 each at par for Rs. 10,00,000. The issueexpenses amount to Rs. 40,000, the debentures are to be redeemed after 7 years. Assuming corporate taxrate at 50%. Calculate cost of debentures before tax and after tax.
Solution:
Cd (before tax)=
RV NPIn 100
RV NP2
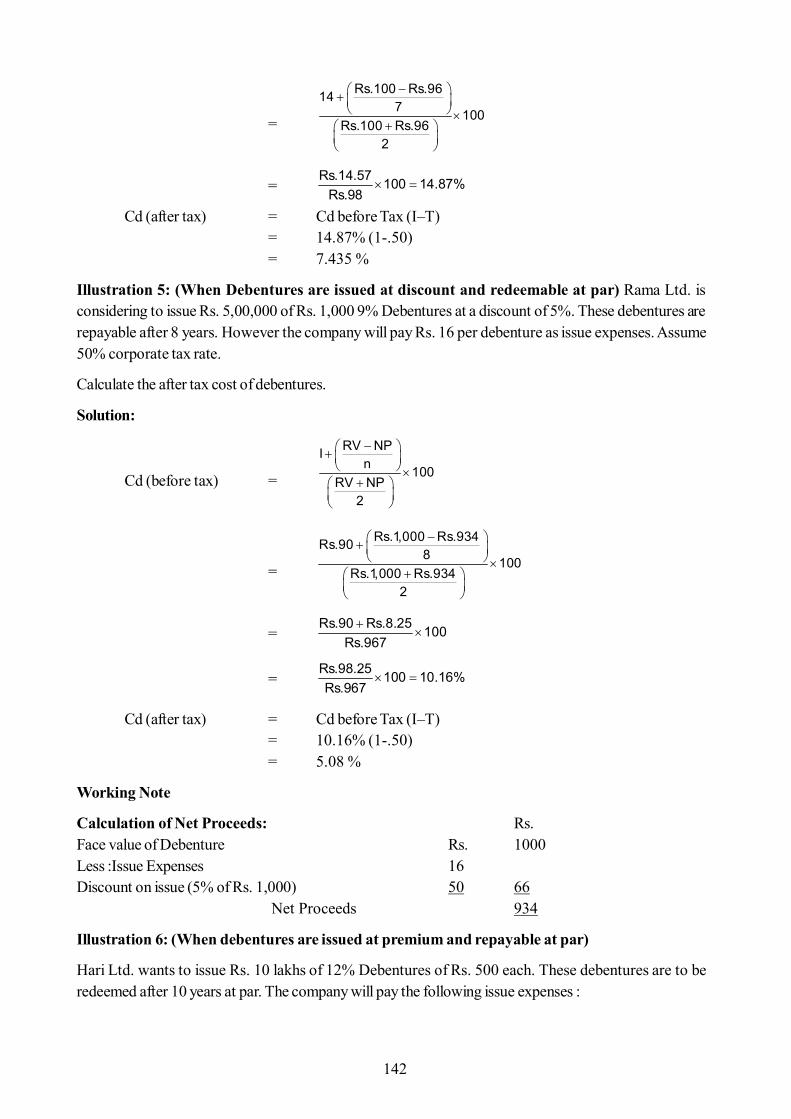
142
=
Rs.100 Rs.96147 100
Rs.100 Rs.962
=
Rs.14.57 100 14.87%
Rs.98Cd (after tax) = Cd before Tax (I–T)
= 14.87% (1-.50)= 7.435 %
Illustration 5: (When Debentures are issued at discount and redeemable at par) Rama Ltd. isconsidering to issue Rs. 5,00,000 of Rs. 1,000 9% Debentures at a discount of 5%. These debentures arerepayable after 8 years. However the company will pay Rs. 16 per debenture as issue expenses. Assume50% corporate tax rate.
Calculate the after tax cost of debentures.
Solution:
Cd (before tax) =
RV NPIn 100
RV NP2
=
Rs.1,000 Rs.934Rs.908 100
Rs.1,000 Rs.9342
=
Rs.90 Rs.8.25 100
Rs.967
=
Rs.98.25 100 10.16%Rs.967
Cd (after tax) = Cd before Tax (I–T)= 10.16% (1-.50)= 5.08 %
Working Note
Calculation of Net Proceeds: Rs.Face value of Debenture Rs. 1000Less :Issue Expenses 16Discount on issue (5% of Rs. 1,000) 50 66 Net Proceeds 934
Illustration 6: (When debentures are issued at premium and repayable at par)
Hari Ltd. wants to issue Rs. 10 lakhs of 12% Debentures of Rs. 500 each. These debentures are to beredeemed after 10 years at par. The company will pay the following issue expenses :
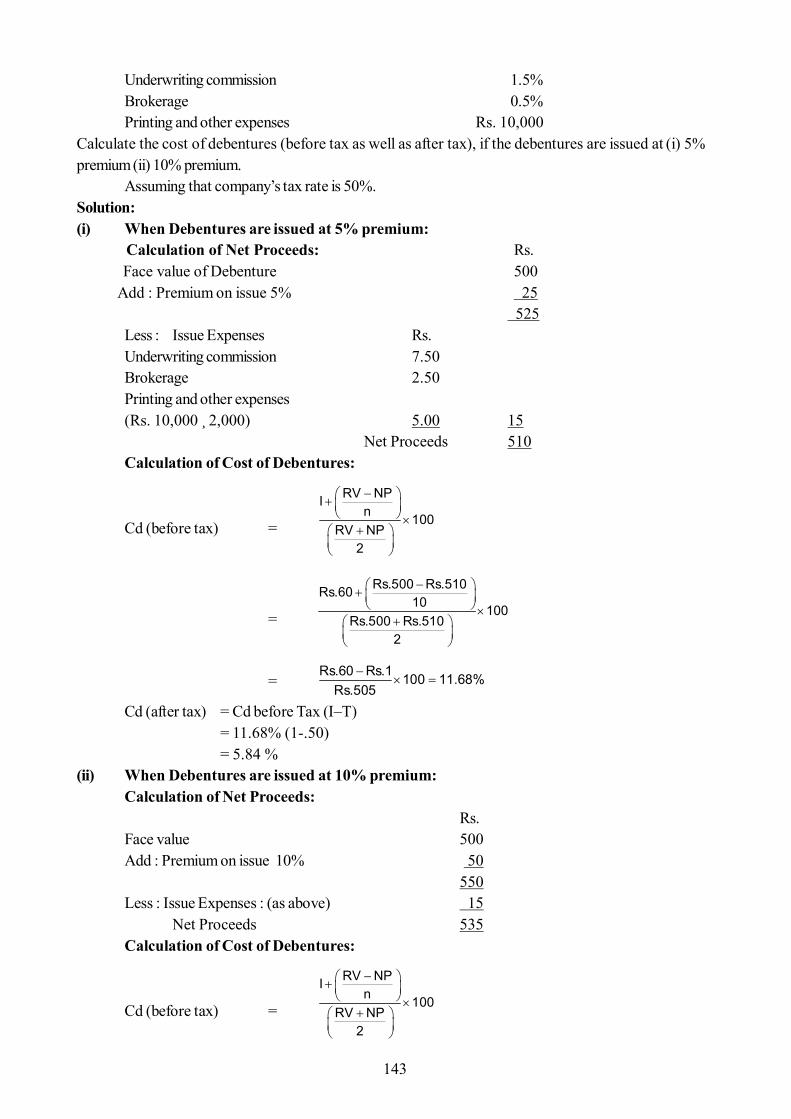
143
Underwriting commission 1.5%Brokerage 0.5%Printing and other expenses Rs. 10,000
Calculate the cost of debentures (before tax as well as after tax), if the debentures are issued at (i) 5%premium (ii) 10% premium.
Assuming that company’s tax rate is 50%.Solution:(i) When Debentures are issued at 5% premium: Calculation of Net Proceeds: Rs. Face value of Debenture 500 Add : Premium on issue 5% 25
525Less : Issue Expenses Rs.Underwriting commission 7.50Brokerage 2.50Printing and other expenses(Rs. 10,000 ̧ 2,000) 5.00 15
Net Proceeds 510Calculation of Cost of Debentures:
Cd (before tax) =
RV NPIn 100
RV NP2
=
Rs.500 Rs.510Rs.6010 100
Rs.500 Rs.5102
=
Rs.60 Rs.1 100 11.68%
Rs.505Cd (after tax) = Cd before Tax (I–T)
= 11.68% (1-.50)= 5.84 %
(ii) When Debentures are issued at 10% premium:Calculation of Net Proceeds:
Rs.Face value 500Add : Premium on issue 10% 50
550Less : Issue Expenses : (as above) 15
Net Proceeds 535Calculation of Cost of Debentures:
Cd (before tax) =
RV NPIn 100
RV NP2
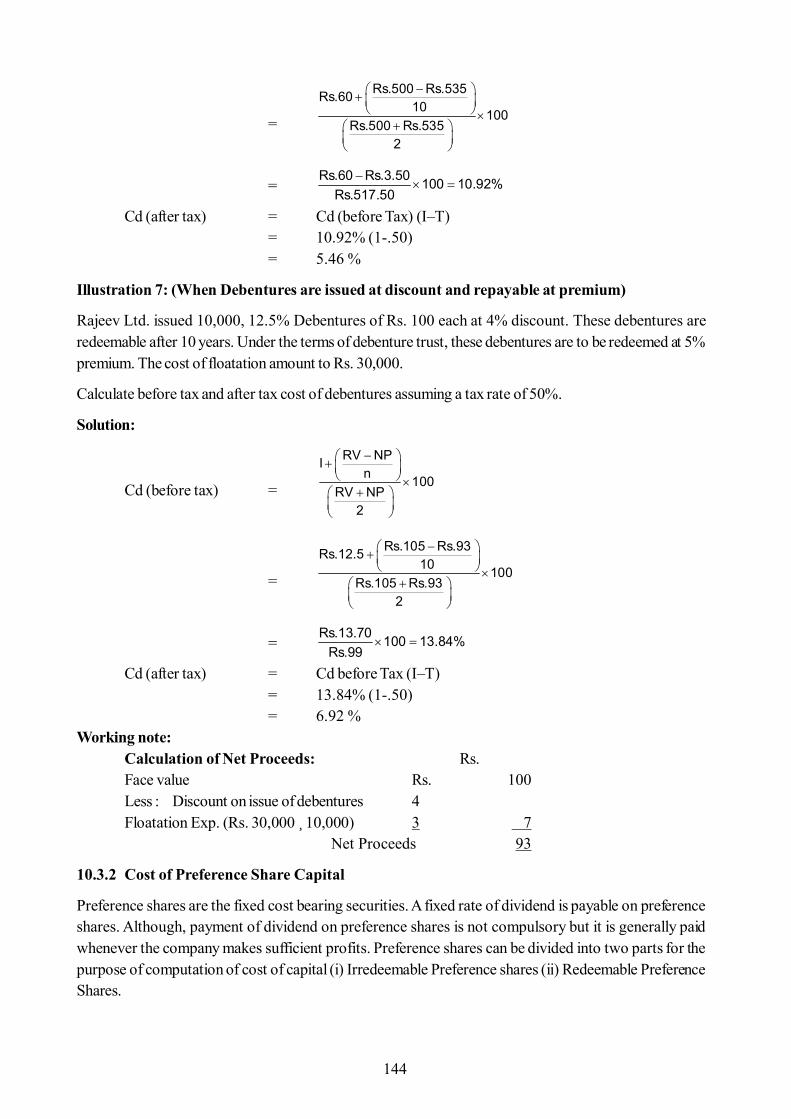
144
=
Rs.500 Rs.535Rs.6010 100
Rs.500 Rs.5352
=
Rs.60 Rs.3.50 100 10.92%
Rs.517.50Cd (after tax) = Cd (before Tax) (I–T)
= 10.92% (1-.50)= 5.46 %
Illustration 7: (When Debentures are issued at discount and repayable at premium)
Rajeev Ltd. issued 10,000, 12.5% Debentures of Rs. 100 each at 4% discount. These debentures areredeemable after 10 years. Under the terms of debenture trust, these debentures are to be redeemed at 5%premium. The cost of floatation amount to Rs. 30,000.
Calculate before tax and after tax cost of debentures assuming a tax rate of 50%.
Solution:
Cd (before tax) =
RV NPIn 100
RV NP2
=
Rs.105 Rs.93Rs.12.510 100
Rs.105 Rs.932
=
Rs.13.70 100 13.84%
Rs.99Cd (after tax) = Cd before Tax (I–T)
= 13.84% (1-.50)= 6.92 %
Working note:Calculation of Net Proceeds: Rs.Face value Rs. 100Less : Discount on issue of debentures 4Floatation Exp. (Rs. 30,000 ̧ 10,000) 3 7
Net Proceeds 93
10.3.2 Cost of Preference Share Capital
Preference shares are the fixed cost bearing securities. A fixed rate of dividend is payable on preferenceshares. Although, payment of dividend on preference shares is not compulsory but it is generally paidwhenever the company makes sufficient profits. Preference shares can be divided into two parts for thepurpose of computation of cost of capital (i) Irredeemable Preference shares (ii) Redeemable PreferenceShares.
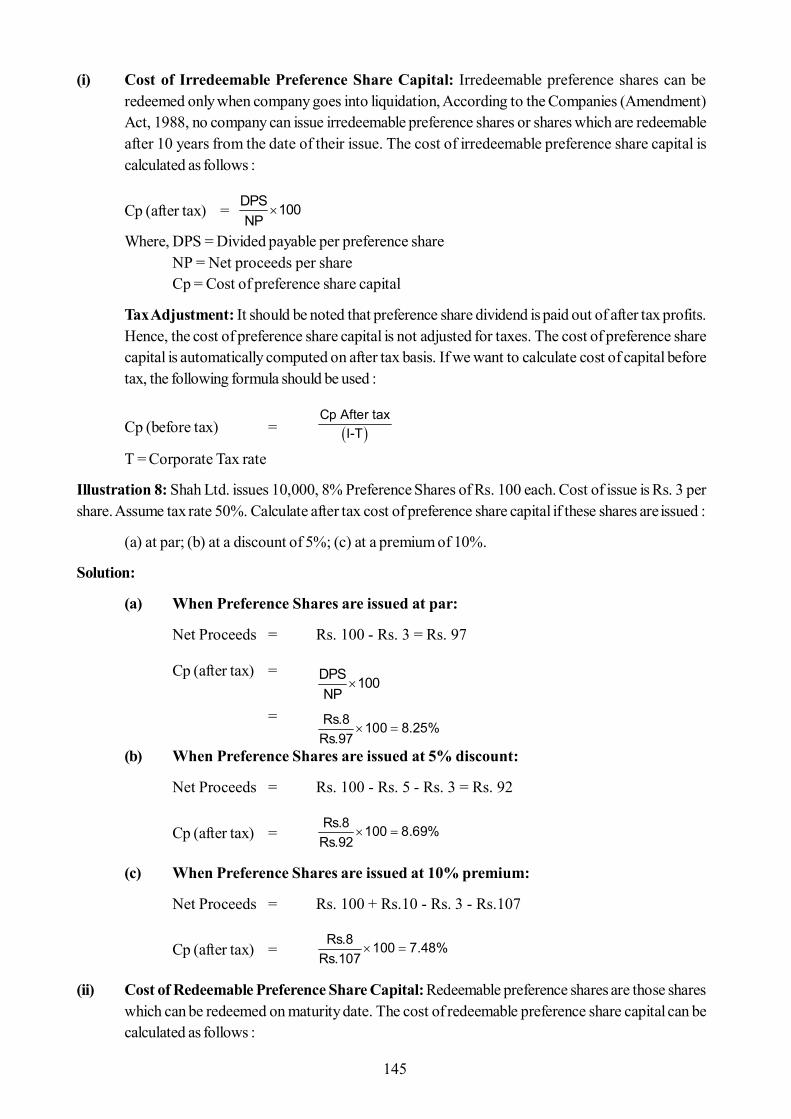
145
(i) Cost of Irredeemable Preference Share Capital: Irredeemable preference shares can beredeemed only when company goes into liquidation, According to the Companies (Amendment)Act, 1988, no company can issue irredeemable preference shares or shares which are redeemableafter 10 years from the date of their issue. The cost of irredeemable preference share capital iscalculated as follows :
Cp (after tax) = DPS 100NP
Where, DPS = Divided payable per preference shareNP = Net proceeds per shareCp = Cost of preference share capital
Tax Adjustment: It should be noted that preference share dividend is paid out of after tax profits.Hence, the cost of preference share capital is not adjusted for taxes. The cost of preference sharecapital is automatically computed on after tax basis. If we want to calculate cost of capital beforetax, the following formula should be used :
Cp (before tax) =
Cp After tax
I-T
T = Corporate Tax rate
Illustration 8: Shah Ltd. issues 10,000, 8% Preference Shares of Rs. 100 each. Cost of issue is Rs. 3 pershare. Assume tax rate 50%. Calculate after tax cost of preference share capital if these shares are issued :
(a) at par; (b) at a discount of 5%; (c) at a premium of 10%.
Solution:
(a) When Preference Shares are issued at par:
Net Proceeds = Rs. 100 - Rs. 3 = Rs. 97
Cp (after tax) = DPS 100NP
= Rs.8 100 8.25%Rs.97
(b) When Preference Shares are issued at 5% discount:
Net Proceeds = Rs. 100 - Rs. 5 - Rs. 3 = Rs. 92
Cp (after tax) = Rs.8 100 8.69%Rs.92
(c) When Preference Shares are issued at 10% premium:
Net Proceeds = Rs. 100 + Rs.10 - Rs. 3 - Rs.107
Cp (after tax) = Rs.8 100 7.48%Rs.107
(ii) Cost of Redeemable Preference Share Capital: Redeemable preference shares are those shareswhich can be redeemed on maturity date. The cost of redeemable preference share capital can becalculated as follows :
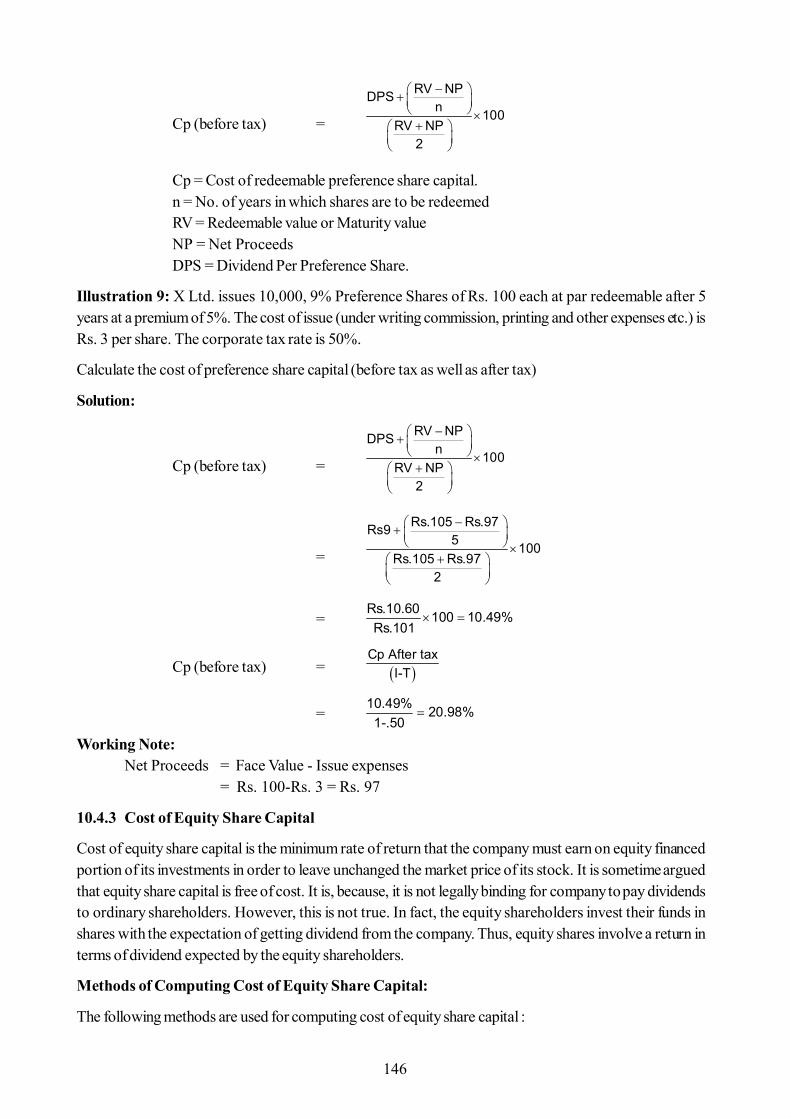
146
Cp (before tax) =
RV NPDPSn 100
RV NP2
Cp = Cost of redeemable preference share capital.n = No. of years in which shares are to be redeemedRV = Redeemable value or Maturity valueNP = Net ProceedsDPS = Dividend Per Preference Share.
Illustration 9: X Ltd. issues 10,000, 9% Preference Shares of Rs. 100 each at par redeemable after 5years at a premium of 5%. The cost of issue (under writing commission, printing and other expenses etc.) isRs. 3 per share. The corporate tax rate is 50%.
Calculate the cost of preference share capital (before tax as well as after tax)
Solution:
Cp (before tax) =
RV NPDPSn 100
RV NP2
=
Rs.105 Rs.97Rs95 100
Rs.105 Rs.972
= Rs.10.60 100 10.49%
Rs.101
Cp (before tax) =
Cp After tax
I-T
= 10.49% 20.98%
1-.50
Working Note:Net Proceeds = Face Value - Issue expenses
= Rs. 100-Rs. 3 = Rs. 97
10.4.3 Cost of Equity Share Capital
Cost of equity share capital is the minimum rate of return that the company must earn on equity financedportion of its investments in order to leave unchanged the market price of its stock. It is sometime arguedthat equity share capital is free of cost. It is, because, it is not legally binding for company to pay dividendsto ordinary shareholders. However, this is not true. In fact, the equity shareholders invest their funds inshares with the expectation of getting dividend from the company. Thus, equity shares involve a return interms of dividend expected by the equity shareholders.
Methods of Computing Cost of Equity Share Capital:
The following methods are used for computing cost of equity share capital :
147
(i) Dividend Yield Method(ii) Earnings Yield Method(iii) Dividend Yield and Growth in Dividend Method(iv) Realized Yield Method.
(i) Dividend Yield Method: It is also known as dividend price ratio method. According to thismethod, the cost of equity share capital is calculated on the basis of a required rate of return in termsof future dividends to be paid on equity shares for maintaining their present market price. Thismethod is based on the assumptions that the investors give prime importance to dividends and riskin the form remains unchanged. This method does not seem to consider the growth in dividend. Thefollowing formula is used for computation of cost of existing equity shares :
Ce (after tax) = DPS 100MPS
Ce = Cost of Equity Share CapitalDPS = Dividend Per ShareMPS = Market Price per Share
Illustration 10: Varsha Ltd. issued 10,000 Equity Shares of Rs. 100 each at par. The company has beenpaying 20% dividend to equity shareholders for the past five years and expects to maintain the same in thefuture also. Market price of equity share is Rs. 160.
Calculate the cost of equity share capital.
Solution:
Ce (after tax) = DPS 100MPS
Ce = Rs.20 100 12.5%Rs.160
(ii) Earnings Yield Method: This is also called ‘Earnings Price Ratio’ method. According to thisapproach, the earning per share determines the market price of equity shares. Under this method,the cost of equity share capital is equal to the rate which must be earned on incremental issues ofequity shares so as to maintain the present value of investment. The following formula is used forcomputation of cost of equity share capital:
Ce = EPS 100MPS
Ce = Cost of Equity Share CapitalEPS = Earnings Per ShareMPS = Market Price per Share
This method of computing cost of equity capital may be employed in the following cases : (i)When the earnings per share are expected to remain constant.
(ii) When all earnings are distributed to the shareholders in the form of dividends.(iii) The market price of the share is influenced only by earnings per share.
Illustration 11: Jain Tubes Ltd. has issued 10,000 equity shares of Rs 100 each fully paid. It has earnedprofit after tax R| 1,80,000. The market price per share is Rs. 200. Calculate the cost of equity share capitalon the basis of earning yield method assuming that all earnings has among shareholders.
148
Solution:
Ce = EPS 100MPS
= Rs.18 100 9%Rs.200
EPS = Profit After TaxNo. of Equity Share
= Rs. 1,80,000 Rs. 18
10,000
(iii) Dividend Yield and Growth in Dividend Method: According to this method, the cost ofequity is determined on the basis of the expected dividend rate plus the rate of growth in dividend.The rate of growth in dividend is determined on the basis of amount of dividends paid by thecompany for the last few years. According to this approach the cost of equity share capital may bedetermined by using the following formula :
Ce = DPS 100 GMPS
Ce = Cost of Equity CapitalDPS = Dividend Per ShareMPS = Market Price Per ShareG = Growth rate in dividend
Illustration 12: Mahadev Ltd. has issued 20,000 equity shares of Rs. 100 each ige rate of dividend paidby the company is 21%. The earnings of the company have recorded a growth rate of 5% per annum. Thecurrent market price of an equity share of company is Rs. 150.
Find out cost of equity share capital.
Solution:
Ce = DPS 100 GMPS
= Rs. 21 100 5%Rs. 150
= 14% + 5% = 19%
(iv) Realised Yield Method: According to this method, the rate of return actually realised byshareholders forms the basis for determining the cost of equity capital. The advocate of this approachargue that the rate of earnings as well as the market price of shares are always subject to fluctuationson account of so many factors. Therefore the return actually realised is a true indicator of the returnexpected by the shareholders. The realised return is discounted al the present value factor and thencompared with the value of investment. This approach is based on the following assumptions :
(i) The risks of the company remain same.(ii) The shareholders continue to expect the same rate of return for bearing the given risk.(iii) The reinvestment opportunity rate of the shareholders is equal to the realised yield.
Illustration 13: Mr. Rajat purchased 100 shares of Hero Honda Ltd. at a cost of Rs. 428 on 1st January2000. The face value of share is Rs. 100 each. He held them for 5 years and finally sold them on 31st Dec.2004 for Rs. 600. The amount of dividend received by him in each of these 5 years was as follows :
149
Year Dividend Per Share2000 Rs. 122001 Rs. 142002 Rs. 152003 Rs. 152004 Rs. 18
Solution:
In order to calculate the cost of equity capital, it is necessary to calculate the internal rate of return. It can becalculated by ‘trial and error’ method.
The purchase price of the share is Rs. 428, which is equal to the present value of cash inflows over a periodof 5 years (dividends and capital receipt on sale) at 10%. thus, the cost of equity capital can be taken at10%.
• Cost of Newly Issued Equity Shares: When new equity shares are issued by the company, ithas to incur some expenses such as underwriting commission, brokerage, printing and other expenses.These expenses are deducted from the issue price or market price (If it is given) and net proceedsis computed. The cost of equity capital is computed on the basis of net proceeds and dividend pershare and earnings per share.
The following formulae are used to compute the cost of equity capital:
1. Divided Yield Method:
Ce = DPS 100NP
2. Earning Yield Method:
Ce = EPS 100NP
3. Dividend Yield Method and Growth in Dividend Method:
Ce = DPS 100 GNP
Illustration 14: From the following information of Santosh Ltd., calculate the cost of new equity shares ofthe company :
Year Dividend Discount facto r a t 10%
Present va lue
Rs. Rs. 2000 1 2 .909 10.91 2001 1 4 .826 11.56 2002 1 5 .751 11.27 2003 1 5 .683 10.25 2004 1 8 .621 11.18 2004 6 00 (sale
Proceeds) .621 372.6
427.7 7
150
(i) Current selling price Rs. 150 per share.(ii) Flotation cost are expected to be 3% of current selling price.(iii) The expected dividend on new shares amounts to Rs. 16 per share.(iv) The following are the dividends paid by the company for the last 5 years.
Year Dividend Per ShareRs.
2000 10.502001 11.002002 12.502003 12.752004 13.25
Solution:
(i) Calculation of Growth Rate in Dividend:
The dividend declared by the company have increased from Rs. 10.50 to Rs. 13.25 during the last 4 years(and not 5 years, since dividends at the end of 2000 are being compared with dividends at the end of 2004).
Compound Factor = Rs. 13.25 1.262Rs. 10.50
Compound interest table (See Appendix 3 at the end of this book) suggests that Re 1.00 Compounds toRs. 1.262 in 4 years at the compound rate of 6%. Therefore, the growth rate in dividends is 6%.
(ii) Cost of Equity Capital DPS:
Ce = DPS 100 GNP
= Rs. 16 100 6%Rs. 145.50
= 11%+ 6% =17%Working Note:
Net Proceeds = Market Price Per Share - Floatation Cost Per Share= Rs. 150 - Rs. 4.50 (3% of Rs. 150)= Rs. 145.50
Illustration 15: X Ltd. is considering an expenditure of Rs. 6 lakhs for expanding its operations. Therelevant information is as follows :
No of existing equity shares 1 lakhMarket value of existing share Rs. 60Net earnings after tax Rs. 9 lakhs
Compute the cost of existing share capital and of new equity share capital assuming that new shares will beissued at a price of Rs. 96 per share (Face value Rs. 100 each). The estimated cost of new issue will be Rs.3 per share.
Solution:
(i) Cost of Existing Equity Share Capital :
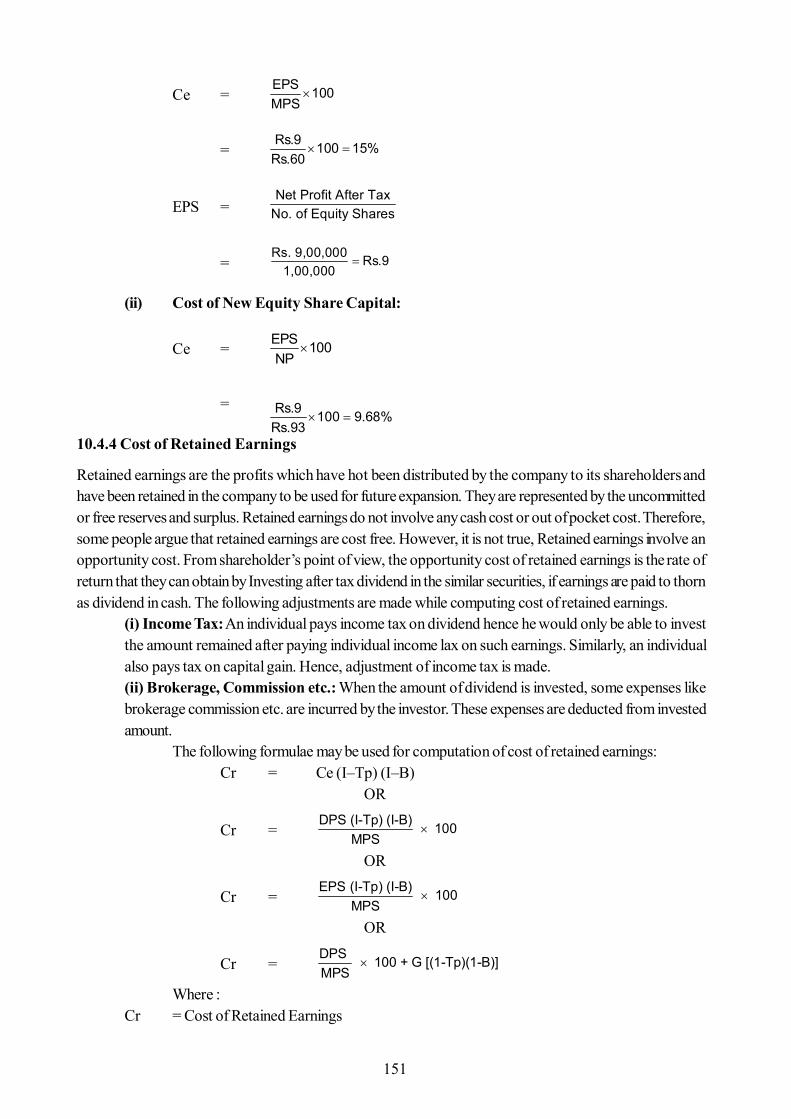
151
Ce = EPS 100MPS
= Rs.9 100 15%Rs.60
EPS = Net Profit After TaxNo. of Equity Shares
= Rs. 9,00,000 Rs.9
1,00,000
(ii) Cost of New Equity Share Capital:
Ce = EPS 100NP
= Rs.9 100 9.68%Rs.93
10.4.4 Cost of Retained Earnings
Retained earnings are the profits which have hot been distributed by the company to its shareholders andhave been retained in the company to be used for future expansion. They are represented by the uncommittedor free reserves and surplus. Retained earnings do not involve any cash cost or out of pocket cost. Therefore,some people argue that retained earnings are cost free. However, it is not true, Retained earnings involve anopportunity cost. From shareholder’s point of view, the opportunity cost of retained earnings is the rate ofreturn that they can obtain by Investing after tax dividend in the similar securities, if earnings are paid to thornas dividend in cash. The following adjustments are made while computing cost of retained earnings.
(i) Income Tax: An individual pays income tax on dividend hence he would only be able to investthe amount remained after paying individual income lax on such earnings. Similarly, an individualalso pays tax on capital gain. Hence, adjustment of income tax is made.(ii) Brokerage, Commission etc.: When the amount of dividend is invested, some expenses likebrokerage commission etc. are incurred by the investor. These expenses are deducted from investedamount.
The following formulae may be used for computation of cost of retained earnings:Cr = Ce (I–Tp) (I–B)
OR
Cr = DPS (I-Tp) (I-B) 100
MPS
OR
Cr = EPS (I-Tp) (I-B) 100
MPS
OR
Cr = DPS 100 + G [(1-Tp)(1-B)]MPS
Where :Cr = Cost of Retained Earnings
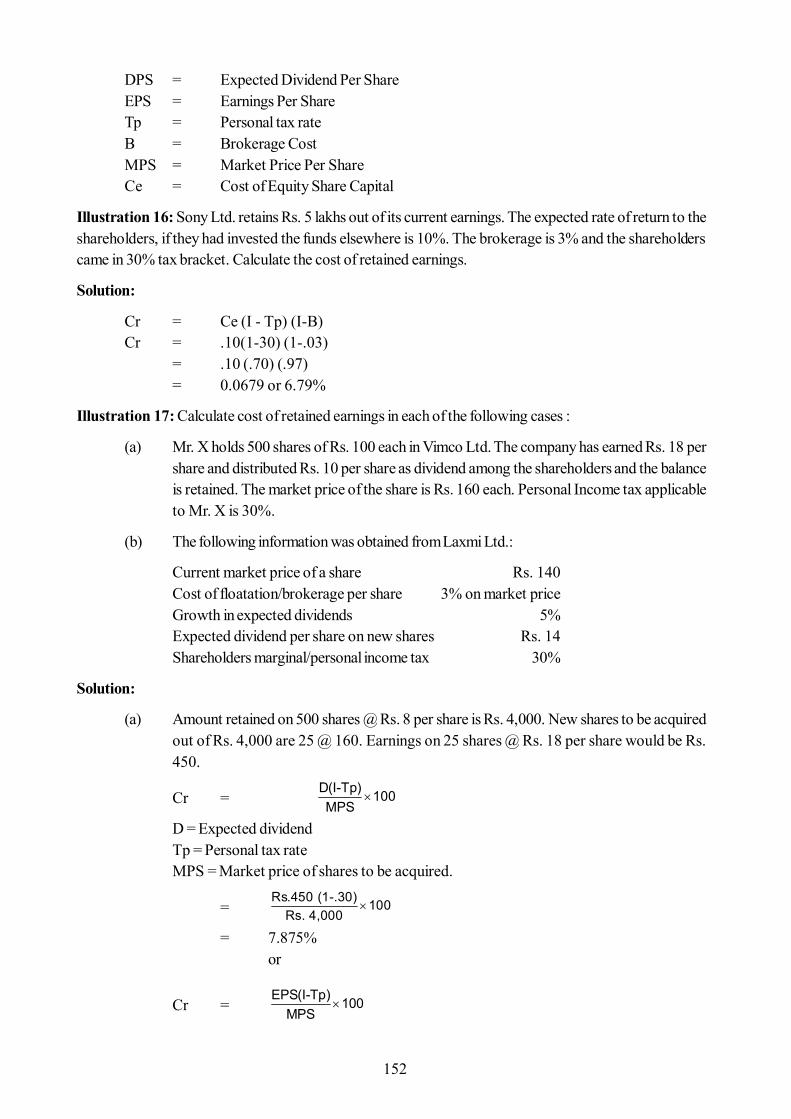
152
DPS = Expected Dividend Per ShareEPS = Earnings Per ShareTp = Personal tax rateB = Brokerage CostMPS = Market Price Per ShareCe = Cost of Equity Share Capital
Illustration 16: Sony Ltd. retains Rs. 5 lakhs out of its current earnings. The expected rate of return to theshareholders, if they had invested the funds elsewhere is 10%. The brokerage is 3% and the shareholderscame in 30% tax bracket. Calculate the cost of retained earnings.
Solution:
Cr = Ce (I - Tp) (I-B)Cr = .10(1-30) (1-.03)
= .10 (.70) (.97)= 0.0679 or 6.79%
Illustration 17: Calculate cost of retained earnings in each of the following cases :
(a) Mr. X holds 500 shares of Rs. 100 each in Vimco Ltd. The company has earned Rs. 18 pershare and distributed Rs. 10 per share as dividend among the shareholders and the balanceis retained. The market price of the share is Rs. 160 each. Personal Income tax applicableto Mr. X is 30%.
(b) The following information was obtained from Laxmi Ltd.:
Current market price of a share Rs. 140Cost of floatation/brokerage per share 3% on market priceGrowth in expected dividends 5%Expected dividend per share on new shares Rs. 14Shareholders marginal/personal income tax 30%
Solution:
(a) Amount retained on 500 shares @ Rs. 8 per share is Rs. 4,000. New shares to be acquiredout of Rs. 4,000 are 25 @ 160. Earnings on 25 shares @ Rs. 18 per share would be Rs.450.
Cr = D(I-Tp) 100
MPS
D = Expected dividendTp = Personal tax rateMPS = Market price of shares to be acquired.
= Rs.450 (1-.30) 100
Rs. 4,000
= 7.875%or
Cr = EPS(I-Tp) 100
MPS
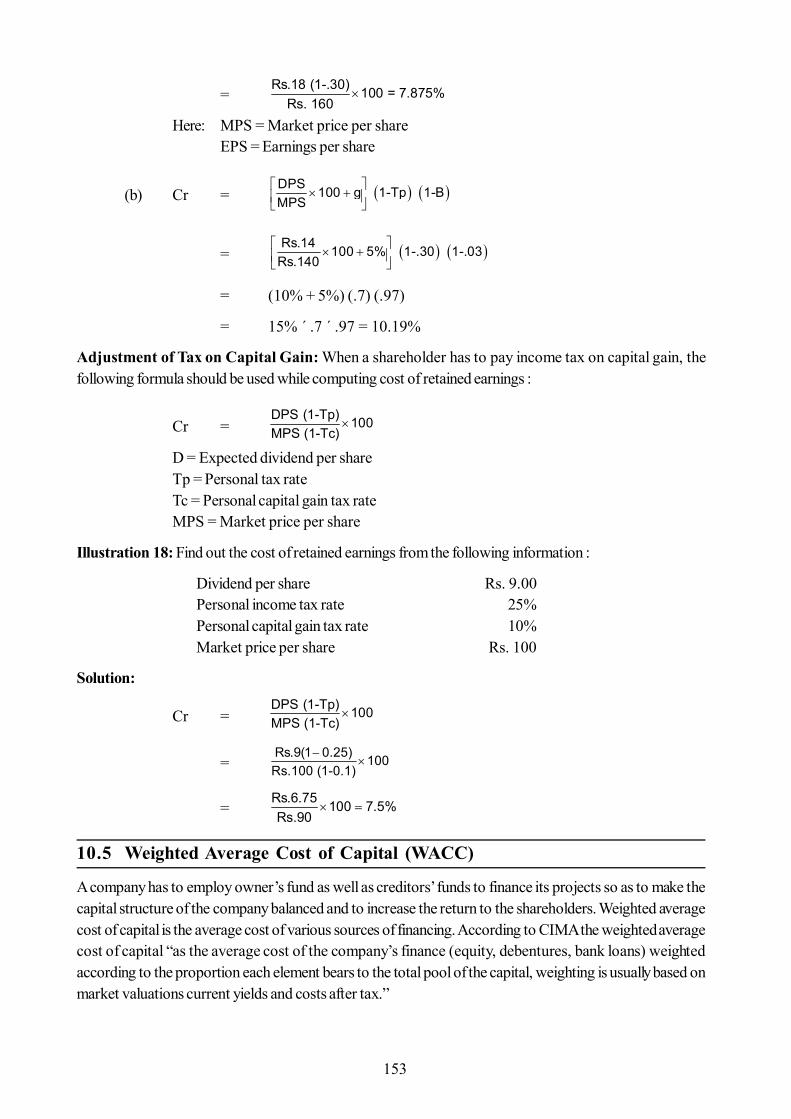
153
= Rs.18 (1-.30) 100 = 7.875%
Rs. 160
Here: MPS = Market price per shareEPS = Earnings per share
(b) Cr = DPS 100 g 1-Tp 1-B
MPS
= Rs.14 100 5% 1-.30 1-.03
Rs.140
= (10% + 5%) (.7) (.97)
= 15% ´ .7 ´ .97 = 10.19%
Adjustment of Tax on Capital Gain: When a shareholder has to pay income tax on capital gain, thefollowing formula should be used while computing cost of retained earnings :
Cr =
DPS (1-Tp) 100MPS (1-Tc)
D = Expected dividend per shareTp = Personal tax rateTc = Personal capital gain tax rateMPS = Market price per share
Illustration 18: Find out the cost of retained earnings from the following information :
Dividend per share Rs. 9.00Personal income tax rate 25%Personal capital gain tax rate 10%Market price per share Rs. 100
Solution:
Cr =
DPS (1-Tp) 100MPS (1-Tc)
=
Rs.9(1 0.25) 100Rs.100 (1-0.1)
=
Rs.6.75 100 7.5%Rs.90
10.5 Weighted Average Cost of Capital (WACC)
A company has to employ owner’s fund as well as creditors’ funds to finance its projects so as to make thecapital structure of the company balanced and to increase the return to the shareholders. Weighted averagecost of capital is the average cost of various sources of financing. According to CIMA the weighted averagecost of capital “as the average cost of the company’s finance (equity, debentures, bank loans) weightedaccording to the proportion each element bears to the total pool of the capital, weighting is usually based onmarket valuations current yields and costs after tax.”
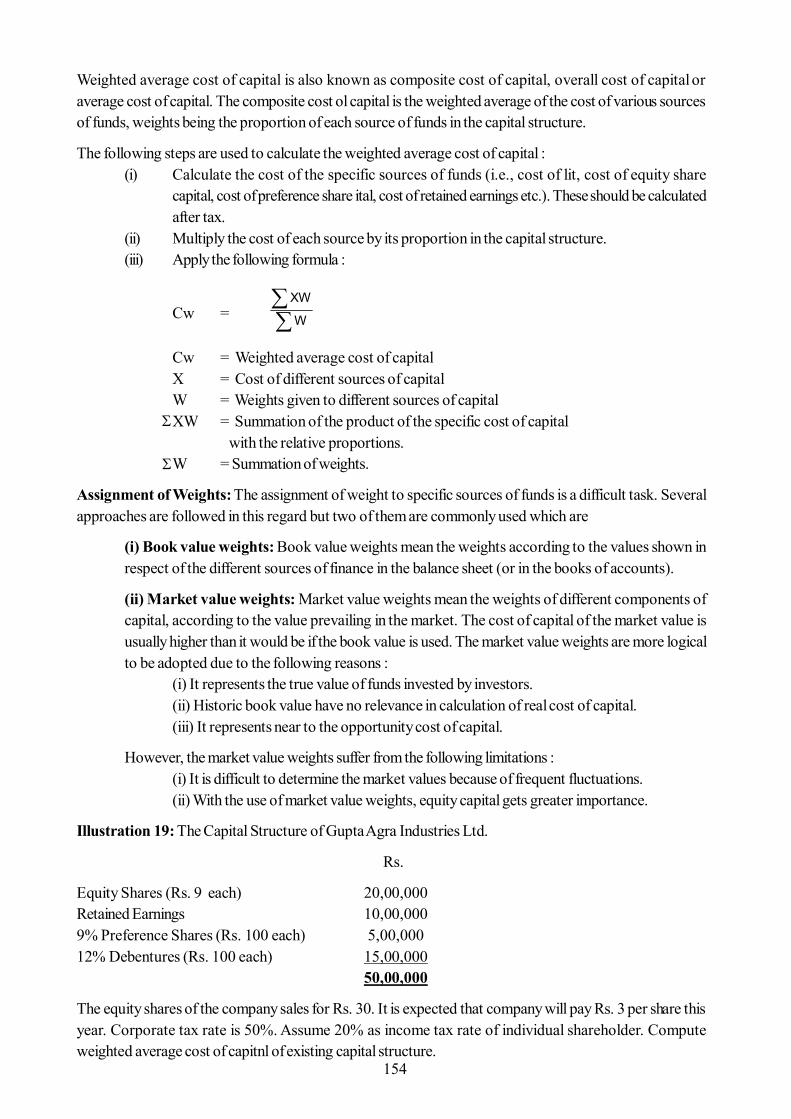
154
Weighted average cost of capital is also known as composite cost of capital, overall cost of capital oraverage cost of capital. The composite cost ol capital is the weighted average of the cost of various sourcesof funds, weights being the proportion of each source of funds in the capital structure.
The following steps are used to calculate the weighted average cost of capital :(i) Calculate the cost of the specific sources of funds (i.e., cost of lit, cost of equity share
capital, cost of preference share ital, cost of retained earnings etc.). These should be calculatedafter tax.
(ii) Multiply the cost of each source by its proportion in the capital structure.(iii) Apply the following formula :
Cw =
XW
W
Cw = Weighted average cost of capitalX = Cost of different sources of capitalW = Weights given to different sources of capitalXW = Summation of the product of the specific cost of capital
with the relative proportions.W = Summation of weights.
Assignment of Weights: The assignment of weight to specific sources of funds is a difficult task. Severalapproaches are followed in this regard but two of them are commonly used which are
(i) Book value weights: Book value weights mean the weights according to the values shown inrespect of the different sources of finance in the balance sheet (or in the books of accounts).
(ii) Market value weights: Market value weights mean the weights of different components ofcapital, according to the value prevailing in the market. The cost of capital of the market value isusually higher than it would be if the book value is used. The market value weights are more logicalto be adopted due to the following reasons :
(i) It represents the true value of funds invested by investors.(ii) Historic book value have no relevance in calculation of real cost of capital.(iii) It represents near to the opportunity cost of capital.
However, the market value weights suffer from the following limitations :(i) It is difficult to determine the market values because of frequent fluctuations.(ii) With the use of market value weights, equity capital gets greater importance.
Illustration 19: The Capital Structure of Gupta Agra Industries Ltd.
Rs.
Equity Shares (Rs. 9 each) 20,00,000Retained Earnings 10,00,0009% Preference Shares (Rs. 100 each) 5,00,00012% Debentures (Rs. 100 each) 15,00,000
50,00,000
The equity shares of the company sales for Rs. 30. It is expected that company will pay Rs. 3 per share thisyear. Corporate tax rate is 50%. Assume 20% as income tax rate of individual shareholder. Computeweighted average cost of capitnl of existing capital structure.
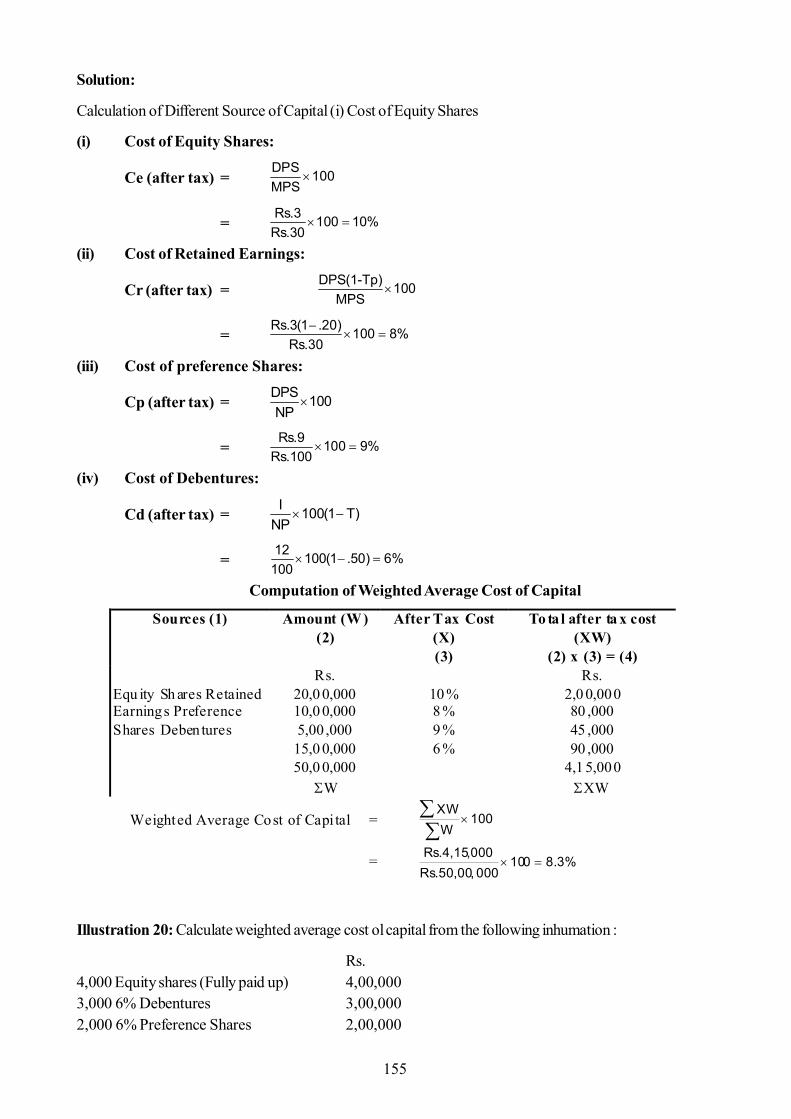
155
Solution:
Calculation of Different Source of Capital (i) Cost of Equity Shares
(i) Cost of Equity Shares:
Ce (after tax) =
DPS 100MPS
=
Rs.3 100 10%
Rs.30(ii) Cost of Retained Earnings:
Cr (after tax) =
DPS(1-Tp) 100
MPS
=
Rs.3(1 .20) 100 8%
Rs.30(iii) Cost of preference Shares:
Cp (after tax) =
DPS 100NP
=
Rs.9 100 9%
Rs.100(iv) Cost of Debentures:
Cd (after tax) =
I 100(1 T)
NP
=
12 100(1 .50) 6%
100Computation of Weighted Average Cost of Capital
Illustration 20: Calculate weighted average cost ol capital from the following inhumation :
Rs.4,000 Equity shares (Fully paid up) 4,00,0003,000 6% Debentures 3,00,0002,000 6% Preference Shares 2,00,000
Sources (1) Amount (W) (2)
After Tax Cost (X) (3)
To ta l after ta x cost (XW)
(2) x (3) = (4) Equ ity Sh ares Retained Earnings Preference Shares Deben tures
Rs. 20,0 0,000 10,0 0,000 5,00 ,000
15,0 0,000
10 % 8 % 9 % 6 %
Rs. 2,0 0,000 80 ,000 45 ,000 90 ,000
50,0 0,000 W
4,1 5,000 XW
Weighted Average Cost of Capi tal =
XW100
W
= Rs.4,15,000
100 8.3%Rs.50,00, 000
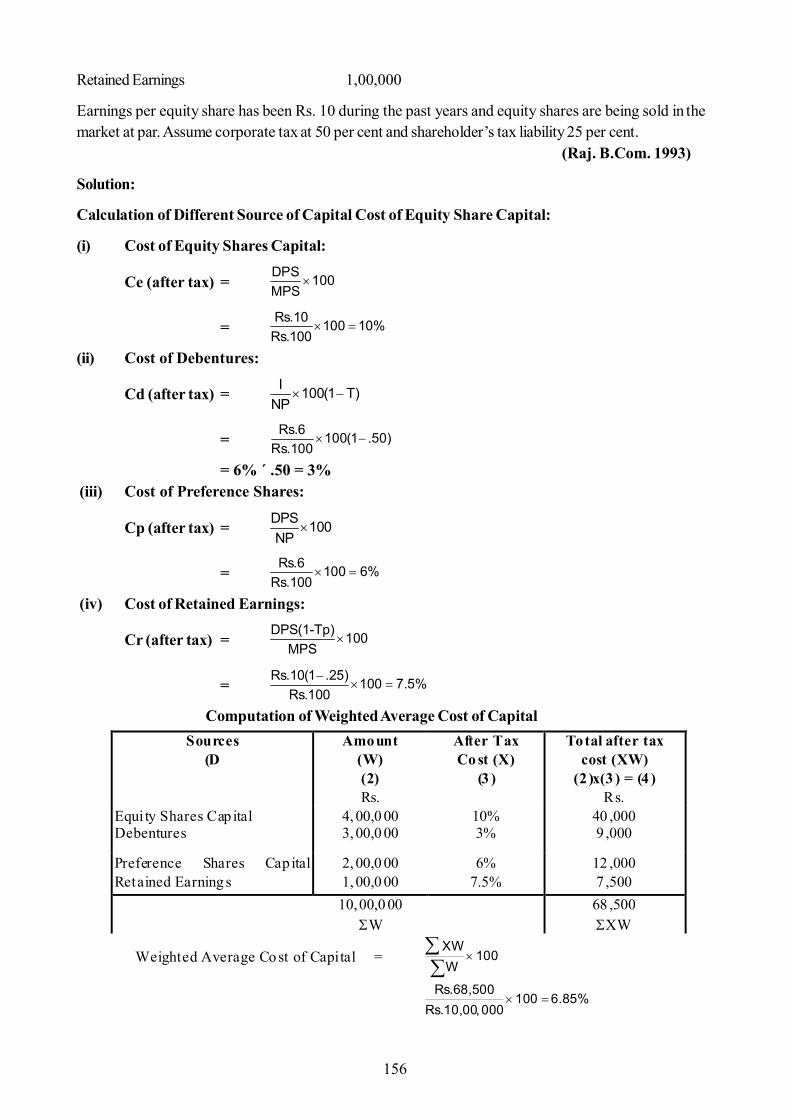
156
Retained Earnings 1,00,000
Earnings per equity share has been Rs. 10 during the past years and equity shares are being sold in themarket at par. Assume corporate tax at 50 per cent and shareholder’s tax liability 25 per cent.
(Raj. B.Com. 1993)
Solution:
Calculation of Different Source of Capital Cost of Equity Share Capital:
(i) Cost of Equity Shares Capital:
Ce (after tax) =
DPS 100MPS
=
Rs.10 100 10%
Rs.100(ii) Cost of Debentures:
Cd (after tax) =
I 100(1 T)
NP
=
Rs.6 100(1 .50)
Rs.100= 6% ´ .50 = 3%
(iii) Cost of Preference Shares:
Cp (after tax) =
DPS 100NP
=
Rs.6 100 6%
Rs.100 (iv) Cost of Retained Earnings:
Cr (after tax) =
DPS(1-Tp) 100
MPS
=
Rs.10(1 .25) 100 7.5%
Rs.100Computation of Weighted Average Cost of Capital
Sources (D
Amount (W) (2)
After Tax Co st (X)
(3 )
Total after tax cost (XW)
(2 )x(3 ) = (4 ) Rs. Rs. Equi ty Shares Cap ital Debentures
4, 00,0 00 3, 00,0 00
10% 3%
40 ,000 9 ,000
Preference Shares Cap ital Retained Earning s
2, 00,0 00 1, 00,0 00
6% 7.5%
12 ,000 7 ,500
10,00,0 00 W
68 ,500 XW
Weighted Average Co st of Capital =
XW100
W
Rs.68,500
100 6.85%Rs.10,00,000
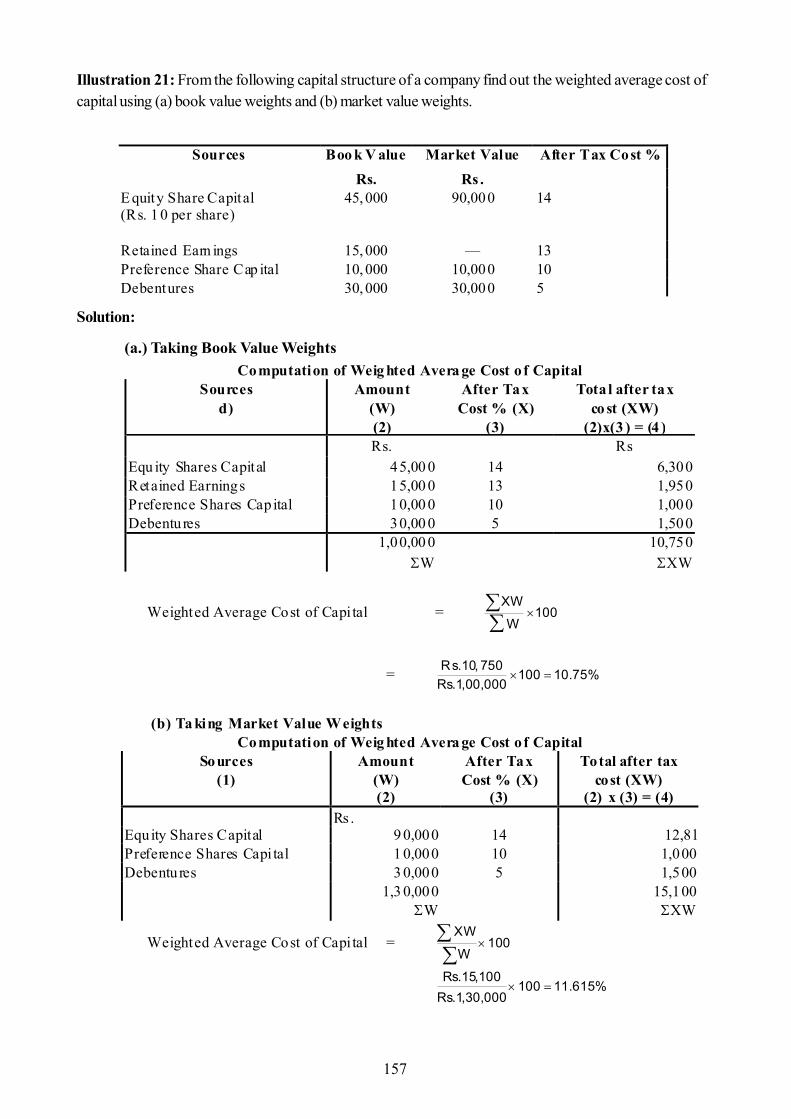
157
Illustration 21: From the following capital structure of a company find out the weighted average cost ofcapital using (a) book value weights and (b) market value weights.
Solution:
(a.) Taking Book Value Weights
Sources Boo k V alue Market Value After Tax Cost % Rs. Rs . E quity Share Capital (Rs. 1 0 per share)
45, 000 90,000 14
Retained Earn ings 15, 000 — 13 Preference Share Cap ital 10, 000 10,000 10 Debentures 30, 000 30,000 5
Computation of Weig hted Avera ge Cost o f Capital Sources
d) Amount
(W) (2)
After Tax Cost % (X)
(3)
Tota l after tax co st (XW)
(2)x(3 ) = (4 ) Rs. Rs Equ ity Shares Capital 45,00 0 14 6,300 Retained Earnings 15,00 0 13 1,950 Preference Shares Capital 10,00 0 10 1,000 Debentures 30,00 0 5 1,500 1,00,00 0
W 10,750
XW
Weighted Average Cost of Capi tal =
XW100
W
= Rs.10, 750
100 10.75%Rs.1,00,000
(b) Ta king Market Value Weights
Computation of Weig hted Avera ge Cost o f Capital Sources
(1) Amount
(W) (2)
After Tax Cost % (X)
(3)
Total after tax cost (XW)
(2) x (3) = (4) Rs . Equity Shares Capital 9 0,000 14 12,8 l Preference Shares Capi tal 1 0,000 10 1,000 Debentures 3 0,000 5 1,500 1,3 0,000
W 15,100
XW
Weighted Average Cost of Capi tal =
XW100
W
Rs.15,100
100 11.615%Rs.1,30,000
158
10.6 Significance of Cost of Capital
The cost of capital is very important concept in financial management. Prior to the development of theconcept of cost of capital the problem was ignored or by passed. The progressive management alwaystakes notice of the cost of capital while taking a financial decision. The concept is quite relevant in thefollowing managerial decisions :
Significance of Cost of Capital:
1. Capital Budgeting Decisions: Cost of capital may be used as the measuring rod for adopting asinvestment proposal. In various methods of capital budgeting cost of capital is the key factor indeciding the project out of various proposals pending before the management. It measures thefinancial performance and determines the acceptability of all investment opportunities by discountingcash flows under present value method. The cost of capital being the minimum rate of return desiredis used to compare with the actual rate of return (internal rate of return). Thus, the cost of capitalprovides the criterion of accepting or rejecting the proposals in capital expenditure decisions.
2. Capital Structure Decisions: While designing an optimal capital structure, the management shouldraise capital from different sources in such a way that it optimizes the risk and cost factors. Raisingof loans may be cheaper on account of income tax benefits, but it involves heavy risk because aslight fall in the earning capacity of the company may bring the firm near to cash insolvency. It is,therefore, necessary that cost of cash source of funds is carefully considered and compared withthe risk involved in it.
3. Evaluation of Financial Performance: The cost of capital framework can be used to evaluatethe financial performance of top management. If the actual profitability, of the project is more thanthe projected and the actual cost of capital, the performance may be said to be satisfactory.
4. Allocation of Capital: This concept is very useful in allocation of capital to various investmentproposals. It is the corner stone of the investment decisions. The main goal of financial managementis the wealth maximization of its shareholders. So the company must choose only those investmentopportunities that are financially beneficial to the shareholders.
5. Helpful in Dividend Policy and Working Capital Management: The measurement of the costof capital helps the management in taking decisions relating to dividend policy and working capitalrequirements.
10.7 Problems in Determining Cost of Capital
The determination of cost of capital is not an easy task. The financial manager is confronted with a largenumber of problems. These problems can briefly be summarized as follows :
Problems in Determining Cost of Capital:
1. Conceptual Controversy: There is major controversy whether or not the cost of capital is dependentupon the method and level of financing by the company. According to traditional theorists, a firmcan change its overall cost of capital by changing debt-equity mix. On the other hand, the moderntheorists, reject the traditional view and holds that cost of capital is independent of the method andlevel of financing.
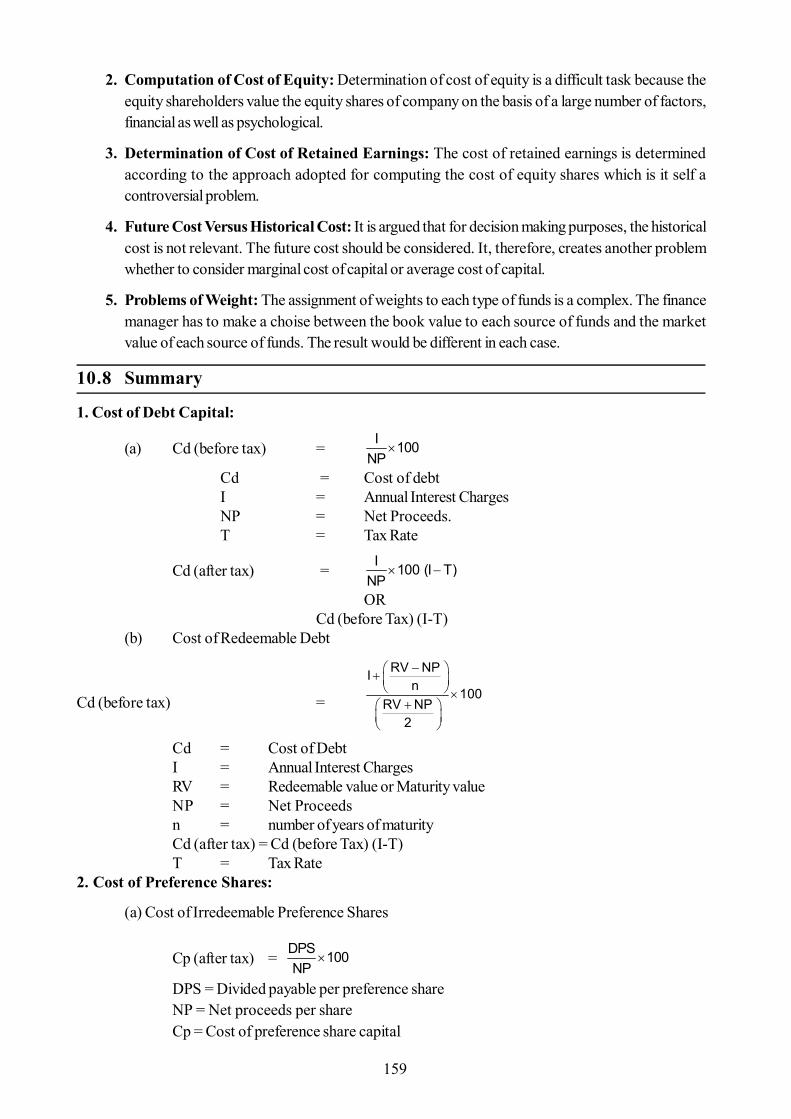
159
2. Computation of Cost of Equity: Determination of cost of equity is a difficult task because theequity shareholders value the equity shares of company on the basis of a large number of factors,financial as well as psychological.
3. Determination of Cost of Retained Earnings: The cost of retained earnings is determinedaccording to the approach adopted for computing the cost of equity shares which is it self acontroversial problem.
4. Future Cost Versus Historical Cost: It is argued that for decision making purposes, the historicalcost is not relevant. The future cost should be considered. It, therefore, creates another problemwhether to consider marginal cost of capital or average cost of capital.
5. Problems of Weight: The assignment of weights to each type of funds is a complex. The financemanager has to make a choise between the book value to each source of funds and the marketvalue of each source of funds. The result would be different in each case.
10.8 Summary
1. Cost of Debt Capital:
(a) Cd (before tax) =
I 100
NPCd = Cost of debtI = Annual Interest ChargesNP = Net Proceeds.T = Tax Rate
Cd (after tax) =
I 100 (I T)
NPOR
Cd (before Tax) (I-T)(b) Cost of Redeemable Debt
Cd (before tax) =
RV NPIn 100
RV NP2
Cd = Cost of DebtI = Annual Interest ChargesRV = Redeemable value or Maturity valueNP = Net Proceedsn = number of years of maturityCd (after tax) = Cd (before Tax) (I-T)T = Tax Rate
2. Cost of Preference Shares:
(a) Cost of Irredeemable Preference Shares
Cp (after tax) = DPS 100NP
DPS = Divided payable per preference shareNP = Net proceeds per shareCp = Cost of preference share capital
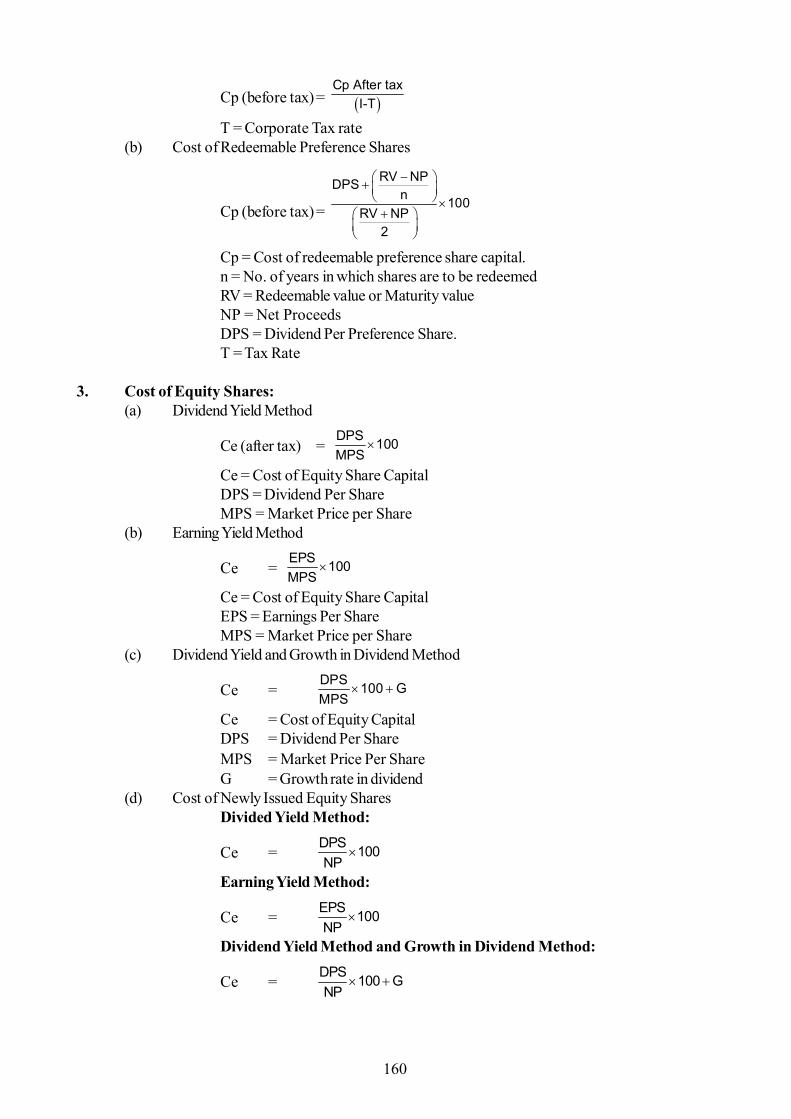
160
Cp (before tax)=
Cp After tax
I-T
T = Corporate Tax rate(b) Cost of Redeemable Preference Shares
Cp (before tax)=
RV NPDPSn 100
RV NP2
Cp = Cost of redeemable preference share capital.n = No. of years in which shares are to be redeemedRV = Redeemable value or Maturity valueNP = Net ProceedsDPS = Dividend Per Preference Share.T = Tax Rate
3. Cost of Equity Shares:(a) Dividend Yield Method
Ce (after tax) = DPS 100MPS
Ce = Cost of Equity Share CapitalDPS = Dividend Per ShareMPS = Market Price per Share
(b) Earning Yield Method
Ce = EPS 100MPS
Ce = Cost of Equity Share CapitalEPS = Earnings Per ShareMPS = Market Price per Share
(c) Dividend Yield and Growth in Dividend Method
Ce = DPS 100 GMPS
Ce = Cost of Equity CapitalDPS = Dividend Per ShareMPS = Market Price Per ShareG = Growth rate in dividend
(d) Cost of Newly Issued Equity SharesDivided Yield Method:
Ce = DPS 100NP
Earning Yield Method:
Ce = EPS 100NP
Dividend Yield Method and Growth in Dividend Method:
Ce = DPS 100 GNP
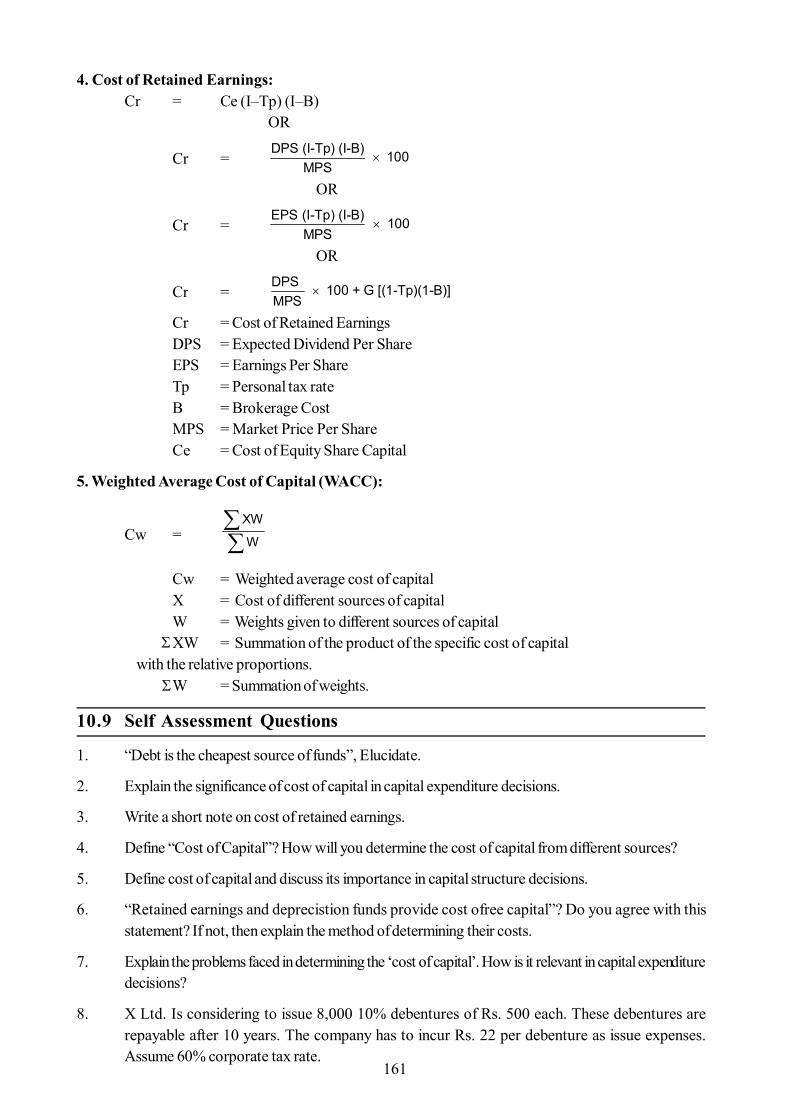
161
4. Cost of Retained Earnings:Cr = Ce (I–Tp) (I–B)
OR
Cr = DPS (I-Tp) (I-B) 100
MPS
OR
Cr = EPS (I-Tp) (I-B) 100
MPS
OR
Cr = DPS 100 + G [(1-Tp)(1-B)]MPS
Cr = Cost of Retained EarningsDPS = Expected Dividend Per ShareEPS = Earnings Per ShareTp = Personal tax rateB = Brokerage CostMPS = Market Price Per ShareCe = Cost of Equity Share Capital
5. Weighted Average Cost of Capital (WACC):
Cw =
XW
W
Cw = Weighted average cost of capitalX = Cost of different sources of capitalW = Weights given to different sources of capitalXW = Summation of the product of the specific cost of capital
with the relative proportions.W = Summation of weights.
10.9 Self Assessment Questions
1. “Debt is the cheapest source of funds”, Elucidate.
2. Explain the significance of cost of capital in capital expenditure decisions.
3. Write a short note on cost of retained earnings.
4. Define “Cost of Capital”? How will you determine the cost of capital from different sources?
5. Define cost of capital and discuss its importance in capital structure decisions.
6. “Retained earnings and deprecistion funds provide cost ofree capital”? Do you agree with thisstatement? If not, then explain the method of determining their costs.
7. Explain the problems faced in determining the ‘cost of capital’. How is it relevant in capital expendituredecisions?
8. X Ltd. Is considering to issue 8,000 10% debentures of Rs. 500 each. These debentures arerepayable after 10 years. The company has to incur Rs. 22 per debenture as issue expenses.Assume 60% corporate tax rate.
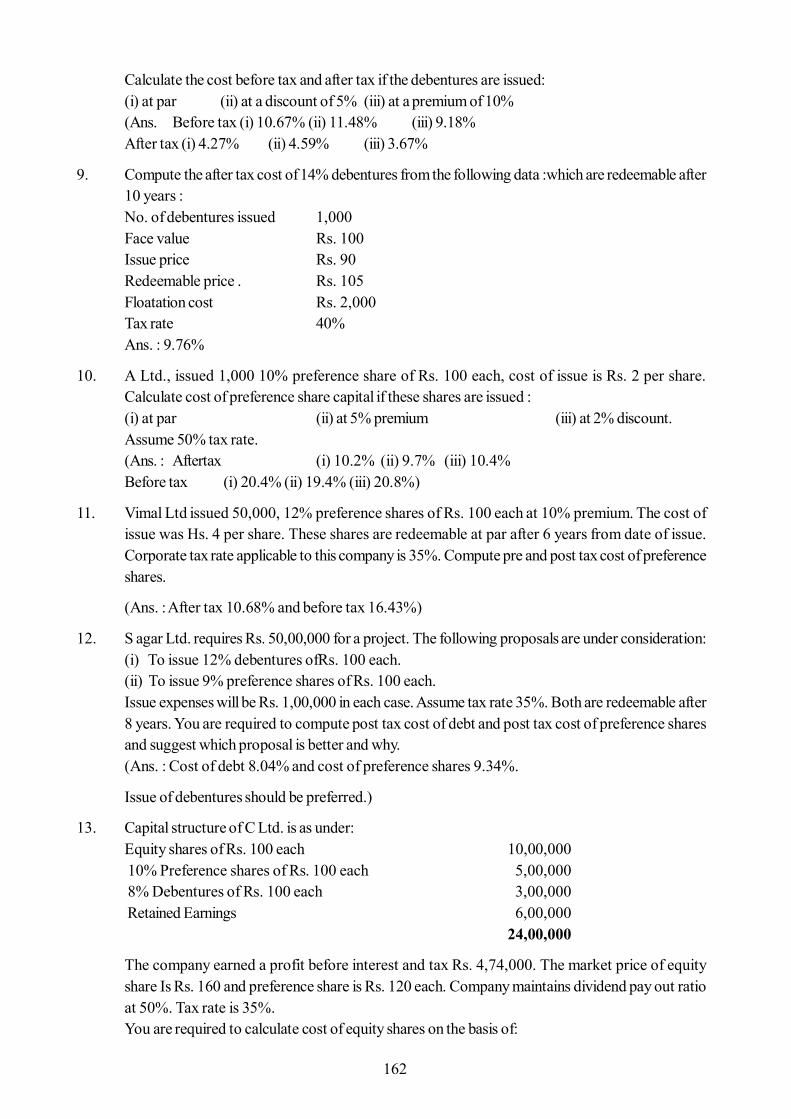
162
Calculate the cost before tax and after tax if the debentures are issued:(i) at par (ii) at a discount of 5% (iii) at a premium of 10%(Ans. Before tax (i) 10.67% (ii) 11.48% (iii) 9.18%After tax (i) 4.27% (ii) 4.59% (iii) 3.67%
9. Compute the after tax cost of 14% debentures from the following data :which are redeemable after10 years :No. of debentures issued 1,000Face value Rs. 100Issue price Rs. 90Redeemable price . Rs. 105Floatation cost Rs. 2,000Tax rate 40%Ans. : 9.76%
10. A Ltd., issued 1,000 10% preference share of Rs. 100 each, cost of issue is Rs. 2 per share.Calculate cost of preference share capital if these shares are issued :(i) at par (ii) at 5% premium (iii) at 2% discount.Assume 50% tax rate.(Ans. : Aftertax (i) 10.2% (ii) 9.7% (iii) 10.4%Before tax (i) 20.4% (ii) 19.4% (iii) 20.8%)
11. Vimal Ltd issued 50,000, 12% preference shares of Rs. 100 each at 10% premium. The cost ofissue was Hs. 4 per share. These shares are redeemable at par after 6 years from date of issue.Corporate tax rate applicable to this company is 35%. Compute pre and post tax cost of preferenceshares.
(Ans. : After tax 10.68% and before tax 16.43%)
12. S agar Ltd. requires Rs. 50,00,000 for a project. The following proposals are under consideration:(i) To issue 12% debentures ofRs. 100 each.(ii) To issue 9% preference shares of Rs. 100 each.Issue expenses will be Rs. 1,00,000 in each case. Assume tax rate 35%. Both are redeemable after8 years. You are required to compute post tax cost of debt and post tax cost of preference sharesand suggest which proposal is better and why.(Ans. : Cost of debt 8.04% and cost of preference shares 9.34%.
Issue of debentures should be preferred.)
13. Capital structure of C Ltd. is as under:Equity shares of Rs. 100 each 10,00,000 10% Preference shares of Rs. 100 each 5,00,000 8% Debentures of Rs. 100 each 3,00,000 Retained Earnings 6,00,000
24,00,000
The company earned a profit before interest and tax Rs. 4,74,000. The market price of equityshare Is Rs. 160 and preference share is Rs. 120 each. Company maintains dividend pay out ratioat 50%. Tax rate is 35%.You are required to calculate cost of equity shares on the basis of:
163
(i) Earnings Yield Method,(ii) Dividend Yield Method. (Ans. : After tax (i) 15.16% (ii) 8.08%)
14. The average rate of dividend paid by Anima Ltd. for the last five years is 21%. The earnings of thecompany have recorded a growth rate of 3% per annum. The market value of the equity shares isestimated to be Rs. 105. Find out the cost of equity share capital.
(Ans. : 23%)
15. From the following information find out cost of retained earnings:Dividend per share Rs. 3Personal income tax rate 30%Personal Capital gain tax rate 20%Market price per share Rs. 25Brokerage on investment of dividend 3%(Ans. 10.185%)
16. Ashutosh Limited company has the following capital structure :fc,Equity Shares (Rs. 10 each) 4,00,000Retained Earnings 2,00,0009% Preference share capital (Rs. 100 each) 1,00,00012% Debentures (Rs. 100 each) 3,00,000
10,00,000
The equity shares of the company sales for Rs. 25. It is expected that company will pay dividend ofRs. 2 per share this year. Corporate tax rate is 50%. Assume 25% as income tax rate of individualshareholders. Calculate the weighted average cost of capital.
(Ans. : 7.1%)
17. PawanManufacturers Ltd. has total assets of Rs. 16,00,000 which has been financed with Rs.5,20,000 of debt, Rs,, 9,00,000 of equity share capital and Rs. 1,80,000 of general reserve.Company’s current year profit before interest and tax is Rs. 1,35,000. It pays 8% interest onborrowed funds. Company has 9,000 equity shares of Rs. 100 each selling at a market price of Rs.120 per share. Tax rate for the company is 35%.You are required to compute weighted average cost of capital.(Ans. : 10.1275%)
10.10 Reference Books
- Khan & Jain : Financial Management, Tata Mc Graw Hill Co.
- Bierman, H. and Smidt., S. : Capital Budgeting Decisions, MacMillan
- S. N. Maheshwari : Financial Management, Sultan Chand & Co.
- Ravi, M. Kishore : Financial Management, Taxmann’s Publications
- Van Horne, J.C.: Financial Management & Policy, Prantice Hall
- Lawrence, D. Sohall & Chanles W. Haley: Introduction to Financial Management, Tata Mc GrawHill

164
- Kuchhal, S.C.; Financial Planning An Analytical Approach, Chaitanya Publishing House
- Ramchandaran, H. : Financial Planning & Control, S. Chand & Co.
- Agarwal & Agarwal : Financial Management, Ramesh Book Depot, Jaipur
- Malodia, G. L. : Financial Management, Jodhpur Publishing House, Jodhpur
165
Unit - 11 : Capital Budgeting
Structure of Unit:
11.0 Objectives11.1 Introduction11.2 Meaning and Definition of Capital Budgeting11.3 Characteristics of Capital Budgeting11.4 Need and Significance of Capital Budgeting11.5 Capital Budgeting Process11.6 Components of Capital Budgeting11.7 Capital Budgeting Techniques
11.7.1 Traditional Techniques11.7.2 Discounted Cash flow Techniques
11.8 Comparison of Net Present Value and Internal Rate of Return11.9 Summary11.10 Self Assessment Questions11.11 Reference Books
11.0 Objectives
After completing this unit, you would be able to:
Meaning and Definition of Capital Budgeting Characteristics of Capital Budgeting Need and Significance of Capital Budgeting Capital Budgeting Process Components of Capital Budgeting Capital Budgeting Techniques Traditional Techniques and Discounted Cash flow Techniques : Comparison of Net Present Value and Internal Rate of Return
11.1 Introduction
Capital budgeting is the process of making investment decisions in capital expenditures. A capital expendituremay be defined as an expenditure the benefit of which are expected to be received over period of timeexceeding one year. Capital budgeting deals exclusively with major investment proposals which are essentiallylong term projects and is concerned with the allocation of firm’s scarce financial resources among theavailable market opportunities. It is many sided activity which includes a search for new and more profitableinvestment proposals and the making of an economic analysis to determine the profit potential of eachinvestment proposal. Capital budgeting is also known as capital expenditure decisions. Long term investmentdecisions, management of fixed assets etc.
11.2 Meaning and Definition of Capital Budgeting
Capital budgeting may be defined as the decision making process by which a firm evaluates the purchase ofmajor fixed assets including land, building, plant and machinery, equipments. It refers to long term planningprocess that involves investing the firm’s resources for a period longer than a year. Some important definitions
166
are as follows :
“Capital budgeting is long term planning for making and financing proposed capital outlay”.Charles T. Horngren
“Capital budgeting consists in planning the development of available capital for the purpose of maximisingthe long term profitability (return on investment) of the firm”.
R. M. Lynch
“Capital budgeting involves the planning of expenditures for assets, the returns from which will be realised infuture time periods”. Milton H. Spencer
“Capital budgeting is concerned with the allocation of the firm’s scarce financial resources among the availablemarket opportunities. The consideration of investment opportunities involves the comparison of the expectedfuture streams of earnings from a project, with the immediate and subsequent expenditures for it”.
G.C. Phillippats
“The capital budgeting is essentially a list of what management relieves to be worth while projects for theacquisition of new capital assets together with the estimated cost of each project.”
Robert N. Anthony
“The capital expenditure budget represents the plans for the appropriations and expenditures for fixedassets during the budget period. Keller & Ferrara
Conclusion: Capital budgeting is long term planning for making and financing proposed capital outlay. It isa process by which available resources are allocated among competitive long term investment opportunitiesso as to promote the greatest profitability of a firm over a period of time. It refers to the total process ofgenerating, evaluating, selecting and following up on capital expenditure alternatives.
11.3 Characteristics of Capital Budgeting
The main characteristics of capital budgeting are as follows :
(1) Capital budgeting is concerned with expenditure of capital nature.
(2) Capital budgeting deals with benefits over a number of years future.
(3) Capital expenditure plans involve a huge investment in I assets.
(4) Capital expenditure once approved represents long I investment that can not be reversed orwithdrawn without sub staining a loss.
(5) Any error in evaluation of investment projects may lead to sum consequences.
11.4 Need and Significance of Capital Budgeting
Capital budgeting decisions are of paramount importance in financial decision making. These decisions arerelated with fixed assets which in generating earnings of the firm. These decisions are the most crucial andcritical and they have significant impact on the profitability aspect of the firm. Capital expenditure decisionshave placed greater emphasis due following :
Need and Significance of Capital Budgeting:
1. Long Term Planning :Capital expenditure is a strategic investment :of some magnitude and is ofa non-routine nature. It has economic life and its benefits continue over series of years.
167
2. Optimum use of Funds :Capital investment decisions require an amount of funds. Capital is ascarce resource of business. So it is essential to utilize capital in such a manner so that wealth of lshareholders may be increased Capital budgeting ensures optimum utilization of larger the business.
3. Analysis of Risk :Capital budgeting helps in analysing the risk involved in various projectsunder consideration. Capital expenditure involve a greater risks as they require huge investment.
4. Replacement Decisions : Capital budgeting helps in taking decisions regarding replacement ofold asset by a new one. The new asset may be useful and profitable for the business. A comparativestudy is made between these options and profitable decisions may be taken.
5. Selection of Best Proposal :Capital budgeting suggest the best proposal available. This is doneby using various modern techniques of capital budgeting
6. Maximization of Profit : Fixed assets generate earnings and require huge investment. Capitalbudgeting decisions ensure the best utilization of fixed assets. Cost control and reduction in costensure maximization of profit of the business.
7. Arrangement of Funds : There are many sources for collecting funds and each has its own costand merits and demerits. Capital budgeting decision helps in determining economic source of capital.
8. Helps in Cash Budgeting : Capital budgeting helps in preparing cash budget of the firm. It ishelpful in forecasting of cash requirements.
9. Protection from Losses : Capital expenditure decisions are not reversible. A wrong decision maybe cause of business failure. Capital budgeting protects from such: may occur due to lack ofknowledge.
10. Control over Capital Expenditure : Capital budgeting helps in controlling the capitalexpenditures. Actual performance may be compared with budgeted results and necessary actionsmay be taken by management.
11. Helps in Formulation of Depreciation Policy :Capital budgeting helps in determining depreciationpolicy of fixed assets. A proper method of depreciation should be adopted to calculate correct costof product and also to reduce tax liability.
11.5 Capital Budgeting Process
Capital budgeting process involves the following steps:
Capital Budgeting Process:
1. Origination of Investment Proposals : The first step in capital budgeting process is the conceptionof a profit making idea. The idea may originate from the top management level taking for longerview in the interest of the company. A periodic review and comparison of earnings, cost, proceduresand product line should be made by the management to facilitate the origination of such idea.
2. Evaluation of Projects : Appraisal of capital projects is important aspect of capital budgeting.Capital appraisal is concerns with evaluating the costs involved in a capital investment proposal andbenefits that accrual from it. The costs and benefits are estimated in the form of cash outflows andcash inflows. This step also involves the selection of an appropriate criterion for judging the desirabilityof the projects.
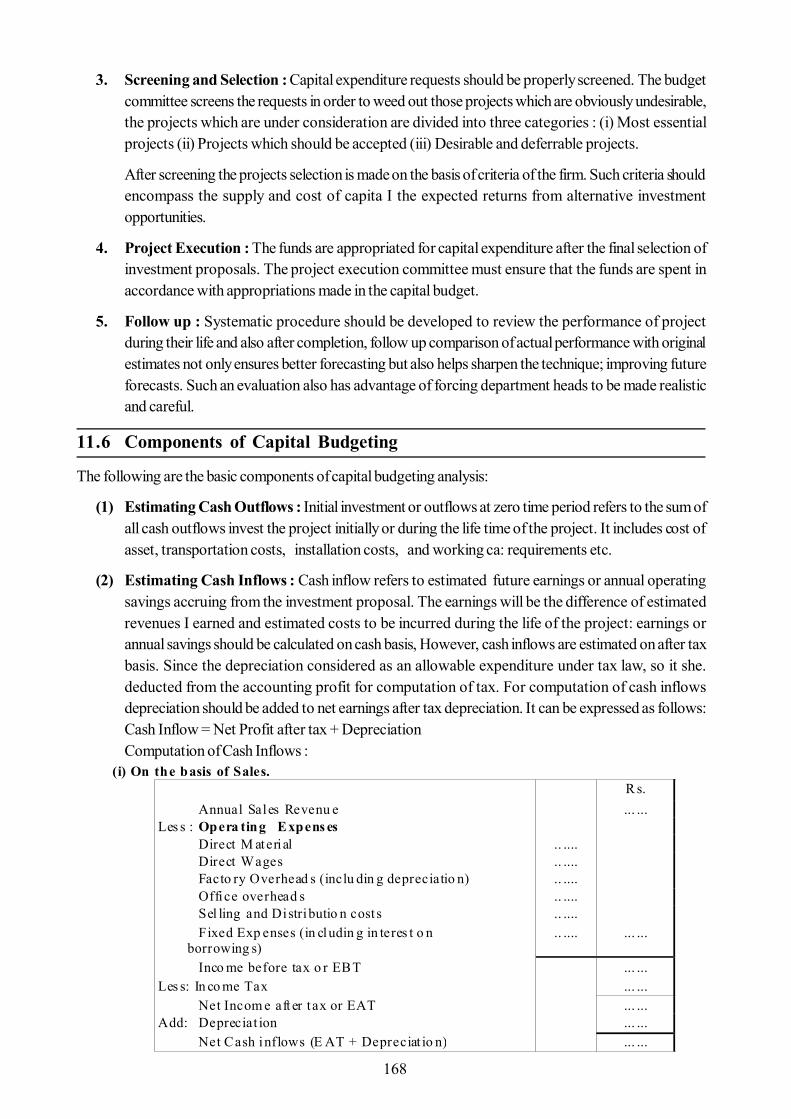
168
3. Screening and Selection : Capital expenditure requests should be properly screened. The budgetcommittee screens the requests in order to weed out those projects which are obviously undesirable,the projects which are under consideration are divided into three categories : (i) Most essentialprojects (ii) Projects which should be accepted (iii) Desirable and deferrable projects.
After screening the projects selection is made on the basis of criteria of the firm. Such criteria shouldencompass the supply and cost of capita I the expected returns from alternative investmentopportunities.
4. Project Execution : The funds are appropriated for capital expenditure after the final selection ofinvestment proposals. The project execution committee must ensure that the funds are spent inaccordance with appropriations made in the capital budget.
5. Follow up : Systematic procedure should be developed to review the performance of projectduring their life and also after completion, follow up comparison of actual performance with originalestimates not only ensures better forecasting but also helps sharpen the technique; improving futureforecasts. Such an evaluation also has advantage of forcing department heads to be made realisticand careful.
11.6 Components of Capital Budgeting
The following are the basic components of capital budgeting analysis:
(1) Estimating Cash Outflows : Initial investment or outflows at zero time period refers to the sum ofall cash outflows invest the project initially or during the life time of the project. It includes cost ofasset, transportation costs, installation costs, and working ca: requirements etc.
(2) Estimating Cash Inflows : Cash inflow refers to estimated future earnings or annual operatingsavings accruing from the investment proposal. The earnings will be the difference of estimatedrevenues I earned and estimated costs to be incurred during the life of the project: earnings orannual savings should be calculated on cash basis, However, cash inflows are estimated on after taxbasis. Since the depreciation considered as an allowable expenditure under tax law, so it she.deducted from the accounting profit for computation of tax. For computation of cash inflowsdepreciation should be added to net earnings after tax depreciation. It can be expressed as follows:Cash Inflow = Net Profit after tax + DepreciationComputation of Cash Inflows :
(i) On the basis of Sales. R s. Annual Sales Revenu e ... ... Les s : Opera ting Expens es Direct M aterial .. .... Direct Wages .. .... Facto ry Overhead s (inclu din g depreciatio n) .. .... Office overhead s .. .... Sel ling and Distributio n cost s .. .... Fixed Exp enses (in cludin g in teres t o n borrowing s)
.. .... ... ...
Inco me before tax o r EBT ... ... Les s: In co me Tax ... ... Net Incom e aft er t ax or EAT ... ... Add: Depreciat ion ... ... Net Cash inflows (E AT + Depreciat io n) ... ...
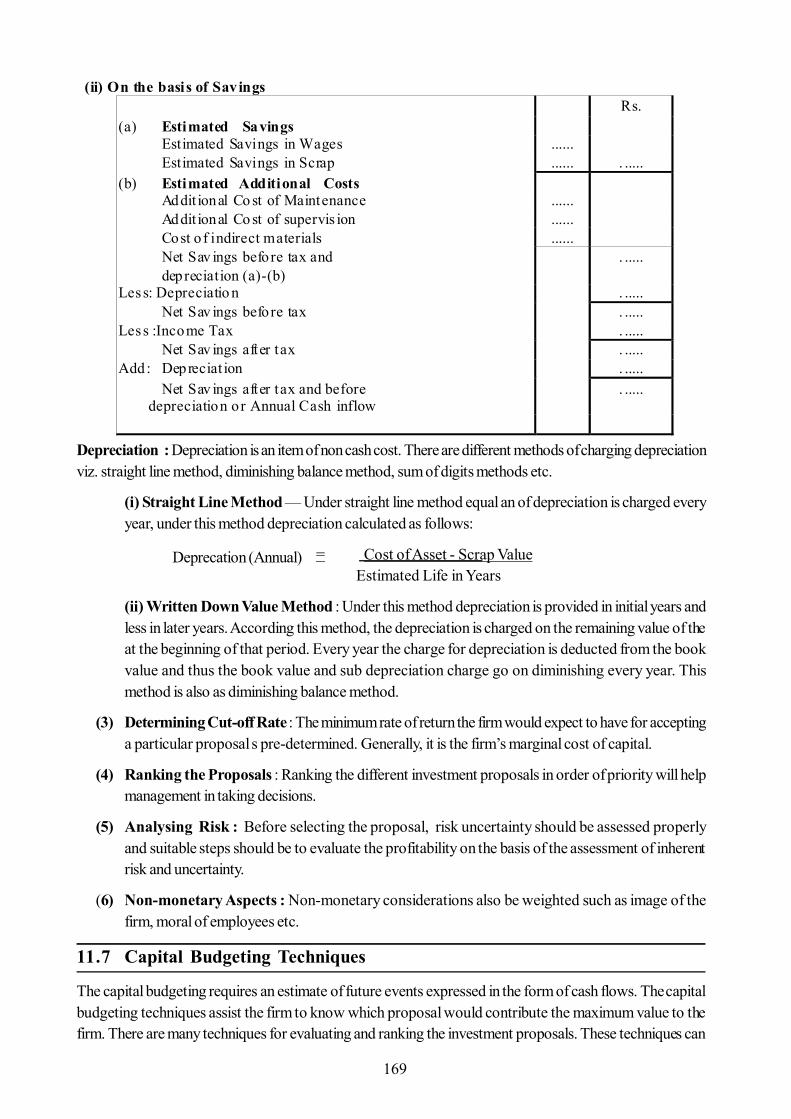
169
Depreciation : Depreciation is an item of non cash cost. There are different methods of charging depreciationviz. straight line method, diminishing balance method, sum of digits methods etc.
(i) Straight Line Method — Under straight line method equal an of depreciation is charged everyyear, under this method depreciation calculated as follows:
= Cost of Asset - Scrap ValueDeprecation (Annual) Estimated Life in Years
(ii) Written Down Value Method : Under this method depreciation is provided in initial years andless in later years. According this method, the depreciation is charged on the remaining value of theat the beginning of that period. Every year the charge for depreciation is deducted from the bookvalue and thus the book value and sub depreciation charge go on diminishing every year. Thismethod is also as diminishing balance method.
(3) Determining Cut-off Rate : The minimum rate of return the firm would expect to have for acceptinga particular proposal s pre-determined. Generally, it is the firm’s marginal cost of capital.
(4) Ranking the Proposals : Ranking the different investment proposals in order of priority will helpmanagement in taking decisions.
(5) Analysing Risk : Before selecting the proposal, risk uncertainty should be assessed properlyand suitable steps should be to evaluate the profitability on the basis of the assessment of inherentrisk and uncertainty.
(6) Non-monetary Aspects : Non-monetary considerations also be weighted such as image of thefirm, moral of employees etc.
11.7 Capital Budgeting Techniques
The capital budgeting requires an estimate of future events expressed in the form of cash flows. The capitalbudgeting techniques assist the firm to know which proposal would contribute the maximum value to thefirm. There are many techniques for evaluating and ranking the investment proposals. These techniques can
(ii) On the basis of Savings Rs. (a) Estimated Savings Estimated Savings in Wages ...... Estimated Savings in Scrap ...... . ..... (b) Estimated Additional Costs Addit ional Co st of Maintenance ...... Addit ional Co st of supervis ion ...... Cost o f indirect materials ...... Net Sav ings before tax and depreciation (a)-(b)
. .....
Less: Depreciatio n . ..... Net Sav ings before tax . ..... Less :Income Tax . ..... Net Sav ings after tax . ..... Add: Depreciat ion . ..... Net Sav ings after tax and before depreciation or Annual Cash inflow
. .....
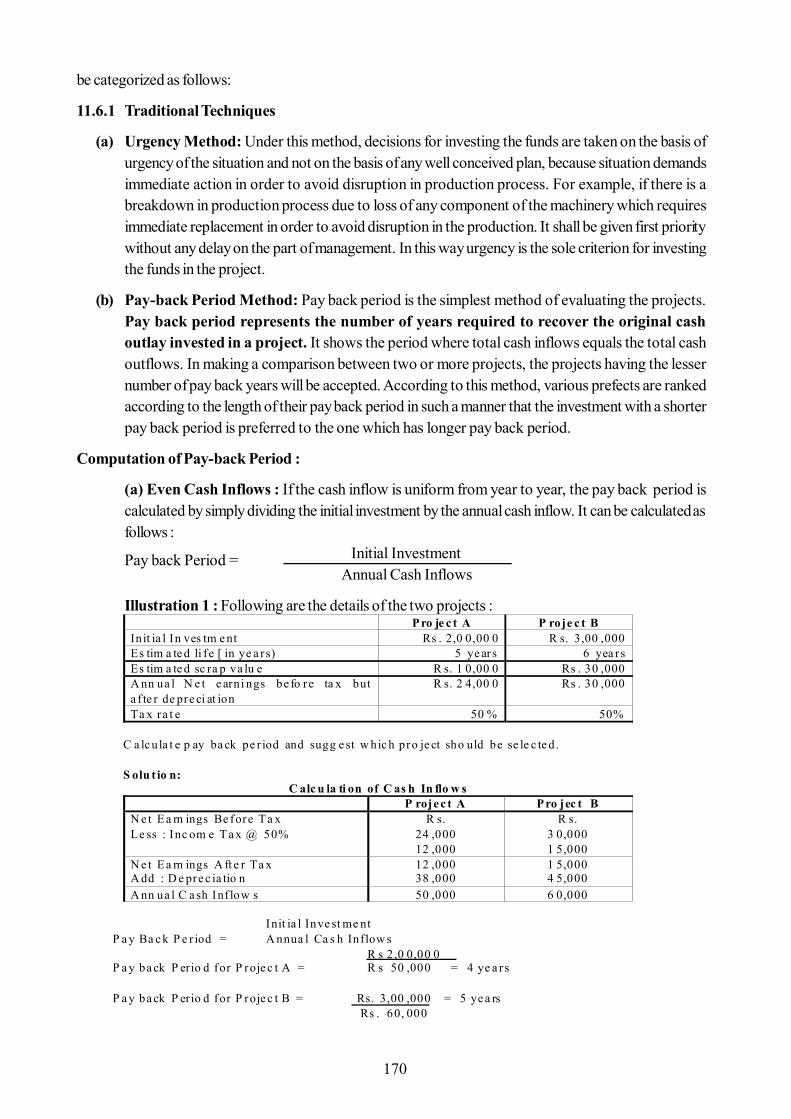
170
be categorized as follows:
11.6.1 Traditional Techniques
(a) Urgency Method: Under this method, decisions for investing the funds are taken on the basis ofurgency of the situation and not on the basis of any well conceived plan, because situation demandsimmediate action in order to avoid disruption in production process. For example, if there is abreakdown in production process due to loss of any component of the machinery which requiresimmediate replacement in order to avoid disruption in the production. It shall be given first prioritywithout any delay on the part of management. In this way urgency is the sole criterion for investingthe funds in the project.
(b) Pay-back Period Method: Pay back period is the simplest method of evaluating the projects.Pay back period represents the number of years required to recover the original cashoutlay invested in a project. It shows the period where total cash inflows equals the total cashoutflows. In making a comparison between two or more projects, the projects having the lessernumber of pay back years will be accepted. According to this method, various prefects are rankedaccording to the length of their pay back period in such a manner that the investment with a shorterpay back period is preferred to the one which has longer pay back period.
Computation of Pay-back Period :
(a) Even Cash Inflows : If the cash inflow is uniform from year to year, the pay back period iscalculated by simply dividing the initial investment by the annual cash inflow. It can be calculated asfollows :
Initial InvestmentPay back Period = Annual Cash Inflows
Illustration 1 : Following are the details of the two projects : Pro je c t A P roje c t B In it ia l In ves tm e nt Rs . 2,0 0,00 0 R s. 3,00 ,000 Es tim a te d li fe [ in ye a rs) 5 ye ars 6 yea rs Es tim a te d sc ra p va lu e R s. 1 0,00 0 Rs . 30 ,000 A nn ua l N e t e arni ngs be fo re ta x but a f te r de pre ci at ion
R s. 2 4,00 0 Rs . 30 ,000
Ta x ra t e 50 % 50% C a lc ula t e p ay ba ck pe r iod and sugg e st w hic h pro je ct sho uld be se le c te d. S olu t io n:
C alc u la ti on of C as h In flo w s P roje c t A Pro jec t B
N e t Ea rn ings Be fore Ta x Le ss : Inc om e Ta x @ 50%
R s. 24 ,000 12 ,000
R s. 3 0,000 1 5,000
N e t Ea rn ings A ft e r Ta x A dd : D e pre c ia tio n
12 ,000 38 ,000
1 5,000 4 5,000
A nn ua l C a sh Inf low s 50 ,000 6 0,000 Init ia l Inve st me nt P a y Ba c k P e r iod = A nnua l Ca s h Inflow s R s 2 ,0 0,00 0 P a y ba ck P erio d for P roje c t A = R s 50 ,000 = 4 ye a rs P a y ba ck P erio d for P roje c t B = Rs. 3,00 ,000 = 5 ye a rs Rs . 60, 000
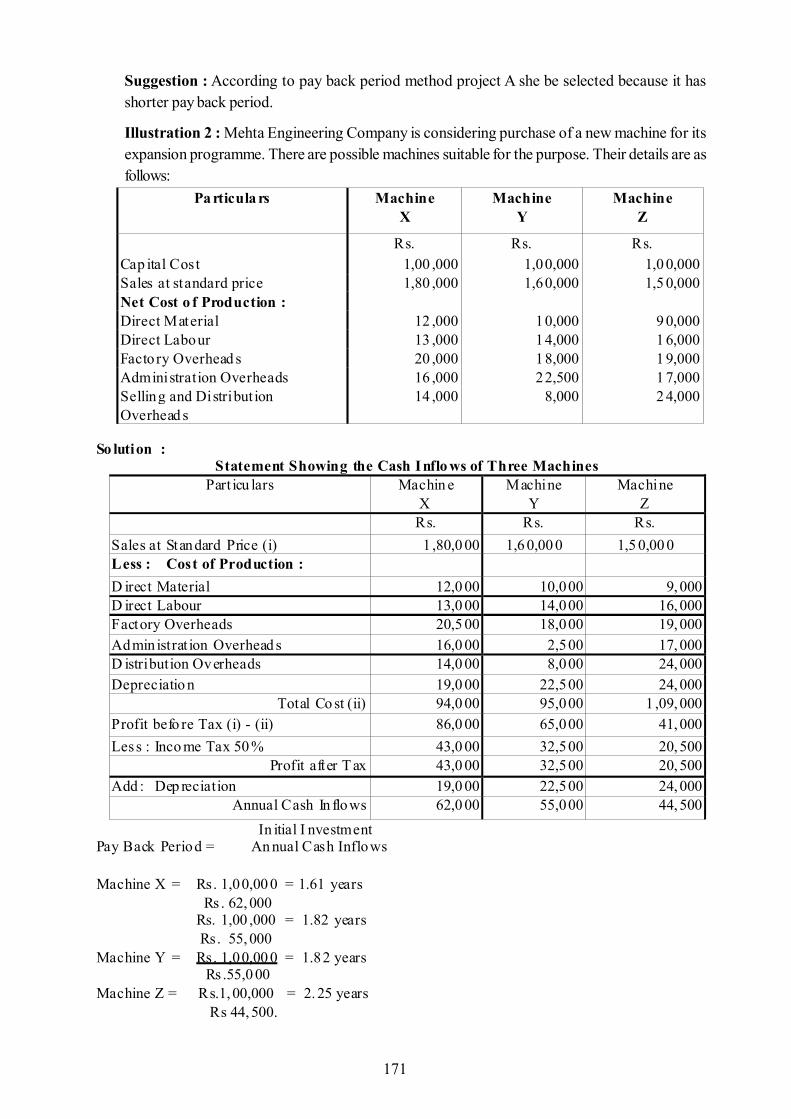
171
Suggestion : According to pay back period method project A she be selected because it hasshorter pay back period.
Illustration 2 : Mehta Engineering Company is considering purchase of a new machine for itsexpansion programme. There are possible machines suitable for the purpose. Their details are asfollows:
Pa rticula rs Machine X
Machine Y
Machine Z
Rs. Rs. Rs. Cap ital Cost 1,00 ,000 1,00,000 1,0 0,000 Sales at standard price 1,80 ,000 1,60,000 1,5 0,000 Net Cost o f Production : Direct Material 12 ,000 10,000 9 0,000 Direct Labour 13 ,000 14,000 1 6,000 Factory Overhead s 20 ,000 18,000 1 9,000 Administration Overheads 16 ,000 22,500 1 7,000 Selling and Distribut ion Overhead s
14 ,000 8,000 2 4,000
So lution :
Statement Showing the Cash Inflo ws of Three Machines Part icu lars Machin e
X Machine
Y Machine
Z Rs. Rs. Rs. Sales at Standard Price (i) 1 ,80,0 00 1,6 0,00 0 1,5 0,00 0 Less : Cost of Production : D irect Material 12,0 00 10,000 9, 000 D irect Labour 13,0 00 14,000 16, 000 Factory Overheads 20,5 00 18,000 19, 000 Administrat ion Overhead s 16,0 00 2,500 17, 000 D istribution Overheads 14,0 00 8,000 24, 000 Depreciatio n 19,0 00 22,500 24, 000
Total Co st (ii) 94,0 00 95,000 1 ,09, 000 Profit befo re Tax (i) - (ii) 86,0 00 65,000 41, 000 Less : Inco me Tax 50 % 43,0 00 32,500 20, 500
Profit after T ax 43,0 00 32,500 20, 500 Add : Dep reciation 19,0 00 22,500 24, 000
Annual Cash In flows 62,0 00 55,000 44, 500 In itial I nvestment
Pay Back Period = An nual Cash Inflows Machine X = Rs. 1,00,00 0 = 1.61 years Rs . 62, 000 Rs. 1,00 ,000 = 1.82 years Rs. 55, 000 Machine Y = Rs. 1,00,00 0 = 1.82 years Rs .55,0 00 Machine Z = Rs.1, 00,000 = 2. 25 years Rs 44, 500.
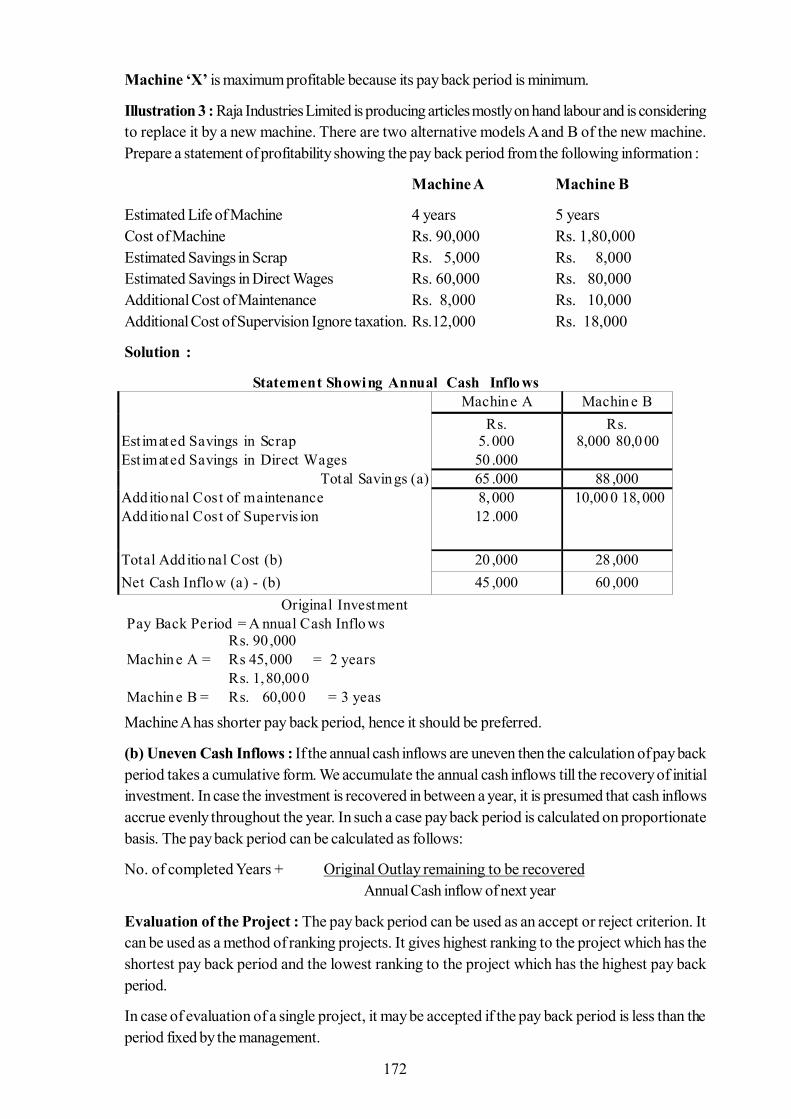
172
Machine ‘X’ is maximum profitable because its pay back period is minimum.
Illustration 3 : Raja Industries Limited is producing articles mostly on hand labour and is consideringto replace it by a new machine. There are two alternative models A and B of the new machine.Prepare a statement of profitability showing the pay back period from the following information :
Machine A Machine B
Estimated Life of Machine 4 years 5 yearsCost of Machine Rs. 90,000 Rs. 1,80,000Estimated Savings in Scrap Rs. 5,000 Rs. 8,000Estimated Savings in Direct Wages Rs. 60,000 Rs. 80,000Additional Cost of Maintenance Rs. 8,000 Rs. 10,000Additional Cost of Supervision Ignore taxation. Rs.12,000 Rs. 18,000
Solution :
Machine A has shorter pay back period, hence it should be preferred.
(b) Uneven Cash Inflows : If the annual cash inflows are uneven then the calculation of pay backperiod takes a cumulative form. We accumulate the annual cash inflows till the recovery of initialinvestment. In case the investment is recovered in between a year, it is presumed that cash inflowsaccrue evenly throughout the year. In such a case pay back period is calculated on proportionatebasis. The pay back period can be calculated as follows:
No. of completed Years + Original Outlay remaining to be recoveredAnnual Cash inflow of next year
Evaluation of the Project : The pay back period can be used as an accept or reject criterion. Itcan be used as a method of ranking projects. It gives highest ranking to the project which has theshortest pay back period and the lowest ranking to the project which has the highest pay backperiod.
In case of evaluation of a single project, it may be accepted if the pay back period is less than theperiod fixed by the management.
Statement Showing Annual Cash Inflo ws Machine A Machin e B Est imated Savings in Scrap Est imated Savings in Direct Wages
Rs. 5. 000 50 .000
Rs. 8,000 80,0 00
Total Savings (a) 65 .000 88 ,000 Additional Cost of maintenance Additional Cost of Supervis ion
8, 000 12 .000
10,00 0 18, 000
Total Additio nal Cost (b) 20 ,000 28 ,000 Net Cash Inflow (a) - (b) 45 ,000 60 ,000
Original Investment Pay Back Period = A nnual Cash Inflo ws Rs. 90 ,000 Machin e A = Rs 45,000 = 2 years Rs. 1,80,000 Machin e B = Rs. 60,00 0 = 3 yeas
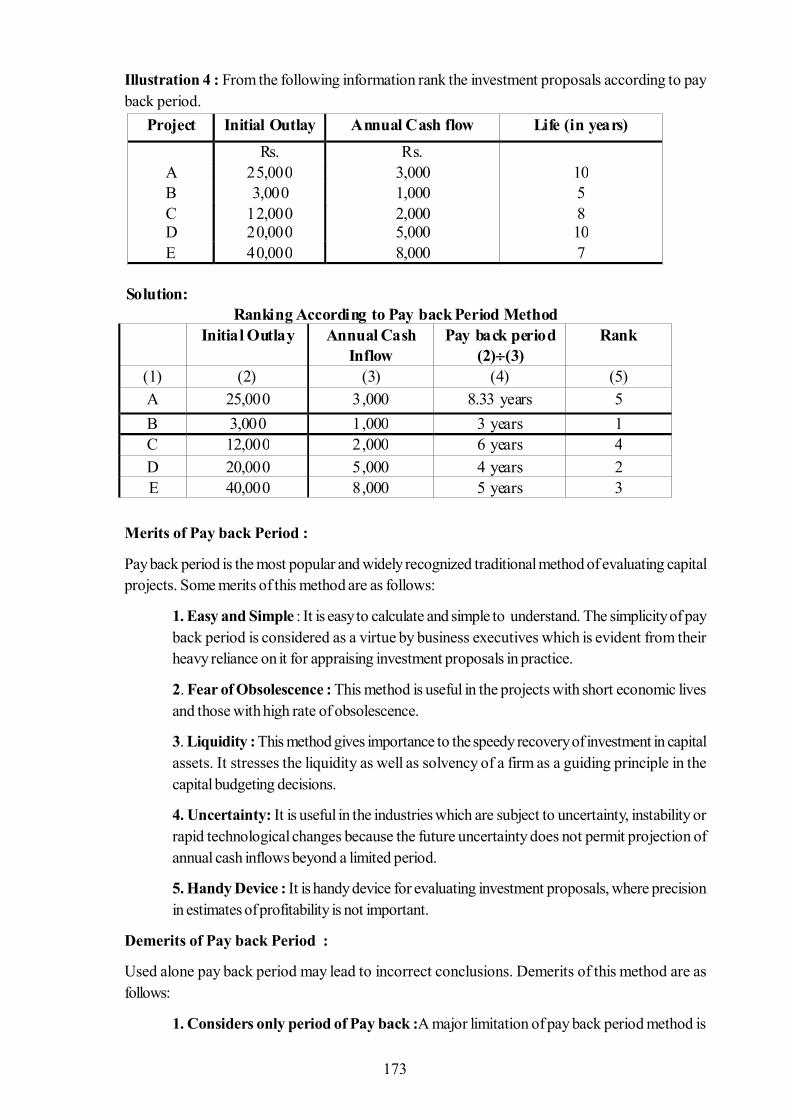
173
Illustration 4 : From the following information rank the investment proposals according to payback period.
Merits of Pay back Period :
Pay back period is the most popular and widely recognized traditional method of evaluating capitalprojects. Some merits of this method are as follows:
1. Easy and Simple : It is easy to calculate and simple to understand. The simplicity of payback period is considered as a virtue by business executives which is evident from theirheavy reliance on it for appraising investment proposals in practice.
2. Fear of Obsolescence : This method is useful in the projects with short economic livesand those with high rate of obsolescence.
3. Liquidity : This method gives importance to the speedy recovery of investment in capitalassets. It stresses the liquidity as well as solvency of a firm as a guiding principle in thecapital budgeting decisions.
4. Uncertainty: It is useful in the industries which are subject to uncertainty, instability orrapid technological changes because the future uncertainty does not permit projection ofannual cash inflows beyond a limited period.
5. Handy Device : It is handy device for evaluating investment proposals, where precisionin estimates of profitability is not important.
Demerits of Pay back Period :
Used alone pay back period may lead to incorrect conclusions. Demerits of this method are asfollows:
1. Considers only period of Pay back :A major limitation of pay back period method is
Project Initial Outlay Annual Cash flow Life (in years)
Rs. Rs. A 25,000 3,000 10 B 3,000 1,000 5 C 12,000 2,000 8 D 20,000 5,000 10 E 40,000 8,000 7
Solution:
Ranking According to Pay back Period Method Initial Outlay Annual Cash
Inflow Pay back period
(2)(3) Rank
(1) (2) (3) (4) (5) A 25,000 3,000 8.33 years 5 B 3,000 1,000 3 years 1 C 12,000 2,000 6 years 4 D 20,000 5,000 4 years 2 E 40,000 8,000 5 years 3
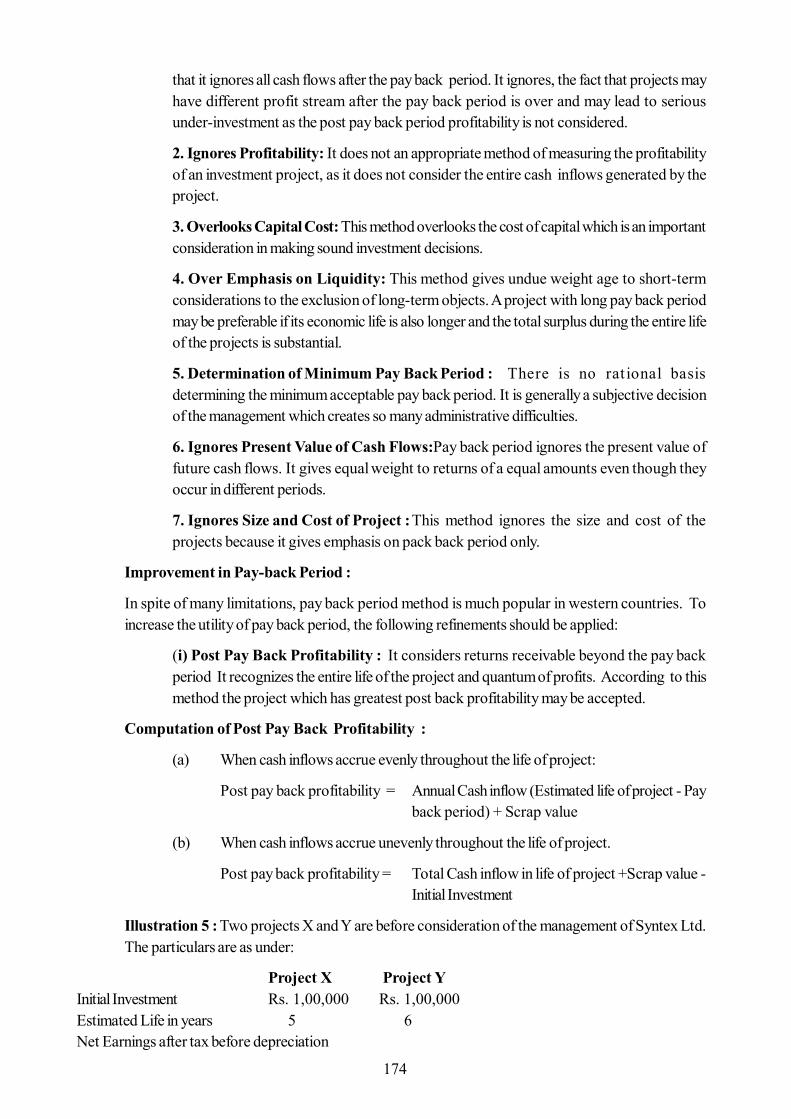
174
that it ignores all cash flows after the pay back period. It ignores, the fact that projects mayhave different profit stream after the pay back period is over and may lead to seriousunder-investment as the post pay back period profitability is not considered.
2. Ignores Profitability: It does not an appropriate method of measuring the profitabilityof an investment project, as it does not consider the entire cash inflows generated by theproject.
3. Overlooks Capital Cost: This method overlooks the cost of capital which is an importantconsideration in making sound investment decisions.
4. Over Emphasis on Liquidity: This method gives undue weight age to short-termconsiderations to the exclusion of long-term objects. A project with long pay back periodmay be preferable if its economic life is also longer and the total surplus during the entire lifeof the projects is substantial.
5. Determination of Minimum Pay Back Period : There is no rat ional basisdetermining the minimum acceptable pay back period. It is generally a subjective decisionof the management which creates so many administrative difficulties.
6. Ignores Present Value of Cash Flows:Pay back period ignores the present value offuture cash flows. It gives equal weight to returns of a equal amounts even though theyoccur in different periods.
7. Ignores Size and Cost of Project :This method ignores the size and cost of theprojects because it gives emphasis on pack back period only.
Improvement in Pay-back Period :
In spite of many limitations, pay back period method is much popular in western countries. Toincrease the utility of pay back period, the following refinements should be applied:
(i) Post Pay Back Profitability : It considers returns receivable beyond the pay backperiod It recognizes the entire life of the project and quantum of profits. According to thismethod the project which has greatest post back profitability may be accepted.
Computation of Post Pay Back Profitability :
(a) When cash inflows accrue evenly throughout the life of project:
Post pay back profitability = Annual Cash inflow (Estimated life of project - Payback period) + Scrap value
(b) When cash inflows accrue unevenly throughout the life of project.
Post pay back profitability = Total Cash inflow in life of project +Scrap value -Initial Investment
Illustration 5 : Two projects X and Y are before consideration of the management of Syntex Ltd.The particulars are as under:
Project X Project YInitial Investment Rs. 1,00,000 Rs. 1,00,000Estimated Life in years 5 6Net Earnings after tax before depreciation
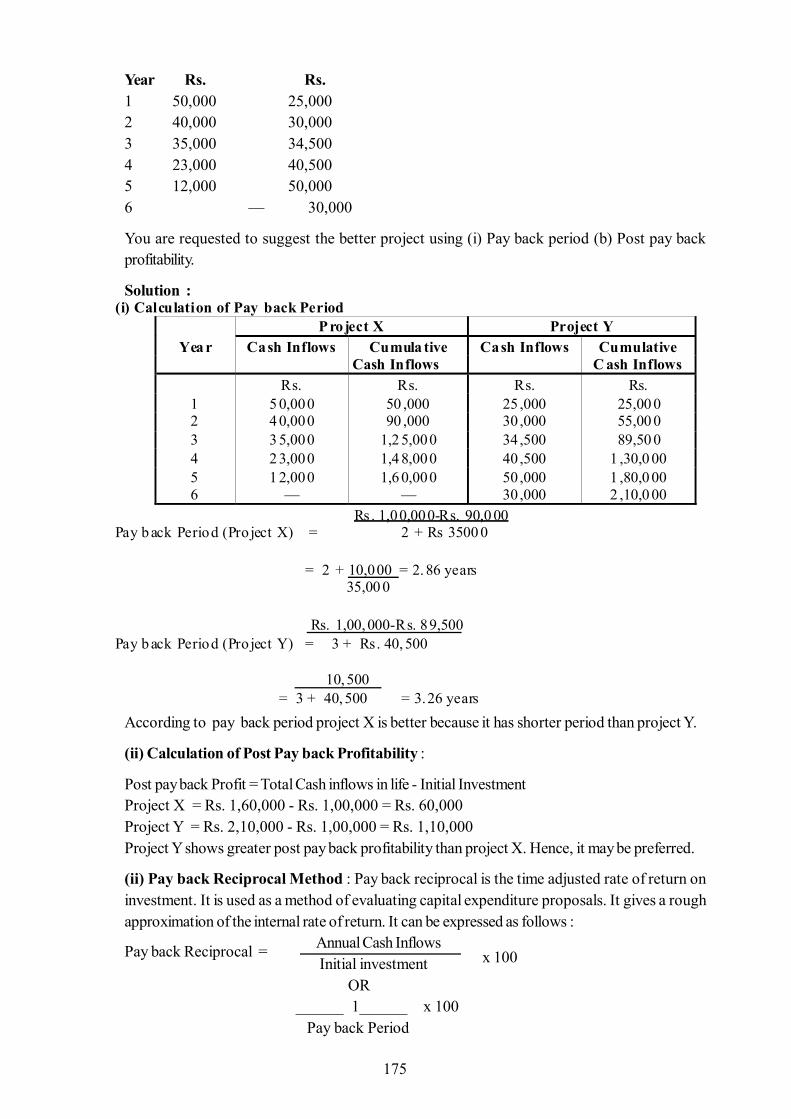
175
Year Rs. Rs.1 50,000 25,0002 40,000 30,0003 35,000 34,5004 23,000 40,5005 12,000 50,0006 — 30,000
You are requested to suggest the better project using (i) Pay back period (b) Post pay backprofitability.
Solution :
According to pay back period project X is better because it has shorter period than project Y.
(ii) Calculation of Post Pay back Profitability :
Post pay back Profit = Total Cash inflows in life - Initial InvestmentProject X = Rs. 1,60,000 - Rs. 1,00,000 = Rs. 60,000Project Y = Rs. 2,10,000 - Rs. 1,00,000 = Rs. 1,10,000Project Y shows greater post pay back profitability than project X. Hence, it may be preferred.
(ii) Pay back Reciprocal Method : Pay back reciprocal is the time adjusted rate of return oninvestment. It is used as a method of evaluating capital expenditure proposals. It gives a roughapproximation of the internal rate of return. It can be expressed as follows :
Annual Cash InflowsPay back Reciprocal = Initial investment x 100
OR ______ 1______ x 100 Pay back Period
(i) Calculation of Pay back Period P roject X Project Y
Yea r Cash Inflows Cumula tive Cash Inflows Cumulative Cash Inflows C ash Inflows Rs. Rs. Rs. Rs.
1 5 0,000 50 ,000 25 ,000 25,00 0 2 4 0,000 90 ,000 30 ,000 55,00 0 3 3 5,000 1,2 5,000 34 ,500 89,50 0 4 2 3,000 1,4 8,000 40 ,500 1 ,30,0 00 5 1 2,000 1,6 0,000 50 ,000 1 ,80,0 00 6 — — 30 ,000 2 ,10,0 00
Rs . 1,00,000-Rs. 90,0 00 Pay b ack Period (Pro ject X) = 2 + Rs 3500 0 = 2 + 10,000 = 2. 86 years 35,00 0 Rs. 1,00, 000-Rs. 89,500 Pay b ack Period (Pro ject Y) = 3 + Rs. 40, 500 10, 500 = 3 + 40, 500 = 3.26 years
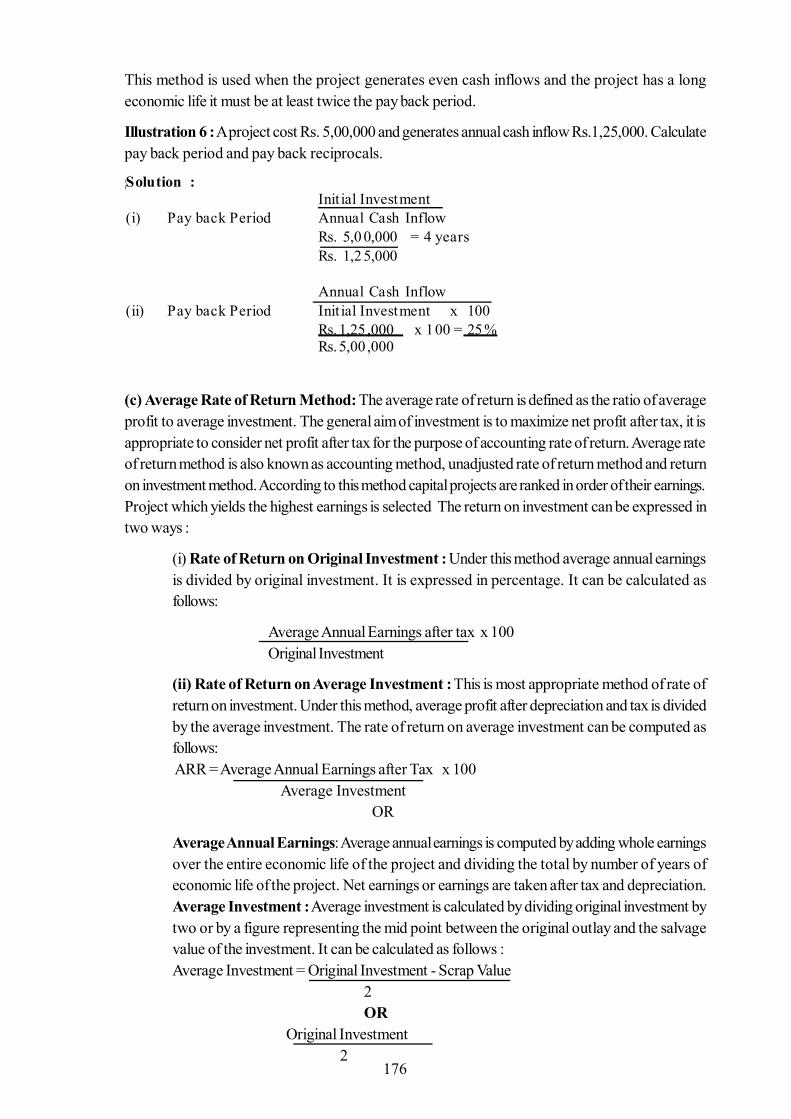
176
This method is used when the project generates even cash inflows and the project has a longeconomic life it must be at least twice the pay back period.
Illustration 6 : A project cost Rs. 5,00,000 and generates annual cash inflow Rs.1,25,000. Calculatepay back period and pay back reciprocals.
Solution :
(c) Average Rate of Return Method: The average rate of return is defined as the ratio of averageprofit to average investment. The general aim of investment is to maximize net profit after tax, it isappropriate to consider net profit after tax for the purpose of accounting rate of return. Average rateof return method is also known as accounting method, unadjusted rate of return method and returnon investment method. According to this method capital projects are ranked in order of their earnings.Project which yields the highest earnings is selected The return on investment can be expressed intwo ways :
(i) Rate of Return on Original Investment : Under this method average annual earningsis divided by original investment. It is expressed in percentage. It can be calculated asfollows:
Average Annual Earnings after tax x 100Original Investment
(ii) Rate of Return on Average Investment : This is most appropriate method of rate ofreturn on investment. Under this method, average profit after depreciation and tax is dividedby the average investment. The rate of return on average investment can be computed asfollows: ARR = Average Annual Earnings after Tax x 100
Average Investment OR
Average Annual Earnings: Average annual earnings is computed by adding whole earningsover the entire economic life of the project and dividing the total by number of years ofeconomic life of the project. Net earnings or earnings are taken after tax and depreciation.Average Investment : Average investment is calculated by dividing original investment bytwo or by a figure representing the mid point between the original outlay and the salvagevalue of the investment. It can be calculated as follows :Average Investment = Original Investment - Scrap Value
2OR
Original Investment 2
Solution : Init ial Investment (i) Pay back Period Annual Cash Inflow Rs. 5,0 0,000 = 4 years Rs. 1,2 5,000 Annual Cash Inflow (ii) Pay back Period Init ial Investment x 100 Rs. 1,25 ,000 x 100 = 25 % Rs. 5,00 ,000
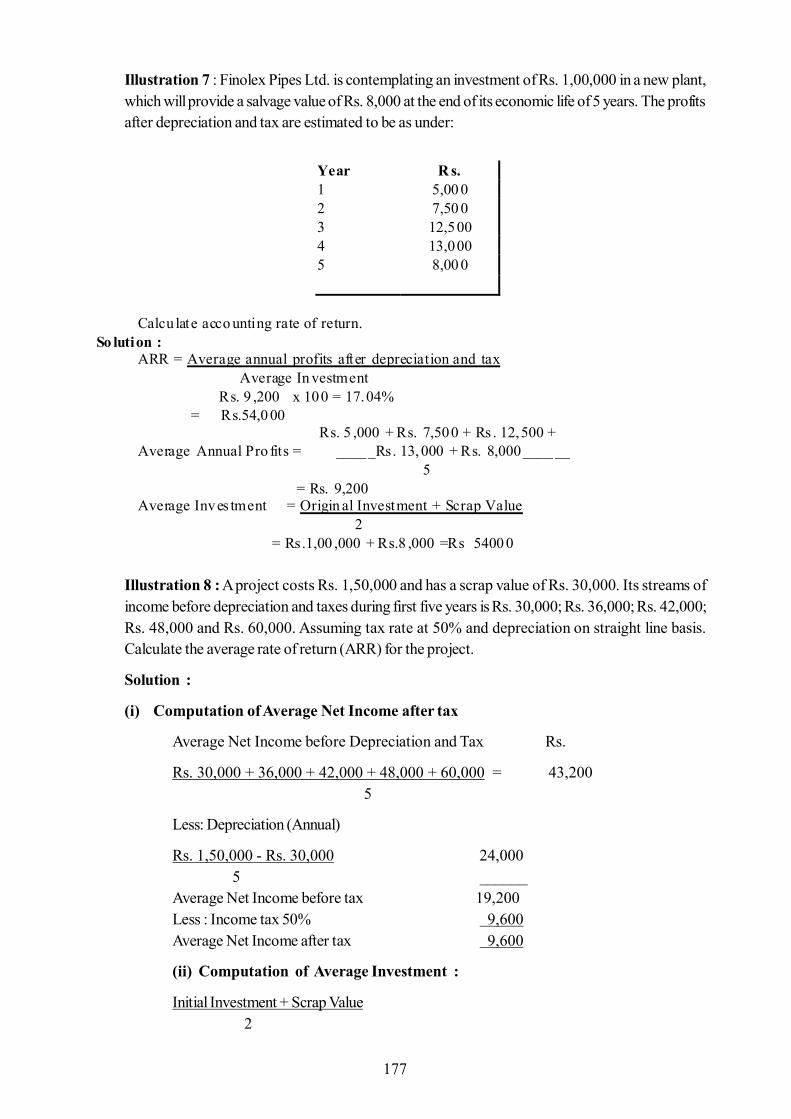
177
Illustration 7 : Finolex Pipes Ltd. is contemplating an investment of Rs. 1,00,000 in a new plant,which will provide a salvage value of Rs. 8,000 at the end of its economic life of 5 years. The profitsafter depreciation and tax are estimated to be as under:
Illustration 8 : A project costs Rs. 1,50,000 and has a scrap value of Rs. 30,000. Its streams ofincome before depreciation and taxes during first five years is Rs. 30,000; Rs. 36,000; Rs. 42,000;Rs. 48,000 and Rs. 60,000. Assuming tax rate at 50% and depreciation on straight line basis.Calculate the average rate of return (ARR) for the project.
Solution :
(i) Computation of Average Net Income after tax
Average Net Income before Depreciation and Tax Rs.
Rs. 30,000 + 36,000 + 42,000 + 48,000 + 60,000 = 43,2005
Less: Depreciation (Annual)
Rs. 1,50,000 - Rs. 30,000 24,000 5 ______
Average Net Income before tax 19,200Less : Income tax 50% 9,600Average Net Income after tax 9,600
(ii) Computation of Average Investment :
Initial Investment + Scrap Value 2
Year R s. 1 5,00 0 2 7,50 0 3 12,500 4 13,000 5 8,00 0
Calcu late acco unting rate of return. So lution : ARR = Average annual profits after depreciation and tax Average In vestment Rs. 9 ,200 x 100 = 17.04% = Rs.54,0 00 Rs. 5 ,000 + Rs. 7,500 + Rs . 12,500 + Average Annual Pro fits = _____Rs. 13, 000 + Rs. 8,000____ __ 5 = Rs. 9,200 Average Inves tment = Origin al Investment + Scrap Value 2 = Rs.1,00 ,000 + Rs.8 ,000 =Rs 5400 0
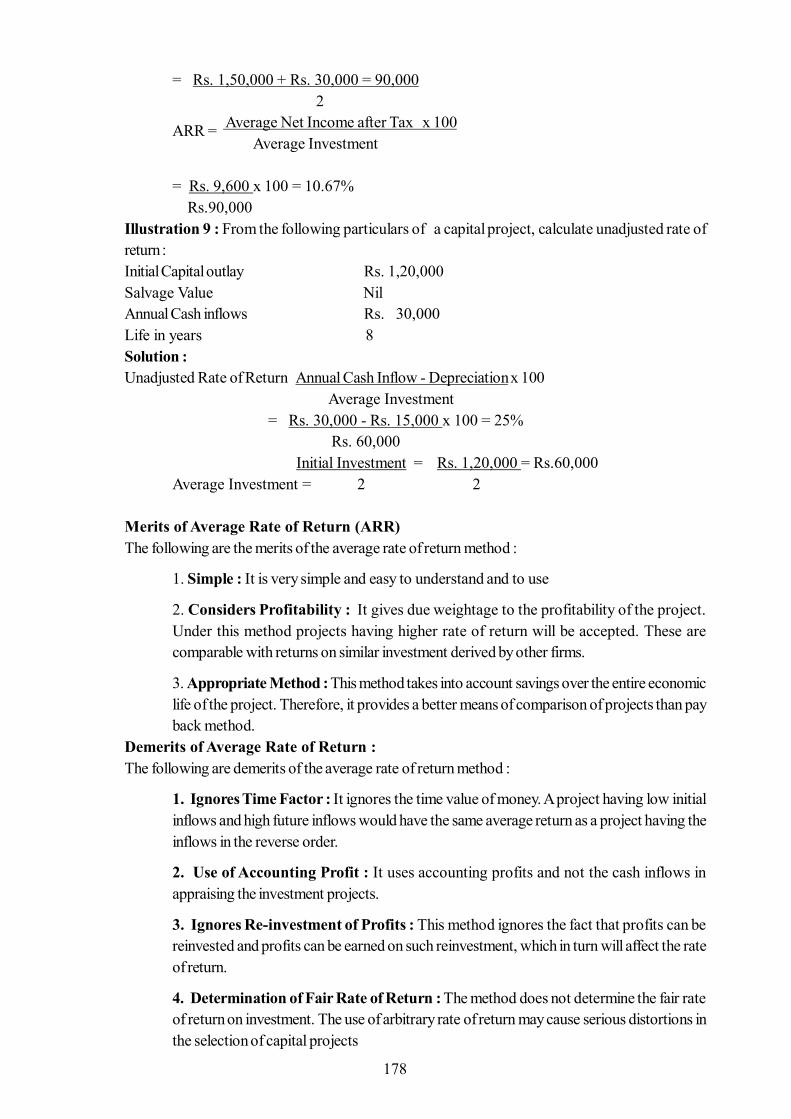
178
= Rs. 1,50,000 + Rs. 30,000 = 90,0002
ARR = Average Net Income after Tax x 100 Average Investment
= Rs. 9,600 x 100 = 10.67% Rs.90,000
Illustration 9 : From the following particulars of a capital project, calculate unadjusted rate ofreturn :Initial Capital outlay Rs. 1,20,000Salvage Value NilAnnual Cash inflows Rs. 30,000Life in years 8Solution :Unadjusted Rate of Return Annual Cash Inflow - Depreciation x 100
Average Investment= Rs. 30,000 - Rs. 15,000 x 100 = 25% Rs. 60,000
Initial Investment = Rs. 1,20,000 = Rs.60,000Average Investment = 2 2
Merits of Average Rate of Return (ARR)The following are the merits of the average rate of return method :
1. Simple : It is very simple and easy to understand and to use
2. Considers Profitability : It gives due weightage to the profitability of the project.Under this method projects having higher rate of return will be accepted. These arecomparable with returns on similar investment derived by other firms.
3. Appropriate Method : This method takes into account savings over the entire economiclife of the project. Therefore, it provides a better means of comparison of projects than payback method.
Demerits of Average Rate of Return :The following are demerits of the average rate of return method :
1. Ignores Time Factor : It ignores the time value of money. A project having low initialinflows and high future inflows would have the same average return as a project having theinflows in the reverse order.
2. Use of Accounting Profit : It uses accounting profits and not the cash inflows inappraising the investment projects.
3. Ignores Re-investment of Profits : This method ignores the fact that profits can bereinvested and profits can be earned on such reinvestment, which in turn will affect the rateof return.
4. Determination of Fair Rate of Return : The method does not determine the fair rateof return on investment. The use of arbitrary rate of return may cause serious distortions inthe selection of capital projects
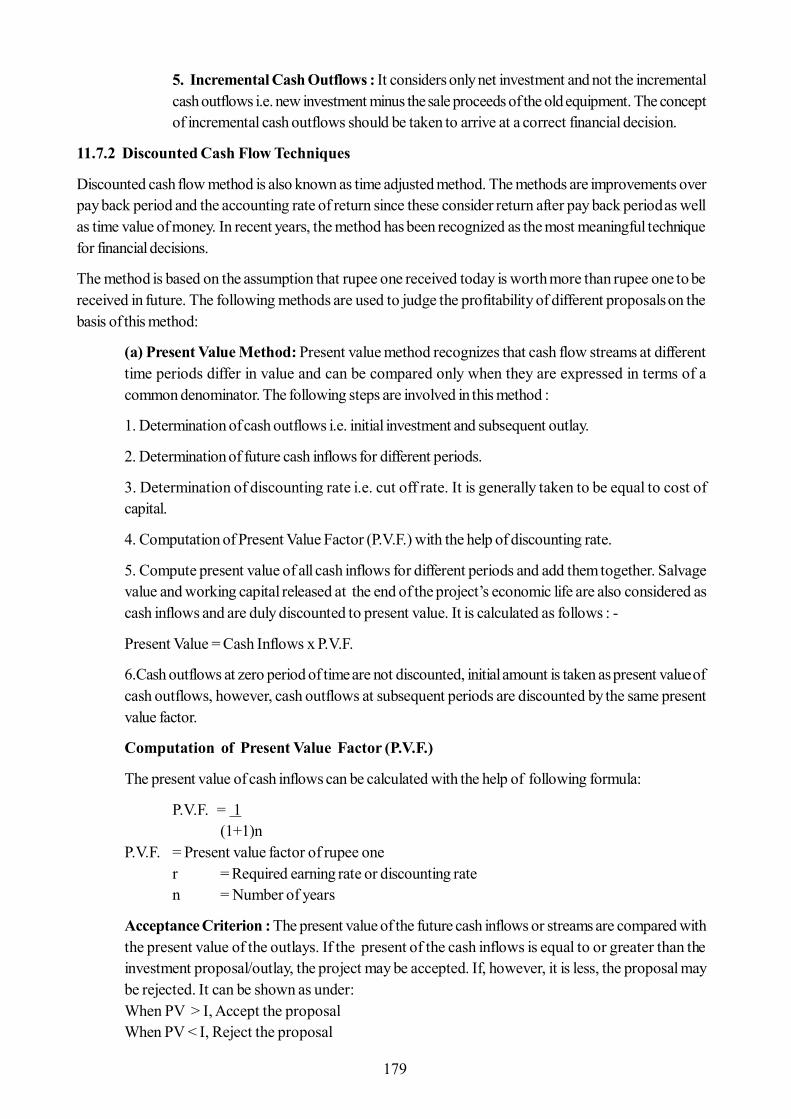
179
5. Incremental Cash Outflows : It considers only net investment and not the incrementalcash outflows i.e. new investment minus the sale proceeds of the old equipment. The conceptof incremental cash outflows should be taken to arrive at a correct financial decision.
11.7.2 Discounted Cash Flow Techniques
Discounted cash flow method is also known as time adjusted method. The methods are improvements overpay back period and the accounting rate of return since these consider return after pay back period as wellas time value of money. In recent years, the method has been recognized as the most meaningful techniquefor financial decisions.
The method is based on the assumption that rupee one received today is worth more than rupee one to bereceived in future. The following methods are used to judge the profitability of different proposals on thebasis of this method:
(a) Present Value Method: Present value method recognizes that cash flow streams at differenttime periods differ in value and can be compared only when they are expressed in terms of acommon denominator. The following steps are involved in this method :
1. Determination of cash outflows i.e. initial investment and subsequent outlay.
2. Determination of future cash inflows for different periods.
3. Determination of discounting rate i.e. cut off rate. It is generally taken to be equal to cost ofcapital.
4. Computation of Present Value Factor (P.V.F.) with the help of discounting rate.
5. Compute present value of all cash inflows for different periods and add them together. Salvagevalue and working capital released at the end of the project’s economic life are also considered ascash inflows and are duly discounted to present value. It is calculated as follows : -
Present Value = Cash Inflows x P.V.F.
6.Cash outflows at zero period of time are not discounted, initial amount is taken as present value ofcash outflows, however, cash outflows at subsequent periods are discounted by the same presentvalue factor.
Computation of Present Value Factor (P.V.F.)
The present value of cash inflows can be calculated with the help of following formula:
P.V.F. = 1(1+1)n
P.V.F. = Present value factor of rupee oner = Required earning rate or discounting raten = Number of years
Acceptance Criterion : The present value of the future cash inflows or streams are compared withthe present value of the outlays. If the present of the cash inflows is equal to or greater than theinvestment proposal/outlay, the project may be accepted. If, however, it is less, the proposal maybe rejected. It can be shown as under:When PV > I, Accept the proposalWhen PV < I, Reject the proposal
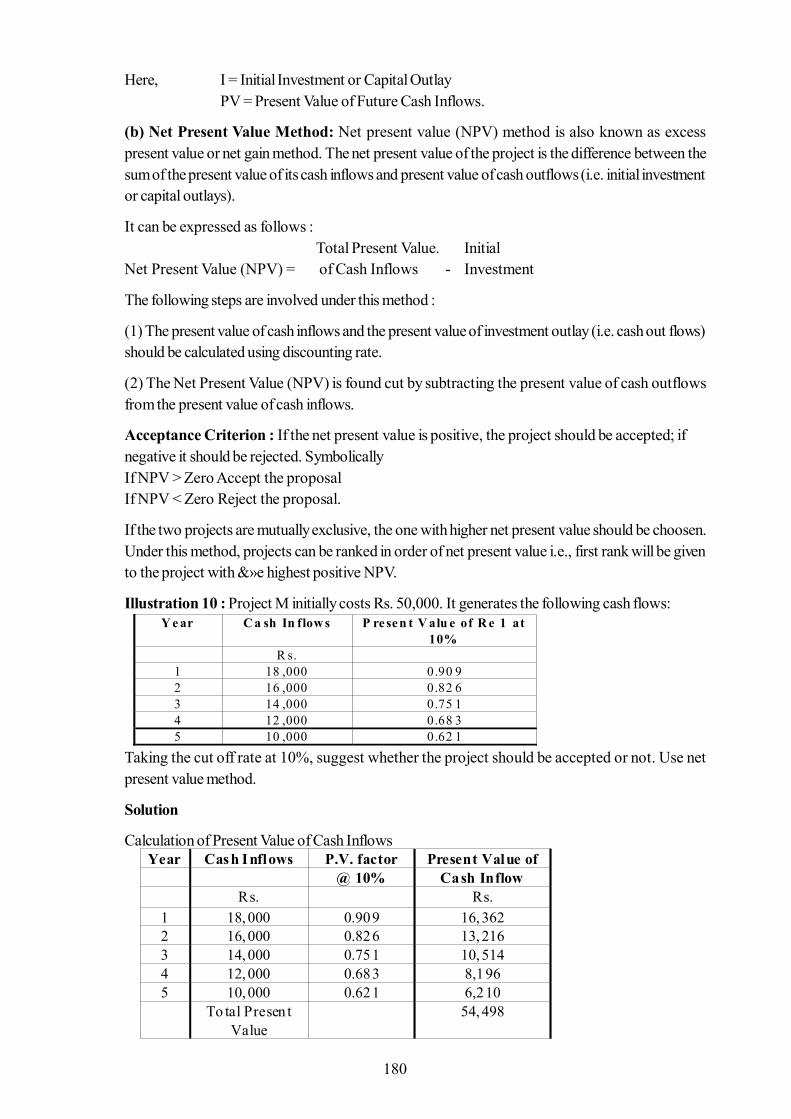
180
Here, I = Initial Investment or Capital OutlayPV = Present Value of Future Cash Inflows.
(b) Net Present Value Method: Net present value (NPV) method is also known as excesspresent value or net gain method. The net present value of the project is the difference between thesum of the present value of its cash inflows and present value of cash outflows (i.e. initial investmentor capital outlays).
It can be expressed as follows :Total Present Value. Initial
Net Present Value (NPV) = of Cash Inflows - Investment
The following steps are involved under this method :
(1) The present value of cash inflows and the present value of investment outlay (i.e. cash out flows)should be calculated using discounting rate.
(2) The Net Present Value (NPV) is found cut by subtracting the present value of cash outflowsfrom the present value of cash inflows.
Acceptance Criterion : If the net present value is positive, the project should be accepted; ifnegative it should be rejected. SymbolicallyIf NPV > Zero Accept the proposalIf NPV < Zero Reject the proposal.
If the two projects are mutually exclusive, the one with higher net present value should be choosen.Under this method, projects can be ranked in order of net present value i.e., first rank will be givento the project with &»e highest positive NPV.
Illustration 10 : Project M initially costs Rs. 50,000. It generates the following cash flows:
Taking the cut off rate at 10%, suggest whether the project should be accepted or not. Use netpresent value method.
Solution
Calculation of Present Value of Cash Inflows
Y e ar C a sh In flow s P resen t V alu e of R e 1 at 10%
R s. 1 18 ,000 0.90 9 2 16 ,000 0.82 6 3 14 ,000 0.75 1 4 12 ,000 0.68 3 5 10 ,000 0.62 1
Year Cash Inflows P.V. factor Present Value of @ 10% Cash Inflow Rs. Rs.
1 18, 000 0.909 16, 362 2 16, 000 0.826 13, 216 3 14, 000 0.751 10, 514 4 12, 000 0.683 8,196 5 10, 000 0.621 6,210 To tal Presen t
Value 54, 498
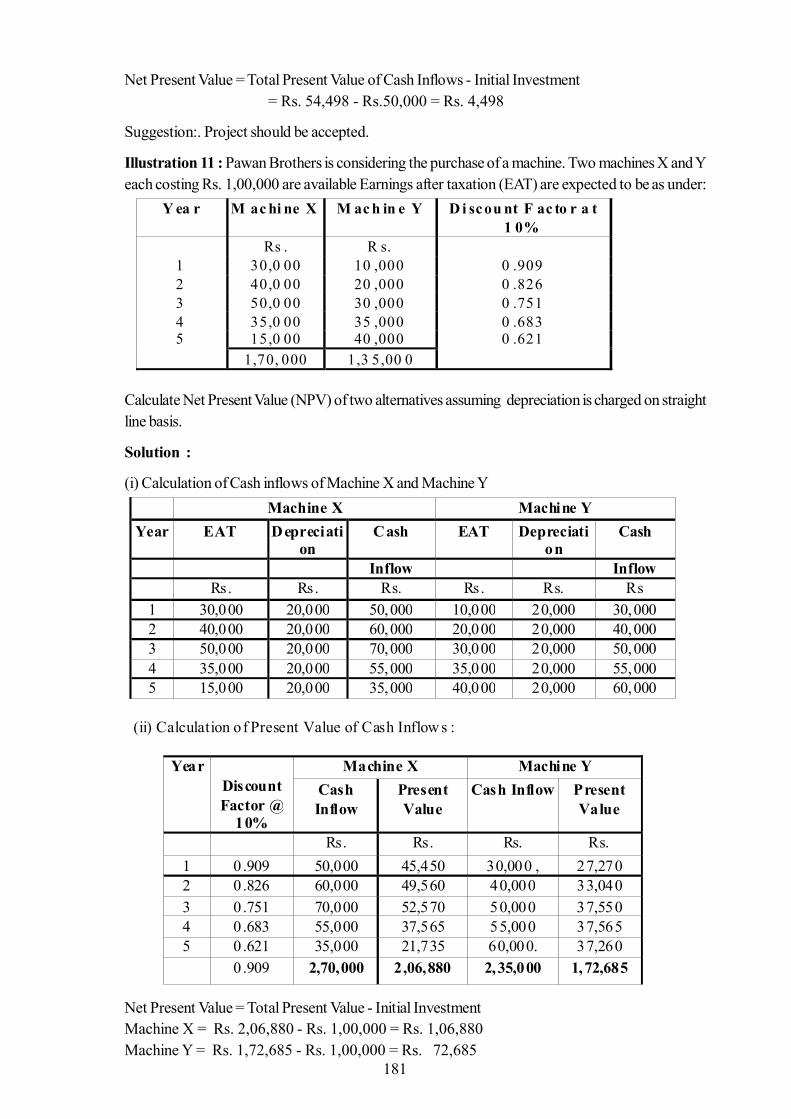
181
Net Present Value = Total Present Value of Cash Inflows - Initial Investment= Rs. 54,498 - Rs.50,000 = Rs. 4,498
Suggestion:. Project should be accepted.
Illustration 11 : Pawan Brothers is considering the purchase of a machine. Two machines X and Yeach costing Rs. 1,00,000 are available Earnings after taxation (EAT) are expected to be as under:
Calculate Net Present Value (NPV) of two alternatives assuming depreciation is charged on straightline basis.
Solution :
(i) Calculation of Cash inflows of Machine X and Machine Y
Net Present Value = Total Present Value - Initial InvestmentMachine X = Rs. 2,06,880 - Rs. 1,00,000 = Rs. 1,06,880Machine Y = Rs. 1,72,685 - Rs. 1,00,000 = Rs. 72,685
Y ea r M ac hi ne X M ac h in e Y D i sc ou nt F ac to r a t 1 0%
Rs . R s. 1 30,0 00 10 ,000 0 .909 2 40,0 00 20 ,000 0 .826 3 50,0 00 30 ,000 0 .751 4 35,0 00 35 ,000 0 .683 5 15,0 00 40 ,000 0 .621 1,70, 000 1,3 5,00 0
Machine X Machine Y Year EAT Depreciati
on Cash EAT Depreciati
on Cash
Inflow Inflow Rs. Rs. Rs. Rs. Rs. Rs
1 30,000 20,000 50,000 10,000 20,000 30,000 2 40,000 20,000 60,000 20,000 20,000 40,000 3 50,000 20,000 70,000 30,000 20,000 50,000 4 35,000 20,000 55,000 35,000 20,000 55,000 5 15,000 20,000 35,000 40,000 20,000 60,000
(ii) Calculation of Present Value of Cash Inflow s :
Year Discount Factor @
10%
Machine X Machine Y Cash Inflow
Present Value
Cash Inflow Present Value
Rs. Rs. Rs. Rs. 1 0 .909 50,000 45,450 30,000 , 27,270 2 0 .826 60,000 49,560 40,000 33,040 3 0 .751 70,000 52,570 50,000 37,550 4 0 .683 55,000 37,565 55,000 37,565 5 0 .621 35,000 21,735 60,000. 37,260
0 .909 2,70,000 2,06,880 2,35,000 1,72,685
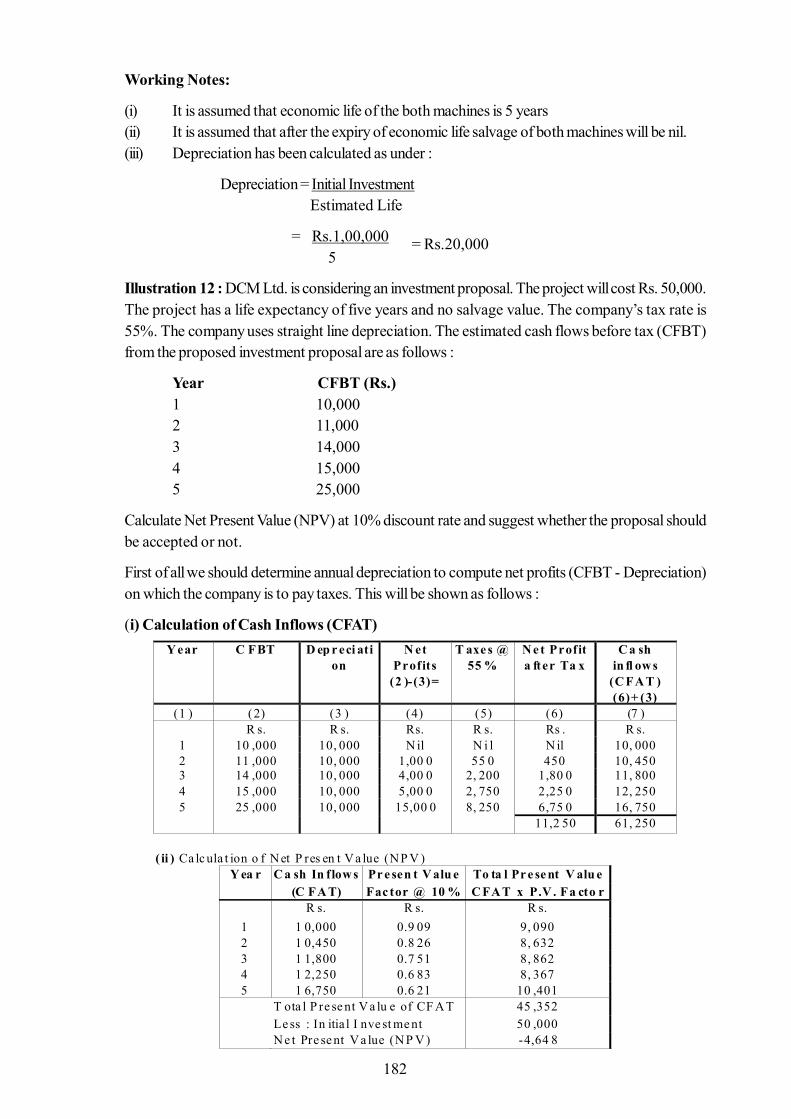
182
Working Notes:
(i) It is assumed that economic life of the both machines is 5 years(ii) It is assumed that after the expiry of economic life salvage of both machines will be nil.(iii) Depreciation has been calculated as under :
Depreciation = Initial Investment Estimated Life
= Rs.1,00,000 5
= Rs.20,000
Illustration 12 : DCM Ltd. is considering an investment proposal. The project will cost Rs. 50,000.The project has a life expectancy of five years and no salvage value. The company’s tax rate is55%. The company uses straight line depreciation. The estimated cash flows before tax (CFBT)from the proposed investment proposal are as follows :
Year CFBT (Rs.)1 10,0002 11,0003 14,0004 15,0005 25,000
Calculate Net Present Value (NPV) at 10% discount rate and suggest whether the proposal shouldbe accepted or not.
First of all we should determine annual depreciation to compute net profits (CFBT - Depreciation)on which the company is to pay taxes. This will be shown as follows :
(i) Calculation of Cash Inflows (CFAT)Y ear C FBT D ep r eci ati
on N et
Profits (2 )-(3)=
T axe s @ 55 %
N e t Profit a fter Ta x
C a sh in fl ow s
(C FA T ) (6)+ (3)
(1 ) (2) (3 ) (4) (5) (6) (7 ) R s. R s. Rs. R s. Rs . R s.
1 10 ,000 10, 000 N il N i l N il 10, 000 2 11 ,000 10, 000 1,00 0 55 0 450 10, 450 3 14 ,000 10, 000 4,00 0 2, 200 1,80 0 11, 800 4 15 ,000 10, 000 5,00 0 2, 750 2,25 0 12, 250 5 25 ,000 10, 000 15,00 0 8, 250 6,75 0 16, 750 11,2 50 61, 250
( ii ) Ca lc ula t ion o f N et P res en t V a lue (N P V )
Y ea r C a sh In flow s Pr e sen t V alu e To ta l Pr e se nt V alu e (C FA T) Fac tor @ 10 % C FA T x P.V . Fa cto r
R s. R s. R s. 1 1 0,000 0.9 09 9, 090 2 1 0,450 0.8 26 8, 632 3 1 1,800 0.7 51 8, 862 4 1 2,250 0.6 83 8, 367 5 1 6,750 0.6 21 10 ,401
T ota l P re se nt V a lu e of CF A T 45 ,352 Le ss : In itia l I nve st me nt 50 ,000 N e t Pre se nt V a lue (N P V ) -4,64 8
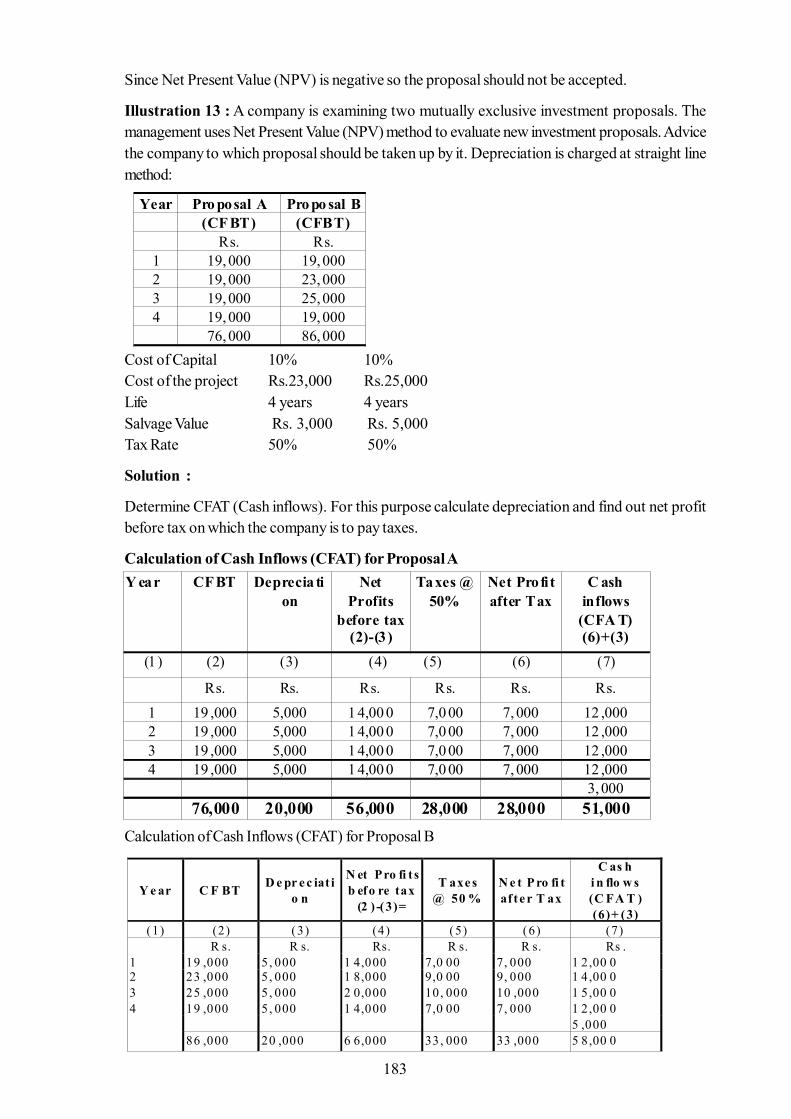
183
Since Net Present Value (NPV) is negative so the proposal should not be accepted.
Illustration 13 : A company is examining two mutually exclusive investment proposals. Themanagement uses Net Present Value (NPV) method to evaluate new investment proposals. Advicethe company to which proposal should be taken up by it. Depreciation is charged at straight linemethod:
Cost of Capital 10% 10%Cost of the project Rs.23,000 Rs.25,000Life 4 years 4 yearsSalvage Value Rs. 3,000 Rs. 5,000Tax Rate 50% 50%
Solution :
Determine CFAT (Cash inflows). For this purpose calculate depreciation and find out net profitbefore tax on which the company is to pay taxes.
Calculation of Cash Inflows (CFAT) for Proposal A
Calculation of Cash Inflows (CFAT) for Proposal B
Year Pro posal A Pro po sal B (CF BT) (CFBT) Rs. Rs.
1 19, 000 19, 000 2 19, 000 23, 000 3 19, 000 25, 000 4 19, 000 19, 000 76, 000 86, 000
Y ear CF BT Deprecia tion
Net Profits
before tax (2)-(3)
Taxes @ 50%
Net Profit after Tax
C ash inflows
(CFA T) (6)+(3)
(1) (2) (3) (4) (5) (6) (7)
Rs. Rs. Rs. Rs. Rs. Rs. 1 19 ,000 5,000 1 4,00 0 7,0 00 7, 000 12 ,000 2 19 ,000 5,000 1 4,00 0 7,0 00 7, 000 12 ,000 3 19 ,000 5,000 1 4,00 0 7,0 00 7, 000 12 ,000 4 19 ,000 5,000 1 4,00 0 7,0 00 7, 000 12 ,000
3, 000 76,000 20,000 56,000 28,000 28,000 51,000
Y e ar C F BT D e pr e c iat io n
N et Pro fi t s b efo re tax
(2 ) -(3)=
T axe s @ 50 %
N e t P ro fi t af te r T ax
C as h i n flo w s (C FA T ) (6)+ (3)
(1) (2) (3) (4) (5) (6) (7) R s. R s. Rs. R s. R s. Rs . 1 19 ,000 5, 000 1 4,000 7,0 00 7, 000 1 2,00 0 2 23 ,000 5, 000 1 8,000 9,0 00 9, 000 1 4,00 0 3 25 ,000 5, 000 2 0,000 10, 000 10 ,000 1 5,00 0 4 19 ,000 5, 000 1 4,000 7,0 00 7, 000 1 2,00 0 5 ,000 86 ,000 20 ,000 6 6,000 33, 000 33 ,000 5 8,00 0
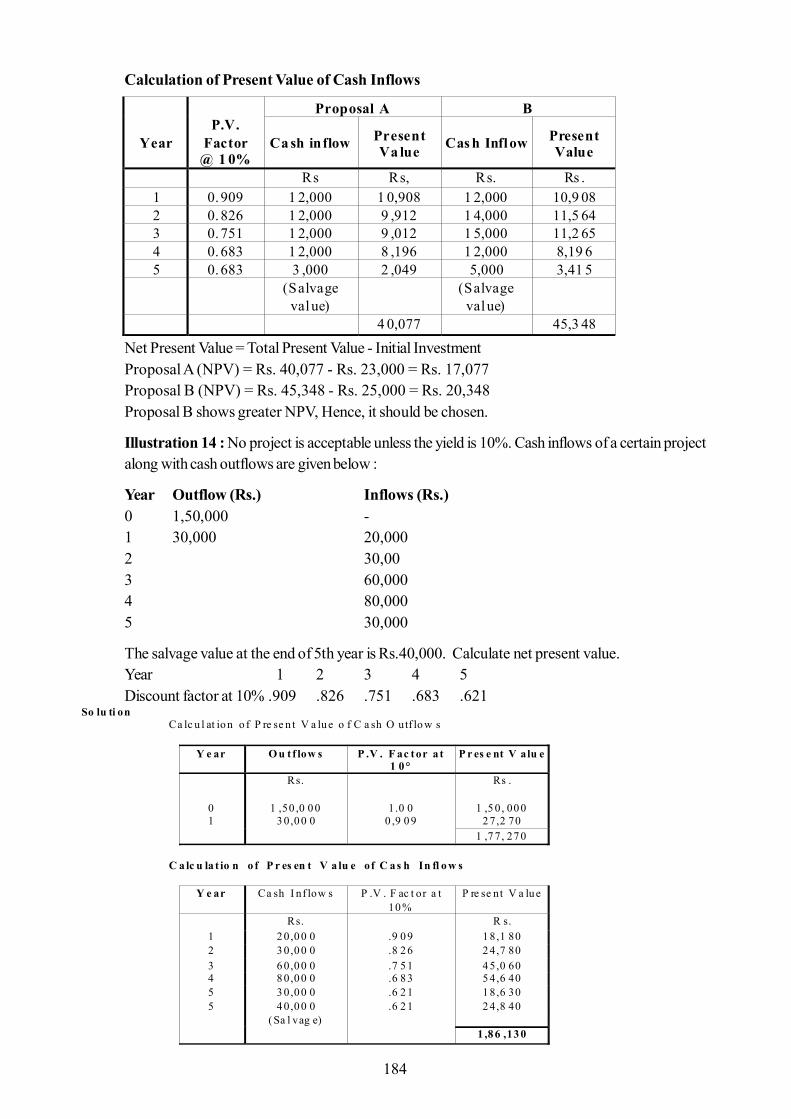
184
Calculation of Present Value of Cash Inflows
Net Present Value = Total Present Value - Initial InvestmentProposal A (NPV) = Rs. 40,077 - Rs. 23,000 = Rs. 17,077Proposal B (NPV) = Rs. 45,348 - Rs. 25,000 = Rs. 20,348Proposal B shows greater NPV, Hence, it should be chosen.
Illustration 14 : No project is acceptable unless the yield is 10%. Cash inflows of a certain projectalong with cash outflows are given below :
Year Outflow (Rs.) Inflows (Rs.)0 1,50,000 -1 30,000 20,0002 30,003 60,0004 80,0005 30,000
The salvage value at the end of 5th year is Rs.40,000. Calculate net present value.Year 1 2 3 4 5Discount factor at 10% .909 .826 .751 .683 .621
Year
P.V.
Factor @ 1 0%
Proposal A B
Ca sh inflow Present Va lue Cas h Inflow Present
Value
Rs Rs, Rs. Rs . 1 0.909 1 2,000 1 0,908 1 2,000 10,9 08 2 0.826 1 2,000 9 ,912 1 4,000 11,5 64 3 0.751 1 2,000 9 ,012 1 5,000 11,2 65 4 0.683 1 2,000 8 ,196 1 2,000 8,19 6 5 0.683 3 ,000 2 ,049 5,000 3,41 5 (Salvage
value) (Salvage
value)
4 0,077 45,3 48
So lu ti on Ca lc u l at io n o f P re se n t V a lu e o f C a sh O utf lo w s
Y e ar O u t f low s P .V . F ac tor a t 1 0 °
P r es e nt V alu e
0 1
Rs.
1 ,50 ,0 0 0 3 0,0 0 0
1 .0 0 0 ,9 0 9
Rs .
1 ,5 0, 00 0 2 7,2 70
1 ,7 7, 27 0 C a lc u la t io n o f P r es en t V a lu e of C a s h In fl o w s
Y e ar Ca sh I nf low s P .V . F ac t or a t 10 %
P re se nt V a lu e
Rs. R s. 1 2 0,0 0 0 .9 0 9 1 8,1 80 2 3 0,0 0 0 .8 2 6 2 4,7 80 3 6 0,0 0 0 .7 5 1 4 5,0 60 4 8 0,0 0 0 .6 8 3 5 4,6 40 5 3 0,0 0 0 .6 2 1 1 8,6 30 5 4 0,0 0 0 .6 2 1 2 4,8 40 (Sa l vag e)
1 ,8 6 ,13 0
185
Net Present Value (NPV) = Total Present Value - Present value of Cash Outflows
= Rs. 1,86,130-Rs. 1,77,270= Rs. 8,860
Merits of Net Present Value Method :
The following are the merits of net present value method :
1. Considers Entire Economic Life : This method takes into account the entire economiclife of an investment and income there from. It gives the true rate of return offered by a newproject.
2. Weightage to Time Factor : it gives due weight to time factor of financing. In thewords of Charles T. Horngren, “Because the discounted cash flow method explicity andrountenely weights the time value of money, it is the best method to use for long rangedecisions”.
3. Suitable Method for Uneven Cash Inflows : It is the most suitable method forevaluating project where the cash flows are uneven.
4. Maximum Profitability : It takes into consideration the objective of maximumprofitability.
Demerits of Net Present Value Method :
The following are the demerits of net present value method :
1. Complicated Method : It is difficult and complicated. It involves a large amount ofcalculations.
2. Determination of Discount Rate : It is difficult to determine the exact rate of discountto be applied. The cost of capital which is commonly used is by it self difficult of assessment.
3. Size of Projects : When projects involve different amounts of investment, the methodmay not provide satisfactory answers.
4. Computation of Economic Life of Project : The economic life of an investment isvery difficult to forecast exactly
(c) Profitability Index or Present Value Index (PVl): The profitability index is the relationship that existsbetween the present values of net cash inflows and the net present values of cash outflows. To obtaincorrect result in comparing projects of unequal size, the calculation of present value can be extended tocompute the ‘Present Value Index’. It can be calculated as follows :
Present Value of Cash InflowsPresent Value Index (PVl) =Present Value of Cash Outflows
The project is viable if the ratio is equal to or greater than 1. Projects can be ranked on the basis ofprofitability index. Highest rank will be assigned to the project with highest profitability index, while thelowest rank will be given to the project having lowest profitability index.
This method is also known as Benefit Cost ratio because the numerator measures benefits and the denominatorcosts.
186
(d) Internal Rate of Return (IRR): Internal Rate of Return (IRR) is the rate of discount which equatesthe aggregate present value of expected future cash inflows with the aggregate present value of cash outflowsof a project. In other words, it is the rate at which net present value of the project is zero.
It is called internal rate be cause it depends mainly on the outlay and proceeds associated with the projectand not on any rate determined outside the investment. This method is known as Time adjusted rate ofreturn, Discounted cash flow rate of return method, marginal efficiency of capital etc.
As we have discussed earlier, the present value method in which required earning rate is selected in advance,but under internal rate of return method, rate of discount or interest is determined.
Computation of Internal Rate of Return
(a) When the annual cash inflows are equal over the life of the asset : In the case of thoseprojects which result in uniform or even cash inflows the internal rate of return can be calculated bylocating present value factor as follows :
Present Value Factor = Initial Investment Annual Cash Inflow
After the P.V. Factor is calculated as above, it is located in the annuity table on the line representingthe number of years corresponding to the economic life of the project. In case the factor is inbetween two rates, the actual rate of return can be interpolated by applying the following formula:
IRR = LDR + P1 - O (HDR - LDR) P1 - P2
IRR = Internal Rate of ReturnHDR = Higher discount rateLDR = Lower discount rateP1 = Present values of cash inflows at LDRP2 = Present value of cash inflows at HDRO = Initial investment or capital outlay
Illustration 15 : A project cost Rs. 50,000 and is expected to generate annual cash inflow of Rs.12,500. The project has an expected life of 5 years.
Calculate “Internal Rate of Return (IRR).
Solution :
Calculation of Internal Rate of Return (IRR)
Firstly, we find present value factor as follows
Initial Investment__Present value factor - Annual Cash Inflow
= Rs. 50,000 = 4 Rs. 12,500
Now see present value annuity table for 5 years period at present value factor of 4. As we see fromthe table at 8% for 5 years period, the present value is 3.993 which is nearly equal to 4. Thus,internal rate of return (IRR) is 8% approx.
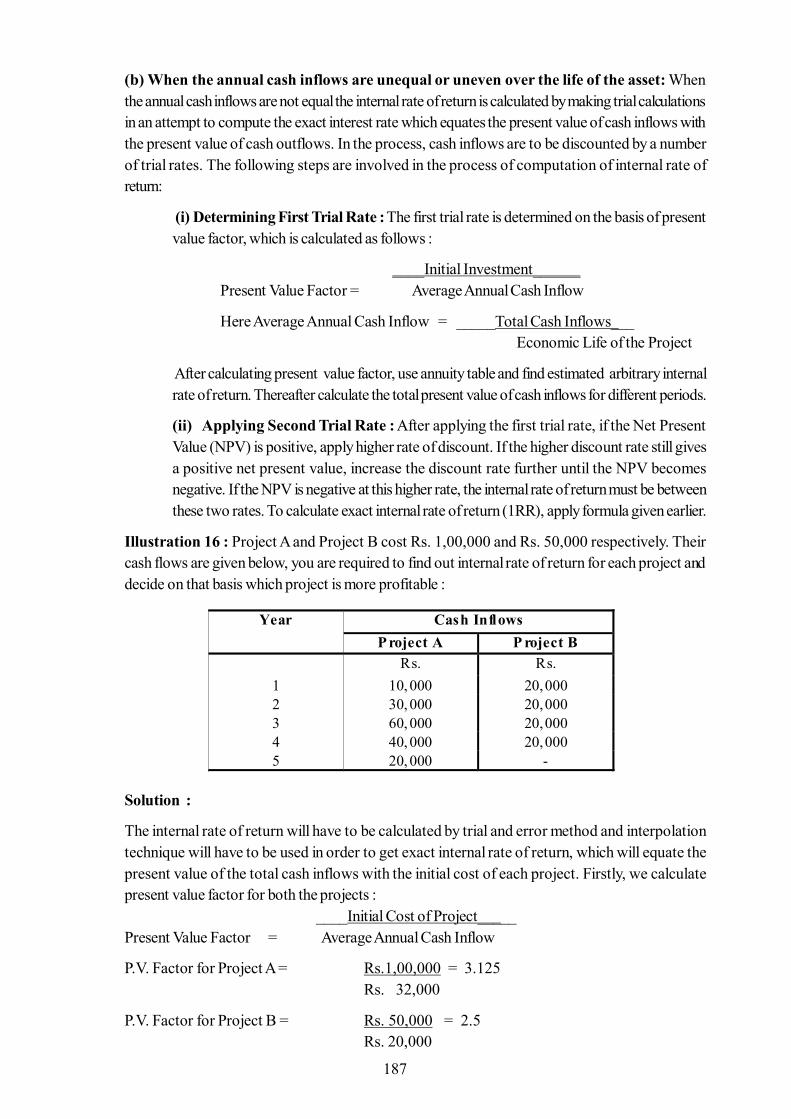
187
(b) When the annual cash inflows are unequal or uneven over the life of the asset: Whenthe annual cash inflows are not equal the internal rate of return is calculated by making trial calculationsin an attempt to compute the exact interest rate which equates the present value of cash inflows withthe present value of cash outflows. In the process, cash inflows are to be discounted by a numberof trial rates. The following steps are involved in the process of computation of internal rate ofreturn:
(i) Determining First Trial Rate : The first trial rate is determined on the basis of presentvalue factor, which is calculated as follows :
____Initial Investment______Present Value Factor = Average Annual Cash Inflow
Here Average Annual Cash Inflow = _____Total Cash Inflows___ Economic Life of the Project
After calculating present value factor, use annuity table and find estimated arbitrary internalrate of return. Thereafter calculate the total present value of cash inflows for different periods.
(ii) Applying Second Trial Rate : After applying the first trial rate, if the Net PresentValue (NPV) is positive, apply higher rate of discount. If the higher discount rate still givesa positive net present value, increase the discount rate further until the NPV becomesnegative. If the NPV is negative at this higher rate, the internal rate of return must be betweenthese two rates. To calculate exact internal rate of return (1RR), apply formula given earlier.
Illustration 16 : Project A and Project B cost Rs. 1,00,000 and Rs. 50,000 respectively. Theircash flows are given below, you are required to find out internal rate of return for each project anddecide on that basis which project is more profitable :
Solution :
The internal rate of return will have to be calculated by trial and error method and interpolationtechnique will have to be used in order to get exact internal rate of return, which will equate thepresent value of the total cash inflows with the initial cost of each project. Firstly, we calculatepresent value factor for both the projects :
____Initial Cost of Project_____Present Value Factor = Average Annual Cash Inflow
P.V. Factor for Project A = Rs.1,00,000 = 3.125Rs. 32,000
P.V. Factor for Project B = Rs. 50,000 = 2.5Rs. 20,000
Year Cash Inflows P roject A P roject B
Rs. Rs. 1 10, 000 20,000 2 30, 000 20,000 3 60, 000 20,000 4 40, 000 20,000 5 20, 000 -
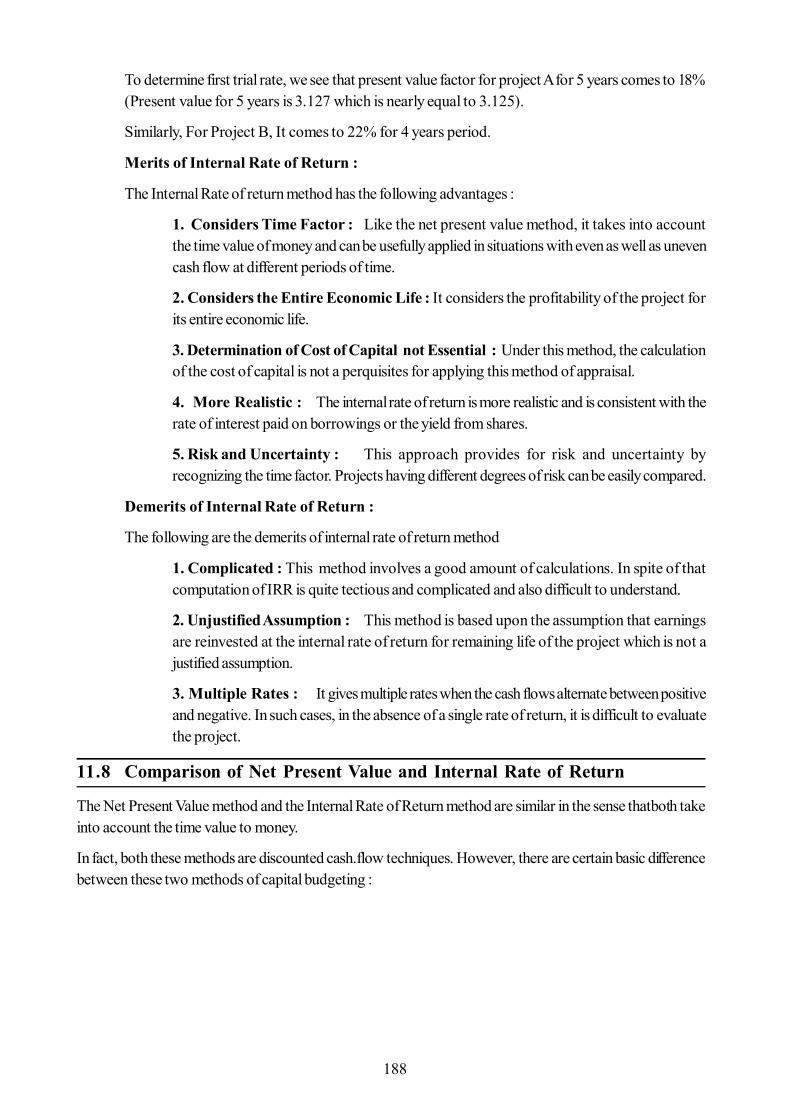
188
To determine first trial rate, we see that present value factor for project A for 5 years comes to 18%(Present value for 5 years is 3.127 which is nearly equal to 3.125).
Similarly, For Project B, It comes to 22% for 4 years period.
Merits of Internal Rate of Return :
The Internal Rate of return method has the following advantages :
1. Considers Time Factor : Like the net present value method, it takes into accountthe time value of money and can be usefully applied in situations with even as well as unevencash flow at different periods of time.
2. Considers the Entire Economic Life : It considers the profitability of the project forits entire economic life.
3. Determination of Cost of Capital not Essential : Under this method, the calculationof the cost of capital is not a perquisites for applying this method of appraisal.
4. More Realistic : The internal rate of return is more realistic and is consistent with therate of interest paid on borrowings or the yield from shares.
5. Risk and Uncertainty : This approach provides for risk and uncertainty byrecognizing the time factor. Projects having different degrees of risk can be easily compared.
Demerits of Internal Rate of Return :
The following are the demerits of internal rate of return method
1. Complicated : This method involves a good amount of calculations. In spite of thatcomputation of IRR is quite tectious and complicated and also difficult to understand.
2. Unjustified Assumption : This method is based upon the assumption that earningsare reinvested at the internal rate of return for remaining life of the project which is not ajustified assumption.
3. Multiple Rates : It gives multiple rates when the cash flows alternate between positiveand negative. In such cases, in the absence of a single rate of return, it is difficult to evaluatethe project.
11.8 Comparison of Net Present Value and Internal Rate of Return
The Net Present Value method and the Internal Rate of Return method are similar in the sense thatboth takeinto account the time value to money.
In fact, both these methods are discounted cash.flow techniques. However, there are certain basic differencebetween these two methods of capital budgeting :
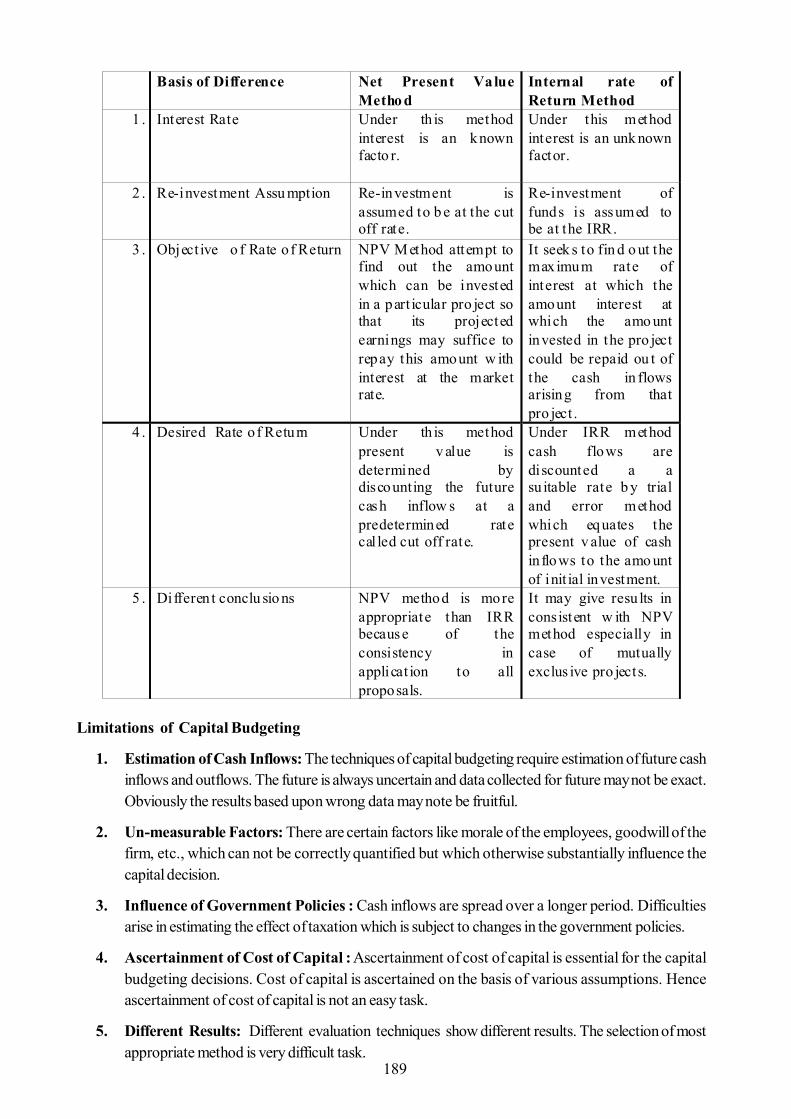
189
Limitations of Capital Budgeting
1. Estimation of Cash Inflows: The techniques of capital budgeting require estimation of future cashinflows and outflows. The future is always uncertain and data collected for future may not be exact.Obviously the results based upon wrong data may note be fruitful.
2. Un-measurable Factors: There are certain factors like morale of the employees, goodwill of thefirm, etc., which can not be correctly quantified but which otherwise substantially influence thecapital decision.
3. Influence of Government Policies : Cash inflows are spread over a longer period. Difficultiesarise in estimating the effect of taxation which is subject to changes in the government policies.
4. Ascertainment of Cost of Capital : Ascertainment of cost of capital is essential for the capitalbudgeting decisions. Cost of capital is ascertained on the basis of various assumptions. Henceascertainment of cost of capital is not an easy task.
5. Different Results: Different evaluation techniques show different results. The selection of mostappropriate method is very difficult task.
Basis of Difference Net Present Value Metho d
Internal rate of Return Method
1 . Interest Rate
Under th is method interest is an known facto r.
Under this method interest is an unk nown factor.
2 . Re-investment Assu mption
Re-investment is assumed to b e at the cut off rate.
Re-investment of funds is assumed to be at the IRR.
3 . Object ive o f Rate o f Return NPV M ethod attempt to find out the amount which can be invested in a part icular pro ject so that its projected earnings may suffice to repay this amount w ith interest at the market rate.
It seek s to fin d o ut the maximum rate of interest at which the amount interest at which the amo unt invested in the pro ject could be repaid ou t of the cash in flows arising from that pro ject .
4 . Desired Rate o f Return
Under th is method present v alue is determined by discounting the future cash inflow s at a predetermined rate cal led cut off rate.
Under IRR method cash flows are discounted a a su itable rate b y trial and error method which equates the present v alue of cash in flows to the amo unt of init ial investment.
5 . Differen t conclu sio ns NPV method is more appropriate than IRR because of the consistency in applicat ion to all proposals.
It may give resu lts in consistent w ith NPV method especially in case of mutually exclus ive pro jects.
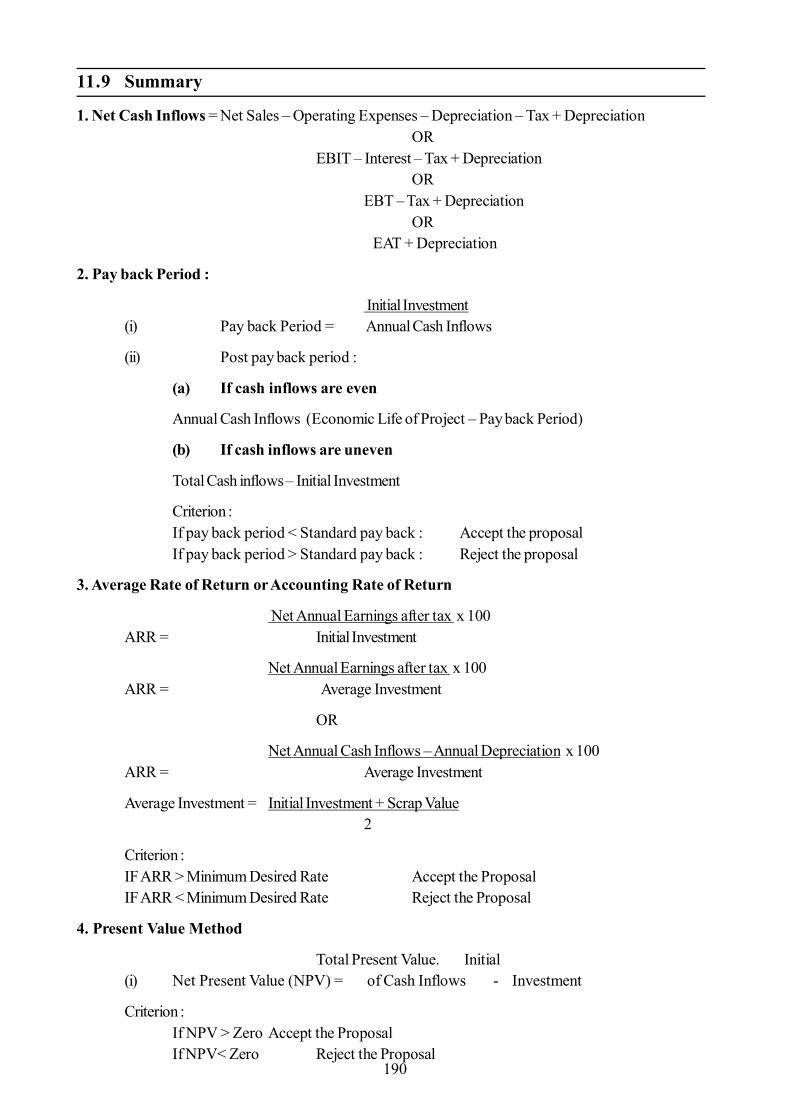
190
11.9 Summary
1. Net Cash Inflows = Net Sales – Operating Expenses – Depreciation – Tax + DepreciationOR
EBIT – Interest – Tax + DepreciationOR
EBT – Tax + DepreciationOR
EAT + Depreciation
2. Pay back Period :
Initial Investment(i) Pay back Period = Annual Cash Inflows
(ii) Post pay back period :
(a) If cash inflows are even
Annual Cash Inflows (Economic Life of Project – Pay back Period)
(b) If cash inflows are uneven
Total Cash inflows – Initial Investment
Criterion :If pay back period < Standard pay back : Accept the proposalIf pay back period > Standard pay back : Reject the proposal
3. Average Rate of Return or Accounting Rate of Return
Net Annual Earnings after tax x 100ARR = Initial Investment
Net Annual Earnings after tax x 100ARR = Average Investment
OR
Net Annual Cash Inflows – Annual Depreciation x 100ARR = Average Investment
Average Investment = Initial Investment + Scrap Value2
Criterion :IF ARR > Minimum Desired Rate Accept the ProposalIF ARR < Minimum Desired Rate Reject the Proposal
4. Present Value Method
Total Present Value. Initial(i) Net Present Value (NPV) = of Cash Inflows - Investment
Criterion :If NPV > Zero Accept the ProposalIf NPV< Zero Reject the Proposal
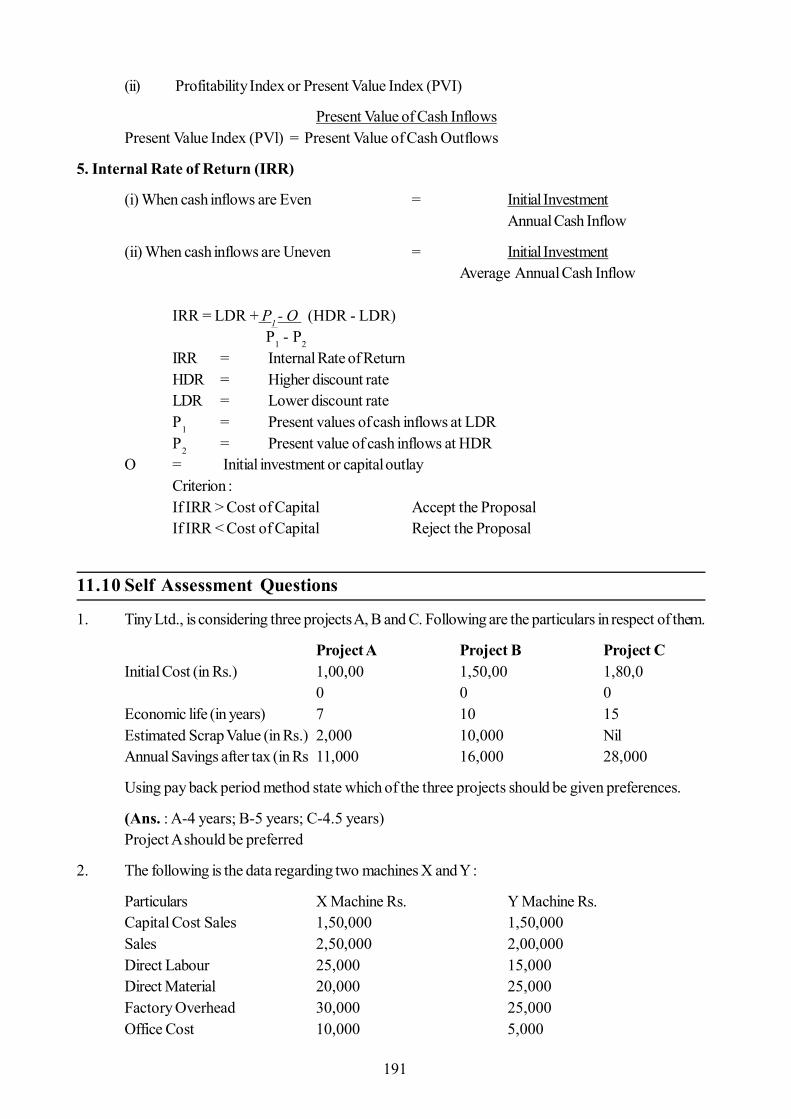
191
(ii) Profitability Index or Present Value Index (PVI)
Present Value of Cash InflowsPresent Value Index (PVl) = Present Value of Cash Outflows
5. Internal Rate of Return (IRR)
(i) When cash inflows are Even = Initial InvestmentAnnual Cash Inflow
(ii) When cash inflows are Uneven = Initial InvestmentAverage Annual Cash Inflow
IRR = LDR + P1 - O (HDR - LDR) P1 - P2
IRR = Internal Rate of ReturnHDR = Higher discount rateLDR = Lower discount rateP1 = Present values of cash inflows at LDRP2 = Present value of cash inflows at HDR
O = Initial investment or capital outlayCriterion :If IRR > Cost of Capital Accept the ProposalIf IRR < Cost of Capital Reject the Proposal
11.10 Self Assessment Questions
1. Tiny Ltd., is considering three projects A, B and C. Following are the particulars in respect of them.
Project A Project B Project CInitial Cost (in Rs.) 1,00,00 1,50,00 1,80,0
0 0 0Economic life (in years) 7 10 15Estimated Scrap Value (in Rs.) 2,000 10,000 NilAnnual Savings after tax (in Rs 11,000 16,000 28,000
Using pay back period method state which of the three projects should be given preferences.
(Ans. : A-4 years; B-5 years; C-4.5 years)Project A should be preferred
2. The following is the data regarding two machines X and Y :
Particulars X Machine Rs. Y Machine Rs.Capital Cost Sales 1,50,000 1,50,000Sales 2,50,000 2,00,000Direct Labour 25,000 15,000Direct Material 20,000 25,000Factory Overhead 30,000 25,000Office Cost 10,000 5,000
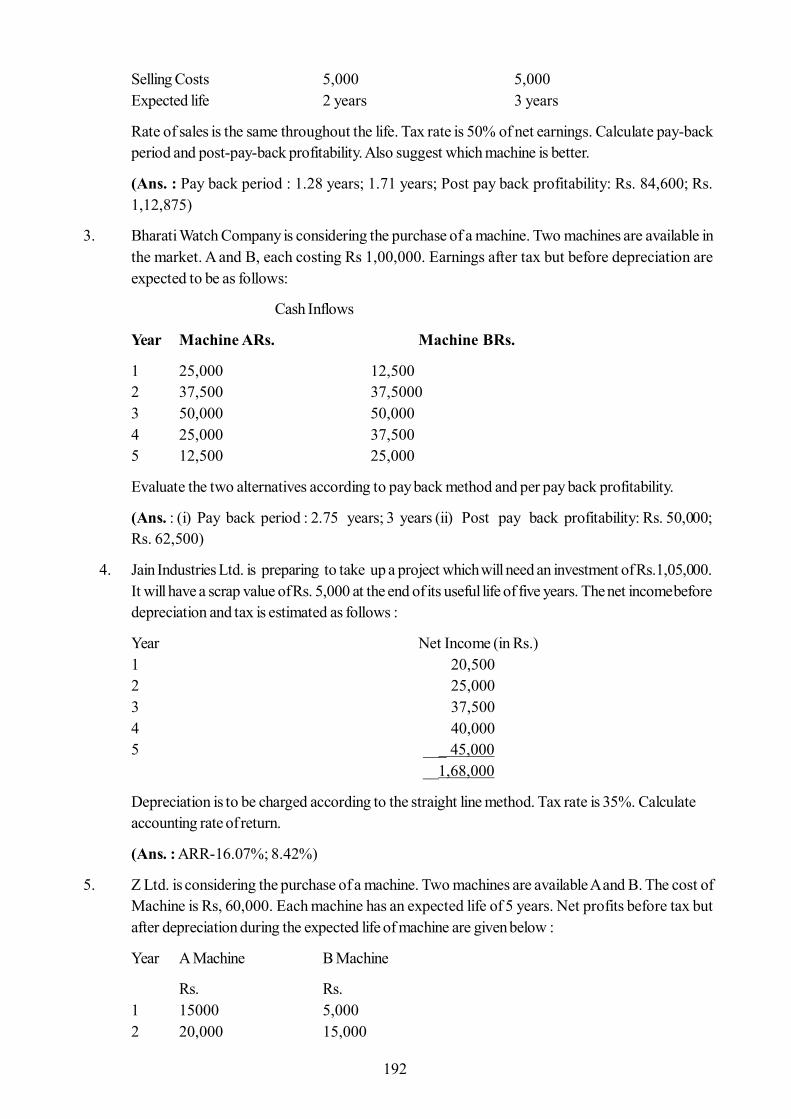
192
Selling Costs 5,000 5,000Expected life 2 years 3 years
Rate of sales is the same throughout the life. Tax rate is 50% of net earnings. Calculate pay-backperiod and post-pay-back profitability. Also suggest which machine is better.
(Ans. : Pay back period : 1.28 years; 1.71 years; Post pay back profitability: Rs. 84,600; Rs.1,12,875)
3. Bharati Watch Company is considering the purchase of a machine. Two machines are available inthe market. A and B, each costing Rs 1,00,000. Earnings after tax but before depreciation areexpected to be as follows:
Cash Inflows
Year Machine ARs. Machine BRs.
1 25,000 12,5002 37,500 37,50003 50,000 50,0004 25,000 37,5005 12,500 25,000
Evaluate the two alternatives according to pay back method and per pay back profitability.
(Ans. : (i) Pay back period : 2.75 years; 3 years (ii) Post pay back profitability: Rs. 50,000;Rs. 62,500)
4. Jain Industries Ltd. is preparing to take up a project which will need an investment of Rs.1,05,000.It will have a scrap value of Rs. 5,000 at the end of its useful life of five years. The net income beforedepreciation and tax is estimated as follows :
Year Net Income (in Rs.)1 20,5002 25,0003 37,5004 40,0005 ___ 45,000 __1,68,000
Depreciation is to be charged according to the straight line method. Tax rate is 35%. Calculateaccounting rate of return.
(Ans. : ARR-16.07%; 8.42%)
5. Z Ltd. is considering the purchase of a machine. Two machines are available A and B. The cost ofMachine is Rs, 60,000. Each machine has an expected life of 5 years. Net profits before tax butafter depreciation during the expected life of machine are given below :
Year A Machine B Machine
Rs. Rs.1 15000 5,0002 20,000 15,000
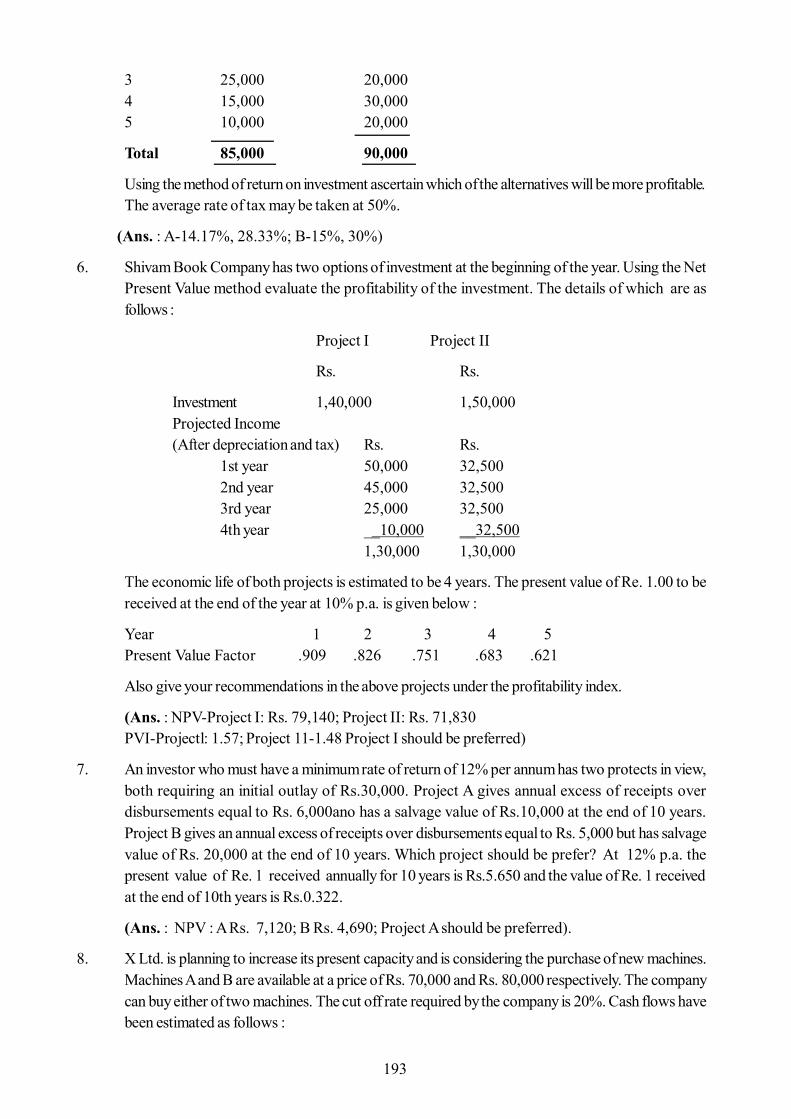
193
3 25,000 20,0004 15,000 30,0005 10,000 20,000
Total 85,000 90,000
Using the method of return on investment ascertain which of the alternatives will be more profitable.The average rate of tax may be taken at 50%.
(Ans. : A-14.17%, 28.33%; B-15%, 30%)
6. Shivam Book Company has two options of investment at the beginning of the year. Using the NetPresent Value method evaluate the profitability of the investment. The details of which are asfollows :
Project I Project II
Rs. Rs.
Investment 1,40,000 1,50,000Projected Income(After depreciation and tax) Rs. Rs.
1st year 50,000 32,5002nd year 45,000 32,5003rd year 25,000 32,5004th year __10,000 __32,500
1,30,000 1,30,000
The economic life of both projects is estimated to be 4 years. The present value of Re. 1.00 to bereceived at the end of the year at 10% p.a. is given below :
Year 1 2 3 4 5Present Value Factor .909 .826 .751 .683 .621
Also give your recommendations in the above projects under the profitability index.
(Ans. : NPV-Project I: Rs. 79,140; Project II: Rs. 71,830PVI-Projectl: 1.57; Project 11-1.48 Project I should be preferred)
7. An investor who must have a minimum rate of return of 12% per annum has two protects in view,both requiring an initial outlay of Rs.30,000. Project A gives annual excess of receipts overdisbursements equal to Rs. 6,000ano has a salvage value of Rs.10,000 at the end of 10 years.Project B gives an annual excess of receipts over disbursements equal to Rs. 5,000 but has salvagevalue of Rs. 20,000 at the end of 10 years. Which project should be prefer? At 12% p.a. thepresent value of Re. 1 received annually for 10 years is Rs.5.650 and the value of Re. 1 receivedat the end of 10th years is Rs.0.322.
(Ans. : NPV : A Rs. 7,120; B Rs. 4,690; Project A should be preferred).
8. X Ltd. is planning to increase its present capacity and is considering the purchase of new machines.Machines A and B are available at a price of Rs. 70,000 and Rs. 80,000 respectively. The companycan buy either of two machines. The cut off rate required by the company is 20%. Cash flows havebeen estimated as follows :
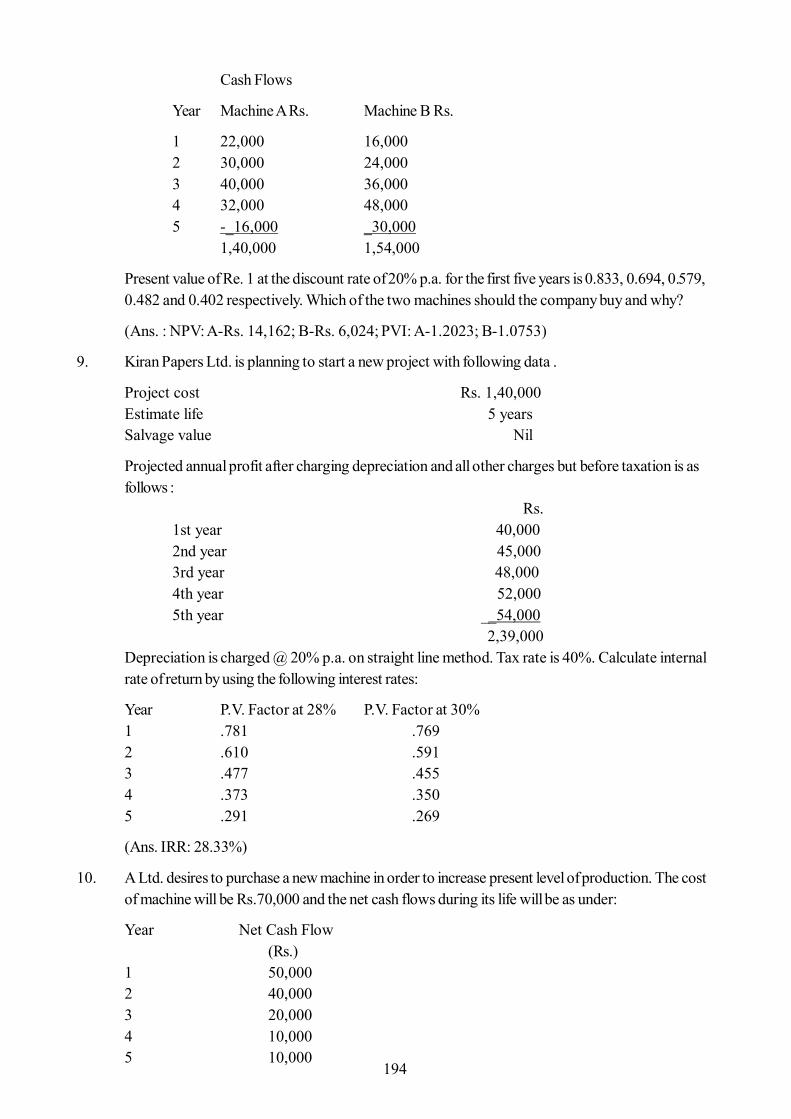
194
Cash Flows
Year Machine A Rs. Machine B Rs.
1 22,000 16,0002 30,000 24,0003 40,000 36,0004 32,000 48,0005 _16,000 _30,000
1,40,000 1,54,000
Present value of Re. 1 at the discount rate of 20% p.a. for the first five years is 0.833, 0.694, 0.579,0.482 and 0.402 respectively. Which of the two machines should the company buy and why?
(Ans. : NPV: A-Rs. 14,162; B-Rs. 6,024; PVI: A-1.2023; B-1.0753)
9. Kiran Papers Ltd. is planning to start a new project with following data .
Project cost Rs. 1,40,000Estimate life 5 yearsSalvage value Nil
Projected annual profit after charging depreciation and all other charges but before taxation is asfollows :
Rs.1st year 40,0002nd year 45,0003rd year 48,0004th year 52,0005th year __54,000
2,39,000Depreciation is charged @ 20% p.a. on straight line method. Tax rate is 40%. Calculate internalrate of return by using the following interest rates:
Year P.V. Factor at 28% P.V. Factor at 30%1 .781 .7692 .610 .5913 .477 .4554 .373 .3505 .291 .269
(Ans. IRR: 28.33%)
10. A Ltd. desires to purchase a new machine in order to increase present level of production. The costof machine will be Rs.70,000 and the net cash flows during its life will be as under:
Year Net Cash Flow(Rs.)
1 50,0002 40,0003 20,0004 10,0005 10,000
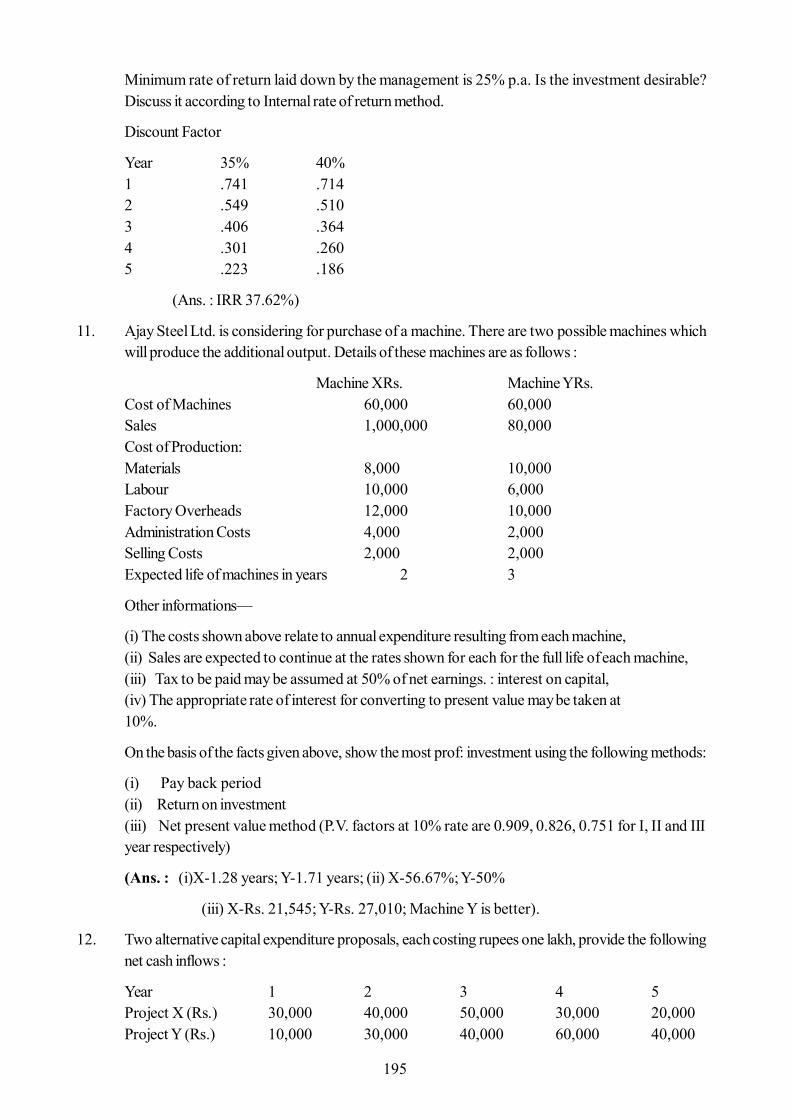
195
Minimum rate of return laid down by the management is 25% p.a. Is the investment desirable?Discuss it according to Internal rate of return method.
Discount Factor
Year 35% 40%1 .741 .7142 .549 .5103 .406 .3644 .301 .2605 .223 .186
(Ans. : IRR 37.62%)
11. Ajay Steel Ltd. is considering for purchase of a machine. There are two possible machines whichwill produce the additional output. Details of these machines are as follows :
Machine XRs. Machine YRs.Cost of Machines 60,000 60,000Sales 1,000,000 80,000Cost of Production:Materials 8,000 10,000Labour 10,000 6,000Factory Overheads 12,000 10,000Administration Costs 4,000 2,000Selling Costs 2,000 2,000Expected life of machines in years 2 3
Other informations—
(i) The costs shown above relate to annual expenditure resulting from each machine,(ii) Sales are expected to continue at the rates shown for each for the full life of each machine,(iii) Tax to be paid may be assumed at 50% of net earnings. : interest on capital,(iv) The appropriate rate of interest for converting to present value may be taken at10%.
On the basis of the facts given above, show the most prof: investment using the following methods:
(i) Pay back period(ii) Return on investment(iii) Net present value method (P.V. factors at 10% rate are 0.909, 0.826, 0.751 for I, II and IIIyear respectively)
(Ans. : (i)X-1.28 years; Y-1.71 years; (ii) X-56.67%; Y-50%
(iii) X-Rs. 21,545; Y-Rs. 27,010; Machine Y is better).
12. Two alternative capital expenditure proposals, each costing rupees one lakh, provide the followingnet cash inflows :
Year 1 2 3 4 5Project X (Rs.) 30,000 40,000 50,000 30,000 20,000Project Y (Rs.) 10,000 30,000 40,000 60,000 40,000
196
Evaluate these proposals on the basis of:
(i) Pay-back period method(ii) Post-pay-back profitability(iii) Return on investment method(iv) Net present value method.
Use a discount rate of 10% per annum. Discount factor at 10;-.various years is as follows:-
Year 1 2 3 4 5
Discount Factor 0,909 0.826 0.751 0.683 0.621
(Ans. : (i) X- 2 3/5 years; Y-31/3 years; (ii) X-Rs. 70,000; Y-Rs. 80,000(iii) X-28%; Y-32%; (iv) X-Rs. 30,770; Y-Rs. 29,730
11.11 Reference Books
- Khan & Jain : Financial Management, Tata Mc Graw Hill Co.
- Bierman, H. and Smidt., S. : Capital Budgeting Decisions, MacMillan
- S. N. Maheshwari : Financial Management, Sultan Chand & Co.
- Ravi, M. Kishore : Financial Management, Taxmann’s Publications
- Van Horne, J.C.: Financial Management & Policy, Prantice Hall
- Lawrence, D. Sohall & Chanles W. Haley: Introduction to Financial Management, Tata Mc GrawHill
- Kuchhal, S.C.; Financial Planning An Analytical Approach, Chaitanya Publishing House
- Ramchandaran, H. : Financial Planning & Control, S. Chand & Co.
- Agarwal & Agarwal : Financial Management, Ramesh Book Depot, Jaipur
- Malodia, G. L. : Financial Management, Jodhpur Publishing House, Jodhpur
197
Unit - 12 : Dividend Policy
Structure of Unit:
12.0 Objectives12.1 Introduction12.2 Concept and Meaning of Dividend Policy12.3 Determinants of Dividend Policy12.4 Types of Dividend12.5 Dividend Models and Value of Firm12.6 Summary12.7 Self Assessment Questions12.8 Reference Books
12.0 Objectives
After completing this unit, you would be able to understand:
Meaning of Dividend Meaning of Dividend Policy Different types of dividends Determinants of dividend policy Different dividend models The value of firm Computation of value of firm Characteristics and utility of leverages
12.1 Introduction
When a company makes profit at the end of the year from its operating activities, the management ofcompany must decide that what to do with those profits. They can decide to retain the profits withinthe company or may be decide to partly remain in company and remaining profits distribute to theshareholders of the company. If they decide to pay profits to the shareholders, then they have todetermine appropriate ratio of distribution and amount retain in the business. The part of profits whichhave to be distribute among the owners of the company i.e. shareholders, is called as dividend. Fordistribution of dividend, company frame a dividend policy according which company takes decision inrespect of payment of dividend in present and in future. On the basis of dividend policy a companydetermines that in what proportion profit should be distribute to the shareholders and to be retained inthe business. The retained portion of the profits in business is use in long term finance.
In simple terms, a company runs its business during any previous year and at the end of the previous yearcompany’s net result of operating activities is profit. The shareholders are owner of a company so they haveright on such profits. Company may be distributing such profits among the shareholders or may be retainedin the business. If company decides to distribute whole or a part of this profit among the shareholders, suchdistributable profit is Dividend. The board of directors declares the dividend. In other words we can saythat the dividend may be defined as divisible profits which are distributed amongst the members of companyin proportion of their share holding in the company. According to ICAI, New Delhi, “a dividend is adistribution to shareholders out of profits or reserves available for this purpose.”(Source: Guidance
198
notes on ‘Terms used in Financial Statements’, ICAI) The dividend declared by the board in annual generalmeeting (AGM). Quantum of the dividend depends on the company’s financial requirements and also dependson the availability of the divisible profits.
12.2 Concept and Meaning of Dividend Policy
For the financial manager of a company, it is crucial to take decision regarding to dividend because s/hehave to determine about the amount of profit to be distributed among the shareholders and the amount ofretained earnings. Amount of dividend and retained earnings have a reciprocal relationship. Market value ofshares depends on the payout ratio. While taking the dividend decision the management takes into accountthe effect of the decision on the shareholders’ wealth.
A dividend policy is a company’s approach to distributing profits back to its owners or stockholders. If acompany is in a growth mode, it may decide that it will not pay dividends, but rather re-invest its profits(retained earnings) in the business. If a company does decide to pay dividends, it must then decide howoften to do so, and at what rate. Large, well-established companies often pay dividends on a fixed schedule,but sometimes they also declare “special dividends.” The payment of dividends impacts the perception of acompany in financial markets, and it may also have a direct impact on its stock price. A company takes threemajor decisions i.e. Investments, financing and dividend. Dividend decision is most significant decision in allof these.
12.3 Determinants of Dividend Policy
The main determinants of dividend policy of a firm can be classified into:
1. Capital Market Considerations: Capital market consideration is also a determinant of dividendpolicy. If the company has easy access to the capital market in such case company should follow aliberal dividend policy and if company has limited access to capital market, it can opt a low dividendpayout ratio. Such companies rely on retained earnings as a major source of financing for futuregrowth.
2. Dividend Payout Ratio: Dividend payout ratio refers to the percentage of the net earnings distributedto the shareholders as dividends. On the basis of dividend policy owners of the company takes thedecision to pay out earnings or to retain them for reinvestment in the firm. A sufficient amount ofdividend creates satisfaction among the shareholders and the retained earnings constitute a sourceof finance. So, it is necessary that a) dividend policy should maintain a balance between currentdividends and future growth which maximizes the price of the firm’s shares and b) The dividendpayout ratio of a firm should be optimum so that firm can able to maximize the wealth of the firm’sowners and providing sufficient funds to finance growth.
3. Legal, Contractual and Internal Constraints and Restrictions: A company is not legallybounded for declaration of dividend but, they have to specify the conditions under which dividendsmust be paid. Such conditions pertain to capital impairment, net profits and insolvency. It may bethat a company accepts important contractual restrictions (when the company obtains externalfunds) in respect of payment of dividends. These restrictions may cause the firm to restrict thepayment of cash dividends until a certain level of earnings has been achieved or limit the amount ofdividends paid to a certain amount or percentage of earnings. Internal constraints are unique to afirm and include liquid assets, growth prospects, financial requirements, availability of funds, earningsstability and control.
199
4. Inflation: In case of situation of inflation, the funds generated from depreciation may not be sufficientto replace obsolete equipments and machinery. In such situation, a company should rely uponretained earnings as a source of fund to replace those assets. Thus, dividend payout ratio negativelyaffected due to inflation.
5. Age of Corporation: A newly establish company will invest their earning for expansion and plantimprovement and may adopt a rigid dividend policy. But if company is well established, it can framea more consistent policy in respect of dividend. So, we can say that dividend policy is also affectedby the age of the corporation.
6. Stability of Earnings: If a company having stability of earnings, such company can maintainconsistency in its dividend policy. Stability of earnings depends on nature of business e.g. firmsdealing in luxurious or fancy goods can earn more profits. So, we can say that the nature of businesshas an important bearing on the dividend policy.
7. Requirement of Additional Capital: In case of small companies, they face the difficulties ofadditional finance for expansion programs. Every company retains a part of their profits forstrengthening their financial position. Thus, such Companies distribute dividend at low rates andretain a big part of profits
8. Liquidity of Funds: If a company decides to pay dividend in cash then it may be only if companyhas sufficient funds. So, availability of cash and sound financial position is equally affected to dividendpolicy. Payment of dividend represents a cash outflow. More availability of funds and good liquidityposition of company show the better ability to pay dividend. If cash position is weak, stock dividendwill be distributed and if cash position is good, company can distribute the cash dividend.
9. Trade Cycles: Business cycles also exercise influence upon dividend Policy. Dividend policy isadjusted according to the business oscillations. During the boom, prudent management createsfood reserves for contingencies which follow the inflationary period. Higher rates of dividend canbe used as a tool for marketing the securities in an otherwise depressed market. The financialsolvency can be proved and maintained by the companies in dull years if the adequate reserveshave been built up.
10. Government Policies. Various Government Policies: Fiscal, industrial, taxation etc. affect tothe earnings capacity of the enterprise. The dividend policy has to be modified according to thechanges in government policies.
11. Taxation Policy: Taxation policy of government also affects the decision of distribution of dividend.In case of high taxation rate a major part of earnings will be paid to government by way of tax,hence rate of dividend will be lowered down. In case of low taxation, the company will be able topay dividend at higher rate.
12. Policy of Control: Policy of control is another determining factor is so far as dividends are concerned.If the directors want to have control on company, they would not like to add new shareholders andtherefore, declare a dividend at low rate. Because by adding new shareholders they fear dilution ofcontrol and diversion of policies and programs of the existing management. So they prefer to meetthe needs through retained earnings. If the directors do not bother about the control of affairs theywill follow a liberal dividend policy. Thus control is an influencing factor in framing the dividendpolicy.
200
13. Legal Requirements: The companies’ act 1956 prescribes guidelines in respect of declarationand payment of dividend. These guidelines issued in order to protect the interest of creditors e.g. acompany is required to provide for depreciation on its fixed and tangible assets before declaringdividend on shares. It proposes that Dividend should not be distributed out of capita, in any case.
12.4 Types of Dividend
I. Dividend on the Basis of Security: There are two types of securities on which company paysdividend i.e. 1) Preference shares 2) Equity shares. Company pays following two types dividend onthese securities:
a) Preference Dividend- On preference Share Company pays dividend at fix rate. At thetime of issue of preference shares, company declares the rate of dividend on these shares.Since dividend on these shares is fixed, so, mostly discussion on dividend policy is relatesto the equity dividend.
b) Equity Dividend- In case of equity shares the rate of dividend cannot be pre determined.Dividend on equity shares is paid at the rate recommended by the board of directors andapproved by the shareholders in Annual General Meeting (AGM). The board of directorshas the right in respect of payment of dividend, the rate of dividend and the medium ofdividend.
II. Dividend on the Basis of Time: On the basis of time, there are two types of dividend-
a) Interim Dividend- When a company earns huge profits or we can say that abnormalprofits during any particular year and directors wish to distribute these profits among theshareholders, then company declares dividend at any time between two AGM. It is calledinterim dividend. In other words, we can say that interim dividend is the dividend which canbe declare and distribute at any time within the financial year. Interim dividend may bedeclare if, Article of association permits for it. Interim dividend is an extra dividend paid incash within the year without requirement of approval in AGM.
b) Regular Dividend- It is annual dividend declares after approval in AGM. This dividendpays by the company after completion of financial year. The rate of dividend depends onthe financial performance of the company in particular year.
III. Dividend on the Basis of Mode of Payment: On the basis of mode of payment, dividend maybe classified in following three categories-
a) Cash Dividend- Mostly, shareholders are interested in cash dividend. When companypays dividend in cash, it indicates outflows of cash from company to its shareholders.Company pays cash dividend out of current sources available in the company or by takingshort term loans from banks and other financial institutions. A company may take decisionof cash payment of dividend, when sufficient funds are available and liquidity position ofcompany is sound. Cash dividend is most desirable mode of payment of dividend. It builtconfidence and faith in investor’s mind about company.
b) Stock Dividend- If any company has a huge amount of reserves & surplus but sufferingfrom problem of shortage of liquidity of funds. In such case, if company wants to distributereserves & surplus among the shareholders, then the company issue new shares to existing
201
shareholders at free of cost. Shareholders receive shares In place of cash dividend. Suchshares are known as “Bonus shares” or “Stock dividend”. In this process whole or a part ofprofits converts into share capital, so, it also called as “Capitalisation of profits”.
c) Scrip or Bond Dividend: If any company is facing a financial crisis, in such circumstancescompany pays dividend in the form of shares and debentures of other companies. This formof dividend is called as scrip or bond dividend. The main difference of scrip dividend andbond dividend is of time period. In case of scrip dividend, securities belong to short termsecurities and in case of bond dividend it is long term securities.
12.5 Dividend Models and Value of Firm
(A) Walter’s Dividend Model: Walter’s model supports the principle that dividends are relevant. Theinvestment policy of a firm cannot be separated from its dividend policy and both are inter-related.The choice of an appropriate dividend policy affects the value of an enterprise.
Assumptions of This Model: The company does not rely upon external funds. It means that retained earningsare the only source of finance.
1. Internal rate of return (r) and cost of capital (k) are constant.2. There is no change in the key variables, namely, beginning earnings per share (E), and dividends per
share (D). The values of D and E may be changed in the model to determine results, but any givenvalue of E and D are assumed to remain constant in determining a given value.
3. The firm has an infinite life.
Formula: Walter’s model
P = D Ke – g
Where: P =Price of Equity shareD = Dividend Per shareKe = Cost of equity sharesG = Growth rate in dividend
After accounting for retained earnings, the model would be:
P = D Ke – rb
Where: r = Expected rate of return on firm’s investmentsb = Retention rate (E - D)/E
Equation showing the value of a share (as present value of all dividends plus the present value of all capitalgains) – Walter’s model:
P = D + r (E-D)/Ke Ke Ke
Where: D = Dividend per share andE = Earnings per share
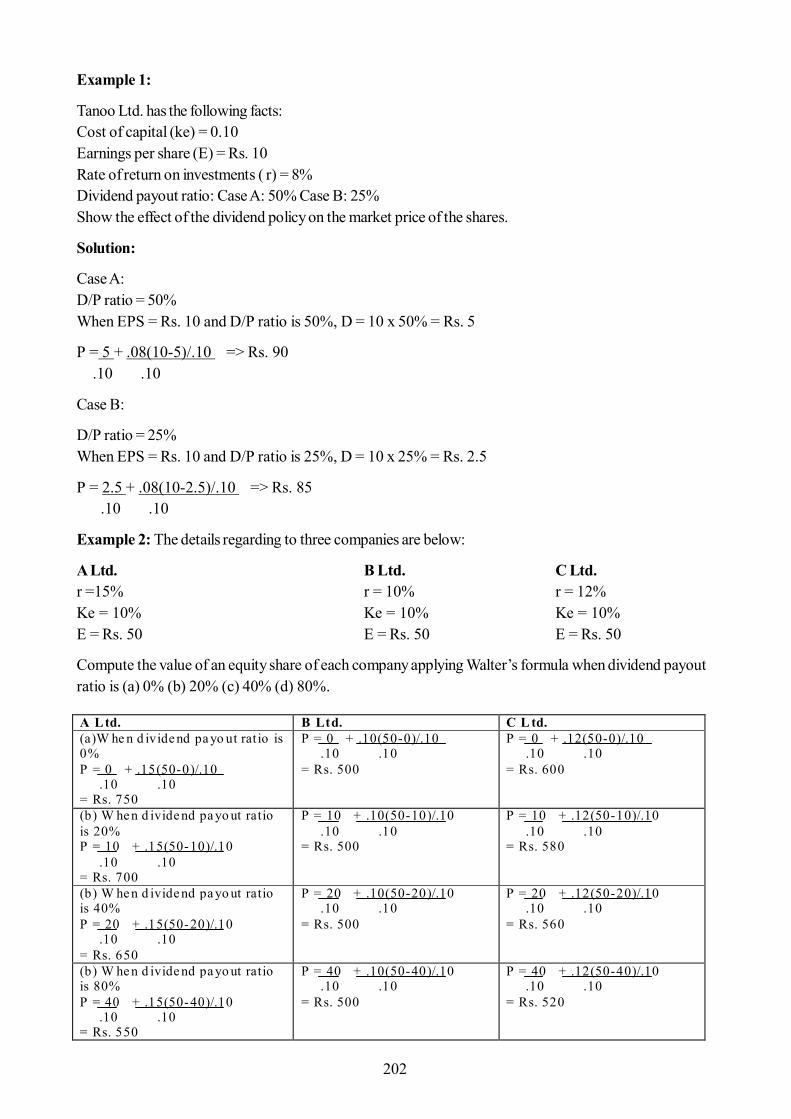
202
Example 1:
Tanoo Ltd. has the following facts:Cost of capital (ke) = 0.10Earnings per share (E) = Rs. 10Rate of return on investments ( r) = 8%Dividend payout ratio: Case A: 50% Case B: 25%Show the effect of the dividend policy on the market price of the shares.
Solution:
Case A:D/P ratio = 50%When EPS = Rs. 10 and D/P ratio is 50%, D = 10 x 50% = Rs. 5
P = 5 + .08(10-5)/.10 => Rs. 90 .10 .10
Case B:
D/P ratio = 25%When EPS = Rs. 10 and D/P ratio is 25%, D = 10 x 25% = Rs. 2.5
P = 2.5 + .08(10-2.5)/.10 => Rs. 85 .10 .10
Example 2: The details regarding to three companies are below:
A Ltd. B Ltd. C Ltd.r =15% r = 10% r = 12%Ke = 10% Ke = 10% Ke = 10%E = Rs. 50 E = Rs. 50 E = Rs. 50
Compute the value of an equity share of each company applying Walter’s formula when dividend payoutratio is (a) 0% (b) 20% (c) 40% (d) 80%.
A Ltd. B Ltd. C L td. (a)W he n d ivide nd pa yo ut rat io is 0% P = 0 + .15(50-0)/.10 .10 .10 = Rs. 750
P = 0 + .10(50-0)/.10 .10 .10 = Rs. 500
P = 0 + .12(50-0)/.10 .10 .10 = Rs. 600
(b) W he n d ivide nd pa yo ut ratio is 20% P = 10 + .15(50-10)/.10 .10 .10 = Rs. 700
P = 10 + .10(50-10)/.10 .10 .10 = Rs. 500
P = 10 + .12(50-10)/.10 .10 .10 = Rs. 580
(b) W he n d ivide nd pa yo ut ratio is 40% P = 20 + .15(50-20)/.10 .10 .10 = Rs. 650
P = 20 + .10(50-20)/.10 .10 .10 = Rs. 500
P = 20 + .12(50-20)/.10 .10 .10 = Rs. 560
(b) W he n d ivide nd pa yo ut ratio is 80% P = 40 + .15(50-40)/.10 .10 .10 = Rs. 550
P = 40 + .10(50-40)/.10 .10 .10 = Rs. 500
P = 40 + .12(50-40)/.10 .10 .10 = Rs. 520
203
Conclusions of Walter’s Model: Prof. Walter’s concept may be summarized as under:
1. Growth Firms (When r > ke): The value of shares is inversely related to the Dividend Payoutratio. As the Dividend Payout ratio increases, the market value of shares decline. Its value is thehighest when Dividend Payout ratio is 0 and should re-invest their entire earnings. So, if the firmretains its earnings entirely, it will maximize the market value of the shares. The optimum payoutratio is zero.
2. Declining Firms (When r < ke): The Dividend Payout ratio and the value of shares are positivelycorrelated. In such case the firms are called declining firms. As the Dividend Payout ratio increases,the market price of the shares also increases. The optimum payout ratio is 100%. Such firms shoulddistribute their entire earnings.
3. Normal Firms (When r = ke): The market value of shares is constant irrespective of the DividendPayout ratio. In this case, there is no optimum D/P ratio.
Limitations of this model:
1. This model can be applicable only to all equity owned firms because Walter’s model assumes thatthe firm’s investments are purely financed by retained earnings.
2. The assumption of r as constant is not realistic because the risk factor of a firm is not alwaysuniform.
3. The assumption of a constant Ke ignores the effect of risk on the value of the firm.
(B) Gordon’s Dividend Capitalization Model: Gordon’s dividend model contends that dividendsare relevant. This model is of the view that dividend policy of a firm affects its market value ofshares.
Assumptions of This Model: The firm is an all equity firm. No external financing is used and investmentprogrammes are financed exclusively by retained earnings.
1. Return on investment (r) and Cost of equity (Ke) are constant.
2. The firm has perpetual life.
3. The retention ratio, once decided upon, is constant. Thus, the growth rate, (g = br) is also constant.
4. Ke > br
5. Corporate taxes do not exist.
Arguments of This Model:
1. Dividend policy of the firm is relevant and that investors put a positive premium on current incomes/dividends.
2. Market value of shares is equal to the present value of its expected future dividends.
3. This model assumes that investors are risk averse and they put a premium on a certain return anddiscount uncertain returns.
4. Investors are rational and want to avoid risk.
5. The rational investors can reasonably be expected to prefer current dividend. They would discountfuture dividends. The retained earnings are evaluated by the investors as a risky promise. In case
204
the earnings are retained, the market price of the shares would be adversely affected. In case theearnings are retained, the market price of the shares would be adversely affected.
6. Investors would be inclined to pay a higher price for shares on which current dividends are paid.
Dividend Capitalization Model: According to Gordon, the market value of a share is equal to thepresent value of the future streams of dividends.
P = E(1-b) Ke – br
Where:
P = Price per shareE = Earnings per shareB = Retention ratio1-b = Dividend payout ratioKe = Cost of Equitybr = g = Growth rate
Example 3: Determination of value of shares, given the following data:
Case A Case B D/P Ratio 40 30Retention Ratio 60 70Cost of Capital 17% 18%Return on investments 12% 12%EPS Rs. 20 Rs. 20
Solution:
Case A
P = Rs. 20 (1-.6) = Rs. 81.630.17- (0.60 x 0.12)
Case B
P = Rs. 20 (1- 0.70) = Rs. 62.50 0.18 – (0.70 x 0.12)
Gordon’s model thus asserts that the dividend decision has a bearing on the market price of the shares andthat the market price of the share is favorably affected with more dividends.
Example 4: The details regarding to three companies are below:
Palki Ltd. Shivang Ltd. Rrudraksh Ltd.
R > Ke R = Ke R < Ker =15% r = 10% r = 8%Ke = 13% Ke = 10% Ke = 10%E = Rs. 20 E = Rs. 20 E = Rs. 20
Compute the market value of an equity share of each company applying Gordon’s formula when dividendpayout ratio is (a) 30% (b) 20% (c) 50%.
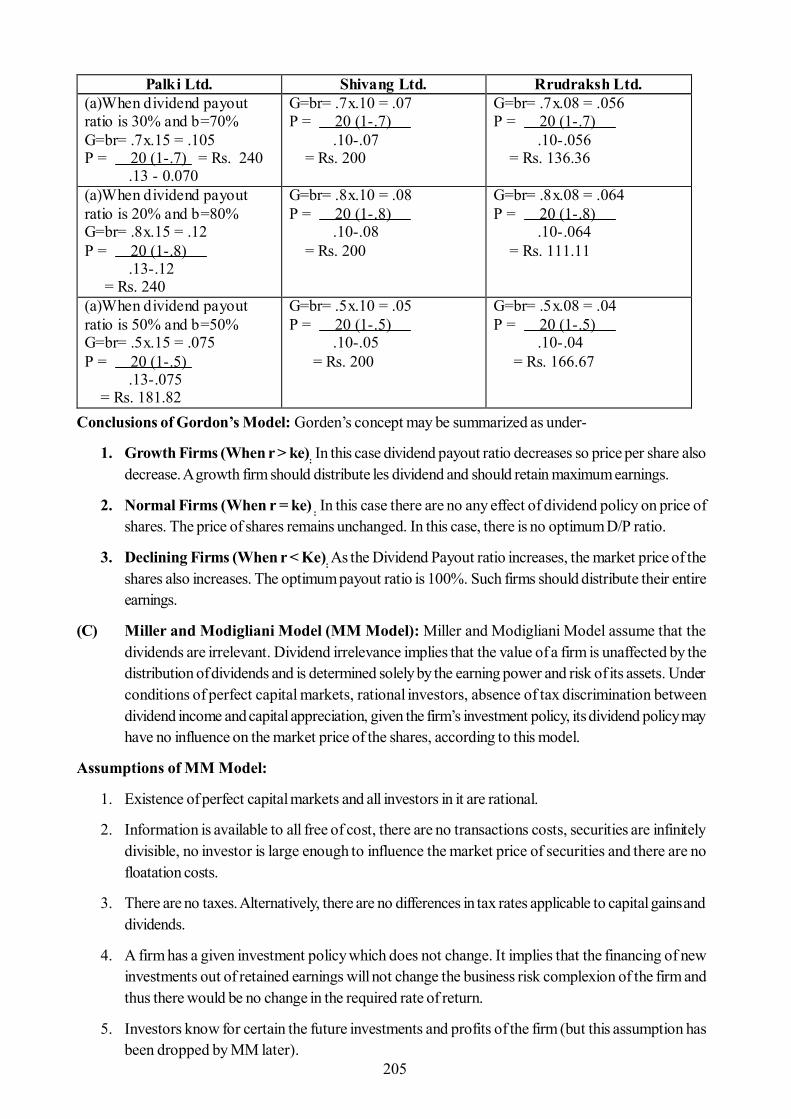
205
Conclusions of Gordon’s Model: Gorden’s concept may be summarized as under-
1. Growth Firms (When r > ke): In this case dividend payout ratio decreases so price per share alsodecrease. A growth firm should distribute les dividend and should retain maximum earnings.
2. Normal Firms (When r = ke) : In this case there are no any effect of dividend policy on price ofshares. The price of shares remains unchanged. In this case, there is no optimum D/P ratio.
3. Declining Firms (When r < Ke): As the Dividend Payout ratio increases, the market price of theshares also increases. The optimum payout ratio is 100%. Such firms should distribute their entireearnings.
(C) Miller and Modigliani Model (MM Model): Miller and Modigliani Model assume that thedividends are irrelevant. Dividend irrelevance implies that the value of a firm is unaffected by thedistribution of dividends and is determined solely by the earning power and risk of its assets. Underconditions of perfect capital markets, rational investors, absence of tax discrimination betweendividend income and capital appreciation, given the firm’s investment policy, its dividend policy mayhave no influence on the market price of the shares, according to this model.
Assumptions of MM Model:
1. Existence of perfect capital markets and all investors in it are rational.
2. Information is available to all free of cost, there are no transactions costs, securities are infinitelydivisible, no investor is large enough to influence the market price of securities and there are nofloatation costs.
3. There are no taxes. Alternatively, there are no differences in tax rates applicable to capital gains anddividends.
4. A firm has a given investment policy which does not change. It implies that the financing of newinvestments out of retained earnings will not change the business risk complexion of the firm andthus there would be no change in the required rate of return.
5. Investors know for certain the future investments and profits of the firm (but this assumption hasbeen dropped by MM later).
Palki Ltd. Shivang Ltd. Rrudraksh Ltd. (a)When dividend payout ratio is 30% and b=70% G=br= .7x.15 = .105 P = 20 (1-.7) = Rs. 240 .13 - 0.070
G=br= .7x.10 = .07 P = 20 (1-.7) .10-.07 = Rs. 200
G=br= .7x.08 = .056 P = 20 (1-.7) .10-.056 = Rs. 136.36
(a)When dividend payout ratio is 20% and b=80% G=br= .8x.15 = .12 P = 20 (1-.8) .13-.12 = Rs. 240
G=br= .8x.10 = .08 P = 20 (1-.8) .10-.08 = Rs. 200
G=br= .8x.08 = .064 P = 20 (1-.8) .10-.064 = Rs. 111.11
(a)When dividend payout ratio is 50% and b=50% G=br= .5x.15 = .075 P = 20 (1-.5) .13-.075 = Rs. 181.82
G=br= .5x.10 = .05 P = 20 (1-.5) .10-.05 = Rs. 200
G=br= .5x.08 = .04 P = 20 (1-.5) .10-.04 = Rs. 166.67
206
Argument of This Model: By the argument of arbitrage, MM Model asserts the irrelevance of dividends.Arbitrage implies the distribution of earnings to shareholders and raising an equal amount externally. Theeffect of dividend payment would be offset by the effect of raising additional funds. MM model argues thatwhen dividends are paid to the shareholders, the market price of the shares will decrease and thus whateveris gained by the investors as a result of increased dividends will be neutralized completely by the reductionin the market value of the shares. The cost of capital is independent of leverage and the real cost of debt isthe same as the real cost of equity, according to this model. Those investors are indifferent between dividendand retained earnings imply that the dividend decision is irrelevant. With dividends being irrelevant, a firm’scost of capital would be independent of its dividend-payout ratio. Arbitrage process will ensure that underconditions of uncertainty also the dividend policy would be irrelevant.
MM Model:
Market price of the share in the beginning of the period = Present value of dividends paid at the endof the period + Market price of share at the end of the period.
P0 = D1 + P1
1 + Ke
Where:
Po = Prevailing market price of a shareKe = Cost of EquityD1 = Dividend to be received at the end of period 1 andP1 = Market price of a share at the end of period 1.The Market price of shares at the end of the period can be calculated by using the following formula:P1 = P0 (1 + Ke) – D1
Value of the firm can also be calculated by applying the following formula:
nP0 = (n + m) P1 – (1 - X)
(1 + Ke)
Where:
n = number of shares outstanding at the beginning of the periodm = number of shares to be issued at the ending of the periodP1 = Market price of the share at the end of the periodKe = Cost of equityI = Total amount required for investmentX = Total net profit of the firm during the period
Example 5: Bhagwati Ltd. whose capitalization rate is 10% has outstanding shares of 25,000 selling at Rs.100 each. The firm is expecting to pay a dividend of Rs. 5 per share at the end of the current financial year.The company’s expected net earnings are Rs. 250,000 and the new proposed investment requires Rs.500,000. Prove that using MM model, the payment of dividend does not affect the value of the firm.
Solution:
1. Value of the firm when dividends are paid:
i. Price per share at the end of year 1:
207
P0 = 1/(1 + ke) x (D1 + P1) Rs. 100 = 1/(1 + 0.10) x (Rs. 5 + P1) P1 = Rs. 105
ii. Amount required to be raised from the issue of new shares:
“ n P1 = I – (E – nD1) => Rs. 500,000 – (Rs. 250,000 - Rs. 125,000) => Rs. 375,000
iii. Number of additional shares to be issued:
“n = Rs. 375,000 / 105 => 3571.42857 shares or 3572 shares
iv. Value of the firm:
nP0 = (n + m) P1 – (1 - X) (1 + Ke)
= (25, 000 + 3572) x 105- (Rs. 5, 00,000 – Rs. 2, 50,000)(1 + 0.10)
= Rs. 25, 00,000
2. Value of the firm when dividends are not paid:
i. Price per share at the end of year 1:
P0 = 1/(1 + ke) x (D1 + P1) Rs. 100 = 1/(1 + 0.10) x (Rs. 0 + P1) P1 = Rs. 110
ii. Amount required to be raised from the issue of new shares:
=> Rs. 500,000 – (Rs. 250,000 -0) = Rs. 250,000
iii. Number of additional shares to be issued:
=> Rs. 250,000/Rs. 110 = 2273
iv. Value of the firm:
nP0 = (n + m) P1 – (1 - X) (1 + Ke)
= (25, 000 + 2273) x 110 - (Rs. 5, 00,000 – Rs. 2, 50,000)(1 + 0.10)
= Rs. 25, 00,000
Thus, according to MM model, the value of the firm remains the same whether dividends are paid or not.This example proves that the shareholders are indifferent between the retention of profits and the paymentof dividend.
Limitations of MM Model:
1. The assumption of perfect capital market is unrealistic. Practically, there are taxes, floatation costsand transaction costs.
208
2. Investors cannot be indifferent between dividend and retained earnings under conditions of uncertainty.This can be proved at least with the aspects of i) near Vs distant dividends, ii) informational contentof dividends, iii) preference for current income and iv) sale of stock at uncertain price.
12.6 Summary
The part of profits which have to be distribute among the owners of the company i.e.shareholders, is called as dividend.
A dividend policy is a company’s approach to distributing profits back to its owners or stockholders.
In case of inflation a company should rely upon retained earnings as a source of fund to replacethose assets.
Walter’s Formula
P = D Ke – g
Gorden’ formula
P = E(1-b)Ke – br
· Modigliani – Miller formula
P0 = D1 + P1
1 + Ke
12.7 Self Assessment Questions
1. What do you understand by Dividend?
2. What do you understand by Retained earnings?
3. Define dividend policy.
4. State any four determinants of dividend policy.
5. Explain assumptions of Walter’s model.
6. Explain various types of dividend.
7. State assumptions of M-M Model.
8. X ltd. earns Rs. 10 per share is capitalized at 10% and has a return on investment of 15%. UsingWalter’s formula, determine – (1) the optimum payout and (2) the price of share at this payout.
9. Following are the details regarding three companies:
The details regarding to three companies are below:A Ltd. B Ltd. C Ltd.R > Ke R = Ke R < Ker =15% r = 10% r = 8%Ke = 12% Ke = 10% Ke = 10%E = Rs. 15 E = Rs. 15 E = Rs. 15
209
You are required to calculate the effect of dividend payment on the value of shares of each of the abovecompanies under the following situations by using Walter’s formula.
(a) When no dividend is paid.(b) When dividend is paid at Rs. 8 per share.
12.8 Reference Books
- Ravi M. Kishore - “Financial Management” 6th edition, 2005 - Taxmen’s, New Delhi.
- M. R. Agrwal – “Financial Management (Principles & practices)”- Garima publications, Jaipur,2010.
- Dr. R. P. Rustagi – “Basic Financial Management” 4th edition, 2012 – Sultan Chand & Sons, NewDelhi.
- Dr. S. N. Maheshwari – “Elements of Financial Management” 10th revised edition, 2012 - SultanChand & Sons, New Delhi.
210
Unit -13 : Operating and Financial Leverages
Structure of Unit:
13.0 Objectives13.1 Introduction and Meaning of Leverage13.2 Operating Leverage13.3 Financial Leverage13.4 Combined Leverage13.5 Summary13.6 Self Assessment Questions13.7 Reference Books
13.0 Objectives
After completing this unit, you would be able to understand:
Meaning of Leverage Different types of leverages Meaning of Operating leverage and degree of Operating leverage Meaning of Financial leverage and degree of Financial leverage Meaning of Combined leverage and degree of Combined leverage Computation of different types of leverages and degree of Leverages Characteristics and utility of leverages
13.1 Introduction and Meaning of Leverage
Leverage is a business term that refers to borrowing. If a business is “leveraged,” it means that the businesshas borrowed money to finance the purchase of assets. The other way to purchase assets is through use ofowner funds, or Equity.
Organizations in today’s fast changing environment face intense competition, economic fluctuations, changingprofile of developing and developed economies, technological breakthroughs and developments, changingsocial values, demographic profiles, legal system, regulatory mechanisms, government policies, culturalprofiles, etc. Originally the word ‘Leverages’ is come from Physics. In Physics the word Leverages refers to‘Weight’. If we convert it into commercial term ‘The weight’ for any businessmen is of fixed expenses. So,we can say that leverage can be calculated of any firm in a case when fixed expenses are in existing in thatfirm. If any firm does not incurs any amount of fixed expenses then leverage can’t be calculate of this firm.
Leverage is a ratio which shows a relationship between Revenue before charging fixed expenses andRevenue after charging fixed expenses. So, we can say that leverage may be calculated in case ofexistence of fixed expenses in the firm. If there are no any fixed expenses then we can’t calculate leverages.
13.2 Operating Leverage
13.2.1 What is Operating Leverage?
In any business concern there are two types of fixed expenses- 1) Fixed expenses of operating nature e.g.Salaries, Rent, etc. 2) Fixed expenses of fInancial nature e.g. Interest on loan. Essentially, operating leverageboils down to an analysis of fixed cost and variable cost. Operating leverage is highest in companies thathave a high proportion of fixed operating costs in relation to variable operating costs. This kind of company
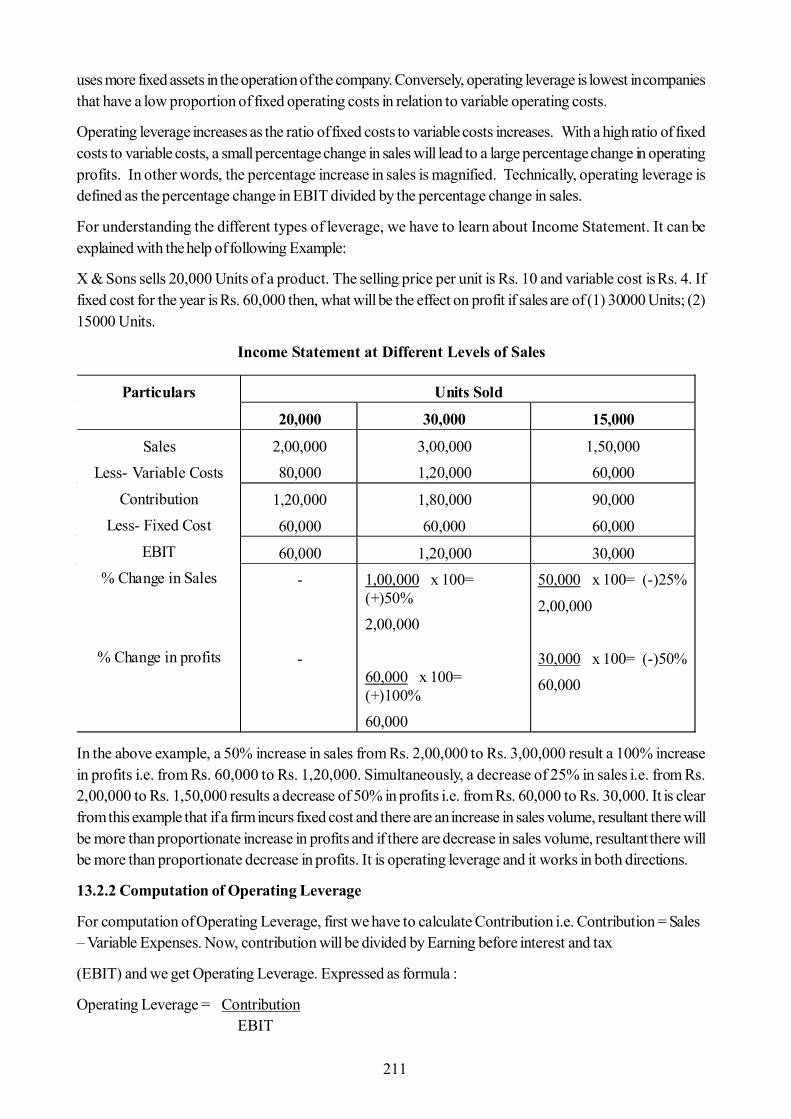
211
uses more fixed assets in the operation of the company. Conversely, operating leverage is lowest in companiesthat have a low proportion of fixed operating costs in relation to variable operating costs.
Operating leverage increases as the ratio of fixed costs to variable costs increases. With a high ratio of fixedcosts to variable costs, a small percentage change in sales will lead to a large percentage change in operatingprofits. In other words, the percentage increase in sales is magnified. Technically, operating leverage isdefined as the percentage change in EBIT divided by the percentage change in sales.
For understanding the different types of leverage, we have to learn about Income Statement. It can beexplained with the help of following Example:
X & Sons sells 20,000 Units of a product. The selling price per unit is Rs. 10 and variable cost is Rs. 4. Iffixed cost for the year is Rs. 60,000 then, what will be the effect on profit if sales are of (1) 30000 Units; (2)15000 Units.
Income Statement at Different Levels of Sales
In the above example, a 50% increase in sales from Rs. 2,00,000 to Rs. 3,00,000 result a 100% increasein profits i.e. from Rs. 60,000 to Rs. 1,20,000. Simultaneously, a decrease of 25% in sales i.e. from Rs.2,00,000 to Rs. 1,50,000 results a decrease of 50% in profits i.e. from Rs. 60,000 to Rs. 30,000. It is clearfrom this example that if a firm incurs fixed cost and there are an increase in sales volume, resultant there willbe more than proportionate increase in profits and if there are decrease in sales volume, resultant there willbe more than proportionate decrease in profits. It is operating leverage and it works in both directions.
13.2.2 Computation of Operating Leverage
For computation of Operating Leverage, first we have to calculate Contribution i.e. Contribution = Sales– Variable Expenses. Now, contribution will be divided by Earning before interest and tax
(EBIT) and we get Operating Leverage. Expressed as formula :
Operating Leverage = Contribution EBIT
Particulars Units Sold
20,000 30,000 15,000
Sales Less- Variable Costs
Contribution Less- Fixed Cost
EBIT % Change in Sales
% Change in profits
2,00,000 80,000
3,00,000 1,20,000
1,50,000 60,000
1,20,000
60,000
1,80,000
60,000
90,000
60,000
60,000 1,20,000 30,000 -
-
1,00,000 x 100= (+)50% 2,00,000
60,000 x 100= (+)100% 60,000
50,000 x 100= (-)25%
2,00,000
30,000 x 100= (-)50% 60,000
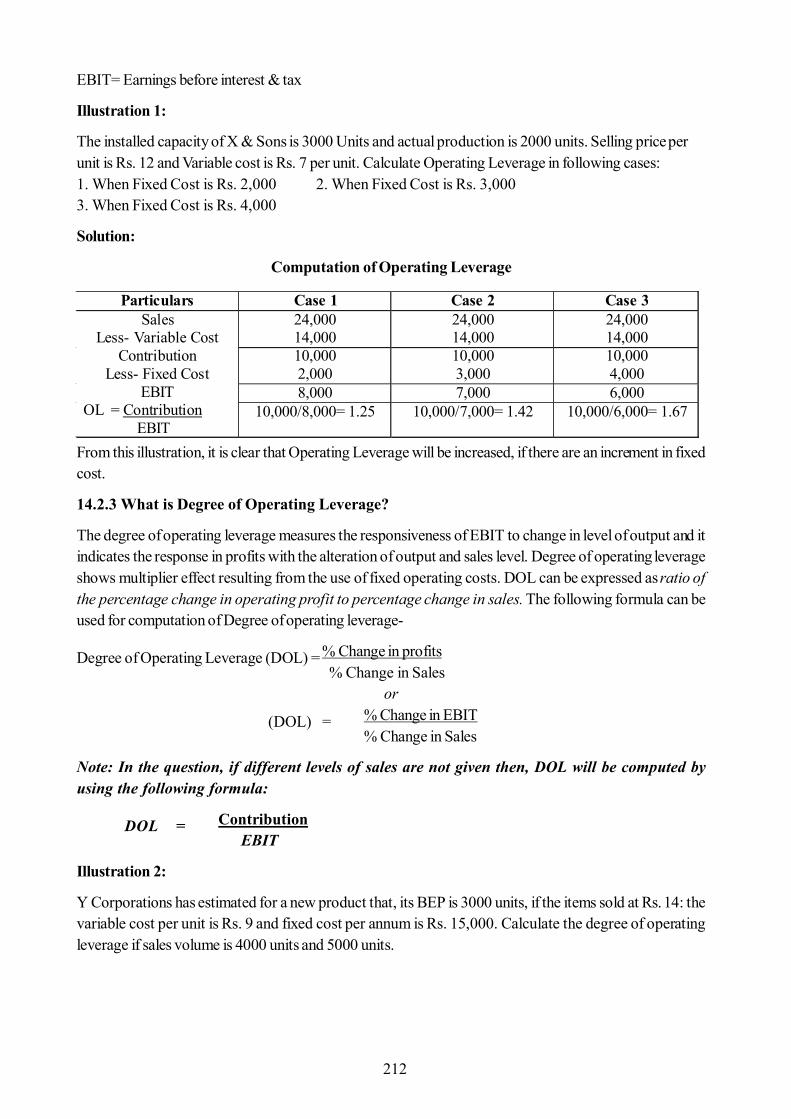
212
EBIT= Earnings before interest & tax
Illustration 1:
The installed capacity of X & Sons is 3000 Units and actual production is 2000 units. Selling price perunit is Rs. 12 and Variable cost is Rs. 7 per unit. Calculate Operating Leverage in following cases:1. When Fixed Cost is Rs. 2,000 2. When Fixed Cost is Rs. 3,0003. When Fixed Cost is Rs. 4,000
Solution:
Computation of Operating Leverage
From this illustration, it is clear that Operating Leverage will be increased, if there are an increment in fixedcost.
14.2.3 What is Degree of Operating Leverage?
The degree of operating leverage measures the responsiveness of EBIT to change in level of output and itindicates the response in profits with the alteration of output and sales level. Degree of operating leverageshows multiplier effect resulting from the use of fixed operating costs. DOL can be expressed as ratio ofthe percentage change in operating profit to percentage change in sales. The following formula can beused for computation of Degree of operating leverage-
Degree of Operating Leverage (DOL) = % Change in profits % Change in Sales
or
(DOL) = % Change in EBIT% Change in Sales
Note: In the question, if different levels of sales are not given then, DOL will be computed byusing the following formula:
DOL = Contribution EBIT
Illustration 2:
Y Corporations has estimated for a new product that, its BEP is 3000 units, if the items sold at Rs. 14: thevariable cost per unit is Rs. 9 and fixed cost per annum is Rs. 15,000. Calculate the degree of operatingleverage if sales volume is 4000 units and 5000 units.
Particulars Case 1 Case 2 Case 3 Sales
Less- Variable Cost Contribution
Less- Fixed Cost EBIT
OL = Contribution EBIT
24,000 14,000
24,000 14,000
24,000 14,000
10,000 2,000
10,000 3,000
10,000 4,000
8,000 7,000 6,000 10,000/8,000= 1.25 10,000/7,000= 1.42 10,000/6,000= 1.67
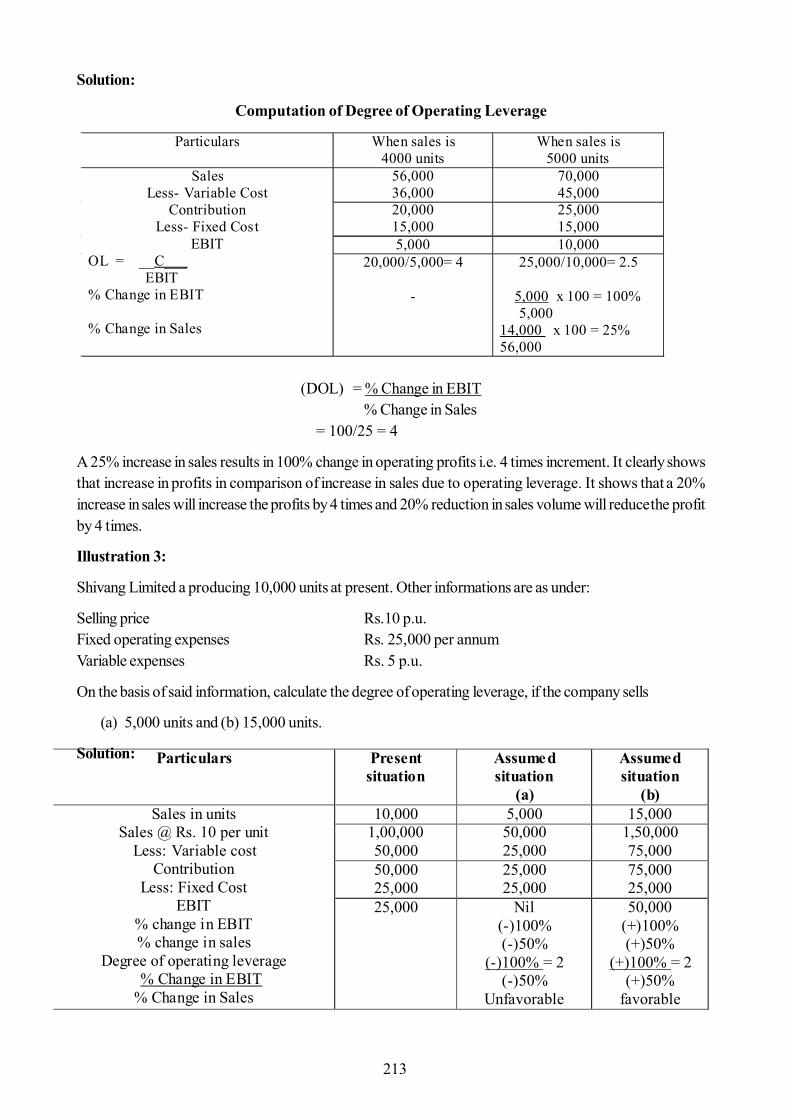
213
Solution:
Computation of Degree of Operating Leverage
(DOL) = % Change in EBIT% Change in Sales
= 100/25 = 4
A 25% increase in sales results in 100% change in operating profits i.e. 4 times increment. It clearly showsthat increase in profits in comparison of increase in sales due to operating leverage. It shows that a 20%increase in sales will increase the profits by 4 times and 20% reduction in sales volume will reduce the profitby 4 times.
Illustration 3:
Shivang Limited a producing 10,000 units at present. Other informations are as under:
Selling price Rs.10 p.u.Fixed operating expenses Rs. 25,000 per annumVariable expenses Rs. 5 p.u.
On the basis of said information, calculate the degree of operating leverage, if the company sells
(a) 5,000 units and (b) 15,000 units.
Solution:
Particulars When sales is 4000 units
When sales is 5000 units
Sales Less- Variable Cost
Contribution Less- Fixed Cost
EBIT OL = __C___ EBIT % Change in EBIT % Change in Sales
56,000 36,000
70,000 45,000
20,000 15,000
25,000 15,000
5,000 10,000 20,000/5,000= 4
-
25,000/10,000= 2.5
5,000 x 100 = 100% 5,000 14,000 x 100 = 25% 56,000
Particulars Present situation
Assumed situation
(a)
Assumed situation
(b) Sales in units
Sales @ Rs. 10 per unit Less: Variable cost
Contribution Less: Fixed Cost
EBIT % change in EBIT % change in sales
Degree of operating leverage % Change in EBIT
% Change in Sales
10,000 5,000 15,000 1,00,000 50,000
50,000 25,000
1,50,000 75,000
50,000 25,000
25,000 25,000
75,000 25,000
25,000 Nil (-)100% (-)50%
(-)100% = 2 (-)50%
Unfavorable
50,000 (+)100% (+)50%
(+)100% = 2 (+)50%
favorable
214
13.2.4 Characteristics of Operating Leverage
1. It is related to assets side of the balance sheet.
2. Operating leverage is directly related to sales and variable cost. It depends on the gap betweenSales and variable expenses. A less gap between sales and variable expenses is a cause of highdegree of operating leverage. The degree of operating leverage cannot be computed at BEP becauseat this point denominator value i.e. EBIT will be Zero.
3. There is a direct relationship between DOL and Break Even Point. If the sales value at which DOLis to be calculated is near to BEP, it is a sign of high degree of DOL.
4. Operating leverage related to the fixed cost of operating nature like Salary to employees, Rent etc.If there are no any such fixed costs, then there will be no operating leverage.
5. Due to increase in sales there will be an increase in operating leverage and high reduction in operatingprofits. So, we can say that operating leverage raise a firm’s operating profits but on the other sideit raises business risk of increasing losses.
13.2.5 Utility of Operating Leverage
1. Operating leverages helpful for decision making. Since, it is related to fixed cost so it is helpful inrespect of long term investment decisions. Capital budgeting is essential for long term profit planning.Operating leverage is essential tool in capital budgeting.
2. Since, it is related to fixed costs which have to be compensating against the operating income. Sowe can say that it decide the capacity of the firm to bear the burden of payment of interest on debtsand repayment of certain portion of debts.
13.3 Financial Leverage
13.3.1 What is Financial Leverage?
Financial leverage refers to the use of debt to acquire additional assets. Financial leverage is also known astrading on equity. There are two types of capital in any firm 1) Fixed cost bearing capital 2) Variable costbearing capital. So, if fixed cost capital exists in any firm then financial leverage is present at there. Accordingto James C. Vane Horn “Financial leverage involves the use of funds obtained at a fixed cost in the hope ofincreasing the return to common stock holders.” Financial leverage directly related to capital structure ofcompany. If proportion of variable cost capital is high than financial leverage will be low and if proportion offixed cost capital is high, which also called as trading on equity, then financial leverage will be high.
13.3.2 Computation of Financial Leverage
For computation of financial leverage, first we have to calculate EBIT. Now by we can calculate financialleverage by using following formula:
Financial Leverage= EBITEBT
EBIT = Earnings before interest & tax
EBT = Earnings before tax
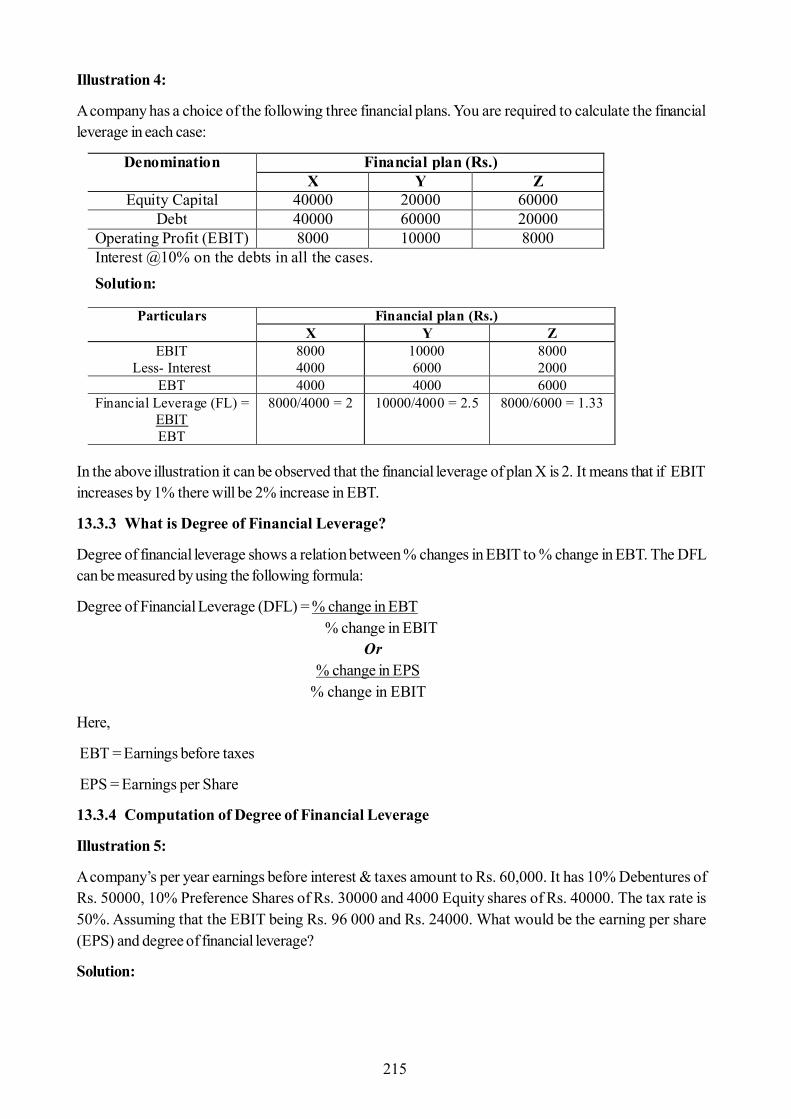
215
Illustration 4:
A company has a choice of the following three financial plans. You are required to calculate the financialleverage in each case:
In the above illustration it can be observed that the financial leverage of plan X is 2. It means that if EBITincreases by 1% there will be 2% increase in EBT.
13.3.3 What is Degree of Financial Leverage?
Degree of financial leverage shows a relation between % changes in EBIT to % change in EBT. The DFLcan be measured by using the following formula:
Degree of Financial Leverage (DFL) = % change in EBT % change in EBIT
Or% change in EPS
% change in EBIT
Here,
EBT = Earnings before taxes
EPS = Earnings per Share
13.3.4 Computation of Degree of Financial Leverage
Illustration 5:
A company’s per year earnings before interest & taxes amount to Rs. 60,000. It has 10% Debentures ofRs. 50000, 10% Preference Shares of Rs. 30000 and 4000 Equity shares of Rs. 40000. The tax rate is50%. Assuming that the EBIT being Rs. 96 000 and Rs. 24000. What would be the earning per share(EPS) and degree of financial leverage?
Solution:
Denomination Financial plan (Rs.) X Y Z
Equity Capital 40000 20000 60000 Debt 40000 60000 20000
Operating Profit (EBIT) 8000 10000 8000 Interest @10% on the debts in all the cases. Solution:
Particulars Financial plan (Rs.) X Y Z
EBIT Less- Interest
8000 4000
10000 6000
8000 2000
EBT 4000 4000 6000 Financial Leverage (FL) =
EBIT EBT
8000/4000 = 2 10000/4000 = 2.5 8000/6000 = 1.33
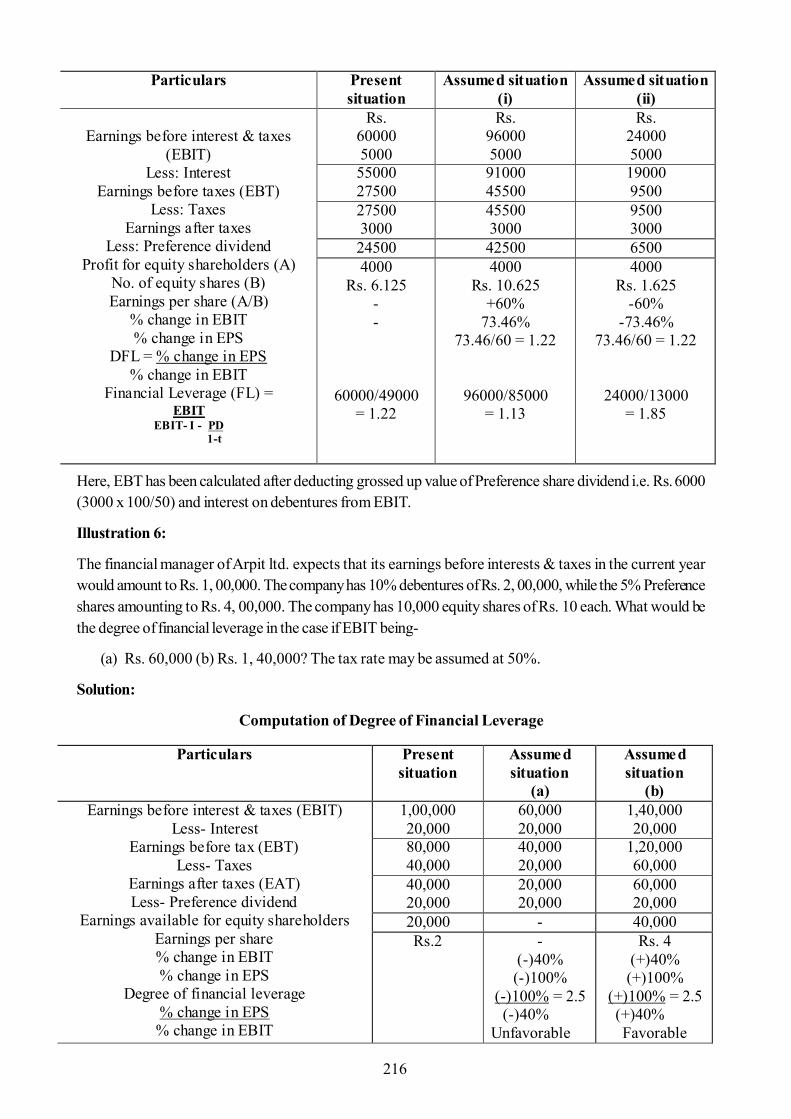
216
Here, EBT has been calculated after deducting grossed up value of Preference share dividend i.e. Rs. 6000(3000 x 100/50) and interest on debentures from EBIT.
Illustration 6:
The financial manager of Arpit ltd. expects that its earnings before interests & taxes in the current yearwould amount to Rs. 1, 00,000. The company has 10% debentures of Rs. 2, 00,000, while the 5% Preferenceshares amounting to Rs. 4, 00,000. The company has 10,000 equity shares of Rs. 10 each. What would bethe degree of financial leverage in the case if EBIT being-
(a) Rs. 60,000 (b) Rs. 1, 40,000? The tax rate may be assumed at 50%.
Solution:
Computation of Degree of Financial Leverage
Particulars Present situation
Assumed situation (i)
Assumed situation (ii)
Earnings before interest & taxes
(EBIT) Less: Interest
Earnings before taxes (EBT) Less: Taxes
Earnings after taxes Less: Preference dividend
Profit for equity shareholders (A) No. of equity shares (B) Earnings per share (A/B)
% change in EBIT % change in EPS
DFL = % change in EPS % change in EBIT
Financial Leverage (FL) = EBIT
EBIT- I - PD 1-t
Rs. 60000 5000
Rs. 96000 5000
Rs. 24000 5000
55000 27500
91000 45500
19000 9500
27500 3000
45500 3000
9500 3000
24500 42500 6500 4000
Rs. 6.125 - -
60000/49000 = 1.22
4000 Rs. 10.625
+60% 73.46%
73.46/60 = 1.22
96000/85000 = 1.13
4000 Rs. 1.625
-60% -73.46%
73.46/60 = 1.22
24000/13000 = 1.85
Particulars Present situation
Assumed situation
(a)
Assumed situation
(b) Earnings before interest & taxes (EBIT)
Less- Interest Earnings before tax (EBT)
Less- Taxes Earnings after taxes (EAT) Less- Preference dividend
Earnings available for equity shareholders Earnings per share % change in EBIT % change in EPS
Degree of financial leverage % change in EPS % change in EBIT
1,00,000 20,000
60,000 20,000
1,40,000 20,000
80,000 40,000
40,000 20,000
1,20,000 60,000
40,000 20,000
20,000 20,000
60,000 20,000
20,000 - 40,000 Rs.2
-
(-)40% (-)100%
(-)100% = 2.5 (-)40% Unfavorable
Rs. 4 (+)40% (+)100%
(+)100% = 2.5 (+)40%
Favorable
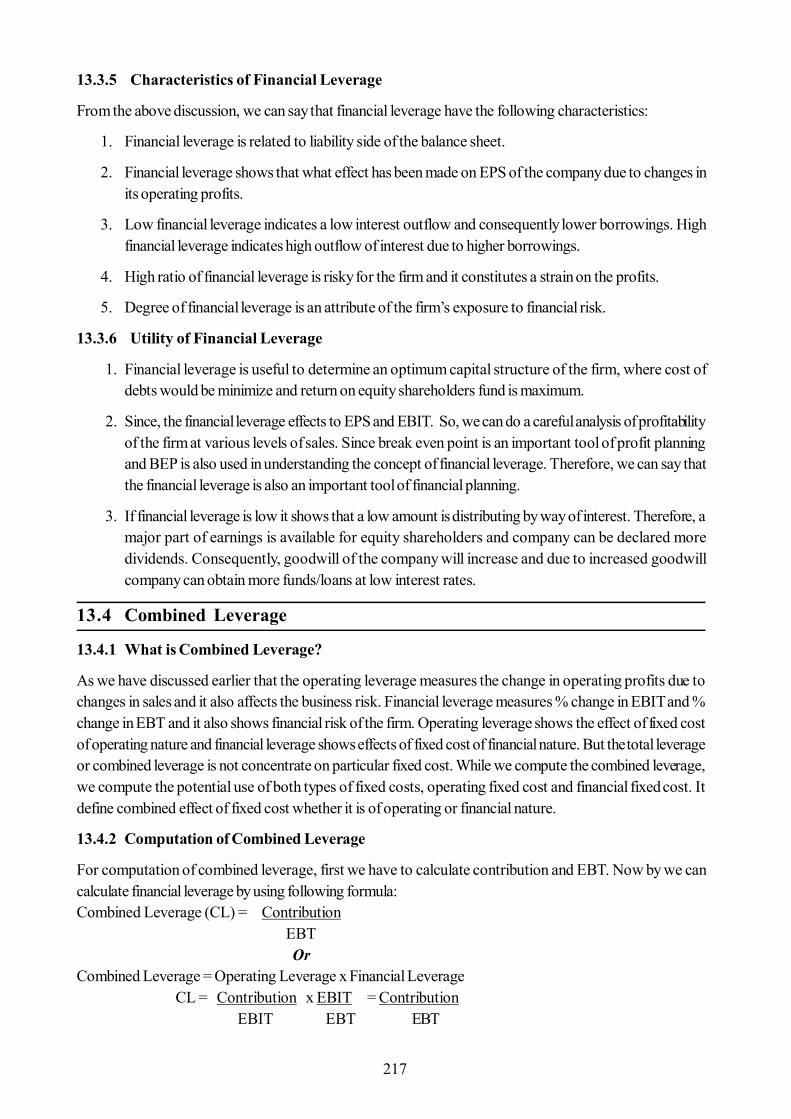
217
13.3.5 Characteristics of Financial Leverage
From the above discussion, we can say that financial leverage have the following characteristics:
1. Financial leverage is related to liability side of the balance sheet.
2. Financial leverage shows that what effect has been made on EPS of the company due to changes inits operating profits.
3. Low financial leverage indicates a low interest outflow and consequently lower borrowings. Highfinancial leverage indicates high outflow of interest due to higher borrowings.
4. High ratio of financial leverage is risky for the firm and it constitutes a strain on the profits.
5. Degree of financial leverage is an attribute of the firm’s exposure to financial risk.
13.3.6 Utility of Financial Leverage
1. Financial leverage is useful to determine an optimum capital structure of the firm, where cost ofdebts would be minimize and return on equity shareholders fund is maximum.
2. Since, the financial leverage effects to EPS and EBIT. So, we can do a careful analysis of profitabilityof the firm at various levels of sales. Since break even point is an important tool of profit planningand BEP is also used in understanding the concept of financial leverage. Therefore, we can say thatthe financial leverage is also an important tool of financial planning.
3. If financial leverage is low it shows that a low amount is distributing by way of interest. Therefore, amajor part of earnings is available for equity shareholders and company can be declared moredividends. Consequently, goodwill of the company will increase and due to increased goodwillcompany can obtain more funds/loans at low interest rates.
13.4 Combined Leverage
13.4.1 What is Combined Leverage?
As we have discussed earlier that the operating leverage measures the change in operating profits due tochanges in sales and it also affects the business risk. Financial leverage measures % change in EBIT and %change in EBT and it also shows financial risk of the firm. Operating leverage shows the effect of fixed costof operating nature and financial leverage shows effects of fixed cost of financial nature. But the total leverageor combined leverage is not concentrate on particular fixed cost. While we compute the combined leverage,we compute the potential use of both types of fixed costs, operating fixed cost and financial fixed cost. Itdefine combined effect of fixed cost whether it is of operating or financial nature.
13.4.2 Computation of Combined Leverage
For computation of combined leverage, first we have to calculate contribution and EBT. Now by we cancalculate financial leverage by using following formula:Combined Leverage (CL) = Contribution
EBT Or
Combined Leverage = Operating Leverage x Financial Leverage CL = Contribution x EBIT = Contribution
EBIT EBT EBT
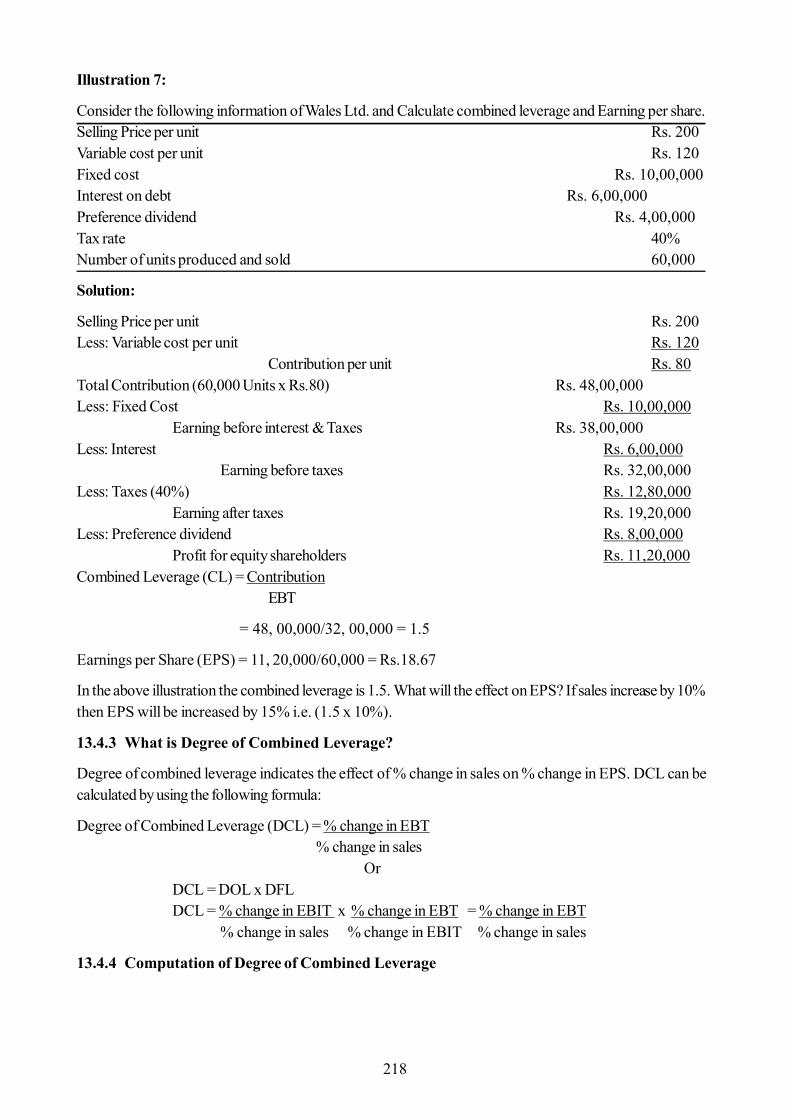
218
Illustration 7:
Consider the following information of Wales Ltd. and Calculate combined leverage and Earning per share.Selling Price per unit Rs. 200Variable cost per unit Rs. 120Fixed cost Rs. 10,00,000Interest on debt Rs. 6,00,000Preference dividend Rs. 4,00,000Tax rate 40%Number of units produced and sold 60,000
Solution:
Selling Price per unit Rs. 200Less: Variable cost per unit Rs. 120
Contribution per unit Rs. 80Total Contribution (60,000 Units x Rs.80) Rs. 48,00,000Less: Fixed Cost Rs. 10,00,000
Earning before interest & Taxes Rs. 38,00,000Less: Interest Rs. 6,00,000
Earning before taxes Rs. 32,00,000Less: Taxes (40%) Rs. 12,80,000
Earning after taxes Rs. 19,20,000Less: Preference dividend Rs. 8,00,000
Profit for equity shareholders Rs. 11,20,000Combined Leverage (CL) = Contribution
EBT
= 48, 00,000/32, 00,000 = 1.5
Earnings per Share (EPS) = 11, 20,000/60,000 = Rs.18.67
In the above illustration the combined leverage is 1.5. What will the effect on EPS? If sales increase by 10%then EPS will be increased by 15% i.e. (1.5 x 10%).
13.4.3 What is Degree of Combined Leverage?
Degree of combined leverage indicates the effect of % change in sales on % change in EPS. DCL can becalculated by using the following formula:
Degree of Combined Leverage (DCL) = % change in EBT% change in sales
OrDCL = DOL x DFLDCL = % change in EBIT x % change in EBT = % change in EBT
% change in sales % change in EBIT % change in sales
13.4.4 Computation of Degree of Combined Leverage
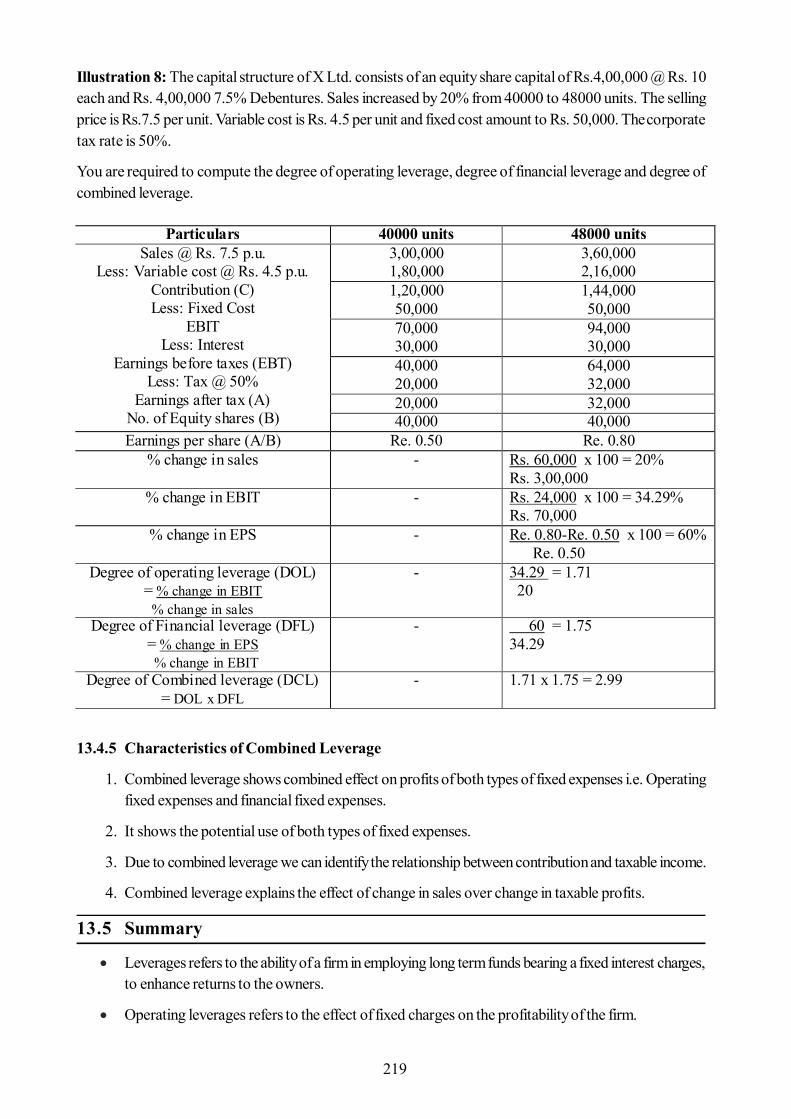
219
Particulars 40000 units 48000 units Sales @ Rs. 7.5 p.u.
Less: Variable cost @ Rs. 4.5 p.u. Contribution (C) Less: Fixed Cost
EBIT Less: Interest
Earnings before taxes (EBT) Less: Tax @ 50%
Earnings after tax (A) No. of Equity shares (B)
3,00,000 1,80,000
3,60,000 2,16,000
1,20,000 50,000
1,44,000 50,000
70,000 30,000
94,000 30,000
40,000 20,000
64,000 32,000
20,000 32,000 40,000 40,000
Earnings per share (A/B) Re. 0.50 Re. 0.80 % change in sales - Rs. 60,000 x 100 = 20%
Rs. 3,00,000 % change in EBIT - Rs. 24,000 x 100 = 34.29%
Rs. 70,000 % change in EPS - Re. 0.80-Re. 0.50 x 100 = 60%
Re. 0.50 Degree of operating leverage (DOL)
= % change in EBIT % change in sales
- 34.29 = 1.71 20
Degree of Financial leverage (DFL) = % change in EPS % change in EBIT
- 60 = 1.75 34.29
Degree of Combined leverage (DCL) = DOL x DFL
- 1.71 x 1.75 = 2.99
Illustration 8: The capital structure of X Ltd. consists of an equity share capital of Rs.4,00,000 @ Rs. 10each and Rs. 4,00,000 7.5% Debentures. Sales increased by 20% from 40000 to 48000 units. The sellingprice is Rs.7.5 per unit. Variable cost is Rs. 4.5 per unit and fixed cost amount to Rs. 50,000. The corporatetax rate is 50%.
You are required to compute the degree of operating leverage, degree of financial leverage and degree ofcombined leverage.
13.4.5 Characteristics of Combined Leverage
1. Combined leverage shows combined effect on profits of both types of fixed expenses i.e. Operatingfixed expenses and financial fixed expenses.
2. It shows the potential use of both types of fixed expenses.
3. Due to combined leverage we can identify the relationship between contribution and taxable income.
4. Combined leverage explains the effect of change in sales over change in taxable profits.
13.5 Summary
Leverages refers to the ability of a firm in employing long term funds bearing a fixed interest charges,to enhance returns to the owners.
Operating leverages refers to the effect of fixed charges on the profitability of the firm.
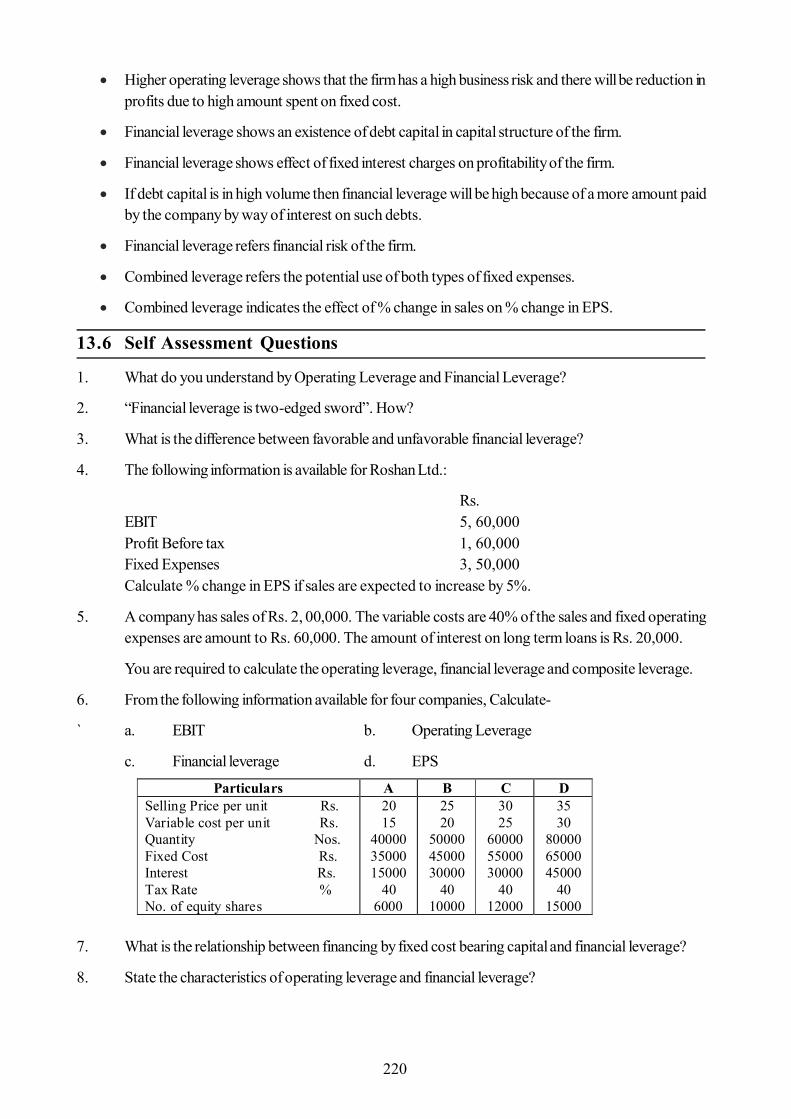
220
Higher operating leverage shows that the firm has a high business risk and there will be reduction inprofits due to high amount spent on fixed cost.
Financial leverage shows an existence of debt capital in capital structure of the firm.
Financial leverage shows effect of fixed interest charges on profitability of the firm.
If debt capital is in high volume then financial leverage will be high because of a more amount paidby the company by way of interest on such debts.
Financial leverage refers financial risk of the firm.
Combined leverage refers the potential use of both types of fixed expenses.
Combined leverage indicates the effect of % change in sales on % change in EPS.
13.6 Self Assessment Questions
1. What do you understand by Operating Leverage and Financial Leverage?
2. “Financial leverage is two-edged sword”. How?
3. What is the difference between favorable and unfavorable financial leverage?
4. The following information is available for Roshan Ltd.:
Rs.EBIT 5, 60,000Profit Before tax 1, 60,000Fixed Expenses 3, 50,000Calculate % change in EPS if sales are expected to increase by 5%.
5. A company has sales of Rs. 2, 00,000. The variable costs are 40% of the sales and fixed operatingexpenses are amount to Rs. 60,000. The amount of interest on long term loans is Rs. 20,000.
You are required to calculate the operating leverage, financial leverage and composite leverage.
6. From the following information available for four companies, Calculate-
` a. EBIT b. Operating Leverage
c. Financial leverage d. EPS
7. What is the relationship between financing by fixed cost bearing capital and financial leverage?
8. State the characteristics of operating leverage and financial leverage?
Particulars A B C D Selling Price per unit Rs. Variable cost per unit Rs. Quantity Nos. Fixed Cost Rs. Interest Rs. Tax Rate % No. of equity shares
20 15
40000 35000 15000
40 6000
25 20
50000 45000 30000
40 10000
30 25
60000 55000 30000
40 12000
35 30
80000 65000 45000
40 15000

221
13.7 Reference Books
- Ravi M. Kishore (2005) - “Financial Management”- Taxmenn’s, New Delhi, 6th edition, 2005.
- M. R. Agrwal (2010) – “Financial Management (Principles & practices)”- Garima publications,Jaipur, 2010.
- Dr. C. P. Jain (2010) – “Prabandh Lekhankan” – Shivam book house (P) Ltd., Jaipur, 2010.
- Dr. M. D. Agrawal & Dr. N. P. Agrawal – “Management Accounting “– Ramesh book depot,Jaipur.
222
Unit -14 : Capital Structure: Theories
Structure of Unit:
14.0 Objectives14.1 Introduction14.2 Meaning and Definition14.3 Features of Capital Structure14.4 Equations and Notations14.5 Theories of Capital Structure
14.5.1 Net Income (NI) Approach14.5.2 Net Operating Income (NOI) Approach14.5.3 Traditional Approach14.5.4 Modigliani-Miller (MM) Approach
14.6 Summary14.7 Self Assessment Questions14.8 Reference Books
14.0 Objectives
The purpose of this unit is to introduce the theories of capital structure of a company.
After you have studied this unit, you should be able to:
Appreciate the concept of capital structure and its importance Understand the features of the capital structure of a firm Define and explain the various theories of capital structure Critically examine and distinguish the various approaches to capital structure Relate the capital structure with the cost of capital and the value of the firm Calculate the market value of the firm using appropriate formulae
14.1 Introduction
Often corporate officers, professional investors, and analysts discuss a company’s capital structure. Theconcept is extremely important because it can influence not only the return a company earns for itsshareholders, but whether or not a firm survives in recession or depression.
Every business enterprise, whether big, medium or small, needs finance to carry on its operations smoothlyand to achieve its targets. Finance is needed for working capital and for permanent investment. Ideally, itshould neither be more or less than required and should gainfully be employed.
Finance is obtained by businesses from various sources of long term and short term funds. Long term fundscomprise of equity and long term borrowings (debt). Equity is in the form of common stock or preferredstock and long term borrowings (debt) are in the form of debentures or bonds. The profit earned fromoperations is owners’ funds which may be retained in the business or distributed to the owners (shareholders)as dividend. The portion of profits retained in the business is a reinvestment of owners’ funds and hence asource of long-term funds. Short-term funds are the working capital requirements of the firm. The short-term borrowings often keep shifting and thus the proportion of the sources for short-term funds cannot berigidly laid down. So, the firm follows a flexible approach. A more definite policy is often laid down for thecomposition of long-term funds.
223
The entire composition of these funds constitutes the overall financial structure of the firm.
14.2 Meaning and Definition
Meaning: The capital structure is how a firm finances its overall operations and growth by using differentsources of funds. It refers to how much of each type of funds a company holds as a percentage of its totalfinancing. In other words, Capital Structure is referred to as the ratio of different kinds of securities raisedby a firm as long-term finance. Therefore, it is a mix of a company’s long-term debt, specific short-termdebt, common equity and preferred equity.
When people refer to capital structure they are mostly referring to a firm’s debt-to-equity ratio, whichprovides insight into how risky a company is. Usually a company more heavily financed by debt poses greaterrisk, as this firm is relatively highly levered.
Definitions: According to Gerestonbeg, “capital structure of a company refers to the composition or makeup of its capitalization and it includes all long term capital resources i.e. loans, reserves, shares and bonds.”
Weston and Brigham define, “capital structure is permanent financing of the firm represented by long termdebts.”
14.3 Features of Capital Structure
While developing a capital structure the finance manager should aim at maximizing the long term marketprice of equity shares. An appropriate capital structure should have the following features. The relativeimportance of each of these feature differ from company to company and may change with changing conditions.
1. Returns: The capital structure should be such that it gives maximum return to the shareholders.Maximum use of leverage at minimum cost should be made so as to obtain maximum advantage oftrading on equity at minimum cost.
2. Solvency: Company should not use excessive debt in the capital structure, because in times ofhigher interest rates it can even threaten the solvency of the company.
3. Flexibility: The capital structure should be flexible enough that the company can alter the debtequity ratio whenever there is need to alter it. For example banks do not give loans to companies ifdebt equity ratio is high, in that case it is important to have flexible capital structure.
4. Goal Oriented: Capital structure should be in congruence with the goals of the company, whichimplies that if the policy is that company will not take more debt, than capital structure should beframed accordingly with more equity and less debt.
14.4 Equations and Notations
In the analysis of capital structure theories, the following basic definitions and equations shall be used.
Market value of Equity = EMarket value of debt= DTotal market value of the firm= V= (E+D)Interest Payments =ITax Rate= TNet Operating Income or EBIT = NOI = X¯Net Income or shareholders earnings (EBIT- INT) when taxes do not exist= NI = Y¯Current Market price per share= Po
224
Dividend at Time 0 (now)= Do
Expected dividend at the end of Year 1= D1
Debt
Cost of Debt = kd = INT / D
Cost of Debt after Tax= Kd= I (1-T) D
Value of Debt= D = INT / kd
Equity
Cost of Equity= Ke= D1 /Po
Alternatively:
Cost of Equity, Ke= Ko+(ko-kd) (D/E)
Over all cost of capital(WACC)= Ko
Ko =Kd[D/(D+E)]+Ke[E/(D+E]
=Kd(D/V)+Ke(E/V)
= Kd D + Ke(E) = KdD + KeE = EBIT V V V V
The above equations and definitions are valid under any of the capital structure theories. The controversy iswith regard to the behavior of the variables like ke, ko, V etc with leverage.
14.5 Theories of Capital Structure
There are four basic Capital Structure theories. They are:
1. Net Income (NI) Approach2. Net Operating Income (NOI) Approach3. Modigliani-Miller (MM) Approach4. Traditional Approach
Generally, the capital structure theories have the following assumptions:
1. The firms employ only two types of capital namely debts ad equity2. The firms pay 100% of the earnings as dividend. This means that the dividend pay-out ratio is 100%
and there are no earnings that are retained by the firms.3. The total assets are given which do not change and the investment decisions are assumed to be constant.4. Business risk is constant over time and it is assumed that it is independent of the capital structure and
financial risk.5. The firm has a perpetual life.6. The firm’s operating earnings (EBIT) are not expected to grow.7. The corporate and personal income taxes do not exist. This assumption was relaxed later on.8. The firm’s total financing remains constant. The firm’s degree of leverage can be altered either by selling
shares to retire debt or by raising more debt and reduce the equity financing.
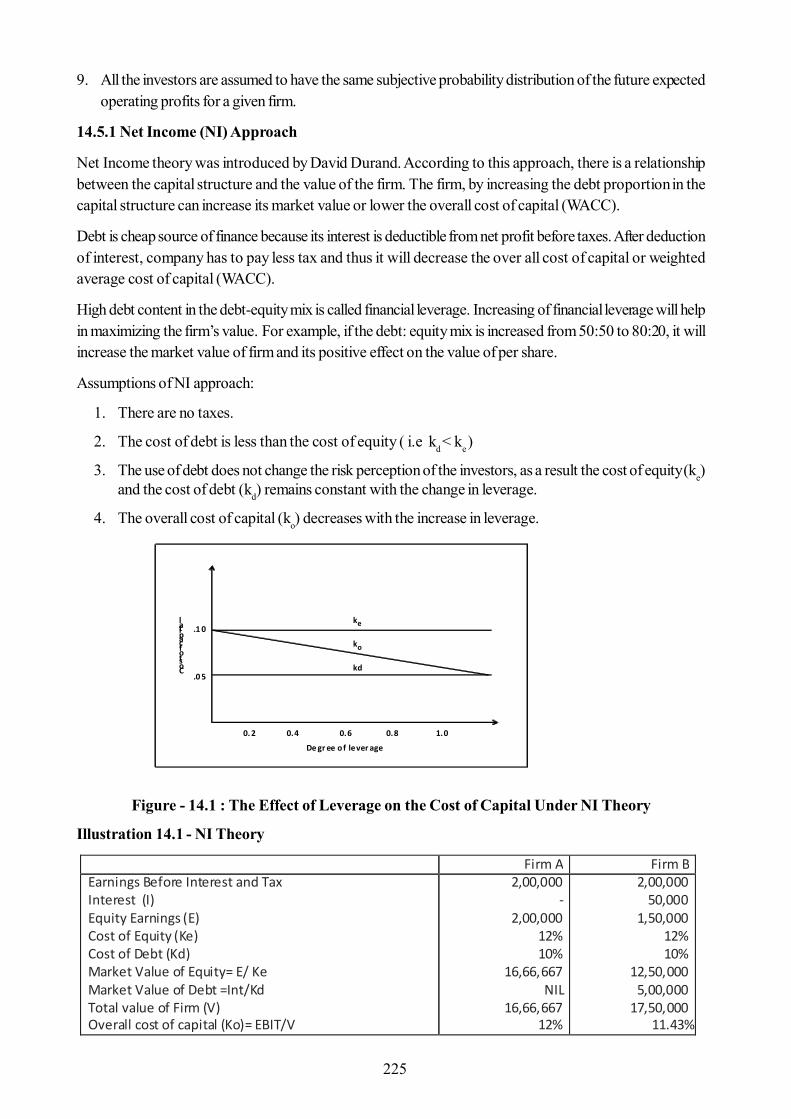
225
9. All the investors are assumed to have the same subjective probability distribution of the future expectedoperating profits for a given firm.
14.5.1 Net Income (NI) Approach
Net Income theory was introduced by David Durand. According to this approach, there is a relationshipbetween the capital structure and the value of the firm. The firm, by increasing the debt proportion in thecapital structure can increase its market value or lower the overall cost of capital (WACC).
Debt is cheap source of finance because its interest is deductible from net profit before taxes. After deductionof interest, company has to pay less tax and thus it will decrease the over all cost of capital or weightedaverage cost of capital (WACC).
High debt content in the debt-equity mix is called financial leverage. Increasing of financial leverage will helpin maximizing the firm’s value. For example, if the debt: equity mix is increased from 50:50 to 80:20, it willincrease the market value of firm and its positive effect on the value of per share.
Assumptions of NI approach:
1. There are no taxes.
2. The cost of debt is less than the cost of equity ( i.e kd < ke )
3. The use of debt does not change the risk perception of the investors, as a result the cost of equity (ke)and the cost of debt (kd) remains constant with the change in leverage.
4. The overall cost of capital (ko) decreases with the increase in leverage.
Figure - 14.1 : The Effect of Leverage on the Cost of Capital Under NI Theory
Illustration 14.1 - NI Theory
Cost of capital
.0 5
.1 0
0. 2 0.4 0.6 0.8 1.0
kd
ko
ke
De gr ee of lever age
Firm A Firm B Earnings Before Interest and Tax Interest (I) Equity Earnings (E) Cost of Equity (Ke) Cost of Debt (Kd) Market Value of Equity= E/ Ke Market Value of Debt =Int/Kd Total value of Firm (V) Overall cost of capital (Ko)= EBIT/V
2,00,000 -
2,00,000 12% 10%
16,66,667 NIL
16,66,667 12%
2,00,000 50,000
1,50,000 12% 10%
12,50,000 5,00,000
17,50,000 11.43%
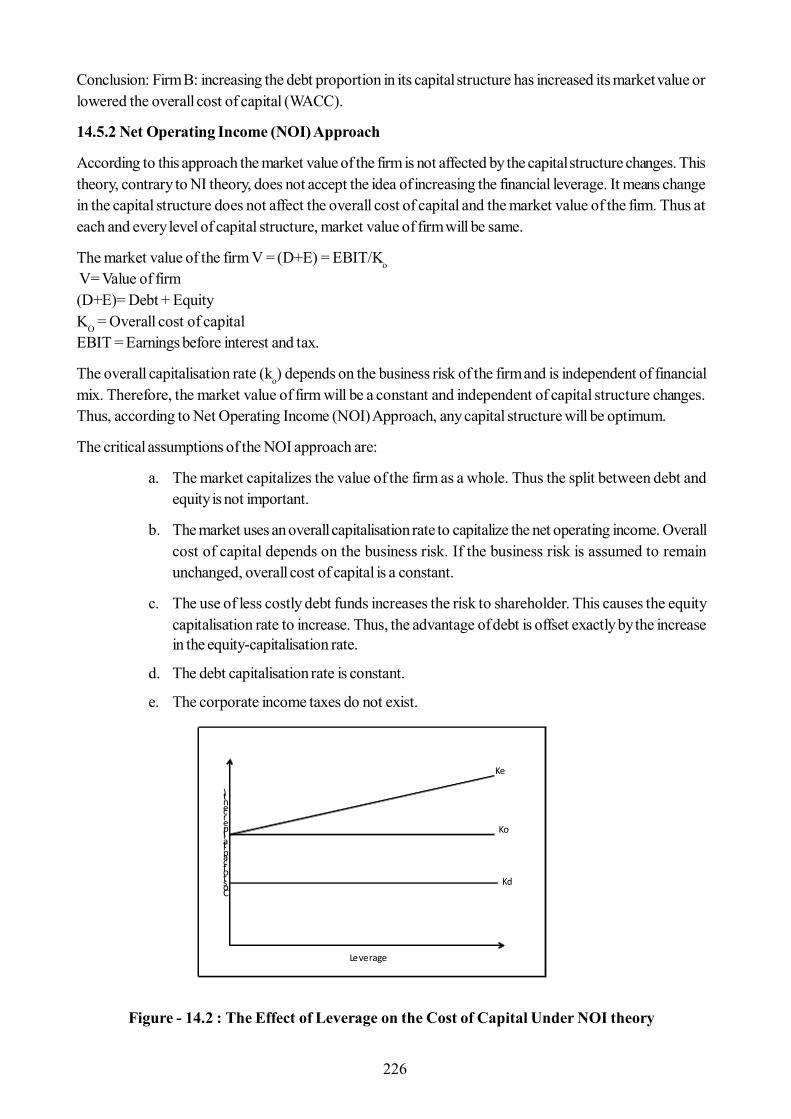
226
Ko
Kd
Ke
Leverage
Cost of capital (per cent)
Conclusion: Firm B: increasing the debt proportion in its capital structure has increased its market value orlowered the overall cost of capital (WACC).
14.5.2 Net Operating Income (NOI) Approach
According to this approach the market value of the firm is not affected by the capital structure changes. Thistheory, contrary to NI theory, does not accept the idea of increasing the financial leverage. It means changein the capital structure does not affect the overall cost of capital and the market value of the firm. Thus ateach and every level of capital structure, market value of firm will be same.
The market value of the firm V = (D+E) = EBIT/Ko
V= Value of firm(D+E)= Debt + EquityKO = Overall cost of capitalEBIT = Earnings before interest and tax.
The overall capitalisation rate (ko) depends on the business risk of the firm and is independent of financialmix. Therefore, the market value of firm will be a constant and independent of capital structure changes.Thus, according to Net Operating Income (NOI) Approach, any capital structure will be optimum.
The critical assumptions of the NOI approach are:
a. The market capitalizes the value of the firm as a whole. Thus the split between debt andequity is not important.
b. The market uses an overall capitalisation rate to capitalize the net operating income. Overallcost of capital depends on the business risk. If the business risk is assumed to remainunchanged, overall cost of capital is a constant.
c. The use of less costly debt funds increases the risk to shareholder. This causes the equitycapitalisation rate to increase. Thus, the advantage of debt is offset exactly by the increasein the equity-capitalisation rate.
d. The debt capitalisation rate is constant.
e. The corporate income taxes do not exist.
Figure - 14.2 : The Effect of Leverage on the Cost of Capital Under NOI theory
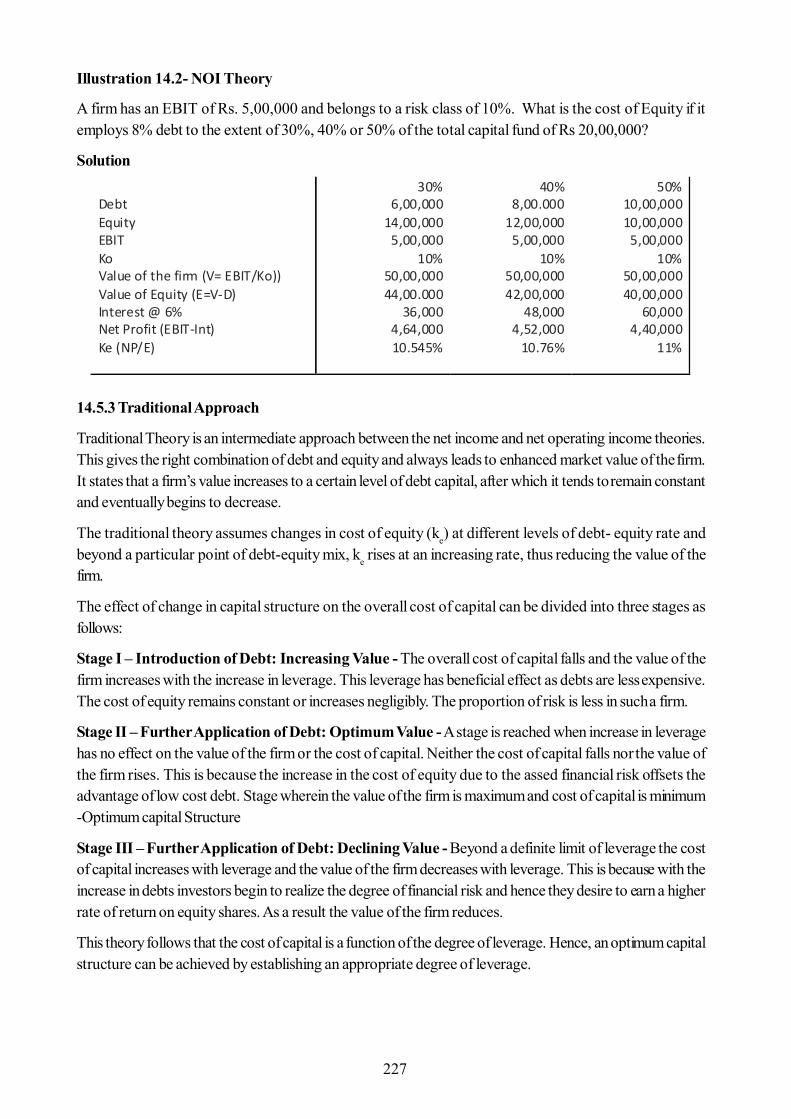
227
Illustration 14.2- NOI Theory
A firm has an EBIT of Rs. 5,00,000 and belongs to a risk class of 10%. What is the cost of Equity if itemploys 8% debt to the extent of 30%, 40% or 50% of the total capital fund of Rs 20,00,000?
Solution
14.5.3 Traditional Approach
Traditional Theory is an intermediate approach between the net income and net operating income theories.This gives the right combination of debt and equity and always leads to enhanced market value of the firm.It states that a firm’s value increases to a certain level of debt capital, after which it tends to remain constantand eventually begins to decrease.
The traditional theory assumes changes in cost of equity (ke) at different levels of debt- equity rate andbeyond a particular point of debt-equity mix, ke rises at an increasing rate, thus reducing the value of thefirm.
The effect of change in capital structure on the overall cost of capital can be divided into three stages asfollows:
Stage I – Introduction of Debt: Increasing Value - The overall cost of capital falls and the value of thefirm increases with the increase in leverage. This leverage has beneficial effect as debts are less expensive.The cost of equity remains constant or increases negligibly. The proportion of risk is less in such a firm.
Stage II – Further Application of Debt: Optimum Value - A stage is reached when increase in leveragehas no effect on the value of the firm or the cost of capital. Neither the cost of capital falls nor the value ofthe firm rises. This is because the increase in the cost of equity due to the assed financial risk offsets theadvantage of low cost debt. Stage wherein the value of the firm is maximum and cost of capital is minimum-Optimum capital Structure
Stage III – Further Application of Debt: Declining Value - Beyond a definite limit of leverage the costof capital increases with leverage and the value of the firm decreases with leverage. This is because with theincrease in debts investors begin to realize the degree of financial risk and hence they desire to earn a higherrate of return on equity shares. As a result the value of the firm reduces.
This theory follows that the cost of capital is a function of the degree of leverage. Hence, an optimum capitalstructure can be achieved by establishing an appropriate degree of leverage.
Debt Equity EBIT Ko Value of the firm (V= EBIT/Ko)) Value of Equity (E=V-D) Interest @ 6% Net Profit (EBIT-Int) Ke (NP/E)
30% 6,00,000
14,00,000 5,00,000
10% 50,00,000 44,00.000
36,000 4,64,000 10.545%
40% 8,00.000
12,00,000 5,00,000
10% 50,00,000 42,00,000
48,000 4,52,000
10.76%
50% 10,00,000 10,00,000
5,00,000 10%
50,00,000 40,00,000
60,000 4,40,000
11%
228
Leverage
Cost of capital(per unit)
L
Stage I
Stage II
Stage III
ke
ka
kd
Figure - 14.3 : The Costs of Capital Behavior Under Traditional View
14.5.4 Modigliani- Miller (M-M) Approach
Modigliani Millar approach, popularly known as the MM approach is similar to the Net operating incomeapproach. The MM approach favors the Net operating income approach and agrees with the fact that thecost of capital is independent of the degree of leverage and at any mix of debt-equity proportions.
Modigliani and Miller argued that, in the absence of taxes the cost of capital and the value of the firm are notaffected by the changes in capital structure.
Assumptions of M-M Approach
1. Capital markets are perfect. Thus investors are
- free to buy and sell securities- able to borrow funds at the same terms as the firms do- well informed and behave rationally
2. All investors have the same expectation of the company’s net operating income (EBIT) for thepurpose of evaluating the value of the firm.
3. Within similar operating environments, the business risk is equal among all firms.
4. Dividend payout ratio is 100% and therefore no retained earnings.
5. No corporate taxes exist. This was removed later.
Basic Propositions – M-M approach- Without Taxes
M M Hypothesis can be explained in terms of two propositions of Modigliani and Miller
Proposition I: At any degree of leverage, the company’s overall cost of capital (ko) and the Value of thefirm (V) remains constant. This means that it is independent of the capital structure. The total value can beobtained by capitalizing the operating earnings stream that is expected in future, discounted at an appropriatediscount rate suitable for the risk undertaken.
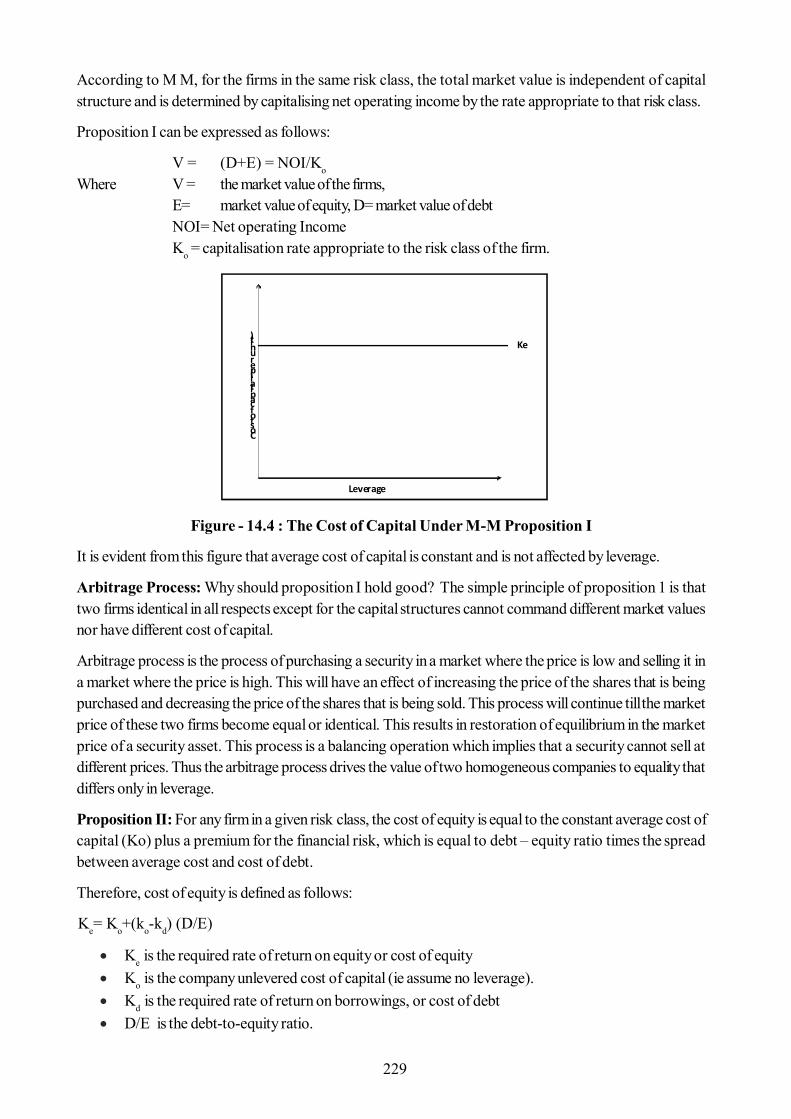
229
Leverage
Cost of capital (per unit) Ke
According to M M, for the firms in the same risk class, the total market value is independent of capitalstructure and is determined by capitalising net operating income by the rate appropriate to that risk class.
Proposition I can be expressed as follows:
V = (D+E) = NOI/Ko
Where V = the market value of the firms,E= market value of equity, D= market value of debtNOI= Net operating IncomeKo = capitalisation rate appropriate to the risk class of the firm.
Figure - 14.4 : The Cost of Capital Under M-M Proposition I
It is evident from this figure that average cost of capital is constant and is not affected by leverage.
Arbitrage Process: Why should proposition I hold good? The simple principle of proposition 1 is thattwo firms identical in all respects except for the capital structures cannot command different market valuesnor have different cost of capital.
Arbitrage process is the process of purchasing a security in a market where the price is low and selling it ina market where the price is high. This will have an effect of increasing the price of the shares that is beingpurchased and decreasing the price of the shares that is being sold. This process will continue till the marketprice of these two firms become equal or identical. This results in restoration of equilibrium in the marketprice of a security asset. This process is a balancing operation which implies that a security cannot sell atdifferent prices. Thus the arbitrage process drives the value of two homogeneous companies to equality thatdiffers only in leverage.
Proposition II: For any firm in a given risk class, the cost of equity is equal to the constant average cost ofcapital (Ko) plus a premium for the financial risk, which is equal to debt – equity ratio times the spreadbetween average cost and cost of debt.
Therefore, cost of equity is defined as follows:
Ke= Ko+(ko-kd) (D/E)
Ke is the required rate of return on equity or cost of equity Ko is the company unlevered cost of capital (ie assume no leverage). Kd is the required rate of return on borrowings, or cost of debt D/E is the debt-to-equity ratio.
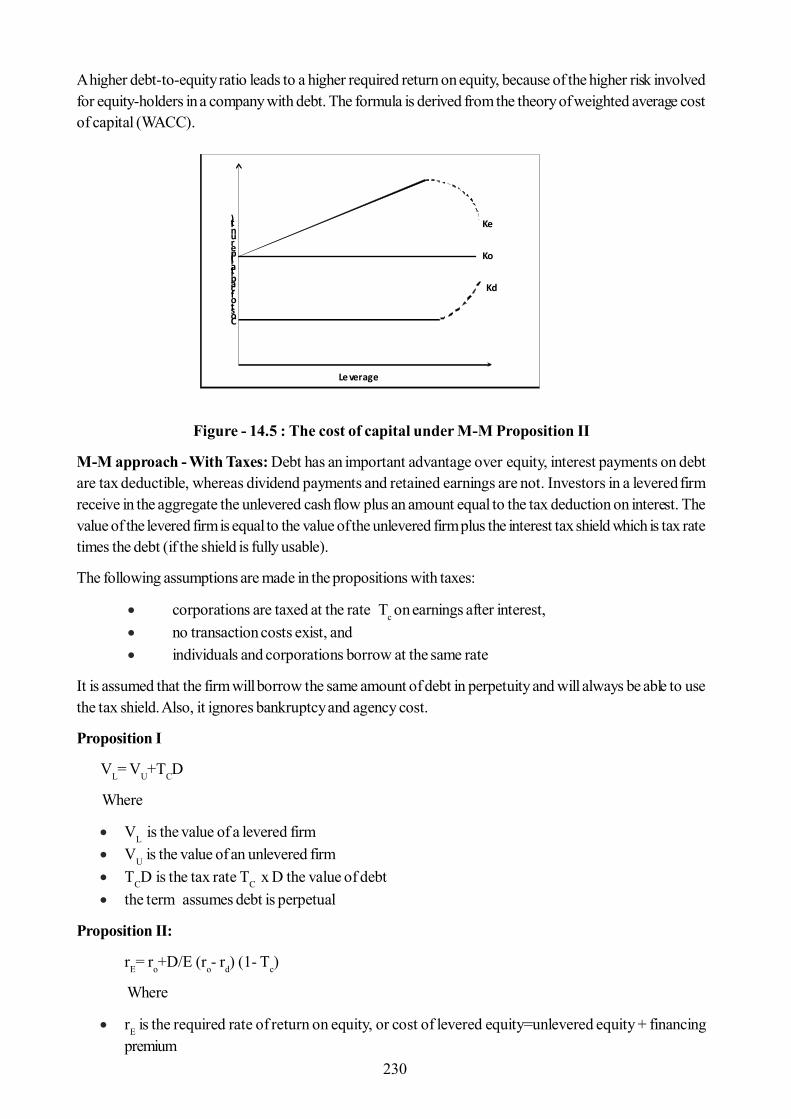
230
Le verage
Cost of capital (per unit)
Ko
Ke
Kd
A higher debt-to-equity ratio leads to a higher required return on equity, because of the higher risk involvedfor equity-holders in a company with debt. The formula is derived from the theory of weighted average costof capital (WACC).
Figure - 14.5 : The cost of capital under M-M Proposition II
M-M approach - With Taxes: Debt has an important advantage over equity, interest payments on debtare tax deductible, whereas dividend payments and retained earnings are not. Investors in a levered firmreceive in the aggregate the unlevered cash flow plus an amount equal to the tax deduction on interest. Thevalue of the levered firm is equal to the value of the unlevered firm plus the interest tax shield which is tax ratetimes the debt (if the shield is fully usable).
The following assumptions are made in the propositions with taxes:
corporations are taxed at the rate Tc on earnings after interest, no transaction costs exist, and individuals and corporations borrow at the same rate
It is assumed that the firm will borrow the same amount of debt in perpetuity and will always be able to usethe tax shield. Also, it ignores bankruptcy and agency cost.
Proposition I
VL= VU+TCD
Where
VL is the value of a levered firm VU is the value of an unlevered firm TCD is the tax rate TC x D the value of debt the term assumes debt is perpetual
Proposition II:
rE= ro+D/E (ro- rd) (1- Tc)
Where
rE is the required rate of return on equity, or cost of levered equity=unlevered equity + financingpremium
231
ro is the company cost of equity capital with no leverage (unlevered cost of equity, or return onassets with D/E = 0)
rd is the required rate of return on borrowings, or cost of debt D/E is the debttoequity ratio Tc is the tax rate.
Limitations of MM Hypothesis:
1. Investors would find the personal leverage inconvenient.2. The risk perception of corporate and personal leverage may be different.3. Arbitrage process cannot be smooth due the institutional restrictions.4. Arbitrage process would also be affected by the transaction costs.5. The corporate leverage and personal leverage are not perfect substitutes.6. Corporate taxes do exist. However, the assumption of “no taxes” has been removed later.
Relaxing MM Assumptions: The scenarios presented by MM are not necessarily reflective of businessreality. Additional factors for consideration include:
Financial Distress: as a firm assumes more debt (i.e. increases its financial leverage), its bankruptcyrisk increases. This increased risk should be factored in to any analysis.
Agency Costs: these are the costs incurred by stockholders to monitor company managers; agencycosts are increased when monitoring mechanisms fail and equity value losses are absorbed.
Asymmetric Information: MM assumes perfect information, but company managers commonlyknow more about the firm than the investing public. This is asymmetric information.
Pecking Order Theory: This theory states that company management prefers to use internal financing(cash on hand, retained earnings) as these sources are not as readily visible to the public as stock and bondofferings, which invite scrutiny.
Financing comes from three sources, internal funds, debt and new equity. Companies prioritize their sourcesof financing, first preferring internal financing, and then debt, lastly raising equity as a last resort. Hence,internal financing is used first, when that is depleted, then debt is issued; and when it is no longer sensible toissue any more debt, equity is issued. This theory maintains that businesses adhere to a hierarchy of financingsources and prefer internal financing when available, and debt is preferred over equity if external financing isrequired.
This model does assume asymmetric information – managers know more than investors, and will only issueequity, the most expensive form of financing, last in order to avoid transferring wealth from old shareholdersto new shareholders.
Static Trade-Off Theory: Outside the MM construct, this theory views capital structure as a decision thatbalances costs and benefits. Under static trade-off, the company should continue to capitalize itself with debtuntil the increased costs associated with financial distress exceed the value of the tax shield.
14.6 Summary
Capital Structure of a firm is a combination of different sources of securities raised by a firm as long-termfinance. It is determined by the mix of debt and equity it uses in financing its operations. The capital structureshould aim at maximizing the returns to the shareholders resulting in the increased market value of the firm.
232
It should be flexible enough that the firm can alter the debt equity ratio at any point of time and need. It isimportant for a firm to plan the capital structure, initially and on continuous basis, as it has a considerablebearing on its profitability.
Capital structure theories developed under some assumptions show sharp differences in the theoreticalrelationship between capital structure, cost of capital and value of the firm.
NI Approach at one extreme argues that leverage always affects the cost of capital and the value of a firm.Increasing the debt portion in debt- equity mix will decreased the overall cost of capital resulting in maximizingthe firm’s value. The NOI Approach, in contrast, is at the other extreme of the spectrum. According to thisApproach, capital structure is totally irrelevant.
The Traditional Approach strikes a balance between these extremes. A firm can increase its value (V) andreduce its cost of capital (k0) up to a point, but beyond that point, the use of further debt will lead to a risein the weighted average cost of capital. At that point the capital structure is optimum.
Although the empirical testing has been only suggestive with respect to the true relationship between leverageand cost of capital, the Traditional Approach provides a fairly close approximation of the position. Theoptimum capital structure would, of course, vary from case to case.
Modigliani and Miller concur with NOI and provide behavioral support to its basic proposition. However,the basic premises of the MM Approach are of doubtful validity. As a result, the arbitrage process isimpeded.
Modigliani and Miller also agree that with corporate taxes debt has a definite advantage over equity as theinterest is tax-deductible and leverage will lower the overall cost of capital. The value of the levered firm isequal to the value of the unlevered firm plus the interest tax shield which is tax rate times the debt. Thescenarios presented by MM are not necessarily reflective of business reality and thus additional factors likefinancial distress, agency costs are to be considered.
Pecking order theory starts with asymmetric information as managers know more about the firm’s prospects,risks and value than outside investors. Asymmetric information affects the choice between internal andexternal financing and between the issue of debt or equity. Therefore there exists a pecking order for thefinancing of new projects.
14.7 Self Assessment Questions
1. Define Capital Structure and explain its features.
2. Explain the assumptions and implications of NI and NOI theories. Illustrate your answer withhypothetical examples.
3. Describe the traditional view on optimum capital structure. Compare this view with NI and NOIapproach.
4. Explain the position of M M theory on the issue of an optimum capital structurea. ignoring corporate income taxesb. assuming the existence of taxes
5. How does the cost of capital behave with leverage under traditional and M M approach?
6. X Co has a net operating income of Rs 2,00,000 on an investment of Rs 10,00,000 in assets. It canraise debt at a 16 per cent rate of interest. Assume that taxes do not exist.
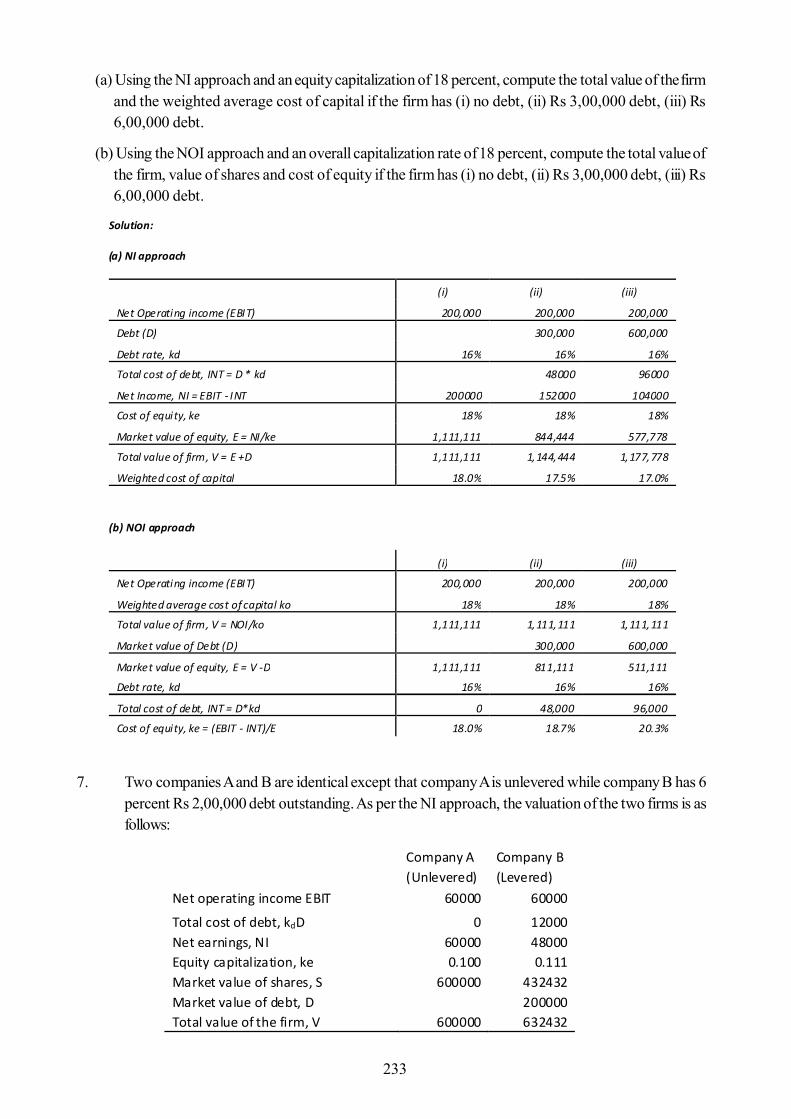
233
(a) Using the NI approach and an equity capitalization of 18 percent, compute the total value of the firmand the weighted average cost of capital if the firm has (i) no debt, (ii) Rs 3,00,000 debt, (iii) Rs6,00,000 debt.
(b) Using the NOI approach and an overall capitalization rate of 18 percent, compute the total value ofthe firm, value of shares and cost of equity if the firm has (i) no debt, (ii) Rs 3,00,000 debt, (iii) Rs6,00,000 debt.
7. Two companies A and B are identical except that company A is unlevered while company B has 6percent Rs 2,00,000 debt outstanding. As per the NI approach, the valuation of the two firms is asfollows:
Solution:
(a) NI approach
(i) (ii) (iii)
Net Operating income (EBIT) 200,000 200,000 200,000
Debt (D) 300,000 600,000
Debt rate, kd 16% 16% 16%
Total cost of debt, INT = D * kd 48000 96000
Net Income, NI = EBIT - INT 200000 152000 104000
Cost of equity, ke 18% 18% 18%
Market value of equity, E = NI/ke 1,111,111 844,444 577,778
Total value of firm, V = E +D 1,111,111 1,144,444 1,177,778
Weighted cost of capital 18.0% 17.5% 17.0%
(b) NOI approach
(i) (ii) (iii)
Net Operating income (EBIT) 200,000 200,000 200,000
Weighted average cost of capital ko 18% 18% 18%
Total value of firm, V = NOI/ko 1,111,111 1,111,111 1,111,111
Market value of Debt (D) 300,000 600,000
Market value of equity, E = V -D 1,111,111 811,111 511,111
Debt rate, kd 16% 16% 16%
Total cost of debt, INT = D*kd 0 48,000 96,000
Cost of equity, ke = (EBIT - INT)/E 18.0% 18.7% 20.3%
Company A Company B (Unlevered) (Levered) Net operating income EBIT 60000 60000
Total cost of debt, kdD 0 12000 Net earnings, NI 60000 48000 Equity capitalization, ke 0.100 0.111 Market value of shares, S 600000 432432 Market value of debt, D
200000
Total value of the firm, V 600000 632432
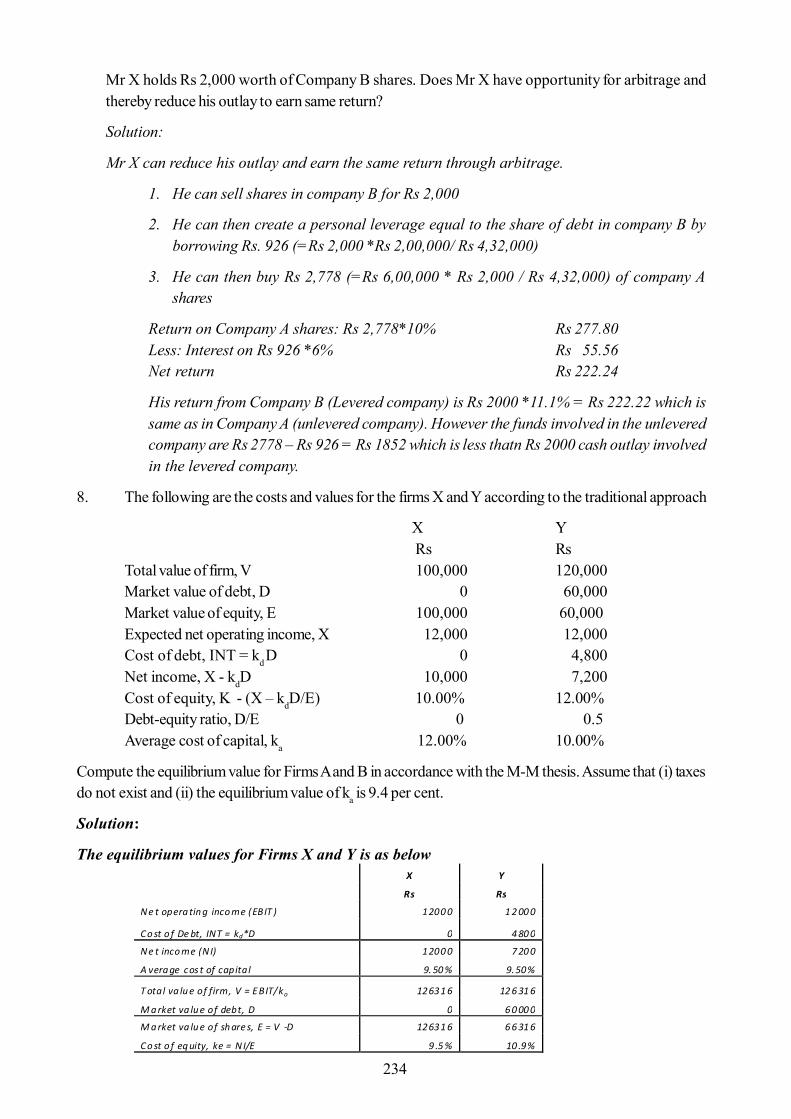
234
Mr X holds Rs 2,000 worth of Company B shares. Does Mr X have opportunity for arbitrage andthereby reduce his outlay to earn same return?
Solution:
Mr X can reduce his outlay and earn the same return through arbitrage.
1. He can sell shares in company B for Rs 2,000
2. He can then create a personal leverage equal to the share of debt in company B byborrowing Rs. 926 (=Rs 2,000 *Rs 2,00,000/ Rs 4,32,000)
3. He can then buy Rs 2,778 (=Rs 6,00,000 * Rs 2,000 / Rs 4,32,000) of company Ashares
Return on Company A shares: Rs 2,778*10% Rs 277.80Less: Interest on Rs 926 *6% Rs 55.56Net return Rs 222.24
His return from Company B (Levered company) is Rs 2000 *11.1% = Rs 222.22 which issame as in Company A (unlevered company). However the funds involved in the unleveredcompany are Rs 2778 – Rs 926 = Rs 1852 which is less thatn Rs 2000 cash outlay involvedin the levered company.
8. The following are the costs and values for the firms X and Y according to the traditional approach
X Y Rs Rs
Total value of firm, V 100,000 120,000Market value of debt, D 0 60,000Market value of equity, E 100,000 60,000Expected net operating income, X 12,000 12,000Cost of debt, INT = kd D 0 4,800Net income, X - kdD 10,000 7,200Cost of equity, K - (X – kdD/E) 10.00% 12.00%Debt-equity ratio, D/E 0 0.5Average cost of capital, ka 12.00% 10.00%
Compute the equilibrium value for Firms A and B in accordance with the M-M thesis. Assume that (i) taxesdo not exist and (ii) the equilibrium value of ka is 9.4 per cent.
Solution:
The equilibrium values for Firms X and Y is as below
X Y
Rs Rs
N e t opera tin g inco me (EBIT ) 1200 0 1 2 00 0
C o st o f De bt, INT = kd*D 0 4 80 0
N e t inco me (N I) 1200 0 7 20 0
A vera ge cos t of capital 9. 50 % 9.50%
T otal va lu e of firm, V = E BIT/ko 12631 6 12 6 31 6
M a rket va lu e of debt, D 0 6 0 00 0
M a rket va lu e of sh are s, E = V -D 12631 6 6 6 31 6
C o st o f eq uity, ke = N I/E 9 .5 % 10 .9%

235
14.8 Reference Books
- Chandra, Prasanna.,2007, Fundamentals of Financial Management, Tata McGraw, New delhi.
- Maheshwari, S.N., 2011, Financial Management, Sultan chand & Sons, New Delhi.
- Pandey, I.M.,2010, Financial Management,Vikas Publishing House Pvt Ltd.,New Delhi.
- Khan M.Y and Jain P.K. 2002, Cost Accounting and Financial Management, Tata McGraw Hill,New Delhi.
- Kulkarni,.P.V. Sathya B.G. 1999. Financial Management, (nineth revised edition), HimalayaPublishing, Bombay .
- Upadhyaya, K.M., 1985 Financial Management Kalyani Publishers, Ludhiana.
236
Unit -15 : Capital Structure: Planning
Structure of Unit:
15.0 Objectives15.1 Introduction15.2 Meaning of Capital Structure15.3 Factors Determining Capital Structure15.4 Approaches to Establish Appropriate Capital Structure
15.4.1 EBIT-EPS Approach15.4.2 Cost of Capital and Valuation Approach15.4.3 Cash Flow Approach
15.5 Practical Considerations in Determining Capital Structure15.6 Summary15.7 Self Assessment Questions15.8 Reference Books
15.0 Objectives
After you have studied this unit, you should be able to:
Appreciate the need for capital structure planning Understand the factors determining the capital structure of a firm Relate the components of capital structure with risk, return and value of the firm Explain and relate the various approaches of capital structure planning Critically examine and distinguish between the alternate approaches Discuss a number of practical considerations in determining a firm’s capital structure
15.1 Introduction
Capital structure planning is very important for survival of the business in long run. Companies which donot plan their capital structure may prosper in the short-run, but in a long run they may face considerabledifficulties in raising funds to finance their activities. With unplanned capital structure, these companies mayalso fail to economize the use of their funds. Consequently, it is being increasingly realized that a companyshould plan its capital structure to maximize the use of the funds and to be able to adapt more easily to thechanging conditions.
Capital structure refers to the mix of long-term sources of funds, such as debentures, long-term debt,preference share capital and equity share capital including reserves and surpluses (i.e. retained earnings).Planning the capital structure is one of the most complex areas of financial decision making because of theinter-relationships among components of the capital structure and also its relationship to risk, return andvalue of the firm. Two similar companies can have different capital structures if the decision makers differ intheir judgment of the significance of various factors.
The optimum capital structure is obtained when the market value per share is maximum. Theoretically, acompany needs to plan out an optimum capital structure. But in practice, it is difficult to determine anoptimum capital structure as one needs to go beyond theories. The capital structure should be plannedgenerally keeping in view the interests of the equity shareholders and the financial requirements of a company.
237
The equity shareholders, being the owners of the company and the providers of risk capital (equity) wouldbe concerned about the ways of financing a company’s operations. However, the interests of other groups,such as employees, customers, creditors, society and government, should also be given reasonableconsideration.
15.2 Meaning of Capital Structure
The capital structure is how a firm finances its overall operations and growth by using different sources offunds. It refers to how much of each type of funds a company holds as a percentage of its total financing. Inother words, Capital Structure is referred to as the ratio of different kinds of securities raised by a firm aslong-term finance. Therefore, it is a mix of a company’s long-term debt, specific short-term debt, commonequity and preferred equity.
The capital structure involves two decisions-a. Type of securities to be issued (equity shares, preference shares and long term borrowings)b. Relative ratio of securities that can be determined by process of capital gearing.
On this basis, the companies are divided into two-
a. Highly Geared Companies- Those companies whose proportion of equity capitalization is small.A company with high gearing (high leverage) is more vulnerable to downturns in the business cyclebecause the company must continue to service its debt regardless of how bad sales are. A greaterproportion of equity provides a cushion and is seen as a measure of financial strength. In highgearing companies, interest paid on debts reduces profits available to shareholders, and if interestrates increase, the cost of the business can rapidly increase. But high gearing is not necessarily bad.It may indicate that a company is adventurous in its expansion plans, and may have taken theopportunity to invest by borrowing at low rates.
b. Low Geared Companies- Those companies whose equity capital dominates total capitalization. Acompany with low gearing is one where the largest proportion of the funding of the business hascome from investment by shareholders. As low gearing will be a result of a low level of borrowings,this can indicate that the firm is growing through reinvestment of profits, minimizing risk. But lowgearing may indicate that a firm is not aggressive enough to survive, and may not be seekingopportunities for growth.
Example: There are two companies A and B. Total capitalization amounts to be Rs. 20 lakhs in each case.The equity capital in the total capitalization of company A is Rs. 5 lakhs, while in company B equity capitalis Rs. 15 lakhs. In company A, equity proportion is 25% and in company B, equity proportion is 75%. Insuch cases, company A is considered to be a highly geared company and company B is low geared company.
15.3 Factors Determining Capital Structure
The right capital structure is important for the survival of the business in long run. It enhances the power ofthe company to face the losses and changes in financial markets. Decision regarding what type of capitalstructure a company should have is of critical importance because of its potential impact on profitability andsolvency.
The factors determining the Capital Structure are highly psychological, complex and qualitative and do notalways follow accepted theory, since capital markets are not perfect and the decision has to be taken underimperfect knowledge and risk. A theoretical model cannot adequately handle all the factors which affect thecapital structure decision.
238
The following are the factors determining the capital structure in a business enterprise:
1. Size of the Business Enterprise: The capital structure of a business enterprise is also influencedby the size of business enterprise. It may be small, medium or large. A large-sized business enterpriserequires much more capital as compared to a small-sized business enterprise. Small size businessfirm’s capital structure generally consists of loans from banks and retained profits. While on theother hand, big companies having goodwill, stability and an established profit can easily go forissuance of shares and debentures as well as loans and borrowings from financial institutions. Thebigger the size, the wider is total capitalization.
2. Nature of the Business Organization: The capital structure of a business enterprise is alsoinfluenced by nature of business organization. It may be manufacturing, financing, trading or publicutility type.
3. Period of Finance: Period of finance, short, medium or long term is also another factor whichdetermines the capital structure of a business enterprise. For example, short-term finances areraised through borrowings as compared to long-term finance which is raised through issue of shares,stocks etc.
4. The Purpose of Financing: The purpose of financing should also be kept in mind in determiningthe capital structure of a business enterprise. The funds may be required either for bettermentexpenditure or for some productive purposes. The betterment expenditure, being non-productive,may be incurred out of funds raised by issue of shares or from retained profits. On the contrary,funds for productive purposes may be raised through borrowings.
5. Elasticity of Capital Structure: The capital structure of a business enterprise should be quiteelastic so as to meet the future requirements of the capital also. For this purpose the amount ofauthorized capital should be fixed at a higher level as compared to present needs.
6. Capital Market Condition: In the lifetime of the company, the market price of the shares has gotan important influence. During the depression period, the company’s capital structure generallyconsists of debentures and loans. While in period of boons and inflation, the company’s capitalshould consist of share capital generally equity shares.
7. Trading on Equity: Trading on equity means taking advantage of equity share capital to borrowfunds on reasonable basis. It refers to additional profits that equity shareholders earn because ofissuance of debentures and preference shares. It is based on the thought that if the rate of dividendon preference capital and the rate of interest on borrowed capital is lower than the general rate ofcompany’s earnings, equity shareholders are at advantage which means a company should go for ajudicious blend of preference shares, equity shares as well as debentures. Trading on equity becomesmore important when expectations of shareholders are high.
8. Degree of Control: In a company, it is the directors who are so called elected representatives ofequity shareholders. These members have got maximum voting rights in a concern as compared tothe preference shareholders and debenture holders. Preference shareholders have reasonably lessvoting rights while debenture holders have no voting rights. If the company’s management policiesare such that they want to retain their voting rights in their hands, the capital structure consists ofdebenture holders and loans rather than equity shares.
9. Choice of Investors: Generally, the company policy is to have different categories of investors
239
for securities. Therefore, a capital structure should give enough choice to all kind of investors toinvest. Bold and adventurous investors generally go for equity shares and loans and debentures aregenerally raised keeping into mind conscious investors.
10. Cost of Financing: In a capital structure, the company has to look to the factor of cost whensecurities are raised. It is seen that debentures at the time of profit earning of company prove to bea cheaper source of finance as compared to equity shares where equity shareholders demand anextra share in profits.
11. Stability of Sales: An established business which has a growing market and high sales turnover,the company is in position to meet fixed commitments. Interest on debentures has to be paid regardlessof profit. Therefore, when sales are high, thereby the profits are high and company is in betterposition to meet such fixed commitments like interest on debentures and dividends on preferenceshares. If company is having unstable sales, then the company is not in position to meet fixedobligations. So, equity capital proves to be safe in such cases.
15.4 Approaches to Establish Appropriate Capital Structure
Capital structure is formed initially when a company is incorporated. The initial capital structure should bedesigned very carefully. The management of the company should set a target capital structure and thesubsequent financing decisions should be made with a view to achieve the target capital structure. Everytime when funds are needed to finance the activities of the firm, the pros and cons of various sources offinance should be weighed and the most advantageous sources should be selected, keeping in view thetarget capital structure. Thus, the capital structure decision is a continuous one and has to be taken whenevera firm needs additional finances.
The following are the three most common approaches to decide about a firm’s capital structure:
1. EBIT-EPS approach for analyzing the impact of debt on EPS2. Valuation approach for determining the impact of debt on the shareholders’ value3. Cash flow approach for analyzing the firm’s ability to service debt
15.4.1 EBIT-EPS Approach
The EBIT-EPS capital structure approach focuses on finding a capital structure with the highest EPS (earningsper share) over the expected range of EBIT (earnings before interest and taxes). The reason of finding acapital structure which will permit maximization of the EPS over the expected range of EBIT is because itpartially helps to achieve the ultimate objective of the enterprise. The ultimate objective of the enterprise isto maximize shareholders’ wealth by maximizing its stock price. Two key variables that affect stock priceare return (earnings attributed to owners of the enterprise) and risk (which can be measured by requiredreturn). This approach explicitly considers maximization of returns (EPS). However, it is important to notethat this approach ignores risk (does not explicitly consider risk).
Financial leverage is an important consideration in planning the capital structure of a company because of itseffect on the earnings per share. The use of fixed cost sources of funds such as debt and preference sharecapital to finance the assets of the company is known as financial leverage or trading on equity. If the assetsare financed using debts and the yield is greater than the cost of debt, the earning per share also increaseswithout an increase in the owners’ investment. The earnings per share also increase when the preferenceshare capital is used to acquire assets. But the leverage impact is more pronounced in case of debt because(i) the cost of debt is usually lower than the cost of preference share capital and (ii) the interest paid on debtis tax deductible.
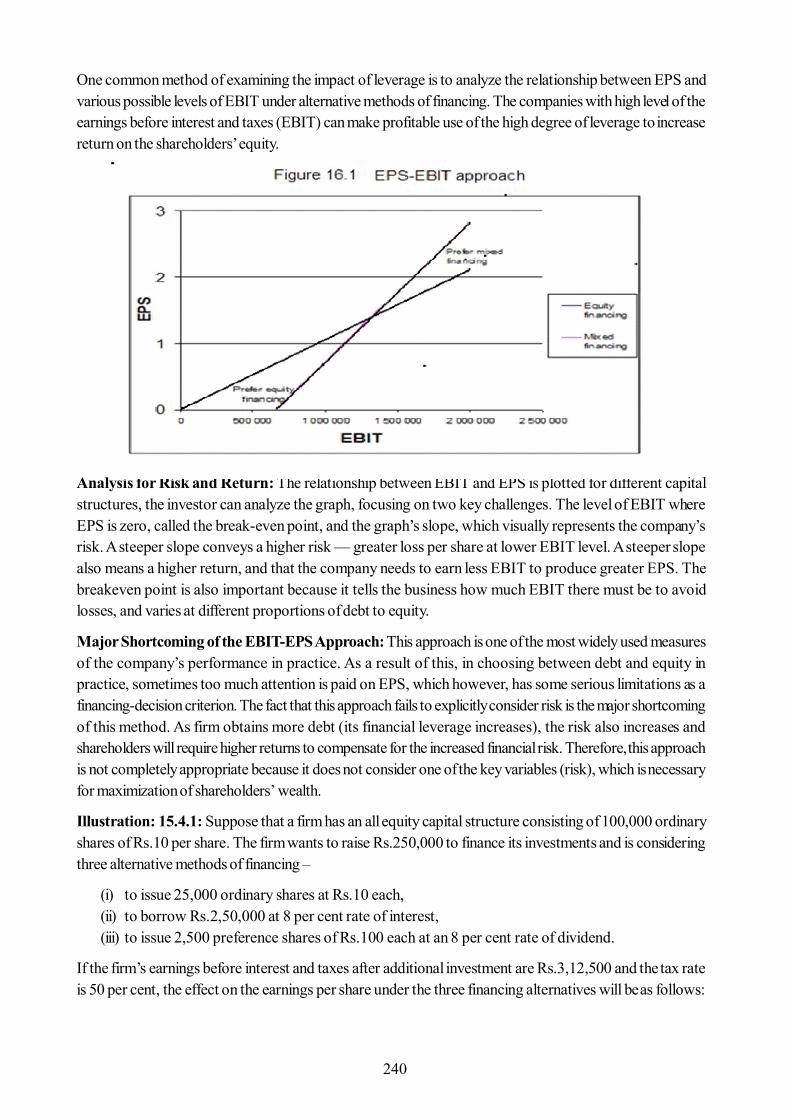
240
One common method of examining the impact of leverage is to analyze the relationship between EPS andvarious possible levels of EBIT under alternative methods of financing. The companies with high level of theearnings before interest and taxes (EBIT) can make profitable use of the high degree of leverage to increasereturn on the shareholders’ equity.
Analysis for Risk and Return: The relationship between EBIT and EPS is plotted for different capitalstructures, the investor can analyze the graph, focusing on two key challenges. The level of EBIT whereEPS is zero, called the break-even point, and the graph’s slope, which visually represents the company’srisk. A steeper slope conveys a higher risk — greater loss per share at lower EBIT level. A steeper slopealso means a higher return, and that the company needs to earn less EBIT to produce greater EPS. Thebreakeven point is also important because it tells the business how much EBIT there must be to avoidlosses, and varies at different proportions of debt to equity.
Major Shortcoming of the EBIT-EPS Approach: This approach is one of the most widely used measuresof the company’s performance in practice. As a result of this, in choosing between debt and equity inpractice, sometimes too much attention is paid on EPS, which however, has some serious limitations as afinancing-decision criterion. The fact that this approach fails to explicitly consider risk is the major shortcomingof this method. As firm obtains more debt (its financial leverage increases), the risk also increases andshareholders will require higher returns to compensate for the increased financial risk. Therefore, this approachis not completely appropriate because it does not consider one of the key variables (risk), which is necessaryfor maximization of shareholders’ wealth.
Illustration: 15.4.1: Suppose that a firm has an all equity capital structure consisting of 100,000 ordinaryshares of Rs.10 per share. The firm wants to raise Rs.250,000 to finance its investments and is consideringthree alternative methods of financing –
(i) to issue 25,000 ordinary shares at Rs.10 each,(ii) to borrow Rs.2,50,000 at 8 per cent rate of interest,(iii) to issue 2,500 preference shares of Rs.100 each at an 8 per cent rate of dividend.
If the firm’s earnings before interest and taxes after additional investment are Rs.3,12,500 and the tax rateis 50 per cent, the effect on the earnings per share under the three financing alternatives will be as follows:
241
Solution: EPS Under Alternative Financing Favorable EBIT:
The firm is able to maximize the earnings per share when it uses debt financing. Though the rate of preferencedividend is equal to the rate of interest, EPS is high in case of debt financing because interest charges are taxdeductible while preference dividends are not. With increasing levels of EBIT, EPS will increase at a fasterrate with a high degree of leverage. However if a company is not able to earn a rate of return on its assetsthat is higher than the interest rate (or the preference dividend rate), debt (or preference financing) will havean adverse impact on EPS.
Suppose the firm in illustration above has an EBIT of Rs.75,000/- EPS under different methods will be asfollows:
It is obvious that under unfavorable conditions, i.e. when the rate of return on the total assets is less than thecost of debt, the earnings per share will fall with the degree of leverage.
15.4.2 Cost of Capital and Valuation Approach
A company should have such a mix of debt and equity that its overall cost of capital is minimum. The overallcost of capital is minimum when the cost of various sources of funds is minimum. Measuring the costs ofvarious sources of funds is a complex subject and needs a separate treatment. In order to minimize the costof capital, cheaper sources of funds should be preferred, other things remaining the same.
The cost of source of finance is the minimum return expected by its suppliers which depends on the degreeof risk assumed by them. A high degree of risk is assumed by shareholders than debt-holders. This isbecause the rate of dividends is not fixed for ordinary shareholders and the board of directors has no legalobligation to pay dividends even if the company has made profits. Besides, the shareholders will have to
Equity Financing Rs.
Debt Financing Rs.
Preference Financing Rs.
EBIT Less: Interest PBT Less: Taxes PAT Less: Preference dividend Earning available to ordinary shareholders Shares outstanding EPS
3,12,500 0
3,12,500 1,56,250 1,56,250
0 1,56,250 1,25,000
1.25
3,12,550 20,000
2,92,500 1,46,250 1,46,250
0 1,46,250 1,00,000
1.46
3,12,550 0
3,12,500 1,56,250 1,56,250
20,000 1,36,250 1,00,000
1.36
EPS Under Alternative Financing Methods: Unfavorable EBIT: Equity Financing Rs.
Debt Financing Rs.
Preference Financing Rs.
EBIT Less: Interest PBT Less: Taxes PAT Less: Preference dividend Earning available to ordinary shareholders Shares outstanding EPS
75,000 0
75,000 37,000 37,500
0 1,56,250 1,25,000
0.30
75,000 20,000 55,000 27,500
1,46,250 0
27,500 1,00,000
0.27
75,000 0
75,000 37,500
1,56,250 20,000 17,500
1,00,000 0.17
242
share the residue only when the company is wound up. In the case of debt-holders, the rate of interest isfixed and the company is legally bound to pay interest whether it makes profits or not. The loan of debt-holders is returned within a prescribed period. This leads to the conclusion that debt is a cheaper source offunds than equity. This is generally the case even when taxes are not considered; the tax deductibility ofinterest charges further reduces the cost of debt.
The preference share capital is also cheaper than equity capital, but not as cheap as debt. Thus, using thecomponent or specific cost of capital as a criterion for financing decisions and ignoring risk, a firm wouldalways like to employ debt since it is the cheapest source of funds.
Pecking Order Hypothesis: The cost of equity includes the cost of new issue of shares and the cost ofretained earnings. The cost of debt is cheaper than the cost of both these sources of equity funds. Betweenthe cost of new issues and retained earnings, the latter is cheaper. The cost of retained earnings is less thanthe cost of new issues because the company does not have to pay personal taxes which have to be paid byshareholders on distributed earnings, and also because, unlike new issues, no floatation costs are incurred ifthe earnings are retained. As a result, between these two sources, retained earnings are preferable. It hasbeen found in practice that the firms prefer internal finance and if they are not sufficient to meet the investmentoutlays, firms go for external finance, issuing the safest security first. They start with debt, then possiblyhybrid securities such as convertible debentures and then equity as a last resort. Myers has called it thepecking order theory since there is not a well defined debt equity target and there are two kinds of equity:external and internal, one at the top of pecking order and one at the bottom.
Trade Off Theory: It should be realized that a company cannot go on minimizing its overall cost of capitalby employing debt. A point is reached beyond which debt becomes more expensive because of the increasedrisk of excessive debt to creditors as well as to shareholders. When the degree of leverage increases, therisk to creditors also increases. They may demand a higher interest rate and may not further provide loan tothe company at all once the debt has reached a particular level. Furthermore, the excessive amount of debtmakes the shareholders’ position very risky. This has the effect of increasing the cost of equity. Thus, up toa point the overall cost of capital decreases with debt, but beyond that point the cost of capital would startincreasing and therefore it would not be advantageous to employ debt further. So there is a combination ofdebt and equity, which minimizes that firm’s average cost of capital and maximizes the market value pershare. The trade off between cost of capital and EPS set the maximum limit to the use of debt.
Thus, when we consider the leverage and the cost of capital factors, it appears reasonable that a firm shouldemploy a large amount of debt provided its earnings do not fluctuate very widely. In fact, debt can be usedto the point where the average cost of capital is minimum. These two factors taken together set the maximumlimit to the use of debt. However, other factors should also be evaluated to determine the appropriatecapital structure for a company.
15.4.3 Cash Flow Approach
Cash flow approach hinges on the principle of conservatism which is related to the fixed charge created byuse of debt or preference capital and the firm’s ability to generate cash to meet these fixed charges. A firmis considered prudently financed if it is able to service its fixed charges under any normally anticipatedadverse conditions.
The fixed charges of a company include payment of interest, preference dividends and principal and theydepend on the amount of loan securities and the terms of payment. If a company employs large amount ofdebt, the fixed charges will naturally be high. Whenever a company plans to raise additional debt, it should
243
analyze the expected future cash flows to meet the fixed charges. Companies expecting larger and stablecash inflows in the future can employ larger debt in their capital structure. On the other hand, companieswhose cash inflows are unstable are unpredictable will find it risky to employ large debt.
An important parameter to be examined at the time of capital structure planning is debt servicing ratio whichis the ratio of net cash inflows to fixed charges. Greater the ratio, greater is the amount of debt a companycan use. However, it should also be noted that it is not the average cash inflows but the yearly cash inflowswhich are important to determine the debt capacity of a company. Hence companies with predictable andstable cash inflows can take a higher debt that those with varying inflows. Ultimately, it is desirable to do afull cash flow analysis over a longer term to ensure that fixed financial obligations are met.
Components of Cash Flows: The cash flows should be analyzed over a long period of time, which cancover the various adverse phases, for determining the firm’s debt policy. The cash flow analysis can becarried out by preparing proforma cash flow statements to show the firm’s financial conditions under adverseconditions such as a recession. The expected cash flows can be categorized into three groups.
Operating Cash Flows refers to the operations of the firm and can be determined from the projectedprofit and loss statements. Behavior of sales volume, input and output price over the period ofanalysis should be examined and predicted.
Non-Operating Cash Flows include capital expenditures and working capital changes. Duringrecession period, the firm may have to specially spend for the promotion of the product and suchexpenditures as well as unavoidable capital expenditure during adverse conditions should be includedin non operating cash flows.
Financial Flows include contractual financial obligations (interest, lease rentals, repayment of debtetc) and policy financial obligations (dividends etc).
15.5 Practical Considerations in Determining Capital Structure
There are certain considerations in addition to the concerns about EPS, value and cash flow which determinecapital structure decisions. Some of these are listed below:
Dilution of Control: In designing the capital structure, the existing management is governed by itsdesire to continue control over the company. This is particular in case of firms promoted byentrepreneurs. The existing management team not only wants control and ownership but also tomanage the company without any outside interference.
Maintain Operating Flexibility: Flexibility means firms ability to adapt its capital structure to theneeds of changing conditions and the company should be able to raise funds without undue delayand cost whenever needed. It should also be in a position to redeem its preference capital and debtunder warranted situations. The financial plan should be so flexible to change the composition of thecapital structure as required by the firm’s operating strategy and needs. This basically depends onloan covenance, option to retire loans early and the excess resources at the command of the firm.
Marketability: Marketability means readiness of investors to purchase security in a given periodof time and to demand reasonable return. Though it does not influence the initial capital structure, itis an important consideration to decide about the appropriate timing of security issues. The continuouschanges in capital markets is an important input while deciding whether to raise funds with equity ordebt issue. The flotation costs is also considered an important factor influencing the capital structurewhen funds are raised externally.
244
Economies of Scale: Size of company may influence its capital and availability of funds fromdifferent sources. Small firms may find it difficult to raise long term loans and even if they are able to,it will be at a higher rate of interest and inconvenient terms. Therefore they depend on share capitaland retained earnings for their long term funds. For those which are able to approach the capitalmarket, the cost of issuing shares is generally more than the large sized companies.
Large sized company has relative flexibility in designing its capital structure. It can obtain loans withease and also sell shares to the public. Because of its large scale its cost of distributing security isless than that of a small company.
Agency Costs: There exists a conflict of interest among shareholders, debt holders and managementwhich may give rise to agency problems involving agency costs. This has an impact on firm’s capitalstructure. The conflict between shareholders and debt holders arise because of the possibility ofshareholders transferring the wealth of debt holders in their favor. The debt holders may lend moneyin low risk projects while the firm may invest in high risk projects. The conflict between shareholders and managers may arise on two aspects – firstly managers may transfer share holderswealth to their advantage by increasing their compensation and perquisites, secondly managers maynot act in the best interest of shareholders in order to protect their jobs. So managers may notundertake risk and thus forego profitable investments.
These problems are handled through monitoring and restrictive covenance which involve costs andthese costs are called agency costs. The implication of the agency cost of capital structure is thatmanagement should use debt to the extent that it maximizes the share holder wealth.
15.6 Summary
Capital structure planning is very important for survival of the business in long run. Planning the capitalstructure is highly complex as the components of capital structure are inter-related and also related to risk,return and value of the firm. There cannot exist a standard capital structure for all firms since there are lotsof factors significantly influencing the determination of the capital structure. Though the primary objectivewhile framing the capital structure is to maximize the returns to the share holders, the interests of othergroups, such as employees, customers, creditors, society and government, should also be given reasonableconsideration.
There are certain approaches for planning an appropriate Capital structure and each of them have advantagesand limitations too. EBIT- EPS approach focuses on finding a capital structure with the highest EPS overthe expected range of EBIT, thus helping the firm to achieve its ultimate objective of maximizing shareholders’wealth. This approach fails to explicitly consider risk which is one of the key factors in maximizing thewealth. In Cost of capital and valuation approach, a company should have such a mix of debt and equitythat its overall cost of capital is minimum. Measuring the cost of various sources of funds is complex and inorder to minimize the cost of capital, cheaper sources of funds should be identified and preferred. Cash flowanalysis clearly reveals that a higher debt equity ratio is not risky if the company has ability to generatesubstantial cash inflows in the future to meet its financial obligations. There are factors influencing cash flowand it is difficult to predict all the possible factors.
In practice, the determination of capital structure involves considerations in addition to the EPS, cash flows,cost of capital and value. Attitudes of managers with regard to financing decisions are quite often influencedby their desire to maintain control, to maintain operating flexibility, and to have convenient and cheapermeans of raising funds.
245
15.7 Self Assessment Questions
1. What do you mean by an appropriate capital structure? What are the factors influencing it?
2. Explain the features and limitations of the three approaches to the determination of capital structure.a) EBIT-EPS approach.b) Valuation approach.c) Cash flow approach.
3. If debt is cheaper than equity, why do firms not finance their assets with debt?
4. Write notes ona. Pecking order theoryb. Trade off theory.
5. What are the practical considerations in determining the capital structure?
6. A company is considering a most desirable capital structure. The cost of debt (after tax) and ofequity capital at various levels of debt equity mix are estimated as follows:
Debt as percentage of Cost of debt Cost of equitytotal capital employed (%) (%)0 10 1520 10 1540 12 1650 13 1860 14 20
Determine the optimal mix of debt and equity for the company by calculating composite cost of capital?
Solution: For determining the optimal debt equity mix, we have to calculate the composite cost of capitali.e. Ko which is equal to Kdp1+Kep2
Where Kd = Cost of debt
p1 = Relative proportion of debt in the total capital of the firmKe = Cost of equityp2 = Relative proportion of equity in the total capital of the firm
Before we arrive at any conclusion, it would be desirable to prepare a table showing all necessaryinformation and calculations.
Calculating Cost of capital
Kd % Ke % p1 p2 Kdp1+kep2= Ko10 15 0.0 1.00 0.0+15.0=1510 15 0.2 0.8 2.0+12.0=1412 16 0.4 0.6 4.8+9.6=14.413 18 0.6 0.5 7.8+9.0=16.814 20 0.6 0.4 8.4+8.0=16.4
The optimal debt equity mix for the company is at a point where the composite cost of capital is minimum.It is evident that a mix of 20% debt and 80% equity gives the minimum composite cost of capital of 14%.
246
Any other mix of debt and equity gives a higher overall cost of capital. The closest to the minimum costof capital is a mix of 40% debt and 60% equity where Ko is 14.4%. It can therefore be concluded thata mix of 20% debt and 80%
,equity will make the capital structure optimal.
15.8 Reference Books
- Chandra, Prasanna.,2007, Fundamentals of Financial Management, Tata McGraw, New delhi.
- Maheshwari, S.N., 2011, Financial Management, Sultan chand & Sons, New Delhi.
- Pandey, I.M.,2010, Financial Management,Vikas Publishing House Pvt Ltd.,New Delhi.
- Khan M.Y and Jain P.K. 2002, Cost Accounting and Financial Management, Tata McGraw Hill,New Delhi.
- Kulkarni,.P.V. Sathya B.G. 1999. Financial Management, (nineth revised edition), HimalayaPublishing, Bombay .
- Upadhyaya, K.M., 1985 Financial Management Kalyani Publishers, Ludhiana.
247
Unit - 16 : Sources of Long-term Finance
Structure of Unit:
16.0 Objectives16.1 Introduction16.2 Share Capital16.3 Debentures/Bonds16.4 Difference Between Shares and Debentures16.5 Retained Earnings16.6 Term Loan16.7 External Commercial Borrowings16.8 Foreign Loan through Depository Receipts16.9 Foreign Currency Convertible Bonds16.10 Euro Bonds and Foreign Bonds16.11 Leasing and Hire Purchase16.12 Venture Capital16.13 Book Building16.14 Debt Securitisation16.15 New Instruments16.16 Summary16.17 Self Assessment Questions16.18 Reference Books
16.0 Objectives
After completing this unit, you would be able to:
Understand the long term finance and its purpose for raising the fund from the sources of long term. Comprehend the share capital and its feature, advantages and disadvantages. Differentiate between the shares and debentures/bonds. Point out various forms of foreign loans through depository receipts and differentiation between
ADRs and GDRs. Know about the different forms of Venture Capital and its growth in India. Learn and appreciate the leasing and hire purchase as a source of long term finance. Understand the different new long term financial instruments.
16.1 Introduction
The firm has to maintain adequate amount of funds for successful operation of funds. As there should beadequate blood level in human body, the same is true with finance in business. Long term finance is alsocalled as long term capital, fixed capital or non-movable capital. The firms require long term fund financingfor purchasing fixed assets, expansion/improvisation, diversification and acquisition & takeovers etc. Longterm finance has two characteristics. I) it is used for fulfilling the long term financial needs of the company, II)they are fixed in nature and these finances can not be encased on will. At the time of inspection of firm fixedassets like land and building, machines, furniture, fittings, patents are purchased from long term finances.Long term finance is not liquid. The long term financial sources are Equity shares, preference shares, retainedearnings, debentures and long term debts etc.
248
16.2 Share Capital
The company has a statutory right to issue shares to raise funds. Funds procured through floatation ofshares are termed as ‘ownership capital’. According to Justice Lindle “Share is the proportional of profit ofwhich holder is liable to get.” The company can issue two types of shares i.e. Equity shares and Preferenceshares.
16.2.1 Equity Shares
Equity shares are owner’s equity having no maturity date. It is known as ordinary shares or common shares,real owners of the company as they have the voting rights and enjoy decision making authority on importantmatters related to the company. Without these shares the company cannot procure debt and preferenceshare capital from investors. The equity shareholders’ return is in the form of dividend depends on theprofits of the company and capital gain/loss at the time of their sale. According to Indian Company’s Act,any company which issues the shares for the first time must issue it at its par value. However, subsequentshares can be issued at a premium.
Features of Equity Shares
Maturity: They provide permanent capital to the firm and no maturity date is fixed for such funds.It is only in the event of liquidation that the shareholders get the profits after meeting all debt obligations.However, the shareholders are free to sell their shares in the secondary market if they requireliquidation their investments.
Claim on Income: The shareholders are the residual claimant on the income and the assets of thecompany. The operating profits are first of all utilized for meeting all the expenses and obligationsand thereafter it is distributed in the form of dividend among the preference shareholders. If theprofit left after meeting all the above then it is distributed among the equity shareholders as dividend.
Claim on Assets: The equity shareholders are having the residual claim on the assets of the company.When the company goes for winding up, the assets are used to pay all the expenses and outstandingliabilities. Thereafter, if any assets are left over, then the equity shareholders can claim on them.
Right to Control or Voting Rights: The equity shareholders have the right to vote in annualgeneral meeting on any resolution placed in it. It is in the proportion of the paid up capital of eachshareholder of the company. The boards of directors are selected by the equity shareholders whoappoint the managers who manage the company. The equity shareholders are having the supremeand ultimate control on the affairs of the company.
Preemptive Rights: As and when a public limited company wants to issue fresh equity shares,they are to be offered first to the existing shareholders. This is known as pre-emptive right. Thepurpose is to enable the shareholders to continue to have proportionate share of ownership. Forexample, if a shareholder has 5% ownership, he has to be offered 5% of the new shares to beissued.
Limited Liability: The liabilities of the equity shareholders are limited to the face value of theshares. In case the shareholder has paid the full amount of the face value, he is no more liabilityexists even if the company goes into liquidation and its liabilities are more than its assets.
249
Merits of Equity Financing
No Cash Outflow: As the equity financing is a permanent source of capital. The company doesnot have the fear of redemption and outflow of cash. The funds are available with the company tillthe company goes for liquidation.
Borrowing Base: lenders feel confident while lending to the company on the basis of its capital.Generally they lend in proportion of the company’s equity capital.
No Compulsion for Payment of Dividend: The equity shareholders are the residual claimantand it is not essential requirement to pay the dividend compulsorily. The company may suspend thepayment of dividend in the case of financial difficulty.
Real Owners and Gainers: The equity shareholders are having the control on the affairs of thecompany hence they are the real owner and in case of profit they are the real gainers by way ofincreased dividend as well as appreciation of market price.
Demerits of Equity Financing
Cost of Equity: The cost of equity financing is the highest as compared to other source of financingbecause of dividend is not tax deductable. Floatation cost is also incurred which is comparativelyhigh than the debt. Floatation costs are incurred incidentally by the company at the time of issue ofshare.
Trading on Equity: It is possible only when debt is issued along with the equity share and it is nothappen when the total requirement of the company is met through equity share capital alone. Tradingon equity enhances the earnings of equity share.
Risk: The equity is more risky, from the viewpoint of investors, as compared to debt because thereis no certainty of return. Raising the fund through equity is more costly and rather difficult.
Dilution of Earnings: As company go for additional issue of shares and proportionately theearnings do not increase in that case the earning per share get diluted.
Ownership Dilution: The company issues further equity to existing shareholders in order tomaintain the proportionate ownership. In case of financial difficulty, this existing control is likely tobe lost. This is the threat with closely held company.
Activity A:
1. According to you why equity financing is needed in a company? List out any ten companies whohave their financing through equity shares.
16.2.2 Preference Shares
As the very name suggests, preference shares have certain preferences compared to equity shares. Preferenceshareholders enjoy the twin preferences in respect of dividend payment and repayment of principal amount,in the event of liquidation, compared to equity shareholders. In the real sense, preference share capital is ahybrid form security, as it carries some of the features of equity share as well as debentures.
Preference shares have gained importance after the Finance bill 1997 as dividend become tax exempted inthe hands of the individual investor and are taxable in the hands of the company as tax is imposed ondistributed profits at a flat rate. At present, a domestic company paying dividend will have to pay dividenddistribution tax @ 12.5% plus surcharge of 10% plus an education cess equaling 2% (Total 14.025%)
250
Features of Preference Shares
Maturity: Preference shares are perpetual. In the normal course of time, they are not repaid,similar to equity share. Their money is returned in the event of liquidation, after payment of debentureholders. But unlike equity it may have a call back arrangement or redemption feature. If it is redeemableor callable preference shares, then it may be redeemed at the time of maturity.
Claim on Income and Assets: Preference shares are a senior security compared to equity share.The preference shareholders are having prior claim on the company’s income and repayment ofdividend then the equity holders. In the event of liquidation, the holders of the preference shares areprior right then the equity holders on the repayment of the amount of their shares.
Nature of Preference Dividends: The dividend on the preference shares are fixed and if companyis having extra earning then no extra dividend are paid to preference share holders. In case thearticle of association permits then the unpaid amount of dividend in any year due to loss in anyparticular year of the company, it will be carried forward for further period and paid when there isprofit.
Convertibility: Sometimes the preferred stock has the feature of convertibility and if so then theshareholders get a privilege to convert his preference shares into equity shares. The article of associationprovides the conversion price clearly.
Controlling Power: Preference shareholders have no voting rights in the management of thecompany. However, they have a right to vote in respect of those matters that affect them directly. Incase of dividend is in arrears for two consecutive years, preference shareholders can nominate amember on the board of the company.
Hybrid form of Security: Preference share capital is a hybrid form security, as it carries some ofthe features of equity share as well as debenture. Preference share is similar to equity share, as non-payment of dividend does not compel the company to go into liquidation. Payment of dividend isnot obligatory. However, dividend paid is not tax deductible. The preference share is similar todebenture, as fixed rate of dividend is paid, just like a fixed rate of interest. They can not claim ashare in the residual profits of the company.
Not Tax Deductible: Preference dividends are not tax deductible as they are paid after giving thetax on the company’s income. Unlike preference dividends Interest paid on debt is deducted beforepaying tax, hence tax incident is lowered when interest is paid on debt which is known as interesttax shield. Thus preferred capital is costlier than debt borrowed by the company.
Participation: Sometime Company issues participating preference shares and in that case thepreference shareholders get a right to participate in the balance of extraordinary profits in a stipulatedproportion together with equity shareholders. Thus the preference shareholder gets fixed dividendand flexible dividend which will depend on the extra earnings of the company i.e. extraordinaryprofits.
Advantages of Preference Shares
The advantages of Preference shares can be enumerated for both to the company as well as to its investors.
(A) Company’s Point of view: The company has the below explained advantages by issuing preferenceshares.
251
Absence of Legal Obligation: The dividend to the preference shareholders are paid only if thecompany has the distributable profits. Thus it can be connoted that the company does not have anylegal commitment or financial burden.
Fixed Rate of Dividend: The amount of dividend is specified at the time of issue of preferenceshares hence no surplus amount is paid even if the company has handsome profit except in the caseof participating preference shares.
Cost of Capital: The cost incurred on such type of instrument financing capital is less than theequity shares.
Long term Capital: The outflow of cash is negligible as these are treated as permanent source ofcapital. But redeemable preference shares are to be redeemed at the end of specified period ormaturity out of the proceeds of fresh issue of shares or accumulated profits of the company.
Trading on Equity: Raising funds through this source magnifies the earning of the equity shares,paying fixed rate of dividend to preference shareholders. This is a risk-free leverage advantage withpreference share capital. Even, default in payment of dividend does not force the company intoinsolvency.
Enhances Creditworthiness/ Borrowing Ability: It is regarded as a part of net worth hence itenhances the creditworthiness of the company. The company has ability to get more borrowingfrom outside.
Absence of Dilution of Control: The preference shareholders do not have the voting powerexcept in case where their interests are directly affected. So, there is no threat of dilution of controlfrom preference shareholders.
Assets are Not Pledged: No specific assets are pledged, while issuing preference shares. So,company’s mortgage able assets are not disturbed in any manner.
(B) Investors Point of view: The investors enjoy the following benefits
Fixed Rate of Dividend: The cumulative preference shareholders are paid dividend at fixed ratebut in case the company incurs loss in any year then the dividend at fixed rate is paid in the subsequentyear’s profits. In case of non cumulative preference share, this is not the case. Dividend is not paidfor the year of loss.
Treated Superior Security Over Equity Share: Preference share enjoys preference over dividendand repayment of fund on Equity shares. Hence, investors prefer to invest in preference share.
Right to Vote: Preference shareholder has the right to vote in case when their interest is directlyaffected by any resolution.
Disadvantages of Preference Shares: In spite of numerous advantages, it is not free from shortcomingswhich is enumerated as below
(A) Company’s Point of View
Cost of Source: The cost of preferred stock & risk is more than the debenture. Hence, from this point, thedebenture is more suitable.
No Tax Advantages: The dividend on preference share is not tax deductible, while the interest ondebenture enjoys tax shield or advantage.
252
Affects Creditworthiness: The Company does not have any legal obligation to pay dividend onpreference shares but in case of non-payment of dividend affects the creditworthiness of the company.
(B) Investor’s Point of View
At Management Mercy: Normally, the preference shareholders do not have any voting rights,they remain at the mercy of management for dividend as well as redemption of capital.
Lower Return: When compared with equity shares, the preference shares are having lower return.
No Charge on Assets: The charges on assets are not available to the preference shares as availableon debentures. So, preference share rank after debentures, in case of liquidation of the company.
Activity B:
1. Why preference shares are called as hybrid security? Analyze the situation when preference shareare beneficial in general.
16.3 Debentures/Bonds
A debenture is a long term promissory note for raising loan capital. It may be either secured or unsecured.Debenture or Bond is a creditor ship security, with a fixed rate of interest and fixed maturity period. Debenturesprovide low risk capital to the company. Those who invest in debentures are called debenture holders. Analternative form of debenture is Bond in India. Public sector companies in India mostly issue bonds. Theinterest paid is a charge to the profit and loss account. Debentures are normally secured by a floating chargeon the assets of the company. The bond is secured by specific assets of the company. In USA bonds areeither secured or unsecured and debentures are unsecured bonds. As we know debentures are long termdebts of a company which borrows money on a promise to pay at a later date with specified interest, theinterest rate is usually fixed.
According to Indian Companies Act, Section 2(12) “Debenture includes debenture stock, bonds and anyother securities of a company whether constituting a charge on the assets of a company or not”. As Tophanhas defined “Debenture is a document given by a company as evidence of a debt to the holder usuallyarising out of a loan and most commonly secured by charge.”
C.W. Gerstenberg has defined “A corporate bond is a written promise under seal to pay a specified sum ofmoney at a fixed time in future, usually more than ten years after the promise is made with interest at fixedrate, payable at specified interest dates.”
Public issue of debentures and private placement to mutual funds now require that the issue be rated by acredit rating agency like CRISIL (Credit Rating and Information Services of India Ltd.). The credit rating isgiven after evaluating factors like track record of the company, profitability, debt servicing capacity, creditworthiness and the perceived risk of lending.
Features of Debentures/Bonds
Maturity: Debentures are issued for a specific period of time and treated as source of long term finance.Generally, debentures are issued for a period of 7 to 10 years and are redeemed on the specific date.
Fixed Interest Rate: The interest rate on debenture is fixed and does not change during the tenureof debenture, irrespective of the profit/loss of the company. Interest is calculated on the face valueof the debenture. Interest is tax deductible and it is the income of the debenture holder and taxablein the hands of the debenture holders.
253
Claim on Income: Interest payment is the obligation on the company even if the company incursloss. Default in payment of interest empowers the debenture holder to move a petition in a court oflaw for the winding up of the company.
Claim on Assets: At the time of liquidation, debenture holders are repaid their claim first beforerepayment is made to preference and equity shareholders. Debentures may have a specific chargeor floating charge on the assets of the company. In the event, they are secured creditors. The saleproceeds of the assets pledged to them go towards repayment of principal and interest to them.
Convertibility: The debentures having a conversion clause are known as convertible debentures.These debentures can be converted to equity shares after a certain period of time.
Callable Feature: Call feature enables the company to redeem the debentures before the duedate of redemption. Generally, the company can go for it when the interest rate payable is high thenthe current interest rate. In order to save costs, the company redeems the debentures before thedue date. Normally, call price is higher than the issue price. It is noteworthy to mention that thecompany is gaining, hence, it is not an issue to share some gain with the debenture holders.
Indenture or Trust Deed: It is a legal agreement between the company issuing the debentures onone hand and the trustees representing debenture holders on the other hand. The trust deed providesthe specific terms in respect of the description of debentures, security available, rights of debentureholders and of the issuing company and responsibilities of the trustees. The responsibility of thetrustees is to protect the rights of the debenture holders by enforcing the responsibilities of thecompany that has issued debentures. Normally, a financial institution or insurance company isappointed as a trustee.
Controlling Power: A Debenture holder does not have any voting right; therefore, they do notenjoy the controlling power and can not participate in the management of the company. They haveonly prior claim in repayment over equity and preference shareholders.
Benefits of Debentures
Less Costly: The debenture is less costly source of finance than preference and equity shares asthe interest is tax deductible. From the perspective of investor, it is less risky investment and offersfixed rate of return.
Absence of Dilution: Debenture holder do not enjoy any voting rights, hence, there is not anyquestion of dilution of ownership or control.
Fixed Interest Rate: The debenture holders are entitled for the fixed rate of interest as specifiedin the debenture. They do not have any claim on the extra share in the earnings of the company. So,cost to the company is fixed.
Beneficial during Inflation: Real interest cost declines during the period of inflation.
Easy to Raise Funds: At the time of depression or low sentiments in the market, the debenture asa source of finance is easy and comfortable. The investors appreciate the benefits of certainty ofincome, with low risk during those periods.
Trading on Equity: In case the return on investment is higher than the cost of debt, it is advantageousto the company to raise fund through debentures as it can trade on equity and enhances the earningsto the equity holders.
254
Flexibility: Debenture provides flexibility in the capital structure of the company as company canredeem debentures, as and when it has surplus funds and desires to do so. Generally, companyreserves the right in the form of ‘call option’ at the time of issue to take advantage of the fallinginterest rates in the market.
Disadvantages of Debentures
Obligatory Payment: The payment of interest is a legal obligation even in the case of company isincurring loss in any particular year. Redemption of debentures is to be made at the end of maturity.Default in payment may force the company to go into liquidation.
Financial Risk: If a company is having fluctuating sales and earnings than it enhances the financialleverage and financial risk.
Stamp Duty: The cost of stamp duty will increases the cost of financing.
Not for All the Companies: Debenture interest is a fixed commitment. This should be noted thatit not desirable for the companies which do not have stable earnings or who deal in products withelastic demand to issue debentures. The company that cannot offer assets as security cannot usethis source of financing.
Cash Outflows: As debentures are to be redeemed at the end of the maturity period. When it isredeemed, the cash outflow occurs. Even if a sinking fund is created to meet the redemption outflow,annual cash outflow occurs.
Restrictive Covenants: The restrictive conditions are contained in the debenture indenture. As acondition can be incorporated in the indenture that the total borrowing by the company cannotexceed a specified limit. Hence, the restrictive covenants limit the operating flexibility of the companyin future.
Activity C:
1. How you would able to say that the debenture is cheaper source of finance than the equity orpreference share? Enumerate your view with practical example.
2. “In a period of rising prices, debenture issue is advantageous”. Justify your answer in the context ofabove statement.
16.4 Difference Between Shares and Debentures
The debentures carry a fixed rate of interest, which is to be paid by the company, irrespective of profits.Normally, debentures are secured. Companies offer collateral security to debenture holders to make thencomfortable from the view point of security. Debenture holders are unlikely to suffer from the financialfailure of the company, in case they are secured and enough money is realized at the time of sale.
Equity shares bear the highest risk as it does not give any guarantee of dividend payment. In case of loss, theequity shareholders do not get any dividend at all. The equity shareholders hardly get back their moneywhen the company goes for liquidation because most of the money would have disappeared from thecompany towards losses by the time. The dissimilarities between shares and debentures are given as under.
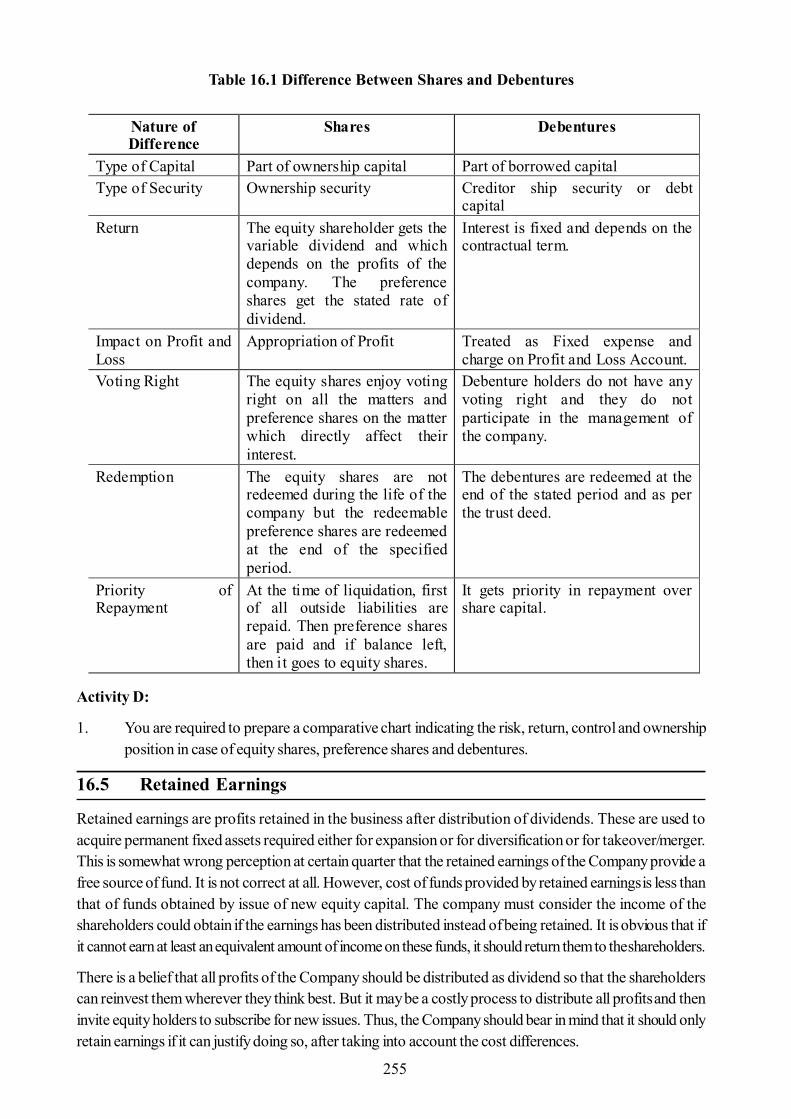
255
Table 16.1 Difference Between Shares and Debentures
Activity D:
1. You are required to prepare a comparative chart indicating the risk, return, control and ownershipposition in case of equity shares, preference shares and debentures.
16.5 Retained Earnings
Retained earnings are profits retained in the business after distribution of dividends. These are used toacquire permanent fixed assets required either for expansion or for diversification or for takeover/merger.This is somewhat wrong perception at certain quarter that the retained earnings of the Company provide afree source of fund. It is not correct at all. However, cost of funds provided by retained earnings is less thanthat of funds obtained by issue of new equity capital. The company must consider the income of theshareholders could obtain if the earnings has been distributed instead of being retained. It is obvious that ifit cannot earn at least an equivalent amount of income on these funds, it should return them to the shareholders.
There is a belief that all profits of the Company should be distributed as dividend so that the shareholderscan reinvest them wherever they think best. But it may be a costly process to distribute all profits and theninvite equity holders to subscribe for new issues. Thus, the Company should bear in mind that it should onlyretain earnings if it can justify doing so, after taking into account the cost differences.
Nature of Difference
Shares Debentures
Type of Capital Part of ownership capital Part of borrowed capital Type of Security Ownership security Creditor ship security or debt
capital Return The equity shareholder gets the
variable dividend and which depends on the profits of the company. The preference shares get the stated rate of dividend.
Interest is fixed and depends on the contractual term.
Impact on Profit and Loss
Appropriation of Profit Treated as Fixed expense and charge on Profit and Loss Account.
Voting Right The equity shares enjoy voting right on all the matters and preference shares on the matter which directly affect their interest.
Debenture holders do not have any voting right and they do not participate in the management of the company.
Redemption The equity shares are not redeemed during the life of the company but the redeemable preference shares are redeemed at the end of the specified period.
The debentures are redeemed at the end of the stated period and as per the trust deed.
Priority of Repayment
At the time of liquidation, first of all outside liabilities are repaid. Then preference shares are paid and if balance left, then it goes to equity shares.
It gets priority in repayment over share capital.
256
Activity E:
1. “Retained Earning is a free source of finance.” Do you feel that this statement is correct? If yes, thenput your opinion in support of this statement.
16.6 Term Loan
Companies can raise long term finance through term loans, in addition to share capital and debentures. Theterm loans are provided by commercial banks, all development financial institutions, State level financialinstitutions and investment institutions to the industrial sector to encourage industrial development in India.They are obtained for financing large expansion, diversification or modernization projects. Term lendingfinancing is also known as project financing. The major advantage of a term-loan is that it is for a fixedperiod. Repayment of installment can be paid back from the profit generations of the company. More so,interest liability is fixed and cannot be varied so the profitability of the project in not affected for a long term.
Features of Term Loan
Purpose: It is mostly to meet the capital expenditure.
Maturity: The maturity for long period is granted beyond five year and one to five year is grantedfor medium term loan.
Documentation: In case of term loan, agreement is entered between the company and the financialinstitution that sanctions the term loan. The term loan document specifies all conditions of sanction,security, interest as well as repayment etc.
Security: term loan are always secured. The assets purchased through the term loan constitute thesecurity. This is called primary security. The company’s current and future assets also generallysecure term loans. This is called secondary security.
Schedule for Repayment: Loans are repaid through installment system. Interest is charged on theoutstanding balance. So, interest burden declines over the years. Company has to pay interest aswell as installment amount fixed in the agreement.
Direct Negotiation: The Company directly negotiates term loan for project finance with the termlending institution. Thus, term loan is private placement. It saves the company underwriting commissionand floatation costs. The benefits of term loan are ease of negotiation and low cost of raising funds.
Restrictive Covenants: The lender may like to protect its financial interest apart from the security.This is done through restrictive covenants, incorporated in the agreement while sanctioning termloan.
Activity G:
1. You are advised to collect the information about term loan from the related institution and preparethe list of elements of the same.
16.7 External Commercial Borrowings
Indian promoters can also borrow directly from foreign institutions, foreign development bank, World Banketc. It is also known as Foreign Currency Term Loans. Foreign institutions provide foreign currency loansand financial assistance towards import of plants and equipments. The interest on these loans is payable inforeign currency. On the payment date, interest amount is converted into domestic currency at the prevailing
257
foreign exchange rate. The borrowings, repayment and interest payments can be tailor-made in view of thecash flow position of the project. This is done through restrictive covenants, incorporated in the agreementwhile sanctioning term loan.
16.8 Foreign Loan through Depository Receipts
Depository Receipts means any instrument in the form of a depository receipt or certificate created by theOverseas Depository Bank outside India and issued to the non-resident investors against the issue of ordinaryshares. A Depository Receipt is a negotiable instrument evidencing a fixed number of equity shares of theissuing company generally denominated in US dollars. DRs are commonly used by those companies whichsell their securities in international market and expand their shareholdings abroad. These securities are listedand traded in International Stock Exchange. These can be American Depository Receipts (ADRs), EuropeanDepository Receipts (EDRs) and Global Depository Receipts (GDRs)
American Depository Receipts (ADRs) in the USA: ADRs are negotiable receipts issued to investorsby an authorized depository (U.S. bank or depository). In general, ADRs are issued in case the funds areraised through retail market in United States. ADRs are listed and traded in a U.S. based stock exchange soit helps in Indian Company going for ADR to be known in the highly liquid U.S. stock exchanges. Indiancompanies are not allowed by law to list rupee denominated shares directly in foreign stock markets. Hencethe company issues the shares to a depository which has an office in India. These shares remain in India witha custodian. Against these shares the depository issues dollar denominated receipts to the foreign investors.The foreign investors can sell these receipts either in the foreign exchange or to the depository and get therupee denominated shares which can be sold in Indian markets. Thus investors gain by playing with thedifference in prices on the U.S. and Indian exchanges. ADRs are instruments that effectively allow non-UScorporate to sell equity to the US investors, by virtue of corporate shares being held by a depository bankwhich issues a receipt. These are marketed and sold by coordinated banks like the bank of New York,Citibank, JP Morgan and bankers trust.
European Depository Receipts (EDRs) in Europe: Unlike ADRs, EDRs are denominated in Europeancurrency and issued in Europe. However, they are not that popular as ADRs as European markets aredominated by Japanese securities.
Global Depository Receipts (GDRs) in International Market: GDRs are multiple market orientedi.e. they can raise equity capital anywhere throughout the world. Unlike ADRs & EDRs, GDRs have theadvantage of inter-market trading amongst the different investors in different countries. Through GDRs afirm can raise capital in more than one country simultaneously through only one security.
ADRs v/s GDRs: ADRs are listed on American Stock Exchange while GDRs are listed in stock exchangesother than American Stock Exchange; Under ADRs issue the process as governed by American laws andSEC (Securities & Exchange Commission) whereas such laws are not applicable to GDRs; ADRs issueinvolves adhering to very stringent disclosure and accounting norms i.e. U.S. GAAP, it requires a combinedbalance sheet of all group companies and not just the single group company going for the issue whereasdisclosure requirements for GDRs are comparatively less strict and ADR market is more liquid comparedto GDR market. Hence company’s going for ADR are able to enhance their shareholders value.
Activity F:
1. What are the reasons that the depository receipts are becoming popular now-a-days? Elaborateand analyse the situation in the context of LPG (Liberalisation, Privatisation, Globalisation)
258
16.9 Foreign Currency Convertible Bonds
The FCCB means bonds issued in accordance with the relevant scheme and subscribed by a non-residentin foreign currency and convertible into ordinary shares of the issuing company in any manner, either inwhole or in part, on the basis of any equity related warrants attached to debt instruments. The FCCBs areunsecured; carry a fixed rate of interest and an option for conversion into a fixed number of equity shares ofthe issuer company. Interest and redemption price (if conversion option is not exercised) is payable indollars. Interest rates are very low by Indian domestic standards. FCCBs are denominated in any freelyconvertible foreign currency.
FCCBs have been popular with issuers. Local debt markets can be restrictive in nature with comparativelyshort maturities and high interest rates. On the other hand, straight equity issue may cause a dilution inearnings and certainly a dilution in control, which many shareholders, especially major family shareholderswould find unacceptable. Thus, the low coupon security which defers shareholders dilution for several yearscan be alternative to an issuer. Foreign investors also prefer FCCBs because of the dollar denominatedservicing, the conversion option and the arbitrage opportunities presented by conversion of the FCCBs intoequity at a discount on prevailing Indian market price.
16.10 Euro Bonds and Foreign Bonds
International/overseas borrowing/debts are termed as ‘euro bonds’. It is issued by international borrowersand is sold to investors in countries with currencies different from the currency in which the bond isdenominated. The most popular currency in which such bonds are offered and accepted is ‘dollar’denominated. Plain Euro Bonds are nothing but debt instruments. These are not very attractive for aninvestor who desires to have valuable additions to his investment.
Euro Bonds are issued in a single currency in different countries while foreign bonds are issued in differentcountries in the respective country’s currency by the foreign borrower e.g. Indian firm issuing foreign bondsin America will issues in dollar term. In domestic capital markets of various countries the Bonds issuesForeign Euro Bonds known by different names such as Yankee Bonds in the US, Swiss Frances inSwitzerland, Samurai Bonds in Tokyo and Bulldogs in UK.
16.11 Leasing and Hire Purchase
Leasing has recently emerged as an important source of long term financing of the business enterprises. Thisis an arrangement under which a company acquires the right to use the asset without owning it or in otherword it is a right to use an equipment/fixed asset on payment of periodical amount known as lease rental. Itis in the form of written agreement signed by both the owner of the asset and the user for the economic useof the asset for a definite period of time. Those firms, which do not wish to purchase the asset, instead enterinto leasing arrangement and find it profitable in case of highly expensive assets. In case of hire purchase, theassets are acquired on credit and payments are made as per terms and conditions. Peculiar feature of hirepurchase is that the person using the asset is the owner of the asset. Full title is transferred to him after he haspaid the agreed installments. The asset is shown balance sheet of user and he is entitled to depreciation andother allowances on the asset for computation of tax during the tenure of hire purchase agreement andsubsequently.
The growth of leasing business specially equipment leasing is of recent origin (1983) and volume of businesstill today is not that big. By 1985 there has been massive tendency for public issues for operating leasingbusiness. However, that tendency got subsided by 1987. Apart from many private sectors non-bank financial
259
companies, some private sector manufacturing companies ICICI, IRBI different subsidiaries of a number ofnationalized bank like SBI Capital Market Ltd, Can Bank Financial services, IFCI, LIC, GIC, HDFC,Cater Lease Financing in India. For development of leasing business, favorable Tax Policy is essential. Theboom of leasing in 1985 was short-lived because of a) Crowding of so many leasing companies lead toreduction of lease rental and thus profitability got affected, b) Obtaining of fund by so many leasing Companiesat reasonable rate became difficult.
The hire purchase credit is medium term credit. A down payment is made ranging from 10% to 25%. Hirepurchase financing in commercial vehicle is most popular in India. However, automobiles financing fordomestic purpose has also become popular recently. Normally goods are hypothecated in favour of thelenders. When there is long payment schedule (period) and the amount is large, guarantee is generallyinsisted in addition to hypothecation. In hire purchase financing the peculiarity is that the financier chargessimple interest on total loan and not on diminishing balance. This imposes a heavy burden on the borrower.
Difference Between Leasing and Hire Purchase
1. In leasing the person using the asset is not the owner of the asset whereas in Hire Purchase, theperson using the asset may become the owner of the assets.
2. In case of leasing, after payment of the agreed lease installments the ownership does not get transferredto the lessor whereas in case of Hire Purchase, after payment of the agreed lease installments theownership is transferred to the person using the asset.
3. In leasing, the lessor claims the depreciation and other allowances whereas in Hire Purchase, thedepreciation and other allowances on the asset are claimed by the lessee (user of the asset).
In case of leasing, asset is shown in the balance sheet of the lessor. As the asset is not shown in the balancesheet of the lessee, hence it is known as ‘off the balance sheet asset’ for the lessee whereas In case of HirePurchase, asset is shown in the balance sheet of the lessee.
Activity G:
1. How leasing is different from Hire Purchase? If you have to choose any one source of finance fromthe above two for your organization then which is preferred by you and why? Discuss.
16.12 Venture Capital
The venture capital refers to financing of new high risky venture promoted by qualified entrepreneurs wholack experience and funds to give shape to their ideas. In broad sense, under venture capital financingventure capitalist make investment to purchase equity or debt securities from inexperienced entrepreneurswho undertake highly risky ventures with a potential of success. The features of the venture capital can beenumerated as it is basically a equity finance in new companies, viewed as long term investment in growthoriented small/medium firm and apart from providing funds, the investor also provides support in form ofsales strategy, business networking and management expertise, enabling the growth of the entrepreneur.
In India venture capital started in 1986 when ICICI set up the first venture fund cell in Bombay. This later onmerged into the Technology Development and Information Company of India Ltd. (TDICI), a Bangalorebased company of ICICI with an equity of 1 crore (contributed equally by ICICI and UTI). Unlike developedcountries, in India venture capital does not finance the risky idea/technology. Indian technological set upshave usually been of a foreign collaboration type. In India venture capital is usually of nature of financingsmall scale enterprises. However, the concept is catching up. Many support institutions are encouragingventure capital idea. In the year 1988, the Government of India took a policy initiative and announced
260
guidelines for Venture Capital Fund (VCFs). In the same year, a Technology Development Fund (TDF)financed by the levy on all payments for technology imports was established. This fund was meant tofacilitate the financing of innovative and high risk technology programmes through the IDBI.
A major development in venture capital financing in India was in the year 1996 when the Securities andExchange Board of India (SEBI) issued guidelines for venture capital funds to follow. These guidelinesdescribed a venture capital fund as a fund established in the form of a company or trust, which raises moneythrough loans, donations, issue of securities or units and makes or proposes to make investments in accordancewith the regulations. This move was instrumental in the entry of various foreign venture capital funds to enterIndia. The guidelines were further amended in April 2000 with the objective of fuelling the growth of venturecapital activities in India.
Methods of Venture Capital Financing
Some common methods of venture capital financing can be enumerated as follows:
Equity Financing: Sometime undertakings require funds for a longer period but they may not beable to provide returns during the initial period. Therefore, the venture capital finance is generallyprovided by way of equity share capital. It is worth mentioning that the equity contribution ofventure capitalist should not exceed 49 % of the total equity capital of venture capital undertakingsso that effective control and ownership remains with the entrepreneurs.
Conditional Loan: This is repayable in the form of a royalty after the venture is able to generatesales. The interest is not paid on such loans. The royalty is generally charged between 2 to 15percent but the actual rate depends on other factors of the venture such as gestation period, cashflow patterns, risk and other factors of the enterprise.
Income Notes: This is a hybrid security which includes the features of both conventional loan andconditional loan. The entrepreneur has to pay both interest and royalty on sales but at substantiallylow rates. IDBI’s VCF provides funding equal to 80-87.50% of the projects cost for commercialapplication of indigenous technology.
Participating Debenture: This type of security carries charges in three phases- In the start upphase no interest is charged, next stage a low rate of interest is charged up to a particular level ofoperation, after that, a high rate of interest is required to be paid.
Activity I:
1. What contribution venture capitalists have made towards economic growth? Discuss critically givingappropriate example.
16.13 Book Building
Book Building is a common practice in developed countries and has recently been making inroads intoemerging markets as well, including India. Book building is essentially a process used by companies forraising capital through Public offerings- both Initial Public Offers (IPOs) and Follow on Public Offers (FPOs)to aid price and demand discovery. It is a mechanism where during the period for which the book for theoffers are open, the bids are collected from investors at various prices which are within the price bandspecified by the issuer. The process is directed towards both the institutional as well as the retail investors.The issue price is determined after the bid closure, based on the demand generated in the process.
261
During the fixed period of time for which the subscription is open, the book runner collects bids frominvestors at various prices between the floor price and the cap price. Bids can be revised by the bidderbefore the book closes. The process aims at tapping both wholesale and retail investors. The final issueprice is not determined until the end of the process when the book is closed. After the closure of the bookbuilding period, the book runner evaluates the collected bids on the basis of certain evaluation criteria andsets the final issue price. If demand is high enough, the book can be oversubscribed. In this case, the greenshoe option is triggered.
16.14 Debt Securitisation
Securitization is a process in which illiquid assets are pooled into marketable securities that can be sold toinvestors. The process leads to the creation of financial instruments that represents ownership interest in, oris secured by a segregated income producing asset or pool of assets. These assets are secured by personalor real property such as automobiles, real estate or equipment loans but in some cases are unsecured.
Process of Securitization: It follows the following process.
Step I – SPV (Special Purpose Vehicle) is created to hold title to assets underlying securities as a repositoryof the assets or claims being securitized.
Step II – The originator i.e. the primary financier or the legal holder of assets sells the assets (existing orfuture) to the SPV.
Step III – The SPV, with the help of an investment banker, issues securities which are distributed toinvestors in form of pass through or pay through certificates.
Step IV – The SPV pays the originator for the assets with the proceeds from the sale of securities.
The process of securitization is generally without recourse i.e. the investor bears the credit risk or risk ofdefault and the issuer is under an obligation to pay to investors only if the cash flows are received by himfrom the collateral. The issuer however, has a right to legal recourse in the event of default. The risk run bythe investor can be further reduced through credit enhancement facilities like insurance, letter of credit andguarantees.
In India, the Reserve Bank of India had issued draft guidelines on securitization of standard assets in April2005.These guidelines were applicable to banks, financial institutions and non banking financial companies.The guidelines were modified and brought into effect from February 2006.
16.15 New Instruments
The new instruments that have been introduced since early 90’s as a source of finance is staggering in theirnature and diversity. These new instruments are as follows:
Deep Discount Bonds: It is a form of Zero-interest bonds. These bonds are sold at a discountedvalue and on maturity face value is paid to the investors. In such bonds, there is no interest payoutduring lock in period. IDBI was the first to issue a deep discount bond in India in January, 1992.The bond of a face value of Rs. 1 lakh was sold for Rs. 2,700 with a maturity period of 25 years.The investor could hold the bond for 25 years or seek redemption at the end of every five yearswith a specified maturity value. The investor can sell the bonds in stock market and realize thedifference between face value (Rs. 2,700) and market price as capital gain.
262
Secured Premium Notes: Secured Premium Notes is issued along with a detachable warrant andis redeemable after a notified period of say 4 to 7 years. The conversion of detachable warrant intoequity shares will have to be done within time period notified by the company.
Zero Interest Fully Convertible Debentures: There are fully convertible debentures which donot carry any interest. The debentures are compulsorily and automatically converted after a specifiedperiod of time and holders thereof are entitled to new equity shares of the company at predeterminedprice. From the point of view of company this kind of instrument is beneficial in the sense that nointerest is to be paid on it, if the share price of the company in the market is very high than theinvestors tends to get equity shares of the company at the lower rate.
Zero Coupon Bonds: A Zero Coupon Bond does not carry any interest but it is sold by the issuingcompany at a discount. The difference between the discounted value and maturing or face valuerepresents the interest to be earned by the investor on such bonds.
Double Option Bonds: These have also been recently issued by the IDBI. The face value of eachbond is Rs. 5,000. The bond carries interest at 15% per annum compounded half yearly from thedate of allotment. The bond has maturity period of 10 years. Each bond has two parts in the formof two separate certificates, one for principal of Rs. 5,000 and other for interest (including redemptionpremium) of Rs. 16,500. Both these certificates are listed on all major stock exchanges. The investorhas the facility of selling either one or both parts anytime he likes.
Option Bonds: These are cumulative and non-cumulative bonds where interest is payable onmaturity or periodically. Redemption premium is also offered to attract investors. These were recentlyissued by IDBI, ICICI etc.
Inflation Bonds: Inflation Bonds are the bonds in which interest rate is adjusted for inflation. Thus,the investor gets interest which is free from the effects of inflation. For example, if the interest rate is11 percent and the inflation is 5 percent, the investor will earn 16 percent meaning thereby that theinvestor is protected against inflation.
Floating Rate Bond: This as the name suggests is bond where the interest rate is not fixed and isallowed to float depending upon the market conditions. This is an ideal instrument which can beresorted to by the issuer to hedge themselves against the volatility in the interest rates. This hasbecome more popular as a money market instrument and has been successfully issued by financialinstitutions like IDBI, ICICI etc.
Activity J:
1. You are required to list out the benefits of the various new financial instruments from the perspectiveof your organization.
16.16 Summary
Long term funds are used for purchasing fixed assets expansion/improvisation programmes, diversificationand acquisition, takeovers & mergers and alliances etc. There are various sources of long term funds likeshare capital, debentures, bonds, Retained earnings, foreign loan, Term loans, Venture Capital, leasing etc.
Equity capital is the owners’ capital and remains forever with the company. Preference capital is alsopermanent capital but unlike equity shareholders the preference shareholders do not enjoy enough powerand voting rights. Preference shares get a priority to get their share of investment and profits before equityshareholders. Debentures are long term promissory notes which may be secured or unsecured. The interest
263
rate is fixed on debentures. Bond holders/Debenture holders have a priority of claim to income over equityand preference shareholders.
Securitisation is important source of finance and it is a process in which illiquid assets are pooled intomarketable securities that can be sold to investors. Leasing is a very popular source to finance equipments.It is a contract between the owner and user of the asset over a specified period of time in which the asset ispurchased initially by the lessor (leasing company) and thereafter leased to the user (Lessee Company) whopays a specified rent at periodical intervals.
Venture capital provides risk capital and skilled to firms which are to invest in ventures of advance technology,and research and development for commercial production of any item/services.
Every day new creative financial products keep on entering the market. Some of the examples are DeepDiscount Bonds, Option Bonds, and Inflation Bonds etc. To day the businesses are allowed to source fundsfrom International Market also. Some of important products are ECB, Euro Bonds, American DepositoryReceipt etc.
16.17 Self Assessment Questions
1. What do you understand by long-term finance? Critically examine the importance of instruments oflong-term finance.
2. ‘From the view-point of the investors, debentures are least risky, lesser risky are preference sharesand highest risky are equity shares’. Discuss and bring out the difference between any two differentinstruments of long-term finance.
3. What are term loans? What are their features?
4. Explain the different forms of depository receipts.
5. What are ECBs? What are the advantages and disadvantages of ECBs? Why are ECBs becomingpopular these days?
6. What do you mean by venture capital financing and what are the methods of this type of financing?
7. What do you understand by equity shares? What are its features, advantages and disadvantages?
8. What is Debt Securitisation? What are the process of Debt Securitisation?
16.18 Reference Books
- Bhalla V. K. (1997); ‘Financial Management and Policy’, First Edition, Anmol Publications Pvt.Ltd., New Delhi.
- Kapil Sheeba, Kapil Kanwal Nayan (2003); ‘Financial Management: Strategy, Implementation &Control’, First Edition, Pragati Prakashan, Meerut.
- Gopal C Rama (2011); ‘Financial Management and Management Accounting’, First Edition, NewAge International (P) Limited, Publishers, New Delhi.
- Banerjee Subir Kumar (1997); ‘Financial Management’ First Edition, S. Chand & Company Ltd.New Delhi.
- Bhalla V.K. (2006); ‘Management of Financial Services’ Third Revised and Enlarged Edition, AnmolPublications Pvt. Ltd., New Delhi.
264
Unit - 17 : Sources of Short-term Finance
Structure of Unit:
17.0 Objectives17.1 Introduction17.2 Characteristic of Short-term Financing17.3 Trade Credit17.4 Accrued Expenses, Provisions & Deferred Income17.5 Bills of Exchange17.6 Treasury Bills17.7 Public Deposit17.8 Commercial Papers17.9 Inter-Corporate Deposits (ICDs)17.10 Short-term Unsecured Debentures17.11 Bank Finance17.12 Difference between Trade Credit and Bank Credit17.13 Factoring17.14 Eurocurrency Loan17.15 Summary17.16 Self Assessment Questions17.17 Reference Books
17.0 Objectives
After completing this unit, you would be able to:
Know the short-term finance its characteristic and purpose for raising the fund from the sources ofshort-term.
Portray meaning, benefits and cost of trade credit as a spontaneous source of finance. Comprehend the different sources of spontaneous sources such as accrued expenses, provisions
and deferred Incomes. Point out commercial paper, bills of exchange, treasury bills, inter-corporate deposit, and short-
term Un-secured debenture as short-term sources of finance. Learn about the different negotiated sources from bank to raise short-term funds. Put forth the innovative source of short-term fund instrument as factoring and its position in India. Differentiate trade credit and bank credit to understand the concept in more lucid manner.
17.1 Introduction
Short term Finance means availability of funds for a period of one year or less than that period. Theseinclude the financial needs up to one year. Short term finance is the source of working capital. Short termfinances are used to purchase the raw materials, to pay salaries, to pay taxes, rent etc. Generally the shortterm sources are trade credit, bank credit, indigenous bankers, public deposits, advances from customers,personal loans, retained earnings, accrued expenses, and provision for taxation and depreciation fund.
Broadly speaking, the short-term finance may be classified between two categories i.e. spontaneous sourcesand negotiated sources. Spontaneous sources of finance are those which naturally arise in the course ofbusiness operations. Trade credit, credit from employees, credit from suppliers of services etc. are some of
265
the examples which may be quoted in this respect. Negotiated sources, as it is clear from name itself, arethose which have to be specifically negotiated with lenders say commercial banks, financial institutions,general public etc. The finance manager has to be very careful while selecting a particular source, or acombination thereof for financing of working capital. Generally the following parameters are suggestive toconsider before arriving on any decisions. These are cost, impact of credit rating, feasibility, reliability,restrictions and hedging or matching approach i.e. raising the same maturity short-term fund as needed inthe business.
17.2 Characteristic of Short-term Financing
The characteristics of the short-term can be enumerated in the below mentioned lines.
Short-term finance tends to be less expensive than long term finance. The principal supplier of the short-term finance is the banking system and its overdrafts and loans have the additional advantages of beingavailable quickly and inexpensively. On the contrary, in long term finance, the public issue of shares tends tobe expensive because of the services of issuing houses, merchant banks, lawyers, accountants, and possiblyother experts whose services are almost essential. Bank overdraft negotiations do not require these experts,although the bank may charge a commission for the overdraft facility offered in addition to the interests onthe overdraft when used.
Short term financing embraces the borrowing or lending of funds for a short period of time, say one year orless. There is greater tendency for the greater use of short-term financing among small concerns and lesseruse among large concerns is prevalent in practically all type of business. This is probably accounted for bythe fact that a small-sized business finds it quite difficult to raise long-term funds resulting on account oflower average credit standing and the relative impermanence of many small units.
Short term finance deals with the commercial bank, trade credit and other sources of funds that have to berepaid within a year or less. Trade credit is the privilege extended by suppliers to their customers fordelaying the payment of goods purchased, sometimes for a month or more. Short-term financing is associatedlargely with paying for those business assets that change constantly in form and that are used up or consumedin the course of operations. Such assets are also called ‘current assets’ or ‘working assets’. Customers maysometimes provide short-term funds by making advances on contracts. They in essence, make a pre-payment on goods before receiving delivery. Customers might advance funds, if the order is big enough torequire the manufacturer to tie up in raw materials or goods to process more funds than what the latter canafford.
Activity A:
1. You are advised to discuss the peculiarities implicit in the problems of short-term financing and itsrelevance in modern business business.
17.3 Trade Credit
Trade credit as source of working capital refers to credit facility given by suppliers of goods during thenormal course of trade. In other word, the credit extended in connection with the goods purchased forresale by a retailer, or for raw materials used by manufacturer in producing its products is called the tradecredit. Thus, trade credit may be defined as the credit available in connection with goods and servicespurchased for resale. It is the ‘resale’ which distinguishes trade credit from other sources. It can be clarifiedwith an example that the fixed assets may be purchased on credit, but since these are to be used in theproduction process rather than for resale, such credit purchase of fixed assets is not called trade credit.
266
When a firm buys goods from another, it may not be required to pay for these goods immediately. Duringthis period, before the payment becomes due, the purchaser has a debt outstanding to the supplier. Thisdebt is recorded in the buyer’s balance sheet as creditors; and the corresponding account for the supplier isthat of debtors. Normal business transaction, therefore, provide the firm with a source of short term financing(trade credit) because of the time gap between the receipts of goods and services and payment thereof. Theamount of such financing depends on the volume of purchases and the payment timing. Small and new firmsare usually more dependent on the trade credit, as they find it difficult to obtain funds from other sources.There can be an argument that trade credit is a cost free source of finance but it is not, it involves implicitcost. The supplier extending trade credit incurs cost in the form of opportunity cost of funds invested intrade receivables. Generally, the supplier passes on these costs to the buyer by increasing the price of thegoods or alternatively by not extending cash discount facility. Trade credit is mostly an informal arrangementand granted on open account basis, In USA trade creditors are called account payables.
Benefits of Trade Credit:
Trade credit is a spontaneous source of financing. When volume of business grows, amount of credit alsoautomatically increases. Suppose buyer is in habit of receiving credit for 30 days and his daily purchases areRs. 10,000 per day. If his business increases and makes purchases for Rs. 3,00,000 (30 x 10,000) to Rs.4,50,000 (30 x 15,000). In an informal way, buyer receives extra credit as he has making prompt paymentat the end of 30 days. The major advantages of trade credit are as under:
Easy Availability: Unlike other sources of finance, trade credit is easier to obtain. Market practice in aparticular trade normally determines credit period. On this trade credit, many small firms survive. In manytrades, it is an accepted way of conducting business. Even a new shop gets trade credit after a couple oftransactions. It is not possible to secure borrowing from banks in initial periods. Even for a new company,trade credit is easier to secure and highly difficult to raise finance in capital market.
Flexibility: Flexibility is a unique feature of trade credit, if business expands, more purchases are madeand with higher purchases, more trade credit is received. In contrast, when business declines automaticallyfirm makes lower purchases with it, lesser trade credit is received.
Informality: Trade credit is informal. No legal documents are involved. Generally no formal agreement isentered into while extending trade credit.
Cost of Trade Credit:
The money utilized by the firm as trade credit is simply a postponement of due payments by the firm makingcertain trade purchases and delaying certain payments. This does not imply that such capital does not carryany cost with it. Trade credit has a cost which is equal to the cost of not availing the discount specified in thecredit terms of the suppliers. All suppliers, in order to speed up their collections and to encourage cashpayments, give some cash discount to their buyers. For example the credit term of a supplier is ‘2/15, net30’ where 2 stands for a cash discount of 2% if the payment is made within 15 days of receiving the invoice.If the buyer does not wish to avail the discount then the maximum period by when he can make payments is30 days. If the buyer uses the trade credit as short-term financing it will utilize the money and make thepayments on the last day of credit period extended to him. He will forego this discount. Cost of foregoingthis discount is the cost of trade credit.
Discount % 360——————————— x ———————————————————————(1 – Discount %) (Total credit period – cash discount period)
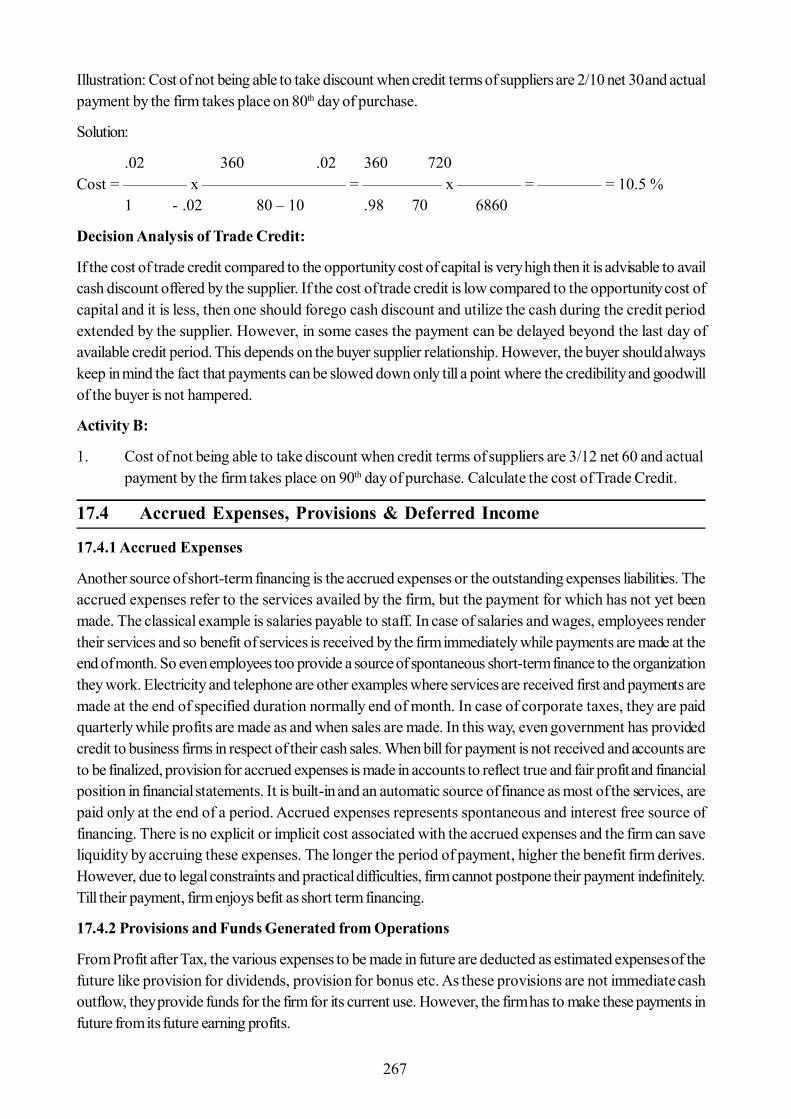
267
Illustration: Cost of not being able to take discount when credit terms of suppliers are 2/10 net 30 and actualpayment by the firm takes place on 80th day of purchase.
Solution:
.02 360 .02 360 720Cost = ———— x ————————— = ————— x ———— = ———— = 10.5 %
1 - .02 80 – 10 .98 70 6860
Decision Analysis of Trade Credit:
If the cost of trade credit compared to the opportunity cost of capital is very high then it is advisable to availcash discount offered by the supplier. If the cost of trade credit is low compared to the opportunity cost ofcapital and it is less, then one should forego cash discount and utilize the cash during the credit periodextended by the supplier. However, in some cases the payment can be delayed beyond the last day ofavailable credit period. This depends on the buyer supplier relationship. However, the buyer should alwayskeep in mind the fact that payments can be slowed down only till a point where the credibility and goodwillof the buyer is not hampered.
Activity B:
1. Cost of not being able to take discount when credit terms of suppliers are 3/12 net 60 and actualpayment by the firm takes place on 90th day of purchase. Calculate the cost of Trade Credit.
17.4 Accrued Expenses, Provisions & Deferred Income
17.4.1 Accrued Expenses
Another source of short-term financing is the accrued expenses or the outstanding expenses liabilities. Theaccrued expenses refer to the services availed by the firm, but the payment for which has not yet beenmade. The classical example is salaries payable to staff. In case of salaries and wages, employees rendertheir services and so benefit of services is received by the firm immediately while payments are made at theend of month. So even employees too provide a source of spontaneous short-term finance to the organizationthey work. Electricity and telephone are other examples where services are received first and payments aremade at the end of specified duration normally end of month. In case of corporate taxes, they are paidquarterly while profits are made as and when sales are made. In this way, even government has providedcredit to business firms in respect of their cash sales. When bill for payment is not received and accounts areto be finalized, provision for accrued expenses is made in accounts to reflect true and fair profit and financialposition in financial statements. It is built-in and an automatic source of finance as most of the services, arepaid only at the end of a period. Accrued expenses represents spontaneous and interest free source offinancing. There is no explicit or implicit cost associated with the accrued expenses and the firm can saveliquidity by accruing these expenses. The longer the period of payment, higher the benefit firm derives.However, due to legal constraints and practical difficulties, firm cannot postpone their payment indefinitely.Till their payment, firm enjoys befit as short term financing.
17.4.2 Provisions and Funds Generated from Operations
From Profit after Tax, the various expenses to be made in future are deducted as estimated expenses of thefuture like provision for dividends, provision for bonus etc. As these provisions are not immediate cashoutflow, they provide funds for the firm for its current use. However, the firm has to make these payments infuture from its future earning profits.
268
Funds generated from operations, during an accounting period, increase working capital by an equivalentamount. The two main components of funds generated from operations are profit and depreciation. Workingcapital will increase by the extent of funds generated from operations.
17.4.3 Deferred Income
Deferred Income represents funds received in advance for services to be rendered in future. The receiptsimprove liquidity of firm. However firms that have great demand for their products and services, enjoyinggood reputation in market, can only get the benefit of deferred income. Manufacturers and contractorsengaged in producing or constructing costly goods, involving considerable length of time for manufacture orconstruction, demand advance money before accepting orders. In turn key projects or where goods are tobe made for a specific requirement, advance payments are insisted. This avoids possibility for cancellationof sale after commencement of execution of order. Normally, clause remains in those contracts that advancepayment made would be forfeited on cancellation of the contract. These advances are adjusted when goodsand services are supplied. Till supply of services, amount stands as a liability in the books of recipient. Thisis a cost free source of finance and really useful in business.
Activity C:
1. Analyse the impact of spontaneous source of short term fund on business decision making taking into account accrued expenses, provisions and deferred Income. What plan business should deviceto increase this type of source of finance?
17.5 Bills of Exchange
Bills of exchange provide an easy route to extend trade credit. When suppliers of goods is less sure ofreceiving payment on due date supplier draws the bill of exchange on the buyer to document transactionfool proof method and buyer accepts the bill of exchange for payment on due date. In other words, tradecredit is documented in the form of bill of exchange. For wholesaler, the bills of exchange become ‘billsreceivable’ and the same document becomes ‘bills payable’ to retailer. In the accounts of wholesaler, billsreceivable appears in place of sundry debtors. Bills payable take the place of sundry creditors in the accountsof retailers.
Supplier is also in a position to discount bills receivable with his banker and can raise finance to meet hisworking capital needs. Even when there is no doubt of creditworthiness of buyer, seller may adopt thismode of payment through bill of exchange when he wants to have the option of raising finance throughdiscounting bills of exchange. In case, bill of exchange is not executed between supplier and buyer, suppliercan raise finance from bank in the form of hypothecation of book debts. In other words, discounting bills ofexchange and hypothecation of book debts are the different routs available for meeting working capitalneeds
The greatest advantage with bill of exchange is its self maturing character as due date is certain and buyercannot dodge payment unlike book debt. Suppliers are also in a position to discount bills receivable with hisbanker and can raise finance to meet his working capital needs.
Credit Terms:
Credit terms refer to those terms under which supplier sell on credit to buyer. There are two important termsand they are ‘due date’ and ‘cash discount’. Due date is the date on which buyer has to make payment forgoods received. On the due date, suppler can expect payment. Credit terms refer to length of credit period.Cash discount is granted to customers for early payment, before due date. The typical way of expressing
269
credit period and cash discount in an invoice is ‘2/15, net 30 days’ This means 2% discount would be given,if buyers makes payment within 15 days from date of invoice. If buyer does not want to avail cash discount,he can avail credit period of 30 days. Buyers can make payment at the end of 30 days from date of invoice.
Activity D:
1 How would you analyse the credit term mentioned as ‘3/18, net 40 days’? Think and discuss thecredit term if it becomes ‘2/10, net 30 days’ is beneficial or not to the business.
17.6 Treasury Bills
This represents central government borrowings against a bill or a promissory note. It is a highly liquid, riskfree instrument. At present there are three types of treasury bills but only first and third is generally used.These are
a) 91 days Treasury Bills issued every week.
b) 182 days Treasury Bills issued every week.
c) 364 days Treasury Bills issued every month.
There are two forms of treasury bills;
a) Ordinary Treasury Bills: These are issued to public and RBI by the Government.
b) Ad-hoc Treasury Bills: These are created only in favour of RBI.
It is the RBI which discounts the treasury bills held by the banks & financial institutions. Rate of interest ontreasury bills is lowest among short-term sources of funds and is fixed by RBI from time to time.
17.7 Public Deposit
A deposit from the public is one of the important source of finance particularly for well established bigcompanies with huge capital base for short and medium term. The firm may raise short-term funds from thegeneral public by offering handsome rate of interest. The deposits thus mobilized from public by non-financial manufacturing companies are known as ‘public deposits’ or ‘fixed deposits’. These are regulatedby regulations of public deposit under the companies’ amendment rules or now company law. However, thecompany raising public deposit cannot raise more than 10% of its paid up share capital and free reserves.The rate of interest on public deposit cannot be more than 15% which is computed on quarterly basis. Thefirm seeking funds through public deposit has to issue an advertisement disclosing details about its name,date of its incorporation, its profits and other relevant information required by the investor in order to investwith the firm and the same has to be submitted to the registrar of companies before advertising it.
Activity E:
1. You are required to collect the information in detail from your surroundings the case of using short-term financing as public deposits and reaction of the public in general.
17.8 Commercial Papers
Commercial Paper (CP) is an unsecured promissory note issued by a firm to raise funds for a short period,generally, varying from a few days to a few months. In India, the maturity period of Commercial Papervaries between 15 days to 1 year while in some other countries; the maturity period may go up to 270 days.It is a money market instrument and generally purchased by commercial banks, money market mutual funds
270
and other financial institutions desirous to invest their funds for a short period. As the Commercial Paper isunsecured, the firms having good credit rating can only issue the commercial paper.
The firm or the dealers in Commercial Paper sell these to the short-term lenders who use it as interestearning investment of temporary surplus of operating funds. The nature of these surpluses and motives forbuying the CP suggest that all the holders of the commercial paper expect to be paid in full at maturity. Thematurity term of commercial paper is not extended. This expectation on the part of short term tendersrequires that the borrowing firm must be (i) an established and profitable firm and (ii) consistently maintainingcredit goodwill in the market and having good credit rating. The interest cost of the commercial paperdepends upon the amount involved, maturity period and the prime lending rates of commercial banks. Themain advantage of commercial paper is that cost involved is lower than the prime lending rates. In additionto this cost, the borrowing firm has to bear another cost in the form of placement fees payable to the dealerof Commercial Paper who arranges the sale.
The Commercial Paper market has ballooned from Rs. 44,000 crore in March, 2009 to Rs. 67,000 croreby June end and Rs. 80,000 crore by mid august 2009 as interest rates in the debt market have fallen belowband rates at 4 to 5 percent.
Issue of Commercial Papers in India:
Commercial Paper was introduced as a money market instruments in India in January, 1990 with a view toenable the companies to borrow for short term. Since the commercial paper represents an unsecuredborrowing in the money market, the regulation of CP comes under the purview of the Reserve Bank of Indiawhich has issued Guidelines in 2000 superseding all earlier Guidelines. These Guidelines are aimed at:
i) Enabling the highly rated corporate borrowers to diversify their sources of short term borrowings,and
ii) To provide an additional instrument to the short term investors.
These Guidelines have stipulated certain conditions meant primarily to ensure that only financially strongcompanies come forward to issue the CP. Commercial Paper should be in the form of usance promissorynote negotiable by endorsement and delivery. It can be issued at such discount to the face value as may bedecided by the issuing company. Commercial Paper is subject to payment of stamp duty. In terms of theguidelines, the issuer company is not permitted to take recourse to the underwriters for underwriting theissue of Commercial Paper.
Updated Conditions of CP:
The updated conditions till 1st July 2010 are as under,
a) Eligibility: A corporate would be eligible to issue Commercial Paper provided: i) the tangible networth of the company, as per the latest audited balance sheet, is not less than Rs. 4 crores; ii)company has been sanctioned working capital limit by bank/s or all India financial institution/s; andiii) the borrowal account of the company is classified as a Standard Assets by the financing banks/institution.
b) Rating requirements: All eligible participants have to obtain the credit rating from CRISIL, ICRA orCARE or any other recognized credit rating agency. The minimum credit rating required for issue ofcommercial paper is P-2 of CRISIL or any other equivalent rating from other rating agencies.
271
c) Minimum Investment and Denomination: Amount that can be invested by a single investor cannot beless than Rs. 5 lakhs (face value). Commercial Paper can be issued in denomination of Rs. 5 lakhsor multiple there of.
d) Maximum Limit: Commercial Paper can be issued within the overall umbrella limit fixed by the RBI,i.e., issue of Commercial Paper together with other instruments, viz., term money borrowings, termdeposits, certificate of deposit and inter-corporate deposits, all put together should not exceed 100percent of its net owned funds, as per the latest audited balance sheet.
e) Aggregate Limit: The aggregate amount of CP from an issuer shall be within the limit as approved byits Board of Directors or the quantum indicated by the Credit Rating Agency for the specified rating,whichever is lower. Banks and financial institutions have the flexibility to fix working capital limitsduly taking into account the resource pattern of companies’ financing including CPs. Earlier,Commercial Bank that sanctioned working capital limit was required to reduce the cash credit limitof the borrower to the extent of the issuance of commercial paper. Now, there is no need for theconcerned commercial bank to reduce the sanctioned cash credit limit of the concerned company,automatically, after issuance of commercial paper. Commercial bank has the freedom to fix theworking capitl limits of the borrower.
f) Issuing and Paying Agent (IPA): Only a scheduled bank can act as an IPA for issuance of Commercialpaper.
g) Period of Raising Subscription: Commercial Paper has to be raised within two weeks from the dateof opening the issue for subscription.
a) Maturity: Maturity runs between a minimum of 7 days and maximum of one year from the date ofissue. No grace period is allowed for repayment and if the maturity date falls on a holiday then itshould be paid on the previous working day. Each issue of Commercial Paper is treated as a freshissue.
h) Interest: Commercial Paper is issued at a discount to its maturity value. The difference amountbetween the issue price and maturity amount is the return to the investor.
i) Credit Enhancement: Commercial Paper is a ‘stand alone’ product. However, banks have theflexibility to provide credit enhancement by way of stand- by assistance, based on their commercialjudgement. In other words, in case of default in payment by the issuer, responsibility would be caston the bank that has provided credit enhancement. This credit enhancement provides the necessarycushion to the investor’s confidence to invest. It may be made clear that the credit enhancement isnot compulsory for the issue of commercial paper. The issuer normally seeks the credit enhancementwhen the credit rating for the commercial paper is not adequate, though enough to issue commercialpaper to attract the investors’ response to raise finance at a cheaper interest rate. This creditenhancement strengthens the rating of the commercial paper.
These conditions change from time to time and the conditions existing at the time of issue govern the issue ofcommercial paper.
Any company proposing to issue commercial paper has to submit an application to the bank which providesworking capital limit to it, along with the credit rating of the firm. The issue has to be privately placed withintwo weeks by the company or through a merchant banker. The initial investor pays the discounted value ofthe commercial paper to the firm. Thus, Commercial Paper is issued only through the bank that has sanctionedthe working capital limit and it does not increase the working capital resources of the firm.
272
Recent Importance:
With the recent reduction in interest rates, importance of commercial paper has diminished, of late. However,corporate sector still finds issue of commercial paper cheap and has again regained its erstwhile importanceto raise finances at a lower interest rate compared to the rates of interest charged on loans by bankingsector. The Indian economy has started witnessing the unprecedented increasing trends on inflation from themiddle of the year 2006. In consequences, bank interest rates have been hardening more significantly fromthe year 2007. Increase in interest rates, offered by banks, is also in consequences of different stringentinitiatives taken by RBI. The different measures are increase of credit reserve ratio and statutory liquidityratio to contain or control the galloping inflation trends, prevailing more than 6% during the year 2010. So,commercial paper has regained its importance to work as a potent weapon to raise short-term finances byhighly rated companies to improve their bottom line. In other words, commercial paper has become attractiveway to finance short-term requirements, instead of borrowing from banks.
Annual financing cost of Commercial Paper:
The annual financing cost of Commercial Paper depends upon the discount on issue and the maturity period.The annualized pre tax cost of commercial paper can be computed as below:
FV - SP 360
Annual Financing Cost = ———————— x ——————
SP MP
Where FV = Face Value of Commercial Paper
SP = Issue Price of Commercial Paper
MP = Maturity period of Commercial Paper
For example, a commercial paper of the face value of Rs. 10,00,000 is issued at Rs. 9,60,000 for amaturity period of 120 days. The annual financing cost of the commercial paper is:
10,00,000 – 9,60,000 360
Annual Financing Cost = ———————————— x ———— = 12.5%
9,60,000 120
Benefits and limitations of Commercial Paper as a Source of Financing
From the point of the issuing company, Commercial Paper provides the following benefits:
a) Commercial Paper is sold on an unsecured basis and does not contain any restrictive conditions.
b) Maturing commercial paper can be repaid by selling new commercial paper and thus can provide acontinuous source of funds.
c) Maturity of Commercial Paper can be tailored to suit the requirement of the issuing firm.
d) Commercial Paper can be issued as a source of fund even when money market is tight.
e) Generally, the cost of Commercial Paper to the issuing firm is lower than the cost of commercialbank loans.
However, Commercial Paper as a source of financing has its own limitations.
273
a) Only highly credit rated firms can use it. New and moderately rated firms generally are not in aposition to issue Commercial Paper.
b) Commercial Paper can neither be redeemed before maturity nor can be extended beyond maturity.
So, Commercial Paper is advantageous both to the issuer as well as to the investor. The issuer can raiseshort-term funds at lower costs and the investor as a short term outlet of funds. Commercial Paper providesliquidity as they can be transferred. However, the issuer must adhere to the RBI guidelines.
Activity F:
1. A commercial paper of the face value of Rs. 20,00,000 is issued at Rs. 19,40,000 for a maturityperiod of 140 days. Calculate the annual financing cost of the commercial paper.
17.9 Inter-Corporate Deposits (ICDs)
Sometimes, the companies borrow funds for a short-term period, say up to six months, from other companieswhich have surplus liquidity for the time being. The ICDs are generally unsecured and are arranged by afinancier. The ICDs are very common and popular in practice as these are not marred by the legal hassles.The convenience is the basic virtue of this method of financing. There is no regulation at present in India toregulate these ICDs. Moreover, these are not covered by the Section 58A of the Companies Act, 1956, asICDs are not for long term. The transactions in the ICDs are generally not disclosed as the borrowing underthe ICD simply a liquidity shortage of the borrower. The rate of interest on ICDs varies depending upon theamount involved and the time period. The entire working of ICDs market is based upon the personalconnections of the lenders, borrowers and the financiers.
Activity G:
1. What is Inter-corporate Deposit? Do you think that it is regulated by any regulation of CompanyAct or other? Explain if it is.
17.10 Short-term Unsecured Debentures
Companies have raised short-term funds by the issue of unsecured debentures for periods up to 17 monthsand 29 days. The rate of interest on these debentures may be higher than the rate on secured long-termdebentures. It should be noted that no credit rating is required for the issue of these debentures because asper the SEBI guidelines, the credit ratings required for debentures having maturity period of 18 months ormore. The use of unsecured debentures as a source of short-term financing, however, depends upon thestate of capital market in the economy. During sluggish period, the companies may not be in a position toissue these debentures. Moreover, only established firms can issue these debentures as new company willnot find favour from the investors. Another drawback of this source is that the company procures fundsfrom retail investors instead of getting a lump-sum from one source only. Further, that the issue of securitiesin capital market is a time consuming process and the issue must be planned in a proper way.
17.11 Bank Finance
Bank offers short term funds for business enterprise in different forms. It may provide funds either directlyor indirectly. In case of indirect finance, the bank covers only the risk and does not provide finance i.e. letterof credit and in case of direct finance, the bank provide finance plus it covers the risk i.e. cash credit,overdraft, note lending and discounting of bills. The firm gives an assessment of its working capital requirementto the bank. On this request the bank provides a credit limit to the firm which the firm can operate accordingly.
274
The interest is charged on the amount actually utilized by the firm. However, the bank requires the borrowingfirm to maintain a minimum balance in its operating accounts at all times which is known as compensatorybalance.
17.11.1 Nature of Credit
Of all the banking concepts, that of credit is probably the most elusive. It is commonly said that a man ‘hascredit’ – a bank ‘extend credit’ or Credit is based upon the three Cs – of capital, character and capacity’.However, this does not tell us anything about what credit is or what the function of credit is. First, creditprovides the mechanism whereby a person may acquire real goods without giving an equivalent value ofgoods in exchange; secondly, as an indirect consequence, there is a redirection of the flow of real goods,different from what would otherwise take place. The great importance of the institution which we looselycall credit finds emphasis in such common expressions as ‘modern industrial society is a credit society,credit is the heart and core of the industrial system and credit is the life blood of commerce and industry’. Insimple business parlance, credit involves merely getting something now and paying for it later. It is synonymouswith borrowing. The essential element in credit operations always is postponement of payment for somethingthat has been received.
17.11.2 Cash Credit
Cash credit is the most popular form of credit with borrowers for meeting working capital requirements.Bank considers firm’s sales and production plans to sanction a particular working capital limit, which iscalled sanctioned limit in a cash credit account. In case of seasonal industries, bank sanctions peak creditlimit to meet working capital requirements during season which is always higher in comparison to the limitsanctioned for non peak period. So, bank sanctions separate limits for peak and non-peak periods asworking capital requirement is maximum during peak season. These cash credit limits are against security ofcurrent assets such as stocks and book debts.
Bank does not finance 100% of current assets. Bank stipulate margin. The drawing power is calculatedafter deducting the required margin from value of stocks. Borrower has to submit stock statement monthlyas per terms of sanction, declaring physical stocks and their value on a specified date. If margin requirementis 30%, bank can lends only up to 70% of value of stock and this is called drawing power of borrower andborrower is allowed to draw to the extent of the drawing power. Based on value of stock, drawing poweris calculated. Borrower can deposit sale proceeds daily to reduce the outstanding balance in cash creditaccount and can draw as and when needed to the maximum extent of drawing power or cash credit limit,which ever is lower. Borrower is required to pay interest for amount utilized only and not on the totalsanctioned limit. It is sanctioned for one year.
Cash credit facility can be sanctioned either in the form of pledge or hypothecation of goods. In case ofpledge, goods are kept in the godowns under lick and key of bank, so possession of goods and controlthereon is with bank, not borrower. As and when payment is made, goods are released, even proportionatelyto borrowers. In case of hypothecation, possession of goods is with borrower and can deal with goods inthe manner he likes, even selling goods without bank’s prior approval. It is extended to such borrowerswhose creditworthiness is well known to bank.
17.11.3 Bank Overdraft
It is short-term borrowing facility made available to the companies in case of urgent need of funds. The bankwill impose limits on the amount they can lend. When the borrowed funds are no longer required they canquickly and easily be repaid. The bank issue overdrafts with a right to call them in at short notice. Banks
275
sanction regular overdraft limits normally against security of fixed deposit receipts, shares, life insurancepolicy, postal certificates etc. Interest is charged on amount utilized. Cheque facility is made available inoverdraft account. In addition to permanent overdraft limit, bank sanctions temporary overdraft in currentaccount of customers as and when cheques received are in excess of balance in current account. This is atemporary arrangement and normally availed by professional for their working capital requirements.
17.11.4 Note Lending
Note lending is very different from Cash Credit and Bank Overdraft account. It is not a running account. Itis sanctioned for a period of about 2-3 months. It is form of loan given to the borrower against promissorynotes/debt instrument. Interest is charged on the complete loan amount sanctioned unlike cash credit/bankoverdraft account where interest is charged only on the utlised (withdrawn) account. However note lendingis not as popular as cash credit/bank overdraft arrangement.
17.11.5 Purchase or Discounting of Bills
Bill discounting is recognized as an important short term financial instrument and it is widely used method ofshort-term financing. Supplier can avail the limit for bills drawn on his buyers, covering supply of goodsmade. If the bill of exchange is payable on demand, it is purchased by bank. If the bill of exchange is drawnon acceptance basis bank discounts the bills accepted by buyer of goods. Buyer has to make payment onthe due date. In both the cases, working capital is provided by bank, by purchasing or discounting bills, asthe case may be. This has a self liquidating character with greater control for banks to monitor utilization offinances for working capital requirements.
17.11.6 Bill Rediscounting
The bill rediscounting Scheme was introduced by Reserve Bank of India with effect from 1st November,1970 in order to extend the use of the bill of exchange as an instrument for providing credit and the creationof a bill market in India with a facility for the rediscounting of eligible bills by banks. Under the bills rediscountingScheme, all licensed scheduled banks are eligible to offer bills of exchange to the Reserve Bank for rediscount.
17.11.7 Line of Credit
A line of credit is an agreement between a bank and a firm that permits the firm to borrow up to a specifiedlimit during a particular time period. Once the line of credit is approved at the start of the period, loans takenout against the line are usually approved by the loan officer with a minimum of delay or additional investigation.The agreement specifies the terms and conditions of the loans to be made under the line of credit. Althoughtechnically in force for a set time period, usually a year, most credit lines represent an ongoing relationshipwith the bank and may be renewed. At renewal the rate, credit limit, or other conditions of the line of creditmay be altered, depending upon the financial performance, condition and needs of the borrower. The line ofcredit provides a very flexible source of short-term financing. The borrower has access to a specifiedamount of credit, but pays interest only on the actual borrowing. Line of Credit is a commitment by a bankto lend a certain amount of funds on demand specifying the maximum amount.
The primary purpose of a credit line is to supply funds to meet the short-term, frequently seasonal, cash flowneeds of the borrower. To ensure that the line is used for short-term purposes, credit line sometimes includesa requirement of a cleanup period, perhaps 30 or 60 days, during which there is no borrowing against theline. A second purpose of a line of credit is to provide a backup source of cash to pay off maturing commercialpaper. Credit lines used in this way are called backup lines. Most organizations issuing commercial papermaintained an unused credit line in an amount sufficient to back up their commercial paper. Of course, theintention is never to have to borrow under this credit line.
276
17.11.8 Working Capital Loan
It is normally sanctioned by banks for ad-hoc or temporary requirements of customers, not earlier foreseen.This is additional sanction in excess of cash credit limit sanctioned. Once repayment is made loan accountwould be closed. In other words, customer cannot utilize this mode of finance on a continuous basis likecash credit account. Banks charge higher interest rate for extending this type of facility, compared to normalcash credit limit extended to same borrower.
Generally, the banks while granting working capital facility to a customer stipulate that a margin of 25%would be required to be provided by the customer and hence the bank borrowing remains only limited to75% of the security offered. In other words, against a security of Rs. 100, the bank gives a loan of up to Rs.75. The short-fall is generally treated as Working Capital Term Loan (WCTL). This WCTL is to be repaidin a phased manner varying between a periods of two to five years.
17.11.9 Funded Interest Term Loan
Sometimes, a company because of its operations may not be able to pay the interest charge on its workingcapital cash credit facility obtained from a commercial bank. Such accumulation of unserviced interestmakes the cash credit account irregular and in excess of the sanctioned limit. It also prevents the firm tomake further operations in the account. Such un-serviced accumulated interest may be transferred by thebank from cash credit account to Funded Interest Term Loan (FITL). This will enable the firm to operate itscash credit account. The FITL is considered separately for repayment.
17.11.10 Non-Fund based Facilities
17.11.10.i Letter of Credit
A letter of credit is a guarantee from a bank stating that a loan will be made to the client if specifiedconditions are met. It is commonly used to finance international trade. Because an exporter does not knowan importer or because information, language and cultural differences make it difficult to perform an adequatecredit analysis, the exporter is not willing to sell to the importer on open credit. The importer presents aletter of credit from its bank, stating that the amount necessary for payment of the shipment will be paid ona specified date if conditions are met. This allows the importer to substitute the bank’s credit rating for itsown credit rating, thereby reducing the risk to the exporter.
The purpose of letter of credit is that payment is assured to supplier of goods or services by bank. Here theresponsibility for payment is assumed by bank and so supplier is not concerned with the creditworthiness ofthe buyer. In case payment is not made by customer, bank makes payment to the party in whose favour theletter of credit is opened. So bank assumes risk for default in payment by the opener of letter of credit.Simply, creditworthiness of buyer is not relevant to the supplier once letter of credit is opened.
A letter of credit can be either revocable, in which case the bank has the right to cancel the letter, orirrevocable, in which case the bank is bound to honour the terms if the specified conditions are met. Thematurity of the loan connected to the letter is dictated by the event that evoked the need for the letter. Inmost instances, it is of relatively short duration, for example, 30 to 90 days. The loan usually has a fixed ratebased on the prevailing rate at the time the loan is issued. A commitment fee is usually charged for issuing aletter of credit whether the loan is issued or not.
A banker’s acceptance is generated by a time draft for which a bank is committed to make the payment tothe holder at maturity. Banker’s acceptances most frequently arise from international transactions when theconditions for a letter of credit have been met. Financing is provided when the bank makes an advance on
277
the time draft issued. Some banks use the term banker’s acceptance to refer to a loan issued to finance thepurchase of specific goods, whether for an international or a domestic transaction. The loan made under abanker’s acceptance is usually a discount loan. The discount from face value advanced to the borrowerincludes an amount for the interest at prevailing money market rates plus a fee or a commission of approximately1.5%. Because of the commission, the cost to the borrower is usually above the commercial paper rate, butbecause it is based on money market rates, it may be below the prime rate.
17.11.10.ii Bank Guarantees
Bank guarantee is one of the facilities that the commercial banks extend on behalf of their clients in favour ofthird parties who will be the beneficiaries of the guarantees. In case of guarantee, it may be categorized asPerformance Bank Guarantee, Bank guarantee against advances received by a supplier and bank guaranteein liew of security deposit or earnest money as per requirement of tenders of different Governmental orCorporate bodies be it in private sectors or in public sectors.
In case of performance guarantee, it gives an assurance by bank to the third party about the performance ofproject or equipments/machineries upto a certain period which has been executed/ manufactured by thecustomers of the bank. In case of bank guarantee for advances received by the customer of the bank fromthird party, such guarantee assures the third party that if the project for which advance has been given is notexecuted, the bank is liable to refund such advance. Such non-fund facilities by bank are not given independentlybut are generally considered by them along with the question of sanction of cash credit facilities.
Activity H:
1. ‘There is no guarantee that a borrower utilizes the cash credit limit for short-term Purposes, alone.’Is it right? Name the alternative form of finance by which bank can better monitor utilization of fundsfor short-term by borrower.
17.12 Difference between Trade Credit and Bank Credit
The below enumerated comparison describes the difference between trade credit and bank credit.
Security: Advances by trade creditors are almost invariably unsecured. They may be secured where creditorsconstitute a major source of finance for the debtor. Bank advances are commonly secured by a charge overthe real or personal property of the customer, although some bank advances may be made on personalsecurity only. Initial inquiry into the nature of the security is generally more rigorous in the case of bankcredit.
Purpose: Trade credit arises from a particular purchase of goods. Bank credit is generally undifferentiatedand can, therefore, be used for a wider range of purpose.
Extent: Usually trade creditors’ accounts do not assume large dimensions. For individual clients, on theother hand, bank advances may be much larger than the amounts those clients owe at any time to theindividual trade creditors
Liquidation: Trade creditors’ accounts are liquidated much more frequently than bank advances.
Cost: Failure to take advantage of cash discounts offered by trade creditors is many times more costly thanborrowing from banks to meet these accounts. Advances on the overdraft cost must be less than the yieldfrom the prompt settlement of creditor’s accounts.
Competition: There is greater competition among the suppliers of goods than among the suppliers of bankcredit. Long credit terms are frequently extended to retain a customer to whom competitors have offered
278
longer terms or better discounts or simply to sustain sales in spite of the customer’s reluctance to buy.Bankers are more cautious, less inclined to encourage borrowing than sales representatives are to promotesales. Bank credit is thus less conducive to the unwise expansion of stock levels and credit sales than tradecredit.
17.13 Factoring
Factoring is a new concept in financing of account receivables. This refers to outright sale of accountsreceivables to a factor or a financial agency. A factor is a firm that acquires the receivables of other firms.The factoring lays down the conditions of the sale in a factoring agreement. In factoring, three parties areinvolved. The supplier of goods (seller), the receiver of goods (buyer), the undertaker of debt (factor).When some goods are sold on credit and payable after a specified period, the efforts of seller are always tocollect receivable as quickly as possible. To put it in other way, he is to remain busy significantly for suchreceivable management. It involves cost, time and efforts on the part of the seller. Instead of making suchinternal management of such receivable, he may delegate such job of receivable management i.e. collectionof debtors to a specialized agency. Such an agency is called factor. To put it in a layman’s language, a factoris an agent who collects the dues of his client for a certain fee. By factoring the seller assigns his right ofcollection of debt from the purchaser to the factor. The buyer is advised with this assignment to pay duesdirectly to the factor instead of to the seller. Hereafter, it becomes responsibility of factor to collect receivables.For such service to the seller and also for bearing the risk of non-collection, the factor obviously chargessome fees. In such cases they charge interest for such financing in addition to fee.
Normally, factoring is the arrangement on a non-recourse basis where in the event of default the loss isborne by this factor. However, in a factoring arrangement with recourse, in such situation, the accountsreceivables will be turned back to the firm by the factor for resolution. To make operative of such service inIndia, RBI constituted a Committee in January, 1988. The Committee submitted its report in January, 1989and RBI accepted its recommendation in principle. SBI commercial and Factoring Services Ltd. is the firstfactoring company which is on verge of starting its operation as factoring.
Factoring Services: The factor manages all the accounts, of all the customers of the said firm to makecollections on time. Factor also interferes in the credit policy of the firm and thus advocates the best creditpolicy suitable for the firm. It provides all management and administration support from the stage of decidingcredit extension to the customer to the final stage of debt collection. Factor provides financial assistance tothe business firm by giving it advance cash against book debts. Factoring services provided by factors arepurchasing receivables, sales ledger administration, credit management, credit collection, protection againstdefault and bad debts, financial accommodation against the assigned book debts, assuming the losses whichmay arise from bad debts and providing relevant advisory service to the seller.
Factoring Process: The client firm having book debts enters into an agreement with a factoring agency/institution. The client firm delivers all orders and invoices and the invoice copy to the factor. The factor pays80% of the invoice value (depends on the type of factoring agreement), in advance. The balance amount ispaid when factor recovers complete amount of money due on customers (debtors of the client) and againstall these services, the factor charges some amount as service charges.
Cost of Factoring: Cost of factoring is very high about 17-18% of the value of receivables. The high costof factoring includes the element of risk present de to the chance of book debts becoming bad debts. Butthe cost is overcome by the advantages of factoring like immediate liquidity and 100% risk cover. The costof factoring service also depends on various factors like credit worthiness of the client, turnover of the clientand the factor, average size of invoices, various costs borne by the factors etc.
279
Factoring in India: In India factoring services started very late, around 1991. It is still in the initial stagesand supports only the domestic trade and commerce in India. The nationalized banks have been given theresponsibility of nurturing factoring in India. SBI has floated its subsidiary factoring unit i.e. SBI factors andCommercial Services Ltd. In the Southern region Canara bank has also floated its subsidiary named asCanbank Factors Ltd. Factoring is very popular in developed countries like USA, UK etc. In USA themarket for factoring services is around $ 33 billion. In India the total factoring service value was around Rs.1000 crores in 1996-97. The idea of introducing factoring service in India was first floated by workinggroup committee headed on money market by Mr. N Vaghul in 1987. RBI then formed a study group,Kalyansundaram, former managing director of SBI, in January 1988 for examining the introduction offactoring services in India. But still, till today the factoring service in India has not acquired the status of aseparate industry, instead it has been clubbed with NBFCs.
Advantages of Factoring
a) It enhances the liquidity position of the company.
b) The hazardous job of collection from Debtors gets eliminated.
c) The loss of interest because of late collection of Debtor can be arrested. Obviously, the return ofinvestment improves.
d) The whole attention and energy of the concerned company can be diverted only on the sales/marketing aspects.
Disadvantages of Factoring
In spite of many services offered by factoring, following are disadvantages of factoring.
a) High cost of factoring compared to other short-term finance.
b) Firms availing factoring services are viewed as weak.
c) Once a buyer defaults in payment, factor takes a tough stance and may not agree to provide creditagainst sales made to the same buyer. This action may force the firm to discontinue sales, resultingin reduced sales.
Difference Between Factoring and Bill Discounting
The difference between factoring and bill discounting can be enumerated as below.
a) Factoring is called as ‘invoice factoring’ whereas bills discounting is known as ‘invoice discounting’.
b) In factoring the parties are known as client, factor and debtor whereas in bills discounting they areknown as Drawer, Drawee and Payee
c) Factoring is a sort of management of book debts whereas bills discounting is a sort of borrowingfrom commercial banks.
d) For factoring there is no specific Act, whereas in the case of bills discounting, the NegotiableInstrument Act is applicable.
Activity I:
1. ‘Factoring services is related to management of debts arising from credit sales. Factor providescredit against receivables and in this process firm gets funds immediately for credit sales made.’What is your opinion on this statement? Discuss.
280
17.14 Eurocurrency Loan
In international trade short term funding is through Eurocurrency loans. Due to individual governmentregulations of different nations, on the interest rate, on domestic banks lending changes as one crosses thenational boundary etc. interest on euro dollar loan would be same as interest on domestic dollar loan if theworld is made free of regulations and taxes imposed by the government.
17.15 Summary
Short-term funds can be collected through many sources such as accrued expenses, provisions, tradecredit, bank finance, public deposit, commercial papers, treasury bills, factory and Eurocurrency etc. Tradecredit is one of the important sources of short-term funds. It arises when firm purchases on credit. However,the firm should also calculate the cost of foregoing cash discount offered by the supplier, if it takes tradecredit. Accrued expenses or deferred payments arise due to delayed payments and liabilities. This gives riseto additional funds which the firm can utilize by delaying payments.
Banks are principal sources of short term finance. The different forms of bank borrowings are cash credit,bank overdraft, discounting of bills, short term loans, letter of credit. However, bank finance is given on thebasis of working capital requirement assessed for a particular firm. There are various regulations of RBIunder which bank finance is offered. Commercial paper is an important instrument of money market. Thehighly rated, blue chip company issues commercial paper for short-term finance. In India common commercialpapers are of 91 & 180 days maturity.
Factoring is basically selling receivables to factoring providing firms called factors. These firms monitor andcollect receivables on behalf of the firm. They offer around 70-90% of the receivable amount to the firmeven before the money is recovered. There are various types of factoring. In India factoring is still in itsnascent stage.
17.16 Self Assessment Questions
1. Explain the importance of trade credit as a source of short-term finance. Whether the provision ofthis source involves any cost to the provider and who bears it, finally?
2. What are accrued Expenses? What are the limitations of using accrued expenses?
3. Describe the different types of short-term finance provided by Commercial banks for meetingshort-term needs of the business. Is there a way to utilize non-fund based limit for short-termpurposes?
4. What are Commercial Papers? What are the preconditions required to be fulfilled before floatingcommercial papers?
5. What are the advantages and disadvantages of using public deposit as a source of funds?
6. What is factoring? How it is beneficial to a firm? Differentiate between bill discounting and factoring.
7. What is Eurocurrency Loan? Why do firm go for such a loan?
17.17 Reference Books
- Bhalla V. K. (1997); ‘Financial Management and Policy’, First Edition, Anmol Publications Pvt.Ltd., New Delhi.

281
- Kapil Sheeba, Kapil Kanwal Nayan (2003); ‘Financial Management: Strategy, Implementation &Control’, First Edition, Pragati Prakashan, Meerut.
- Gopal C Rama (2011); ‘Financial Management and Management Accounting’, First Edition, NewAge International (P) Limited, Publishers, New Delhi.
- Banerjee Subir Kumar (1997); ‘Financial Management’ First Edition, S. Chand & Company Ltd.New Delhi.
- Bhalla V.K. (2006); ‘Management of Financial Services’ Third Revised and Enlarged Edition, AnmolPublications Pvt. Ltd., New Delhi.
- Kulkarni P.V., Satyaprasad B.G.(2007); ‘Financial Management’, Himalaya Publishing House,Mumbai.
Related Documents