Annual Report | December 31, 2020 Vanguard Institutional Index Fund

Welcome message from author
This document is posted to help you gain knowledge. Please leave a comment to let me know what you think about it! Share it to your friends and learn new things together.
Transcript

Annual Report | December 31, 2020
Vanguard Institutional Index Fund

Contents
Your Fund’s Performance at a Glance . . . . . . . . . . . . . . . . .1
About Your Fund’s Expenses . . . . . . . . . . . . . . . . . . . . . . . . . .2
Performance Summary . . . . . . . . . . . . . . . . . . . . . . . . . . . . . . .4
Financial Statements . . . . . . . . . . . . . . . . . . . . . . . . . . . . . . . . .6
Please note: The opinions expressed in this report are just that—informed opinions. They should not be considered promisesor advice. Also, please keep in mind that the information and opinions cover the period through the date on the front of thisreport. Of course, the risks of investing in your fund are spelled out in the prospectus.

• For the 12 months ended December 31, 2020, Vanguard Institutional Index Fundreturned 18.39% for Institutional Shares and 18.41% for Institutional Plus Shares,closely tracking its target index, the Standard & Poor’s 500 Index. The fund providesexposure to the stocks of the largest U.S. companies.
• The fiscal year was marked by the global spread of COVID-19 and efforts to containit. Responses from policymakers, the creation and initial distribution of vaccines, andthe easing of some restrictions lifted investor sentiment, and stock markets hit highs inDecember. After an initial period of high volatility and low liquidity in the bond markets,yields fell and prices rose amid unprecedented actions taken by governments andcentral banks to blunt the virus’s economic impact.
• The information technology, consumer discretionary, and communication servicessectors were among the largest contributors to performance. Among the biggestdetractors were energy, financials, and real estate.
• For the ten years ended December 31, 2020, the fund posted average annual returnsof 13.86% for Institutional Shares and 13.88% for Institutional Plus Shares, closelytracking the return of its target index.
Market Barometer
Average Annual Total ReturnsPeriods Ended December 31, 2020
OneYear ThreeYears FiveYears
Stocks
Russell 1000 Index (Large-caps) 20.96% 14.82% 15.60%
Russell 2000 Index (Small-caps) 19.96 10.25 13.26
Russell 3000 Index (Broad U.S. market) 20.89 14.49 15.43
FTSE All-World ex US Index (International) 11.22 5.18 9.16
Bonds
Bloomberg Barclays U.S. Aggregate Bond Index(Broad taxable market) 7.51% 5.34% 4.44%
Bloomberg Barclays Municipal Bond Index(Broad tax-exempt market) 5.21 4.64 3.91
FTSEThree-Month U.S. Treasury Bill Index 0.58 1.56 1.16
CPI
Consumer Price Index 1.36% 1.85% 1.95%
Your Fund’s Performance at a Glance
1

As a shareholder of the fund, you incur ongoing costs, which include costs for portfolio
management, administrative services, and shareholder reports (like this one), among others.
Operating expenses, which are deducted from a fund’s gross income, directly reduce the
investment return of the fund.
A fund’s expenses are expressed as a percentage of its average net assets. This figure is known
as the expense ratio. The following examples are intended to help you understand the ongoing
costs (in dollars) of investing in your fund and to compare these costs with those of other mutual
funds. The examples are based on an investment of $1,000 made at the beginning of the period
shown and held for the entire period.
The accompanying table illustrates your fund’s costs in two ways:
• Based on actual fund return.This section helps you to estimate the actual expenses that you
paid over the period. The ”Ending Account Value“ shown is derived from the fund’s actual return,
and the third column shows the dollar amount that would have been paid by an investor who
started with $1,000 in the fund. You may use the information here, together with the amount you
invested, to estimate the expenses that you paid over the period.
To do so, simply divide your account value by $1,000 (for example, an $8,600 account value
divided by $1,000 = 8.6), then multiply the result by the number given for your fund under the
heading ”Expenses Paid During Period.“
• Based on hypothetical 5% yearly return.This section is intended to help you compare your
fund’s costs with those of other mutual funds. It assumes that the fund had a yearly return of 5%
before expenses, but that the expense ratio is unchanged. In this case—because the return used
is not the fund’s actual return—the results do not apply to your investment. The example is useful
in making comparisons because the Securities and Exchange Commission requires all mutual
funds to calculate expenses based on a 5% return. You can assess your fund’s costs by comparing
this hypothetical example with the hypothetical examples that appear in shareholder reports of
other funds.
Note that the expenses shown in the table are meant to highlight and help you compare ongoingcosts only and do not reflect transaction costs incurred by the fund for buying and selling
securities. Further, the expenses do not include any purchase, redemption, or account service fees
described in the fund prospectus. If such fees were applied to your account, your costs would be
higher. Your fund does not carry a “sales load.”
The calculations assume no shares were bought or sold during the period. Your actual costs may
have been higher or lower, depending on the amount of your investment and the timing of any
purchases or redemptions.
You can find more information about the fund’s expenses, including annual expense ratios, in the
Financial Statements section of this report. For additional information on operating expenses and
other shareholder costs, please refer to your fund’s current prospectus.
About Your Fund’s Expenses
2

Six Months Ended December 31, 2020
Institutional Index Fund
BeginningAccount Value
6/30/2020
EndingAccount Value
12/31/2020
ExpensesPaid During
Period
Based on Actual Fund Return
Institutional Shares $1,000.00 $1,221.53 $0.20
Institutional Plus Shares 1,000.00 1,221.61 0.11
Based on Hypothetical 5%Yearly Return
Institutional Shares $1,000.00 $1,024.96 $0.18
Institutional Plus Shares 1,000.00 1,025.04 0.10
The calculations are based on expenses incurred in the most recent six-month period. The fund’s annualized six-month expense ratios forthat period are 0.035% for Institutional Shares and 0.02% for Institutional Plus Shares. The dollar amounts shown as “Expenses Paid” areequal to the annualized expense ratio multiplied by the average account value over the period, multiplied by the number of days in themost recent six-month period, then divided by the number of days in the most recent 12-month period (184/366).
3

All of the returns in this report represent past performance, which is not a guarantee of
future results that may be achieved by the fund. (Current performance may be lower or
higher than the performance data cited. For performance data current to the most recent
month-end, visit our website at vanguard.com/performance.) Note, too, that both
investment returns and principal value can fluctuate widely, so an investor’s shares, when
sold, could be worth more or less than their original cost. The returns shown do not reflect
taxes that a shareholder would pay on fund distributions or on the sale of fund shares.
Cumulative Performance: December 31, 2010,Through December 31, 2020Initial Investment of $5,000,000
$22,000,000
1,000,000
18,306,040
2020201920182017201620152014201320122011
Average Annual Total ReturnsPeriods Ended December 31, 2020
OneYear
FiveYears
TenYears
Final Valueof a $5,000,000
Investment
Institutional Index Fund InstitutionalShares 18.39% 15.19% 13.86% $18,306,040
S&P 500 Index 18.40 15.22 13.88 18,349,775
Dow Jones U.S. Total Stock Market FloatAdjusted Index 20.79 15.36 13.74 18,120,128
OneYear
FiveYears
TenYears
Final Valueof a $100,000,000
Investment
Institutional Index Fund Institutional PlusShares 18.41% 15.21% 13.88% $366,809,120
S&P 500 Index 18.40 15.22 13.88 366,995,500
Dow Jones U.S. Total Stock Market FloatAdjusted Index 20.79 15.36 13.74 362,402,560
Institutional Index Fund
Performance Summary
See Financial Highlights for dividend and capital gains information.
4

Communication Services 10.8%
Consumer Discretionary 12.7
Consumer Staples 6.5
Energy 2.3
Financials 10.4
Health Care 13.5
Industrials 8.4
InformationTechnology 27.6
Materials 2.6
Real Estate 2.4
Utilities 2.8
The table reflects the fund’s investments, except for short-terminvestments and derivatives. Sector categories are based on theGlobal Industry Classification Standard (“GICS”), except for the“Other” category (if applicable), which includes securities thathave not been provided a GICS classification as of the effectivereporting period.
The fund may invest in derivatives (such as futures and swapcontracts) for various reasons, including, but not limited to,attempting to remain fully invested and tracking its target index asclosely as possible.
Global Industry Classification Standard (“GICS”) was developed by and is the exclusive property and a service mark ofMSCI Inc. (“MSCI”) and Standard and Poor’s, a division of McGraw-Hill Companies, Inc. (“S&P”), and is licensed for useby Vanguard. Neither MSCI, S&P nor any third party involved in making or compiling the GICS or any GICS classificationmakes any express or implied warranties or representations with respect to such standard or classification (or the resultsto be obtained by the use thereof), and all such parties hereby expressly disclaim all warranties of originality, accuracy,completeness, merchantability or fitness for a particular purpose with respect to any such standard or classification.Without limiting any of the foregoing, in no event shall MSCI, S&P, any of its affiliates or any third party involved inmaking or compiling the GICS or any GICS classification have any liability for any direct, indirect, special, punitive,consequential or any other damages (including lost profits) even if notified of the possibility of such damages.
Institutional Index Fund
Fund AllocationAs of December 31, 2020
5

The fund files its complete schedule of portfolio holdings with the Securities and Exchange
Commission (SEC) for the first and third quarters of each fiscal year as an exhibit to its reports on
Form N-PORT. The fund’s Form N-PORT reports are available on the SEC’s website at
www.sec.gov.
Shares
MarketValue•
($000)
Common Stocks (99.5%)
Communication Services (10.7%)* Facebook Inc. Class A 19,739,456 5,392,030* Alphabet Inc. Class A 2,468,665 4,326,681* Alphabet Inc. Class C 2,383,525 4,175,650* Walt Disney Co. 14,866,161 2,693,451
Verizon Communications Inc. 33,979,230 1,996,280Comcast Corp. Class A 37,491,270 1,964,543
* Netflix Inc. 3,627,686 1,961,599AT&T Inc. 58,512,703 1,682,825
* Charter Communications Inc. Class A 1,198,070 792,583* T-Mobile US Inc. 4,790,330 645,976
Activision Blizzard Inc. 6,346,011 589,227* Twitter Inc. 6,530,682 353,636
Electronic Arts Inc. 2,381,809 342,028* Take-Two Interactive Software Inc. 944,438 196,245
ViacomCBS Inc. Class B 4,638,915 172,846Omnicom Group Inc. 1,763,532 109,991
* Live Nation Entertainment Inc. 1,174,545 86,306Fox Corp. Class A 2,779,995 80,953CenturyLink Inc. 8,106,094 79,034News Corp. Class A 4,206,221 75,586Interpublic Group of Cos. Inc. 3,200,538 75,277
* Discovery Inc. Class C 2,570,227 67,314* DISH Network Corp. Class A 2,034,809 65,806* Fox Corp. Class B 1,259,506 36,374* Discovery Inc. Class A 1,189,065 35,779
News Corp. Class B 504 9
27,998,029Consumer Discretionary (12.7%)* Amazon.com Inc. 3,501,954 11,405,619* Tesla Inc. 6,226,673 4,393,976
Home Depot Inc. 8,840,234 2,348,143NIKE Inc. Class B 10,303,352 1,457,615McDonald's Corp. 6,118,445 1,312,896Starbucks Corp. 9,637,775 1,031,049Lowe's Cos. Inc. 6,016,525 965,712
* Booking Holdings Inc. 336,336 749,111Target Corp. 4,112,058 725,902TJX Cos. Inc. 9,858,494 673,237
Institutional Index Fund
Financial Statements
Schedule of InvestmentsAs of December 31, 2020
6

Shares
MarketValue•
($000)
General Motors Co. 10,342,475 430,661Dollar General Corp. 2,011,821 423,086Ross Stores Inc. 2,923,150 358,992
* Chipotle Mexican Grill Inc. Class A 229,732 318,572Aptiv plc 2,217,260 288,887Marriott International Inc. Class A 2,183,873 288,097Ford Motor Co. 32,084,475 282,023eBay Inc. 5,376,796 270,184
* O'Reilly Automotive Inc. 594,713 269,149Yum! Brands Inc. 2,476,958 268,899HiltonWorldwide Holdings Inc. 2,277,755 253,423
* AutoZone Inc. 190,405 225,714VF Corp. 2,625,589 224,252
* Dollar Tree Inc. 1,931,191 208,646Best Buy Co. Inc. 1,892,307 188,833DR Horton Inc. 2,724,086 187,744
* Etsy Inc. 1,035,392 184,207Lennar Corp. Class A 2,220,805 169,292Las Vegas Sands Corp. 2,697,033 160,743Expedia Group Inc. 1,116,130 147,776Garmin Ltd. 1,224,741 146,552Tractor Supply Co. 956,548 134,472
* Ulta Beauty Inc. 462,493 132,809Carnival Corp. 6,106,316 132,263Darden Restaurants Inc. 1,068,871 127,324
* CarMax Inc. 1,347,132 127,250Domino's Pizza Inc. 323,447 124,029Pool Corp. 329,672 122,803Genuine Parts Co. 1,184,163 118,925
* NVR Inc. 28,708 117,125Tiffany & Co. 886,893 116,582Royal Caribbean Cruises Ltd. 1,527,634 114,099MGM Resorts International 3,362,005 105,937Hasbro Inc. 1,047,781 98,009PulteGroup Inc. 2,204,211 95,046Whirlpool Corp. 514,125 92,794Wynn Resorts Ltd. 797,854 90,022Advance Auto Parts Inc. 557,498 87,811
* LKQ Corp. 2,299,473 81,033BorgWarner Inc. 2,007,400 77,566L Brands Inc. 1,916,756 71,284Tapestry Inc. 2,275,913 70,735
* Mohawk Industries Inc. 490,180 69,091* Norwegian Cruise Line Holdings Ltd. 2,597,575 66,056
Newell Brands Inc. 3,094,204 65,690PVH Corp. 585,094 54,934Leggett & Platt Inc. 1,088,882 48,237Hanesbrands Inc. 2,861,862 41,726Ralph Lauren Corp. Class A 394,891 40,966Gap Inc. 1,686,927 34,059
* Under Armour Inc. Class A 1,553,736 26,678* Under Armour Inc. Class C 1,598,671 23,788
Lennar Corp. Class B 46,974 2,875
33,071,010
Institutional Index Fund
7

Shares
MarketValue•
($000)
Consumer Staples (6.5%)Procter & Gamble Co. 20,360,836 2,833,007Coca-Cola Co. 31,758,201 1,741,620PepsiCo Inc. 11,347,725 1,682,868Walmart Inc. 11,383,755 1,640,968CostcoWholesale Corp. 3,623,091 1,365,108Philip Morris International Inc. 12,787,695 1,058,693Mondelez International Inc. Class A 11,744,056 686,675Altria Group Inc. 15,260,009 625,660Colgate-Palmolive Co. 7,039,135 601,916Estee Lauder Cos. Inc. Class A 1,860,179 495,161Kimberly-Clark Corp. 2,793,099 376,594Sysco Corp. 4,182,260 310,575Constellation Brands Inc. Class A 1,391,817 304,878General Mills Inc. 5,020,044 295,179
* Monster Beverage Corp. 3,034,501 280,631Walgreens Boots Alliance Inc. 5,898,823 235,245Archer-Daniels-Midland Co. 4,568,926 230,320Kroger Co. 6,362,246 202,065McCormick & Co. Inc. 2,042,338 195,248Hershey Co. 1,211,532 184,553Kraft Heinz Co. 5,321,221 184,434Church & Dwight Co. Inc. 2,040,264 177,972Clorox Co. 784,306 158,367Tyson Foods Inc. Class A 2,415,120 155,630Conagra Brands Inc. 4,011,813 145,468Kellogg Co. 2,088,081 129,941Brown-Forman Corp. Class B 1,498,229 119,004J M Smucker Co. 935,910 108,191Hormel Foods Corp. 2,302,961 107,341LambWeston Holdings Inc. 1,202,762 94,705Campbell Soup Co. 1,662,761 80,394Molson Coors Beverage Co. Class B 1,543,018 69,729
16,878,140Energy (2.2%)
Exxon Mobil Corp. 34,719,131 1,431,123Chevron Corp. 15,807,222 1,334,920ConocoPhillips 8,769,358 350,687Phillips 66 3,586,089 250,811Schlumberger NV 11,430,530 249,528EOG Resources Inc. 4,788,992 238,827Marathon Petroleum Corp. 5,342,581 220,969
* Kinder Morgan Inc. 15,987,111 218,544Valero Energy Corp. 3,348,417 189,420Williams Cos. Inc. 8,465,624 169,736Pioneer Natural Resources Co. 1,350,137 153,767ONEOK Inc. 3,648,978 140,048Halliburton Co. 7,259,180 137,199Hess Corp. 2,243,724 118,446Baker Hughes Co. Class A 5,629,686 117,379Concho Resources Inc. 1,613,491 94,147Occidental Petroleum Corp. 4,880,580 84,483Diamondback Energy Inc. 1,294,261 62,642Cabot Oil & Gas Corp. 3,279,182 53,385Devon Energy Corp. 3,144,433 49,713
Institutional Index Fund
8

Shares
MarketValue•
($000)
Apache Corp. 3,101,529 44,011NOV Inc. 3,189,232 43,788Marathon Oil Corp. 6,484,139 43,249TechnipFMC plc 3,462,423 32,547HollyFrontier Corp. 1,220,619 31,553
5,860,922Financials (10.4%)* Berkshire Hathaway Inc. Class B 15,980,160 3,705,320
JPMorgan Chase & Co. 25,029,365 3,180,481Bank of America Corp. 62,509,027 1,894,649Citigroup Inc. 17,095,224 1,054,092Wells Fargo & Co. 33,948,697 1,024,572BlackRock Inc. 1,164,643 840,337Morgan Stanley 11,735,875 804,260Goldman Sachs Group Inc. 2,825,191 745,031Charles Schwab Corp. 12,248,406 649,655S&P Global Inc. 1,975,625 649,447American Express Co. 5,355,475 647,530Chubb Ltd. 3,706,536 570,510CME Group Inc. 2,947,742 536,636Intercontinental Exchange Inc. 4,608,909 531,361Truist Financial Corp. 11,069,424 530,557US Bancorp 11,256,188 524,426PNC Financial Services Group Inc. 3,479,091 518,385Marsh & McLennan Cos. Inc. 4,165,306 487,341Progressive Corp. 4,808,950 475,509Aon plc Class A 1,877,378 396,634Moody's Corp. 1,326,152 384,902Capital One Financial Corp. 3,755,713 371,252MSCI Inc. Class A 680,639 303,926MetLife Inc. 6,281,259 294,905Travelers Cos. Inc. 2,080,009 291,971Bank of NewYork Mellon Corp. 6,693,913 284,090T Rowe Price Group Inc. 1,859,313 281,481Allstate Corp. 2,496,551 274,446American International Group Inc. 7,073,255 267,793Prudential Financial Inc. 3,252,162 253,896Aflac Inc. 5,365,362 238,598Discover Financial Services 2,516,632 227,831Willis TowersWatson plc 1,057,868 222,872State Street Corp. 2,896,806 210,830First Republic Bank 1,423,631 209,174Arthur J Gallagher & Co. 1,579,891 195,448Ameriprise Financial Inc. 968,654 188,239MarketAxess Holdings Inc. 311,698 177,842
* SVB Financial Group 425,595 165,058Fifth Third Bancorp 5,853,493 161,381Northern Trust Corp. 1,708,790 159,157Synchrony Financial 4,457,888 154,733Hartford Financial Services Group Inc. 2,942,479 144,123M&T Bank Corp. 1,053,989 134,173KeyCorp. 8,016,378 131,549Regions Financial Corp. 7,884,866 127,104Citizens Financial Group Inc. 3,506,193 125,381Nasdaq Inc. 942,678 125,131
Institutional Index Fund
9

Shares
MarketValue•
($000)
Cincinnati Financial Corp. 1,227,173 107,218Huntington Bancshares Inc. 8,366,163 105,665Principal Financial Group Inc. 2,100,835 104,222Raymond James Financial Inc. 1,001,589 95,822Loews Corp. 1,918,882 86,388Cboe Global Markets Inc. 887,179 82,614Everest Re Group Ltd. 327,645 76,698W R Berkley Corp. 1,154,614 76,689Lincoln National Corp. 1,490,464 74,985Globe Life Inc. 789,458 74,967Assurant Inc. 486,126 66,220Comerica Inc. 1,145,026 63,961Zions Bancorp NA 1,349,764 58,634Franklin Resources Inc. 2,237,171 55,907Invesco Ltd. 3,098,241 54,002People's United Financial Inc. 3,490,772 45,136Unum Group 1,670,762 38,327
27,141,474Health Care (13.4%)
Johnson & Johnson 21,616,317 3,401,976UnitedHealth Group Inc. 7,791,069 2,732,172Merck & Co. Inc. 20,774,703 1,699,371Pfizer Inc. 45,640,849 1,680,040Abbott Laboratories 14,553,349 1,593,446AbbVie Inc. 14,496,661 1,553,317Thermo Fisher Scientific Inc. 3,254,403 1,515,836Medtronic plc 11,052,403 1,294,679Danaher Corp. 5,191,527 1,153,246Bristol-Myers Squibb Co. 18,555,154 1,150,976Eli Lilly and Co. 6,519,403 1,100,736Amgen Inc. 4,780,226 1,099,070
* Intuitive Surgical Inc. 965,288 789,702CVS Health Corp. 10,747,993 734,088Stryker Corp. 2,684,545 657,821Anthem Inc. 2,042,234 655,741Zoetis Inc. 3,902,531 645,869Cigna Corp. 2,966,517 617,570Gilead Sciences Inc. 10,292,951 599,667Becton Dickinson and Co. 2,381,507 595,901
* Vertex Pharmaceuticals Inc. 2,135,115 504,613* Edwards Lifesciences Corp. 5,117,572 466,876
Humana Inc. 1,086,693 445,838* Illumina Inc. 1,198,844 443,572* Boston Scientific Corp. 11,757,443 422,680* Regeneron Pharmaceuticals Inc. 861,018 415,966
HCA Healthcare Inc. 2,167,274 356,430* IDEXX Laboratories Inc. 700,423 350,120
Baxter International Inc. 4,194,458 336,563* Align Technology Inc. 589,135 314,822* Biogen Inc. 1,263,469 309,373
Agilent Technologies Inc. 2,512,823 297,744* DexCom Inc. 788,513 291,529* Centene Corp. 4,760,689 285,784* IQVIA Holdings Inc. 1,574,270 282,062* Alexion Pharmaceuticals Inc. 1,796,954 280,756
Institutional Index Fund
10

Shares
MarketValue•
($000)
Zimmer Biomet Holdings Inc. 1,701,688 262,213ResMed Inc. 1,189,697 252,882McKesson Corp. 1,318,551 229,322
* Mettler-Toledo International Inc. 195,355 222,642Cerner Corp. 2,519,151 197,703
* Viatris Inc. 9,909,677 185,707West Pharmaceutical Services Inc. 607,054 171,984
* Laboratory Corp. of America Holdings 799,853 162,810Teleflex Inc. 382,350 157,364
* Hologic Inc. 2,110,433 153,703Cooper Cos. Inc. 402,687 146,304
* Catalent Inc. 1,352,342 140,738* Incyte Corp. 1,528,377 132,938
STERIS plc 700,641 132,800PerkinElmer Inc. 919,413 131,936Quest Diagnostics Inc. 1,106,434 131,854
* Varian Medical Systems Inc. 750,095 131,274Cardinal Health Inc. 2,408,509 129,000
* Waters Corp. 509,373 126,029* ABIOMED Inc. 370,925 120,254
AmerisourceBergen Corp. Class A 1,206,963 117,993* Bio-Rad Laboratories Inc. Class A 176,539 102,912
DENTSPLY SIRONA Inc. 1,796,133 94,046Universal Health Services Inc. Class B 638,444 87,786
* Henry Schein Inc. 1,171,954 78,357* DaVita Inc. 605,716 71,111
Perrigo Co. plc 1,122,101 50,180
34,997,794Industrials (8.4%)
Honeywell International Inc. 5,761,783 1,225,531Union Pacific Corp. 5,533,239 1,152,131United Parcel Service Inc. Class B 5,873,075 989,026Boeing Co. 4,357,280 932,719RaytheonTechnologies Corp. 12,470,274 891,7493M Co. 4,736,537 827,899Caterpillar Inc. 4,460,911 811,975General Electric Co. 71,928,018 776,823Lockheed Martin Corp. 2,021,663 717,650Deere & Co. 2,573,346 692,359CSX Corp. 6,279,682 569,881FedEx Corp. 1,983,863 515,051Norfolk Southern Corp. 2,085,494 495,534Illinois ToolWorks Inc. 2,365,442 482,266Emerson Electric Co. 4,910,512 394,658Eaton Corp. plc 3,272,977 393,215Northrop Grumman Corp. 1,273,089 387,936Waste Management Inc. 3,192,963 376,546Roper Technologies Inc. 861,192 371,251L3Harris Technologies Inc. 1,725,297 326,116Parker-Hannifin Corp. 1,057,645 288,113TraneTechnologies plc 1,971,589 286,196General Dynamics Corp. 1,908,670 284,048Verisk Analytics Inc. Class A 1,335,059 277,145Johnson Controls International plc 5,943,564 276,911
* TransDigm Group Inc. 446,999 276,625
Institutional Index Fund
11
Shares
MarketValue•
($000)
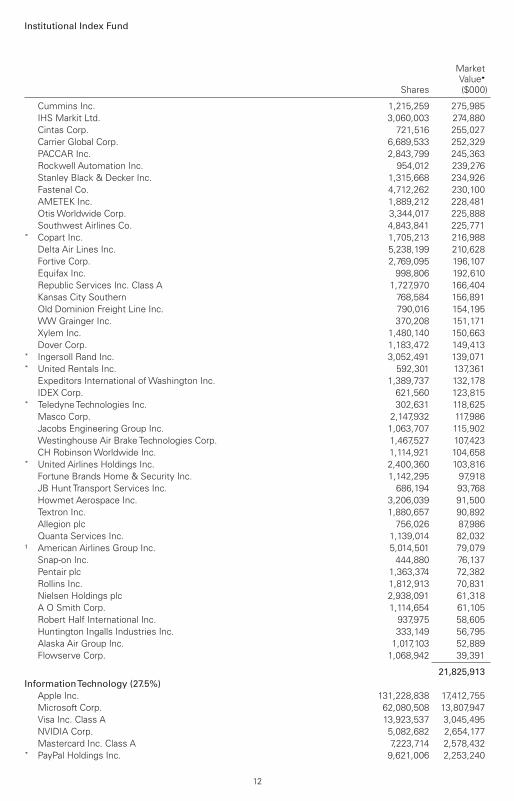
Cummins Inc. 1,215,259 275,985IHS Markit Ltd. 3,060,003 274,880Cintas Corp. 721,516 255,027Carrier Global Corp. 6,689,533 252,329PACCAR Inc. 2,843,799 245,363Rockwell Automation Inc. 954,012 239,276Stanley Black & Decker Inc. 1,315,668 234,926Fastenal Co. 4,712,262 230,100AMETEK Inc. 1,889,212 228,481OtisWorldwide Corp. 3,344,017 225,888Southwest Airlines Co. 4,843,841 225,771
* Copart Inc. 1,705,213 216,988Delta Air Lines Inc. 5,238,199 210,628Fortive Corp. 2,769,095 196,107Equifax Inc. 998,806 192,610Republic Services Inc. Class A 1,727,970 166,404Kansas City Southern 768,584 156,891Old Dominion Freight Line Inc. 790,016 154,195WW Grainger Inc. 370,208 151,171Xylem Inc. 1,480,140 150,663Dover Corp. 1,183,472 149,413
* Ingersoll Rand Inc. 3,052,491 139,071* United Rentals Inc. 592,301 137,361
Expeditors International ofWashington Inc. 1,389,737 132,178IDEX Corp. 621,560 123,815
* TeledyneTechnologies Inc. 302,631 118,625Masco Corp. 2,147,932 117,986Jacobs Engineering Group Inc. 1,063,707 115,902Westinghouse Air BrakeTechnologies Corp. 1,467,527 107,423CH RobinsonWorldwide Inc. 1,114,921 104,658
* United Airlines Holdings Inc. 2,400,360 103,816Fortune Brands Home & Security Inc. 1,142,295 97,918JB Hunt Transport Services Inc. 686,194 93,768Howmet Aerospace Inc. 3,206,039 91,500Textron Inc. 1,880,657 90,892Allegion plc 756,026 87,986Quanta Services Inc. 1,139,014 82,032
1 American Airlines Group Inc. 5,014,501 79,079Snap-on Inc. 444,880 76,137Pentair plc 1,363,374 72,382Rollins Inc. 1,812,913 70,831Nielsen Holdings plc 2,938,091 61,318A O Smith Corp. 1,114,654 61,105Robert Half International Inc. 937,975 58,605Huntington Ingalls Industries Inc. 333,149 56,795Alaska Air Group Inc. 1,017,103 52,889Flowserve Corp. 1,068,942 39,391
21,825,913InformationTechnology (27.5%)
Apple Inc. 131,228,838 17,412,755Microsoft Corp. 62,080,508 13,807,947Visa Inc. Class A 13,923,537 3,045,495NVIDIA Corp. 5,082,682 2,654,177Mastercard Inc. Class A 7,223,714 2,578,432
* PayPal Holdings Inc. 9,621,006 2,253,240
Institutional Index Fund
12

Shares
MarketValue•
($000)
* Adobe Inc. 3,939,003 1,969,974Intel Corp. 33,649,287 1,676,407
* salesforce.com Inc. 7,513,145 1,671,900Cisco Systems Inc. 34,695,665 1,552,631Broadcom Inc. 3,321,464 1,454,303QUALCOMM Inc. 9,286,887 1,414,764Accenture plc Class A 5,202,336 1,358,902Texas Instruments Inc. 7,537,492 1,237,129Oracle Corp. 15,575,408 1,007,573International Business Machines Corp. 7,316,601 921,014
* Advanced Micro Devices Inc. 9,875,620 905,693* ServiceNow Inc. 1,601,998 881,788
Intuit Inc. 2,157,439 819,503Fidelity National Information Services Inc. 5,095,141 720,759
* MicronTechnology Inc. 9,140,729 687,200Applied Materials Inc. 7,499,081 647,171Automatic Data Processing Inc. 3,521,029 620,405Lam Research Corp. 1,182,521 558,469
* Autodesk Inc. 1,805,507 551,293* Fiserv Inc. 4,721,511 537,591
Global Payments Inc. 2,457,907 529,482Analog Devices Inc. 3,033,936 448,203Cognizant Technology Solutions Corp. Class A 4,390,056 359,765
* TE Connectivity Ltd. 2,715,616 328,780KLA Corp. 1,268,281 328,371
* Synopsys Inc. 1,253,174 324,873Amphenol Corp. Class A 2,456,323 321,213
* Cadence Design Systems Inc. 2,290,287 312,464Microchip Technology Inc. 2,137,956 295,273Xilinx Inc. 2,012,757 285,349HP Inc. 11,277,644 277,317
* ANSYS Inc. 705,135 256,528Paychex Inc. 2,626,374 244,726Motorola Solutions Inc. 1,391,464 236,632Corning Inc. 6,270,432 225,736Skyworks Solutions Inc. 1,363,610 208,469
* Keysight Technologies Inc. 1,522,674 201,130Maxim Integrated Products Inc. 2,194,978 194,585
* FleetCor Technologies Inc. 684,800 186,834* Paycom Software Inc. 402,236 181,911* VeriSign Inc. 824,623 178,448* Zebra Technologies Corp. Class A 437,794 168,257* Fortinet Inc. 1,106,239 164,310
Teradyne Inc. 1,363,481 163,468* Qorvo Inc. 936,525 155,716
CDW Corp. 1,173,969 154,717Broadridge Financial Solutions Inc. 949,451 145,456
* Tyler Technologies Inc. 331,085 144,525* Akamai Technologies Inc. 1,336,773 140,348
Western Digital Corp. 2,497,725 138,349Citrix Systems Inc. 1,010,854 131,512
* Arista Networks Inc. 447,242 129,955Hewlett Packard Enterprise Co. 10,566,120 125,209NetApp Inc. 1,833,896 121,477
* Gartner Inc. 732,808 117,389
Institutional Index Fund
13

Shares
MarketValue•
($000)
Leidos Holdings Inc. 1,097,858 115,407Seagate Technology plc 1,834,370 114,024Jack Henry & Associates Inc. 627,468 101,644NortonLifeLock Inc. 4,867,057 101,137
* F5 Networks Inc. 506,203 89,061Western Union Co. 3,373,003 74,004
* IPG Photonics Corp. 293,931 65,779Juniper Networks Inc. 2,714,095 61,094DXCTechnology Co. 2,091,269 53,850FLIR Systems Inc. 1,078,066 47,252
* Vontier Corp. 1,105,424 36,921Xerox Holdings Corp. 1,365,034 31,655
71,765,120Materials (2.6%)
Linde plc 4,309,647 1,135,635Air Products and Chemicals Inc. 1,814,846 495,852Sherwin-Williams Co. 671,233 493,296Ecolab Inc. 2,039,029 441,164DuPont de Nemours Inc. 6,025,445 428,469Newmont Corp. 6,596,819 395,084Dow Inc. 6,090,229 338,008Freeport-McMoRan Inc. 11,930,170 310,423PPG Industries Inc. 1,939,411 279,702Ball Corp. 2,685,354 250,221Corteva Inc. 6,117,326 236,863LyondellBasell Industries NV Class A 2,110,956 193,490Vulcan Materials Co. 1,088,065 161,371International Paper Co. 3,227,590 160,476Amcor plc 12,879,237 151,589Martin Marietta Materials Inc. 511,335 145,204Nucor Corp. 2,478,881 131,852Albemarle Corp. 874,053 128,940Celanese Corp. Class A 959,535 124,682FMC Corp. 1,065,257 122,430Eastman Chemical Co. 1,111,491 111,460Packaging Corp. of America 777,586 107,237Avery Dennison Corp. 685,875 106,386
1 International Flavors & Fragrances Inc. 879,064 95,677Westrock Co. 2,154,721 93,795CF Industries Holdings Inc. 1,760,480 68,148Mosaic Co. 2,839,036 65,326Sealed Air Corp. 1,276,614 58,456
6,831,236Real Estate (2.4%)
AmericanTower Corp. 3,647,548 818,729Prologis Inc. 6,069,952 604,931Crown Castle International Corp. 3,541,549 563,779Equinix Inc. 731,674 522,547Digital Realty Trust Inc. 2,300,490 320,941Public Storage 1,248,916 288,412SBA Communications Corp. Class A 912,164 257,349Simon Property Group Inc. 2,692,181 229,589Welltower Inc. 3,424,460 221,289Weyerhaeuser Co. 6,133,463 205,655AvalonBay Communities Inc. 1,146,323 183,905
Institutional Index Fund
14

Shares
MarketValue•
($000)
Alexandria Real Estate Equities Inc. 1,016,894 181,231Realty Income Corp. 2,883,489 179,267
* CBRE Group Inc. Class A 2,754,220 172,745Equity Residential 2,811,995 166,695Ventas Inc. 3,075,560 150,825Healthpeak Properties Inc. 4,420,151 133,621Essex Property Trust Inc. 535,352 127,103Extra Space Storage Inc. 1,060,978 122,925Duke Realty Corp. 3,053,453 122,047Mid-America Apartment Communities Inc. 938,727 118,927Boston Properties Inc. 1,161,978 109,842UDR Inc. 2,419,645 92,987Host Hotels & Resorts Inc. 5,792,006 84,737Iron Mountain Inc. 2,363,042 69,662Regency Centers Corp. 1,298,607 59,204Kimco Realty Corp. 3,556,524 53,383Federal Realty Investment Trust 565,842 48,164Vornado Realty Trust 1,288,900 48,128SL Green Realty Corp. 594,879 35,443
6,294,062Utilities (2.7%)
NextEra Energy Inc. 16,086,529 1,241,076Duke Energy Corp. 6,043,208 553,316Southern Co. 8,673,116 532,790
* Dominion Energy Inc. 6,699,049 503,768American Electric Power Co. Inc. 4,075,952 339,405Exelon Corp. 8,010,520 338,204Sempra Energy 2,368,683 301,794Xcel Energy Inc. 4,314,889 287,674Eversource Energy 2,814,298 243,465Public Service Enterprise Group Inc. 4,152,145 242,070WEC Energy Group Inc. 2,589,105 238,275AmericanWaterWorks Co. Inc. 1,488,472 228,436Edison International 3,107,920 195,240DTE Energy Co. 1,589,341 192,962PPL Corp. 6,312,500 178,013Consolidated Edison Inc. 2,309,372 166,898Entergy Corp. 1,644,091 164,146Ameren Corp. 2,030,238 158,480CMS Energy Corp. 2,351,486 143,464FirstEnergy Corp. 4,454,904 136,365AES Corp. 5,460,741 128,327Alliant Energy Corp. 2,053,851 105,835Evergy Inc. 1,864,932 103,522Atmos Energy Corp. 1,034,707 98,742CenterPoint Energy Inc. 4,478,668 96,918NRG Energy Inc. 2,001,482 75,156PinnacleWest Capital Corp. 923,643 73,845NiSource Inc. 3,142,866 72,097
7,140,283
Total Common Stocks(Cost $104,220,459) 259,803,983
Institutional Index Fund
15

Shares
MarketValue•
($000)
Temporary Cash Investments (0.5%)
Money Market Fund (0.5%)2,3 Vanguard Market Liquidity Fund, 0.111%
13,420,898 1,342,090
FaceAmount
($000)
U.S. Government and Agency Obligations (0.0%)4 U.S. Cash Management Bill, 0.081%, 5/18/21 52,000 51,981
TotalTemporary Cash Investments(Cost $1,393,993) 1,394,071
Total Investments (100.0%)(Cost $105,614,452) 261,198,054
Other Assets and Liabilities—Net (0.0%) (12,295)
Net Assets (100%) 261,185,759
Cost is in $000.
• See Note A in Notes to Financial Statements.* Non-income-producing security.1 Includes partial security positions on loan to broker-dealers. The total value of securities on loan is $118,952,000.2 Affiliated money market fund available only to Vanguard funds and certain trusts and accounts managed by Vanguard. Rate shown isthe 7-day yield.
3 Collateral of $125,677,000 was received for securities on loan.4 Securities with a value of $51,981,000 have been segregated as initial margin for open futures contracts.
Derivative Financial Instruments Outstanding as of Period End
Futures Contracts
($000)
Expiration
Number ofLong (Short)Contracts
NotionalAmount
Value andUnrealized
Appreciation(Depreciation)
Long Futures Contracts
E-mini S&P 500 Index March 2021 6,491 1,216,673 13,729
Over-the-Counter Total Return Swaps
Reference EntityTermination
Date Counterparty
NotionalAmount
($000)
FloatingInterest Rate
Received(Paid) (%)1
Value andUnrealized
Appreciation($000)
Value andUnrealized
Depreciation($000)
Clorox Co. 1/29/21 GSI 50,760 (0.153) — (283)
Occidental Petroleum Corp. 1/29/21 GSI 39,680 (0.153) — (5,042)
Consolidated Edison Inc. 8/31/21 BOANA 36,135 (0.553) 365 —
Institutional Index Fund
16

Over-the-Counter Total Return Swaps (continued)
Reference EntityTermination
Date Counterparty
NotionalAmount
($000)
FloatingInterest Rate
Received(Paid) (%)1
Value andUnrealized
Appreciation($000)
Value andUnrealized
Depreciation($000)
Williams Cos. Inc. 8/31/21 BOANA 18,045 (0.553) 351 —
Williams Cos. Inc. 8/31/21 BOANA 12,030 (0.553) 234 —
950 (5,325)
1 Based on 1M USD London Interbank Offered Rate (LIBOR) as of the most recent payment date. Floating interest payment received/paidmonthly.1M—1-month.BOANA—Bank of America, N.A.GSI—Goldman Sachs International.
See accompanying Notes, which are an integral part of the Financial Statements.
Institutional Index Fund
17

($000s, except shares and per-share amounts) Amount
Assets
Investments in Securities, at Value
Unaffiliated Issuers (Cost $104,272,443) 259,855,964
Affiliated Issuers (Cost $1,342,009) 1,342,090
Total Investments in Securities 261,198,054
Investment in Vanguard 10,038
Cash 1,139
Cash Collateral Pledged—Futures Contracts 26,143
Cash Collateral Pledged—Over-the-Counter Swap Contracts 7,500
Receivables for Investment Securities Sold 402,838
Receivables for Accrued Income 193,583
Receivables for Capital Shares Issued 378,025
Variation Margin Receivable—Futures Contracts 8,742
Unrealized Appreciation—Over-the-Counter Swap Contracts 950
Total Assets 262,227,012
Liabilities
Payables for Investment Securities Purchased 3,432
Collateral for Securities on Loan 125,677
Payables for Capital Shares Redeemed 903,021
Payables to Vanguard 3,798
Unrealized Depreciation—Over-the-Counter Swap Contracts 5,325
Total Liabilities 1,041,253
Net Assets 261,185,759
Institutional Index Fund
Statement of Assets and LiabilitiesAs of December 31, 2020
18

Statement of Assets and Liabilities (continued)
At December 31, 2020, net assets consisted of:
($000s, except shares and per-share amounts) Amount
Paid-in Capital 102,841,333
Total Distributable Earnings (Loss) 158,344,426
Net Assets 261,185,759
Institutional Shares—Net Assets
Applicable to 359,040,014 outstanding $.001 par value shares ofbeneficial interest (unlimited authorization) 119,011,804
Net Asset Value Per Share—Institutional Shares $331.47
Institutional Plus Shares—Net Assets
Applicable to 428,900,667 outstanding $.001 par value shares ofbeneficial interest (unlimited authorization) 142,173,955
Net Asset Value Per Share—Institutional Plus Shares $331.48
See accompanying Notes, which are an integral part of the Financial Statements.
Institutional Index Fund
19
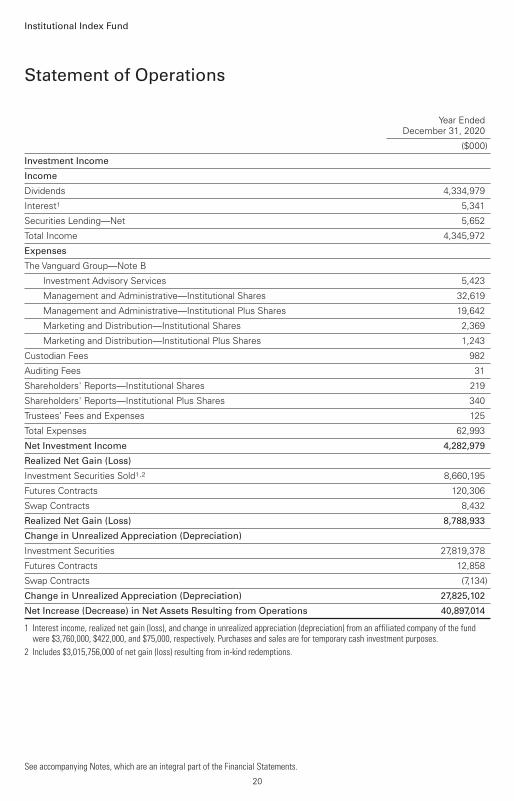
Year EndedDecember 31, 2020
($000)
Investment Income
Income
Dividends 4,334,979
Interest1 5,341
Securities Lending—Net 5,652
Total Income 4,345,972
Expenses
The Vanguard Group—Note B
Investment Advisory Services 5,423
Management and Administrative—Institutional Shares 32,619
Management and Administrative—Institutional Plus Shares 19,642
Marketing and Distribution—Institutional Shares 2,369
Marketing and Distribution—Institutional Plus Shares 1,243
Custodian Fees 982
Auditing Fees 31
Shareholders' Reports—Institutional Shares 219
Shareholders' Reports—Institutional Plus Shares 340
Trustees’ Fees and Expenses 125
Total Expenses 62,993
Net Investment Income 4,282,979
Realized Net Gain (Loss)
Investment Securities Sold1,2 8,660,195
Futures Contracts 120,306
Swap Contracts 8,432
Realized Net Gain (Loss) 8,788,933
Change in Unrealized Appreciation (Depreciation)
Investment Securities 27,819,378
Futures Contracts 12,858
Swap Contracts (7,134)
Change in Unrealized Appreciation (Depreciation) 27,825,102
Net Increase (Decrease) in Net Assets Resulting from Operations 40,897,014
1 Interest income, realized net gain (loss), and change in unrealized appreciation (depreciation) from an affiliated company of the fundwere $3,760,000, $422,000, and $75,000, respectively. Purchases and sales are for temporary cash investment purposes.
2 Includes $3,015,756,000 of net gain (loss) resulting from in-kind redemptions.
See accompanying Notes, which are an integral part of the Financial Statements.
Institutional Index Fund
Statement of Operations
20

Year Ended December 31,
2020($000)
2019($000)
Increase (Decrease) in Net Assets
Operations
Net Investment Income 4,282,979 4,492,233
Realized Net Gain (Loss) 8,788,933 6,459,230
Change in Unrealized Appreciation (Depreciation) 27,825,102 50,144,079
Net Increase (Decrease) in Net Assets Resulting from Operations 40,897,014 61,095,542
Distributions1
Institutional Shares (3,751,166) (3,467,753)
Institutional Plus Shares (4,332,922) (3,565,031)
Total Distributions (8,084,088) (7,032,784)
Capital ShareTransactions
Institutional Shares (12,893,969) (14,747,377)
Institutional Plus Shares (906,093) 2,853,989
Net Increase (Decrease) from Capital Share Transactions (13,800,062) (11,893,388)
Total Increase (Decrease) 19,012,864 42,169,370
Net Assets
Beginning of Period 242,172,895 200,003,525
End of Period 261,185,759 242,172,895
1 Certain prior-period numbers have been reclassified to conform with the current-period presentation.
See accompanying Notes, which are an integral part of the Financial Statements.
Institutional Index Fund
Statement of Changes in Net Assets
21

Institutional Shares
For a Share OutstandingThroughout Each Period
Year Ended December 31,
2020 2019 2018 2017 2016
Net Asset Value, Beginning of Period $290.23 $227.55 $243.46 $203.83 $186.62
Investment Operations
Net Investment Income 5.2611 5.2031 5.0591 4.3791 4.210
Net Realized and Unrealized Gain (Loss) onInvestments 46.122 65.746 (15.434) 39.687 17.814
Total from Investment Operations 51.383 70.949 (10.375) 44.066 22.024
Distributions
Dividends from Net Investment Income (5.273) (5.550) (4.837) (4.436) (4.223)
Distributions from Realized Capital Gains (4.870) (2.719) (.698) — (.591)
Total Distributions (10.143) (8.269) (5.535) (4.436) (4.814)
Net Asset Value, End of Period $331.47 $290.23 $227.55 $243.46 $203.83
Total Return 18.39% 31.46% -4.42% 21.79% 11.93%
Ratios/Supplemental Data
Net Assets, End of Period (Millions) $119,012 $116,814 $104,296 $140,591 $120,014
Ratio of Total Expenses toAverage Net Assets 0.035% 0.035% 0.035% 0.04% 0.04%
Ratio of Net Investment Income toAverage Net Assets 1.83% 1.98% 2.03% 1.96% 2.19%
Portfolio Turnover Rate2 4% 4% 6% 5% 5%
1 Calculated based on average shares outstanding.2 Excludes the value of portfolio securities received or delivered as a result of in-kind purchases or redemptions of the fund’s capital
shares.
See accompanying Notes, which are an integral part of the Financial Statements.
Institutional Index Fund
Financial Highlights
22

Institutional Plus Shares
For a Share OutstandingThroughout Each Period
Year Ended December 31,
2020 2019 2018 2017 2016
Net Asset Value, Beginning of Period $290.25 $227.57 $243.48 $203.84 $186.63
Investment Operations
Net Investment Income 5.3101 5.2521 5.1671 4.4141 4.248
Net Realized and Unrealized Gain (Loss) onInvestments 46.108 65.739 (15.503) 39.705 17.814
Total from Investment Operations 51.418 70.991 (10.336) 44.119 22.062
Distributions
Dividends from Net Investment Income (5.318) (5.592) (4.876) (4.479) (4.261)
Distributions from Realized Capital Gains (4.870) (2.719) (.698) — (.591)
Total Distributions (10.188) (8.311) (5.574 ) (4.479) (4.852)
Net Asset Value, End of Period $331.48 $290.25 $227.57 $243.48 $203.84
Total Return 18.41% 31.48% -4.41% 21.82% 11.95%
Ratios/Supplemental Data
Net Assets, End of Period (Millions) $142,174 $125,359 $95,707 $91,567 $91,481
Ratio of Total Expenses toAverage Net Assets 0.02% 0.02% 0.02% 0.02% 0.02%
Ratio of Net Investment Income toAverage Net Assets 1.84% 1.99% 2.05% 1.98% 2.21%
Portfolio Turnover Rate2 4% 4% 6% 5% 5%
1 Calculated based on average shares outstanding.2 Excludes the value of portfolio securities received or delivered as a result of in-kind purchases or redemptions of the fund’s capital
shares.
See accompanying Notes, which are an integral part of the Financial Statements.
Institutional Index Fund
Financial Highlights
23

Vanguard Institutional Index Fund Fund is registered under the Investment Company Act of 1940as an open-end investment company, or mutual fund. The fund offers two classes of shares:Institutional Shares and Institutional Plus Shares. Each of the share classes has different eligibilityand minimum purchase requirements, and is designed for different types of investors.
Market disruptions associated with the COVID-19 pandemic have had a global impact, anduncertainty exists as to the long-term implications. Such disruptions can adversely affect assets ofthe fund and thus fund performance.
A. The following significant accounting policies conform to generally accepted accountingprinciples for U.S. investment companies. The fund consistently follows such policies in preparingits financial statements.
1. Security Valuation: Securities are valued as of the close of trading on the NewYork StockExchange (generally 4 p.m., Eastern time) on the valuation date. Equity securities are valued at thelatest quoted sales prices or official closing prices taken from the primary market in which eachsecurity trades; such securities not traded on the valuation date are valued at the mean of thelatest quoted bid and asked prices. Securities for which market quotations are not readily available,or whose values have been materially affected by events occurring before the fund’s pricing timebut after the close of the securities’ primary markets, are valued by methods deemed by the boardof trustees to represent fair value. Investments in Vanguard Market Liquidity Fund are valued atthat fund's net asset value. Temporary cash investments are valued using the latest bid prices orusing valuations based on a matrix system (which considers such factors as security prices, yields,maturities, and ratings), both as furnished by independent pricing services.
2. Futures Contracts: The fund uses index futures contracts to a limited extent, with the objectivesof maintaining full exposure to the stock market, maintaining liquidity, and minimizing transactioncosts. The fund may purchase futures contracts to immediately invest incoming cash in themarket, or sell futures in response to cash outflows, thereby simulating a fully invested position inthe underlying index while maintaining a cash balance for liquidity. The primary risks associatedwith the use of futures contracts are imperfect correlation between changes in market values ofstocks held by the fund and the prices of futures contracts, and the possibility of an illiquid market.Counterparty risk involving futures is mitigated because a regulated clearinghouse is thecounterparty instead of the clearing broker. To further mitigate counterparty risk, the fund tradesfutures contracts on an exchange, monitors the financial strength of its clearing brokers andclearinghouse, and has entered into clearing agreements with its clearing brokers. Theclearinghouse imposes initial margin requirements to secure the fund’s performance and requiresdaily settlement of variation margin representing changes in the market value of each contract. Anysecurities pledged as initial margin for open contracts are noted in the Schedule of Investments.
Futures contracts are valued at their quoted daily settlement prices. The notional amounts of thecontracts are not recorded in the Statement of Assets and Liabilities. Fluctuations in the value ofthe contracts are recorded in the Statement of Assets and Liabilities as an asset (liability) and inthe Statement of Operations as unrealized appreciation (depreciation) until the contracts areclosed, when they are recorded as realized gains (losses) on futures contracts.
During the year ended December 31, 2020, the fund’s average investments in long and shortfutures contracts represented less than 1% and 0% of net assets, respectively, based on theaverage of the notional amounts at each quarter-end during the period.
Institutional Index Fund
Notes to Financial Statements
24

3. Swap Contracts: The fund has entered into equity swap contracts to earn the total return onselected reference stocks in the fund’s target index. Under the terms of the swaps, the fundreceives the total return on the referenced stock (i.e., receiving the increase or paying thedecrease in value of the selected reference stock and receiving the equivalent of any dividends inrespect of the selected referenced stock) over a specified period of time, applied to a notionalamount that represents the value of a designated number of shares of the selected referencestock at the beginning of the equity swap contract. The fund also pays a floating rate that is basedon short-term interest rates, applied to the notional amount. At the same time, the fund generallyinvests an amount approximating the notional amount of the swap in high-quality temporary cashinvestments.
The notional amounts of swap contracts are not recorded in the Statement of Assets andLiabilities. Swaps are valued daily based on market quotations received from independent pricingservices or recognized dealers and the change in value is recorded in the Statement of Assets andLiabilities as an asset (liability) and in the Statement of Operations as unrealized appreciation(depreciation) until periodic payments are made or the termination of the swap, at which timerealized gain (loss) is recorded.
A risk associated with all types of swaps is the possibility that a counterparty may default on itsobligation to pay net amounts due to the fund. The fund’s maximum amount subject tocounterparty risk is the unrealized appreciation on the swap contract. The fund mitigates itscounterparty risk by entering into swaps only with a diverse group of prequalified counterparties,monitoring their financial strength, entering into master netting arrangements with itscounterparties, and requiring its counterparties to transfer collateral as security for theirperformance. In the absence of a default, the collateral pledged or received by the fund cannot berepledged, resold, or rehypothecated. In the event of a counterparty’s default (includingbankruptcy), the fund may terminate any swap contracts with that counterparty, determine the netamount owed by either party in accordance with its master netting arrangements, and sell orretain any collateral held up to the net amount owed to the fund under the master nettingarrangements. The swap contracts contain provisions whereby a counterparty may terminate opencontracts if the fund net assets decline below a certain level, triggering a payment by the fund ifthe fund is in a net liability position at the time of the termination. The payment amount would bereduced by any collateral the fund has pledged. Any securities pledged as collateral for opencontracts are noted in the Schedule of Investments. The value of collateral received or pledged iscompared daily to the value of the swap contracts exposure with each counterparty, and anydifference, if in excess of a specified minimum transfer amount, is adjusted and settled within twobusiness days.
During the year ended December 31, 2020, the fund’s average amounts of investments in totalreturn swaps represented less than 1% of net assets, based on the average of notional amountsat each quarter-end during the period.
4. Federal IncomeTaxes: The fund intends to continue to qualify as a regulated investmentcompany and distribute all of its taxable income. The fund’s tax returns are open to examination bythe relevant tax authorities until expiration of the applicable statute of limitations, which isgenerally three years after the filing of the tax return. Management has analyzed the fund’s taxpositions taken for all open federal and state income tax years, and has concluded that noprovision for income tax is required in the fund’s financial statements.
Institutional Index Fund
25

5. Distributions: Distributions to shareholders are recorded on the ex-dividend date. Distributionsare determined on a tax basis at the fiscal year-end and may differ from net investment incomeand realized capital gains for financial reporting purposes.
6. Securities Lending: To earn additional income, the fund lends its securities to qualifiedinstitutional borrowers. Security loans are subject to termination by the fund at any time, and arerequired to be secured at all times by collateral in an amount at least equal to the market value ofsecurities loaned. Daily market fluctuations could cause the value of loaned securities to be moreor less than the value of the collateral received.When this occurs, the collateral is adjusted andsettled before the opening of the market on the next business day. The fund further mitigates itscounterparty risk by entering into securities lending transactions only with a diverse group ofprequalified counterparties, monitoring their financial strength, and entering into master securitieslending agreements with its counterparties. The master securities lending agreements providethat, in the event of a counterparty’s default (including bankruptcy), the fund may terminate anyloans with that borrower, determine the net amount owed, and sell or retain the collateral up tothe net amount owed to the fund; however, such actions may be subject to legal proceedings.While collateral mitigates counterparty risk, in the event of a default, the fund may experiencedelays and costs in recovering the securities loaned. The fund invests cash collateral received inVanguard Market Liquidity Fund, and records a liability in the Statement of Assets and Liabilitiesfor the return of the collateral, during the period the securities are on loan. Collateral investmentsin Vanguard Market Liquidity Fund are subject to market appreciation or depreciation. Securitieslending income represents fees charged to borrowers plus income earned on invested cashcollateral, less expenses associated with the loan. During the term of the loan, the fund is entitledto all distributions made on or in respect of the loaned securities.
7. Credit Facilities and Interfund Lending Program: The fund and certain other funds managed byThe Vanguard Group ("Vanguard") participate in a $4.3 billion committed credit facility provided by asyndicate of lenders pursuant to a credit agreement and an uncommitted credit facility provided byVanguard. Both facilities may be renewed annually. Each fund is individually liable for itsborrowings, if any, under the credit facilities. Borrowings may be utilized for temporary oremergency purposes, subject to the fund’s regulatory and contractual borrowing restrictions.Withrespect to the committed credit facility, the participating funds are charged administrative fees andan annual commitment fee of 0.10% of the undrawn committed amount of the facility; these feesare allocated to the funds based on a method approved by the fund’s board of trustees andincluded in Management and Administrative expenses on the fund’s Statement of Operations. Anyborrowings under either facility bear interest at a rate based upon the higher of the one-monthLondon Interbank Offered Rate (or an acceptable alternate rate, if necessary), federal fundseffective rate, or overnight bank funding rate plus an agreed-upon spread, except that borrowingsunder the uncommitted credit facility may bear interest based upon an alternate rate agreed to bythe fund and Vanguard.
In accordance with an exemptive order (the “Order”) from the SEC, the fund may participate in ajoint lending and borrowing program that allows registered open-end Vanguard funds to borrowmoney from and lend money to each other for temporary or emergency purposes (the “InterfundLending Program”), subject to compliance with the terms and conditions of the Order, and to theextent permitted by the fund’s investment objective and investment policies. Interfund loans andborrowings normally extend overnight, but can have a maximum duration of seven days. Loansmay be called on one business day’s notice. The interest rate to be charged is governed by theconditions of the Order and internal procedures adopted by the board of trustees. The board oftrustees is responsible for overseeing the Interfund Lending Program.
Institutional Index Fund
26

For the year ended December 31, 2020, the fund did not utilize the credit facilities or the InterfundLending Program.
8. Other: Dividend income is recorded on the ex-dividend date. Non-cash dividends included individend income, if any, are recorded at the fair value of the securities received. Interest incomeincludes income distributions received from Vanguard Market Liquidity Fund and is accrued daily.Premiums and discounts on debt securities are amortized and accreted, respectively, to interestincome over the lives of the respective securities, except for premiums on certain callable debtsecurities that are amortized to the earliest call date. Security transactions are accounted for onthe date securities are bought or sold. Costs used to determine realized gains (losses) on the saleof investment securities are those of the specific securities sold.
Each class of shares has equal rights as to assets and earnings, except that each class separatelybears certain class-specific expenses related to maintenance of shareholder accounts (included inManagement and Administrative expenses) and shareholder reporting. Marketing and distributionexpenses are allocated to each class of shares based on a method approved by the board oftrustees. Income, other non-class-specific expenses, and gains and losses on investments areallocated to each class of shares based on its relative net assets.
B. In accordance with the terms of a Funds' Service Agreement (the “FSA”) between Vanguardand the fund, Vanguard furnishes to the fund investment advisory, corporate management,administrative, marketing, and distribution services at Vanguard’s cost of operations (as defined bythe FSA). These costs of operations are allocated to the fund based on methods and guidelinesapproved by the board of trustees and are generally settled twice a month.
Upon the request of Vanguard, the fund may invest up to 0.40% of its net assets as capital inVanguard. At December 31, 2020, the fund had contributed to Vanguard capital in the amount of$10,038,000, representing less than 0.01% of the fund’s net assets and 4.01% of Vanguard’scapital received pursuant to the FSA. The fund’s trustees and officers are also directors andemployees, respectively, of Vanguard.
C. Various inputs may be used to determine the value of the fund’s investments and derivatives.These inputs are summarized in three broad levels for financial statement purposes. The inputs ormethodologies used to value securities are not necessarily an indication of the risk associated withinvesting in those securities.
Level 1—Quoted prices in active markets for identical securities.
Level 2—Other significant observable inputs (including quoted prices for similar securities, interestrates, prepayment speeds, credit risk, etc.).
Level 3—Significant unobservable inputs (including the fund’s own assumptions used todetermine the fair value of investments). Any investments and derivatives valued with significantunobservable inputs are noted on the Schedule of Investments.
Institutional Index Fund
27

The following table summarizes the market value of the fund’s investments and derivatives as ofDecember 31, 2020, based on the inputs used to value them:
Level 1($000)
Level 2($000)
Level 3($000)
Total($000)
Investments
Assets
Common Stocks 259,803,983 — — 259,803,983
Temporary Cash Investments 1,342,090 51,981 — 1,394,071
Total 261,146,073 51,981 — 261,198,054
Derivative Financial Instruments
Assets
Futures Contracts1 8,742 — — 8,742
Swap Contracts — 950 — 950
Total 8,742 950 — 9,692
Liabilities
Swap Contracts — 5,325 — 5,325
1 Represents variation margin on the last day of the reporting period.
D. Permanent differences between book-basis and tax-basis components of net assets arereclassified among capital accounts in the financial statements to reflect their tax character. Thesereclassifications have no effect on net assets or net asset value per share. As of period end,permanent differences primarily attributable to the accounting for in-kind redemptions,distributions in connection with fund share redemptions, and swap agreements were reclassifiedbetween the following accounts:
Amount($000)
Paid-in Capital 3,447,042
Total Distributable Earnings (Loss) (3,447,042)
Temporary differences between book-basis and tax-basis components of total distributableearnings (loss) arise when certain items of income, gain, or loss are recognized in different periodsfor financial statement and tax purposes; these differences will reverse at some time in the future.The differences are primarily related to the deferral of losses from wash sales; and the recognitionof unrealized gains or losses from certain derivative contracts. As of period end, the tax-basiscomponents of total distributable earnings (loss) are detailed in the table as follows:
Amount($000)
Undistributed Ordinary Income 179,484
Undistributed Long-Term Gains 2,635,282
Capital Loss Carryforwards —
Qualified Late-Year Losses —
Net Unrealized Gains (Losses) 155,529,660
Institutional Index Fund
28

The tax character of distributions paid was as follows:Year Ended December 31,
2020Amount
($000)
2019Amount
($000)
Ordinary Income* 4,324,881 4,784,546
Long-Term Capital Gains 3,759,207 2,248,238
Total 8,084,088 7,032,784
* Includes short-term capital gains, if any.
As of December 31, 2020, gross unrealized appreciation and depreciation for investments basedon cost for U.S. federal income tax purposes were as follows:
Amount($000)
Tax Cost 105,668,395
Gross Unrealized Appreciation 162,856,776
Gross Unrealized Depreciation (7,327,116)
Net Unrealized Appreciation (Depreciation) 155,529,660
E. During the year ended December 31, 2020, the fund purchased $12,647,550,000 of investmentsecurities and sold $30,835,185,000 of investment securities, other than temporary cashinvestments. Purchases and sales include $2,266,405,000 and $4,454,141,000, respectively, inconnection with in-kind purchases and redemptions of the fund's capital shares.
F. Capital share transactions for each class of shares were:
Year Ended December 31,
2020 2019
Amount($000)
Shares(000)
Amount($000)
Shares(000)
Institutional Shares
Issued 16,030,122 57,378 14,883,249 56,631
Issued in Lieu of Cash Distributions 3,469,785 12,450 3,215,012 11,843
Redeemed (32,393,876) (113,270) (32,845,638) (124,329)
Net Increase (Decrease)—Institutional Shares (12,893,969) (43,442) (14,747,377) (55,855)
Institutional Plus Shares
Issued 20,850,601 73,122 19,449,819 74,177
Issued in Lieu of Cash Distributions 4,174,182 14,912 3,447,974 12,677
Redeemed (25,930,876) (91,033) (20,043,804) (75,519)
Net Increase (Decrease)—Institutional Plus Shares (906,093) (2,999) 2,853,989 11,335
G. Management has determined that no events or transactions occurred subsequent toDecember 31, 2020, that would require recognition or disclosure in these financial statements.
Institutional Index Fund
29

To the Board of Trustees of Vanguard Institutional Index Funds and Shareholders of VanguardInstitutional Index Fund
Opinion on the Financial StatementsWe have audited the accompanying statement of assets and liabilities, including the schedule ofinvestments, of Vanguard Institutional Index Fund (one of the funds constituting VanguardInstitutional Index Funds, referred to hereafter as the "Fund”) as of December 31, 2020, the relatedstatement of operations for the year ended December 31, 2020, the statement of changes in netassets for each of the two years in the period ended December 31, 2020, including the relatednotes, and the financial highlights for each of the five years in the period ended December 31,2020 (collectively referred to as the “financial statements”). In our opinion, the financialstatements present fairly, in all material respects, the financial position of the Fund as ofDecember 31, 2020, the results of its operations for the year then ended, the changes in its netassets for each of the two years in the period ended December 31, 2020 and the financialhighlights for each of the five years in the period ended December 31, 2020 in conformity withaccounting principles generally accepted in the United States of America.
Basis for OpinionThese financial statements are the responsibility of the Fund’s management. Our responsibility isto express an opinion on the Fund’s financial statements based on our audits. We are a publicaccounting firm registered with the Public Company Accounting Oversight Board (United States)(PCAOB) and are required to be independent with respect to the Fund in accordance with the U.S.federal securities laws and the applicable rules and regulations of the Securities and ExchangeCommission and the PCAOB.
We conducted our audits of these financial statements in accordance with the standards of thePCAOB. Those standards require that we plan and perform the audit to obtain reasonableassurance about whether the financial statements are free of material misstatement, whether dueto error or fraud.
Our audits included performing procedures to assess the risks of material misstatement of thefinancial statements, whether due to error or fraud, and performing procedures that respond tothose risks. Such procedures included examining, on a test basis, evidence regarding the amountsand disclosures in the financial statements. Our audits also included evaluating the accountingprinciples used and significant estimates made by management, as well as evaluating the overallpresentation of the financial statements. Our procedures included confirmation of securitiesowned as of December 31, 2020 by correspondence with the custodian and brokers and byagreement to the underlying ownership records of the transfer agent; when replies were notreceived from brokers, we performed other auditing procedures.We believe that our auditsprovide a reasonable basis for our opinion.
/s/PricewaterhouseCoopers LLPPhiladelphia, PennsylvaniaFebruary 18, 2021
We have served as the auditor of one or more investment companies in The Vanguard Group ofFunds since 1975.
Report of Independent RegisteredPublic Accounting Firm
30

Special 2020 tax information (unaudited) for Vanguard Institutional Index Fund
This information for the fiscal year ended December 31, 2020, is included pursuant to provisions ofthe Internal Revenue Code.
The fund distributed $4,180,611,000 as capital gain dividends (20% rate gain distributions) toshareholders during the fiscal year.
For nonresident alien shareholders, 100% of short-term capital gain dividends distributed by thefund are qualified short-term capital gains.
The fund distributed $4,105,148,000 of qualified dividend income to shareholders during the fiscalyear.
The fund distributed $136,146,000 of qualified business income to shareholders during the fiscalyear.
For corporate shareholders, 90.1% of investment income (dividend income plus short-term gains,if any) qualifies for the dividends-received deduction.
31

The S&P 500 Index is a product of S&P Dow Jones Indices LLC, a division of S&P Global, or its affiliates (“SPDJI”), andhas been licensed for use by Vanguard. Standard & Poor’s®, and S&P® are registered trademarks of Standard & Poor’sFinancial Services LLC, a division of S&P Global (“S&P”) and Dow Jones® is a registered trademark of Dow JonesTrademark Holdings LLC (“Dow Jones”). The trademarks have been licensed to SPDJI and have been sublicensed for usefor certain purposes by Vanguard. Vanguard Institutional Index Fund is not sponsored, endorsed, sold or promoted bySPDJI, Dow Jones, S&P, any of their respective affiliates (collectively, “S&P Dow Jones Indices”). S&P Dow JonesIndices make no representation or warranty, express or implied, to the owners of the Vanguard Institutional Index Fund orany member of the public regarding the advisability of investing in securities generally or in Vanguard Institutional IndexFund particularly or the ability of the S&P 500 Index to track general market performance. S&P Dow Jones Indices’ onlyrelationship to Vanguard with respect to the S&P 500 Index is the licensing of the Index and certain trademarks, servicemarks and/or trade names of S&P Dow Jones Indices and/or its licensors. The S&P 500 Index is determined, composedand calculated by S&P Dow Jones Indices without regard to Vanguard or the Vanguard Institutional Index Fund. S&PDow Jones Indices have no obligation to take the needs of Vanguard or the owners of Vanguard Institutional Index Fundinto consideration in determining, composing or calculating the S&P 500 Index. S&P Dow Jones Indices are notresponsible for and have not participated in the determination of the prices, and amount of Vanguard Institutional IndexFund or the timing of the issuance or sale of Vanguard Institutional Index Fund or in the determination or calculation ofthe equation by which Vanguard Institutional Index Fund is to be converted into cash, surrendered or redeemed, as thecase may be. S&P Dow Jones Indices have no obligation or liability in connection with the administration, marketing ortrading of Vanguard Institutional Index Fund. There is no assurance that investment products based on the S&P 500 Indexwill accurately track index performance or provide positive investment returns. S&P Dow Jones Indices LLC is not aninvestment advisor. Inclusion of a security within an index is not a recommendation by S&P Dow Jones Indices to buy,sell, or hold such security, nor is it considered to be investment advice.
S&P DOW JONES INDICES DOES NOT GUARANTEE THE ADEQUACY, ACCURACY, TIMELINESS AND/OR THECOMPLETENESS OF THE S&P GLOBAL EX-U.S. PROPERTY INDEX OR ANY DATA RELATED THERETO OR ANYCOMMUNICATION, INCLUDING BUT NOT LIMITED TO, ORAL OR WRITTEN COMMUNICATION (INCLUDING ELECTRONICCOMMUNICATIONS) WITH RESPECT THERETO. S&P DOW JONES INDICES SHALL NOT BE SUBJECT TO ANY DAMAGESOR LIABILITY FOR ANY ERRORS, OMISSIONS, OR DELAYS THEREIN. S&P DOW JONES INDICES MAKE NO EXPRESS ORIMPLIED WARRANTIES, AND EXPRESSLY DISCLAIMS ALL WARRANTIES, OF MERCHANTABILITY OR FITNESS FOR APARTICULAR PURPOSE OR USE OR AS TO RESULTS TO BE OBTAINED BY VANGUARD, OWNERS OF THE VANGUARDGLOBAL EX-U.S. REAL ESTATE INDEX FUND, OR ANY OTHER PERSON OR ENTITY FROM THE USE OF THE S&P GLOBALEX-U.S. PROPERTY INDEX OR WITH RESPECT TO ANY DATA RELATED THERETO. WITHOUT LIMITING ANY OF THEFOREGOING, IN NO EVENT WHATSOEVER SHALL S&P DOW JONES INDICES BE LIABLE FOR ANY INDIRECT, SPECIAL,INCIDENTAL, PUNITIVE, OR CONSEQUENTIAL DAMAGES INCLUDING BUT NOT LIMITED TO, LOSS OF PROFITS,TRADING LOSSES, LOST TIME OR GOODWILL, EVEN IF THEY HAVE BEEN ADVISED OF THE POSSIBILITY OF SUCHDAMAGES, WHETHER IN CONTRACT, TORT, STRICT LIABILITY, OR OTHERWISE. THERE ARE NO THIRD PARTYBENEFICIARIES OF ANY AGREEMENTS OR ARRANGEMENTS BETWEEN S&P DOW JONES INDICES AND VANGUARD,OTHER THAN THE LICENSORS OF S&P DOW JONES INDICES.
32

This page intentionally left blank.

This page intentionally left blank.

The trustees of your mutual fund are there to see that the fund is operated and managed in yourbest interests since, as a shareholder, you are a part owner of the fund. Your fund’s trustees alsoserve on the board of directors of The Vanguard Group, Inc., which is owned by the Vanguard fundsand provides services to them.
A majority of Vanguard’s board members are independent, meaning that they have no affiliationwith Vanguard or the funds they oversee, apart from the sizable personal investments they havemade as private individuals. The independent board members have distinguished backgrounds inbusiness, academia, and public service. Each of the trustees and executive officers oversees 211Vanguard funds.
Information for each trustee and executive officer of the fund appears below. That information, aswell as the Vanguard fund count, is as of the date on the cover of this fund report. The mailingaddress of the trustees and officers is P.O. Box 876, Valley Forge, PA 19482. More informationabout the trustees is in the Statement of Additional Information, which can be obtained, withoutcharge, by contacting Vanguard at 800-662-7447, or online at vanguard.com.
InterestedTrustee1
Mortimer J. BuckleyBorn in 1969. Trustee since January 2018. Principaloccupation(s) during the past five years and otherexperience: chairman of the board (2019–present) ofVanguard and of each of the investment companiesserved by Vanguard; chief executive officer(2018–present) of Vanguard; chief executive officer,president, and trustee (2018–present) of each of theinvestment companies served by Vanguard; presidentand director (2017–present) of Vanguard; andpresident (2018–present) of Vanguard MarketingCorporation. Chief investment officer (2013–2017),managing director (2002–2017), head of the RetailInvestor Group (2006–2012), and chief informationofficer (2001–2006) of Vanguard. Chairman of theboard (2011–2017) and trustee (2009–2017) of theChildren’s Hospital of Philadelphia; and trustee(2018–present) and vice chair (2019–present) of TheShipley School.
Independent Trustees
Emerson U. FullwoodBorn in 1948. Trustee since January 2008. Principaloccupation(s) during the past five years and otherexperience: executive chief staff and marketingofficer for North America and corporate vice president(retired 2008) of Xerox Corporation (documentmanagement products and services). Formerpresident of theWorldwide Channels Group, Latin
America, andWorldwide Customer Service andexecutive chief staff officer of Developing Markets ofXerox. Executive in residence and 2009–2010Distinguished Minett Professor at the RochesterInstitute of Technology. Director of SPX FLOW, Inc.(multi-industry manufacturing). Director of theUniversity of Rochester Medical Center, the MonroeCommunity College Foundation, the UnitedWay ofRochester, North Carolina A&T University, andRobertsWesleyan College. Trustee of the Universityof Rochester.
Amy GutmannBorn in 1949. Trustee since June 2006. Principaloccupation(s) during the past five years and otherexperience: president (2004–present) of theUniversity of Pennsylvania. Christopher H. BrowneDistinguished Professor of Political Science, School ofArts and Sciences, and professor of communication,Annenberg School for Communication, withsecondary faculty appointments in the Department ofPhilosophy, School of Arts and Sciences, and at theGraduate School of Education, University ofPennsylvania.
F. Joseph LoughreyBorn in 1949. Trustee since October 2009. Principaloccupation(s) during the past five years and otherexperience: president and chief operating officer(retired 2009) and vice chairman of the board(2008–2009) of Cummins Inc. (industrial machinery).Chairman of the board of Hillenbrand, Inc. (specializedconsumer services) and the Lumina Foundation.
1 Mr. Buckley is considered an “interested person,” as defined in the Investment Company Act of 1940, because he is an officer of theVanguard funds.
The People Who Govern Your Fund

Director of the V Foundation. Member of the advisorycouncil for the College of Arts and Letters and chair ofthe advisory board to the Kellogg Institute forInternational Studies, both at the University of NotreDame.
Mark LoughridgeBorn in 1953. Trustee since March 2012. Principaloccupation(s) during the past five years and otherexperience: senior vice president and chief financialofficer (retired 2013) of IBM (information technologyservices). Fiduciary member of IBM’s RetirementPlan Committee (2004–2013), senior vice presidentand general manager (2002–2004) of IBM GlobalFinancing, vice president and controller (1998–2002)of IBM, and a variety of other prior management rolesat IBM. Member of the Council on Chicago Booth.
Scott C. MalpassBorn in 1962. Trustee since March 2012. Principaloccupation(s) during the past five years and otherexperience: chief investment officer (retired June2020) and vice president (retired June 2020) of theUniversity of Notre Dame. Assistant professor offinance at the Mendoza College of Business,University of Notre Dame, and member of the NotreDame 403(b) Investment Committee (retired June2020). Member of the board of Catholic InvestmentServices, Inc. (investment advisors) and the board ofsuperintendence of the Institute for theWorks ofReligion.
Deanna MulliganBorn in 1963. Trustee since January 2018. Principaloccupation(s) during the past five years and otherexperience: board chair (2020–present), chiefexecutive officer (2011–2020), and president(2010–2019) of The Guardian Life Insurance Companyof America. Chief operating officer (2010–2011) andexecutive vice president (2008–2010) of the individuallife and disability division of Guardian Life. Member ofthe board of the American Council of Life Insurersand the board of the Economic Club of NewYork.Trustee of the Partnership for NewYork City (businessleadership), Chief Executives for Corporate Purpose,NewYork-Presbyterian Hospital, Catalyst, and theBruce Museum (arts and science). Member of theAdvisory Council for the Stanford Graduate School ofBusiness.
André F. PeroldBorn in 1952. Trustee since December 2004. Principaloccupation(s) during the past five years and otherexperience: George Gund Professor of Finance andBanking, Emeritus at the Harvard Business School(retired 2011). Chief investment officer andco-managing partner of HighVista Strategies (private
investment firm). Member of the board of advisorsand member of the investment committee of theMuseum of Fine Arts Boston. Member of the board(2018–present) of RIT Capital Partners (investmentfirm). Member of the investment committee ofPartners Health Care System.
Sarah Bloom RaskinBorn in 1961. Trustee since January 2018. Principaloccupation(s) during the past five years and otherexperience: deputy secretary (2014–2017) of theUnited States Department of theTreasury. Governor(2010–2014) of the Federal Reserve Board.Commissioner (2007–2010) of financial regulation forthe State of Maryland. Member of the board ofdirectors (2012–2014) of Neighborhood ReinvestmentCorporation. Director (2017–present) of i(x)Investments, LLC; director (2017–present) of ReserveTrust. Rubenstein Fellow (2017–present) of DukeUniversity; trustee (2017–present) of AmherstCollege, and trustee (2019–present) of the FolgerShakespeare Library.
Peter F. VolanakisBorn in 1955. Trustee since July 2009. Principaloccupation(s) during the past five years and otherexperience: president and chief operating officer(retired 2010) of Corning Incorporated(communications equipment) and director of CorningIncorporated (2000–2010) and Dow Corning(2001–2010). Director (2012) of SPX Corporation(multi-industry manufacturing). Overseer of the AmosTuck School of Business Administration, DartmouthCollege (2001–2013). Chairman of the board oftrustees of Colby-Sawyer College. Member of theboard of Hypertherm Inc. (industrial cutting systems,software, and consumables).

Executive Officers
John BendlBorn in 1970. Principal occupation(s) during the pastfive years and other experience: principal ofVanguard. Chief financial officer (2019–present) ofeach of the investment companies served byVanguard. Chief accounting officer, treasurer, andcontroller of Vanguard (2017–present). Partner(2003–2016) at KPMG (audit, tax, and advisoryservices).
Christine M. BuchananBorn in 1970. Principal occupation(s) during the pastfive years and other experience: principal ofVanguard. Treasurer (2017–present) of each of theinvestment companies served by Vanguard. Partner(2005–2017) at KPMG (audit, tax, and advisoryservices).
David CermakBorn in 1960. Principal occupation(s) during the pastfive years and other experience: principal ofVanguard. Finance director (2019–present) of each ofthe investment companies served by Vanguard.Managing director and head (2017–present) ofVanguard Investments Singapore. Managing directorand head (2017–2019) of Vanguard Investments HongKong. Representative director and head (2014–2017)of Vanguard Investments Japan.
John GallowayBorn in 1973. Principal occupation(s) during the pastfive years and other experience: principal ofVanguard. Investment stewardship officer (September2020–present) of each of the investment companiesserved by Vanguard. Head of Investor Advocacy(February 2020–present) and head of MarketingStrategy and Planning (2017–2020) at Vanguard.Deputy assistant to the President of theUnited States (2015).
Thomas J. HigginsBorn in 1957. Principal occupation(s) during the pastfive years and other experience: principal ofVanguard. Finance director (2019–present), chieffinancial officer (2008–2019), and treasurer(1998–2008) of each of the investment companiesserved by Vanguard.
Peter MahoneyBorn in 1974. Principal occupation(s) during the pastfive years and other experience: principal ofVanguard. Controller (2015–present) of each of theinvestment companies served by Vanguard. Head ofInternational Fund Services (2008–2014) at Vanguard.
Anne E. RobinsonBorn in 1970. Principal occupation(s) during the pastfive years and other experience: general counsel(2016–present) of Vanguard. Secretary (2016–present)of Vanguard and of each of the investmentcompanies served by Vanguard. Managing director(2016–present) of Vanguard. Managing director andgeneral counsel of Global Cards and ConsumerServices (2014–2016) at Citigroup. Counsel(2003–2014) at American Express.
Michael RollingsBorn in 1963. Principal occupation(s) during the pastfive years and other experience: finance director(2017–present) and treasurer (2017) of each of theinvestment companies served by Vanguard.Managing director (2016–present) of Vanguard. Chieffinancial officer (2016–present) of Vanguard. Director(2016–present) of Vanguard Marketing Corporation.Executive vice president and chief financial officer(2006–2016) of MassMutual Financial Group.
John E. SchadlBorn in 1972. Principal occupation(s) during the pastfive years and other experience: principal ofVanguard. Chief compliance officer (2019–present) ofVanguard and of each of the investment companiesserved by Vanguard. Assistant vice president(2019–present) of Vanguard Marketing Corporation.
Vanguard Senior Management Team
Joseph Brennan James M. NorrisMortimer J. Buckley Thomas M. RampullaGregory Davis Karin A. RisiJohn James Anne E. RobinsonJohnT. Marcante Michael RollingsChris D. McIsaac LaurenValente

Connect withVanguard® > vanguard.com
Fund Information > 800-662-7447
Annuity and Insurance Services > 800-522-5555
Institutional Investor Services > 800-523-1036
TextTelephone for PeopleWhoAre Deaf or Hardof Hearing > 800-749-7273
This material may be used in conjunctionwith the offering of shares of any Vanguardfund only if preceded or accompanied bythe fund’s current prospectus.
You can obtain a free copy of Vanguard’s proxy votingguidelines by visiting vanguard.com/proxyreporting or bycalling Vanguard at 800-662-2739. The guidelines arealso available from the SEC’s website, www.sec.gov. Inaddition, you may obtain a free report on how your fundvoted the proxies for securities it owned during the 12months ended June 30. To get the report, visit eithervanguard.com/proxyreporting or www.sec.gov.
All comparative mutual fund data are from Morningstar,Inc., unless otherwise noted.
You can review information about your fund on the SEC’swebsite, and you can receive copies of this information,for a fee, by sending a request via email addressed [email protected].
Source for Bloomberg Barclays indexes: BloombergIndex Services Limited. Copyright 2021, Bloomberg. Allrights reserved.
© 2021 The Vanguard Group, Inc.All rights reserved.Vanguard Marketing Corporation, Distributor.
Q940 022021
Related Documents