Purdue Pharma LP Protocol: VAN2001 Statistical Analysis Plan 2 SAP2 Final V1.0 Page 1 of 80 Version Date: 12JAN2018 TITLE PAGE DOCUMENT: STATISTICAL ANALYSIS PLAN PROTOCOL NUMBER: VAN2001 TITLE: A Phase 2a, Multicenter, Randomized, Double-blind, Placebo-controlled and Active-controlled, Parallel-group Study Evaluating the Analgesic Efficacy and Safety of V120083 in Subjects with Moderate to Severe Chronic Pain Due to Osteoarthritis of the Knee. DATE: 17-FEB-2017 (amendment 1) SAP STATUS SAP2, Final 1.0 SAP VERSION DATE 12JAN2018 SPONSOR: Purdue Pharma L.P. One Stamford Forum Stamford, CT 06901-3431 USA PREPARED BY:

Welcome message from author
This document is posted to help you gain knowledge. Please leave a comment to let me know what you think about it! Share it to your friends and learn new things together.
Transcript
Purdue Pharma LP
Protocol: VAN2001 Statistical Analysis Plan 2
SAP2 Final V1.0 Page 1 of 80 Version Date: 12JAN2018
TITLE PAGE
DOCUMENT: STATISTICAL ANALYSIS PLAN PROTOCOL
NUMBER: VAN2001
TITLE: A Phase 2a, Multicenter, Randomized, Double-blind, Placebo-controlled and Active-controlled, Parallel-group Study Evaluating the Analgesic Efficacy and Safety of V120083 in Subjects with Moderate to Severe Chronic Pain Due to Osteoarthritis of the Knee.
DATE: 17-FEB-2017 (amendment 1)
SAP STATUS SAP2, Final 1.0
SAP VERSION DATE 12JAN2018
SPONSOR: Purdue Pharma L.P. One Stamford Forum Stamford, CT 06901-3431 USA
PREPARED BY:
Purdue Pharma LP
Protocol: VAN2001 Statistical Analysis Plan 2
SAP2 Final V1.0 Page 3 of 80 Version Date: 12JAN2018
TABLE OF CONTENTS
1. LIST OF ABBREVIATIONS ...................................................................................................9
2. INTRODUCTION ..............................................................................................................12
3. STUDY OBJECTIVES .........................................................................................................12
3.1. PRIMARY OBJECTIVE..........................................................................................................12
3.2. SECONDARY OBJECTIVE ......................................................................................................12
4. STUDY DESIGN................................................................................................................14
4.1. GENERAL STUDY DESIGN AND PLAN ......................................................................................14
4.2. STUDY POPULATION ..........................................................................................................16
4.3. RANDOMIZATION AND BLINDING..........................................................................................17
4.4. STUDY ASSESSMENTS.........................................................................................................18
5. STUDY VARIABLES AND DEFINITIONS .............................................................................22
5.1. EFFICACY VARIABLES..........................................................................................................22
5.1.1. Primary Efficacy Variable ................................................................................................ 22
5.1.2. Secondary Efficacy Variables .......................................................................................... 22
5.2. SAFETY VARIABLES ............................................................................................................29
Purdue Pharma LP
Protocol: VAN2001 Statistical Analysis Plan 2
SAP2 Final V1.0 Page 4 of 80 Version Date: 12JAN2018
5.2.1. Adverse Events................................................................................................................ 29
5.2.2. Clinical Laboratory Evaluations ...................................................................................... 31
5.2.3. Vital Signs ........................................................................................................................ 35
5.2.4. ECGs ............................................................................................................................... . 36
5.2.5. Physical Examination. ..................................................................................................... 39
5.2.6. Other Safety Assessments .............................................................................................. 39
5.3. ADDITIONAL VARIABLES .....................................................................................................40
5.3.1. PK and PG Variables........................................................................................................ 40
5.3.2. Chemotherapy induced Taste Alteration Scale (CiTAS)................................................. 40
6. SAMPLE SIZE DETERMINATION.......................................................................................41
7. ANALYSIS POPULATIONS ................................................................................................41
7.1. ENROLLED POPULATION .....................................................................................................41
7.2. SAFETY POPULATION .........................................................................................................41
7.3. FULL ANALYSIS POPULATION ...............................................................................................42
7.4. PER PROTOCOL POPULATION...............................................................................................42
7.5. PROTOCOL DEVIATIONS.......................................................................................................42
8. GENERAL STATISTICAL CONSIDERATIONS .......................................................................43
8.1. ADJUSTMENTS FOR COVARIATES.........................................................................................43
Purdue Pharma LP
Protocol: VAN2001 Statistical Analysis Plan 2
SAP2 Final V1.0 Page 5 of 80 Version Date: 12JAN2018
8.2. HANDLING OF DROPOUTS ORMISSING DATA.........................................................................44
8.3. INTERIM ANALYSES AND DATAMONITORING ..........................................................................45
8.4. MULTI CENTER STUDIES ...................................................................................................47
8.5. MULTIPLE COMPARISONS /MULTIPLICITY ..............................................................................48
8.6. EXAMINATION OF SUBGROUPS.............................................................................................48
9. STUDY POPULATION CHARACTERISTICS .........................................................................48
9.1. SUBJECT DISPOSITION ........................................................................................................48
9.2. MAJOR PROTOCOL DEVIATIONS ...........................................................................................48
9.3. DEMOGRAPHICS AND BASELINE CHARACTERISTICS....................................................................49
9.4. DOSING AND EXTENT OF EXPOSURE ......................................................................................49
9.5. PRIOR AND CONCOMITANT MEDICATION AND THERAPIES ..........................................................50
9.6. MEDICAL HISTORY.............................................................................................................51
9.7. KELLGREN LAWRENCE........................................................................................................51
10. EFFICACY ANALYSES......................................................................................................51
10.1. PRIMARY EFFICACY VARIABLE(S) ........................................................................................52
10.1.1. Analysis for Primary Efficacy Endpoint......................................................................... 52
10.1.2. Hypothesis Testing for the Primary Efficacy Endpoint........................................ 54
Purdue Pharma LP
Protocol: VAN2001 Statistical Analysis Plan 2
SAP2 Final V1.0 Page 6 of 80 Version Date: 12JAN2018
10.2. SECONDARY EFFICACY VARIABLE(S) ....................................................................................54
10.2.1. Weekly “average pain over the last 24 hours” collected by e-Dairy ................. 54
10.2.2. Average daily “pain right now” collected by e-Dairy .......................................... 54
10.2.3. WOMAC total score .................................................................................................. 55
10.2.4. WOMAC pain severity subscale ........................................................................... 55
10.2.5. WOMAC physical function subscale ...................................................................... 55
10.2.6. WOMAC stiffness subscale ................................................................................... 56
10.2.7. mBPI-SF total scores (all parts of the 6 questions) ........................................... 56
10.2.8. mBPI-SF pain severity subscale........................................................................... 56
10.2.9. mBPI-SF pain interference subscale ..................................................................... 56
10.2.10. SF-36 ......................................................................................................................... 57
10.2.11. EQ-5D-5L .................................................................................................................. 57
10.2.12. PGIC at the end of double-blind period (week 4) ............................................. 58
10.2.13. Supplemental analgesic medication use ........................................................... 58
10.2.14. Responder to treatment.......................................................................................... 58
10.3.1. “Worst Pain over the last 24 hours” collected by mBPI-SF .............................. 59
11. SAFETY ANALYSES.........................................................................................................59
11.1. ADVERSE EVENTS..........................................................................................................60
11.2. CLINICAL LABORATORY EVALUATIONS..................................................................................61
Purdue Pharma LP
Protocol: VAN2001 Statistical Analysis Plan 2
SAP2 Final V1.0 Page 7 of 80 Version Date: 12JAN2018
11.3. VITAL SIGNS ..................................................................................................................62
11.4. ECGS ........................................................................................................................63
11.5. ABUSE OR DIVERSION OF STUDY DRUG ..............................................................................64
11.6. PHYSICAL EXAMINATION.................................................................................................64
11.7. OTHER SAFETYMEASURES................................................................................................64
11.7.1. HADS ........................................................................................................................... 64
11.7.2. C-SSRS ....................................................................................................................... 65
11.7.3. CiTAS scores........................................................................................................... 65
12. OTHER ANALYSES .........................................................................................................65
12.1. PK AND PG ANALYSES.....................................................................................................65
13. SUMMARY OF CHANGES FROM PROTOCOL SPECIFIED ANALYSES ...............................65
14. REPORTING CONVENTIONS.........................................................................................66
15. REFERENCES..................................................................................................................68
16. TABLES, FIGURES, LISTINGS AND OUTPUT ....................................................................68
16.1. TABLES.......................................................................................................................68
16.2. FIGURES .......................................................................................................................68
16.3. DATA LISTINGS FOR APPENDIX 16.2 ...................................................................................69
Purdue Pharma LP
Protocol: VAN2001 Statistical Analysis Plan 2
SAP2 Final V1.0 Page 8 of 80 Version Date: 12JAN2018
17. ATTACHMENTS .............................................................................................................69
18. APPENDIX .....................................................................................................................79
Purdue Pharma LP
Protocol: VAN2001 Statistical Analysis Plan 2
SAP2 Final V1.0 Page 9 of 80 Version Date: 12JAN2018
1. LIST OF ABBREVIATIONS
AE adverse event ALT alanine aminotransferase (alanine transaminase; also SGPT) ANC absolute neutrophil count ANCOVA analysis of covariance AST aspartate aminotransferase (aspartate transaminase; also SGOT) ATC anatomical therapeutic chemical BUN blood urea nitrogen bid twice daily BMI body mass index bpm beats per minute CRF case report form CSR Clinical study report C-SSRS columbia-suicide severity rating scale dL deciliter DMC data monitoring committee DO Doctor of Osteopathic Medicine ECG electrocardiogram EQ-5D-5L EuroQol-5D FAP full analysis population FDA Food and Drug Administration g gram GGT gamma-glutamyltransferase GH general health HADS Hospital Anxiety and Depression Scale HR heart rate ICF informed consent form ICH International Council for Harmonisation IVRS interactive voice response system IWRS interactive web response system
Purdue Pharma LP
Protocol: VAN2001 Statistical Analysis Plan 2
SAP2 Final V1.0 Page 10 of 80 Version Date: 12JAN2018
kg kilogram K-L Kellgren-Lawrence L liter LDH lactate dehydrogenase LFT liver function test LLN lower limit of the laboratory reference range LNH low, normal, high (relative to the laboratory reference range) mBPI-SF modified Brief Pain Inventory – Short Form MedDRA Medical Dictionary for Regulatory Activities mEq milliequivalent mg milligram MH mental health MI myocardial infarction mL milliliter mm millimeter mm Hg millimeters of mercury MMRM mixed-effect general linear model with repeated measures mmol millimole msec millisecond NRS numerical rating scale OA osteoarthritis MD Medical doctor PF physical functioning PG pharmacogenomics PGIC Patient Global Impression of Change PK pharmacokinetic(s) po oral route of administration PP per-protocol population PR PR interval (ECG) QRS QRS interval (ECG) QT QT interval (ECG) QTc QT data corrected for heart rate
Purdue Pharma LP
Protocol: VAN2001 Statistical Analysis Plan 2
SAP2 Final V1.0 Page 11 of 80 Version Date: 12JAN2018
QTcB QT data corrected for heart rate using the Bazett formula QTcF QT data corrected for heart rate using the Fridericia formula RBC red blood cell (count) RE role-emotional RP role-physical SAE serious adverse event SAP statistical analysis plan SD standard deviation SF social functioning SF-36 Medical Outcomes Study 36-Item Short Form Health Survey SGOT serum glutamic-oxaloacetic transaminase (also AST) SGPT serum glutamate pyruvate transaminase (also ALT) SI international system of units for clinical laboratory values SOC System Organ Class SOP standard operating procedure SSRI selective serotonin reuptake inhibitor ST ST interval (ECG) TEAE treatment-emergent adverse event ULN upper limit of the laboratory reference range US United States v versus VT vitality WBC white blood cell (count) WOMAC Western Ontario and McMaster Osteoarthritis Index
Purdue Pharma LP
Protocol: VAN2001 Statistical Analysis Plan 2
SAP2 Final V1.0 Page 12 of 80 Version Date: 12JAN2018
2. INTRODUCTION
This Statistical Analysis Plan (SAP) summarizes the planned presentation and analysis of the clinical data from Purdue Pharma L.P. Protocol VAN2001 a Phase 2a, multicenter, randomized, double-blind, placebo-controlled and active-controlled, parallel-group study evaluating the analgesic efficacy and safety of V120083 in subjects with moderate to severe chronic pain due to osteoarthritis (OA) of the knee.
Study measurements and assessments, planned statistical analysis methods, and planned tables, listings and graphs are specified in this plan.
The final version of the SAP will be developed in two stages. At the first stage, SAP1 will be developed and initial approval by Purdue will be obtained prior to commencing the programming activities. All changes introduced during the second stage following the initial approval of SAP1 will be tracked and a final version of the SAP, known as SAP2, will be issued for Purdue’s final approval prior to database lock and study unblinding.
3. STUDY OBJECTIVES
3.1. PRIMARY OBJECTIVE
The primary objective of this study is:
To evaluate the analgesic efficacy of V120083 twice daily (bid) compared with placebo in subjects with moderate to severe chronic pain due to OA of the knee using the “average pain over the last 24 hours” score from the modified Brief Pain Inventory – short form (mBPI-SF) pain severity subscale at week 4 of the double blind period.
3.2. SECONDARY OBJECTIVE
The secondary objectives of this study are:
Evaluate the safety and tolerability (including adverse event [AE] reporting, clinical laboratory parameters, and physical examination) of 2 dose levels of V120083.
Purdue Pharma LP
Protocol: VAN2001 Statistical Analysis Plan 2
SAP2 Final V1.0 Page 13 of 80 Version Date: 12JAN2018
Evaluate the efficacy of V120083 on pain, stiffness, physical function, and overall disability using the Western Ontario and McMaster Osteoarthritis Index (WOMAC) subscale and total scores.
Evaluate the efficacy of V120083 on pain intensity due to OA using numerical rating
scale (NRS) pain scores from the mBPI-SF pain severity subscale.
Evaluate the impact of V120083 on pain-related quality of life/function using the mBPI- SF pain interference subscale.
Evaluate the effect of V120083 on pain severity and pain interference overall using the
mBPI-SF total score.
Evaluate the impact of V120083 on subjects’ health state (as defined by mobility, self- care, daily activities, pain/discomfort, and anxiety/depression) using the EuroQol-5D (EQ-5D-5L).
Evaluate the impact of V120083 on subjects’ functional health and well-being using the
Medical Outcomes Study 36-Item Short Form Health Survey (SF-36).
Evaluate subject global impression of treatments using the Patient Global Impression of Change (PGIC) questionnaire.
Evaluate the impact of V120083 on mood (anxiety and depression) using the Hospital
Anxiety and Depression Scale (HADS).
Evaluate the efficacy of naproxen vs. placebo for assay sensitivity using the primary and secondary endpoints indicated above.
Determine plasma levels of V120083 in subjects under clinical use conditions.
Evaluate supplemental analgesic medication use.
Evaluate treatment response.

Purdue Pharma LP
Protocol: VAN2001 Statistical Analysis Plan 2
SAP2 Final V1.0 Page 14 of 80 Version Date: 12JAN2018
Evaluate the occurrence of treatment-emergent suicidal ideation or behavior using the Columbia-Suicide Severity Rating Scale (C-SSRS).
4. STUDY DESIGN
4.1. GENERAL STUDY DESIGN AND PLAN
The study consists of 3 periods: 1) the screening period (within 21 days of baseline); 2) the double-blind period, which consists of 4 weeks of treatment (28 days); and 3) the follow-up period, during which a telephone contact is made approximately 7 days after the end of study/study discontinuation visit. Subjects may withdraw from the study at any time and for any reason. The reasons for screen failure, baseline failure and discontinuation from the double- blind period are summarized in section 9.3.3 of the protocol.
It is planned that up to 276 subjects, in approximately 30 sites in the United States, will be randomly assigned to one of the 4 treatments in the double-blind period: V120083 30 mg bid, V120083 60 mg bid, naproxen 500 mg bid, or placebo. Naproxen 500 mg bid will be used as an active control to determine the assay sensitivity of the study.
Figure 1 Study Plan
TC Visit 2 Week 1
Visit 3 Week 2Visit 4
Week 4Visit 5
Follow-up
Stop incominganalgesics
Placebo
PainAssessmentb
Washout
V120083 30 mg bid
V120083 60 mg bidPeriod
Randomization
Naproxen 500 mg bid
End of Study
Screening Period( 21 days)
Double blind Period(28 days)
Follow up Period(7 days)
Purdue Pharma LP
Protocol: VAN2001 Statistical Analysis Plan 2
SAP2 Final V1.0 Page 15 of 80 Version Date: 12JAN2018
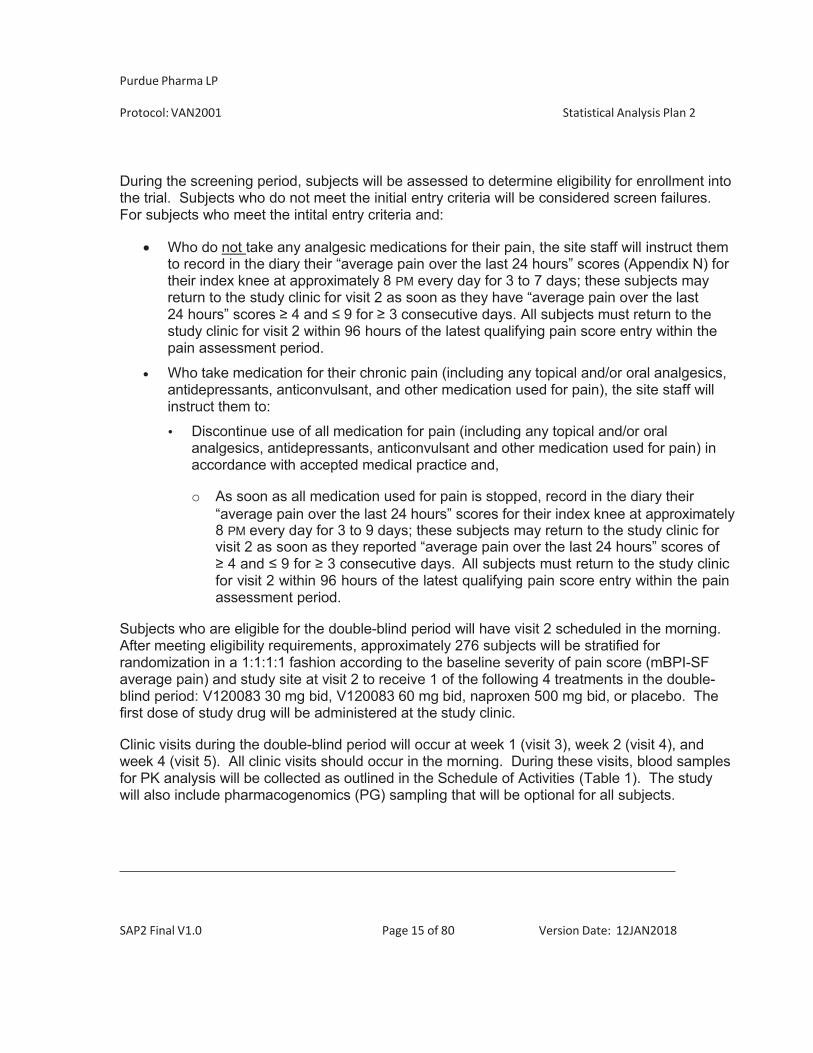
During the screening period, subjects will be assessed to determine eligibility for enrollment into the trial. Subjects who do not meet the initial entry criteria will be considered screen failures. For subjects who meet the intital entry criteria and:
Who do not take any analgesic medications for their pain, the site staff will instruct them
to record in the diary their “average pain over the last 24 hours” scores (Appendix N) for their index knee at approximately 8 PM every day for 3 to 7 days; these subjects may return to the study clinic for visit 2 as soon as they have “average pain over the last 24 hours” scores 4 and 9 for 3 consecutive days. All subjects must return to the study clinic for visit 2 within 96 hours of the latest qualifying pain score entry within the pain assessment period.
Who take medication for their chronic pain (including any topical and/or oral analgesics, antidepressants, anticonvulsant, and other medication used for pain), the site staff will instruct them to:
Discontinue use of all medication for pain (including any topical and/or oral analgesics, antidepressants, anticonvulsant and other medication used for pain) in accordance with accepted medical practice and,
o As soon as all medication used for pain is stopped, record in the diary their
“average pain over the last 24 hours” scores for their index knee at approximately 8 PM every day for 3 to 9 days; these subjects may return to the study clinic for visit 2 as soon as they reported “average pain over the last 24 hours” scores of 4 and 9 for 3 consecutive days. All subjects must return to the study clinic
for visit 2 within 96 hours of the latest qualifying pain score entry within the pain assessment period.
Subjects who are eligible for the double-blind period will have visit 2 scheduled in the morning. After meeting eligibility requirements, approximately 276 subjects will be stratified for randomization in a 1:1:1:1 fashion according to the baseline severity of pain score (mBPI-SF average pain) and study site at visit 2 to receive 1 of the following 4 treatments in the double- blind period: V120083 30 mg bid, V120083 60 mg bid, naproxen 500 mg bid, or placebo. The first dose of study drug will be administered at the study clinic.
Clinic visits during the double-blind period will occur at week 1 (visit 3), week 2 (visit 4), and week 4 (visit 5). All clinic visits should occur in the morning. During these visits, blood samples for PK analysis will be collected as outlined in the Schedule of Activities (Table 1). The study will also include pharmacogenomics (PG) sampling that will be optional for all subjects.
Purdue Pharma LP
Protocol: VAN2001 Statistical Analysis Plan 2
SAP2 Final V1.0 Page 16 of 80 Version Date: 12JAN2018
Starting at the screening phone call visit, subjects may take their own supplemental analgesic medication, ie, 500 mg acetaminophen (APAP), which can be taken as needed up to 2 g/24 hours for breakthrough pain, but it is not be be taken within 24 hours of visit 2. Supplemental analysis medication, APAP/acetaminophen 500 mg, will be provided during the double-blind period. No more than 4 tablets/24 hours (ie, no more than 2 g/24 hours, and no more than 2 tablets of APAP/acetaminophen 500 mg at any one time), as needed, will be permitted during the double-blind period. All subjects will be instructed to refrain from taking any supplemental analgesic medication for at least 24 hours prior to the weeks, 1, 2, and 4 (visits 3, 4, and 5, respectively) of the double-blind period.
Subjects are allowed a ±1 day window for visit 3, and a ± 2 day window for visits 4 and 5, from baseline. All scheduled visits will be anchored to the day of randomization (visit 2). Subjects who discontinued treatment early will be instructed to return to study clinic for an early discontinuation visit (visit 5). After the end of the study/early discontinuation visit, all subjects will be converted to a pain regimen as deemed medically appropriate by the investigator/designee.
During the follow-up period, subjects will receive a telephone call approximately 7 days after the end of the study/study discontinuation visit to assess subject status and documentation of AEs and concomitant medications.
An interim analysis will be performed for futility when approximately 50% of randomized subjects have completed the study. An independent data monitoring committee (DMC) will review all unblinded safety and efficacy data from the analysis and make recommendations.
4.2. STUDY POPULATION
The subject population will consist of males and females 40 and 80 years of age with moderate to severe chronic OA pain of the knee as their predominant pain condition for at least 6 months prior to screening. Subjects meeting all the inclusion criteria per section 9.3.1 of the protocol, and none of the exclusion criteria per section 9.3.2 of the protocol may be enrolled in the study. Approximately 276 subjects will be stratified for randomization in a 1:1:1:1 fashion according to the baseline severity of pain score (mBPI-SF average pain) and study site at visit 2 to receive 1 of the following 4 treatments in the double blind period: V120083 30 mg bid, V120083 60 mg bid, naproxen 500 mg bid, or placebo. The actual number of subjects treated will depend on the outcome of the interim analyses.
Purdue Pharma LP
Protocol: VAN2001 Statistical Analysis Plan 2
SAP2 Final V1.0 Page 17 of 80 Version Date: 12JAN2018
4.3. RANDOMIZATION AND BLINDING
Subjects will be randomized at visit 2 by Interactive Web Response System/Interactive Voice Response System (IWRS/IVRS) to receive 1 of the 4 treatment groups according to a randomization schedule generated by and will be assigned a unique randomization number.
The subject number will be recorded on all clinical investigation documentation (e.g, case report forms, clinical drug supply labels, laboratory kits, ECGs, etc.). During the double-blind period of the study, the subject and all personnel involved with the conduct, analysis, and the interpretation of the study, including the investigators, clinical site personnel, and the sponsor (or designee) staff, will be blinded to the study drug codes.
The randomization schedule will be kept strickly confidential, filed securely by the sponsor (or designee), and accessible only to authorized persons per sponsor’s (or designee’s) SOPs until the time of unblinding.
Unblinding a subject should only be done in emergency situations for reasons of subject’s safety.
In the event that an emergency unblinding is required, the investigator/medically qualified designee (must be a MD or a DO) should make every attempt to contact the sponsor’s medical monitor or designee before breaking the blind.
When the blinding code is broken, the date, time of unblinding, and reason(s) must be fully documented in the source documentation. If not already done, the sponsor’s medical monitor or designee must be contacted as soon as possible to notify him/her of the unblinding and to discuss the reason(s) for unblinding.
In the event that an emergency unblinding is required, authorized IWRS users at the clinical sites and the sponsor or designee, will have the ability to retrieve the subject’s treatment group assignment through IVRS/IWRS.
This study includes an interim analysis for safety and efficacy (for futility) when 50% of the subjects have completed the end-of-study visit. The treatment assignment for the subset of subjects included in the interim analyses will be released to the interim analysis team through
Purdue Pharma LP
Protocol: VAN2001 Statistical Analysis Plan 2
SAP2 Final V1.0 Page 18 of 80 Version Date: 12JAN2018
the IVRS system and will be kept strictly confidential in a secure location. The unblinded interim analysis team will consist of a statistician and programmer not associated with the study team.
4.4. STUDY ASSESSMENTS
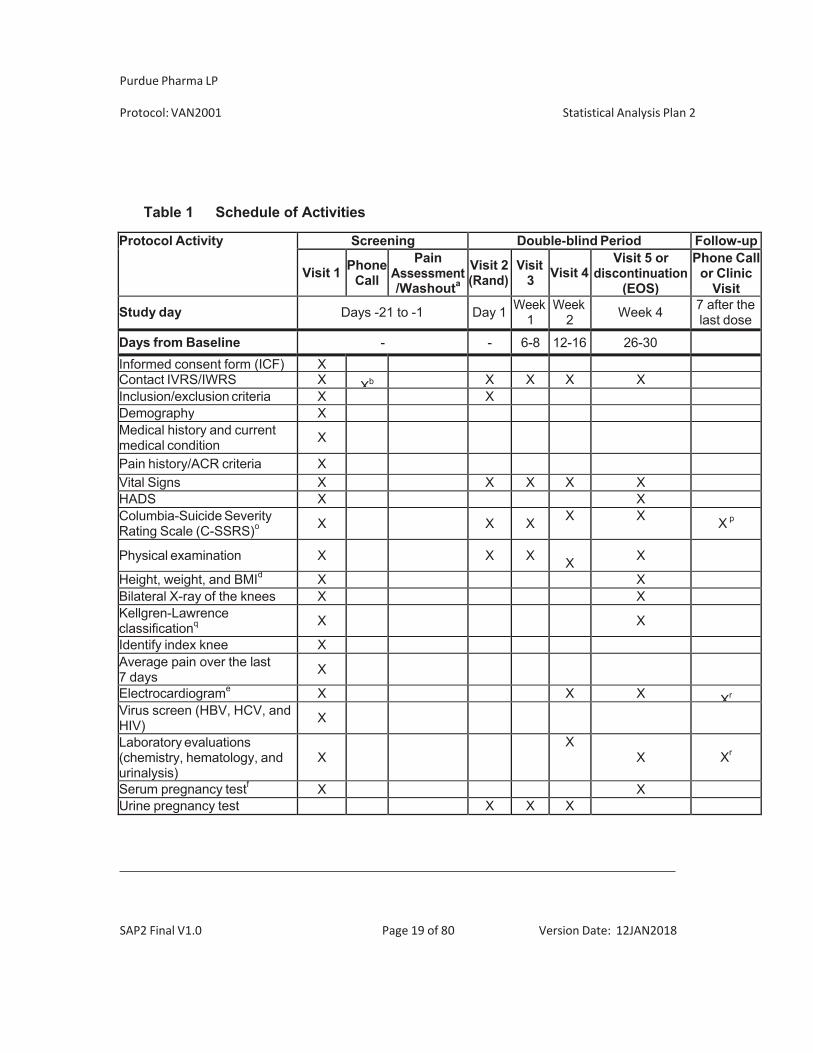
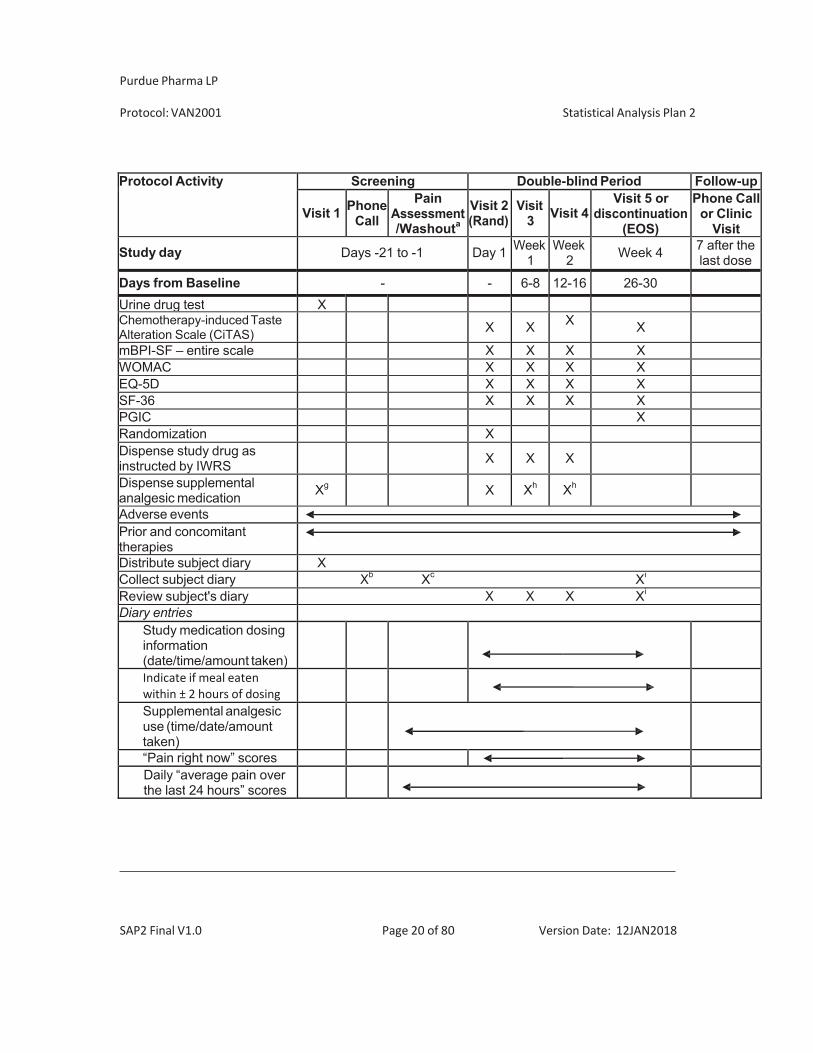
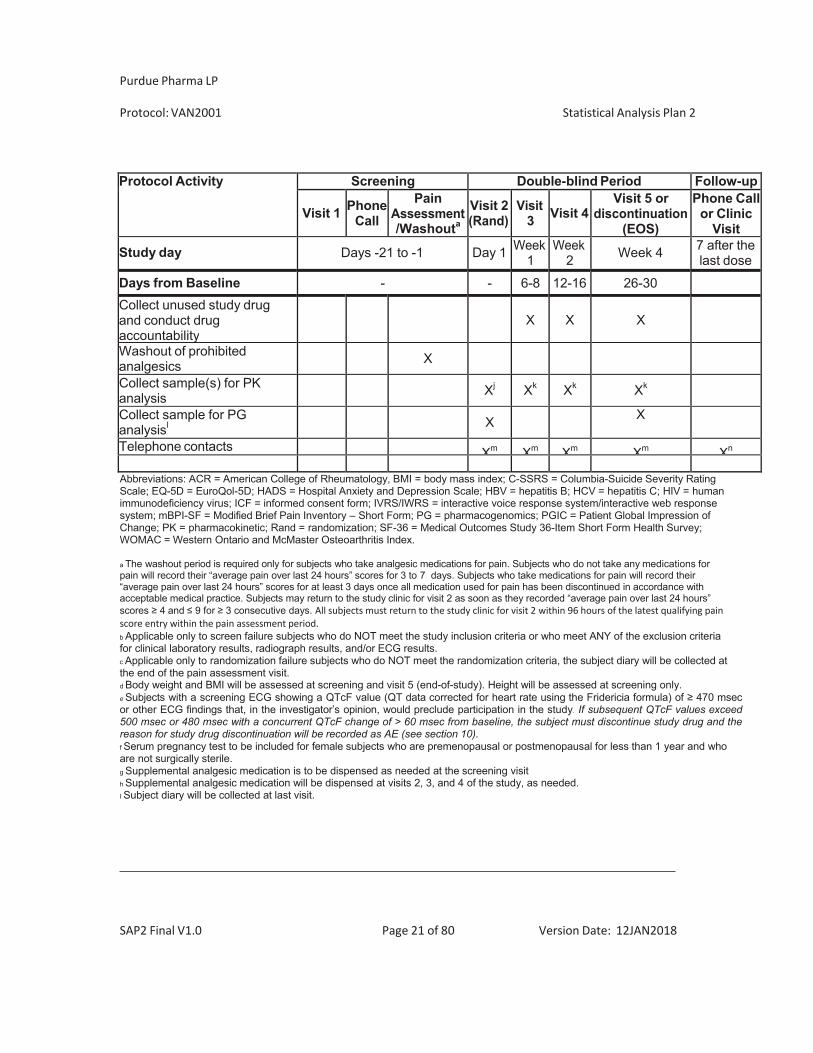
Table 1 summarizes the schedule of expected visits and procedures of the study, including clinical evaluations and clinical laboratory test measurements.
Purdue Pharma LP
Protocol: VAN2001 Statistical Analysis Plan 2
SAP2 Final V1.0 Page 19 of 80 Version Date: 12JAN2018
Table 1 Schedule of Activities
Protocol Activity Screening Double-blind Period Follow-up
Visit 1 PhoneCall
PainAssessment/Washouta
Visit 2(Rand)
Visit3 Visit 4
Visit 5 ordiscontinuation
(EOS)
Phone Callor Clinic
Visit
Study day Days -21 to -1 Day 1 Week1
Week 2 Week 4 7 after the
last dose
Days from Baseline - - 6-8 12-16 26-30Informed consent form (ICF) XContact IVRS/IWRS X Xb X X X XInclusion/exclusion criteria X XDemography XMedical history and current medical condition X
Pain history/ACR criteria X Vital Signs X X X X XHADS X XColumbia-Suicide Severity Rating Scale (C-SSRS)o X X X X X X p
Physical examination X X X X X
Height, weight, and BMId X XBilateral X-ray of the knees X XKellgren-Lawrence classificationq X X
Identify index knee XAverage pain over the last 7 days X
Electrocardiograme X X X Xr
Virus screen (HBV, HCV, and HIV) X
Laboratory evaluations (chemistry, hematology, and urinalysis)
X X
X Xr
Serum pregnancy testf X XUrine pregnancy test X X X
Purdue Pharma LP
Protocol: VAN2001 Statistical Analysis Plan 2
SAP2 Final V1.0 Page 20 of 80 Version Date: 12JAN2018
Protocol Activity Screening Double-blind Period Follow-up
Visit 1 PhoneCall
PainAssessment/Washouta
Visit 2(Rand)
Visit3 Visit 4
Visit 5 ordiscontinuation
(EOS)
Phone Callor Clinic
Visit
Study day Days -21 to -1 Day 1 Week1
Week 2 Week 4 7 after the
last dose
Days from Baseline - - 6-8 12-16 26-30Urine drug test XChemotherapy-induced Taste Alteration Scale (CiTAS)
X X X X
mBPI-SF – entire scale X X X XWOMAC X X X XEQ-5D X X X XSF-36 X X X XPGIC XRandomization XDispense study drug as instructed by IWRS
X X X
Dispense supplemental analgesic medication Xg X Xh Xh
Adverse eventsPrior and concomitant therapiesDistribute subject diary XCollect subject diary Xb Xc Xi
Review subject's diary X X X Xi
Diary entriesStudy medication dosing information (date/time/amount taken)
Indicate if meal eatenwithin ± 2 hours of dosing
Supplemental analgesic use (time/date/amount taken)
“Pain right now” scoresDaily “average pain over the last 24 hours” scores
Purdue Pharma LP
Protocol: VAN2001 Statistical Analysis Plan 2
SAP2 Final V1.0 Page 21 of 80 Version Date: 12JAN2018
Protocol Activity Screening Double-blind Period Follow-up
Visit 1 PhoneCall
PainAssessment/Washouta
Visit 2(Rand)
Visit3 Visit 4
Visit 5 ordiscontinuation
(EOS)
Phone Callor Clinic
Visit
Study day Days -21 to -1 Day 1 Week1
Week 2 Week 4 7 after the
last dose
Days from Baseline - - 6-8 12-16 26-30Collect unused study drug and conduct drug accountability
X X X
Washout of prohibited analgesics X
Collect sample(s) for PK analysis
Xj Xk Xk Xk
Collect sample for PG analysisl
X X
Telephone contacts Xm Xm Xm Xm Xn
Abbreviations: ACR = American College of Rheumatology, BMI = body mass index; C-SSRS = Columbia-Suicide Severity Rating Scale; EQ-5D = EuroQol-5D; HADS = Hospital Anxiety and Depression Scale; HBV = hepatitis B; HCV = hepatitis C; HIV = human immunodeficiency virus; ICF = informed consent form; IVRS/IWRS = interactive voice response system/interactive web response system; mBPI-SF = Modified Brief Pain Inventory – Short Form; PG = pharmacogenomics; PGIC = Patient Global Impression of Change; PK = pharmacokinetic; Rand = randomization; SF-36 = Medical Outcomes Study 36-Item Short Form Health Survey; WOMAC = Western Ontario and McMaster Osteoarthritis Index.
a The washout period is required only for subjects who take analgesic medications for pain. Subjects who do not take any medications for pain will record their “average pain over last 24 hours” scores for 3 to 7 days. Subjects who take medications for pain will record their “average pain over last 24 hours” scores for at least 3 days once all medication used for pain has been discontinued in accordance with acceptable medical practice. Subjects may return to the study clinic for visit 2 as soon as they recorded “average pain over last 24 hours” scores 4 and 9 for 3 consecutive days. All subjects must return to the study clinic for visit 2 within 96 hours of the latest qualifying painscore entry within the pain assessment period.b Applicable only to screen failure subjects who do NOT meet the study inclusion criteria or who meet ANY of the exclusion criteria for clinical laboratory results, radiograph results, and/or ECG results. c Applicable only to randomization failure subjects who do NOT meet the randomization criteria, the subject diary will be collected at the end of the pain assessment visit. d Body weight and BMI will be assessed at screening and visit 5 (end-of-study). Height will be assessed at screening only. e Subjects with a screening ECG showing a QTcF value (QT data corrected for heart rate using the Fridericia formula) of 470 msec or other ECG findings that, in the investigator’s opinion, would preclude participation in the study. If subsequent QTcF values exceed 500 msec or 480 msec with a concurrent QTcF change of > 60 msec from baseline, the subject must discontinue study drug and the reason for study drug discontinuation will be recorded as AE (see section 10). f Serum pregnancy test to be included for female subjects who are premenopausal or postmenopausal for less than 1 year and who are not surgically sterile. g Supplemental analgesic medication is to be dispensed as needed at the screening visit h Supplemental analgesic medication will be dispensed at visits 2, 3, and 4 of the study, as needed. I Subject diary will be collected at last visit.
Purdue Pharma LP
Protocol: VAN2001 Statistical Analysis Plan 2
SAP2 Final V1.0 Page 22 of 80 Version Date: 12JAN2018
J For subjects in the intense PK sampling population, PK samples will be collected at Visit 2 (6 timepoints; predose, 1, 2 [+/- 10 min], 4, 6 and 8 hrs [+/- 20min] postdose) The actual time of dosing and sampling should be recorded. k For all subjects, PK samples will be collected at visit 3 (predose, 1 and 2 hours post-dose); visit 4 (predose or post dose) and 5 (predose or post dose). The actual time of dosing and sampling should be recorded. l PG samples will be collected for DNA and protein at visit 2 predose and at visit 5 postdose. m At approximately 1 to 2 days prior to each scheduled visits, the site personnel will contact the subject to remind subjects to: Refrain from taking any supplemental analgesic medications for at least 24 hours prior to the clinic visit (applicable to visits 3, 4 and 5 only) and to hold morning dose of study drug on the day of the clinic visit for predose PK sampling n Follow-up visit could be by telephone contact or by a clinic visit. o At screening visit, use C-SSRS Baseline/Screening Assessment. For randomization visit and subsequent scheduled or unscheduled visits, use C-SSRS Since Last Visit Assessment. Positive scores on the C-SSRS may result in discontinuation and/or referral to a specialist for evaluation as outlined in the protocol p C-SSRS should be completed at all visits that include clinical assessments q K-L grade should be determined by a local radiologist or rheumatologist. r Subjects who require follow-up of clinical laboratory or ECG assessments must return to the clinical site for this visit.
5. STUDY VARIABLES AND DEFINITIONS
5.1. EFFICACY VARIABLES
5.1.1. Primary Efficacy Variable The primary efficacy assessment is the “average pain over the last 24 hours” score (on an 11- point NRS scale where 0=no pain, 10=pain as bad as you can imagine) from the mBPI-SF pain severity subscale at week 4 of the double-blind period.
The baseline score will be the value collected the day of randomization (Visit 2).
No missing data will be imputed for the primary efficacy variable.
5.1.2. Secondary Efficacy Variables The secondary efficacy variables are:
Weekly “average pain over the last 24 hours” collected by e-Diary
Average daily “pain right now” collected by e-Diary
WOMAC total scores
WOMAC pain severity subscales
WOMAC physical function subscale
Purdue Pharma LP
Protocol: VAN2001 Statistical Analysis Plan 2
SAP2 Final V1.0 Page 23 of 80 Version Date: 12JAN2018
WOMAC stiffness subscale
mBPI-SF total scores (all parts of 6 questions)
mBPI-SF pain severity subscale
mBPI-SF interference subscale
SF-36
EQ-5D-5L
PGIC at the end of double-blind period (week 4)
Supplemental analgesic medication use
Responder to treatment
Evaluate the occurrence of treatment-emergent suicidal ideation or behavior using the Columbia – Suicide Severity Rating Scale (C-SSRS)
Weekly “average pain over the last 24 hours” collected by e-Dairy
The question daily “average pain over the last 24 hours” scores is administered daily during the screening visits and at visits 2 through 5 (end of study/early discontinuation).
For the purposes of defining weekly averages, weeks will be defined as 7X24 hours intervals starting on the date/time when the first dose of double-blind medication was taken.
A minimum of 4 non-missing scores are required in order to compute the average for any given week.
The baseline score will be the average of non-missing observations taken over the 7 days prior to first dose date.
Handling of missing data is described in detail in Section 8.2.
Purdue Pharma LP
Protocol: VAN2001 Statistical Analysis Plan 2
SAP2 Final V1.0 Page 24 of 80 Version Date: 12JAN2018
Average daily “pain right now” collected by e-Diary
The average daily “pain right now” scores (see Appendix P of the protocol) will be defined as the sum of nonmissing daily “pain right now” scores reported during that week (days 1 to 7, days 8 to 14, days 15 to 21, and days 22 to 28) divided by the number of days with nonmissing scores for that week. If a subject reports fewer than 3 days of pain scores during a week, the weekly mean “pain right now” score will be set to missing. If there are >1 “pain right now” scores reported on the same day, then the average score on the day will be used to calculate weekly mean scores.
The baseline score will be the average of non-missing observations taken over the 7 days prior to first dose date.
Handling of missing data is described in detail in Section 8.2.
WOMAC: The WOMAC is a self-administered questionnaire used to assess subjects with OA of the hip or knee. The 24-hour, 0-4 categorical version (see Appendix J of the protocol) will be administered at each clinic visit (excluding the follow-up visit), and it will be used to monitor the course of the disease or to determine the effectiveness of medications. The following 3 subscales will be calculated and analyzed:
Pain Subscale (5 items: walking; stair climbing; nocturnal; at rest; weight bearing). The
pain subscale score will be obtained by adding the responses to questions 1-5. The score can range from 0-20.
Stiffness Subscale (2 items: morning stiffness; stiffness occurring later in the day). The
stiffness subscale score will be obtained by adding the responses to questions 6-7. The score can range from 0-8.
Physical Function Subscale (17 items: descending stairs; ascending stairs; rising from
sitting; standing; bending to floor; walking on flat; getting into or out of car; going shopping; putting on socks; rising from bed; taking off socks; lying in bed; sitting; getting into or out of the bathtub; getting on or off the toilet; heavy domestic duties; light domestic duties). The physical function subscale score will be obtained by adding the responses to questions 8-24. The score can range from 0-68.
Total score (24 items from pain, stiffness and physical function subscales). The total
score will be obtained by adding the response to questions 1 to 24.
Purdue Pharma LP
Protocol: VAN2001 Statistical Analysis Plan 2
SAP2 Final V1.0 Page 25 of 80 Version Date: 12JAN2018
A mean score will also be computed for the 3 subscales/scale by averaging the response to questions instead of summing them.
The questionnaire will be administered at visits 2 through 5.
The baseline subscales/scale will be defined as the score obtained at the randomization Visit 2 (day 1) prior to the first dose of the study drug.
Handling of missing data is described in detail in Section 8.2.
mBPI-SF Scores
The mBPI-SF (see protocol Appendix I) is a self-administered questionnaire used to assess the severity of pain, and the interference of pain on daily functions. It consists of 6 questions. Questions 1-4 ask the subjects to rate their severity of pain on a 0-10 numerical rating scale (NRS) for worst pain, least pain, average pain, and current pain. Question 5 asks subjects to rate their pain relief over the past 24 hours. Question 6 has 7 parts, all of which ask the subjects to rate the impact/interference of their pain on various functions, ie, general activity, mood, walking, normal work, relations with others, sleep, and enjoyment of life.
The severity of pain subscale will be computed as the mean of items 1-4. The interference of pain subscale will be computed as the mean of the sub-questions of item 6. Question 5, relief from pain, will be analyzed on its own.
The questionnaire will be administered at visits 2 through 5.
The baseline pain score will be defined as the score obtained at the randomization visit 2 (day 1) prior to the first dose of the study drug.
Handling of missing data is described in detail in Section 8.2.
Medical Outcomes Study 36-item Short-Form Health Survey (SF-36)
The SF-36 is a generic health survey with 36 items that measure functional health and well- being from the subject’s perspective (see Appendix L of the protocol). The 36 questions are grouped into 11 sections. Some of the sections consist of multiple questions. The survey is summarized into 8 dimensions/scales on a 0-100 scale:
Physical Functioning (PF) Role Physical (RP)
Purdue Pharma LP
Protocol: VAN2001 Statistical Analysis Plan 2
SAP2 Final V1.0 Page 26 of 80 Version Date: 12JAN2018
Bodily Pain (BP) General Health (GH) Vitality (VT) Social Functioning (SF) Role Emotional (RE) Mental Health (MH)
From these 8 dimensions, 2 components will be derived:
Physical component score Mental component score
The questionnaire will be administered visits 2 through 5. The baseline dimension/scale will be defined as the score obtained at the randomization Visit 2 (day 1) prior to the first dose of the study drug.
. EQ-5D-5L
EQ-5D-5L is a standardized generic measure of health status for clinical and economic appraisal (see Appendix K of the protocol). It is based on a descriptive system that defines health in terms of 5 dimensions who have 5 levels of severity (no problems, slight problems, moderate problems, severe problems, and extreme problems/unable to):
Mobility Self-care Usual activities Pain/discomfort Anxiety/Depression
It also includes a visual analogue scale (VAS) from 0 (“worst imaginable health state”) to 100 (“best imaginable health state”).
For each of the dimension the scores will be dichotomized into “no problems” (i.e. level 1) and “problems” (i.e. levels 2 to 5).
Purdue Pharma LP
Protocol: VAN2001 Statistical Analysis Plan 2
SAP2 Final V1.0 Page 27 of 80 Version Date: 12JAN2018
The U.S. population-based indez values based on crosswal value sets for EQ-5D-5L developed by EuroQoL Research Funcation (van Hout B et al. 2012) will be derived.
The baseline subscales will be defined as the score obtained at the randomization Visit 2 (day 1) prior to the first dose of the study drug.
The questionnaire will be administered visits 2 through 5.
Missing data will not be imputed.
PGIC Score
The PGIC (see protocol Appendix M) is a self-administered questionnaire which assesses the subject’s change in the overall status relative to the start of treatment. The scale has only 1 item, which measures global change of overall status (improvement or worsening) as evaluated by the subject on a 7-point scale from 1 to 7 (lower scores represent better outcomes). PGIC will be assessed at visit 5 (end of study/early discontinuation).
Missing data will not be imputed.
Supplemental Analgesic Medication Use
Commercially available APAP/acetaminophen 500mg, will be provided to subjects in bottles starting at visit 1. Prior to visit 1, subjects will provide their own supplemental analgesic medication (APAP).
For each visit (timepoint), starting at randomization visit 2, the total number of tablets taken will be calculated as the number of tablets given minus the number of tablets returned. The average daily number of tablets will be calculated by dividing the total number of tablets taken during the time interval by the number of days in the interval.
Due to the nature of the data, supplemental analgesic medication for OA tends to have a large proportion of zeros (contributed by subjects who do not take any supplemental analgesic medication) followed by continuous distribution of nonzero values. Therefore, the supplemental analgesic medication for OA will also be summarized categorically during the double-blind period. Preliminarily, the categories will be:
No supplemental actetaminophen tablets, 0 to 0.5 tablet,
Purdue Pharma LP
Protocol: VAN2001 Statistical Analysis Plan 2
SAP2 Final V1.0 Page 28 of 80 Version Date: 12JAN2018
> 0.5 to 1.0 tablet, >1.0 to 2.0 tablets, > 2.0 tablets.
Upon review of the blinded data prior to database lock, the categories will be reviewed and if any adjustments to the categories are deemed necessary, the rational and new categories will be documented in the SAP prior to database lock.
Missing supplemental medication data will not be imputed.
Responder to treatment
A subject’s response to treatment is defined as the percentage reduction from the the baseline “average pain over the last 24 hours” score to the week 4 pain score from the mBPI-SF pain severity subscale. For each subject, percentage reduction in pain from baseline through double-blind treatment will be calculated as:
%reduction = 100 * (baseline pain score – week 4 pain intensity score) / baseline pain score,
If a subject’s week 4 “average pain over the last 24 hours” score is greater than the baseline score, the subject will be assigned a 0% reduction in pain.
All subjects who discontinue study drug prior to week 4 will be considered nonresponders and will be assigned a 0% reduction in pain.
Responder analysis will be performed based on different cutoffs (<0, 0, >0, 10%, 20%, 30%, 40%, 50%, 60%, 70%, 80%, 90%, and =100%) for the percent reduction. Responders
are defined as having >0 % reduction, non-responders are defined as having <=0% reduction.
Purdue Pharma LP
Protocol: VAN2001 Statistical Analysis Plan 2
SAP2 Final V1.0 Page 29 of 80 Version Date: 12JAN2018
5.2. SAFETY VARIABLES
5.2.1. Adverse Events An adverse event (AE) is defined as any untoward medical occurrence in a patient or clinical investigation subject, regardless of whether administered any pharmaceutical product or placebo. An AE does not necessarily have a causal relationship with treatment.
Severity of AEs and will be described using the following categories: mild, moderate, and severe.
The relationship of an AE to study drug will be determined by the investigator/medically qualified designee (must be MD or DO) after thorough consideration of all facts that are available, and will be reported using the following categories: reasonable possibility and no reasonable possibility.
All AEs will be reported starting from the time an informed consent for study participation is provided.
AEs assessed as non-serious will be reported through the 7 days following the subject’s last study drug dose or until the last study visit, whichever is later. Non-serious AEs that are ongoing at the subject’s last study visit must be followed until resolution or for 30 days after the subject’s last study drug dose, whichever comes first.
All AEs must be evaluated as potential Serious Adverse Events (SAEs). A SAE is any untoward medical occurrence that at any dose:
Results in a fatality
Is life-threatening (i.e., the subject was at immediate risk of fatality from the AE as it
occurred. (This does not include an event that, had it occurred in a more severe form or was allowed to continue, might have caused death).
Requires inpatient hospitalization or prolongation of existing hospitalization
Results in persistent or significant disability/incapacity
Is a congenital anomaly/birth defect (in the child of a subject who was exposed to the
study drug) or
Purdue Pharma LP
Protocol: VAN2001 Statistical Analysis Plan 2
SAP2 Final V1.0 Page 30 of 80 Version Date: 12JAN2018
Is a medically important event or reaction. All SAEs must be reported starting from the time an informed consent for study participation is provided. If the Investigator becomes aware of an SAE within 30 days after the subject’s last study drug dose or study drug, or protocol-specified drug, or standard treatment, or within 30 days after the last study visit or follow-up phone call, the SAE must be reported. SAEs must be followed until the event resolves, the event or sequelae stabilize, or it is unlikely that additional information can be obtained after demonstration of due diligence with follow-up efforts (i.e., the subject or health care practioner is unable to provide additional information, or the subject is lost to follow up).
Treatment-emergent adverse events (TEAEs) will be assigned to study drug according to their onset date. TEAEs are defined as any sign or symptom that emerges during treatment, having been absent at pretreatment; or re-emerges during treatment, having been present at pretreatment but stopped prior to treatment; or worsens in severity during treatment relative to the pretreatment state, when the AE is continuous. In summary, adverse events that started on or after the first dose of double-blind study medication up to 7 days (30 days for SAE) after subject’s last dose are considered treatment-emergent. AEs that start more than 7 days (30 days for SAE) after the last dose of study drug will be considered non-TEAEs.
. Details on
summarizing treatment emergent and non-treatment emergent AEs are provided in Section 11.1.
For analysis purposes, a TEAE will be considered related to study drug if the investigator assess the relationship to study drug as a reasonable possibility.
Adverse events of special interest (AESI) will be recorded and reported on the AE of Special Interest Notifical Form. The following AESI will be considered:
Disturbances in thermal sensation, which may include:
o inhibition of thermal sensation and associated AEs such as thermal burns o heat sensitivity
Taste disturbance.
Purdue Pharma LP
Protocol: VAN2001 Statistical Analysis Plan 2
SAP2 Final V1.0 Page 31 of 80 Version Date: 12JAN2018
5.2.2. Clinical Laboratory Evaluations Blood and urine samples will be collected for chemistry, hematology, and urinalysis evaluation at Visit 1, 4, and 5. The clinical laboratory evaluations will be conducted by a central laboratory.
Some of blood/plasma and urine samples collected during the study may be used for future exploratory investigative studies, if and as necessary.
A serum pregnancy test will be performed for all female subjects at screening, and at end of study or early discontinuation as applicable. A urine pregnancy test will be performed for all female subjects prior to the first dose of the study drug and at each study visit.
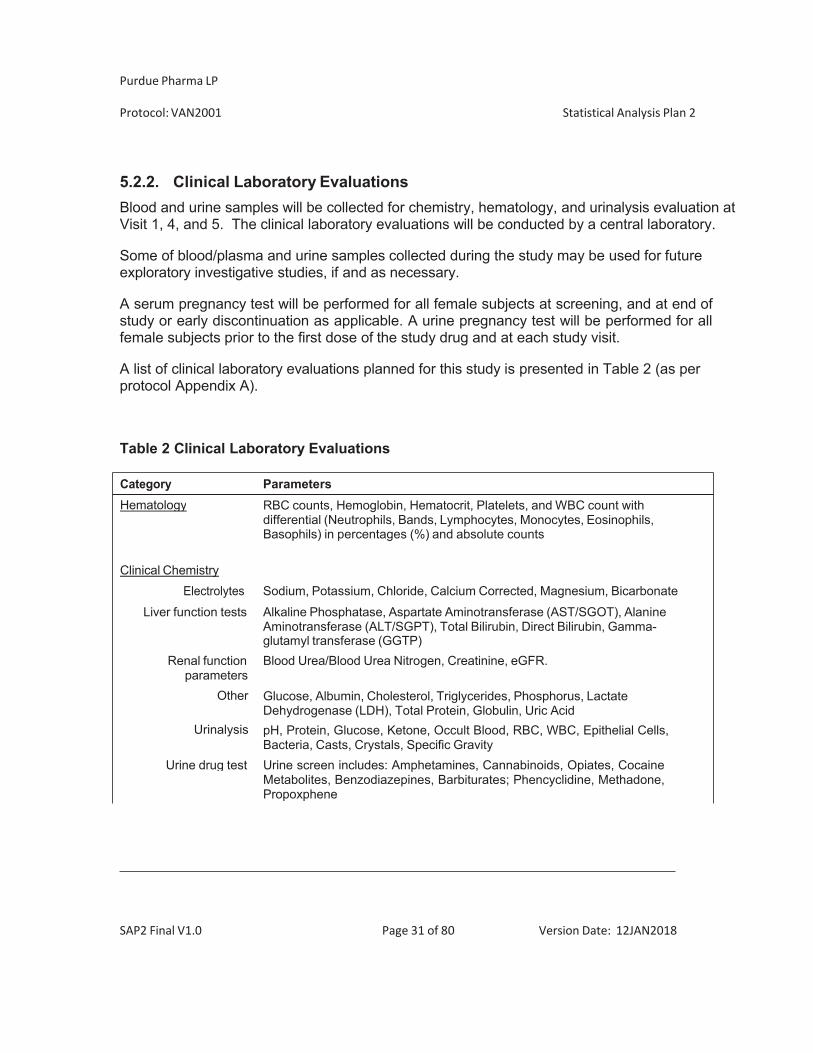
A list of clinical laboratory evaluations planned for this study is presented in Table 2 (as per protocol Appendix A).
Table 2 Clinical Laboratory Evaluations
Category Parameters
Hematology RBC counts, Hemoglobin, Hematocrit, Platelets, and WBC count with differential (Neutrophils, Bands, Lymphocytes, Monocytes, Eosinophils,Basophils) in percentages (%) and absolute counts
Clinical Chemistry Electrolytes Sodium, Potassium, Chloride, Calcium Corrected, Magnesium, Bicarbonate
Liver function tests Alkaline Phosphatase, Aspartate Aminotransferase (AST/SGOT), Alanine Aminotransferase (ALT/SGPT), Total Bilirubin, Direct Bilirubin, Gamma- glutamyl transferase (GGTP)
Renal function Blood Urea/Blood Urea Nitrogen, Creatinine, eGFR. parameters
Other
Urinalysis
Urine drug test
Glucose, Albumin, Cholesterol, Triglycerides, Phosphorus, Lactate Dehydrogenase (LDH), Total Protein, Globulin, Uric Acid pH, Protein, Glucose, Ketone, Occult Blood, RBC, WBC, Epithelial Cells,Bacteria, Casts, Crystals, Specific Gravity Urine screen includes: Amphetamines, Cannabinoids, Opiates, CocaineMetabolites, Benzodiazepines, Barbiturates; Phencyclidine, Methadone,Propoxphene
Purdue Pharma LP
Protocol: VAN2001 Statistical Analysis Plan 2
SAP2 Final V1.0 Page 32 of 80 Version Date: 12JAN2018
Serum pregnancy test Human Chorionic Gonadotropin (Choriogonadotropin Beta)
Category ParametersUrine pregnancy test Human Chorionic Gonadotropin (Choriogonadotropin Beta)
Virus screen Hepatitis B, Hepatitis C, Human Immunodeficiency Virus
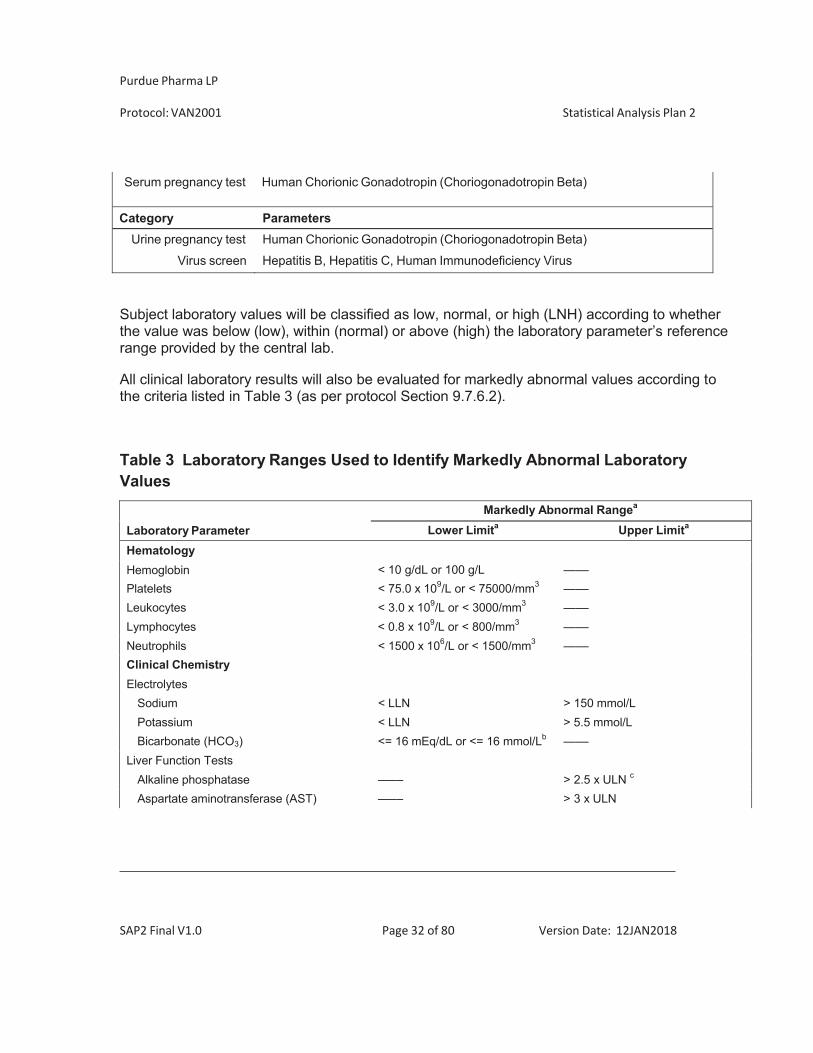
Subject laboratory values will be classified as low, normal, or high (LNH) according to whether the value was below (low), within (normal) or above (high) the laboratory parameter’s reference range provided by the central lab.
All clinical laboratory results will also be evaluated for markedly abnormal values according to the criteria listed in Table 3 (as per protocol Section 9.7.6.2).
Table 3 Laboratory Ranges Used to Identify Markedly Abnormal Laboratory Values
Laboratory ParameterMarkedly Abnormal Rangea
Lower Limita Upper Limita
Hematology< 10 g/dL or 100 g/L —––Hemoglobin
Platelets < 75.0 x 10⁹/L or < 75000/mm3 —––Leukocytes < 3.0 x 10⁹/L or < 3000/mm3 —––Lymphocytes < 0.8 x 10⁹/L or < 800/mm3 —––Neutrophils < 1500 x 106/L or < 1500/mm3 —––Clinical ChemistryElectrolytes
Sodium < LLN > 150 mmol/LPotassium < LLN > 5.5 mmol/LBicarbonate (HCO3) <= 16 mEq/dL or <= 16 mmol/Lb —––
Liver Function TestsAlkaline phosphatase —–– > 2.5 x ULN c
Aspartate aminotransferase (AST) —–– > 3 x ULN
Purdue Pharma LP
Protocol: VAN2001 Statistical Analysis Plan 2
SAP2 Final V1.0 Page 33 of 80 Version Date: 12JAN2018
Laboratory ParameterMarkedly Abnormal Rangea
Lower Limita Upper Limita
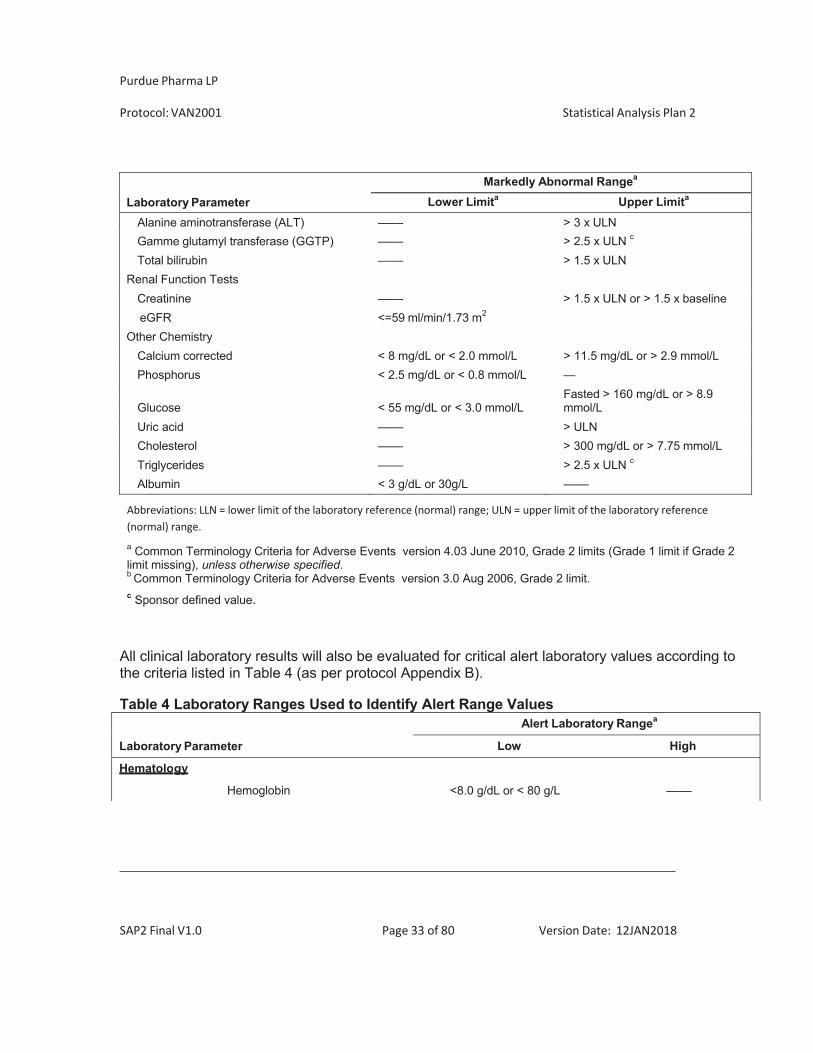
Alanine aminotransferase (ALT) —–– > 3 x ULNGamme glutamyl transferase (GGTP) —–– > 2.5 x ULN c
Total bilirubin —–– > 1.5 x ULNRenal Function Tests
Creatinine —–– > 1.5 x ULN or > 1.5 x baselineeGFR <=59 ml/min/1.73 m2
Other ChemistryCalcium corrected < 8 mg/dL or < 2.0 mmol/L > 11.5 mg/dL or > 2.9 mmol/LPhosphorus < 2.5 mg/dL or < 0.8 mmol/L —
Fasted > 160 mg/dL or > 8.9Glucose < 55 mg/dL or < 3.0 mmol/L mmol/LUric acid —–– > ULNCholesterol —–– > 300 mg/dL or > 7.75 mmol/LTriglycerides —–– > 2.5 x ULN c
Albumin < 3 g/dL or 30g/L —––
Abbreviations: LLN = lower limit of the laboratory reference (normal) range; ULN = upper limit of the laboratory reference(normal) range.a Common Terminology Criteria for Adverse Events version 4.03 June 2010, Grade 2 limits (Grade 1 limit if Grade 2 limit missing), unless otherwise specified. b Common Terminology Criteria for Adverse Events version 3.0 Aug 2006, Grade 2 limit. c Sponsor defined value.
All clinical laboratory results will also be evaluated for critical alert laboratory values according to the criteria listed in Table 4 (as per protocol Appendix B).
Table 4 Laboratory Ranges Used to Identify Alert Range Values
Laboratory Parameter
Alert Laboratory Rangea
Low High
Hematology
Hemoglobin <8.0 g/dL or < 80 g/L —––
Purdue Pharma LP
Protocol: VAN2001 Statistical Analysis Plan 2
SAP2 Final V1.0 Page 34 of 80 Version Date: 12JAN2018
Chemistry
Electrolytes
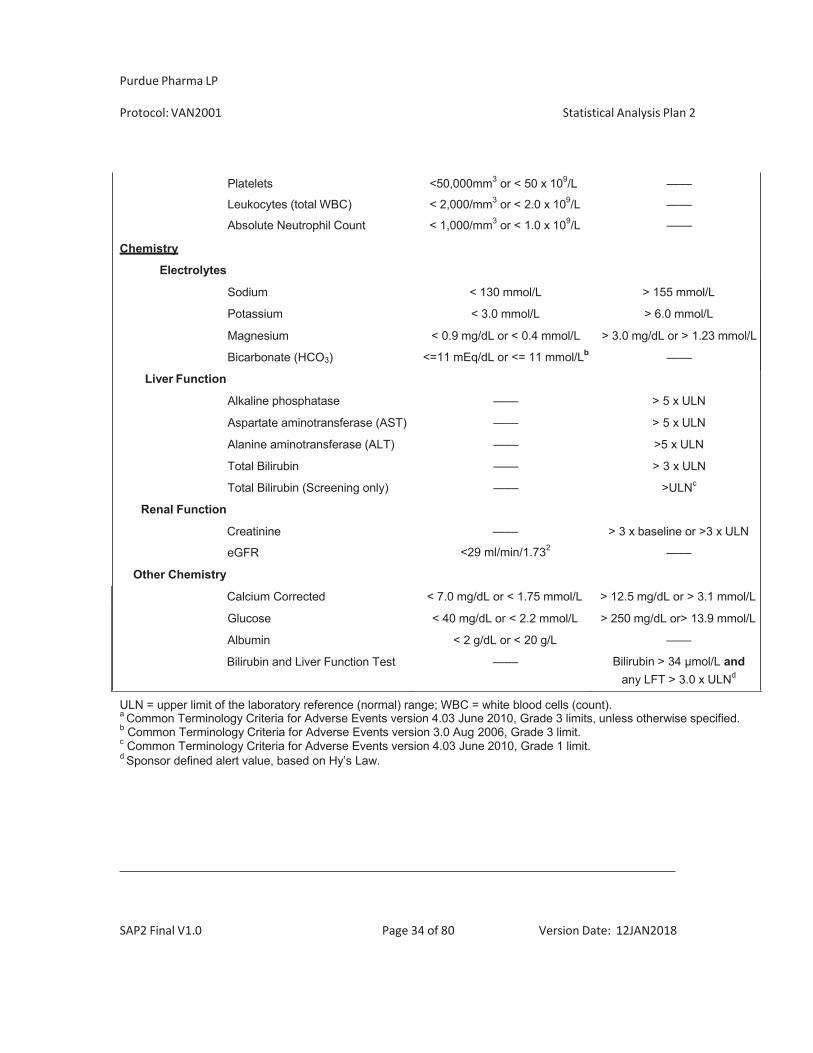
Platelets <50,000mm3 or < 50 x 109/L —––
Leukocytes (total WBC) < 2,000/mm3 or < 2.0 x 10⁹/L —––
Absolute Neutrophil Count < 1,000/mm3 or < 1.0 x 10⁹/L —––
Sodium < 130 mmol/L > 155 mmol/L
Potassium < 3.0 mmol/L > 6.0 mmol/L
Magnesium
Bicarbonate (HCO3)
< 0.9 mg/dL or < 0.4 mmol/L
<=11 mEq/dL or <= 11 mmol/Lb
> 3.0 mg/dL or > 1.23 mmol/L
—––
Liver Function
Alkaline phosphatase —–– > 5 x ULN
Aspartate aminotransferase (AST) —–– > 5 x ULN
Alanine aminotransferase (ALT) —–– >5 x ULN
Total Bilirubin
Total Bilirubin (Screening only)
—––
—––
> 3 x ULN
>ULNc
Renal Function
Creatinine
eGFR
—––
<29 ml/min/1.732
> 3 x baseline or >3 x ULN
—––
Other Chemistry
Calcium Corrected < 7.0 mg/dL or < 1.75 mmol/L > 12.5 mg/dL or > 3.1 mmol/L
Glucose < 40 mg/dL or < 2.2 mmol/L > 250 mg/dL or> 13.9 mmol/L
Albumin < 2 g/dL or < 20 g/L —––
Bilirubin and Liver Function Test —–– Bilirubin > 34 mol/L and any LFT > 3.0 x ULNd
ULN = upper limit of the laboratory reference (normal) range; WBC = white blood cells (count). a Common Terminology Criteria for Adverse Events version 4.03 June 2010, Grade 3 limits, unless otherwise specified. b Common Terminology Criteria for Adverse Events version 3.0 Aug 2006, Grade 3 limit. c Common Terminology Criteria for Adverse Events version 4.03 June 2010, Grade 1 limit. d Sponsor defined alert value, based on Hy’s Law.
Purdue Pharma LP
Protocol: VAN2001 Statistical Analysis Plan 2
SAP2 Final V1.0 Page 35 of 80 Version Date: 12JAN2018
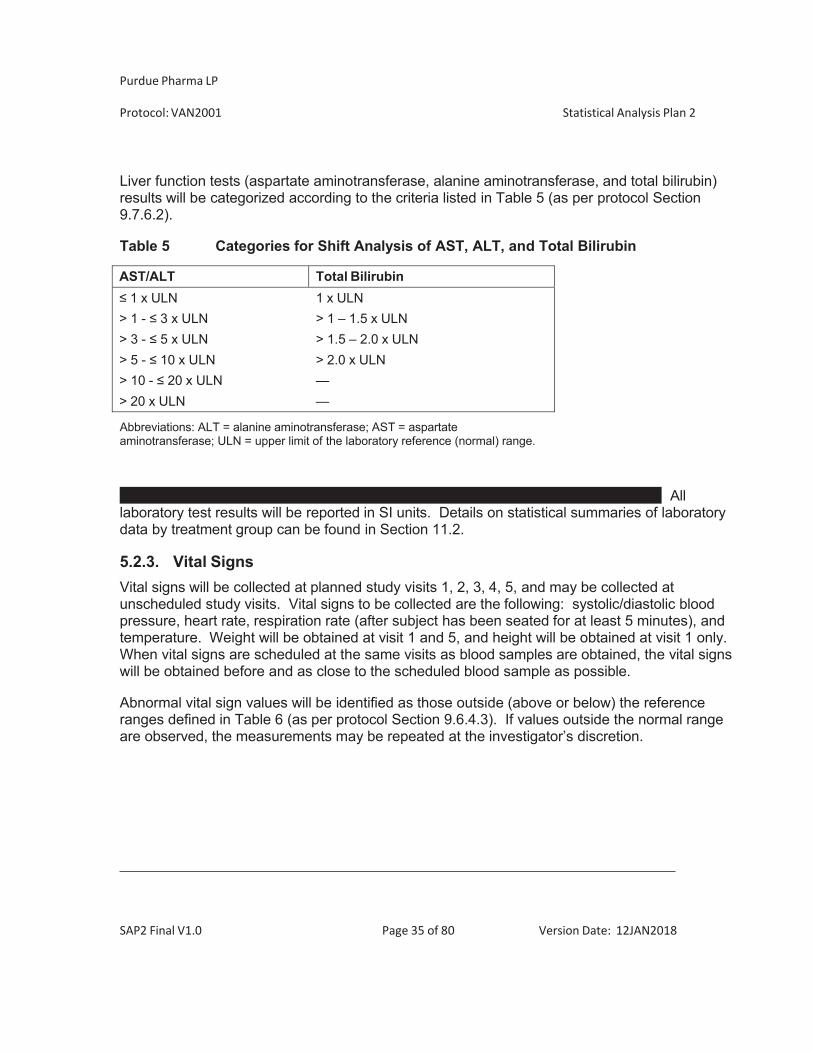
Liver function tests (aspartate aminotransferase, alanine aminotransferase, and total bilirubin) results will be categorized according to the criteria listed in Table 5 (as per protocol Section 9.7.6.2).
Table 5 Categories for Shift Analysis of AST, ALT, and Total Bilirubin
AST/ALT Total Bilirubin 1 x ULN 1 x ULN
> 1 - 3 x ULN > 1 – 1.5 x ULN > 3 - 5 x ULN > 1.5 – 2.0 x ULN > 5 - 10 x ULN > 2.0 x ULN > 10 - 20 x ULN — > 20 x ULN —
Abbreviations: ALT = alanine aminotransferase; AST = aspartate aminotransferase; ULN = upper limit of the laboratory reference (normal) range.
All laboratory test results will be reported in SI units. Details on statistical summaries of laboratory data by treatment group can be found in Section 11.2.
5.2.3. Vital Signs Vital signs will be collected at planned study visits 1, 2, 3, 4, 5, and may be collected at unscheduled study visits. Vital signs to be collected are the following: systolic/diastolic blood pressure, heart rate, respiration rate (after subject has been seated for at least 5 minutes), and temperature. Weight will be obtained at visit 1 and 5, and height will be obtained at visit 1 only. When vital signs are scheduled at the same visits as blood samples are obtained, the vital signs will be obtained before and as close to the scheduled blood sample as possible.
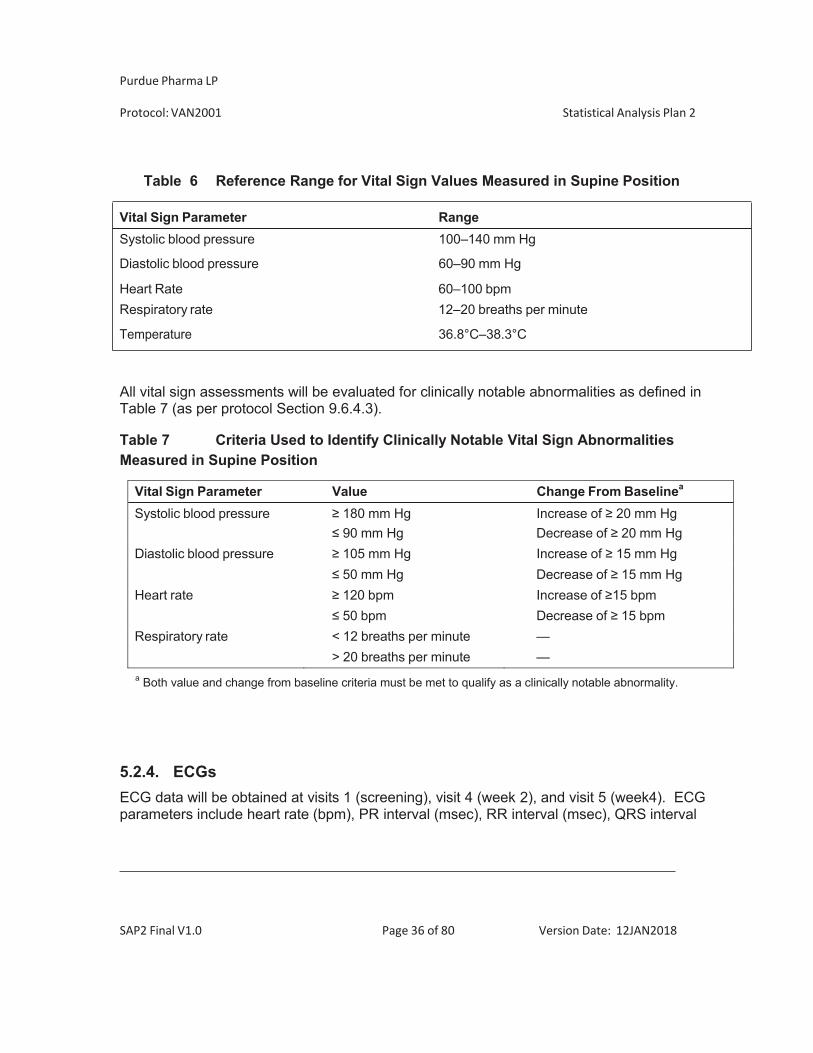
Abnormal vital sign values will be identified as those outside (above or below) the reference ranges defined in Table 6 (as per protocol Section 9.6.4.3). If values outside the normal range are observed, the measurements may be repeated at the investigator’s discretion.
Purdue Pharma LP
Protocol: VAN2001 Statistical Analysis Plan 2
SAP2 Final V1.0 Page 36 of 80 Version Date: 12JAN2018
Table 6 Reference Range for Vital Sign Values Measured in Supine Position
All vital sign assessments will be evaluated for clinically notable abnormalities as defined in Table 7 (as per protocol Section 9.6.4.3).
Table 7 Criteria Used to Identify Clinically Notable Vital Sign Abnormalities Measured in Supine Position
Vital Sign Parameter Value Change From Baselinea
Systolic blood pressure 180 mm Hg Increase of 20 mm Hg 90 mm Hg Decrease of 20 mm Hg
Diastolic blood pressure 105 mm Hg Increase of 15 mm Hg 50 mm Hg Decrease of 15 mm Hg
Heart rate 120 bpm Increase of 15 bpm 50 bpm Decrease of 15 bpm
Respiratory rate < 12 breaths per minute —> 20 breaths per minute —
a Both value and change from baseline criteria must be met to qualify as a clinically notable abnormality.
5.2.4. ECGs ECG data will be obtained at visits 1 (screening), visit 4 (week 2), and visit 5 (week4). ECG parameters include heart rate (bpm), PR interval (msec), RR interval (msec), QRS interval
Vital Sign Parameter Range Systolic blood pressure 100–140 mm Hg
Diastolic blood pressure 60–90 mm Hg
Heart Rate 60–100 bpm Respiratory rate 12–20 breaths per minute
Temperature 36.8°C–38.3°C
Purdue Pharma LP
Protocol: VAN2001 Statistical Analysis Plan 2
SAP2 Final V1.0 Page 37 of 80 Version Date: 12JAN2018
(msec), uncorrected QT interval (msec), QTcB (Bazett’s correction) interval (msec), and QTcF (Fridericia’s correction) interval (msec). The results of the 12-lead ECG will be transmitted to the central ECG provided for interpretation and will be evaluated by the investigator for clinical significance.
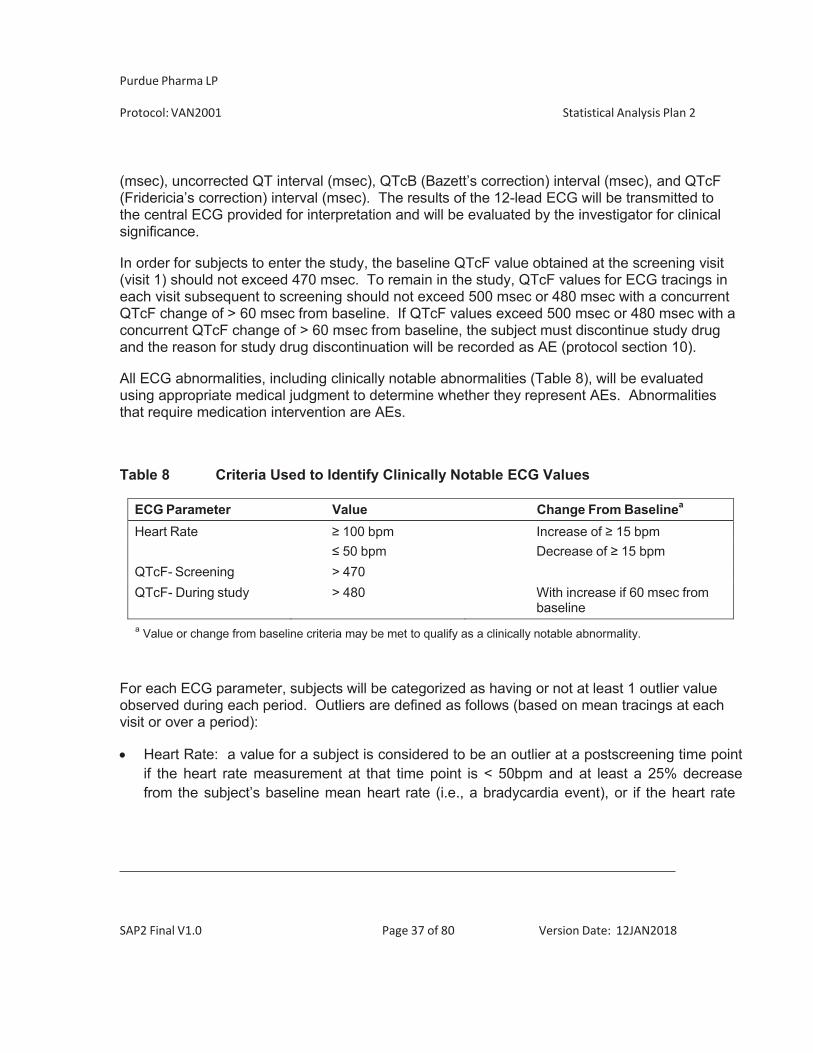
In order for subjects to enter the study, the baseline QTcF value obtained at the screening visit (visit 1) should not exceed 470 msec. To remain in the study, QTcF values for ECG tracings in each visit subsequent to screening should not exceed 500 msec or 480 msec with a concurrent QTcF change of > 60 msec from baseline. If QTcF values exceed 500 msec or 480 msec with a concurrent QTcF change of > 60 msec from baseline, the subject must discontinue study drug and the reason for study drug discontinuation will be recorded as AE (protocol section 10).
All ECG abnormalities, including clinically notable abnormalities (Table 8), will be evaluated using appropriate medical judgment to determine whether they represent AEs. Abnormalities that require medication intervention are AEs.
Table 8 Criteria Used to Identify Clinically Notable ECG Values
ECG Parameter Value Change From Baselinea
Heart Rate 100 bpm Increase of 15 bpm 50 bpm Decrease of 15 bpm
QTcF- Screening > 470QTcF- During study > 480 With increase if 60 msec from
baselinea Value or change from baseline criteria may be met to qualify as a clinically notable abnormality.
For each ECG parameter, subjects will be categorized as having or not at least 1 outlier value observed during each period. Outliers are defined as follows (based on mean tracings at each visit or over a period):
Heart Rate: a value for a subject is considered to be an outlier at a postscreening time point
if the heart rate measurement at that time point is < 50bpm and at least a 25% decrease from the subject’s baseline mean heart rate (i.e., a bradycardia event), or if the heart rate
Purdue Pharma LP
Protocol: VAN2001 Statistical Analysis Plan 2
SAP2 Final V1.0 Page 38 of 80 Version Date: 12JAN2018
measurement at the postscreening time point is > 100 bpm and at least a 25% increase from the baseline mean heart rate (i.e., a tachycardia event).
PR interval: a value for a subject is considered to be an outlier at a postscreening time point if the PR interval from the ECG at the postscreening time point is > 200 msec and at least a 25% increase from the subject’s baseline mean PR interval.
QRS interval: a value for a subject is considered to be an outlier at a postscreening time point if the QRS interval from the ECG at the postscreening time point is > 100 msec and at least a 25% increase from the subject’s baseline mean QRS interval.
QT interval: a value for a subject is considered to be an outlier at a postscreening time point if the QT interval from the ECG at the postscreening time point is > 450 msec, and the subject’s baseline mean QT interval is > 450 msec.
QTcF: a value for a subject is considered to be an outlier at a postscreening time point if the QTcF interval from the ECG at the postscreening time point is > 450 msec, and the subject’s baseline mean QTcF interval is 450 msec.
ECG morphology findings consist of the following: Abnormal U wave
Atrial fibrillation Right bundle branch block (RBBB) Left bundle branch block (LBBB) Left anterior hemiblock (LAH) Myocardial infarction (MI) ST depression T wave (biphasic and/or inverted).
For each of the of the findings listed above, a subject will be categorized as having the specific treatment-emergent ECG abnormality if it is observed in at least 1 postscreening period ECG morphologic determination, but is absent from all screening baseline results.
Purdue Pharma LP
Protocol: VAN2001 Statistical Analysis Plan 2
SAP2 Final V1.0 Page 39 of 80 Version Date: 12JAN2018
5.2.5. Physical Examination Physical examination will be performed at visit 1 (screening), visit 2 (Day 1), visit 3 (week 1), visit 4 (week 2), and visit 5 (week 4).
5.2.6. Other Safety Assessments HADS questionnaire
The HADS (see protocol Appendix H) is a self-screening questionnaire that is commonly used by physicians and therapists to assess levels of anxiety and depression. The HADS is a self- reported 14-item instrument that measures the presence and severity of anxiety and depression based on the subject’s experience over the past week. It consists of 2 subscales, each having 7 items (range 0-3): an anxiety subscale (HADS-A) and a depression subscale (HADS-D). The 2 subscales, anxiety and depression, have been found to be independent measures. The score for each subscale ranges from 0 (no anxiety or depression) to 21, with a score of 12 or higher indicating the probable presence of the mood disorder. Subjects with score > 12 at screening visit do not qualify for this study.
The HADS questionnaire will be administered at visit 1 (screening) as well as visit 5 (week 4).
To obtain the anxiety score at a given visit add up all the answers to the odd-numbered questions, wheareas to obtain the depression score add up all the answers to the even- numbered questions. Since questions are asked in a positive/negative way, see Protocol Appendix H for the scoring of each item as the first answer may be worth 0, 1, 2 or 3 points. Missing scores will be imputed as described in Section 8.2.
Kellgren-Lawrence (K-L)
The K-L criteria (see protocol Appendix G) are used to classify the severity of knee osteoarthritis. It consists of 5 grades (ranging from grade 0 = no radiographic features of OA to grade 4= severe OA with large osteophytes, marked narrowing of the joint space, severe sclerosis, and definite deformity of the bone ends). The K-L will be performed at visit 1 (screening) and visit 5 (week 4). Subjects meeting K-L criteria 0, 1, or 4 do not qualify for this study.
Since the goal of using this scale is to distinguish definite mild/moderate OA (K-L grades 2) from none, the original version (Kellgren & Lawrence 1957) will be used in this study.
Purdue Pharma LP
Protocol: VAN2001 Statistical Analysis Plan 2
SAP2 Final V1.0 Page 40 of 80 Version Date: 12JAN2018
Columbia-Suicide Severity Rating Score (C-SSRS)
The C-SSRS scale (Protocol Appendix O) consists of a baseline/screening evaluation that assessed the lifetime and prior 24 month experience of the subject with suicide events and suicidal ideation and a post baseline ”Since Last Visit” evaluation that focuses on suicidality since the last study visit. The C-SSRS is a prospective assessment instrument that directly classifies suicidal ideation and behavior into categories. The C-SSRS involves a series of probing questions to inquire about possible suicidal thinking and behavior.
5.3. ADDITIONAL VARIABLES
5.3.1. PK and PG Variables PK and PG analyses will be described in separate documents and will be presented in separate reports.
5.3.2. Chemotherapy-induced Taste Alteration Scale (CiTAS) Subjects will rate their evaluation of taste alterations for the 18 items and 5 subscales on the CiTAS, a 5-point Likert-type scale (Protocol Appendix P). The scores received from each subscale will be evaluated rather than the total score received from the entire scale. The subscale scores will be obtained by dividing the number of the items into the sum of scores of those items as follows:
Decline in basic taste: add up score from question 2 to question 6, and divite it by 5.
Discomfort: add up score from question 13 to question 18, and divide it by 6.
Phantogeusia and parageusia: add up score from question 10 to question 12, and
divide it by 3.
General taste alterations: add up score from question 1 and question 7 to question 9, and divide it by 4.
The maximum score is 5 ppints, whereas the minimum score is 1 point that can be received from subscales.
Purdue Pharma LP
Protocol: VAN2001 Statistical Analysis Plan 2
SAP2 Final V1.0 Page 41 of 80 Version Date: 12JAN2018
6. SAMPLE SIZE DETERMINATION
A total of up to 276 subjects is planned to be randomized to the double-blind period of this study using a 1:1:1:1 randomization ratio; ie, approximately 69 subjects are to be randomized to each of the 4 treatment groups (V120083 [60 mg or 30 mg], naproxen [active comparator], or placebo). The actual number of subjects treated will depend on the outcome of the interim analysis.
The analgesic effect size of V120083 is unknown. Therefore, the sample size calculation is based on a clinically important difference for OA pain reduction of 1 unit on an 11-point NRS (0 to 10).
This study may provide appropriate information for the data variability in the sample size calculations. The SD for average pain over the last 24 hours, an individual question of the mBPI-SF at week 4 was approximately 2.34. With a fixed sample size study design, the sample size needed for 80% power to detect this difference with a significance level of 0.05 (1-sided) is 69 subjects per arm, assuming a 1:1 randomization ratio of each active arm to placebo. The sample size calculation was performed in nQuery+nTerim 3.0.
7. ANALYSIS POPULATIONS
If there is at least one subject for whom planned/randomized treatment is not the same as the actual treatment received, all safety displays will use the actual treatment received, and all efficacy displays will use the planned/randomized treatment.
7.1. ENROLLEDPOPULATION
The enrolled population consists of all subjects who signed the informed consent form. 7.2. SAFETY POPULATION
The safety population consists of subjects who were randomized and received at least 1 dose of the double-blind study drug. Subjects will be analyzed according to the treatment they received. The safety population will be used to analyze all safety endpoints.
Purdue Pharma LP
Protocol: VAN2001 Statistical Analysis Plan 2
SAP2 Final V1.0 Page 42 of 80 Version Date: 12JAN2018
7.3. FULL ANALYSIS POPULATION
The full analysis population consists of subjects who were randomized and received at least 1 dose of the double-blind study drug, and have at least 1 efficacy assessment. This population will be used to analyze all efficacy endpoints, unless otherwise stated. Following the intention- to-treat principle, data from subjects in this population will be analyzed according to their randomized treatment.
7.4. PER PROTOCOL POPULATION
The per protocol population consists of subjects in the full analysis population without any major protocol deviations. Major protocol deviations will be defined prior to database lock. Per protocol population will be used for supportive analysis to assess robustness of the primary analysis.
7.5. PROTOCOL DEVIATIONS
Protocol deviations will be identified in two ways: programmatically and through monitoring reviews. The deviations identified through monitoring are classified according to the 9 categories listed below and will be assigned a severity flag (major/minor) according to pre- specified rules.
1. Informed consent 2. Eligibility and Entry Criteria 3. Prohibited Medication 4. Laboratory Assessment Criteria 5. Study procedure Criteria 6. Visit Scheduled Criteria 7. IP Compliance 8. Rescue Medication 9. Other Criteria
Some of these deviations are considered major from an operations perspective but may not affect the efficacy evaluations. Therefore, for purposes of analysis, the monitoring flag will not
Purdue Pharma LP
Protocol: VAN2001 Statistical Analysis Plan 2
SAP2 Final V1.0 Page 43 of 80 Version Date: 12JAN2018
be used, although the classification of deviations as major or minor will be retained in the listings. All programmed deviations defined below, are affecting the efficacy evaluations and therefore lead to the exclusion of subjects from the per-protocol population:
1) Known protocol deviations identified from the subject qualification CRF and/or
inclusion/exclusion entry criteria.
2) Non-randomized subject who received study medication or subject who received wrong study medication, as per the randomization list.
3) Subjects who discontinued before the end of the study. Even if protocol allows for early
discontinuation, this has a major impact on the primary efficacy endpoint (“average pain over the last 24 hours” at week 4).
4) Prohibited prior, concomitant, or supplemental medication deviations.
5) Overall study drug compliance < 80% or >120% for the active treatment or for both
tablets and capsules for the placebo group.
6) Missing “average pain over the last 24 hours” at week 4. 8. GENERAL STATISTICAL CONSIDERATIONS
8.1. ADJUSTMENTS FOR COVARIATES
Details of adjustments for covariates for the efficacy variables and the definition of these covariates are detailed in Sections 10.1 and 10.2. For each primary and secondary efficacy variable analyzed using MMRM, the baseline values will be included as covariates in the model.
Exploratory/subgroup analyses with adjustment for covariates may be performed for further scientific interest in order to look for explanatory variables related to the occurrence of primary safety and efficacy endpoints. Models predicting study endpoints may be developed with potential covariates inclusion in the analysis. The covariates will be chosen and pre-specified from among the baseline and demographic variables.
Purdue Pharma LP
Protocol: VAN2001 Statistical Analysis Plan 2
SAP2 Final V1.0 Page 44 of 80 Version Date: 12JAN2018
8.2. HANDLING OF DROPOUTS OR MISSING DATA
Weekly “average pain over the last 24 hours”:
If more than 3 scores are missing in the “average pain over the last 24-hours” then the resulting average will be treated as missing.
Weekly average “daily pain right now”:
If more than 3 scores are missing in the “pain right now” then the resulting average will be treated as missing.
WOMAC:
Pain subscale: Calculated by summing items 1-5. If 2 or more pain scores are missing, then the pain subscale will be set to missing; otherwise, the average multiplied by 5 of the nonmissing pain scores will be used for the missing pain scores.
Stiffness Subscale: Calculated by summing items 6-7. If both stiffness scores are missing, then the stiffness subscale will be set to missing. If 1 stiffness score is missing, then the nonmissing stiffness score will be multiplied by 2 for the analysis.
Physical Function Subscale: This scale is calculated by summing items 8-24. If 4 or more physical functioning scores are missing, then the physical functioning subscale will be set to missing; otherwise, the average multiplied by 17of the nonmissing physical function scores will be used for the missing physical functioning scores.
Composite Scale: Calculated by summing 3 subscales: (pain subscale + stiffness subscale + physical functioning subscales). If 1 or more of the subscales is missing, then the composite scale will be set to missing.
The mean subscales/scale will be imputed the same way as the sum subscales/scale. mBPI-SF:
If more than half of the items in either the severity of pain subscale ( 3) or the interference of pain subscale ( 4) are missing, then the resulting subscale score will be treated as missing. Otherwise, if half the items or less in a particular subscale are missing, then for the purpose of
Purdue Pharma LP
Protocol: VAN2001 Statistical Analysis Plan 2
SAP2 Final V1.0 Page 45 of 80 Version Date: 12JAN2018
computing the subscale score, the item’s scoring value will be imputed by the mean score from the other items within the subscale.
PGIC:
No imputation will be done for the PGIC. Supplemental Medication use:
No imputation will be done for the analysis of supplemental medication use. HADS:
If more than 1 item in either the anxiety subscale or the depression subscale are missing, then the resulting subscale score will be treated as missing. Otherwise, if 1 item or less in a particular subscale is missing, then for the purpose of computing the subscale score, the item’s scoring value will be imputed by the mean score from the other items within the subscale.
Columbia-Suicide Severity Rating Score (C-SSRS):
No imputation will be done for the C-SSRS. 8.3. INTERIM ANALYSES AND DATA MONITORING
An interim analysis may be conducted when approximately 50% of randomized subjects have completed the end-of-study visit. The unblinded interim analyses will be performed by an unblinded statistical team, which includes a statistician and programmers not associated with the study team. The unblinded statistical team will provide partially unblinded tables to the reviewers, by partially unblinded tables it is meant that instead of having the treatment names on each column, it will be presented as “Treatment A”, “Treatment B”, etc. The unblinded
Purdue Pharma LP
Protocol: VAN2001 Statistical Analysis Plan 2
SAP2 Final V1.0 Page 46 of 80 Version Date: 12JAN2018
statistician will provide the unblinded treatment information to the DMC members only if requested. The data review will be performed by an independent data monitoring committee. Additional data reviews may be conducted as deemed necessary. The sponsor may request additional (ad hoc) DMC recommendations throughout the study.
At the interim analysis, the following procedures will be performed:
1) Safety evaluation for early termination will be performed when 50% of subjects have
completed the study. The independent statistician/programmer will provide safety data listing and summary tables by partially unblinded treatment groups. The DMC members will review the safety data, including but not limited to AEs, clinical laboratory values, C- SSRS listing, ECGs and Chemotherapy-induced Taste Alteration Scale (CiTAS). The decision to stop 1 or more treatment groups due to safety issues will be made based on clinical judgment. The arm will be stopped if there is significant physical toxicity or evidence of impending risk of physiologic harm or extremely abnormal laboratory findings related to treatment.
2) Futility evaluation for V120083 treatment arms will be performed by the independent
statistician/programmer when 50% of subjects have completed the study. The 50% interim analysis will be performed to evaluate the futility of each dose of study drug in the study population on the primary efficacy parameter. The DMC will review the results of the analysis and make recommendations, based on the pre-specified futility stopping criteria, regarding plans for further studies. The unblinded biostatistician will also pass unblinded conditional powers and relevant efficacy summary outputs to Internal DMC members for reviewing the results of futility analysis. Only the conditional power will be provided, no p-values, no confidence intervals will be presented for the primary efficacy parameter. No summaries on other efficacy parameters will be provided. Please refer to DMC charter for the appointed internal DMC members and the procedures to ensure the integrity of blinding.
3) Futility stopping criteria: Stop the trial if the conditional powers of both V120083 30 mg
BID and 60 mg BID groups fall below the value of 0.2. The conditional power is based on one-sided test (Type I Error Rate = 10%).
Lan et all (1982) introduced stochastic curtailment to stop a trial if, given current data, it is likely to predict the outcome of the trial with high probability. The conditional power at the scheduled end of the study, given the observed data at the interim evaluation, will be calculated with a stochastic curtailment approach to support the decision of early termination for futility. SAS 9.2
Purdue Pharma LP
Protocol: VAN2001 Statistical Analysis Plan 2
SAP2 Final V1.0 Page 47 of 80 Version Date: 12JAN2018
PROC SEQTEST will be used to calculate the conditional power based on the formula given by Cui et al and Emerson et al (2005, p.13)..
An external data monitoring board will be used for this study.
An Interim Analysis charter, including more administrative details, will be written and approved before the interim analysis.
8.4. MULTI-CENTER STUDIES
All investigative sites within a US census region (West, Midwest, Northeast and South) with fewer than 8 randomized subjects will be combined into a single pooled site for analysis purposes. If a resulting pooled site still has fewer than 8 randomized subjects, then this pooled site will be further combined with the smallest unpooled site within that region. If there is not another unpooled site within that region, then the pooled site will be combined with the smallest pooled site from another region. This pooling process will continue until there are at least 8 randomized subjects in each pooled site.
Detailed steps: 1. All sites within a US census region with fewer than 8 subjects will be combined into a
single pooled site. If a resulting pooled site still has fewer than 8 subjects, then proceed to the next step.
2. The pooled site (<8) will be further combined with the smallest unpooled site within that region. If there is not another unpooled site within that region, then proceed to the next step.
a. If several unpooled sites within the region have the smallest subjects (tie), the preference is to select the unpooled site that is the closest to the site in distance.
b. If there are still more than one unpooled site within the region after evaluating the distance, an unpooled site will be selected randomly to combine with the pooled site (<8) from step 1.
3. The pooled site will be combined with the smallest pooled site from another region.
Purdue Pharma LP
Protocol: VAN2001 Statistical Analysis Plan 2
SAP2 Final V1.0 Page 48 of 80 Version Date: 12JAN2018
If some sites are very small, per ICH guidance (E9 section 3.2), a graphical exploration of the homogeneity of treatment effects across sites will be provided for the primary efficacy variable if appropriate.
8.5. MULTIPLE COMPARISONS / MULTIPLICITY
No multiplicity adjustment will be performed for this study. 8.6. EXAMINATION OF SUBGROUPS
No formal subgroup analyses are planned for efficacy and safety variables. 9. STUDY POPULATION CHARACTERISTICS
9.1. SUBJECT DISPOSITION
Subject disposition will be summarized for the screening period for all subjects in the enrolled population and by treatment groups for the double-blind period in the safety population.
The number and percentage of subjects who completed, and the number and percentage of subjects who discontinued, along with the distribution of the reasons for discontinuation will be presented for all enrolled subjects during the screening period and for all randomized subjects in the safety population. Additionally, there will be a cumulative display of subject disposition and reason for discontinuation of the study drug by double-blind visit for the safety population.
The number and percent of subjects in each analysis population will be presented. All disposition data will be presented in data listings.
9.2. MAJOR PROTOCOL DEVIATIONS
All protocol deviations (see section 7.5) will be listed. The listing will include an indicator for major/minor deviations.
Major protocol deviations will be summarized using counts and percentages for the safety population during the double-blind period.
Purdue Pharma LP
Protocol: VAN2001 Statistical Analysis Plan 2
SAP2 Final V1.0 Page 49 of 80 Version Date: 12JAN2018
9.3. DEMOGRAPHICS AND BASELINE CHARACTERISTICS
The continuous demographic/baseline variables (e.g.: age, weight, height, BMI, “average pain over the last 24 hours” (baseline value and screening value that qualifies subject), and WOMAC [pain subscale, stiffness subscale, physical function subscale, and composite scale]) will be summarized using mean, median, standard deviation, minimum, and maximum values. For categorical (nominal) variables (e.g., age group, gender, race, ethnicity, stratified baseline pan score [moderate or severe], and Kellgren-Lawrence grade), the number and percentage of subjects will be used.
BMI (kg/cm2) will be calculated as baseline (weight (kg)/[screening height(cm)/100]2).
Demographic/baseline variables will be summarized by treatment group for the subjects in the safety population. Demographic/baseline variables will also be summarized by subjects who completed the study and those who discontinued for the safety population. All demographic and baseline characteristic data will be listed.
9.4. DOSING AND EXTENT OF EXPOSURE
The double-blind period begins on the day the fist double-blind study drug is administered. The number and percentage of subjects exposed to double-blind treatment for overlapping time intervals (e.g.: any exposure, 1 week, 2 weeks, 4 weeks) in the double-blind period will be calculated by treatment group for the safety population. Descriptive statistics (mean, standard error, median, minimum, and maximum) will be provided to summarize the length of exposure (in days) to each treatment .
Exposure (days) = last dose date minus first dose date of study medication + 1
A data listing of the study drug dosage administered to each subject during the double-blind period as well as the number of capsules dispensed and returned for each patient and visit will be provided.
Time to discontinuation of double-blind study drug is equal to the exposure (days) defined above. Subjects who completed the study are censored at the time of their last dose. A figure using the Kaplan-Meier method will be used to estimate the distribution of the time to discontinuation.
Compliance will be calculated using this formula:
Purdue Pharma LP
Protocol: VAN2001 Statistical Analysis Plan 2
SAP2 Final V1.0 Page 50 of 80 Version Date: 12JAN2018
(Total number of capsules dispensed – total number of capsules returned) X 100
Expected number of capsules to be taken The expected number of capsules to be taken is based on the exposure (as defined above) times 6 (as subjects are expected to take 6 capsules per day).
Subjects will be considered non-compliant if their overall compliance during the double-blind period is not within 80% to 120% (inclusive) for the active drug (V120083 or Naproxen). The count and percentage of subjects compliant and non-compliant with study drug during the double-blind period will be summarized by treatment group using the following categories: <80%, 80%-120%, and >120%.
9.5. PRIOR AND CONCOMITANT MEDICATION AND THERAPIES
Prior and concomitant therapy includes all medications (over-the-counter (OTC) and/or prescription, including analgesics except sponsor-provided supplemental analgesic medication), procedures, and significant nonpharmacological therapies that are used to treat the subject, including those used in response to an AE/SAE, during the time periods relevant to study conduct.
Any prior (within 30 days of screening) and concomitant therapy taken by a subject during the course of the study and the reason for its use will be documented.
Medications and therapies that the subject received within 30 days of screening and stopped on or before the date of the first dose of double-blind study medication will be considered as prior. All medications and therapies that the subject received on or after the date of the first dose of double-blind study medication up until 7 days after the last dose of study medication will be considered as concomitant.
Medications stopped on the day of the first double-blind dose will be considered as both prior and concomitant.
Prior and concomitant medications and therapies will be coded to World Health Organization Drug Dictionary (WHO DD enhanced) version 01SEP2016 terms. A dictionary listing of all unique concomitant medications used in the study will be provided, sorting medications by drug class and preferred drug name.
Purdue Pharma LP
Protocol: VAN2001 Statistical Analysis Plan 2
SAP2 Final V1.0 Page 51 of 80 Version Date: 12JAN2018
Prior medication/therapy will be summarized by treatment group for the safety population.
Concomitant medication/therapy will be summarized similarly. In each of the above summary tables, the number of subjects taking each medication/therapy will be presented by anatomical therapeutic chemical (ATC) names (levels 1, 2, 3). Each subject taking the same therapy more than once will be counted once within each ATC code level.
All prior and concomitant therapies as well as supplemental analgesic medications used during the study will be presented in data listings.
9.6. MEDICAL HISTORY
Medical history will be coded to Medical History Dictionary for Regulatory Activites Terminology (MedDRA, version 19.1 terms. Coded medical history terms will be summarized by System Organ Class and Preferred Term for the safety population by treatment group.
Multiple entries for an individual subject under the same System Organ Class/Preferred Term will only be counted once.
9.7. KELLGREN-LAWRENCE
The total number of subjects responding to each grade (no OA, doubtful, mild, moderate, severe) will be summarized descriptively (number of subjects and percentages) for each treatment group. The mean of the grades will also be summarized for each treatment group.
10. EFFICACY ANALYSES
All efficacy analyses will be conducted on the full analysis population. An analysis of the primary efficacy variable on the per-protocol population will also be performed. Primary hypothesis test will be one-sided with a 5% significance level. For each of the following primary, secondary, and the primary contrast will be those between placebo and each dose of study drug. The placebo and the active control will be compared to assess assay sensitivity.
All efficacy data will be listed by investigator, subject and treatment group.
Purdue Pharma LP
Protocol: VAN2001 Statistical Analysis Plan 2
SAP2 Final V1.0 Page 52 of 80 Version Date: 12JAN2018
Descriptive statistics for a continuous variable will include mean, standard deviation, median, minimum, and maximum. Descriptive statistics for a categorical variable will include count and percent.
10.1. PRIMARY EFFICACY VARIABLE(S)
The primary efficacy variable is defined in Section 5.1.1. 10.1.1. Analysis for Primary Efficacy Endpoint Descriptive Summaries
For the primary efficacy endpoint, the “average pain over the last 24 hours” score from the mBPI-SF pain severity subscale at week 4 of the double-blind period, descriptive statistics will be tabulated by treatment and by timepoint (baseline and double-blind weeks 1, 2 and 4). Change from baseline to post-baseline timepoints will also be presented.
Statistical Analysis
Primary Statistical Analysis Model
The primary efficacy analysis of the “average pain over the last 24 hours” score at week 4 comparing the two levels of the study drug vs. placebo will be performed using a mixed-effects general linear model with repeated measures (MMRM). The model will include treatment (4 levels: 60 mg bid or 30 mg bid of V120083, 500mg bid naproxen, and placebo), and time (3 levels: end of week 1 (visit 3), end of week 2 (visit 4), and end of week 4 (visit 5 end of study)) as fixed effects, and treatment by time interaction; the baseline score as fixed covariate, and subjet as random effect. The pooled sites (based on US census regions) and disease status (moderate, severe) will also be included in the model if they are not causing issues in the model convergence, otherwise they will be removed. Restricted maximum likelihood (REML) will be used to estimate the parameters in the model. The “average pain over the last 24 hours” score will be modeled as a dependent variable with repeated measures within subject.
Purdue Pharma LP
Protocol: VAN2001 Statistical Analysis Plan 2
SAP2 Final V1.0 Page 54 of 80 Version Date: 12JAN2018
10.1.2. Hypothesis Testing for the Primary Efficacy Endpoint The null hypothesis corresponding to the primary efficacy comparisons (each dose of V120083 versus placebo) will be considered as distinct.
The null hypothesis to be tested is:
H0: 30 = 60 = p
The (1-sided) alternative hypothesis is: H1: ( 30 or 60) - p < 0
Where p, 30 and 60 are the treatment effect of Placebo, V120083 30mg and V120083 60mg, respectively.
Both hypothesis (V120083 30mg or 60mg bid versus placebo) will be tested simultaneously, without order or alpha level adjustment strategy.
10.2. SECONDARY EFFICACY VARIABLE(S)
All secondary efficacy variables are defined in Section 5.1.2. The analyses of the secondary efficacy variables will be carried out for the FAP by treatment group.
10.2.1. Weekly “average pain over the last 24 hours” collected by e-Dairy The weekly “average pain over the last 24 hours” collected by e-Dairy will be analyzed in a similar manner as for the primary endpoint.
Descriptive statistics will be tabulated by treatment and by timepoint (baseline and double-blind weeks 1, 2 and 4). Change from baseline to post-baseline timepoints will also be presented.
Estimates of the means, LSMeans (95% CI) at each visit during the double-blind period will be presented graphically.
10.2.2. Average daily “pain right now” collected by e-Dairy Summary statistics (mean, SD, median, and range) for the average daily “pain right now” scores will be provided by weeks and treatment group for all subjects in the full analysis population.
Purdue Pharma LP
Protocol: VAN2001 Statistical Analysis Plan 2
SAP2 Final V1.0 Page 55 of 80 Version Date: 12JAN2018
Estimates of the means, LSMeans (95% Cis) at each visit during the double-blind period will be presented graphically.
10.2.3. WOMAC total score The WOMAC total score, will be analyzed using the same MMRM model as the primary efficacy variable.
Descriptive statistics will be tabulated for the total score by treatment and timepoint (baseline, weeks 1, 2 and 4). Change from baseline to post-baseline timepoints will also be presented.
Estimates of the means, LSMeans (95% CIs) at each Visit during the double-blind period will be presented graphically.
The WOMAC mean score will be summarized similarly.
10.2.4. WOMAC pain severity subscale The WOMAC pain severity subscale (total score and mean score), will be analyzed using the same MMRM model as the primary efficacy variable.
Descriptive statistics will be tabulated for the pain subscale by treatment and timepoint (baseline, weeks 1, 2 and 4). Change from baseline to post-baseline timepoints will also be presented.
Estimates of the means, LSMeans (95% CIs) at each Visit during the double-blind period will be presented graphically.
10.2.5. WOMAC physical function subscale The WOMAC physical function subscale (total score and mean score), will be analyzed using the same MMRM model as the primary efficacy variable.
Descriptive statistics will be tabulated for the physical function subscale by treatment and timepoint (screening, baseline, weeks 1, 2 and 4). Change from baseline to post-baseline timepoints will also be presented.
Estimates of the means, LSMeans (95% CIs)at each Visit during the Double-Blind Period will be presented graphically.
Purdue Pharma LP
Protocol: VAN2001 Statistical Analysis Plan 2
SAP2 Final V1.0 Page 56 of 80 Version Date: 12JAN2018
10.2.6. WOMAC stiffness subscale The WOMAC stiffness subscale (total score and mean score), will be analyzed using the same MMRM model as the primary efficacy variable.
Descriptive statistics will be tabulated for the stiffness subscale by treatment and timepoint (baseline, weeks 1, 2 and 4). Change from baseline to post-baseline timepoints will also be presented.
Estimates of the means, LSMeans (95% CIs) at each Visit during the Double-Blind Period will be presented graphically.
10.2.7. mBPI-SF total scores (all parts of the 6 questions) The mBPI-SF individual questions, will be analyzed using the same MMRM model as the primary efficacy variable.
Descriptive statistics (mean, standard deviation, median, minimum, and maximum) will be generated by treatment group and visit will be tabulated. Change from baseline to post-baseline timepoints will also be presented.
10.2.8. mBPI-SF pain severity subscale The mBPI-SF severity of pain subscale, will be analyzed using the same MMRM model as the primary efficacy variable.
Descriptive statistics will be tabulated for pain subscale by treatment and by timepoint. Change from baseline to post-baseline timepoints will also be presented. Decrease in % change from baseline >30% or >50% will be presented for mBPI-SF question 3 (average pain in the last 24 hours).
Estimates of the means, LSMeans (95% CIs) at each Visit during the double-blind period will be presented graphically.
10.2.9. mBPI-SF pain interference subscale The mBPI-SF pain interference subscale, will be analyzed using the same MMRM model as the primary efficacy variable.
Descriptive statistics will be tabulated for pain interference by treatment and by timepoint. Change from baseline to post-baseline timepoints will also be presented. Decrease in %
Purdue Pharma LP
Protocol: VAN2001 Statistical Analysis Plan 2
SAP2 Final V1.0 Page 57 of 80 Version Date: 12JAN2018
change from baseline >30% or >50% will be presented for mBPI-SF question 3 (average pain in the last 24 hours).
Estimates of the means, LSMeans (95% CIs) as well as treatment difference (versus Placebo) at each Visit during the double-blind period will be presented graphically.
10.2.10. SF-36 There are 8 dimensions/scales: physical functioning (PF), role-physical (RP), bodily pain (BP), general health (GH), vitality (VT), social functioning (SF), role-emotional (RE), and mental health (MH). In addition to the 8 scales, 2 summary measures will be derived:
Physical component summary (PCS) measure (aggregate of PF, RP, BP, and GH scales); and Mental component summary (MCS) measure (aggregate of VT, SF, RE, and MH scales).
.
The PCS and MCS measures will be analyzed using the same MMRM model as the primary efficacy variable.
Descriptive statistics (mean, standard deviation, median, minimum, and maximum) will be generated by treatment group and visit for the Physical Health Component Measure and Mental Health Component Measure (see Section 5.1.2).
10.2.11. EQ-5D-5L The same MMRM model as the primary efficacy variable will be used for the VAS score (how good or bad is your health today (0-100)).
Descriptive statistics will be tabulated by treatment and by timepoint. Change from baseline to post-baseline timepoints will also be presented.
The proportions (n, %) of subjects with no problems (includes dimension 1)/problems (includes dimension 2, 3, 4, 5) will be summarized descriptively for the five dimensions (mobility, self- care, usual activities, pain/discomfort, anxiety/depression).
Fisher’s exact test will be used for comparison between the treatment groups, and a generalized estimating equation (GEE) wll be used for the analysis over time.
Purdue Pharma LP
Protocol: VAN2001 Statistical Analysis Plan 2
SAP2 Final V1.0 Page 58 of 80 Version Date: 12JAN2018
10.2.12. PGIC at the end of double-blind period (week 4) Descriptive statistics will be reported for the PGIC score at the end of study visit by treatment. The categories will be compared between treatment group and placebo using the Chi-Squared test.
Further dichotomous analysis will be conducted on collapsed categories (very much improved/much improved vs minimally improved/no change/minimally worse/much worse/very much worse) using Fisher’s exact test.
Mean of PGIC scores for each treatment, 95% CI for difference from placebo and associated p- values will be based on an ANOVA model with treatment (4 levels) as fixed effect. All comparisons versus placebo will be performed.
10.2.13. Supplemental analgesic medication use The percentage of subjects who require no supplemental APAP during the double-blind period will be reported for each treatment group separately and 95% binomial confidence intervals with normal approximation with a correction for continuity will be constructed for each proportion.
In addition, the average daily number of supplemental acetaminophen 500mg, as detailed in Section 5.1.2, will be summarized descriptively by treatment groups for double-blind week 1, week 2, week 4 and overall for the double-blind period.
The average daily number of supplemental acetaminophen 500mg for each timepoint will also be reported using the categories defined in Section 5.1.2.
Descriptive statistics (n, mean, SD, median, minimum, and maximum) will be presented by treatment group. Due to the nature of the data, supplemental pain medication for OA tends to have a large proportion of zeros (contributed by subjects who do not take any supplemental pain medication) followed by continuous distribution of nonzero values. Therefore, the supplemental pain medication for OA will also be summarized categorically. Preliminarily, the categories will be (1) no supplemental acetaminophen tables, (2) 0 to 0.5 tables, (3) >0.5 to 1 tablets, (4) >1.0 to 2.0 tablets, and (5) >2.0 tablets. Upon review of the blinded data prior to database lock, the categories will be reviewed.
10.2.14. Responder to treatment The definition of responder to treatment is defined in Section 5.1.2. The number and percentage of subjects with a response to treatment will be summarized by treatment group.
Purdue Pharma LP
Protocol: VAN2001 Statistical Analysis Plan 2
SAP2 Final V1.0 Page 59 of 80 Version Date: 12JAN2018
The proportion of subjects with a response (>0% reduction) to treatment at week 4 will be compared using a logistic regression model with “responder” (yes/no) as dependent variable, treatment and baseline pain score as covariate.
A graph of the observed cumulative percentage of subjects vs percentage reduction in pain from screening pain score will be generated by treatment group. Based on this graph, estimates of percentage of responders for the following cutoffs: (<0, 0, >0, 10%, 20%, 30%, 40%, 50%, 60%, 70%, 80%, 90%, and =100%) for each treatment group will be computed and
graphed. The same analyses will also be performed on the responders based on the weekly “average pain at week 4” collected by e-diary.
11. SAFETY ANALYSES
Evaluation of safety will be performed for all subjects in the safety populations, unless stated otherwise.
Purdue Pharma LP
Protocol: VAN2001 Statistical Analysis Plan 2
SAP2 Final V1.0 Page 60 of 80 Version Date: 12JAN2018
11.1. ADVERSE EVENTS
AEs will be coded to MedDRA terms using MedDRA version 19.1. An adverse event dictionary listing will be produced presenting by MedDRA System Organ Class, Preferred Term and all lower level terms and verbatim descriptions associated with the Preferred Terms. This listing will be sorted by MedDRA System Organ Class and Preferred Term.
The definition of TEAEs used in this study is provided in Section 5.2.1. Only TEAEs will be included in summary tables.
The incidence of TEAEs and of AESIs will be summarized by System Organ Class, MedDRA Preferred Term and treatment (if appropriate) by presenting the number and percentage of subjects with an AE. A subject will be counted only once in the incidence count for a specific MedDRA Preferred Term, although a MedDRA Preferred Term might be recorded more than once for a particular subject.
Separate summaries will be provided for TEAEs by maximum severity (mild, moderate, severe), relationship (yes, no) to study drug, TEAE leading to study drug discontinuation and TEAE leading to study discontinuation. A TEAE will be considered related to study drug if the investigator reported the event to be a reasonable possibility (if reported as definitely, probably or possibly) that it is related to treatment.
In addition, a table of TEAEs occurring in 5% of the subjects in at least 1 treatment group will be presented.
Individual subject listings of AEs that resulted in death, or other SAEs, and of AES that led to treatment discontinuation, dose interruption, or dose reduction, and AESIs will be generated. These listings will include the treatment group and dose (if applicable) at the time of AE onset, start and stop dates of the AE, days on study, and days on treatment.
Summaries of TEAEs occurring in the double-blind period will be generated by treatment group and for all subjects who received V120083 (30 and 60mg) for subjects in the safety population.
Purdue Pharma LP
Protocol: VAN2001 Statistical Analysis Plan 2
SAP2 Final V1.0 Page 61 of 80 Version Date: 12JAN2018
11.2. CLINICAL LABORATORY EVALUATIONS
For each laboratory test, abnormal values will be identified as those outside (above or below) the reference range and will be flagged in the by-subject listings. Laboratory test results will be assigned a LNH classification according to whether the value is below (L), within (N), or above (H) the laboratory parameter’s reference range (as defined in Section 5.2.2).
Within treatment comparisons during the double-blind phase will be based on 3-by-3 tables (shift tables) that, for a particular laboratory test, compare the baseline LNH classification to the LNH classification at the end of double-blind treatment for the safety population.
Similar shift tables will be produced for urinalysis test (pH and specific gravity) results.
Summary statistics (n, mean, standard deviation, median, minimum, and maximum) for baseline, end of double-blind and change from baseline to end of double-blind values of continuous laboratory parameters will be produced by treatment group for subjects in the safety population.
All clinical laboratory results will be evaluated for markedly abnormal values, as defined in Section 5.2.2. A listing of all subjects in the safety population with at least 1 markedly abnormal laboratory value will be prepared; for a given subject, in addition to the flagged markedly abnormal laboratory parameters, the listing will present the results of all scheduled and unscheduled study evaluations of the same laboratory parameter whether or not they are markedly abnormal. The incidence of markedly abnormal laboratory tests will be summarized by treatment group for all subjects in the safety population. For these calculations, each subject may be counted once in the laboratory parameter high and in the laboratory parameter low categories as applicable. A similar summary table and listing will be provided for alert laboratory values, as defined in Section 5.2.2.
Additional analyses of liver function tests (AST, ALT, and total bilirubin) will be conducted by generating shift tables using the categories presented in Section 5.2.2, Table 5. Shift summaries will be generated comparing baseline values to end of double-blind values.
A listing of all subjects in the safety population with liver function test results for AST and ALT > 3 X ULN or total bilirubin > 1.5 X ULN will be generated.
Purdue Pharma LP
Protocol: VAN2001 Statistical Analysis Plan 2
SAP2 Final V1.0 Page 62 of 80 Version Date: 12JAN2018
All laboratory test results will be reported in SI units. Laboratory tests to be summarized are specified in Appendix.
A listing of the reference (normal) ranges for laboratory parameters will be included in the clinical study report for this protocol.
Urine drug test and urine/serum pregnancy test results will be listed only.
11.3. VITAL SIGNS
Vital sign listings will be provided for the safety population. Vital sign (systolic blood pressure [mmHg], diastolic blood pressure [mmHg], pulse rate [beats/min], respiratory rate [breaths/min], and temperature [C]) summary tables will be presented by treatment group for subjects in the safety population.
Abnormal vital sign values will be identified as those outside (above or below) the reference ranges defined in Section 5.2.3, Table 6. The incidence of abnormal vital sign values during the double-blind phase will be presented by treatment for subjects in the safety population.
For each continuous vital sign parameter, descriptive summary statistics (n, mean, and standard deviation/standard error, median, and range) will be calculated for values observed during the double-blind period, including end of double-blind (see Section 5.2.3). Summary statistics for the change from baseline to each post-randomization visit, including end of double-blind assessment, will be presented.
Vital sign abnormalities that meet or exceed the “clinical notable vital sign” values (see Section 5.2.3, table 7) will be listed. The incidence of clinically notable vital signs during the double- blind period will be presented by treatment for subjects in the safety population.
Purdue Pharma LP
Protocol: VAN2001 Statistical Analysis Plan 2
SAP2 Final V1.0 Page 63 of 80 Version Date: 12JAN2018
11.4. ECGS
Summaries of ECG evaluations performed at the end of double-blind period will be compared to baseline values (see Section 5.2.4) and generated by randomization treatment group for the subjects in the safety population. In addition, summary tables may be generated for ECGs collected during exposure to the study drugs across the double-blind period.
The following listings and summary tables will be generated:
1. Summary statistics (n, mean, standard deviation, minimum, and maximum) of the
baseline value and each scheduled evaluation, and the corresponding change from baseline for each continuous ECG parameter (heart rate [beats/min], PR interval [msec], QRS duration [msec], QT interval [msec], QTcB [msec], and QTcF[msec]).
2. Count (%) of subjects with a change from baseline in QT, QTcB, or QTcF intervals >30
but <=60 miliseconds, and with a change >60 miliseconds at each scheduled postbaseline evaluation.
3. Listing of subjects with a change from baseline in QT, QTcB, or QTcF intervals >30 but
<=60 miliseconds, and with a change >60 miliseconds at each scheduled postbaseline evaluation.
4. Count (%) of subjects, for each ECG parameter, with at least 1 outlier* value observed
during the phase or period of interest.
5. Listing of subjects with at least 1 outlier* ECG tracing parameter postbaseline.
6. For each selected ECG morphology finding, the count (%) of subjects with the specific finding absent or present at baseline versus end of double-blind period.
7. Listing of subjects with treatment-emergent ECG morphology findings.
*Outliers are defined in section 5.2.4.
For these analyses, the following rules will apply:
The baseline value of each ECG parameter will be defined as the average of all ECG
values collected prior to the start of study drug.
Purdue Pharma LP
Protocol: VAN2001 Statistical Analysis Plan 2
SAP2 Final V1.0 Page 64 of 80 Version Date: 12JAN2018
In listings summaries 1 through 3 above, the value of the ECG parameters at each scheduled post-baseline evaluation will be calculated as the average of the tracing results collected at that time.
For listings 4 through 7, every ECG tracing will be evaluated (ie, no average will be
calculated).
For listings 6 and 7, a subject will be categorized as having a specific morphology finding present at baseline if the finding is observed in at least 1 ECG tracing obtained prior to the start of study drug. A specific ECG morphology finding will be considered present at the end of a phase/period if it is observed in at least 1 ECG tracing collected during that phase/period.
For listing 7, an ECG morphology finding will be considered treatment emergent if it is
observed in a least 1 postbaseline ECG tracing but is absent from all screening baseline tracings.
11.5. ABUSE OR DIVERSION OF STUDY DRUG
A listing will be provided on the abuse or diversion of study drug data. 11.6. PHYSICAL EXAMINATION
Any observed changes in physical and neurologic examinations from before treatment to after treatment will be listed and described.
11.7. OTHER SAFETY MEASURES
Descriptive statistics will be presented by treatment group for the HADS, C-SSRS, and K-L scores using the safety population.
11.7.1. HADS The change from baseline to end of double-blind (week 4) for both subjects HADS-A and HADS-D as defined in Section 5.2.7 will be analyzed using an ANCOVA model including
Purdue Pharma LP
Protocol: VAN2001 Statistical Analysis Plan 2
SAP2 Final V1.0 Page 65 of 80 Version Date: 12JAN2018
treatment group (4 levels) and baseline as covariate. All comparisons versus placebo will be performed.
11.7.2. C-SSRS Summaries (number of subjects and percentages) will be presented for each question within the following categories: suicidal ideation, suicidal behavior, and self-injurious behavior without suicidal intent, that occurred during the double-blind period.
11.7.3. CiTAS scores The CiTAS scores as defined in section 5.3.2 will be listed and summarized descriptively (n, mean, standard deviation, median, and range), for each of the following scores:
- Decline in basic taste
- Discomfort
- Phantogeusia and parageusia
- General taste alterations.
12. OTHER ANALYSES
12.1. PK AND PG ANALYSES
PK and PG analyses will be described in separate documents and will be presented in separate reports. Due to the exploratory nature of the PG, all summaries and analyses related to PG, if conducted, will be documented separately and will not be included in the CSR (clinical study report).
13. SUMMARY OF CHANGES FROM PROTOCOL-SPECIFIED ANALYSES
No changes are planned/were made to the planned analyses.
Purdue Pharma LP
Protocol: VAN2001 Statistical Analysis Plan 2
SAP2 Final V1.0 Page 66 of 80 Version Date: 12JAN2018
14. REPORTING CONVENTIONS
Page Layout
The Section 14 tables and Appendix 16 listings should be in landscape orientation by default.
The output in Section 14 and Appendix 16 will be in RTF file format using Courier New
font with 8 point size.
Output should adhere to US/ICH margins requirement. A page in landscape orientation requires a margin of ¾ of an inch at the top. Header and footer information should appear within these same margins.
Category labels in the left most columns of all tables and listings will be left justified.
A blank row will separate the header from the content of the table listing.
Summary Tables
In the summary tables for the double-blind period, the defaut order for treatment groups will be Placebo, naproxen, V120083 30mg and V120083 60mg. In the summary tables for the pre- randomization period, the default order for treatment groups will be Nonrandomized and Randomized.
Subject Listings
Subject listings, unless specified otherwise, should use Country, Investigator Name/Number, Subject Number, and Treatment as the “Sort Order”.
Statistical Considerations
The Standard TLFs adhere to the following statistical conventions:
The subject percentages (%) should be rounded to a whole number, with SAS rounding options used to obtain the values.
Percentages for values in the tables that are less than <1 should be presented as “<1”.
Purdue Pharma LP
Protocol: VAN2001 Statistical Analysis Plan 2
SAP2 Final V1.0 Page 67 of 80 Version Date: 12JAN2018
If “%” is part of the column heading, do not repeat the “%” sign in the body of the table.
If a value is zero (0), then do not use 0% and leave the corresponding percentage blank.
The format for range should always be “Min, Max”.
If there are missing data, then a missing row will be added to keep track of all subjects. If no missing data, then delete the missing row. Percentages will not be presented on the row missing category.
Standard Deviation should be abbreviated as “SD”, and Standard Error should be
abbreviated as “SE”; it is presented within parenthesis next to the mean value, without any +/- sign. The Standard Deviation or Standard Error should have one additional decimal point beyond that of the mean (for example, if the mean has one decimal point, SD/SE should have two decimal points). Mean should have one additional decimal point beyond that of the data being summarized.
“N” will represented the entire treatment group, while “n” will represent a subset of the
treatment group. For tables with population designated as a row heading, “N” should be used (i.e. tables where all the participant data is not available for every variable within a treatment group). As a guideline, if the number is used in denominator that it should be presented as “N”. If the number is used in numerator then it should be presented as “n”.
Column Heading Alignment
Two solid lines should bind the column headings for the tables.
A solid line should be at the end of the table or at the bottom of the page (if table extends to more than one page).
Footnote should start after the bottom solid line. In the event of lengthy footnotes,
they will only be presented on the last page of the table (as endnote).
Directory Patch and Page Numbers
Page number on the tables should be displayed at the bottom right of the table heading for all tables.
Purdue Pharma LP
Protocol: VAN2001 Statistical Analysis Plan 2
SAP2 Final V1.0 Page 68 of 80 Version Date: 12JAN2018
Format of the page numbers should be: Page X of Y.
Name of the SAS Program and the date/time of the TLFs was run should be displayed on the output as the last footnotes.
Cross-References
All in-text tables should be cross-referenced to a table in Section 14.
All Section 14 tables should be cross-referenced to a listing in Appendix 16. 15. REFERENCES
1. Cui L, Hung HMJ, Wang SJ. (1999) Modification of sample size in group sequential trials. Biometrics. 55: 853-857.
2. Emerson SS, Kittelson JM, Gillen DL. (2005) On the use of stochastic curtailment in
group sequential clinical trials. University of Washington Department of Biostatistics Technical Report.
3. Lan KKG, Simon R, and Halperin M. (1982). Stochastically curtailed tests in long-term clinical trials. Comm Statist, C (Sequentia1 Analysis). 1:207-219.
16. TABLES, FIGURES, LISTINGS AND OUTPUT
16.1. TABLES
See separate document for table shells. 16.2. FIGURES
See separate document for figure shells.
Purdue Pharma LP
Protocol: VAN2001 Statistical Analysis Plan 2
SAP2 Final V1.0 Page 69 of 80 Version Date: 12JAN2018
16.3. DATA LISTINGS FOR APPENDIX 16.2
See separate document for listing shells. 17. ATTACHMENTS

Purdue Pharma LP
Protocol: VAN2001 Statistical Analysis Plan 2
SAP2 Final V1.0 Page 70 of 80 Version Date: 12JAN2018

Purdue Pharma LP
Protocol: VAN2001 Statistical Analysis Plan 2
SAP2 Final V1.0 Page 71 of 80 Version Date: 12JAN2018

Purdue Pharma LP
Protocol: VAN2001 Statistical Analysis Plan 2
SAP2 Final V1.0 Page 72 of 80 Version Date: 12JAN2018

Purdue Pharma LP
Protocol: VAN2001 Statistical Analysis Plan 2
SAP2 Final V1.0 Page 76 of 80 Version Date: 12JAN2018
Purdue Pharma LP
Protocol: VAN2001 Statistical Analysis Plan 2
SAP2 Final V1.0 Page 77 of 80 Version Date: 12JAN2018

Purdue Pharma LP
Protocol: VAN2001 Statistical Analysis Plan 2
SAP2 Final V1.0 Page 78 of 80 Version Date: 12JAN2018

Purdue Pharma LP
Protocol: VAN2001 Statistical Analysis Plan 2
SAP2 Final V1.0 Page 79 of 80 Version Date: 12JAN2018
18. APPENDIX
Appendix A – Laboratory Tests Hematology: RBC counts, Hemoglobin, Hematocrit, Platelets, and WBC count with differential (neutrophils, lymphocytes, monocytes, eosinophils, basophils) in percentages (%) and absolute counts.
Clinical Chemistry:
Electrolytes: Sodium, Potassium, Chloride, Calcium Corrected, Magnesium, Bicarbonate Liver function tests: Alkaline Phosphatase, Asparate Aminotransferase (AST/SGOT), Alanine Aminotransferase (ALT/SGPT), Total Bilirubin, gamma-glutamyl transferase (GGT).
Renal function parameters: Blood Urea/Blood Urea Nitrogen, Creatinine, eGFR
Other: Glucose, Albumin, Cholesterol, Triglycerides, Phosphorus, Lactate Dehydrogenase (LDH), Total Protein, Globulin, Uric Acid.
Urinalysis: pH, Protein, Glucose, Ketone, Occult Blood, RBC, WBC, Epithelial Cells, Bacteria, Casts, Crystals, Specific Gravity.
Urine drug test: Amphetamines, Cannabinoids, Opiates, Cocaine Metabolites, Benzodiazepines, Barbiturates, phencyclidine, methadone, propoxphene.
Serum pregnancy test: Human Chorionic Gonadotropin (Choriogonadotropin Beta).
Urine pregnancy test: Human Chorionic Gonadotropin (Choriogonadotropin Beta).
Virus screen: Hepatitis B, Hepatitis C, Human Immunodeficiency Virus.
Purdue Pharma LP
Protocol: VAN2001 Statistical Analysis Plan 2
SAP2 Final V1.0 Page 80 of 80 Version Date: 12JAN2018
DOCUMENTHISTORY
Version Date Modified By Summary of Changes
Related Documents