Valuing Spatially Valuing Spatially Delineated Nutrient Delineated Nutrient Pollution Pollution Martin D. Smith Martin D. Smith Larry B. Crowder Larry B. Crowder Nicholas School of the Environment and Earth Nicholas School of the Environment and Earth Sciences Sciences Duke University Duke University Image source: Dr. James Bowen, UNC Charlot http://www.coe.uncc.edu/~jdbowen/neem/

Valuing Spatially Delineated Nutrient Pollution
Jan 01, 2016
Valuing Spatially Delineated Nutrient Pollution. Martin D. Smith Larry B. Crowder Nicholas School of the Environment and Earth Sciences Duke University. Image source: Dr. James Bowen, UNC Charlotte http://www.coe.uncc.edu/~jdbowen/neem/. - PowerPoint PPT Presentation
Welcome message from author
This document is posted to help you gain knowledge. Please leave a comment to let me know what you think about it! Share it to your friends and learn new things together.
Transcript

Valuing Spatially Delineated Valuing Spatially Delineated Nutrient PollutionNutrient Pollution
Martin D. SmithMartin D. SmithLarry B. CrowderLarry B. Crowder
Nicholas School of the Environment and Earth SciencesNicholas School of the Environment and Earth SciencesDuke UniversityDuke University
Image source: Dr. James Bowen, UNC Charlotte http://www.coe.uncc.edu/~jdbowen/neem/

What can we learn from a lumped-parameter bioeconomic model about
valuing ecosystem services?
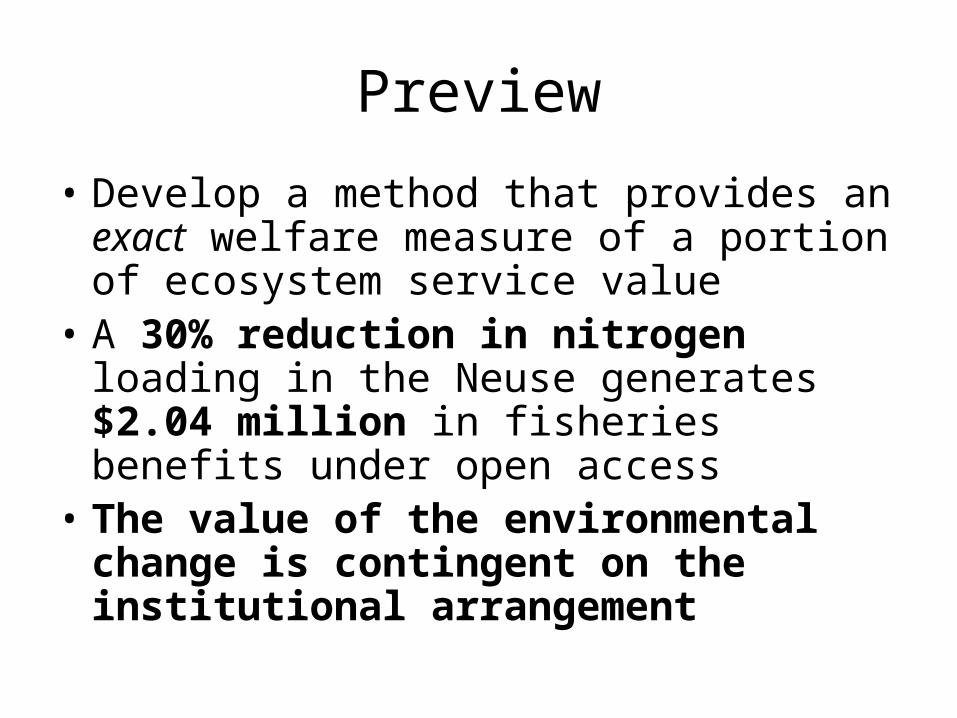
Preview
• Develop a method that provides an exact welfare measure of a portion of ecosystem service value
• A 30% reduction in nitrogen loading in the Neuse generates $2.04 million in fisheries benefits under open access
• The value of the environmental change is contingent on the institutional arrangement

Outline
• Background and literature• Analytical Model with Open Access• Parameterizing the model (briefly)• Qualitative and Quantitative Results• Discussion of the results• Linking Models of Economics and Ecosystems• Preliminary results from a “quasi-optimized”
model
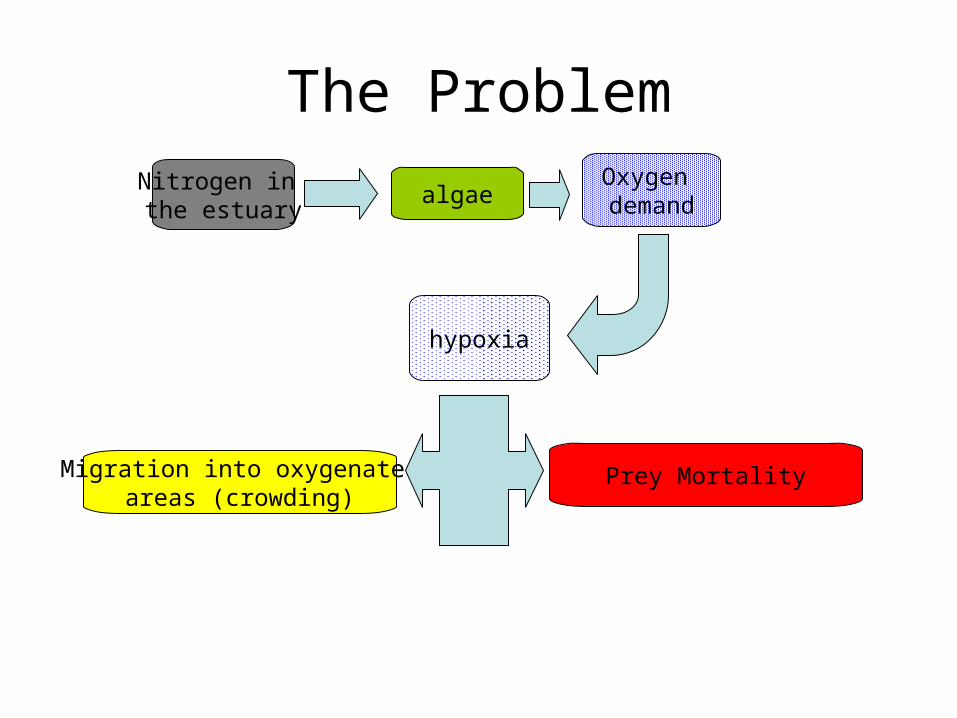
The ProblemNitrogen in the estuary
algaeOxygen demand
hypoxia
Migration into oxygenatedareas (crowding)
Prey Mortality

TMDL and the Neuse
• Nutrient pollution in Neuse linked to hypoxia/anoxia, toxic algal blooms, fish kills, effects on the trophic system
• Clean Water Act requires Total Maximum Daily Load (TMDL) plan
• Neuse TMDL recommends 30% reduction in nitrogen loadings
• Schwabe (2001) estimates annualized cost of 30% reduction ranges from $5.4 million to $9.1 million (1999 dollars)
• 9 species that depend on estuarine soft-bottom habitat make up > 2/3 dockside value of NC commercial fisheries (Peterson et al., 2000)
Image Source: NCSU Center for Applied Aquatic Ecologywww.ncsu.edu/wq/ pics-dp/dpncmap.gif
Image Source: http://www.usdoj.gov/dea/pubs/states/northcarolina2003.html

NC Blue Crab Fishery
• Largest commercial fishery in NC ($34.4 million ex vessel revenues in 2002)
• 80,000 – 100,000 trips per year
• 35% in Neuse River and Pamlico Sound
• Essentially open access
• ~ 25 % of East Coast production from NC
Image Source: Dept. of Fisheries Science, VIMS, William and Mary http://www.fisheries.vims.edu/femap/fish%20pages/blue%20crab.htm
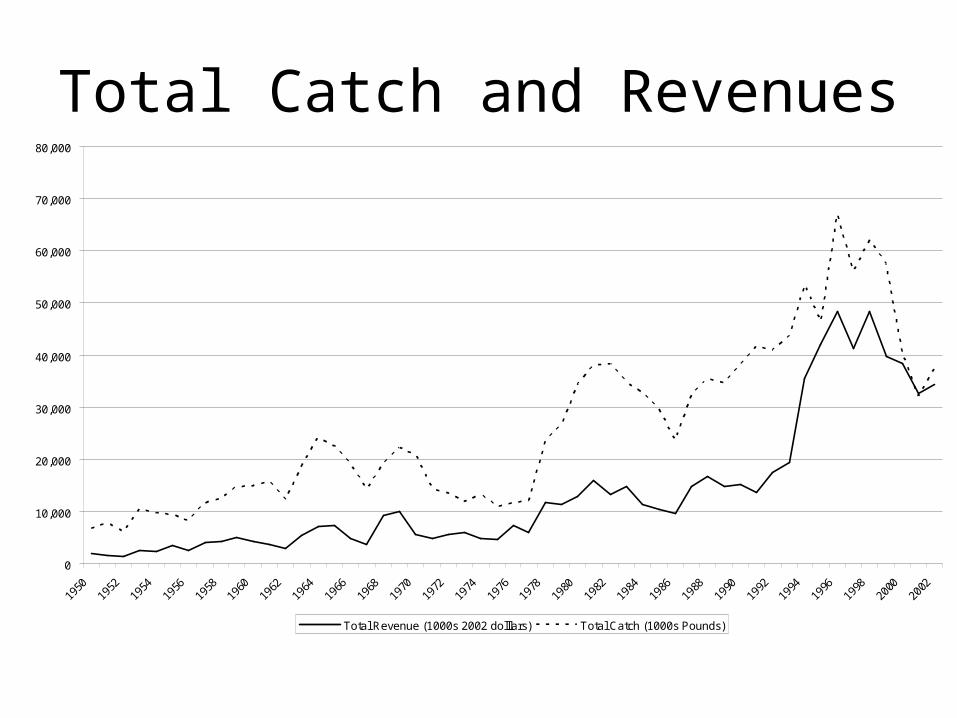
Total Catch and Revenues
0
10,000
20,000
30,000
40,000
50,000
60,000
70,000
80,000
1950
1952
1954
1956
1958
1960
1962
1964
1966
1968
1970
1972
1974
1976
1978
1980
1982
1984
1986
1988
1990
1992
1994
1996
1998
2000
2002
Total Revenue (1000s 2002 dolllars) Total Catch (1000s Pounds)

4 strands of the bioeconomic literature
• Multispecies models with predator-prey interaction (Hannesson, 1983; Ragozin and Brown, 1985; Kaplan and Smith, 2001; Brock and Xepapadeas, 2004)
• Habitat dependence of a renewable resource (Swallow, 1990; Barbier and Strand, 1998)
• Spatial fisheries models (Sanchirico and Wilen, 1999; Smith and Wilen, 2003)
• Empirical bioeconomics of open access (Wilen, 1976; Bjorndal and Conrad, 1987)

Model StructureLumped-parameter system of 8 ordinary differential equations
1. Nutrient loadings accumulate in the estuary 2. Nutrient accumulation increases algal carrying capacity
Two species 3. blue crabs as harvested mobile predator4. clams as unharvested stationary prey
Two patches5. Patch 1 subject to hypoxia6. Patch 2 has no hypoxia
7. Dynamic open access 8. Discrete choice model of fishing locations

Nutrients (N) and Algae (A)
tNtLtN
tNtAtAtA 1
This parameter will matter a lot.
Loadings minus natural decay
Logistic growth a function of nutrients

Blue Crab (X) population dynamics
tXtYtXtYtXtA
thtXtYktXtXrtX xx
22111
111111
)()(
1
Logistic growth predation harvest
Hypoxia-inducedmigration
Migration from relative prey availability

Blue Crab (X) population dynamics
tXtYtXtYtXtA
thtXtYktXtXrtX xx
22111
111111
)()(
1
tXtYtXtYtXtA
thtXtYktXtXrtX xx
22111
222222
)()(
1

Prey (Y) population dynamics
tYtAtYtXtYtYrtY y 111111 1
tYtXtYtYrtY y 22222 1
Predation
Logistic growth Hypoxia-inducedmortality

Dynamic Open Access
• Rents are dissipated in the long run
• Transitional rents are the welfare metric
• Reducing hypoxia generates a short-run economic benefit by increasing prey stocks and reducing predator crowding

Dynamic Open Access
cptE tE
thth 21
tEcththptTotal 21
Profit/Rent Function
Vernon Smith Rent Dissipation
is speed of adjustment
costsrevenues
Marginal cost of effort + opp cost of capital (per unit effort)
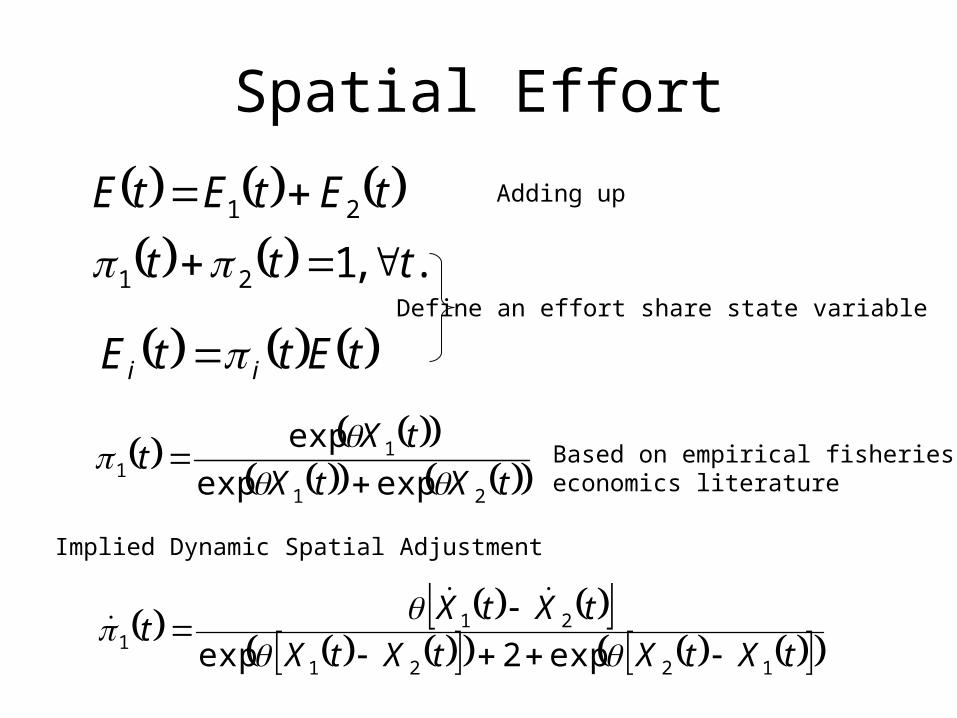
Spatial Effort
tXtX
tXt
21
11 expexp
exp
tXtXtXtX
tXtXt
1221
211 exp2exp
tEtEtE 21
tEttE ii
.,121 ttt
Implied Dynamic Spatial Adjustment
Adding up
Define an effort share state variable
Based on empirical fisherieseconomics literature

Closing the Model
tXtqEth iii
ctXttXtpqtE 2111 1
Schaefer Production
q is “catchability”

Parameterization(Short Version)
• Nitrogen loadings, algal production, hypoxia, and prey mortality: Various pieces of the Neu-BERN model due to Borsuk, Stow, Reckhow, and others
• Blue Crab population dynamics: Eggleston et al. (2004) stock assessment and related work
• Blue crab migration: Eby and Crowder• Costs – Rhodes, Lipton, and Shabman survey of
Chesapeake blue crabbers• Prices and trips– NC DMF data + BLS CPI South Size D• Discount rate – 2.5%• Other parameters – used nonlinear solver to back them
out or used 1-period-ahead forecasting to choose them
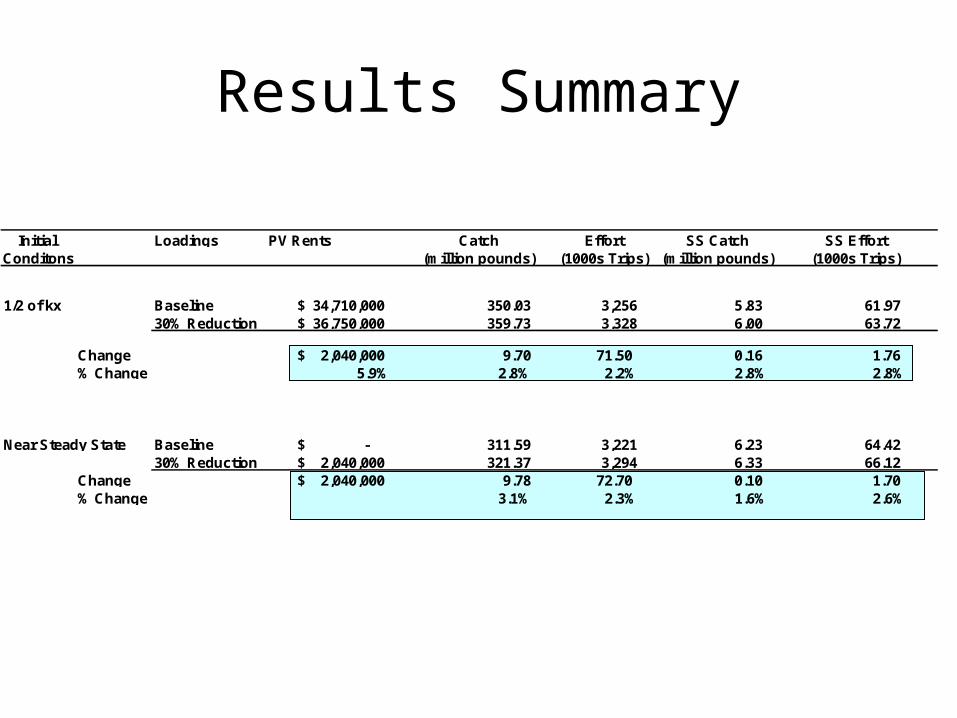
Results Summary
Initial Loadings PV Rents Catch Effort SS Catch SS EffortConditons (million pounds) (1000s Trips) (million pounds) (1000s Trips)
1/2 of kx Baseline 34,710,000$ 350.03 3,256 5.83 61.97 30% Reduction 36,750,000$ 359.73 3,328 6.00 63.72
Change 2,040,000$ 9.70 71.50 0.16 1.76 % Change 5.9% 2.8% 2.2% 2.8% 2.8%
Near Steady State Baseline -$ 311.59 3,221 6.23 64.42 30% Reduction 2,040,000$ 321.37 3,294 6.33 66.12
Change 2,040,000$ 9.78 72.70 0.10 1.70 % Change 3.1% 2.3% 1.6% 2.6%

No Reduction in Nitrogen – Initial Condition at ½ kx
0 10 20 30 40 50 600
5
10
15Patch 1 Predator Population
Year
Pou
nds
(m
illio
ns)
0 10 20 30 40 50 600
5
10
15Patch 2 Predator Population
Year
Pou
nds
(m
illio
ns)
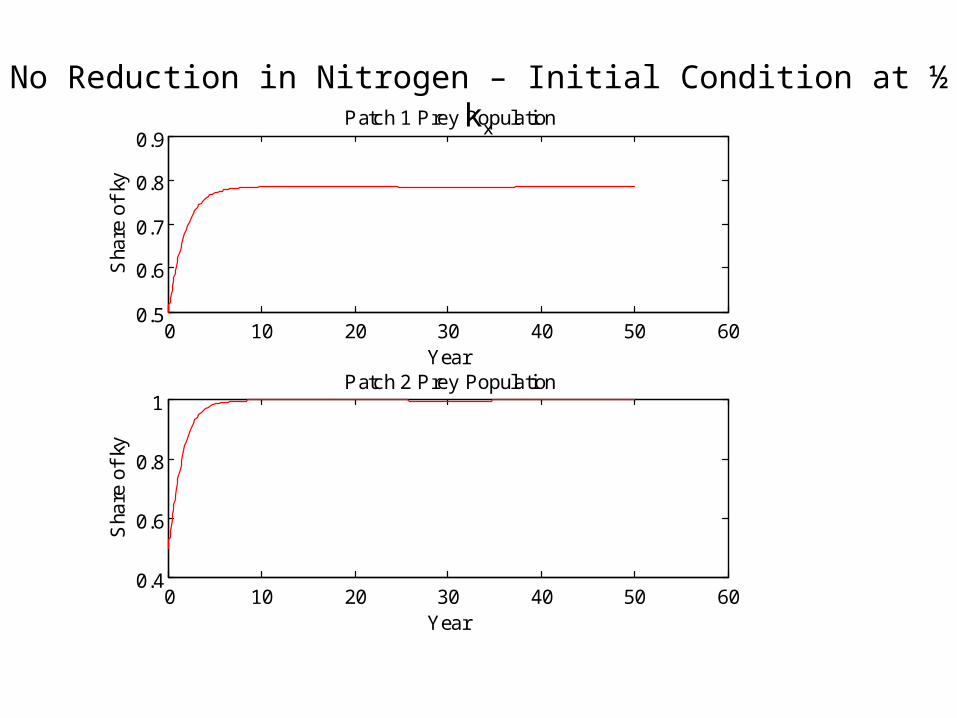
No Reduction in Nitrogen – Initial Condition at ½ kx
0 10 20 30 40 50 600.5
0.6
0.7
0.8
0.9Patch 1 Prey Population
Year
Sha
re o
f ky
0 10 20 30 40 50 600.4
0.6
0.8
1Patch 2 Prey Population
Year
Sha
re o
f ky

No Reduction in Nitrogen – Initial Condition at ½ kx
0 10 20 30 40 50 602
4
6
8x 10
4 Total Fishing Effort
Year
Tot
al
Tri
ps
Pe
r Y
ear
0 10 20 30 40 50 60
0.35
0.4
0.45
0.5Share of Effort in Patch 1
Year
Stretchedcycles reflectsluggish adjustment
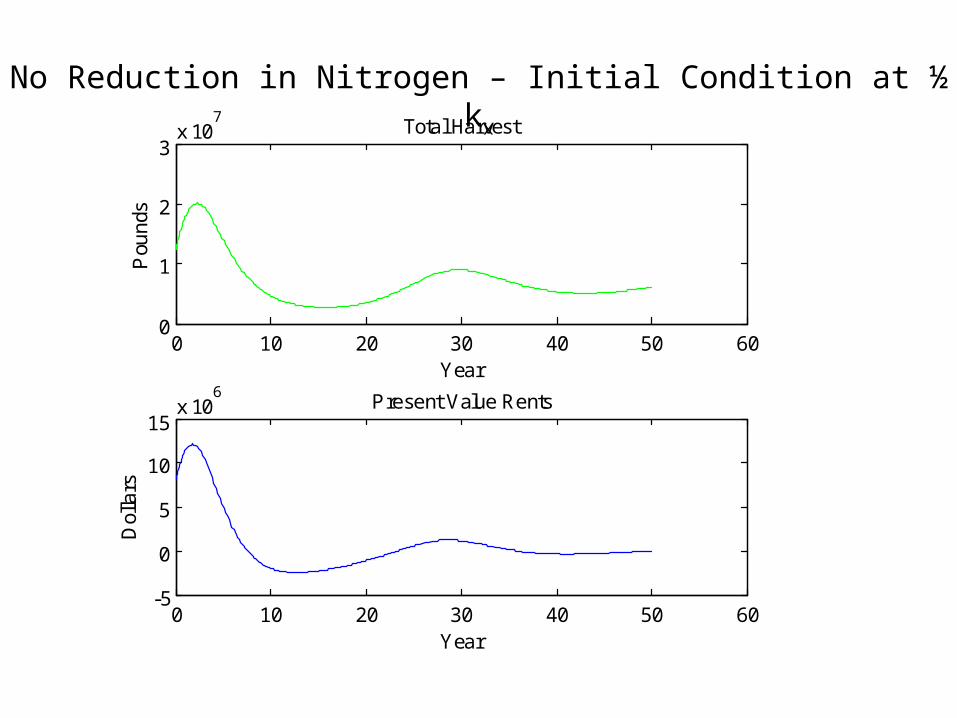
No Reduction in Nitrogen – Initial Condition at ½ kx
0 10 20 30 40 50 600
1
2
3x 10
7 Total Harvest
Year
Pou
nds
0 10 20 30 40 50 60-5
0
5
10
15x 10
6 Present Value Rents
Year
Dol
lars

No Reduction in Nitrogen – Initial Condition at ½ kx
0 10 20 30 40 50 60-0.4
-0.2
0
0.2
0.4Migration Into Patch 1 from Relative Prey Availability
Year
Pou
nds
(m
illio
ns)
0 10 20 30 40 50 60-4
-3
-2
-1
0Migration from Patch 1 Due to Hypoxia
Year
Pou
nds
(m
illio
ns)

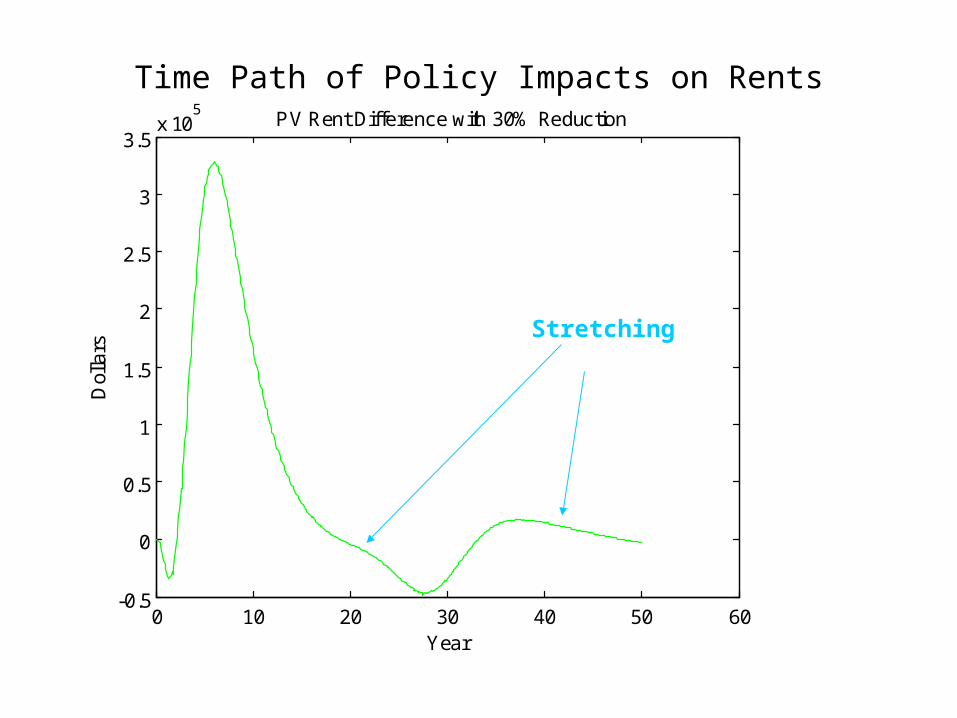
Time Path of Policy Impacts on Rents
0 10 20 30 40 50 60-0.5
0
0.5
1
1.5
2
2.5
3
3.5x 10
5 PV Rent Difference with 30% Reduction
Year
Dol
lars

0 10 20 30 40 50 60-0.5
0
0.5
1
1.5
2
2.5
3
3.5x 10
5 PV Rent Difference with 30% Reduction
Year
Dol
lars
Time Path of Policy Impacts on Rents
Long dynamicstroughs peaks
0 10 20 30 40 50 60-0.5
0
0.5
1
1.5
2
2.5
3
3.5x 10
5 PV Rent Difference with 30% Reduction
Year
Dol
lars
Time Path of Policy Impacts on Rents
Stretching
0 10 20 30 40 50 60-0.5
0
0.5
1
1.5
2
2.5
3
3.5x 10
5 PV Rent Difference with 30% Reduction
Year
Dol
lars
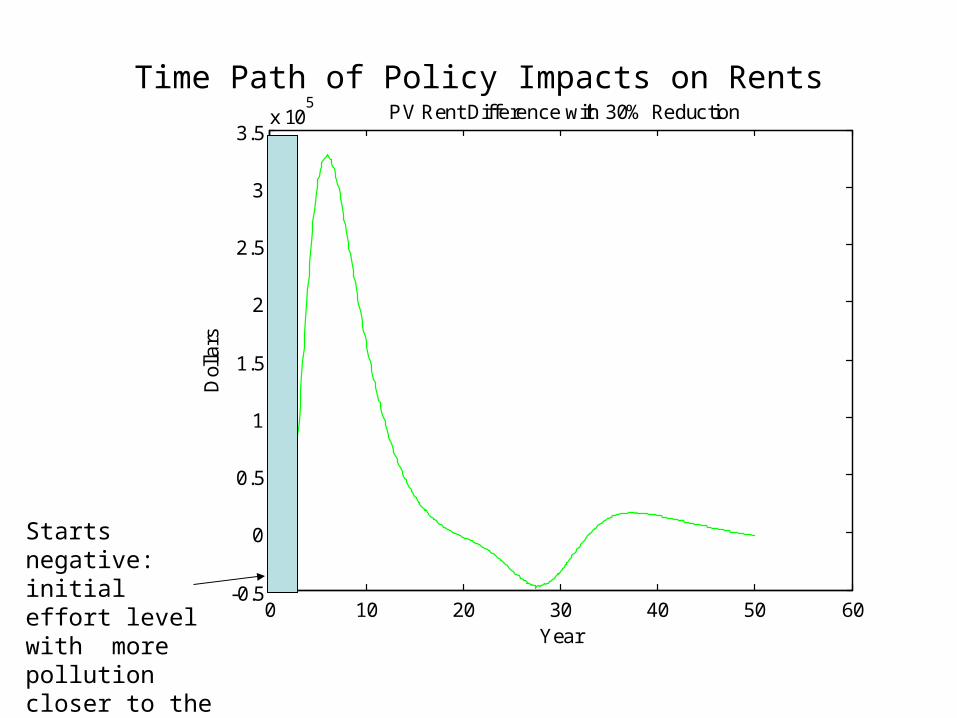
Time Path of Policy Impacts on Rents
Starts negative: initial effort level with more pollution closer to the optimal level

0 10 20 30 40 50 60-0.5
0
0.5
1
1.5
2
2.5
3
3.5x 10
5 PV Rent Difference with 30% Reduction
Year
Dol
lars
Time Path of Policy Impacts on Rents
Most of gains in first 15 years
0 10 20 30 40 50 60-0.5
0
0.5
1
1.5
2
2.5
3
3.5x 10
5 PV Rent Difference with 30% Reduction
Year
Dol
lars
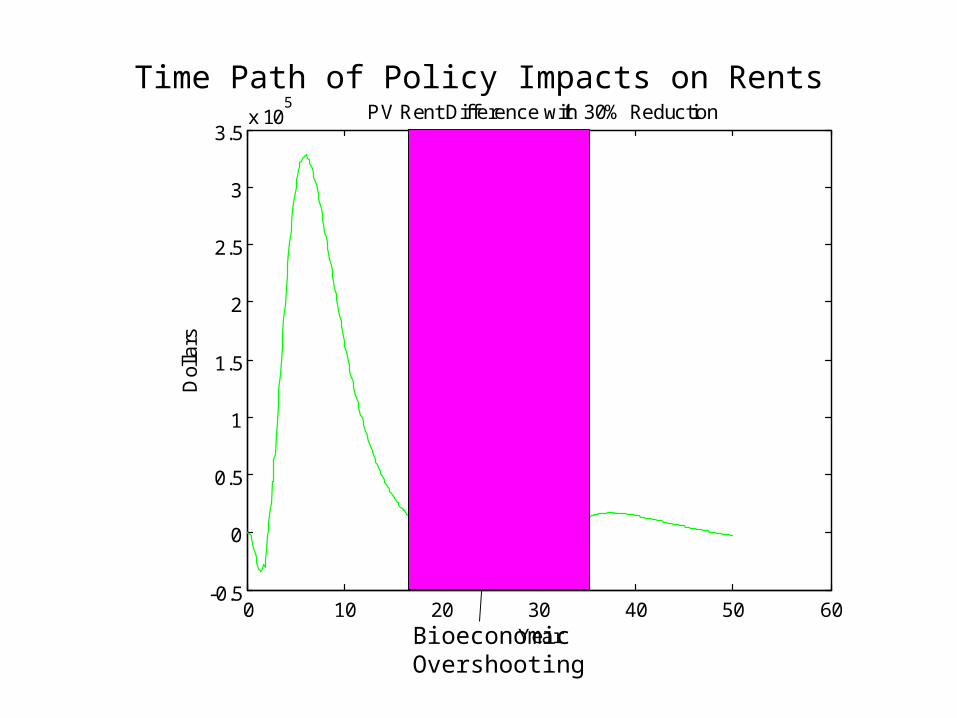
Time Path of Policy Impacts on Rents
Bioeconomic Overshooting

0 10 20 30 40 50 60-0.5
0
0.5
1
1.5
2
2.5
3
3.5x 10
5 PV Rent Difference with 30% Reduction
Year
Dol
lars
Time Path of Policy Impacts on Rents
Rent dissipation

Gains from reduced nutrient pollution could be much larger
under a rationalized fishery

Time Path of Policy Impacts on Catch
0 10 20 30 40 50 604.5
5
5.5
6
6.5
7
7.5
8
8.5
9
9.5x 10
6 Harvest Difference with 30% Reduction
Year
Pou
nds
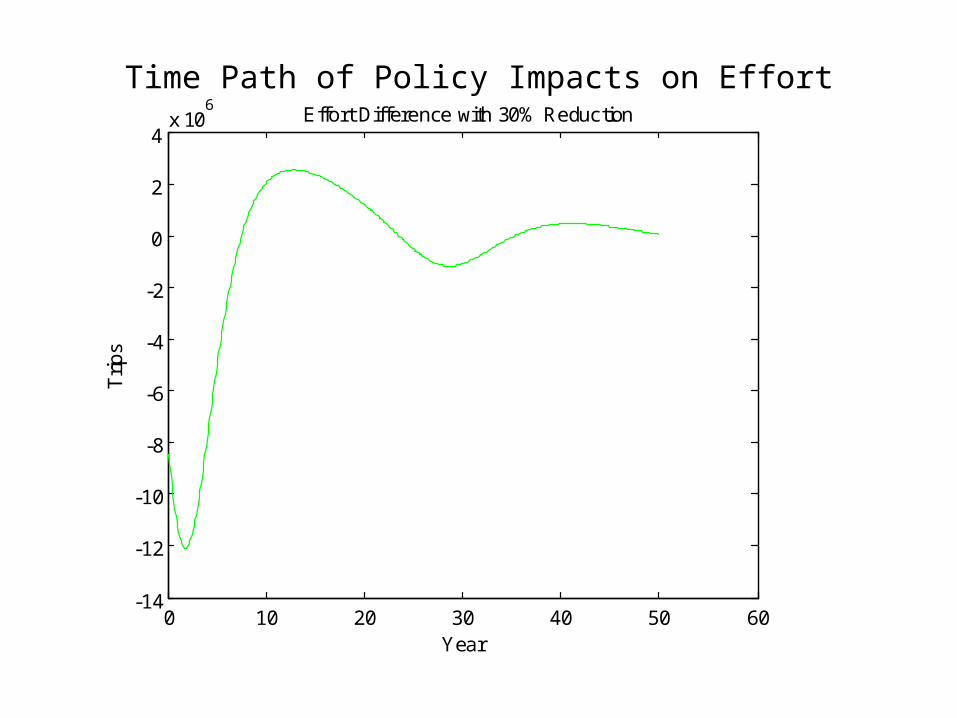
Time Path of Policy Impacts on Effort
0 10 20 30 40 50 60-14
-12
-10
-8
-6
-4
-2
0
2
4x 10
6 Effort Difference with 30% Reduction
Year
Tri
ps
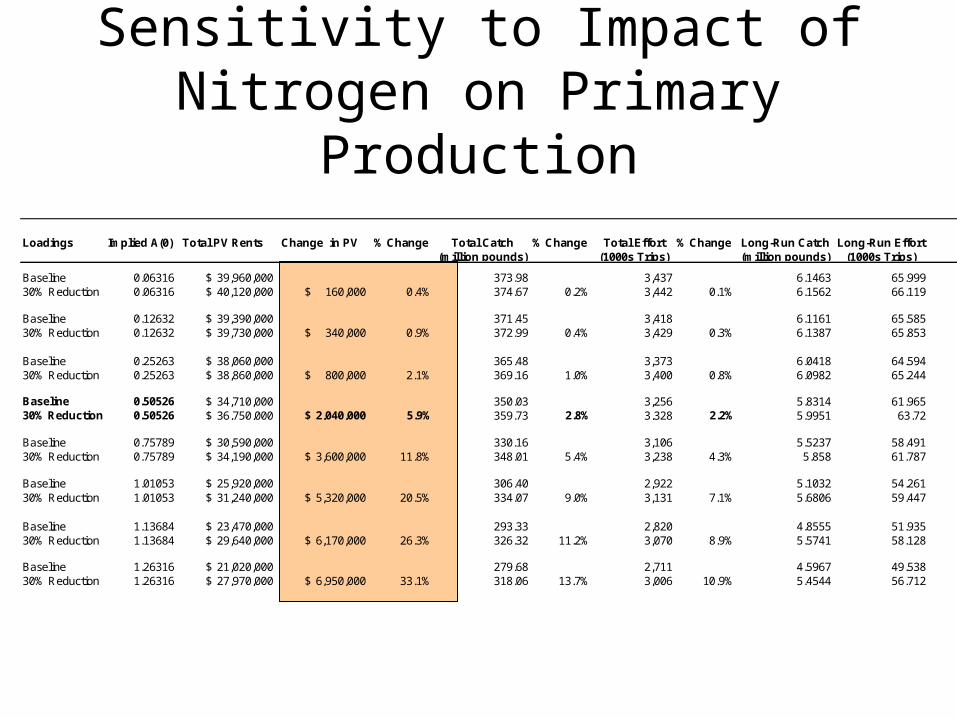
Loadings Implied A(0) Total PV Rents Change in PV % Change Total Catch % Change Total Effort % Change Long-Run Catch Long-Run Effort(million pounds) (1000s Trips) (million pounds) (1000s Trips)
Baseline 0.06316 39,960,000$ 373.98 3,437 6.1463 65.99930% Reduction 0.06316 40,120,000$ 160,000$ 0.4% 374.67 0.2% 3,442 0.1% 6.1562 66.119
Baseline 0.12632 39,390,000$ 371.45 3,418 6.1161 65.58530% Reduction 0.12632 39,730,000$ 340,000$ 0.9% 372.99 0.4% 3,429 0.3% 6.1387 65.853
Baseline 0.25263 38,060,000$ 365.48 3,373 6.0418 64.59430% Reduction 0.25263 38,860,000$ 800,000$ 2.1% 369.16 1.0% 3,400 0.8% 6.0982 65.244
Baseline 0.50526 34,710,000$ 350.03 3,256 5.8314 61.96530% Reduction 0.50526 36,750,000$ 2,040,000$ 5.9% 359.73 2.8% 3,328 2.2% 5.9951 63.72
Baseline 0.75789 30,590,000$ 330.16 3,106 5.5237 58.49130% Reduction 0.75789 34,190,000$ 3,600,000$ 11.8% 348.01 5.4% 3,238 4.3% 5.858 61.787
Baseline 1.01053 25,920,000$ 306.40 2,922 5.1032 54.26130% Reduction 1.01053 31,240,000$ 5,320,000$ 20.5% 334.07 9.0% 3,131 7.1% 5.6806 59.447
Baseline 1.13684 23,470,000$ 293.33 2,820 4.8555 51.93530% Reduction 1.13684 29,640,000$ 6,170,000$ 26.3% 326.32 11.2% 3,070 8.9% 5.5741 58.128
Baseline 1.26316 21,020,000$ 279.68 2,711 4.5967 49.53830% Reduction 1.26316 27,970,000$ 6,950,000$ 33.1% 318.06 13.7% 3,006 10.9% 5.4544 56.712
Sensitivity to Impact of Nitrogen on Primary Production

Sensitivity to Per Trip Costsc + delta Loadings Total PV Rents Change in PV % Change Total Catch % Change Total Effort % Change Long-Run Catch Long-Run Effort
(million pounds) (1000s Trips) (million pounds) (1000s Trips)
125 Baseline 46,160,000$ 2,312.30 3,427 4.4194 75.415125 30% Reduction 48,200,000$ 2,040,000$ 4.4% 2,376.20 2.8% 3,501 2.1% 4.4107 76.854
175 Baseline 39,880,000$ 2,815.40 3,381 3.2266 68.049175 30% Reduction 41,910,000$ 2,030,000$ 5.1% 2,892.40 2.7% 3,452 2.1% 3.3579 69.58
225 Baseline 35,480,000$ 3,327.90 3,285 5.092 62.488225 30% Reduction 37,530,000$ 2,050,000$ 5.8% 3,420.80 2.8% 3,356 2.2% 5.2579 64.242
240.45 Baseline 34,710,000$ 3,500.30 3,256 5.8314 61.965240.45 30% Reduction 36,750,000$ 2,040,000$ 5.9% 3,597.30 2.8% 3,328 2.2% 5.9951 63.72
275 Baseline 33,490,000$ 3,893.50 3,198 7.2743 61.9275 30% Reduction 35,460,000$ 1,970,000$ 5.9% 3,998.80 2.7% 3,270 2.2% 7.433 63.578
325 Baseline 31,870,000$ 4,444.20 3,125 8.5753 62.111325 30% Reduction 33,760,000$ 1,890,000$ 5.9% 4,560.70 2.6% 3,195 2.2% 8.7608 63.66
375 Baseline 29,990,000$ 4,954.60 3,056 9.417 61.396375 30% Reduction 31,820,000$ 1,830,000$ 6.1% 5,082.70 2.6% 3,125 2.3% 9.6477 62.899

Sensitivity to Speed of Adjustment
gamma Loadings Total PV Rents Change in PV % Change Total Catch % Change Total Effort % Change Long-Run Catch Long-Run Effort(million pounds) (1000s Trips) (million pounds) (1000s Trips)
15 Baseline 95,580,000$ 417.05 3,146 6.8259 62.95715 30% Reduction 101,070,000$ 5,490,000$ 5.7% 431.26 3.4% 3,212 2.1% 6.9181 64.57630 Baseline 53,430,000$ 375.67 3,231 5.7156 66.23430 30% Reduction 56,410,000$ 2,980,000$ 5.6% 386.45 2.9% 3,300 2.1% 5.9126 67.79940 Baseline 39,570,000$ 356.49 3,255 5.3732 63.28740 30% Reduction 41,870,000$ 2,300,000$ 5.8% 366.51 2.8% 3,326 2.2% 5.5471 65.005
45.37 Baseline 34,710,000$ 350.03 3,256 5.8314 61.96545.37 30% Reduction 36,750,000$ 2,040,000$ 5.9% 359.73 2.8% 3,328 2.2% 5.9951 63.72
50 Baseline 31,690,000$ 346.87 3,255 6.3955 61.76650 30% Reduction 33,530,000$ 1,840,000$ 5.8% 356.34 2.7% 3,327 2.2% 6.5498 63.51660 Baseline 27,500,000$ 345.14 3,256 7.2314 64.23860 30% Reduction 29,020,000$ 1,520,000$ 5.5% 354.19 2.6% 3,329 2.2% 7.3647 65.87975 Baseline 22,850,000$ 343.14 3,276 6.3191 67.4975 30% Reduction 24,040,000$ 1,190,000$ 5.2% 351.71 2.5% 3,349 2.2% 6.4492 68.987
100 Baseline 16,280,000$ 333.22 3,288 5.4752 61.917100 30% Reduction 17,160,000$ 880,000$ 5.4% 341.35 2.4% 3,360 2.2% 5.6434 63.478150 Baseline 11,820,000$ 331.88 3,295 6.4151 68.3150 30% Reduction 12,430,000$ 610,000$ 5.2% 339.79 2.4% 3,368 2.2% 6.532 70.026225 Baseline 7,960,000$ 326.87 3,292 7.0599 65.088225 30% Reduction 8,400,000$ 440,000$ 5.5% 334.48 2.3% 3,364 2.2% 7.345 66.928350 Baseline 5,290,000$ 324.81 3,302 6.9632 65.836350 30% Reduction 5,620,000$ 330,000$ 6.2% 332.13 2.3% 3,371 2.1% 7.3234 67.712

Discussion
• PV cost of permanent 30% reduction (from Schwabe, 2000) using 2.5% discount rate $259.7 million (2002 dollars)
• Blue crab benefits are <1% of this cost
• Open access the culprit?
• Benefits to other fisheries
• Non-fishery benefits of ecosystem services

Linking Models in Economics and Ecology
• Direction of Effects
• Magnitude of Effects
• Timing of Effects
• Parameter Lumping

Direction of Effects
• Prey response to hypoxia
• Hypoxia-induced catchability increase
• Nutrients and hormesis

Magnitude of Effects
• Carrying capacities and the pristine system
• Patch 2 as “insurance”

Timing of Effects
• Hysteresis in oxygen demand– Nitrogen stocks– Algae stocks
• Intrinsic growth rates – how fast predators, prey, and algae “recover”
• Economic speed of adjustment (both timing and magnitude)

Parameter lumping
• Like a partial reduced-form – Use available information to put structure on
the problem– Lumped parameters not directly measurable
quantities in nature
• Example: Prey Death Parameter– Lumps algae-dissolved oxygen and dissolved
oxygen-death together– Does not distinguish between “death” and
growth retardation

How does ecosystem value depend on the management institution?
Compare open access to optimal!

A “Quasi-Optimum”
• Grid Search over constant effort solutions– Search over total effort and share allocation to
the patches
• Lower bound on total rents
• Difference in rents not necessarily bigger or smaller

Preliminary Results
Open Quasi-Access Optimized
($millions) ($millions)
Baselline Rents (50 Years) 34.7 397.7PV Rent Increase from 30% Nitrogen Reduction 2.04 7.44% of Baseline 5.9% 1.9%

Biological Dispersal and Effort Allocation
Phi Constant Annual E Share in Patch 1(Total for Both Patches)
0 32500 0.492.5 32500 0.4025 32000 0.0950 32000 0.01
A Marine Reserve in the “dirty” patch
1 1 2 2( ) ( )Y t X t Y t X t

Crab Indifference
• Two countervailing forces:– Crabs move away from hypoxic zones –
increases relative prey availability– Hypoxia decreases absolute prey availability
• Crabs may respond to low oxygen at levels that are sub-lethal for prey
• Sink or source? A question for behavioral ecology

Preliminary Work on the Optimized Model
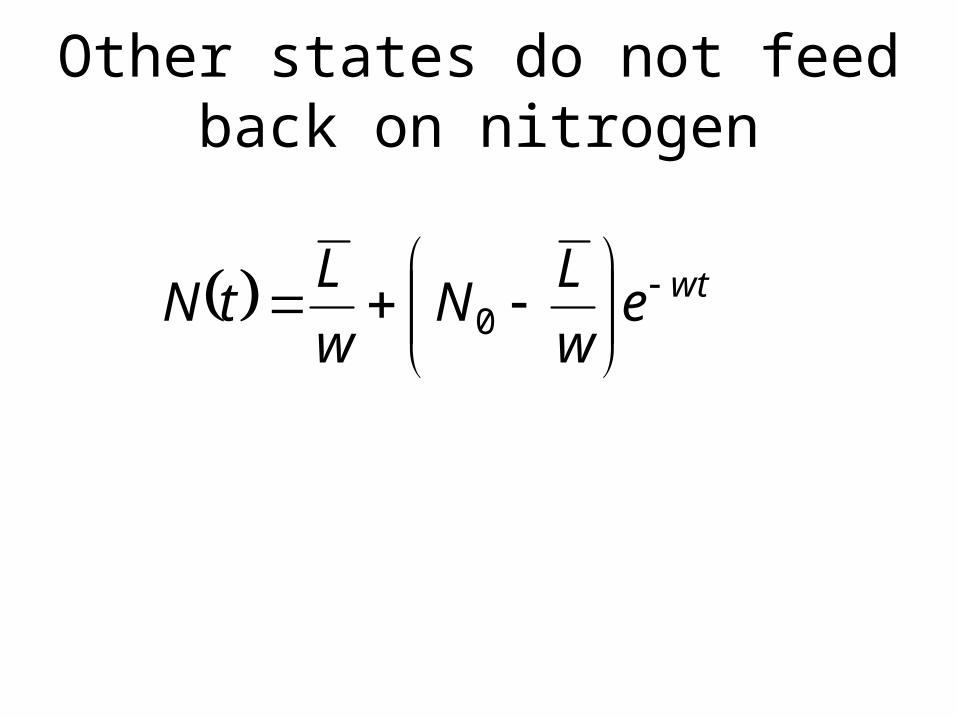
Other states do not feed back on nitrogen
wtew
LN
w
LtN
0
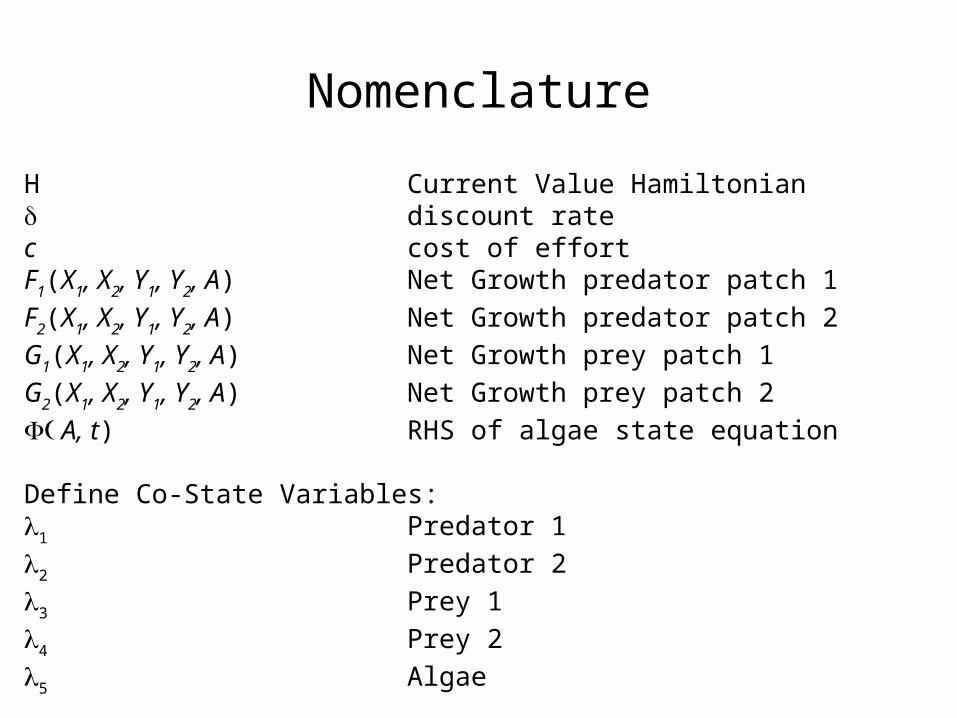
Nomenclature
H Current Value Hamiltonian discount ratec cost of effortF1(X1, X2, Y1, Y2, A) Net Growth predator patch 1
F2(X1, X2, Y1, Y2, A) Net Growth predator patch 2
G1(X1, X2, Y1, Y2, A) Net Growth prey patch 1
G2(X1, X2, Y1, Y2, A) Net Growth prey patch 2
A, t) RHS of algae state equation
Define Co-State Variables:1 Predator 1
2 Predator 2
3 Prey 1
4 Prey 2
5 Algae

Current Value Hamiltonian
tAG
GXqEF
XqEFEcpqXEcpqXH
,A ,Y ,Y ,X ,X
A ,Y ,Y ,X ,XA ,Y ,Y ,X ,X
A ,Y ,Y ,X ,X
5212124
21211322212122
112121112211

First Order Conditions
1
24
1
13
1
2211
1
11 X
G
X
G
X
FqE
X
F
2
24
2
13
2
1122
2
22 X
G
X
G
X
FqE
X
F
1
24
1
22
1
113
1
13 Y
G
Y
F
Y
F
Y
G
2
13
2
22
2
114
2
24 Y
G
Y
F
Y
F
Y
G
A
G
A
G
A
F
A
F
A
24
13
22
1155

First Order Conditions (cont.)
Two Switching Functions
11
1 qX
cpt
22
2 qX
cpt
Plus all of the original state equations.
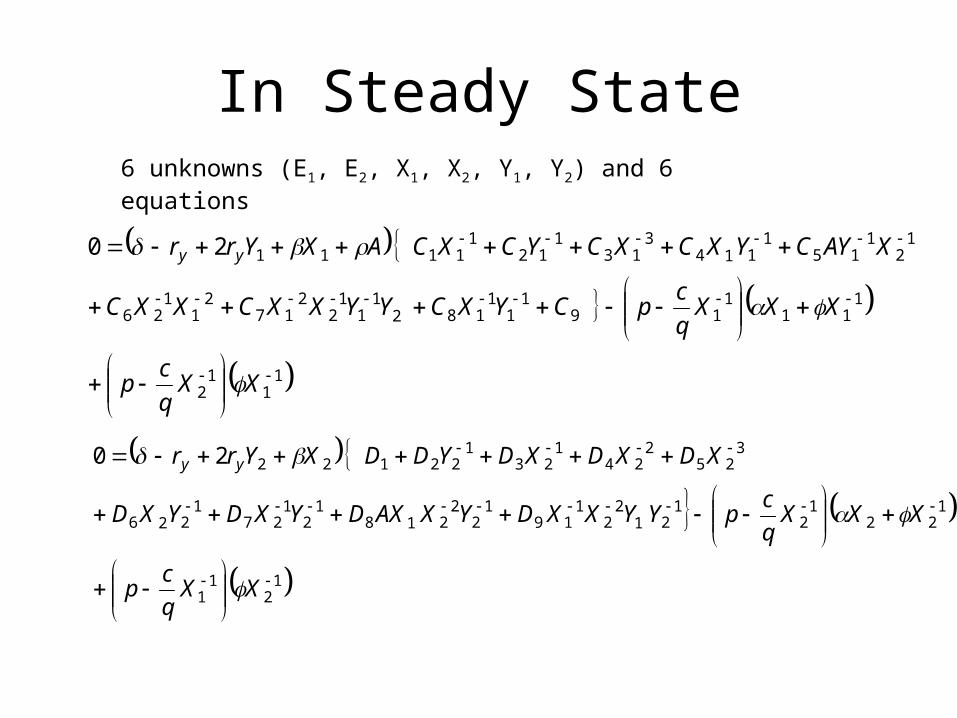
In Steady State6 unknowns (E1, E2, X1, X2, Y1, Y2) and 6 equations
12
11
122
12
121
22
119
12
2218
12
127
1226
325
224
123
12212220
XXq
cp
XXXq
cpYYXXDYXAXDYXDYXD
XDXDXDYDDXYrr yy
11
12
111
119
11
1182
11
12
217
21
126
12
115
1114
313
112
1111120
XXq
cp
XXXq
cpCYXCYYXXCXXC
XAYCYXCXCYCXCAXYrr yy
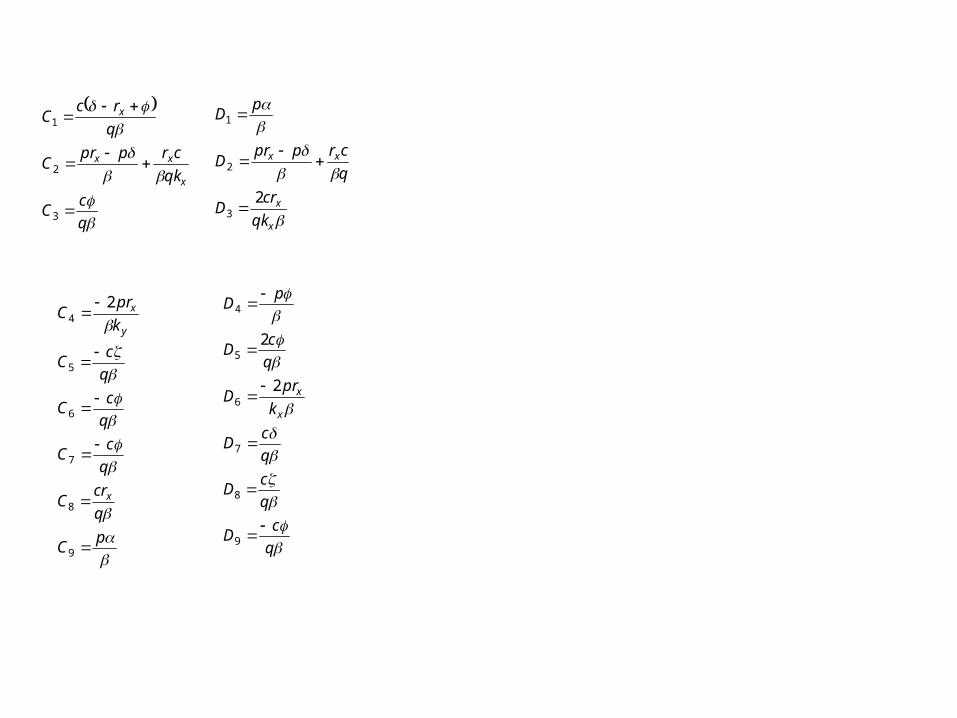
q
cC
qk
crpprC
q
rcC
x
xx
x
3
2
1
pC
q
crC
q
cC
q
cC
q
cC
k
prC
x
y
x
9
8
7
6
5
42
x
x
xx
qk
crD
q
crpprD
pD
23
2
1
q
cD
q
cD
q
cD
k
prD
q
cD
pD
x
x
9
8
7
6
5
4
2
2

Additional Figures

1 1.5 2 2.5 3 3.5 4 4.50.783
0.784
0.785
0.786
0.787Phase Space Patch 1 Populations
Predators (millions of pounds)
Pre
y (s
hare
of k
y)
1.5 2 2.5 3 3.5 4 4.5 5 5.50.994
0.995
0.996
0.997
0.998
0.999Phase Space Patch 2 Populations
Predators (millions of pounds)
Pre
y (s
hare
of k
y)
Populations when Initial Conditions are 200-year States

30% Reduction in Nitrogen – Initial Condition at ½ kx
0 10 20 30 40 50 600
5
10
15Patch 1 Predator Population
Year
Po
und
s (m
illio
ns)
0 10 20 30 40 50 600
5
10
15Patch 2 Predator Population
Year
Po
und
s (m
illio
ns)

30% Reduction in Nitrogen – Initial Condition at ½ kx
0 10 20 30 40 50 600.5
0.6
0.7
0.8
0.9Patch 1 Prey Population
Year
Sha
re o
f ky
0 10 20 30 40 50 600.5
0.6
0.7
0.8
0.9
1Patch 2 Prey Population
Year
Sha
re o
f ky

30% Reduction in Nitrogen – Initial Condition at ½ kx
0 10 20 30 40 50 603
4
5
6
7
8
9x 10
4 Total Fishing Effort
Year
To
tal T
rip
s P
er
Ye
ar
0 10 20 30 40 50 600.3
0.35
0.4
0.45
0.5Share of Effort in Patch 1
Year

30% Reduction in Nitrogen – Initial Condition at ½ kx
0 10 20 30 40 50 600
0.5
1
1.5
2
2.5x 10
7 Total Harvest
Year
Po
und
s
0 10 20 30 40 50 60-5
0
5
10
15x 10
6 Present Value Rents
Year
Do
llars

30% Reduction in Nitrogen – Initial Condition at ½ kx
0 10 20 30 40 50 60-0.5
0
0.5
1
1.5
2Migration Into Patch 1 from Relative Prey Availability
Year
Po
und
s (m
illio
ns)
0 10 20 30 40 50 60-10
-8
-6
-4
-2
0Migration from Patch 1 Due to Hypoxia
Year
Po
und
s (m
illio
ns)
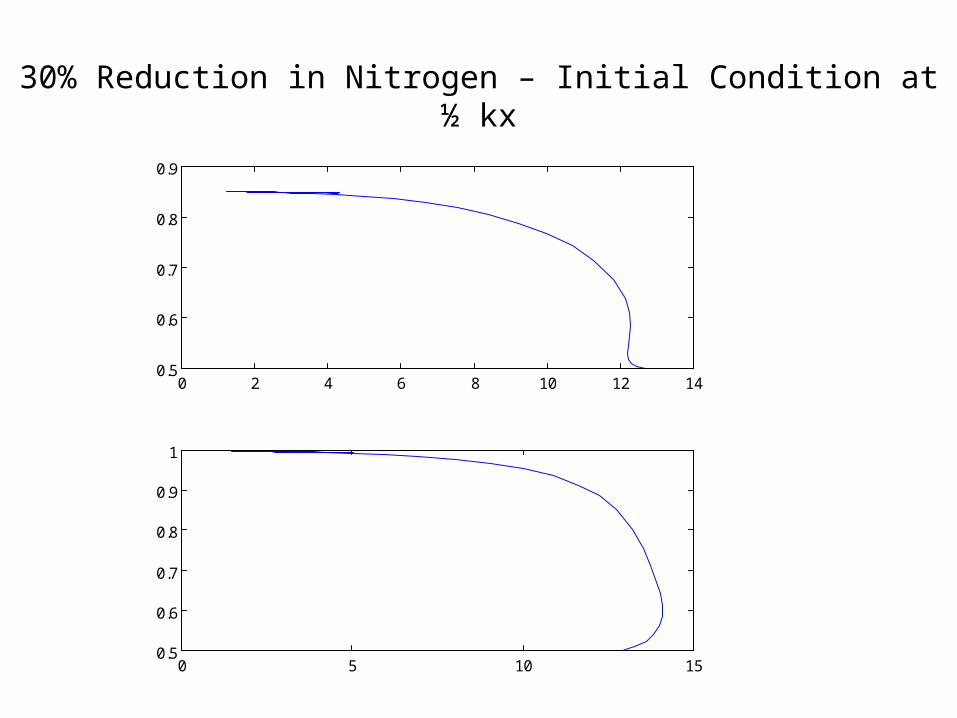
30% Reduction in Nitrogen – Initial Condition at ½ kx
0 2 4 6 8 10 12 140.5
0.6
0.7
0.8
0.9Phase Space Patch 1 Populations
Predators (millions of pounds)
Pre
y (s
hare
of k
y)
0 5 10 150.5
0.6
0.7
0.8
0.9
1Phase Space Patch 2 Populations
Predators (millions of pounds)
Pre
y (s
hare
of k
y)
Related Documents