Valuing Peace: The Effects of Financial Market Exposure on Votes and Political Attitudes Saumitra Jha Graduate School of Business Stanford University Moses Shayo Department of Economics The Hebrew University of Jerusalem * February 9, 2018 Abstract Financial markets expose individuals to the broader economy. Does participation in financial markets also lead individuals to re-evaluate the costs of conflict, their views on politics and even their votes? Prior to the 2015 Israeli elections, we randomly assigned financial assets from Israeli and Palestinian companies to likely voters and gave them incentives to actively trade for up to seven weeks. Opportunities to trade in financial markets systematically shifted vote choices and increased support for peace initiatives. These effects persist a year after the experiment, and appear consistent with financial market exposure leading to increased awareness of the economic risks of conflict. JEL codes: C93, D72, D74, N2, O12 * Emails:[email protected] ; [email protected]. We are particularly grateful to Marcella Aslan, Yair Assaf-Shapira, Eli Berman, Elchanan Ben-Porath, Kate Casey, Arun Chandrashekhar, John Cochrane, Esther Duflo, Ido Erev, Jim Fearon, Raquel Fernandez, Avner Greif, Nir Halevy, Ori Hef- fetz, Keith Krehbiel, David Laitin, Jessica Leino, Neil Malhotra, Joram Mayshar, Stelios Michalopoulos, Melanie Morten, Ilan Noy, Rohini Pande, Jean-Phillippe Platteau, Sol Polachek, Huggy Rao, Debraj Ray, Ken Singleton, Francesco Trebbi, Asaf Zussman, Stanford GSB PE and finance groups, and numerous seminar and conference participants for valuable comments and suggestions. Financial support from the Stanford Institute for Entrepreneurship in Developing Economies (SEED) is gratefully acknowledged. Gurpal Sran and Ohad Dan provided much valued research assistance.

Welcome message from author
This document is posted to help you gain knowledge. Please leave a comment to let me know what you think about it! Share it to your friends and learn new things together.
Transcript

Valuing Peace:The Effects of Financial Market Exposure on Votes
and Political Attitudes
Saumitra JhaGraduate School of Business
Stanford University
Moses ShayoDepartment of Economics
The Hebrew University of Jerusalem∗
February 9, 2018
Abstract
Financial markets expose individuals to the broader economy. Does participation infinancial markets also lead individuals to re-evaluate the costs of conflict, their viewson politics and even their votes? Prior to the 2015 Israeli elections, we randomlyassigned financial assets from Israeli and Palestinian companies to likely votersand gave them incentives to actively trade for up to seven weeks. Opportunities totrade in financial markets systematically shifted vote choices and increased supportfor peace initiatives. These effects persist a year after the experiment, and appearconsistent with financial market exposure leading to increased awareness of theeconomic risks of conflict.
JEL codes: C93, D72, D74, N2, O12
∗Emails:[email protected]; [email protected]. We are particularly grateful to Marcella Aslan,Yair Assaf-Shapira, Eli Berman, Elchanan Ben-Porath, Kate Casey, Arun Chandrashekhar, JohnCochrane, Esther Duflo, Ido Erev, Jim Fearon, Raquel Fernandez, Avner Greif, Nir Halevy, Ori Hef-fetz, Keith Krehbiel, David Laitin, Jessica Leino, Neil Malhotra, Joram Mayshar, Stelios Michalopoulos,Melanie Morten, Ilan Noy, Rohini Pande, Jean-Phillippe Platteau, Sol Polachek, Huggy Rao, Debraj Ray,Ken Singleton, Francesco Trebbi, Asaf Zussman, Stanford GSB PE and finance groups, and numerousseminar and conference participants for valuable comments and suggestions. Financial support from theStanford Institute for Entrepreneurship in Developing Economies (SEED) is gratefully acknowledged.Gurpal Sran and Ohad Dan provided much valued research assistance.

1 Introduction
Public attention in societies facing violent conflict is often focused on ethnic animosities,
fatalities, territorial disputes and military considerations, rather than on the economics.
In this paper, we test whether a historically important, but nowadays relatively neglected,
mechanism—exposure to financial markets—can lead individuals to reevaluate the costs
of conflict and to change their political choices to support peace initiatives.
The basic idea is straightforward: compared to commonplace daily transactions, fi-
nancial markets expose individuals to the broader economy, and from a broader economic
perspective, conflicts tend to be very costly (eg Blattman and Miguel, 2010, World Bank,
2011). Indeed, the hypothesis that market exposure affects attitudes towards conflict is
very old, dating back at least to Montesquieu (1748): “Commerce is a cure for the most
destructive prejudices; it is almost a general rule that wherever the ways of man are gentle
there is commerce; and wherever there is commerce, there the ways of men are gentle.”
Theoretically, financial markets may change political attitudes as they can demonstrate
the shared risks from conflict and the returns from peace. Empirically, however, mea-
suring the causal effect of financial markets is very difficult, as individuals’ investment
opportunities and decisions are associated with numerous factors that could potentially
affect political choices.
This paper presents results from the first study to experimentally assign individuals
financial assets, allow them to trade in those assets, and trace the effects on their political
views and behavior. We do this in the context of a geopolitically important and highly
persistent ethnic conflict—that between Israelis and Palestinians. This is a challenging
setting: conflicting interests and distrust reinforced by more than eighty years of recurrent
violence have produced seemingly entrenched ethnic animosities, to the point that many
consider the conflict intractable.
Yet, the potential economic gains from peace are also large. The (non-partisan)
Rand Corporation estimates that a two-state solution, which it also regards as the most
likely to succeed, will yield Israelis an economic dividend of $123 billion over ten years,
and Palestinians $50 billion (Anthony et al., 2015). In contrast, a return to widespread
conflict would lower Israeli GDP by $250 billion and Palestinian GDP by $46 billion over
the same period (see also Eckstein and Tsiddon, 2004).
Why then has a peace agreement proven so elusive? Among the many possible reasons
for this, there are two that are particularly relevant for our study. First, as we describe
below, the central debate in Israeli politics lies in weighing the risks and returns of
maintaining status quo policies against the risks and returns of making concessions for
peace. Second, in their day-to-day interactions, individuals may have very different
2

exposure and familiarity with the risks faced by the economy as a whole. Can exposure
to financial markets that provide broader exposure to these risks also change attitudes
towards peace initiatives, and even voting decisions?
A month and a half prior to the highly contested 2015 Israeli elections, we randomly
assigned 1345 Jewish Israeli voters to either a financial asset treatment or a control
group. Individuals in the treatment group received either vouchers that could be used
to invest in specific stocks, or endowments of assets that tracked the value of specific
indices or company stocks from both Israel and the Palestinian Authority. Participants
were given incentives to learn about the performance of their asset and to make weekly
decisions to buy or sell part of their portfolio. We cross-randomized the dates at which
individuals would be divested of their portfolio to be either before or after the elections,
and randomly assigned the initial value of the portfolio (either NIS 200 (∼$50) or NIS
400 (∼$100)).
Individuals also participated in a parallel series of surveys that allowed us to track not
only their investment behavior but also their political attitudes and their vote choices.
Importantly, the surveys were designed so that participants answered the political surveys
separately, and they did not associate them with the financial study. This novel approach
helps rule out potential social desirability biases or experimenter demand effects that
often plague studies on peacemaking. Section 3 details how this was achieved and verified.
Our main result (Section 5) is that exposure to financial markets causes large and
systematic shifts in individuals’ vote choices in the 2015 elections.1 Exposure to the stock
market reduces the probability of voting for parties skeptical of peace negotiations—
known in Israel as the right—by about 4 to 5 percentage points (relative to their vote
share of 36% in the control). In particular, it reduces support for the incumbent Likud
party, headed by Benjamin Netanyahu, by 4 to 5 percentage points (relative to 20% in the
control). At the same time, it increases the probability of voting for parties that support
restarting the peace process—the left—by 4 to 6 percentage points (relative to 25% in
the control). This mainly reflects a 3 to 5 percentage points increase in the probability
of voting for the chief opposition party, The Zionist Union, which includes the Labour
party.
Consistent with random assignment, these estimates are unaffected by controlling
for individuals’ vote choices in the recently held 2013 elections, as well as education,
income levels, region, religiosity, risk and time preferences, initial financial literacy and
other characteristics. In terms of magnitude, these effects are comparable to recently
1A desirable feature of the Israeli setting from an academic perspective is that the entire countrycomprises a single constituency of 5.9 million eligible voters. Thus our study had no effect on theelection outcomes themselves.
3

estimated effects of changes in security risks—e.g., living in a town within the rocket
range of Hamas-dominated Gaza—on Israeli voters (Berrebi and Klor, 2008, Getmansky
and Zeitzoff, 2014).
Section 6 exploits the sub-treatments and detailed survey questions to shed light on
the underlying mechanisms. The analysis here is more exploratory in nature, as we move
away from the one-treatment one-outcome framework to multiple, potentially under-
powered, sub-treatments and multiple outcomes, some of which are attitudes rather than
chosen behavior. Nonetheless, we believe the results are illuminating.
We start with two key alternative explanations: that the exposure to financial markets
gave participants a direct material incentive to change their vote, or that it induced a
change in their policy preferences. Given that peace overtures tend to raise both Israeli
and Palestinian asset prices (Zussman, Zussman and Nielsen, 2008), individuals holding
stocks on Election Day may have a direct material incentive to vote for parties that
favor the peace process. Inconsistent with the material incentive channel, however, we
find that the treatment effect is at least as strong for participants already divested by
election day. In fact those that had realized losses in the stock market prior to the
election were more likely to change their voting decision than those still invested but
with paper losses, a pattern consistent with an increased sensitivity to risks among those
with realized losses (Imas, 2016).
Instead of responding to some direct material incentive, the evidence suggests that
individuals exposed to financial markets develop different policy preferences over peace
initiatives. They increase their support not only for the general principle of a two-state
solution, but also for specific, and costly, concessions for peace. These effects on attitudes
are specific to the peace process: if anything, individuals’ preferences over economic
policies shift slightly to the right.
We next use survey responses to better understand why these policy preferences
change. We find that treated individuals appear to reevaluate the risks and benefits of the
status quo versus restarting the peace process. Specifically, when evaluating the effects
of a peace agreement with the Palestinians, individuals exposed to financial markets tend
to predict better outcomes for Israel’s economy. This effect is again greater for the risk-
averse, suggesting that treated individuals perceive greater risks associated with status
quo policies relative to the risks of negotiating for peace. Relatedly, treated individuals
appear (somewhat) more likely to see economic issues—rather than security—as central
to the election. They also report being more familiar with the stock market, are more
likely to know how the stock market performed recently, and become more likely to follow
financial media. In Jha and Shayo (2018) we also report findings that treated individuals
4

become more financially literate. In contrast, we find little evidence for either a wealth
effect or an effect on individuals’ mood or subjective well-being.
A further question is whether the treatment effects are transitory, perhaps reflecting
short-term attention to economics, or that even a short intensive exposure to financial
markets can lead to lasting re-evaluations of political positions. Strikingly, we find ev-
idence that the effects on voting intentions persist even a year after the intervention.
Indeed, we cannot rule out the possibility that the treatment changes more minds in the
long run than in the immediate run-up to the election.
Finally, we examine the differences between holding in-group (Israeli) vs out-group
(Palestinian) assets. On the one hand, the out-group assets could have larger effects
as they expose individuals to new sets of considerations and shared risks, and are more
likely to demonstrate the connection between financial markets and the peace process.
On the other hand, out-group assets are less familiar, and there may also be stigma
and psychological costs associated with “trading with the enemy”. Indeed, individuals
assigned domestic stocks are more likely to take up assets and are more engaged. Our
prior was that the former factors would dominate. Ultimately, however, domestic assets
turned out to have greater returns, strengthening their effects, and the overall effects
ended up being quite similar.
An important feature of our intervention is that, unlike campaigns that distribute
potentially contentious information that might be perceived as propaganda, our inter-
vention is unobtrusive and non-paternalistic. It encourages individuals to learn about
stock markets on their own and leaves them to draw their own conclusions about the
economic costs of different policies. Further, while the treatment is quite intensive, it
does not require prohibitively high stakes or long durations: assigning $50 worth of assets
appears almost as effective as assigning $100, and meaningful effects emerge after four
weeks of exposure. These elements, along with the fact that it is not necessary to expose
individuals to the assets of the other party to the conflict, arguably raise the potential
for implementing the intervention at scale and in a wide range of settings.
This paper naturally links to a large literature on conflict and underdevelopment. An
important body of work shows that places that experienced violence historically tend to
be more prone to future violence, often due to changes in culture or a polarization of social
attitudes (eg Voigtlander and Voth, 2012, Besley and Reynal-Querol, 2014, Shayo and
Zussman, 2011, 2017, Sambanis and Shayo, 2013). A smaller, parallel, literature examines
how economic interests may offset these passions and mitigate violence (Hirschman, 1977,
Martin, Mayer and Thoenig, 2008, Rohner, Thoenig and Zilibotti, 2013, Jha, 2013, 2014,
Grosfeld, Sakalli and Zhuravskaya, 2017, Becker and Pascali, 2016). To the best of our
5

knowledge, however, the causal effects of market interaction on individual-level choices
and attitudes towards conflict remain to be studied.
More generally, failures of the Political Coase Theorem have been blamed not only for
conflict but also for underdevelopment around the world (eg Acemoglu and Robinson,
2000, Rajan, 2006, Fearon, 1996). Yet, by allowing individuals to share in the future
gains from the economy and exposing them to novel risks and broader economic consid-
erations, financial assets can also align interests against conflict and in favor of beneficial
reforms. In fact, exposure to novel financial assets appears to have had historical suc-
cess at mitigating social conflict in three revolutionary states that subsequently led the
world in economic growth: England, the United States and Japan (Jha, 2012, 2015, Jha,
Mitchener and Takashima, 2017).
Motivated by these historical cases, our contribution lies in examining, experimentally,
whether properly designed financial exposure can have meaningful effects in a contem-
porary environment. Further, unlike this literature, we are able to show that exposure
to financial markets can affect policy preferences even without directly creating a signif-
icant personal financial stake, by helping individuals to re-evaluate the risks and returns
of conflict and peace.
Beyond the substantive contribution, our paper makes two methodological contri-
butions. First, we innovate relative to the existing finance literature by implementing
random assignment to empirically identify the causal effects, not only of exposure to
financial assets but also of opportunities to trade those assets, on individual political
behavior, knowledge and attitudes.2 More broadly, the micro-finance and financial inclu-
sion literature in development has made extensive use of random assignment of different
financial services, such as savings accounts (Karlan and Morduch, 2010, provides a useful
overview). Methodologically, the most closely related paper is Bursztyn et al. (2014),
who assign a financial asset randomly among those that chose to purchase it through a
brokerage firm, and find that holding this asset has effects on take up by peers. However,
no study, to our knowledge, has thus-far randomly assigned opportunities to trade in
financial markets. We develop our own simplified trading platform that allows inexperi-
enced individuals to both hold and trade in assets that track real stocks at their actual
market prices. Notably, participants do not need to go through the process of purchasing
the assets themselves, as everything is done through our platform. This offers a method
2The existing literature on the effects of financial market exposure on political attitudes exclusivelyuses observational data. The closest paper to our’s, substantively, is Jha (2015), who exploits thecoincidence of individual politicians’ abilities to sign legally binding share contracts with novel shareofferings by overseas companies to identify the effect of shareholding on support for parliamentarysupremacy in the English Revolution.
6

of conducting experiments with an important set of factors that have thus far proven
very hard to randomize, certainly at scale.
Second, we use double-blinded samples in parallel surveys in order to measure treat-
ment effects. This mitigates problems that arise when subjects modify their self-reports
in response to the treatment (see Podsakoff et al., 2003 for a discussion of common biases
in this class). Our approach provides a useful addition to existing methods of address-
ing this problem which include the use of filler questions to distract individuals from
the purpose of the study, list experiments, or proxy outcome measures (like the Implicit
Association Test) that are considered less susceptible to conscious processes. Our use
of online panels can be scaled easily, particularly as internet penetration expands, reach
broad representative samples, and can potentially be applied to questions quite removed
from the political economy of conflict, both to other failures of the Political Coase The-
orem, and beyond.
2 Institutional and Political Context
Our study focuses on the March 2015 Israeli general elections. Israel is a parliamentary
democracy with proportional representation. Elections must be called at least every four
years. However, disagreements within the ruling coalition led the 2015 elections to be held
just a little over two years after the January 2013 elections. The intervening two years
also witnessed asset price rises during peace negotiations brokered by John Kerry, and
falls after their collapse, which culminated in the 2014 Gaza War (Appendix Figure A1).
This recent history is particularly valuable because the 2013 elections provide a recent
measure of participants’ (pre-treatment) vote choices. We focus on Jewish voters, who
comprise around 80% of the population.
It is important to stress that, rather than economic policies, the main dividing line
between the right and the left in Israeli politics focuses on the Israeli-Palestinian con-
flict.3 The Israeli right (led by the Likud party) largely favors the status quo, viewing
concessions for peace as highly risky and likely to lead to a major deterioration of the
security situation. In contrast, the left (led by The Zionist Union party) sees status quo
policies, including permitting settlements in the West Bank, as already costly and likely
to put Israel’s security and democracy at further risk. Instead it favors restarting the
3This also shows up very clearly in the voting patterns in our sample. In an OLS regression of orderedvote choice in 2015 on pre-treatment indices of individual attitudes towards peace concessions andtowards economic policies (all these measures are explained below), both indices are highly significant,with an R2 of 0.296. However, of this R2, the peace index is responsible for 0.279 (or 94.1%), while theeconomic policy index only accounts for 0.016 (or 5.4%).
7

peace process with the goal of finding a permanent solution to the conflict. Finally, while
many Israeli parties can be clearly classified as left or right based on this dimension,
other parties—which we will refer to as center—tend to focus on different issues and are
widely seen as potential members of a coalition led by either the Likud or by The Zionist
Union. These include the religious ultra-orthodox parties Shas and Yahadut HaTorah,
as well as parties focused on civic and economic issues, Yesh Atid and Kulanu.
A brief description of the position of the three largest parties in our dataset would
be useful. The first is the ruling party, the Likud, which won 23% of the vote in 2015.
The Likud did not publish a formal platform in the 2015 elections, but being in power
since 2009 it is strongly associated with the status quo and skepticism towards the peace
process. On the eve of the elections, on March 16, 2015, the leader of the Likud, Prime
Minister Benjamin Netanyahu, argued that “Whoever moves to establish a Palestinian
state or intends to withdraw from territory is simply yielding territory for radical Islamic
terrorist attacks against Israel”, and stated that he would not allow a Palestinian state
if elected (Reuters, 2015).
The second major party is The Zionist Union, a joint list that includes the historic
Labour party and the smaller and more centrist Hatnuah party. The Zionist Union won
19% of the 2015 vote. Its 2015 platform stated that “reaching a diplomatic settlement [of
the conflict] is a foremost Israeli interest and a necessary condition for securing [Israel’s]
future as a Jewish and democratic country, enjoying widespread international support.”
The party further committed to restarting bilateral, regional and international negotia-
tions “with the aim of reaching a permanent settlement with the Palestinians, based on
the principle of two states for two peoples” (The Zionist Union, 2015, p. 5).
The third party is Yesh Atid, headed by ex-journalist Yair Lapid. In 2015 Yesh
Atid focused primarily on economic and civic issues that appeal to the secular middle
class, with much less emphasis on the conflict and no clear position on that issue.4 As
described in Section 3, at baseline we over-sampled Jewish individuals who had voted for
non-orthodox center parties in 2013, as these are considered Israel’s swing voters. Since
Yesh Atid is the main center party in Israel, its unweighted 2015 vote share in our sample
is 18% even though it won 9% of the general vote in 2015.5
4Whereas the opening chapter of the Zionist Union’s 2015 platform detailed specific national securityand peace initiatives, Yesh Atid ’s 2015 platform opened with a chapter on corruption, followed bychapters on the cost of living, housing, education, health and welfare. National security and diplomacywere brought up in the eighth chapter (just before small businesses). The chapter listed the manythreats Israel faced but did not commit to a clear policy, concluding that “Israel needs to develop acomprehensive national security conception, based on the development and reinforcement of military,political and economic power resources – and a proactive and active foreign policy – and act accordingly”(Yesh Atid, 2015, p. 110).
5As we shall discuss, undoing these weights does not change the overall pattern of results. Regarding
8

3 Experimental Design
We recruited 1681 anonymous individual participants from among Jewish Israeli citizens
who had previously voted and who participate in a large Israeli internet panel. This
panel of about 60,000 participants is nationally representative in terms of age and sex,
and is commonly used for commercial market research, political polling and academic
studies. The panel also has a particularly useful feature: anonymity in the identity of the
respondents from our perspective, and anonymity of the originators of different surveys
from the respondents’ perspective. This feature allows us to avoid social desirability
biases that often plague research on peace-building initiatives.
Individuals were invited to a study on investor behavior, and told that they would
be participating in several surveys and would be asked questions on various issues (the
invitation and survey instruments are available on our webpages.) They were informed
that they would be entered into a lottery to win either a financial asset or an initial
voucher of cash to invest in a financial asset, and that these assets would track the value
of specific stocks from the entire region.6 Among those that consented, we conducted
two parallel sets of surveys. Everyone received a set of surveys gauging their social and
political attitudes, and separately, their financial knowledge and economic preferences.
In addition, those that won the lottery received a survey each week in which to make
their financial investment decisions.
Importantly, the surveys were designed so that participants did not associate the
social surveys with the financial surveys. This was achieved by three features. First, as
mentioned above, our surveys were anonymous: they were among 110 sent to panelists
by anonymous sources during February and March. Second, we avoided any questions
related to the elections or the Israeli-Palestinian conflict in the financial surveys, and
similarly avoided any financial questions in the social surveys. Third, the assets we
selected to participate in the study were broad indices or the stocks of bricks and mortar
banks and telecoms companies rather than holding companies, companies with extensive
business in the West Bank or companies with overt ties to national defense.7
the remaining parties in our data: Meretz and the Arab Joint List are both clearly to the left of theZionist Union in terms of support for peace negotiations and willingness to withdraw from territoriesoccupied in the 1967 war. At the other extreme, Haam Itanu and Habayit Hayehudi are highly supportiveof Jewish settlements in the occupied territories and oppose any withdrawals, and as such are to theright of the Likud. Finally, Israel Beitenu, headed by Avigdor Lieberman, is potentially the hardest toplace as, from time to time, Lieberman positions himself more in the center on some issues. Nonethelesshe has always been either part of a right wing coalition or opposing it from the right. Classifying IsraelBeitenu as center does not affect our results.
6To avoid social desirability biases, each individual had some chance of being assigned stocks fromCyprus, Egypt, Jordan and Turkey in addition to Israeli and Palestinian stocks.
7The only defense company in the Tel Aviv 25 (TA-25), Elbit Systems, had a weight of only 3.26%.
9

Figure 1: What can the researchers learn from this study?
050
100
150
200
Elections
Politics
Econ. Knowledge
Interest in Mkts
Investor Choices
Risk Attitudes
Capital Market
Trust in Mkt
Increase Fin. Access
Sell Stocks
Which Stocks to Invest
Nothing
A Lot
Don't Know
Trust in Others
Foreign Fin. Mkts
Responses to an open-response question at the end of the trading period (March 12 or April 2) asking:
“What do you think the researchers can learn from the study?” Respondents only include the 840
participants who actually received treatment.
To verify whether these measures were effective, we asked our participants an open-
ended question on what they believed “the researchers can learn from the study” in
the concluding investment survey. The results are in Figure 1. Despite the surveys
running around the time of the polls, only one respondent mentioned the elections and
only seven mentioned any other relationship to politics. Of these, six thought the study
could inform how political views affect investment behavior, rather than the reverse.
The modal responses were that the study was about gauging economic knowledge, risk
attitudes, capital market behavior and investor choices. These are accurate responses
given that we study these as well.
As our main interest is in political behavior, we limited survey invitations to those that
had voted in the past. As mentioned above, we further over-sampled non-orthodox center
voters at twice their vote share.8 These swing voters are arguably the most politically
8That is, individuals who voted for the secular parties: Yesh Atid, Hatnuah or Kadimah in 2013. See
10

relevant since they often determine the electoral outcome. All respondents were asked
to fill out an initial financial survey on investment behavior and financial literacy. These
included their prior investment history (including whether they had traded stocks in the
last six months), and a battery of questions measuring financial literacy, risk aversion
and time preference (see survey instruments). A couple of days later they were invited
to answer an initial social survey which included questions on political behavior, social
and political attitudes, and well-being. Of the 1681 who completed the initial financial
survey, 1418 completed the initial social survey as well. Based upon the initial surveys,
we screened out those who provided incomplete answers, had been grossly inconsistent
when asked the same factual questions at different times, or had completed the survey
extremely quickly (see Figure A2 for details). This left 1345 participants to randomly
assign to the various treatments. The combined outcome of this sampling strategy is that
the sample used for random assignment approximates the broader Jewish population of
Israel in terms of geographical region and sex, but tends to be somewhat more educated
and secular, with fewer individuals over 55 and in the top-most income deciles (Appendix
Table A1).
Among these 1345 respondents, we employed a stratified block randomization proce-
dure designed to increase balance across treatment groups in political and demographic
variables.9 A sample of 309 were assigned to the control group, and 1036 were assigned
to the treatment group. Further, to help understand the mechanisms involved, partici-
pants within the treatment group were initially endowed with either vouchers to invest
in stocks, stocks from Israel or stocks from the Palestinian Authority, each of high or low
initial value, and each with redemption date either before or after the elections. Table 1
summarizes the basic design and initial allocation.
Every week, participants in the treatment group could reallocate up to 10% of their
holdings by buying or selling a particular financial asset, commission-free. This limit was
chosen to encourage individuals to learn by doing rather than simply choosing their entire
portfolios (or selling all their stocks) immediately. To further incentivize engagement with
the stock market, participants who did not enter a decision lost the 10% that they could
have traded that week. They could decide to neither sell nor buy, but they had to enter
a decision to avoid the loss.
also Figure 3.9Specifically, we created 104 blocks of 13 (less for one block), with the blocks created to stratify
sequentially on: 2013 vote choice (with parties ordered from left to right), sex, a dummy for whether theindividual traded stocks in the last 6 months, a dummy for whether the individual would recommendto a friend to invest in stocks from Arab countries, geographical region, discrepancies in their reportedvoting in the 2013 elections and a measure of their willingness to take risks. This creates relativelyhomogeneous blocks. Within each block we then randomize individuals into the subtreatments.
11

Table 1: Experimental Design
All NIS 200 NIS 400 All NIS 200 NIS 400Treatment 1036
Voucher to Invest 206 64 32 32 142 71 71Israeli Stocks 414 141 70 71 273 136 137Palestinian Stocks 416 141 71 70 275 137 138
Control 309
Redeem pre-elections Redeem post-electionsTotal
The 830 individuals who were initially assigned stock endowments could sell (and
later buy back) a specific stock or index fund. Of these, 414 were assigned assets from
Israel, evenly and randomly distributed between the Tel Aviv 25 Index as well as stocks
from a commercial bank—Bank Leumi—and a telecoms company, Bezeq. The remaining
416 were assigned assets from the Palestinian Authority, distributed evenly between the
Palestine Stock Exchange General Index as well as stocks from a commercial bank—the
Bank of Palestine—and a telecoms company, PALTEL.10 The 206 individuals who were
initially assigned vouchers could buy (and later sell) a specific index fund. Of these,
202 could trade an asset that tracked the Tel-Aviv 25 Index. In addition, four traded
for indices from Cyprus, Egypt, Jordan and Turkey.11 Both the voucher and the stock
groups traded on the same platform and received the same information, but naturally,
the main trading possibility faced by the voucher group was to buy while that of the
stock groups was to sell their asset.
About a third of the treatment group were fully divested of their assets the weekend
prior to the March 17 elections. The others could continue to trade in their assets until
10The specific companies were selected along two criteria: lack of overt connection to the Israeli-Palestinian peace process and comparability. PALTEL is the largest private employer in the PalestinianAuthority, while Bezeq was the former Israeli state telecoms monopoly. The Bank of Palestine is thePalestinian Authority’s largest commercial bank, while Bank Leumi literally means “National Bank”,and is one of the two largest banks in Israel.
The assets were in fact a derivative claim on the authors’ research funds rather than an actual purchaseof the underlying asset. This also meant that the study could not affect the asset prices directly evenfor those that are thinly traded. Since the Palestinian and other assets were listed in foreign currencysuch as Jordanian Dinars, we fixed the exchange rate for the duration of the experiment so that therewas no exchange rate risk for the Palestinian or other cross-national stocks. We disallowed short sales.
11We maintained these 4 assets to be consistent with the information provided to participants, thatthe stocks participating in the study are from the entire region (see footnote 6). Initially, we consideredassigning more individuals to neutral stocks, such as the Cyprus, Jordanian and Turkish market indicesand even the S&P 500. However, as our main motivation was to study the effects of holding financialassets that allowed individuals to learn about the economic costs of conflict, our first priority was tostudy the effects of exposure to the Israeli and Palestinian asset markets. Since assignment to neutralstocks would have been at the expense of the power of the main treatments, we ultimately chose to limitthis exposure to 4 individuals.
12

two weeks after the elections. Finally, about half of the participants in the treatment
group were given assets initially valued at NIS 200 (around $50), with the rest valued
at NIS 400 (around $100). While these sums are not large—they are comparable to the
average Israeli daily wage of around NIS 312 in December 2014—they are quite significant
compared to typical stakes in experimental economics, as well as relative to the standard
pay of NIS 0.1 per question these participants receive for our and other surveys.
All members of the treatment group were invited to an instructions survey in which
they were informed of their asset allocation (Figure A3), given detailed explanations
about the rules of the game, and quizzed to make sure they understood how the value
of their assets would be determined. 840 participants completed the instructions survey
and agreed to continue. The incomplete takeup probably reflects some self-selection as
well as differential willingness to hold different assets. Not surprisingly, the lowest takeup
was for the low (NIS 200) assets (77.2%, 78.4% and 78.6% for Israeli, Palestinian and
voucher endowments respectively). For the NIS 400 assets, vouchers had the highest
takeup (91.3%), followed by Israeli (86.1%) and Palestinian stocks (78.8%). Anticipating
this, we took special care to survey the outcomes of non-takers so we can estimate both
Treatment on the Treated (TOT) and more conservative Intent to Treat (ITT) effects.
The latter measure the effect of being assigned to treatment whether or not an individual
actually took up the assets. For TOT we use the random assignment to treatment as an
instrument for actual treatment.
The 840 participants who completed the instructions survey received weekly updates
about the price of their assigned asset and a statement of the composition and current
value of their financial portfolio. This was sent out after markets closed on the last
business day of the week (usually on Thursdays). We also provided links to the Hebrew
version of investing.com to allow individuals to independently track and verify the histor-
ical performance and current price of their stocks. Participants were then asked to make
their investment decisions and had until the opening of the stock market the following
week to do so. All trades were implemented via a trading platform incorporated into our
surveys (Figure A4).12 69% of the 840 participants entered a trading decision at every
opportunity they had and 80% did so in all but one week. Figure 2 provides a timeline
of the surveys and shows the performance of the assigned stocks over the course of the
experiment. As it turned out, the returns on each of the Israeli assets was ultimately
12Specifically, once the markets closed, we calculated for each individual: (1) the current number ofstocks they own given previous trading decisions, (2) the value of these stocks given current prices and(3) the amount of cash at their disposal. We then informed them of their trading possibilities, namelyhow much they could buy (depending on the amount of cash at their disposal) and how much they couldsell (depending on the amount of stocks owned). All trades were implemented at the current price, whichwas constant during the decision window.
13

Figure 2: Asset Prices during the Experiment and 2015 Elections.
BEZQ
LUMI
TA25
PLE
PALTEL
BOP
ea
rly d
ive
stm
en
t (1
/3)
fina
l fin
an
cia
l su
rve
y (2
/3)
ba
selin
e s
urv
ey
fina
nci
al t
rad
ing
tre
atm
en
t b
eg
ins
Ele
ctio
ns
post
sur
vey
info
rma
tion
su
rve
y
.8.9
11.
11.
2A
sset
Pric
e R
atio
(In
itial
Pric
e =
1)
February 1, 2015 March 1, 2015 April 1, 2015 May 1, 2015
Israeli stocks (Bezeq Telecoms (BEZQ), Bank Leumi (LUMI) and the Tel Aviv 25 (TA25)) are dashed
and blue, Palestinian stocks (Palestine Telecoms (PALTEL), Bank of Palestine (BOP) and the Pales-
tinian General Market Index (PLE)) are solid and green.
higher than those from the Palestinian economy.
Two days after the elections we surveyed all individuals on their vote choice as well
as attitudes towards the peace process. This provided data on the vote choice of 1291
participants. For the voting data, we were further able to augment and compare these re-
sponses to the participants’ routine updates to the survey company on their demographic
and voting data, as well as to our own (anonymous) information survey in April 2015.
There were very few discrepancies among the three, again consistent with an absence
of social desirability bias in responses.13 As a result, we benefit from very little attri-
tion in our main outcome variable: we observe the vote choice of 1311 out of the 1345
initially assigned to treatment (97.4% of the treatment group and 97.7% of the control,
13Of the 1040 participants who answered both our post election survey and the survey company’s,95.6% reported voting for the same party in both. The coefficient on the treatment indicator from aregression of the probability of reporting a matching vote in the two surveys is -0.008 (SE=0.0144),suggesting that discrepancies in reporting are also unrelated to treatment.
14

Table A3).14
4 Data
Table 2 compares the treatment and control groups across a broad range of pre-treatment
characteristics. We restrict attention to the 1311 individuals for whom we have the 2015
vote outcome. Column 3 reports the raw mean difference while Column 5 reports mean
differences within the 104 stratification bins. As expected from stratified random assign-
ment with low attrition rates, for almost all variables there are no significant differences
across treatment and control. Most importantly, we know how individuals voted just two
years prior to the 2015 elections that we study. As the top two rows show, about 24%
of our sample voted for right parties and about 13% voted for left (pro-peace process)
parties in 2013, with similar proportions across treatment and control groups. Figure 3A
shows balance party-by-party.
Attitudes towards making concessions for peace at baseline, and attitudes towards
left or right economic policies—measures that we will describe in more detail below—
are also similar across treatment and control. Around 36% of our sample in both the
treatment and control groups reported having traded stocks in the six months prior to
the experiment. The groups are also balanced by basic demographic characteristics,
including sex, marital status, education, religiosity, geographical location and income.
The groups have similar time preferences (based on standard hypothetical choices) and
similar financial literacy test scores. Two variables show small but statistically significant
differences. Individuals in the treatment group are somewhat younger on average (39.3
vs 41.5 years old) and consider themselves to be slightly more willing to take risks (an
average of 4.7 on a 1-10 scale, compared to 4.3 in the control). We control for these and
other demographic variables in our regressions (including a quadratic for age).15
14We have slightly higher attrition on the questions measuring attitudes towards the peace process,with a response rate of 95% (1277/1345).
15These slight age differences actually work against the main effect, as, unlike in the US, youngervoters in Israel are less likely to vote for the left (see also Table A8). Similarly, as we show below, theeffects are stronger for the risk-averse. To further check whether the number of significant differencesmight indicate a potential problem with the realization of our randomization procedure, we do thefollowing. We randomly assign the sample of 1311 individuals in Table 2 to fictitious treatment andcontrol groups, with the same proportions as those of the actual groups. We then perform the testsreported in columns 3-4 and count the number of significant differences. We repeat this procedure 500times. Appendix Figure A5 shows the distribution of the number of significant differences at the 10%level across simulations. Less than 6% of the simulations have zero significant differences and less than28% have less than two (the number we obtain). The number of differences significant at the 10% levelranges from 0 to 9, with an average of 2.64 across simulations. The number of differences significant atthe 5% level ranges from 0 to 7, with an average of 1.28.
15

Table 2: Descriptive Statistics and Balance Tests
Obs.
Treatment Control Diff. P-value Diff. P-value(1) (2) (3) (4) (5) (6) (7)
0.241 0.245 -0.004 0.881 0.000 0.964 1,311[0.428] [0.431] (0.028) (0.006)0.137 0.126 0.011 0.625 0.005 0.213 1,311
[0.344] [0.332] (0.022) (0.004)0.051 0.004 0.047 0.378 0.038 0.399 1,311
[0.823] [0.784] (0.053) (0.044)0.007 -0.005 0.012 0.757 0.011 0.752 1,311
[0.574] [0.596] (0.038) (0.036)0.355 0.368 -0.013 0.686 -0.018 0.290 1,311
[0.479] [0.483] (0.031) (0.017)0.521 0.513 0.008 0.806 0.009 0.470 1,311[0.5] [0.501] (0.033) (0.012)
39.289 41.530 -2.240 0.012 -2.142 0.011 1,311[13.394] [14.293] (0.892) (0.844)
0.230 0.232 -0.002 0.946 0.002 0.953 1,311[0.421] [0.423] (0.028) (0.027)0.148 0.152 -0.005 0.842 -0.005 0.834 1,311
[0.355] [0.36] (0.023) (0.024)0.426 0.427 -0.001 0.976 -0.005 0.860 1,311
[0.495] [0.495] (0.032) (0.031)0.598 0.629 -0.032 0.326 -0.033 0.295 1,311
[0.491] [0.484] (0.032) (0.031)0.627 0.636 -0.008 0.791 -0.014 0.582 1,311
[0.484] [0.482] (0.032) (0.025)0.164 0.172 -0.009 0.723 -0.005 0.823 1,311[0.37] [0.378] (0.024) (0.024)0.124 0.119 0.005 0.828 0.005 0.780 1,311[0.33] [0.325] (0.022) (0.018)0.085 0.073 0.012 0.493 0.014 0.222 1,311
[0.279] [0.26] (0.018) (0.012)0.091 0.096 -0.005 0.799 -0.004 0.800 1,311
[0.288] [0.295] (0.019) (0.017)0.097 0.089 0.008 0.689 0.009 0.595 1,311
[0.296] [0.286] (0.019) (0.017)0.142 0.123 0.019 0.395 0.021 0.291 1,311
[0.349] [0.328] (0.023) (0.020)0.290 0.298 -0.008 0.798 -0.007 0.766 1,311
[0.454] [0.458] (0.030) (0.023)0.194 0.212 -0.018 0.500 -0.024 0.276 1,311
[0.396] [0.409] (0.026) (0.022)0.104 0.116 -0.012 0.560 -0.010 0.596 1,311
[0.305] [0.321] (0.020) (0.018)0.081 0.066 0.015 0.392 0.015 0.341 1,311
[0.273] [0.249] (0.018) (0.016)10996 11162 -165.192 0.651 -231.199 0.511 1,286[5,567] [5,324] (365.176) (352.004)4.716 4.344 0.371 0.012 0.366 0.009 1,311
[2.265] [2.24] (0.148) (0.139)0.657 0.642 0.015 0.638 0.014 0.645 1,311
[0.475] [0.48] (0.031) (0.031)70.664 69.726 0.938 0.543 0.870 0.550 1,311
[23.359] [23.917] (1.541) (1.455)
Male
Voted Right '13
Voted Left '13
Peace Index
Economic Policy Index
Bought/Sold Shares in Last 6 Mths [0/1]
West Bank
Age [Yrs]
Post Secondary EducationBA Student
BA Graduate and Above
Married
Religiosity: Secular
Traditional
Religious
Ultra-Orthodox
MeanWithout FEs With Strata FEs
Difference in Means
Notes : Standard deviations in brackets in columns 1-2. Standard errors in parentheses in columns 3,6. Each entry in Columns 3-4 and 5-6 is derived from a separate OLS regression where the explanatory variable is an indicator for treatment group. Columns 5-6 control for 104 randomization strata fixed effects. +: mid-point of SES income categories.
Monthly Family Income [NIS]+Willing to Take Risks [1-10]Time preference median or aboveFinancial literacy: % correct
Region: Jerusalem
North
Haifa
Center
Tel Aviv
South
16

Figure 3: Vote in Treatment and Control Groups in 2013 and 2015
0.03
0.03
0.03
0.03
0.03
0.03
0.03
0.03 0.
040.
040.
040.
040.
040.
040.
040.
040.
040.
040.
040.
040.
040.
040.
040.
040.
040.
040.
040.
040.
040.
040.
040.
040.
040.
040.
040.
040.
040.
040.
040.
040.
040.
040.
040.
040.
040.
040.
040.
040.
040.
04
0.10
0.10
0.10
0.10
0.10
0.10
0.10
0.10
0.10
0.10
0.10
0.10
0.10
0.10
0.10
0.10
0.10
0.10
0.10
0.10
0.10
0.10
0.10
0.10
0.10
0.10
0.10
0.10
0.10
0.10
0.09
0.09
0.09
0.09
0.09
0.09
0.09
0.09
0.09
0.09
0.09
0.09
0.09
0.09
0.09
0.09
0.09
0.09
0.09
0.09
0.09
0.09
0.09
0.09
0.09
0.09
0.09
0.09
0.09
0.09
0.09
0.09
0.09
0.09
0.09
0.09
0.09
0.09
0.09
0.09
0.09
0.09
0.09
0.09
0.09
0.09
0.09
0.09
0.09
0.09
0.09
0.09
0.09
0.09
0.09
0.09
0.09
0.09
0.09
0.09
0.09
0.09
0.09
0.09
0.09
0.09
0.09
0.09
0.09
0.09
0.09
0.09
0.09
0.09
0.09
0.09
0.09
0.09
0.09
0.09
0.09
0.09
0.09
0.09
0.09
0.09
0.09
0.09
0.09
0.09
0.09
0.09
0.07
0.07
0.07
0.07
0.07
0.07
0.07
0.07
0.07
0.07
0.07
0.07
0.07
0.07
0.07
0.07
0.07
0.07
0.07
0.07
0.07
0.07
0.07
0.07
0.07
0.07
0.07
0.07
0.07
0.07
0.07
0.07
0.07
0.07
0.07
0.07
0.07
0.07
0.07
0.07
0.07
0.07
0.07
0.07
0.07
0.07
0.07
0.07
0.07
0.07
0.07
0.07
0.07
0.07
0.07
0.07
0.07
0.07
0.07
0.07
0.07
0.07
0.07
0.07
0.07
0.07
0.07
0.07
0.07
0.07
0.07
0.07
0.07
0.07
0.07
0.07
0.07
0.07
0.07
0.07
0.07
0.07
0.07
0.07
0.07
0.07
0.07
0.07
0.07
0.07
0.07
0.07
0.07
0.36
0.36
0.36
0.36
0.36
0.36
0.36
0.36
0.36
0.36
0.36
0.36
0.36
0.36
0.36
0.36
0.36
0.36
0.36
0.36
0.36
0.36
0.36
0.36
0.36
0.36
0.36
0.36
0.36
0.36
0.36
0.36
0.36
0.36
0.36
0.36
0.36
0.36
0.36
0.36
0.36
0.36
0.36
0.36
0.36
0.36
0.36
0.36
0.36
0.36
0.36
0.36
0.36
0.36
0.36
0.36
0.36
0.36
0.36
0.36
0.36
0.36
0.36
0.36
0.36
0.36
0.36
0.36
0.36
0.36
0.36
0.36
0.36
0.36
0.36
0.36
0.36
0.36
0.36
0.36
0.36
0.36
0.36
0.36
0.36
0.36
0.36
0.36
0.36
0.36
0.36
0.36
0.36
0.36
0.36
0.36
0.36
0.36
0.36
0.36
0.36
0.36
0.36
0.36
0.36
0.36
0.36
0.36
0.36
0.36
0.36
0.36
0.36
0.36
0.36
0.36
0.36
0.36
0.36
0.36
0.36
0.36
0.36
0.36
0.36
0.36
0.36
0.36
0.36
0.36
0.36
0.36
0.36
0.36
0.36
0.36
0.36
0.36
0.36
0.36
0.36
0.36
0.36
0.36
0.36
0.36
0.36
0.36
0.36
0.36
0.36
0.36
0.36
0.36
0.36
0.36
0.36
0.36
0.36
0.36
0.36
0.36
0.36
0.36
0.36
0.36
0.36
0.36
0.36
0.36
0.36
0.36
0.36
0.36
0.36
0.36
0.36
0.36
0.36
0.36
0.36
0.36
0.36
0.36
0.36
0.36
0.36
0.36
0.36
0.36
0.36
0.36
0.36
0.36
0.36
0.36
0.36
0.36
0.36
0.36
0.36
0.36
0.36
0.36
0.36
0.36
0.36
0.36
0.36
0.36
0.36
0.36
0.36
0.36
0.36
0.36
0.36
0.36
0.36
0.36
0.36
0.36
0.36
0.36
0.36
0.36
0.36
0.36
0.36
0.36
0.36
0.36
0.36
0.36
0.36
0.36
0.36
0.36
0.36
0.36
0.36
0.36
0.36
0.36
0.36
0.36
0.36
0.36
0.36
0.36
0.36
0.36
0.36
0.36
0.36
0.36
0.36
0.36
0.36
0.36
0.36
0.36
0.36
0.36
0.36
0.36
0.36
0.36
0.36
0.36
0.36
0.36
0.36
0.36
0.36
0.36
0.36
0.36
0.36
0.36
0.36
0.36
0.36
0.36
0.36
0.36
0.36
0.36
0.36
0.36
0.36
0.36
0.36
0.36
0.36
0.36
0.36
0.36
0.36
0.36
0.36
0.36
0.36
0.36
0.36
0.36
0.36
0.36
0.36
0.36
0.36
0.36
0.36
0.36
0.36
0.36
0.36
0.36
0.36
0.36
0.36
0.36
0.36
0.36
0.36
0.36
0.36
0.36
0.36
0.36
0.36
0.36
0.36
0.36
0.36
0.36
0.36
0.36
0.36
0.36
0.36
0.36
0.36
0.36
0.36
0.36
0.36
0.36
0.36
0.36
0.36
0.36
0.36
0.36
0.36
0.36
0.36
0.36
0.36
0.36
0.36
0.36
0.36
0.36
0.36
0.36
0.36
0.36
0.36
0.36
0.36
0.36
0.36
0.36
0.36
0.36
0.36
0.36
0.36
0.36
0.36
0.36
0.36
0.36
0.36
0.36
0.36
0.36
0.36
0.36
0.36
0.36
0.36
0.36
0.36
0.36
0.36
0.36
0.36
0.36
0.36
0.36
0.36
0.36
0.36
0.36
0.36
0.36
0.36
0.36
0.36
0.36
0.36
0.36
0.36
0.36
0.36
0.36
0.36
0.36
0.36
0.36
0.36
0.36
0.36
0.36
0.36
0.36
0.36
0.36
0.36
0.36
0.36
0.36
0.36
0.36
0.36
0.36
0.36
0.36
0.36
0.36
0.36
0.36
0.36
0.36
0.36
0.36
0.36
0.36
0.36
0.36
0.36
0.36
0.36
0.36
0.36
0.36
0.36
0.36
0.36
0.36
0.36
0.36
0.36
0.36
0.36
0.36
0.36
0.36
0.36
0.03
0.03
0.03
0.03
0.03
0.03
0.03
0.03
0.03
0.03
0.03
0.03
0.03
0.03
0.03
0.03
0.03
0.03
0.03
0.03
0.03
0.03
0.03
0.03
0.03
0.03
0.03
0.03
0.03
0.03
0.03
0.03
0.03
0.03
0.03
0.07
0.07
0.07
0.07
0.07
0.07
0.07
0.07
0.07
0.07
0.07
0.07
0.07
0.07
0.07
0.07
0.07
0.07
0.07
0.07 0.07
0.07
0.07
0.07
0.07
0.07
0.07
0.07
0.07
0.07
0.07
0.07
0.07
0.07
0.07
0.07
0.07
0.07
0.07
0.07
0.07
0.07
0.07
0.07
0.07
0.07
0.07
0.07
0.07
0.07
0.07
0.07
0.07
0.07
0.07
0.07
0.07
0.07
0.07
0.07
0.07
0.07
0.07
0.07
0.07
0.07
0.07
0.07
0.07
0.07
0.07
0.07
0.07
0.07
0.07
0.07
0.07
0.07
0.07
0.07
0.07
0.07
0.07
0.07
0.07
0.07
0.07
0.07
0.07
0.07
0.07
0.07
0.05
0.05
0.05
0.05
0.05
0.05
0.05
0.05
0.05
0.05
0.05
0.05
0.05
0.05
0.04
0.04
0.04
0.04
0.04
0.04
0.04
0.04
0.04
0.04
0.04
0.04
0.04
0.04
0.04
0.04
0.04
0.04
0.04
0.04
0.04
0.04
0.04
0.04
0.04
0.04
0.04
0.04
0.04
0.04
0.04
0.04
0.04
0.04
0.04
0.04
0.04
0.04
0.04
0.04
0.04
0.17
0.17
0.17
0.17
0.17
0.17
0.17
0.17
0.17
0.17
0.17
0.17
0.17
0.17
0.17
0.17
0.17
0.17
0.17
0.17
0.17
0.17
0.17
0.17
0.17
0.17
0.17
0.17
0.17
0.17
0.17
0.17
0.17
0.17
0.17
0.17
0.17
0.17
0.17
0.17
0.17
0.17
0.17
0.17
0.17
0.17
0.17
0.17
0.17
0.17
0.17
0.16
0.16
0.16
0.16
0.16
0.16
0.16
0.16
0.16
0.16
0.16
0.16
0.16
0.16
0.16
0.16
0.16
0.16
0.16
0.16
0.16
0.16
0.16
0.16
0.16
0.16
0.16
0.16
0.16
0.16
0.16
0.16
0.16
0.16
0.16
0.16
0.16
0.16
0.16
0.16
0.16
0.16
0.16
0.16
0.16
0.16
0.16
0.16
0.16
0.16
0.16
0.16
0.16
0.16
0.16
0.16
0.16
0.16
0.16
0.16
0.16
0.16
0.16
0.16
0.16
0.16
0.16
0.16
0.16
0.16
0.16
0.16
0.16
0.16
0.16
0.16
0.16
0.16
0.16
0.16
0.16
0.16
0.16
0.16
0.16
0.16
0.16
0.16
0.16
0.16
0.16
0.16
0.16
0.16
0.16
0.16
0.16
0.16
0.16
0.16
0.16
0.16
0.16
0.16
0.16
0.16
0.16
0.16
0.16
0.16
0.16
0.16
0.16
0.16
0.16
0.16
0.16
0.16
0.16
0.16
0.16
0.16
0.16
0.16
0.16
0.16
0.16
0.16
0.16
0.16
0.16
0.16
0.16
0.16
0.16
0.16
0.16
0.16
0.16
0.16
0.16
0.16
0.16
0.16
0.16
0.16
0.16
0.16
0.16
0.16
0.16
0.16
0.16
0.16
0.16
0.16
0.16
0.16
0.16
0.16
0.16
0.16
0.16
0.16
0.16
0.08
0.08
0.08
0.08
0.08
0.08
0.08
0.08
0.08
0.08
0.08
0.08
0.08
0.08
0.08
0.08
0.08
0.08
0.08
0.08
0.08
0.08
0.08
0.08
0.08
0.08
0.08
0.08
0.08
0.08
0.08
0.08
0.08
0.08
0.08
0.08
0.08
0.08
0.08
0.08
0.08
0.08
0.08
0.08
0.08
0.08
0.08
0.08
0.08
0.08
0.08
0.08
0.08
0.08
0.08
0.08
0.08
0.08
0.08
0.08
0.08
0.08
0.08
0.08
0.08
0.08
0.08
0.08
0.08
0.08
0.08
0.08
0.08
0.08
0.08
0.08
0.08
0.08
0.08
0.08
0.08
0.08
0.08
0.08
0.08
0.08
0.08
0.08
0.08
0.08
0.08
0.08
0.08
0.08
0.08
0.08
0.08
0.08
0.08
0.06
0.06
0.06
0.06
0.06
0.06
0.06
0.06
0.06
0.06
0.06
0.06
0.06
0.06
0.06
0.06
0.06 0.06
0.06
0.06
0.06
0.06
0.06
0.06
0.06
0.06
0.06
0.06
0.06
0.06
0.06
0.06
0.06
0.06
0.06
0.06
0.06
0.06
0.06
0.06
0.06
0.06
0.06
0.06
0.06
0.06
0.06
0.06
0.06
0.06
0.06
0.06
0.06
0.06
0.06
0.06
0.06
0.06
0.06
0.06
0.06
0.06
0.06
0.06
0.06
0.06
0.06
0.06
0.06
0.06
0.06
0.06
0.06
0.06
0.06
0.06
0.06
0.06
0.00
0.10
0.20
0.30
0.40
Mer
etz
Labo
rHa
tnua
hYe
sh A
tidKa
dima
Shas
Yaha
dut H
ator
ahLik
ud B
eiten
uHa
bayit
Hay
ehud
iOt
her
2013 Elections
0.00
0.00
0.00
0.03
0.03
0.03
0.03
0.03
0.03
0.03
0.03
0.03
0.03
0.05
0.05
0.05
0.05
0.05
0.05
0.05
0.05
0.05
0.05
0.05
0.05
0.05
0.05
0.05
0.05
0.05
0.05
0.05
0.05
0.05
0.05
0.05
0.05
0.05
0.05
0.05
0.05
0.05
0.05
0.05
0.05
0.05
0.05
0.05
0.05
0.05
0.05
0.05
0.05
0.05
0.05
0.05
0.05
0.05
0.05
0.05
0.05
0.05
0.05
0.05
0.05
0.05
0.05
0.05
0.22
0.22
0.22
0.22
0.22
0.22
0.22
0.22
0.22
0.22
0.22
0.22
0.22
0.22
0.22
0.22
0.22
0.22
0.22
0.22
0.22
0.22
0.22
0.22
0.22
0.22
0.22
0.22
0.22
0.22
0.22
0.22
0.22
0.22
0.22
0.22
0.22
0.22
0.22
0.22
0.22
0.22
0.22
0.22
0.22
0.22
0.22
0.22
0.22
0.22
0.22
0.22
0.22
0.22
0.22
0.22
0.22
0.22
0.22
0.22
0.22
0.22
0.22
0.22
0.22
0.25
0.25
0.25
0.25
0.25
0.25
0.25
0.25
0.25
0.25
0.25
0.25
0.25
0.25
0.25
0.25
0.25
0.25
0.25
0.25
0.25
0.25
0.25
0.25
0.25
0.25
0.25
0.25
0.25
0.25
0.25
0.25
0.25
0.25
0.25
0.25
0.25
0.25
0.25
0.25
0.25
0.25
0.25
0.25
0.25
0.25
0.25
0.25
0.25
0.25
0.25
0.25
0.25
0.25
0.25
0.25
0.25
0.25
0.25
0.25
0.25
0.25
0.25
0.25
0.25
0.25
0.25
0.25
0.25
0.25
0.25
0.25
0.25
0.25
0.25
0.25
0.25
0.25
0.25
0.25
0.25
0.25
0.25
0.25
0.25
0.25
0.25
0.25
0.25
0.25
0.25
0.25
0.25
0.25
0.25
0.25
0.25
0.25
0.25
0.25
0.25
0.25
0.25
0.25
0.25
0.25
0.25
0.25
0.25
0.25
0.25
0.25
0.25
0.25
0.25
0.25
0.25
0.25
0.25
0.25
0.25
0.25
0.25
0.25
0.25
0.25
0.25
0.25
0.25
0.25
0.25
0.25
0.25
0.25
0.25
0.25
0.25
0.25
0.25
0.25
0.25
0.25
0.25
0.25
0.25
0.25
0.25
0.25
0.25
0.25
0.25
0.25
0.25
0.25
0.25
0.25
0.25
0.25
0.25
0.25
0.25
0.25
0.25
0.25
0.25
0.25
0.25
0.25
0.25
0.25
0.25
0.25
0.25
0.25
0.25
0.25
0.25
0.25
0.25
0.25
0.25
0.25
0.25
0.25
0.25
0.25
0.25
0.25
0.25
0.25
0.25
0.25
0.25
0.25
0.25
0.25
0.25
0.25
0.25
0.25
0.25
0.25
0.25
0.25
0.25
0.25
0.25
0.25
0.25
0.25
0.25
0.25
0.25
0.25
0.25
0.25
0.25
0.25
0.25
0.25
0.25
0.25
0.25
0.25
0.25
0.25
0.25
0.25
0.25
0.25
0.25
0.25
0.25
0.25
0.25
0.25
0.25
0.25
0.25
0.25
0.25
0.25
0.25
0.25
0.25
0.25
0.25
0.25
0.25
0.25
0.25
0.25
0.25
0.25
0.21
0.21
0.21
0.21
0.21
0.21
0.21
0.21
0.21
0.21
0.21
0.21
0.21
0.21
0.21
0.21
0.21
0.21
0.21
0.21
0.21
0.21
0.21
0.21
0.21
0.21
0.21
0.21
0.21
0.21
0.21
0.21
0.21
0.21
0.21
0.21
0.21
0.21
0.21
0.21
0.21
0.21
0.21
0.21
0.21
0.21
0.21
0.21
0.21
0.21
0.21
0.21
0.21
0.21
0.21
0.21
0.21
0.21
0.21
0.21
0.21
0.21
0.21
0.17
0.17
0.17
0.17
0.17
0.17
0.17
0.17
0.17
0.17
0.17
0.17
0.17
0.17
0.17
0.17
0.17
0.17
0.17
0.17
0.17
0.17
0.17
0.17
0.17
0.17
0.17
0.17
0.17
0.17
0.17
0.17
0.17
0.17
0.17
0.17
0.17
0.17
0.17
0.17
0.17
0.17
0.17
0.17
0.17
0.17
0.17
0.17
0.17
0.17
0.17
0.17
0.17
0.17
0.17
0.17
0.17
0.17
0.17
0.17
0.17
0.17
0.17
0.17
0.17
0.17
0.17
0.17
0.17
0.17
0.17
0.17
0.17
0.17
0.17
0.17
0.17
0.17
0.17
0.17
0.17
0.17
0.17
0.17
0.17
0.17
0.17
0.17
0.17
0.17
0.17
0.17
0.17
0.17
0.17
0.17
0.17
0.17
0.17
0.17
0.17
0.17
0.17
0.17
0.17
0.17
0.17
0.17
0.17
0.17
0.17
0.17
0.17
0.17
0.17
0.17
0.17
0.17
0.17
0.17
0.17
0.17
0.17
0.17
0.17
0.17
0.17
0.17
0.17
0.17
0.17
0.17
0.17
0.17
0.17
0.17
0.17
0.17
0.17
0.17
0.17
0.17
0.17
0.17
0.17
0.17
0.17
0.17
0.17
0.17
0.17
0.17
0.17
0.17
0.17
0.17
0.17
0.17
0.17
0.17
0.17
0.17
0.17
0.17
0.17
0.17
0.17
0.17
0.17
0.17
0.17
0.17
0.08
0.08
0.08
0.08
0.08
0.08
0.08
0.08
0.08
0.08
0.08
0.08
0.08
0.08
0.08
0.08
0.08
0.08
0.08
0.08
0.08
0.08
0.08
0.080.09
0.09
0.09
0.09
0.09
0.09
0.09
0.09
0.09
0.09
0.09
0.09
0.09
0.09
0.09
0.09
0.09
0.09
0.09
0.09
0.09
0.09
0.09
0.09
0.09
0.09
0.09
0.09
0.09
0.09
0.09
0.09
0.09
0.09
0.09
0.09
0.09
0.09
0.09
0.09
0.09
0.09
0.09
0.09
0.09
0.09
0.09
0.09
0.09
0.09
0.09
0.09
0.09
0.09
0.09
0.09
0.09
0.09
0.09
0.09
0.09
0.09
0.09
0.09
0.09
0.09
0.09
0.09
0.09
0.09
0.09
0.09
0.09
0.09
0.09
0.09
0.09
0.09
0.09
0.09
0.09
0.09
0.09
0.09
0.09
0.09
0.03
0.03
0.03
0.03
0.03
0.03
0.03
0.03
0.03
0.030
.05
0.05
0.05
0.05
0.05
0.05
0.05
0.05
0.05
0.05
0.05
0.05
0.05
0.05
0.05
0.05
0.05
0.05
0.05
0.05
0.05
0.05
0.05
0.05
0.05
0.05
0.05
0.05
0.05
0.05
0.05
0.05
0.05
0.05
0.05
0.05
0.05
0.05
0.05
0.05
0.05
0.05
0.05
0.05
0.05
0.05
0.05
0.04
0.04
0.04
0.04
0.04
0.04
0.04
0.04
0.04
0.04
0.04
0.04
0.04
0.04
0.04
0.04
0.04
0.04
0.04
0.04
0.04
0.04
0.04
0.04
0.04
0.04
0.04
0.04
0.04
0.04
0.04
0.04
0.04
0.04
0.04
0.04
0.04
0.04
0.04
0.04
0.04
0.04
0.04
0.04
0.04
0.04
0.04
0.04
0.04
0.04
0.04
0.04
0.04
0.04
0.04
0.20
0.20
0.20
0.20
0.20
0.20
0.20
0.20
0.20
0.20
0.20
0.20
0.20
0.20
0.20
0.20
0.20
0.20
0.20
0.20
0.20
0.20
0.20
0.20
0.20
0.20
0.20
0.20
0.20
0.20
0.20
0.20
0.20
0.20
0.20
0.20
0.20
0.20
0.20
0.20
0.20
0.20
0.20
0.20
0.20
0.20
0.20
0.20
0.20
0.20
0.20
0.20
0.20
0.20
0.20
0.20
0.20
0.20
0.20
0.20
0.20
0.15
0.15
0.15
0.15
0.15
0.15
0.15
0.15
0.15
0.15
0.15
0.15
0.15
0.15
0.15
0.15
0.15
0.15
0.15
0.15
0.15
0.15
0.15
0.15
0.15
0.15
0.15
0.15
0.15
0.15
0.15
0.15
0.15
0.15
0.15
0.15
0.15
0.15
0.15
0.15
0.15
0.15
0.15
0.15
0.15
0.15
0.15
0.15
0.15
0.15
0.15
0.15
0.15
0.15
0.15
0.15
0.15
0.15
0.15
0.15
0.15
0.15
0.15
0.15
0.15
0.15
0.15
0.15
0.15
0.15
0.15
0.15
0.15
0.15
0.15
0.15
0.15
0.15
0.15
0.15
0.15
0.15
0.15
0.15
0.15
0.15
0.15
0.15
0.15
0.15
0.15
0.15
0.15
0.15
0.15
0.15
0.15
0.15
0.15
0.15
0.15
0.15
0.15
0.15
0.15
0.15
0.15
0.15
0.15
0.15
0.15
0.15
0.15
0.15
0.15
0.15
0.15
0.15
0.15
0.15
0.15
0.15
0.15
0.15
0.15
0.15
0.15
0.15
0.15
0.15
0.15
0.15
0.15
0.15
0.15
0.15
0.15
0.15
0.15
0.15
0.15
0.15
0.15
0.15
0.15
0.15
0.15
0.15
0.15
0.15
0.15
0.15
0.15
0.02
0.02
0.02
0.02
0.02
0.02
0.02
0.02
0.02
0.02
0.02
0.02
0.02
0.02
0.02
0.02
0.02
0.02
0.02
0.02
0.02
0.02
0.02
0.02
0.02
0.02
0.05
0.05
0.05
0.05
0.05
0.05
0.05
0.05
0.05
0.05
0.05
0.05
0.05
0.05
0.04
0.04
0.04
0.04
0.04
0.04
0.04
0.04
0.04
0.04
0.04
0.04
0.04
0.04
0.04
0.04
0.04
0.04
0.04
0.04
0.04
0.04
0.04
0.04
0.04
0.04
0.04
0.04
0.04
0.04
0.04
0.04
0.04
0.04
0.04
0.04
0.04
0.04
0.04
0.04
0.04
0.04
0.09
0.09
0.09
0.09
0.09
0.09
0.09
0.09
0.09
0.09
0.09
0.09
0.09
0.09
0.09
0.09
0.09
0.09
0.09
0.09
0.09
0.09
0.09
0.09
0.09
0.09
0.090.
100.
100.
100.
100.
100.
100.
100.
100.
100.
100.
100.
100.
100.
100.
100.
100.
100.
100.
100.
100.
100.
100.
100.
100.
100.
100.
100.
100.
100.
100.
100.
100.
100.
100.
100.
100.
100.
100.
100.
100.
100.
100.
100.
100.
100.
100.
100.
100.
100.
100.
100.
100.
100.
100.
100.
100.
100.
100.
100.
100.
100.
100.
100.
100.
100.
100.
100.
100.
100.
100.
100.
100.
100.
100.
100.
100.
100.
100.
100.
100.
100.
100.
100.
100.
100.
100.
100.
100.
100.
100.
100.
100.
100.
100.
100.
100.
100.
100.
100.
100.
010.
010.
010.
010.02
0.02
0.02
0.02
0.02
0.02
0.02
0.02
0.02
0.02
0.02
0.02
0.02
0.02
0.02
0.02
0.02
0.02
0.02
0.02
0.02
0.02
0.02
0.00
0.10
0.20
0.30
0.40
Haba
yit H
ayeh
udi
Haam
Itan
u
Israe
l Beit
enu
Likud
Yaha
dut H
ator
ah
Shas
Kulan
u
Yesh
Atid
Zion
ist U
nion
Mer
etz
Arab
Joint
List
Othe
r
2015 Elections
Vote
Sha
rePanel A
0.1260.1260.1260.1260.1260.1260.1260.1260.1260.1260.1260.1260.1260.1260.1260.1260.1260.1260.1260.1260.1260.1260.1260.1260.1260.1260.1260.1260.1260.1260.1260.1260.1260.1260.1260.1260.1260.126 0.1370.1370.1370.1370.1370.1370.1370.1370.1370.1370.1370.1370.1370.1370.1370.1370.1370.1370.1370.1370.1370.1370.1370.1370.1370.1370.1370.1370.1370.1370.1370.1370.1370.1370.1370.1370.1370.1370.1370.1370.1370.1370.1370.1370.1370.1370.1370.1370.1370.1370.1370.1370.1370.1370.1370.1370.1370.1370.1370.1370.1370.1370.1370.1370.1370.1370.1370.1370.1370.1370.1370.1370.1370.1370.1370.1370.1370.1370.1370.1370.1370.1370.1370.1370.1370.1370.1370.1370.1370.1370.1370.1370.1370.1370.1370.1370.1370.1370.1370.1370.1370.1370.1370.1370.1370.1370.1370.1370.1370.1370.1370.1370.1370.1370.1370.1370.1370.1370.1370.1370.1370.1370.1370.1370.1370.1370.1370.1370.1370.1370.1370.1370.1370.1370.1370.1370.1370.137
0.6290.6290.6290.6290.6290.6290.6290.6290.6290.6290.6290.6290.6290.6290.6290.6290.6290.6290.6290.6290.6290.6290.6290.6290.6290.6290.6290.6290.6290.6290.6290.6290.6290.6290.6290.6290.6290.6290.6290.6290.6290.6290.6290.6290.6290.6290.6290.6290.6290.6290.6290.6290.6290.6290.6290.6290.6290.6290.6290.6290.6290.6290.6290.6290.6290.6290.6290.6290.6290.6290.6290.6290.6290.6290.6290.6290.6290.6290.6290.6290.6290.6290.6290.6290.6290.6290.6290.6290.6290.6290.6290.6290.6290.6290.6290.6290.6290.6290.6290.6290.6290.6290.6290.6290.6290.6290.6290.6290.6290.6290.6290.6290.6290.6290.6290.6290.6290.6290.6290.6290.6290.6290.6290.6290.6290.6290.6290.6290.6290.6290.6290.6290.6290.6290.6290.6290.6290.6290.6290.6290.6290.6290.6290.6290.6290.6290.6290.6290.6290.6290.6290.6290.6290.6290.6290.6290.6290.6290.6290.6290.6290.6290.6290.6290.6290.6290.6290.6290.6290.6290.6290.6290.6290.6290.6290.6290.6290.6290.6290.6290.6290.6290.6290.6290.6290.6290.6290.6290.6290.629 0.6220.6220.6220.6220.6220.6220.6220.6220.6220.6220.6220.6220.6220.6220.6220.6220.6220.6220.6220.6220.6220.6220.6220.6220.6220.6220.6220.6220.6220.6220.6220.6220.6220.6220.6220.6220.6220.6220.6220.6220.6220.6220.6220.6220.6220.6220.6220.6220.6220.6220.6220.6220.6220.6220.6220.6220.6220.6220.6220.6220.6220.6220.6220.6220.6220.6220.6220.6220.6220.6220.6220.6220.6220.6220.6220.6220.6220.6220.6220.6220.6220.6220.6220.6220.6220.6220.6220.6220.6220.6220.6220.6220.6220.6220.6220.6220.6220.6220.6220.6220.6220.6220.6220.6220.6220.6220.6220.6220.6220.6220.6220.6220.6220.6220.6220.6220.6220.6220.6220.6220.6220.6220.6220.6220.6220.6220.6220.6220.6220.6220.6220.6220.6220.6220.6220.6220.6220.6220.6220.6220.6220.6220.6220.6220.6220.6220.6220.6220.6220.6220.6220.6220.6220.6220.6220.6220.6220.6220.6220.6220.6220.6220.6220.6220.6220.6220.6220.6220.6220.6220.6220.6220.6220.6220.6220.6220.6220.6220.6220.6220.6220.6220.6220.6220.6220.6220.6220.6220.6220.6220.6220.6220.6220.6220.6220.6220.6220.6220.6220.6220.6220.6220.6220.6220.6220.6220.6220.6220.6220.6220.6220.6220.6220.6220.6220.6220.6220.6220.6220.6220.6220.6220.6220.6220.6220.6220.6220.6220.6220.6220.6220.6220.6220.6220.6220.6220.6220.6220.6220.6220.6220.6220.6220.6220.6220.6220.6220.6220.6220.6220.6220.6220.6220.6220.6220.6220.6220.6220.6220.6220.6220.6220.6220.6220.6220.6220.6220.6220.6220.6220.6220.6220.6220.6220.6220.6220.6220.6220.6220.6220.6220.6220.6220.6220.6220.6220.6220.6220.6220.6220.6220.6220.6220.6220.6220.6220.6220.6220.6220.6220.6220.6220.6220.6220.6220.6220.6220.6220.6220.6220.6220.6220.6220.6220.6220.6220.6220.6220.6220.6220.6220.6220.6220.6220.6220.6220.6220.6220.6220.6220.6220.6220.6220.6220.6220.6220.6220.6220.6220.6220.6220.6220.6220.6220.6220.6220.6220.6220.6220.6220.6220.6220.6220.6220.6220.6220.6220.6220.6220.6220.6220.6220.6220.6220.6220.6220.6220.6220.6220.6220.6220.6220.6220.6220.6220.6220.6220.6220.6220.6220.6220.6220.6220.6220.6220.6220.6220.6220.6220.6220.6220.6220.6220.6220.6220.6220.6220.6220.6220.6220.6220.6220.6220.6220.6220.6220.6220.6220.6220.6220.6220.6220.6220.6220.6220.6220.6220.6220.6220.6220.6220.6220.6220.6220.6220.6220.6220.6220.6220.6220.6220.6220.6220.6220.6220.6220.6220.6220.6220.6220.6220.6220.6220.6220.6220.6220.6220.6220.6220.6220.6220.6220.6220.6220.6220.6220.6220.6220.6220.6220.6220.6220.6220.6220.6220.6220.6220.6220.6220.6220.6220.6220.6220.6220.6220.6220.6220.6220.6220.6220.6220.6220.6220.6220.6220.6220.6220.6220.6220.6220.6220.6220.6220.6220.6220.6220.6220.6220.6220.6220.6220.6220.6220.6220.6220.6220.6220.6220.6220.6220.6220.6220.6220.6220.6220.6220.6220.6220.6220.6220.6220.6220.6220.6220.6220.6220.6220.6220.6220.6220.6220.6220.6220.6220.6220.6220.6220.6220.6220.6220.6220.6220.6220.6220.6220.6220.6220.6220.6220.6220.6220.6220.6220.6220.6220.6220.6220.6220.6220.6220.6220.6220.6220.6220.6220.6220.6220.6220.6220.6220.6220.6220.6220.6220.6220.6220.6220.6220.6220.6220.6220.6220.6220.6220.6220.6220.6220.6220.6220.6220.6220.6220.6220.6220.6220.6220.6220.6220.6220.6220.6220.6220.6220.6220.6220.6220.6220.6220.6220.6220.6220.6220.6220.6220.6220.6220.6220.6220.6220.6220.6220.6220.6220.6220.6220.6220.6220.622
0.2450.2450.2450.2450.2450.2450.2450.2450.2450.2450.2450.2450.2450.2450.2450.2450.2450.2450.2450.2450.2450.2450.2450.2450.2450.2450.2450.2450.2450.2450.2450.2450.2450.2450.2450.2450.2450.2450.2450.2450.2450.2450.2450.2450.2450.2450.2450.2450.2450.2450.2450.2450.2450.2450.2450.2450.2450.2450.2450.2450.2450.2450.2450.2450.2450.2450.2450.2450.2450.2450.2450.2450.2450.245 0.2410.2410.2410.2410.2410.2410.2410.2410.2410.2410.2410.2410.2410.2410.2410.2410.2410.2410.2410.2410.2410.2410.2410.2410.2410.2410.2410.2410.2410.2410.2410.2410.2410.2410.2410.2410.2410.2410.2410.2410.2410.2410.2410.2410.2410.2410.2410.2410.2410.2410.2410.2410.2410.2410.2410.2410.2410.2410.2410.2410.2410.2410.2410.2410.2410.2410.2410.2410.2410.2410.2410.2410.2410.2410.2410.2410.2410.2410.2410.2410.2410.2410.2410.2410.2410.2410.2410.2410.2410.2410.2410.2410.2410.2410.2410.2410.2410.2410.2410.2410.2410.2410.2410.2410.2410.2410.2410.2410.2410.2410.2410.2410.2410.2410.2410.2410.2410.2410.2410.2410.2410.2410.2410.2410.2410.2410.2410.2410.2410.2410.2410.2410.2410.2410.2410.2410.2410.2410.2410.2410.2410.2410.2410.2410.2410.2410.2410.2410.2410.2410.2410.2410.2410.2410.2410.2410.2410.2410.2410.2410.2410.2410.2410.2410.2410.2410.2410.2410.2410.2410.2410.2410.2410.2410.2410.2410.2410.2410.2410.2410.2410.2410.2410.2410.2410.2410.2410.2410.2410.2410.2410.2410.2410.2410.2410.2410.2410.2410.2410.2410.2410.2410.2410.2410.2410.2410.2410.2410.2410.2410.2410.2410.2410.2410.2410.2410.2410.2410.2410.2410.2410.2410.2410.2410.2410.2410.2410.2410.2410.2410.2410.2410.2410.2410.2410.2410.2410.2410.2410.2410.2410.2410.241
0.00
00.
200
0.40
00.
600
Left Center/Other RightControl Treatment
2013 Elections
0.2480.2480.2480.2480.2480.2480.2480.2480.2480.2480.2480.2480.2480.2480.248
0.394
0.2480.248
0.394
0.358
0.2480.248
0.358
0.2480.248
0.3940.394
0.2480.248
0.358
0.2480.2480.2480.2480.2480.2480.2480.248
0.3090.3090.3090.309 0.3120.3090.3090.3090.3090.309
0.379
0.3090.3090.309 0.3120.3090.3090.3090.3090.3090.3090.3090.3090.3090.3090.3090.3090.3090.3090.3090.309
0.379
0.3090.3090.3090.309
0.379
0.309
0.379
0.3090.3090.3090.3090.3090.3090.3090.3090.3090.309
0.379
0.3090.3090.3090.309
0.379
0.3090.3090.3090.3090.3090.3090.3090.3090.3090.309
0.3790.379
0.3090.3090.309
0.379
0.3090.3090.3090.3090.3090.309
0.379
0.3120.3090.3090.3090.3090.309
0.379
0.3120.3090.3090.3090.3090.3090.3090.3090.3090.309
0.379
0.3090.3090.3090.3090.3090.309 0.3120.3090.3090.3090.3090.3090.3090.309 0.3120.3090.3090.3090.3090.3090.3090.3090.3090.3090.309
0.379
0.3090.309
0.379
0.3090.3090.309
0.3790.379
0.3090.3090.3090.3090.3090.3090.3090.309
0.248
0.358
0.394
0.358
0.394
0.2480.248
0.3940.3940.3940.394
0.358
0.248
0.358
0.3940.3940.394
0.3580.3580.358
0.248
0.394
0.248
0.3940.394
0.3580.358
0.3940.394
0.248
0.394
0.248
0.394
0.358
0.3940.394
0.358
0.248
0.3580.358
0.3940.3940.3940.3940.3940.3940.3940.394
0.248
0.3940.3940.394
0.248
0.3940.3940.394
0.248
0.394
0.248
0.3940.3940.394
0.358
0.3940.394
0.248
0.3940.3940.3940.394
0.248
0.3940.3940.3940.3940.394
0.248
0.3940.394
0.3580.358
0.394
0.248
0.3580.358
0.2480.248
0.394
0.358
0.394
0.248
0.394
0.2480.2480.248
0.394
0.2480.248
0.358
0.3940.394
0.2480.248
0.394
0.2480.248
0.358
0.248
0.3940.3940.394
0.248
0.3940.394
0.358
0.248
0.394
0.248
0.358
0.394
0.248
0.358
0.394
0.248
0.358
0.3940.3940.394
0.358
0.3940.3940.3940.3940.3940.3940.3940.3940.3940.3940.3940.3940.394
0.248
0.3940.394
0.358
0.3940.3940.394
0.3580.358
0.394
0.3580.358
0.248
0.3940.394
0.248
0.358
0.3940.394
0.3580.358
0.394
0.358
0.3940.3940.394
0.248
0.3940.394
0.248
0.394
0.2480.248
0.358
0.394
0.3580.3580.358
0.3940.394
0.3580.358
0.3940.3940.3940.3940.3940.394
0.3090.3090.309
0.3790.379
0.3120.309 0.312
0.379
0.3120.312
0.3790.379
0.3090.3090.3090.309 0.312
0.3790.379
0.3090.309
0.379
0.309
0.379
0.309
0.379
0.312
0.3790.3790.3790.379
0.3120.309
0.3790.379
0.309
0.379
0.309
0.3790.379
0.309
0.3790.379
0.309 0.312
0.3790.3790.3790.379
0.3120.309
0.3790.379
0.3090.309
0.379
0.309 0.3120.3090.309
0.379
0.309
0.379
0.3120.309
0.3790.379
0.309
0.3790.379
0.3090.309 0.3120.3090.3090.3090.309
0.379
0.309
0.379
0.312
0.3790.379
0.309
0.379
0.312
0.379
0.309
0.379
0.309
0.3790.379
0.309
0.379
0.3090.309 0.312
0.3790.379
0.309
0.3790.3790.3790.379
0.312
0.379
0.312
0.379
0.312
0.379
0.312
0.3790.3790.3790.379
0.312
0.379
0.309
0.3790.3790.3790.3790.3790.3790.379
0.309
0.379
0.309
0.3790.379
0.3120.3120.3120.3120.3090.309
0.379
0.3120.312
0.3790.379
0.309
0.379
0.312
0.3790.379
0.309
0.3790.379
0.3090.3090.3090.3090.309
0.3790.3790.379
0.3090.3090.309
0.379
0.312
0.3790.3790.3790.3790.379
0.3090.309
0.3790.379
0.3120.309
0.3790.379
0.3090.3090.309
0.3790.3790.3790.379
0.309
0.3790.3790.379
0.3090.3090.309 0.312
0.3790.379
0.3090.309
0.3790.379
0.3120.3090.3090.3090.309
0.3790.379
0.312
0.379
0.312
0.379
0.312
0.3790.3790.379
0.3090.309
0.379
0.309
0.379
0.309 0.3120.312
0.3790.379
0.309
0.379
0.3120.309
0.379
0.3090.3090.309 0.3120.3090.309 0.312
0.379
0.309 0.3120.3090.309
0.3790.379
0.3090.309
0.379
0.3090.3090.309
0.3790.379
0.309
0.3790.379
0.309
0.3790.3790.379
0.3090.309
0.3790.3790.3790.3790.3790.3790.3790.3790.3790.379
0.309
0.3790.379
0.312
0.379
0.309 0.312
0.379
0.309
0.3790.379
0.309 0.312
0.3790.379
0.3120.3090.3090.309
0.3790.379
0.309 0.312
0.379
0.309 0.3120.3090.3090.3090.309
0.379
0.309
0.3790.3790.3790.379
0.3090.3090.3090.309
0.379
0.309 0.3120.3120.309 0.312
0.3790.379
0.312
0.3790.3790.379
0.3120.309
0.3790.379
0.309 0.3120.3120.3120.3090.309
0.3790.3790.3790.379
0.309
0.3790.3790.379
0.309
0.3790.379
0.3090.309
0.379
0.3120.3120.3090.309
0.379
0.3120.309
0.379
0.3090.309
0.3790.379
0.3090.309
0.379
0.3090.309
0.3790.379
0.312
0.3790.3790.379
0.309
0.379
0.3090.309 0.312
0.3790.3790.3790.379
0.3120.309
0.3790.379
0.3120.312
0.379
0.3120.309
0.3790.3790.379
0.309
0.3790.379
0.309
0.3790.379
0.312
0.379
0.3090.3090.309 0.312
0.379
0.309
0.379
0.3120.3090.309
0.379
0.309
0.379
0.312
0.3790.379
0.312
0.379
0.3090.309 0.3120.3120.312
0.3790.3790.3790.379
0.3120.3120.309
0.3790.3790.3790.3790.379
0.3090.309 0.312
0.3790.3790.3790.379
0.309
0.379
0.309
0.379
0.3120.309
0.3790.3790.379
0.3120.3120.3090.309
0.3790.379
0.312
0.3790.3790.379
0.312
0.3790.379
0.3120.309 0.312
0.3790.379
0.309
0.3790.379
0.3120.3120.309
0.379
0.309
0.379
0.309
0.379
0.309
0.3790.379
0.309
0.3790.379
0.312
0.379
0.3090.3090.309
0.379
0.309
0.3790.3790.3790.3790.3790.3790.379
0.309
0.3790.3790.3790.3790.3790.3790.379
0.309
0.379
0.309
0.379
0.312
0.3790.3790.379
0.3120.312
0.3790.3790.3790.379
0.309 0.312
0.3790.3790.379
0.309
0.379
0.312
0.3790.3790.3790.3790.3790.379
0.309
0.3790.379
0.3120.3120.309 0.3120.312
0.3790.3790.379
0.309
0.3790.3790.3790.3790.379
0.312
0.3790.379
0.312
0.379
0.309
0.379
0.309
0.3790.3790.3790.3790.379
0.312
0.3790.379
0.312
0.3790.3790.3790.3790.3790.3790.379
0.309
0.379
0.3090.309 0.312
0.379
0.312
0.3790.379
0.309
0.3790.3790.379
0.309 0.3120.309 0.312
0.3790.379
0.3090.309
0.3790.379
0.312
0.379
0.312
0.3790.3790.3790.3790.379
0.312
0.379
0.3090.309 0.312
0.3790.3790.379
0.312
0.3790.3790.3790.3790.3790.379
0.309
0.379
0.309 0.312
0.3790.379
0.309
0.3790.3790.3580.358
0.248
0.394
0.3580.3580.3580.3580.3580.3580.3580.3580.3580.3580.358
0.394
0.3580.3580.358
0.394
0.3580.358
0.248
0.358
0.394
0.358
0.394
0.3580.3580.3580.3580.3580.3580.3580.3580.3580.3580.3580.3580.3580.3580.358
0.394
0.3580.3580.3580.3580.358
0.394
0.3580.3580.3580.3580.358
0.394
0.3580.3580.3580.3580.3580.3580.3580.3580.3580.3580.3580.3580.3580.3580.3580.3580.3580.3580.358
0.3120.3120.3120.3120.3120.312
0.3790.379
0.3120.3120.3120.3120.3120.3120.3120.3120.3120.3120.312
0.379
0.312
0.379
0.3120.3120.3120.3120.312
0.379
0.3120.312
0.379
0.3120.3120.3120.3120.3120.3120.3120.3120.3120.3120.312
0.379
0.312
0.379
0.3120.3120.3120.3120.3120.3120.3120.3120.309 0.3120.3120.3120.3120.3120.3120.3120.3120.312
0.379
0.312
0.3790.3790.3790.379
0.3120.3120.312
0.379
0.3120.312
0.379
0.3120.3120.3120.3120.3120.3120.3120.3120.3120.3120.3120.3120.3120.3120.312
0.3790.3790.379
0.3120.3120.3120.3120.3120.3120.3120.3120.3120.3120.3120.3120.309 0.3120.312
0.379
0.309 0.3120.3120.3120.3120.3120.3120.3120.3120.3120.3120.3120.312
0.379
0.3120.3120.3120.3120.3120.3120.312
0.379
0.3120.3120.3120.3120.3120.3120.3120.3120.3120.3120.3120.3120.3120.3120.3120.3120.3120.3120.3120.3120.3120.3120.3120.3120.3120.3120.3120.3120.3120.3120.3120.3120.312
0.379
0.3120.3120.3120.3120.3120.3120.3120.3120.3120.3120.309 0.312
0.379
0.312
0.379
0.312
0.379
0.3120.312
0.379
0.3120.3120.3120.3120.3120.3120.312
0.379
0.3120.3120.3120.3120.3120.3120.3120.3120.3120.312
0.379
0.3120.309 0.3120.3120.3120.3120.3120.3120.312
0.3790.379
0.312
0.379
0.3120.3120.3120.309 0.3120.3120.3120.3120.309 0.3120.3120.312
0.379
0.3120.3120.3120.312
0.379
0.3120.312
0.379
0.3120.3120.3120.312
0.00
00.
200
0.40
00.
600
Left Center/Other RightControl Treatment
2015 Elections
Vote
Sha
re
N=1311. The 'other' bars include 71 and 17 individuals who voted for for other parties in 2013 and 2015, respectively, as well as 1 and 27 individuals who did not vote in 2013 and 2015, respectively.
Panel B
Blocks in Panel B: 2013: Left includes: Meretz & Labour. Center: Hatnuah, Yesh Atid, Kadima, Shas
& Yahadut HaTorah. Right: Likud Beitenu and Habayit Hayehudi. 2015: Left: The Zionist Union,
Meretz & the Arab Joint List. Center: Yesh Atid, Kulanu, Shas and Yahadut HaTorah; Right parties:
Likud, Israel Beitenu, Haam Itanu & Habayit Hayehudi.
17

5 Main Results
Does exposure to financial markets change political choices? Figure 3 shows the raw vote
shares across the treatment and control groups. Panel A shows the detailed party vote
while Panel B combines the parties into blocks (see Section 2 for party positions). The
histograms to the left show vote shares in the 2013 elections (prior to our intervention).
Notice the ex ante over-sampling of the center parties Hatnuah, Yesh Atid and Kadima.
These three parties won, respectively, 5%, 16% and 2% of the overall votes for non-Arab
parties in 2013, but are represented at about twice those shares, totalling 45% of our
sample. Importantly, and consistent with Table 2, the treatment and control groups
have almost identical distributions of votes across parties in 2013.
Voting decisions in 2015, however, reveal substantial differences (Panel A, right). The
right-wing ruling Likud party won 20.2% of the votes in the control group but only 15.2%
in the treatment group. In contrast, the main left-wing party, The Zionist Union, won
21.5% of the votes in the control but 25.2% of the votes among the treated. In the center,
the Yesh Atid party won 21% of the votes in the control but 17% in the treatment group.
To help clarify, we show the same result consolidating parties into left and right blocks
(Panel B). Within the control group, 24.8% voted for the left (a proportion similar to
the 25.3% overall vote share for Jewish left parties in the 2015 elections), but this share
increases to 30.9% in the treatment group. At the same time, right parties won 35.8% of
the votes in the control group, but only 31.2% in the treatment group.
Table 3 presents estimates of the treatment effect on the probability of voting for
left (Cols 1-4) and right parties (Cols 5-8) in the 2015 elections. Table 4 shows the
effect separately for the probability of voting for each party, as well as of not voting.
For the most part we report Intent to Treat (ITT) estimates, not only because they are
more conservative, but as they are important when one is interested in the treatment
effect taking into account that some individuals may choose not to participate. We use
heteroskedasticity-robust standard errors: the clustering problem does not arise in our
benchmark specifications since we randomize at the individual level (the Moulton factor
is 1).16
Columns 1 and 5 in Table 3 replicate the raw mean differences in Figure 3, Panel
B. In Columns 2 and 6 we control for other factors that may shape vote choices. The
controls include (pre-treatment) vote choices in the recently held 2013 elections, prior
experience in trading stocks, sex, age (and age squared), categorical variables for levels
16See also Abadie, Athey, Imbens and Wooldridge (2017). Bootstrapping the standard errors for themain specifications in Columns 2 and 6 of Table 3 (in Stata with seed 111111 and 500 replications) yieldsan estimate on the left of 0.059 [0.0235], and on the right of -0.044 [0.0238].
18

Table 3: Treatment Effects on Left and Right Vote in 2015
ITT ITT ITT reweighted
TOT ITT ITT ITT reweighted
TOT
(1) (2) (3) (4) (5) (6) (7) (8)
Treatment 0.061 0.059 0.043 0.073 -0.045 -0.044 -0.051 -0.054(0.029) (0.023) (0.020) (0.027) (0.031) (0.024) (0.027) (0.028)
Voted Right '13 -0.254 -0.201 -0.272 0.492 0.473 0.505(0.091) (0.083) (0.089) (0.122) (0.127) (0.114)
Voted Left '13 0.596 0.614 0.608 -0.222 -0.249 -0.231(0.091) (0.090) (0.085) (0.088) (0.088) (0.087)
0.018 0.015 0.015 0.030 0.024 0.032(0.040) (0.035) (0.039) (0.040) (0.043) (0.039)
Traditional -0.138 -0.155 -0.133 0.102 0.128 0.099(0.032) (0.029) (0.031) (0.032) (0.036) (0.030)
Religious -0.166 -0.162 -0.165 0.241 0.232 0.240(0.032) (0.031) (0.030) (0.049) (0.049) (0.046)
-0.221 -0.208 -0.222 0.056 0.033 0.057(0.039) (0.037) (0.038) (0.086) (0.088) (0.082)
Post Secondary 0.068 0.063 0.066 -0.060 -0.046 -0.059(0.033) (0.027) (0.032) (0.034) (0.037) (0.032)
BA Student 0.088 0.072 0.088 -0.041 -0.025 -0.041(0.038) (0.032) (0.036) (0.039) (0.042) (0.037)
0.062 0.038 0.062 -0.044 -0.021 -0.045(0.030) (0.026) (0.029) (0.032) (0.035) (0.030)
-0.001 0.002 -0.001 0.007 0.008 0.007(0.005) (0.004) (0.005) (0.005) (0.005) (0.005)
0.012 0.009 0.010 0.004 0.004 0.005(0.022) (0.018) (0.020) (0.021) (0.024) (0.020)
0.000 0.000 0.000 -0.001 -0.001 -0.001(0.000) (0.000) (0.000) (0.001) (0.001) (0.000)
Strata FE NO YES YES YES NO YES YES YESDemographic Controls NO YES YES YES NO YES YES YESF(excluded instruments) 3129 3129Observations 1,311 1,311 1,311 1,311 1,311 1,311 1,311 1,311R-squared 0.003 0.447 0.570 0.443 0.002 0.518 0.556 0.518
Vote for Left Party in 2015 Vote for Right Party in 2015
Notes: OLS (ITT) and 2SLS (TOT) estimates of the treatment effect on the probability that an individual voted for a left or right party in 2015. Robust standard errors in parentheses. 2SLS estimates use assignment to treatment as instrument. Data in Cols 3,7 are reweighted to represent the vote share of Jewish parties in 2013. Cols 2-4, 6-8 include fixed effects for 104 blocks constructed to stratify sequentially on: 2013 vote, sex, traded stocks, would recommend Arab stocks, geographical region, discrepancies in 2013 vote across surveys, and subjective willingness to take risks. `Demographic controls' include sex, age, age squared, four education categories, marital status, six regional dummies, four religiosity categories, five income categories (and a dummy for missing), time preference above the median, financial literacy score and subjective willingness to take risks.
Willing to Take Risks [1-10]
Bought/Sold Shares in Last 6 Mths [0/1]
Time preference above median
Financial Literacy, %Correct
Ultra-Orthodox
BA Graduate & Above
of education, income, religiosity, geographical region and marital status, pre-treatment
measures of willingness to take risks, patience and financial literacy, as well as 104 strata
fixed effects. Note that these controls are meaningful determinants of vote choice, as
reflected in the increase in R2 from 0.003 to 0.447 for the decision to vote left, and
19
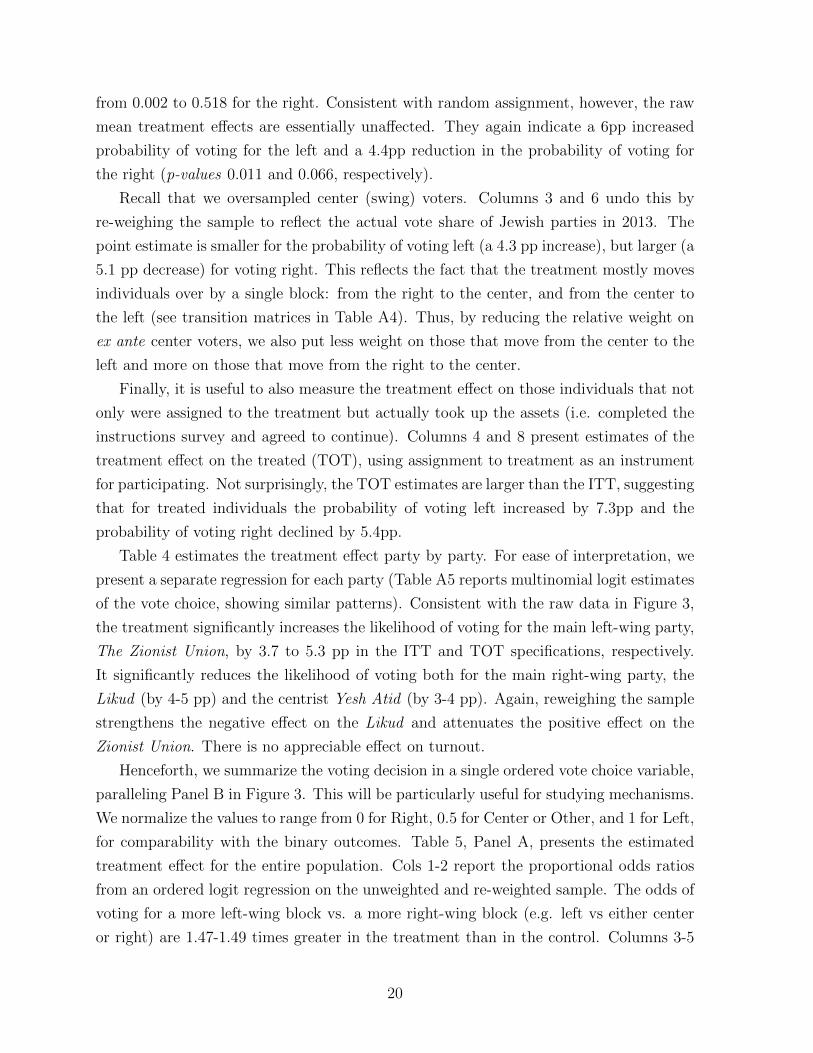
from 0.002 to 0.518 for the right. Consistent with random assignment, however, the raw
mean treatment effects are essentially unaffected. They again indicate a 6pp increased
probability of voting for the left and a 4.4pp reduction in the probability of voting for
the right (p-values 0.011 and 0.066, respectively).
Recall that we oversampled center (swing) voters. Columns 3 and 6 undo this by
re-weighing the sample to reflect the actual vote share of Jewish parties in 2013. The
point estimate is smaller for the probability of voting left (a 4.3 pp increase), but larger (a
5.1 pp decrease) for voting right. This reflects the fact that the treatment mostly moves
individuals over by a single block: from the right to the center, and from the center to
the left (see transition matrices in Table A4). Thus, by reducing the relative weight on
ex ante center voters, we also put less weight on those that move from the center to the
left and more on those that move from the right to the center.
Finally, it is useful to also measure the treatment effect on those individuals that not
only were assigned to the treatment but actually took up the assets (i.e. completed the
instructions survey and agreed to continue). Columns 4 and 8 present estimates of the
treatment effect on the treated (TOT), using assignment to treatment as an instrument
for participating. Not surprisingly, the TOT estimates are larger than the ITT, suggesting
that for treated individuals the probability of voting left increased by 7.3pp and the
probability of voting right declined by 5.4pp.
Table 4 estimates the treatment effect party by party. For ease of interpretation, we
present a separate regression for each party (Table A5 reports multinomial logit estimates
of the vote choice, showing similar patterns). Consistent with the raw data in Figure 3,
the treatment significantly increases the likelihood of voting for the main left-wing party,
The Zionist Union, by 3.7 to 5.3 pp in the ITT and TOT specifications, respectively.
It significantly reduces the likelihood of voting both for the main right-wing party, the
Likud (by 4-5 pp) and the centrist Yesh Atid (by 3-4 pp). Again, reweighing the sample
strengthens the negative effect on the Likud and attenuates the positive effect on the
Zionist Union. There is no appreciable effect on turnout.
Henceforth, we summarize the voting decision in a single ordered vote choice variable,
paralleling Panel B in Figure 3. This will be particularly useful for studying mechanisms.
We normalize the values to range from 0 for Right, 0.5 for Center or Other, and 1 for Left,
for comparability with the binary outcomes. Table 5, Panel A, presents the estimated
treatment effect for the entire population. Cols 1-2 report the proportional odds ratios
from an ordered logit regression on the unweighted and re-weighted sample. The odds of
voting for a more left-wing block vs. a more right-wing block (e.g. left vs either center
or right) are 1.47-1.49 times greater in the treatment than in the control. Columns 3-5
20
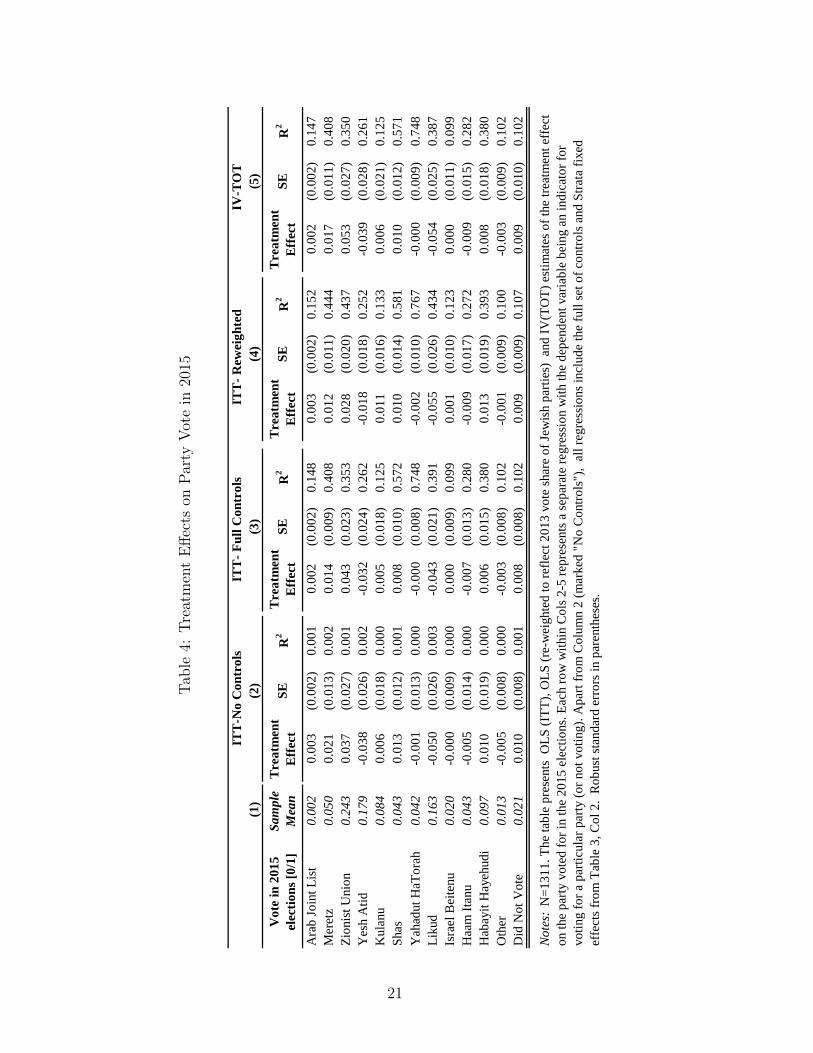
Tab
le4:
Tre
atm
ent
Eff
ects
onP
arty
Vot
ein
2015
(1)
(2)
(3)
(4)
(5)
Ara
b Jo
int L
ist
0.00
20.
003
(0.0
02)
0.00
10.
002
(0.0
02)
0.14
80.
003
(0.0
02)
0.15
20.
002
(0.0
02)
0.14
7M
eret
z0.
050
0.02
1(0
.013
)0.
002
0.01
4(0
.009
)0.
408
0.01
2(0
.011
)0.
444
0.01
7(0
.011
)0.
408
Zion
ist U
nion
0.24
30.
037
(0.0
27)
0.00
10.
043
(0.0
23)
0.35
30.
028
(0.0
20)
0.43
70.
053
(0.0
27)
0.35
0Y
esh
Atid
0.17
9-0
.038
(0.0
26)
0.00
2-0
.032
(0.0
24)
0.26
2-0
.018
(0.0
18)
0.25
2-0
.039
(0.0
28)
0.26
1K
ulan
u0.
084
0.00
6(0
.018
)0.
000
0.00
5(0
.018
)0.
125
0.01
1(0
.016
)0.
133
0.00
6(0
.021
)0.
125
Shas
0.04
30.
013
(0.0
12)
0.00
10.
008
(0.0
10)
0.57
20.
010
(0.0
14)
0.58
10.
010
(0.0
12)
0.57
1Y
ahad
ut H
aTor
ah0.
042
-0.0
01(0
.013
)0.
000
-0.0
00(0
.008
)0.
748
-0.0
02(0
.010
)0.
767
-0.0
00(0
.009
)0.
748
Liku
d0.
163
-0.0
50(0
.026
)0.
003
-0.0
43(0
.021
)0.
391
-0.0
55(0
.026
)0.
434
-0.0
54(0
.025
)0.
387
Isra
el B
eite
nu0.
020
-0.0
00(0
.009
)0.
000
0.00
0(0
.009
)0.
099
0.00
1(0
.010
)0.
123
0.00
0(0
.011
)0.
099
Haa
m It
anu
0.04
3-0
.005
(0.0
14)
0.00
0-0
.007
(0.0
13)
0.28
0-0
.009
(0.0
17)
0.27
2-0
.009
(0.0
15)
0.28
2H
abay
it H
ayeh
udi
0.09
70.
010
(0.0
19)
0.00
00.
006
(0.0
15)
0.38
00.
013
(0.0
19)
0.39
30.
008
(0.0
18)
0.38
0O
ther
0.01
3-0
.005
(0.0
08)
0.00
0-0
.003
(0.0
08)
0.10
2-0
.001
(0.0
09)
0.10
0-0
.003
(0.0
09)
0.10
2D
id N
ot V
ote
0.02
10.
010
(0.0
08)
0.00
10.
008
(0.0
08)
0.10
20.
009
(0.0
09)
0.10
70.
009
(0.0
10)
0.10
2
ITT
-No
Con
trol
s
Tre
atm
ent
Eff
ect
Vot
e in
201
5 el
ectio
ns [0
/1]
Sam
ple
Mea
nSE
R2
Not
es:
N=1
311.
The
tabl
e pr
esen
ts O
LS (I
TT),
OLS
(re-
wei
ghte
d to
refle
ct 2
013
vote
shar
e of
Jew
ish
parti
es)
and
IV(T
OT)
est
imat
es o
f the
trea
tmen
t effe
ct
on th
e pa
rty v
oted
for i
n th
e 20
15 e
lect
ions
. Eac
h ro
w w
ithin
Col
s 2-5
repr
esen
ts a
sepa
rate
regr
essi
on w
ith th
e de
pend
ent v
aria
ble
bein
g an
indi
cato
r for
vo
ting
for a
par
ticul
ar p
arty
(or n
ot v
otin
g). A
part
from
Col
umn
2 (m
arke
d "N
o C
ontro
ls")
, al
l reg
ress
ions
incl
ude
the
full
set o
f con
trols
and
Stra
ta fi
xed
effe
cts f
rom
Tab
le 3
, Col
2.
Rob
ust s
tand
ard
erro
rs in
par
enth
eses
.
ITT
- Ful
l Con
trol
s IT
T- R
ewei
ghte
d IV
-TO
T
Tre
atm
ent
Eff
ect
Tre
atm
ent
Eff
ect
Tre
atm
ent
Eff
ect
SER
2SE
R2
SER
2
21

Table 5: Treatment Effects on Ordered Vote Choice in 2015
IV-2SLS ITT ITT
re-weightedITT ITT
re-weightedTOT
(1) (2) (3) (4) (5)
Treatment 1.494 1.472 0.052 0.047 0.064(0.233) (0.254) (0.019) (0.019) (0.022)
R-squared/ Pseudo R2 0.369 0.434 0.549 0.627 0.546F(excluded instrument) 3129
Treatment 1.673 1.637 0.062 0.058 0.079(0.343) (0.366) (0.024) (0.023) (0.028)
R-squared/ Pseudo R2 0.407 0.471 0.582 0.653 0.574F(excluded instrument) 1585Strata FE YES YES YES YES YESDemographic Controls YES YES YES YES YES
Ordered Logit OLS
B. Inexperienced (did not buy/sell assets six months before the experiment (N=842))
Notes : Dependent variable is individual vote choice, ordered from Right (0), Center/Other (0.5), to Left (1). Robust standard errors in parentheses. Cols 1-2 present ordered logit estimates expressed as odds ratios. Cols 3-4 are OLS. Col 5 shows 2SLS (TOT) estimates using assignment to treatment as instrument for actual participation. All regressions control for the full set of demographic controls, randomization strata and vote choice in 2013 from Table 3 (Col 2). Cols 2,4 re-weight the data to match the parties' share of 2013 Jewish vote.
A. Full sample (N=1311)
report OLS and 2SLS estimates. The linear effects on the ordered vote choice reveal a
0.052 leftward shift in the unweighted ITT, 0.047 in the reweighted ITT and 0.064 in the
TOT (p-values equal 0.006, 0.013, 0.004, respectively).
Panel B of Table 5 restricts attention to those who lacked experience trading in stocks
in the six months prior to the experiment. Perhaps not surprisingly, the effects of exposure
to financial markets tend to be higher for this group. It is important to note that because
we stratified on past experience, the strata fixed effects absorb much of the relationship
between past financial experience and vote choice in Table 3. When we remove the
strata fixed effects (Table A6), two patterns emerge. First, even without the treatment,
those that had past experience in the financial markets were 9-10pp more likely to vote
for a left party in 2015, with this increased probability coming at the expense of the
center relative to the right. Second, the point estimates of the effects of financial market
exposure on inexperienced traders tend to be larger, and mimic these patterns. Thus,
it appears that the treatment leads those inexperienced in financial markets to become
more like experienced traders in their political choices. This indicates that if, over time,
the treatment makes individuals more like experienced traders, then the effect on their
political attitudes is likely to be stable even in the long run. We examine this empirically
22

Table 6: Difference-in-Difference Effects on Ordered Vote Choice in 2015
N=1311 x 2 waves. ITT ITT ITT ITT re-weighted
TOT
(1) (2) (3) (4) (5)
Treatment x 2015 0.046 0.046 0.046 0.045 0.055(0.020) (0.021) (0.020) (0.021) (0.025)
Treatment 0.008 0.004(0.020) (0.007)
2015 0.005 0.005 0.005 -0.014 0.005(0.018) (0.018) (0.018) (0.019) (0.018)
Individual FE NO NO YES YES YESDemographic Controls NO YES NO NO NOF(excluded instrument) 4673
R-squared 0.005 0.649 0.805 0.848 0.805Notes : OLS (ITT) and 2SLS (TOT) estimates of the difference in the difference in ordered vote choice between individuals in the treatment group and control group over two waves: 2013 and 2015. Standard errors clustered at the individual level in parentheses. 2015 is a dummy for 2015. Col 2 includes the full set of controls from Table 3, Col 2, while Cols 3-5 include individual fixed effects. Col 4 re-weights the sample to match the party shares of the Jewish vote in 2013.
below.
As a useful robustness check, we can exploit the fact that we observe voting before the
experiment, in 2013, and after, in 2015, to examine within-individual changes in voting
behavior over time. However, such a difference-in-difference analysis must be interpreted
with caution. Between 2013 and 2015, there have been changes in the composition of
parties and how they fit into the right-left spectrum.17 Thus, voting “left” or “right”
could mean different things in 2013 and 2015. While in Tables 3-5, we simply controlled
for vote in 2013, a difference-in-difference analysis imposes the additional assumption
that a left vote is the same regardless of year. With this caveat, Table 6 reports the
results of this exercise. Our main interest is in the interaction term reported in the top
row: the difference in the change in the vote between 2013 and 2015 for the treated
individuals relative to the control. The effect on the ordered vote choice is unaffected by
the inclusion of either individual controls or individual fixed effects (Cols 1-3). Columns
1 and 2 also provide a useful placebo test: individuals in the treatment group have very
similar vote choices as the control prior to treatment, especially when we include our
standard set of controls. It is only after treatment, in 2015, that they diverge.
17Specifically, one of the main center parties in 2013, Hatnuah, created a joint list with the LabourParty, thereby moving to the left. The centrist Kadimah party disappeared. On the other side, MosheKahlon, a former member of the Likud, created a new centrist party called Kulanu. The ultra orthodoxShas party split, with offshoot Haam Itanu adopting an extreme right position. Lieberman’s IsraelBeitenu, split from the joint list it had formed with the Likud in 2013.
23

As a further robustness check, in Table A7, we take out voters of each of the 2013
parties, one party at a time. The treatment effect is not driven by the voters of any one
particular party. Looking at heterogeneous effects (Table A8), we find that the effect
on the vote is similar across gender and education groups and appears stronger for older
participants.
Further, looking across regions (Table A9 and Figure A6) reveals that the point
estimates of the effect on the vote are positive throughout the country, with two notable
exceptions: the point estimates are 0 in the West Bank (i.e., among Jewish settlers)
and in the Jerusalem region, which both includes territories occupied in 1967, and where
religiosity is very high.18 Indeed, as we show in Table A8, the treatment mainly affects
secular and traditional voters, and has a weaker and statistically insignificant effect on
the religious and ultra orthodox. This is not surprising, since the latter overwhelmingly
vote for ethnic and religious parties. As we will show, however, though the treatment has
limited effect on the vote in these groups, financial asset exposure does appear to have a
similar positive effect on attitudes towards the peace process across levels of religiosity.
6 Mechanisms
So far we have demonstrated that exposure to financial assets moves individuals’ votes
in the 2015 elections leftward, towards parties that are more supportive of the peace
process. We believe this result is important in and of itself, and appears to confirm
Montesquieu’s conjecture discussed in the introduction. Nonetheless, in this section we
exploit the rich set of sub-treatments and attitudinal measures to try to shed more light
on the mechanisms through which this occurs. The analysis here is exploratory in nature,
but we believe it offers several potentially important insights.
Table A2 reports balancing tests across sub-treatments. As before, sub-treatments
are balanced relative to the control across almost all dimensions. Even so, we continue
to control for pre-treatment characteristics, as in Table 3 (Col 2).
6.1 Economic incentives or changes in policy preferences?
We first evaluate two main alternatives: that the exposure to financial markets gave
participants a direct material incentive to change their vote, or that it induced a change
in their policy preferences.
18The share of religious and ultra orthodox in Jerusalem is 52%, compared to 21% in the broadersample.
24

Table 7: Effects of Election Day Stockholdings on Ordered Vote Choice in 2015
OLS OLS OLS 2SLS OLS 2SLS OLS 2SLS(1) (2) (3) (4) (5) (6) (7) (8)
Treatment 0.052 0.038 0.045 0.059(0.019) (0.020) (0.019) (0.020)
Divest Before Election 0.039(0.019)
Voucher Treatment 0.033 0.020 0.019 0.028 0.022(0.022) (0.024) (0.023) (0.031) (0.030)
-0.006(0.007)
Divest Before x 1(Price Gain by Mar. 12) 0.067 0.088(0.027) (0.033)
Divest Before x 1(Price Loss by Mar. 12) 0.084 0.126(0.029) (0.039)
Divest After x 1(Price Gain by Mar. 12) 0.055 0.073(0.023) (0.030)
Divest After x 1(Price Loss by Mar. 12) 0.005 0.006(0.024) (0.032)
1(Realized Gain before Election) 0.063 0.082(0.031) (0.035)
1(Realized Loss before Election) 0.088 0.135(0.034) (0.043)
1(Paper Gain before Election) 0.068 0.097(0.026) (0.034)
1(Paper Loss before Election) -0.015 -0.028(0.028) (0.040)
F(excluded instruments) 1100 * *Strata FE YES YES YES YES YES YES YES YESDemographic Controls YES YES YES YES YES YES YES YESR-squared 0.549 0.550 0.550 0.549 0.553 0.553 0.574 0.572Observations 1,311 1,311 1,311 1,311 1,311 1,311 817 817Notes : Dependent variable is vote choice, ordered from Right (0), Center/Other (0.5) to Left (1). Col 4 provides IV-2SLS estimates, instrumenting for the stock value on election day using the stock value of a purely passive investor who made no trades. The instrument is calculated based on the asset allocation, the redemption date (pre- or post- elections), the initial value (high or low) and the price change of the specific asset by election day. Col 5 estimates separate effects according to whether early or late divesters experienced price gains or losses. Col 6 uses the price variables in Col 5 as instruments for whether an agent experienced realized or paper portfolio gains or losses. Cols 7-8 repeat the estimates in Col 5-6 for the sub-sample reporting ex ante median or below willingness to take risks. All regressions include the full set of controls from Table 3, Col 2. Robust standard errors in parentheses. *:Note that the four price gain/loss instruments are nearly perfectly collinear with the portfolio gain/loss so we do not report the F-statistics on each first stage.
Stock value- actual on election day (100s NIS)
Full Sample Risk Averse
Peace overtures tend to raise both Israeli and Palestinian asset prices (Zussman et
al., 2008). This may lead individuals holding stocks on Election Day to have a direct
incentive to vote for parties that favor the peace process.19 To test whether this is
19Within the period of experimental trading leading up to the elections, changes in opinion polls that
25

the case, in Table 7 we employ three complementary strategies that give us exogenous
variation in the degree of asset exposure on election day. First, in Col 2, we compare
individuals who were exogenously divested of their assets the week prior to the elections
to those who retained the direct material incentive by being divested after. Compared
to those divested post-election, the effect on those already divested on election day is
actually 0.039 higher, not lower. We return to this result below.
Second, we compare individuals initially assigned a portfolio purely of stock which
they could then sell to those initially given vouchers with which to buy stock. Given our
trading restrictions, those endowed with stock still held at least 66% of their assets in
stock on election day, compared to 35%, at most, for those endowed with vouchers. How-
ever, as seen in Col 3, the coefficient on the voucher treatment is statistically insignificant
(and, if anything, suggests the effect is higher, not lower).
Finally, in Column 4 we examine the effects of the actual asset holdings of each
participant on election day. As asset holdings are naturally endogenous to individual
investment decisions, we generate an instrument for election-day asset holdings based
upon the portfolio of a passive investor who registers a decision every week to simply
hold their initial asset allocation. This instrument combines all the exogenous features of
the experiment that drive the value of stocks, including timing of divestment, high vs low
allocation, stock vs voucher endowment, and the price change of the underlying asset.
As seen from the F-statistic, the instrument works well. However, there is no evidence
for an additional effect of actual stock holdings beyond the average treatment effect.
We conclude that the voting results cannot be attributed to a direct material incentive
generated by the stocks we provided. There are two points worth stressing, however.
First, even if our specific treatment did not create an incentive to vote in a certain
way, this does not rule out the possibility of incentive effects on political attitudes more
generally. It is not unlikely that a larger scale intervention could induce direct incentive
effects.
A second possibility is that the incentives generated by the stock positions we provide
could be either undone by participants trading outside the experiment or even may be
augmented as individuals become more familiar and engaged with stock market. Antici-
pating these possibilities, we explicitly stratified on those that had traded stocks within
six months prior to the experiment as they would be better positioned to undo the treat-
ment.20 Every week, we also asked participants that took up our financial assets directly
whether or not they had traded outside the experiment. In Figure A8 we plot the share
predict a 1% increase in the right vote share are associated with a 1.59% fall in the asset prices of ourparticipating Israeli stocks (Table A14).
20We are grateful to Ken Singleton for pointing this out during the design phase of our experiment.
26

of participants (among the compliers) who bought or sold stocks outside the experiment
(see also Jha and Shayo (2018)). Notice that, as expected, the experienced are consider-
ably more likely to report trading outside the experiment. Further, for the inexperienced
that took up assets, there is indeed an increase in the propensity to both buy and sell
outside the experiment as the study proceeds, consistent with an increase in familiarity
with the stock market. By the time of the elections 14% of inexperienced compliers
reported trading outside at least once. Mediation analysis reported in the Appendix,
however, suggests that this variation does not explain the treatment effect.
As discussed above, the effect on those who were divested before the election is not
smaller than the effect on those who had experimentally-assigned skin in the game on
election day. This is inconsistent with direct material incentives explaining the effect.
However, it remains an intriguing question why individuals who were divested before
the elections actually appear to respond more in their voting decisions (Col 2). One
possibility is that knowing that they were committing to a shorter duration, made early
divesters more likely to take up the treatment to begin with. It may have also made
them more engaged in trading and in other parts of the study during the period prior
to elections, increasing the treatment intensity. However, early divesters are only 0.011
(se=0.026) more likely to take up the treatment, and do not appear to engage in more
trades, have more accurate knowledge of their stock’s performance, spend more time on
the survey or be otherwise more engaged prior to the elections (Table A15).
Instead, we unpack the results in light of a distinction highlighted by Imas (2016):
that differences in risk-related behavior across settings can be reconciled by the differen-
tial effects of realized losses versus paper losses. In particular, he shows that individuals
experiencing realized losses tend to become more averse to risks, whereas those experienc-
ing paper losses become more risk-seeking. If this is true, and if the treatment operates
in part through exposing individuals to broader economic risks, then the effects should
be greater for those with realized losses relative to paper losses. Table 7, Col 5 examines
whether the treatment effect differs for early and late divesters according to whether the
price of their assigned asset rose or fell prior to the early group’s divestment. The results
appear to confirm Imas’s interpretation: while those whose assets did well show similar
effects among both early and late divesters, among those whose prices fell, the effect is
0.084 (se=0.029) for those who divested before the elections while it is 0.005 (se=0.024)
for those who did not realize these falls in price. Column 6 uses the price change to
instrument for realized versus paper portfolio gains and losses, showing a consistent pic-
ture: those with realized losses by election change their vote while those with paper losses
are less sensitive.
27

Finally, Columns 7 and 8 repeat this exercise for the subset of individuals who re-
ported (pre-treatment) a willingness to take risks that is at or below the sample median.
Consistent with the risk sensitivity interpretation, the difference between those with re-
alized and paper losses is further amplified for the risk-averse. Below we show that the
risk-averse respond more to the treatment in their attitudes towards the peace process
as well.
Rather than the direct material incentives provided by stockholdings, individuals
might also change their vote choices if exposure to financial markets induces them to
change their policy preferences over the peace process or in other domains. We therefore
asked our participants two sets of questions: on attitudes toward the peace process, and
on their views on conservative vs liberal economic policies (see Table 8). The questions on
the peace process that we use are drawn from a standard battery included in a national
survey conducted since 2003 (Smooha, 2015). These include both a broad question
on support for a two-state solution, as well as agreement with specific concessions for
peace, including the 1967 borders as the borders between the two states, the splitting of
Jerusalem, and the return of Palestinian refugees to the state of Palestine. Participants
were asked whether they approve, tend to approve, tend to disapprove or disapprove of the
statement in each question.21 For economic policy attitudes, we include questions from
the World Values Survey, assessing attitudes towards income inequality and governmental
responsibility for the poor. To these we add a question on the privatization of services
and industries, and a question gauging support for reductions in capital gains tax on
investment in the Israeli stock market. We combine the two sets of questions into a
Peace Index and an Economic Policy Index, following Kling, Liebman and Katz (2007),
where higher values indicate more of a left position.
Table 8 presents the overall effect of exposure to financial assets on the two indices,
as well as the effect component-by-component. Each regression includes the full set of
controls from Table 3 (Col 2). Overall, the treatment has a strong positive effect on
the summary index of agreement with the four principles underlying a potential peace
deal (Col 2). The effects appear stronger for the more specific and less widely accepted
concessions, and, once again, the point estimates are more pronounced among those less
21The proportions approving of these principles in our sample closely resemble the numbers in therepresentative sample of the Jewish population in the most recent survey, conducted in 2013. Theoverall trends in the population reveal either stable or falling support for these principles between 2003-4 and 2013. Specifically, support for the two state solution among the Jewish population fell from 71.3%in 2003 and 66.7% in 2012 to 61.5% in 2013. Support for the more specific principles has been eitherstable or falling since 2003-4, reaching roughly the same levels seen in our data. In 2013, support for1967 borders with land swaps was 40.3% (44.2 in 2003), for the splitting of Jerusalem it was 22.6% (23.3in 2004) and for the return of refugees it was 48.2% (62.6 in 2003). See Smooha (2015) for details.
28

Table 8: Treatment Effects on Attitudes
Mean[SD]
(1) (2 (3) (4) (5) (6) (7)
0.066 0.110 1,277 0.455 0.157 819 0.479[0.833] (0.044) (0.054)
-0.019 -0.026 1,111 0.210 -0.104 697 0.209[0.598] (0.041) (0.054)
2.522 0.101 1,277 0.231 0.230 819 0.265[1.140] (0.079) (0.102)
2.164 0.164 1,277 0.213 0.278 819 0.238[1.083] (0.079) (0.102)
1.822 0.189 1,277 0.206 0.213 819 0.238[1.039] (0.086) (0.110)
2.135 0.194 1,277 0.079 0.262 819 0.084[1.075] (0.077) (0.099)
-4.249 -0.009 1,110 0.044 -0.057 697 0.050[2.302] (0.076) (0.102)
4.530 0.033 1,111 0.052 -0.037 697 0.070[2.429] (0.073) (0.097)
-3.299 -0.162 1,110 0.052 -0.291 696 0.062[2.087] (0.077) (0.101)
2.652 0.053 1,104 0.073 -0.029 692 0.076[0.999] (0.080) (0.107)
Inexperienced
The top panel reports OLS (ITT) estimates of the treatment effect on attitude indices. The peace questions were asked in the March 19 survey. The economic questions were asked in the July 19 survey [The effect on the economic policy index for compliers vs control, asked March 12 (early divesters)/ April 5 (late divesters) is also negative and insignificant (-.0274 [0.039])]. The bottom panel reports ordered probit estimates of the treatment effect on the specific questions composing the indices. Col 1 provides means and standard deviations [in brackets]. Each summary index is the average of z-scores of its components, with the sign of each measure oriented so that attitudes commonly associated with the left have higher scores. The z-scores are calculated by subtracting the control group mean and dividing by the control group standard deviation (Kling et al. 2007). Robust standard errors in parentheses. All regressions include the full set of controls from Table 3 (Col 2).
R2 / Pseudo
R2Treatment
Effect Obs.Treatment
Effect Obs.
R2 / Pseudo
R2
Incomes in Israel should be made more equal (vs. need larger diffs as incentives).
Services and industries should be owned by the Government (vs. privatized).
Government responsible for helping the poor (vs. people should take care of themselves).
Oppose reducing capital gains tax on investments in the stock market (vs. support).
Full Sample
Two states for two peoples
1967 borders with a possibility of land exchanges
Jerusalem will be split into two separate cities - Arab and Jewish
Palestinian refugees will get compensation & allowed to return to Palestine only
Sample
Specific Outcomes (Ordered Probits):
Peace Index
Indices (OLS)
Economic Policy Index
experienced in financial markets prior to the experiment (Col 5). Remarkably, as we show
in Appendix Table A8 (cols 2,5), attitudes towards peace appear to change as much for
the religious and ultra-orthodox as for secular and traditional voters.
29

In contrast, the overall effect on the index of preferences over economic policies is
insignificant, and if anything slightly negative, indicating that financial market exposure
may have induced a slight move rightwards on these issues. In our case, this comes
mainly from a change in policy preferences towards increased individual—rather than
governmental—responsibility for addressing poverty.
Finally, in the post-election survey, we also assessed whether the exposure to financial
markets affected what could be considered inclusive preferences. Specifically, we asked
questions that assess individuals’ acceptance of cooperating and interacting with Israeli
Arabs in political, social and business domains (Table A17). While the point estimates
of the average treatment effect are positive on all three domains, the effect is statistically
significant only for the political domain (the acceptance of Arab parties in the governing
coalition).
To summarize, the effect of financial market exposure on voting decisions appears to
reflect a change in policy preferences rather than any direct economic incentives, and
the change in policy preferences stems chiefly from attitudes towards the peace process
(and potentially very slightly, inclusiveness), rather than economic policies. Mediation
analysis reported in the Appendix suggests that it is the variation in attitudes towards
the peace process that most explains the treatment effect on the vote.
6.2 Wealth and affect versus awareness and re-evaluation of
risks
Why did policy preferences change? One possibility is that receiving a financial portfolio
worth $50 or $100 might have some form of wealth effect that could change policy pref-
erences directly. It could also affect well-being or increase stress. It is worth observing,
however, that the initial amounts we provide are unlikely to change an individual’s overall
wealth meaningfully enough to influence voting a month later. Further, as we just saw,
economic policy preferences move, if at all, slightly to the right, rather than to the left.
However, we can test whether the effects of asset exposure are larger for the poor, as one
might expect with a direct wealth effect. Table 9 (Cols 1,3,5) estimates the interaction
of the treatment with an indicator for below average pre-treatment income on the vote
choice, peace index, and economic policy index. As expected, poorer individuals do sup-
port more left-leaning economic policies in our sample (Col 5). However, the interaction
term shows no significant difference in the treatment effect for this group for any of these
outcomes.
A related test of a potential wealth effect is to see if the effects are greater for those
30

Table 9: Wealth Effects
(1) (2) (3) (4) (5) (6)
Treatment 0.053 0.044 0.104 0.083 -0.017 -0.003(0.025) (0.021) (0.058) (0.049) (0.052) (0.047)
Below Avg Income 0.001 -0.052 0.175(0.035) (0.089) (0.081)
Treatment x Below Avg Income -0.004 0.014 -0.028(0.039) (0.094) (0.089)
High Allocation 0.016 0.055 -0.045(0.018) (0.042) (0.040)
Strata FE YES YES YES YES YES YESDemographic Controls YES YES YES YES YES YESObservations 1,311 1,311 1,277 1,277 1,111 1,111R-squared 0.547 0.549 0.454 0.455 0.207 0.211
Econ. Policy IndexPeace IndexOrdered Vote Choice
Notes : Dependent variables are individual vote choice, ordered from Right (0), Center/Other (0.5), to Left (1); the Peace Index; and the Economic Policy Index. Higher values of the indices imply greater support for peace negotiations and for redistributive policies, respectively. See Table 6. Robust standard errors in parentheses. The table reports the coefficient on the treatment indicator, a dummy for whether an individual had household income below the Israeli average, the interaction with the treatment (Col 1,3,5), and a dummy for whether an individual received a high allocation of 400 NIS in assets vs 200 NIS. All regressions include strata fixed effects and the full set of controls from Table 3, Col 2.
that received the high allocation. As Column 2 suggests, while the effect of being assigned
$50 of financial assets is 0.044 on the ordered vote choice, the effect of being assigned
$100 is only 0.016 larger (a statistically insignificant difference).
Another possibility is that the provision of financial assets causes meaningful changes
in individuals’ well-being, mood or affective states of mind, potentially associated with
winning a lottery or with having to make financial decisions. In other settings, the
positive effect of such chance events has tended to favor incumbent parties, which should,
if anything, attenuate our results (e.g. Healy, Malhotra and Mo, 2010). To examine this
directly, we asked individuals immediately after the elections not only about their overall
life satisfaction but also a battery comprising the top predictors of well-being based on
Benjamin et al. (2014, Table 2).22 As we show in Table A10, however, the treatment did
not significantly change any individual indicator of subjective well-being or a combined
index of all indicators. Taken together, our treatment effects do not appear to be due to
a wealth effect nor to a change in mood or affective state.
Instead, as the stronger point estimates of the effect on inexperienced investors sug-
gest, exposure to financial markets in a simplified way may have overcome fixed barriers
to learning and led to a re-evaluation of risks in a way that could help explain the change
22We included the top ten items, except the mental health question, which might have been consideredintrusive in the cultural context.
31

in policy preferences. In Jha and Shayo (2018), we present responses to an open-ended
question “What did you learn from the study?” among the treated. While some treated
participants, particularly those with pre-existing experience in the stock markets, said
that they learned nothing, by far the modal responses were that individuals felt more
familiar and confident in interacting with the stock market, and that they became more
cognizant of market risks and risk-return tradeoffs.
Consequently, treated individuals may become more aware of the economic risks and
returns of the status-quo relative to those of restarting the peace process. To assess
this possibility, immediately after the elections we asked individuals a set of questions
on the predicted benefits or costs of a peace agreement. These included two sociotropic
questions—how an agreement with the Palestinians would affect Israel’s economy and
security—and two questions on the effects on their personal safety and economic situation
(Table 10 provides the exact wording).
Before turning to the results, it is important to note that the idea that a peace
agreement could benefit the economy—or at least be less harmful to the economy than
it might be to security—is not entirely novel to voters. While 58% of individuals provide
the exact same answer to the two sociotropic questions, 33% of them say an agreement
will have a more beneficial (or less harmful) effect on the economy than it will on national
security. Only 9% of individuals say an agreement with the Palestinians will be better
for security than for the economy. This pattern shows up for both right and left voters.23
We now examine whether exposure to financial markets enhances such assessments.
Table 10 (Panel A) shows the OLS treatment effect on the sociotropic and personal
indices, as well as ordered probit estimates on responses to each question. Individuals
in the treatment group—especially among the financially inexperienced—predict greater
benefits from a peace agreement for Israel, and Israel’s economy in particular. In contrast,
the treated are as likely as the control group to predict that they will personally benefit
from a two state solution.24 Indeed, as Figure A9 suggests, the effect on assessments of
the potential gains to the Israeli economy from a peace agreement can explain around
23Among participants that had voted for the right in 2013, 57% provide the same answer to the twoquestions and 35% provide a more positive answer on the economy than on security. For the personalquestions, 65% provide the same answer to the two questions, 23% provide a more positive assessmenton the effect on personal economic situation and 12% provide a more positive assessment on the effecton personal security. The difference between the last two proportions is more pronounced among rightvoters in 2013 (32% vs. 6%).
24One possibility is that exposure to the stock market increases individuals’ perception of the corre-lation between their personal financial situation and the performance of the stock market, or of Israel’seconomy more generally. In Jha and Shayo (2018) however, we show that treated individuals do notincrease their assessment of these correlations. This again suggests that it is individuals’ reassessmentof the gains and risks to the national economy, more than how this affects their personal economicincentives, that is specifically relevant.
32

Table 10: Additional Mechanisms
Sample
Mean [SD] Treatment
Effect (SE) Treatment
Effect (SE)
Sociotropic Index (OLS) 0.011 [0.948] 0.041 (0.054) 0.130 (0.068)Israel's economy? (O. Probit) 3.294 [1.329] 0.126 (0.073) 0.223 (0.094)Israel's security? (O. Probit) 2.956 [1.392] -0.010 (0.076) 0.097 (0.097)
Personal Index (OLS) -0.013 [0.929] 0.003 (0.056) 0.030 (0.070)your personal economic situation? (O. Probit) 3.048 [1.047] -0.013 (0.077) 0.005 (0.101)your personal security? (O. Probit) 2.888 [1.237] -0.002 (0.075) 0.059 (0.094)
Observations
B. What is the Most important Issue in Israel today? (OLS)[March 2015]
Solely or Mainly Socio-Economic [0/1] 0.4074 [0.492] 0.039 (0.030) 0.023 (0.039)Solely or Mainly Security and the Political Process [0/1] 0.1387 [0.346] 0.007 (0.022) 0.005 (0.027)
Political Platforms & Facts Score [Prop Correct of 13] 0.694 [0.212] 0.002 (0.013) -0.010 (0.018)Economic Facts Score [Prop Correct of 5] 0.533 [0.276] 0.017 (0.016) 0.020 (0.021)
Stock mkt perform. answer within 3pp of actual 0.393 [0.489] 0.066 (0.033) 0.091 (0.042)Observations
Which of the following newspapers/websites do you usually read? Number of financial outlets [0-3] 1.117 [1.120] 0.203 (0.074) 0.195 (0.093)Number of non-financial outlets [0-5] 1.393 [1.032] -0.080 (0.075) -0.135 (0.097)
Haaretz [0/1] 0.151 [0.358] 0.005 (0.023) -0.028 (0.029)Israel Hayom [0/1] 0.431 [0.495] -0.052 (0.035) -0.066 (0.045)
ObservationsNotes: Treatment effects from separate regressions. Dependent variable in the first column. All regressions include the full set of controls and strata FE from Table 3, Col 2. Robust standard errors in parentheses. On March 19, 2015, we asked individuals to predict the effects of a two state solution at two levels--national and personal--and on two dimensions: security and the economy (Panel A). We also asked individuals whether the main issue in the elections was "socio-economic" or "security and the political [diplomatic] process" relative to "both" (Panel B). On April 17, we asked individuals 13 political knowledge questions, of which 2 were questions on salient events in the run-up to elections, 2 were questions on Netanyahu's public statements on the two-state solutions, 4 were questions on the positions taken by the leader of the Zionist Union (Herzog), and 5 were on political facts. Economic knowledge questions asked individuals to provide estimates on the unemployment rate, inflation rate, whether the stock market rose and fell and its change in value, and the change in housing prices. All answers were scored correct if they were within 3pp of the correct answer (Panel C). On July 19, we asked individuals which newspapers they usually read from among the following: Globes, The Marker, Haaretz, Vesti, Yediot Ahronoth, Israel Hayom, Calcalist and Maariv . Of these, Globes, The Marker and Calcalist are financial outlets (Panel D).
1,238 782
Inexperienced
1,120 705
Suppose Israel reaches a permanent agreement with the Palestinians based on the principle of two states for two peoples. How do you think this will affect... [1 (worsen a lot), 2 (worsen somewhat), 3 (no change), 4 (improve somewhat), 5(improve a lot)]
1281 / 1282 823
All
C. Economic and Political Facts (OLS) [Apr 2015]
D. Media Consumption (OLS) [July 2015]
A. Consequences of a Two-State Agreement (OLS/Ordered Probits) [March 2015]
1291 828
16% of the treatment effect on voting behavior.
33

6.3 Re-evaluating risks of status-quo policies vs a peace settle-
ment
As discussed above, exposure to the stock market appears to lead individuals to reevaluate
the economic risks and benefits from a peace agreement. This could reflect changes in
the perceived riskiness of concessions for peace (emphasized by the right) or the riskiness
of status quo policies (emphasized by the left). We can exploit the data we collected
on individuals’ pre-treatment risk aversion to distinguish which is most relevant in our
setting. If the treatment primarily reduces an individual’s perceived risk of pursuing a
peace initiative, either by lowering her perception of the probability of bad outcomes or
by increasing her evaluation of the returns in various states, then the treatment effect
should be larger among the less risk averse individuals, who may now be willing to take
the risk of pursuing such an initiative (see Appendix for the theoretical intuition). If, on
the other hand, the treatment causes individuals to perceive greater risks from continuing
with the status quo (i.e. the treatment leads the perceived returns under the status quo
to be second order stochastically dominated relative to the control), then the treatment
effect should be stronger among the more risk averse.
Table 11 estimates the treatment effect, interacted with individuals’ self-assessed pre-
treatment risk aversion, on voting, policy preferences and predictions about the effects
of a peace settlement. Notice that ex-ante risk averse individuals—in both treatment
and control—are not significantly different from their more risk-tolerant counterparts in
either their ordered vote choice or in their economic policy preferences (Cols 1 and 3,
respectively). However, while risk averse individuals in the control group are significantly
less supportive of peace concessions, risk averse individuals that were exposed to financial
markets show significantly greater increases in support for peace concessions (Col 2).
Similar differences show up in perceptions of how a peace settlement would affect both
Israel’s economic and security situation, and the individuals’ own. These heightened
treatment effects on the risk averse are consistent with exposure to financial markets
causing individuals to perceive a larger risk of continuing with status quo policies relative
to the risk from negotiating for peace.
6.4 Salience and Information
Along with financial asset exposure leading individuals to re-evaluate the benefits of
different policies to Israel’s economy, it may also make economic issues more salient in
their political decision-making. In the post-election survey, we asked individuals: “What
do you think is the most important issue in Israel today?” Table 10 (Panel B) provides
34

Table 11: Differential Effects by Risk Aversion
Ordered Vote Choice Peace Index Econ Pol. Index Sociotropic Index Personal Index(1) (2) (3) (4) (5)
Treatment 0.016 -0.079 -0.099 -0.098 -0.129(0.032) (0.075) (0.073) (0.093) (0.095)
Risk Averse -0.027 -0.176 -0.043 -0.140 -0.126(0.037) (0.086) (0.083) (0.104) (0.108)
Treatment * Risk Averse 0.055 0.291 0.115 0.218 0.205(0.041) (0.095) (0.089) (0.116) (0.120)
Demographic Controls YES YES YES YES YESStrata FE YES YES YES YES YESObservations 1,311 1,277 1,111 1,282 1,281R-squared 0.550 0.458 0.212 0.395 0.349
Effects of a Peace Settlement
This table shows the differential treatment effects on risk averse individuals, defined as those with ex ante subjective willingness to take risks at the median or below. The outcomes are the 2015 vote choice, ordered Right (0) Center/Other (0.5) Left (2), the Peace Index and the Economic Policy Index (Cols 1-3), and indices for whether a peace settlement will improve Israel's economy and/or security (Col 4) and the individual's personal safety and/or economic situation (Col 5). Indices constructed following Kling et al 2007. All regressions are OLS, and control for the full set of controls and strata FE in Table 3, Col 2, except that we replace the willingness to take risk measure with a dummy for being risk averse. Robust standard errors in parentheses.
some (imprecisely estimated) evidence on this: treated individuals are on average 3.9pp
more likely to respond that the main issue is only or mainly the socio-economic situation
rather than only or mainly security and the political [diplomatic] process, or “both are
equally important”.
We next look more closely at possible channels that may have led to a shift in at-
tention. One possibility is that the financial treatment distracted individuals, leading
to lower exposure to political news or propaganda relative to the control, which could
affect political engagement (see Gentzkow, Shapiro and Sinkinson, 2011, Falck, Gold and
Heblich, 2014, although as mentioned above, in our case there is no effect on turnout,
see Table 4). Alternatively, the treatment might have changed the slant of the news
sources they followed, which could affect the choice of party (DellaVigna and Kaplan,
2007, Enikolopov, Petrova and Zhuravskaya, 2011). A month after the elections, we
therefore fielded an information survey assessing participants’ political knowledge on fac-
tual issues, on the political platforms of the leaders of the Likud and Zionist Union, and
on events that took place during the election.25 As Panel C in Table 10 shows, how-
25These included 13 questions on the positions of the candidates (eg what is Herzog’s position concern-ing the establishment of a Palestinian state as part of a political agreement? ), events during the run-upto the elections (eg what was the main subject of Netanyahu’s Congress speech? ), and simple factualquestions (eg who was Minister of Defense in the previous government (until December 2014)? ). In thesame survey we also included questions on perceptions of Netanyahu’s positions on 5 issues in which hehas not expressed a consistent position. The treatment did not have a systematic effect on these itemseither.
35

ever, we find no evidence that the treatment affected individuals’ political knowledge.
Similarly, we asked participants five questions assessing their knowledge about prevailing
economic conditions, such as the unemployment and inflation rates. The treatment did
not have an effect on the extent of their economic knowledge, with one notable exception:
treated individuals had more accurate knowledge about the recent performance of the
Israeli stock market.
Four months after the elections, in July 2015, we also asked individuals which news
outlets they read regularly. As Panel D reveals, while treated individuals do not signifi-
cantly change their consumption of non-financial news, they do significantly increase the
number of financial outlets that they follow. In contrast, we find no change in the media
slant between treatment and control: they are as likely to read left-leaning news sources
(Haaretz ) and right-leaning outlets (Sheldon Adelson’s Israel Hayom).
These findings suggest that treated individuals are not being subject to broader media
influences. Instead the treatment appears to encourage individuals to take a specific
interest in economics and follow financial news. Given that it is not easy to nudge
people to follow economics or gain financial literacy, our treatment suggests a new and
apparently effective method of achieving this. We examine this process of “learning by
trading” in more detail in our companion paper (Jha and Shayo, 2018).
6.5 Short versus long-term attention and awareness
We now examine the persistence of the treatment effect on policy preferences. Beyond the
direct importance of this question, it can also help shed further light on the mechanism
involved. Specifically, the effect we find may be due to short-term attention to economics
or temporary behavioral responses (Jayaraman, Ray and Vericourt, 2016). In this case,
the effect should not persist. Alternatively, there are at least three reasons why there
could be a lasting effect. The first is habit formation: having decided to support a
particular position, and given that there are costs to re-optimizing, an individual may
reasonably stick with her previous decisions. A second is cognitive dissonance: having
voted for a particular party, an individual comes to prefer that party (see Mullainathan
and Washington, 2009). A third possibility is that treated individuals continue to follow
the broader economy, and this continues to influence their policy preferences. Note that,
unlike the first two reasons for persistence, the third implies that the treatment might
potentially have additional effects, beyond its immediate effect on vote choices during
the 2015 elections.
A year after the experimental intervention, in April 2016, we surveyed the original
participants about their current political positions. We were able to re-sample 943 partic-
36
Table 12: Voting Intentions, One Year Post-Intervention
ITT TOT ITT TOT
(1) (2) (3) (4)
Treatment 0.040 0.047 0.025 0.029(0.020) (0.022) (0.016) (0.018)
Voted Right '15 -0.266 -0.266(0.027) (0.025)
Voted Left '15 0.202 0.203(0.024) (0.022)
Demographic Controls YES YES YES YES
Strata FE YES YES YES YES
F(excluded instruments) 2622 2564
Observations 943 943 939 939R-squared 0.530 0.529 0.657 0.657Notes : Dependent variable is individuals' responses, in April 2016, to the question: "If elections were held today, which party would you vote for?" ordered from Right (0), Center/Other (0.5) to Left (1). The list of parties is identical to the list of parties in the 2015 elections. All regressions include the full set of controls from Table 3, Col 2, including controls for the vote choice in 2013. Cols 3-4 include indicators for an individual's vote for the left and the right in 2015. Robust standard errors in parentheses.
ipants, a sub-sample that is not statistically distinguishable across treatment and control
on pre-treatment vote choice, policy preferences and other characteristics (Table A11).
Yet, as Table 12 (Cols 1-2) suggests, when asked in April 2016 which political party they
would vote for if the elections were held that day, those exposed to the financial asset
treatment continue to show a 0.040 (ITT) to 0.047 (TOT) increase in their ordered vote
choice in favor of left parties (p-values 0.047 and 0.032, respectively). This reflects an in-
creased propensity to vote for the left by 4.9pp (ITT) to 5.7pp (TOT), and a reduction of
intended vote for the right by 3.1pp-3.7pp, as well as a higher Peace Index (Table A12).26
26In Appendix Table A13 we report treatment effects on the individual components of the peace indexas well as on other outcomes. Most are imprecisely estimated, but it might be worth noting that thepoint estimates are positive on all components of the peace index, as well as those of the social andbusiness indices, and negative on blaming the Palestinians for the conflict and integrating solely withthe West. The differences between treatment and control on the two state solution’s effects on theeconomy are attenuated relative to 2015, but as the increase in means relative to Table 10 suggest,this is not because the treated group fell in their assessments of the benefits of a peace settlement butrather that the perceived benefits among the control rose substantially. Attention in both groups shiftedsomewhat to security. It is worth noting that the period between the elections in March 2015 and ourfollow-up survey in April 2016 witnessed an upsurge in violence known as the ‘Stabbing Intifada’, inwhich 140 people were killed and 12,040 injured. See https://www.hrw.org/world-report/2016/country-chapters/israel/palestine. The control mimic the treatment in another dimension as well: when askeda new question on what would be the effects of a continued lack of negotiations, both treatment andcontrol were close to three times more likely to expect the economic and political situation to worsen thanimprove. Finally, we asked one more novel question in the 2016 follow-up, to gauge whether financial
37

Taken together, the results from the 2016 survey are inconsistent with a limited short-
term attention effect. Remarkably, Cols 3-4 in Table 12 suggest that the treatment effect
might be positive even controlling for individuals’ vote choice in 2015. This supports a
continued awareness and information-gathering interpretation rather than habit forma-
tion or cognitive dissonance alone.27
6.6 In-group vs. out-group assets, price effects and engagement
One might expect that exposure to the assets of the other party to the conflict—
Palestinian assets in our case—would have a greater effect than exposure to the assets
of one’s own group. This was, in fact, our prior. Out-group assets expose individuals to
more novel sets of considerations and shared risks. However, out-group assets are less
familiar, and there may also be stigma and psychological costs associated with “trad-
ing with the enemy” that can affect participation on both the extensive margin, in the
takeup of the financial assets (Huberman, 2001), and the intensive margin, in the levels
of engagement and learning. Simultaneously, the relative price performance of the differ-
ent assets may also influence willingness to participate and risk sensitivity (Imas, 2016,
Malmendier and Nagel, 2011, Greenwood and Nagel, 2009).
Table 13 separates the overall treatment effect into the effect of being assigned Pales-
tinian versus other assets. We examine both the Vote Choice and the Peace Index. The
effects of being assigned to Palestinian stocks appear rather similar in magnitude to
non-Palestinian assets (Cols 1-2). Palestinian and non-Palestinian asset exposure have
almost identical effects on the Peace Index (Panel B). For the vote choice, exposure to
non-Palestinian assets may even have a somewhat stronger effect, though the difference
is not significant (Panel A). These broad similarities in the overall effects, however, may
mask differences due to the price performance of Palestinian and Israeli assets during
the time of our study, differences in the extent to which individuals were engaged, and
differences in the inferences they make from their asset exposure. We consider each in
turn.
In Cols 3-4, we estimate the effect of the price change (in basis points) of each in-
dividual’s assigned asset up until the day before the election (March 16), beyond the
market exposure changes the extent to which a peace settlement is viewed as zero sum. The resultsare suggestive: as Figure A7 shows, while 29.27% of the control believed that a peace settlement wouldbenefit “only the Palestinians”, this falls to 26.27% in the treatment group.
27As further corroborative evidence, treated individuals also continue to be 6.06pp [0.0363] more likelyto read financial news outlets compared to those in the control with similar demographics, pre-treatmentfinancial literacy and other characteristics (mean= 40.1%). One year out, there is again little change(2.26pp [0.0246]) in the probability of following non-financial news outlets (mean= 88.8%). See Jha andShayo (2018).
38

Table 13: Effects of In-Group vs Out-Group Financial Assets
ITT TOT ITT TOT ITT TOT(1) (2) (3) (4) (5) (6)
Panel A: Ordered Vote ChoicePalestinian Assets 0.032 0.042 0.042 0.055
(0.022) (0.026) (0.024) (0.030)Non-Palestinian Assets 0.065 0.078 0.038 0.043
(0.020) (0.023) (0.036) (0.040)Treatment 0.041 0.051
(0.020) (0.023)Price change of asset by elections (basis points) 0.454 0.517 0.507 0.660
(0.222) (0.258) (0.557) (0.616)F(excluded instruments) 1454 1504 958.7Observations 1,311 1,311 1,311 1,311 1,311 1,311R-squared 0.550 0.547 0.550 0.548 0.550 0.548
Panel B: Peace IndexPalestinian Assets 0.111 0.142 0.120 0.155
(0.051) (0.061) (0.058) (0.068)Non-Palestinian Assets 0.110 0.131 0.086 0.098
(0.047) (0.054) (0.086) (0.094)Treatment 0.109 0.136
(0.046) (0.055)Price change of asset by elections (basis points) 0.044 -0.023 0.442 0.632
(0.520) (0.597) (1.297) (1.428)F(excluded instruments) 1482 1522 978.6Observations 1,277 1,277 1,277 1,277 1,277 1,277R-squared 0.455 0.455 0.455 0.455 0.455 0.455Demographic Controls YES YES YES YES YES YESStrata FE YES YES YES YES YES YESNotes: This table presents OLS (ITT) and 2SLS (TOT) estimates of the treatment effect on an individual's vote choice, ordered Right (0) Center/Other (0.5) Left (1) (Panel A) and the Peace Index (Panel B). The price change is the change in basis points measured from the day of assignment to the trading day preceding the election (March 16). Non-Palestinian Assets include Israeli stock and vouchers. All regressions include the full set of strata FE and controls from Table 3, Col 2. Robust standard errors are in parentheses.
effect of being assigned to the treatment. The treatment effect on vote choice is signif-
icantly higher for assets that performed well prior to election day, but improved price
performance does not appear to significantly increase willingness to support concessions
for peace. It is important to note that the participating Israeli assets all out-performed
the Palestinian assets (see Figure 2) and those exposed to Palestinian assets all faced
either realized or paper losses by election day. Thus the price changes also correlate
with assignment to in-group vs. out-group assets, making it hard to disentangle the two
effects. Including both price change and the assets’ nationality (Cols 5-6), the Pales-
tinian asset effects become somewhat stronger relative to Cols 1-2, and the effects of the
39

non-Palestinian assets are attenuated. However, the point estimate differences between
exposure to Palestinian and non-Palestinian assets remain statistically insignificant.
Take-up and engagement also show interesting differences. Those assigned Palestinian
stocks are less likely to take up the treatment (78.6% relative to 82.7% for the non-
Palestinian). Further, even among those that took up assets, those with Palestinian
stocks tend to be less engaged: they spend less time on the weekly surveys, answer fewer
factual questions about the asset and its past price performance correctly, and are not as
good at predicting the next week’s price performance (Table A15, Panels A,B). Though
individuals assigned Palestinian stocks did actively trade more in the weeks prior to the
elections, this is because they are more likely to sell their asset, not buy.
Despite the lower level of engagement (and thus the weaker intensity of treatment),
there is also suggestive evidence that those assigned Palestinian assets make different
inferences that may offset this. In particular, they are 40pp more likely than those that
received Israeli assets to credit peaceful relations with neighbors as the most important
driver of their assets’ value rather than company management, workers, national eco-
nomic policies and conditions and domestic political factors (Table A15, Panel C). And
those compliers who saw their financial asset’s value as being driven more by peaceful
relations are also more likely to support peace concessions (Table A16).
Thus, there appear to be two parallel channels at play. Individuals exposed to domes-
tic assets are more likely to take up assets and are more engaged, increasing the intensity
of treatment. In addition, domestic assets performed better during the time of our study.
Individuals exposed to out-group assets, however, appear more likely to make the direct
link between their financial asset and the peace process, and those that do are more likely
to alter their attitudes towards peace. The overall effects end up being quite similar.
7 Conclusion
This is the first paper to measure the causal effects of providing incentives for individuals
to trade in the stock market on their attitudes towards peace and their electoral choices.
We find that providing individuals with both means and incentives to trade in the stock
market systematically shifts their voting choices towards parties more supportive of the
peace process. These effects appear to persist a year after the experiment ended. The
evidence suggests that the treatment effects are not primarily driven by direct monetary
incentives but rather by changes in policy preferences. Furthermore, the change in policy
preferences appears to reflect an increased awareness of the broader risks to the economy
of status-quo policies relative to those that stem from initiatives for peace. We note that
40

financial exposure may also affect voting decisions through additional channels that were
not captured by the survey measures and subtreatments we included.
The novel design we use to harness financial exposure to increase awareness of shared
economic risks can be useful for a range of settings and applies well beyond violent
conflict. For example, in follow-up research, Jha, Margalit and Shayo (in progress) we
apply a parallel methodology, exposing UK voters to the opportunity to trade financial
assets in UK companies that complement the EU economy and EU companies that
complement that of the United Kingdom. Undecided voters exposed to these conditions
were twice as likely as control to vote to ‘Remain’ in the EU during the 2017 Brexit
referendum.
Contemporary policy suggestions in areas of persistent ethnic conflict tend to focus
either on diplomacy or on international peacekeeping. Our results suggest that an alter-
native approach that has been largely neglected in recent times—exposure to financial
markets—might have promise as well. The treatment effects we uncover are substantial
despite the context of persistent ethnic conflict, and they emerge without the need for
prohibitively high stakes or the need to expose individuals to the assets of the other party
to the conflict. This last feature is less likely to elicit a backlash by either politicians or
participants. Our intervention is also unobtrusive and non-paternalistic. It encourages
individuals to learn about stock markets on their own and leaves them to draw their own
conclusions about the economic costs of different policies. This should also help make it
more widely acceptable than information campaigns that might sometimes be perceived
as propaganda.
One intriguing possibility is that rather than focusing on providing aid to govern-
ments or even directly to populations in conflict zones, donors could examine providing
individuals with resources earmarked to invest in stock in their national or regional ex-
changes, which can only be sold gradually over time. Beyond the direct aid provided,
such policies might potentially lead recipients to internalize and take more account of
the gains and risks of conflict and peacemaking to society more generally. In so doing,
carefully designed financial exposure may provide a useful channel for fostering peace.
References
Abadie, Alberto, Susan Athey, Guido W Imbens, and Jeffrey Wooldridge,“When Should You Adjust Standard Errors for Clustering?,” Technical Report, Na-tional Bureau of Economic Research 2017.
Acemoglu, Daron and James A. Robinson, “Political Losers as a Barrier to Eco-nomic Development,” American Economic Review, 2000, 90 (2), 126–130.
41

Anthony, C. Ross, Daniel Egel, Charles P. Ries et al., The Costs of the Israeli-Palestinian Conflict, Santa Monica, CA: RAND Corporation, 2015.
Becker, Sascha and Luigi Pascali, “Religion, Division of Labor and Conflict: Anti-Semitism in German Regions over 600 Years.,” working paper, CAGE Warwick 2016.
Benjamin, Daniel J., Ori Heffetz, Miles S. Kimball, and Nichole Szembrot,“Beyond Happiness and Satisfaction: Toward Well-Being Indices Based on StatedPreference,” American Economic Review, 2014, 104 (9), 2698–2735.
Berrebi, Claude and Esteban Klor, “Are Voters Sensitive to Terrorism? DirectEvidence from the Israeli Electorate,” American Political Science Review, 2008, 102(3), 279–301.
Besley, Timothy and Marta Reynal-Querol, “The Legacy of Historical Conflict:Evidence from Africa,” American Political Science Review, 2014, 108 (2), 319–336.
Blattman, Christopher and Edward Miguel, “Civil War,” Journal of EconomicLiterature, 2010.
Bursztyn, Leonardo, Florian Ederer, Bruno Ferman, and Noam Yuchtman,“Understanding mechanisms underlying peer effects: evidence from a field experimenton financial decisions,” Econometrica, July 2014, 82 (4), 1273–1301.
DellaVigna, Stefano and Ethan Kaplan, “The Fox News effect: Media bias andvoting,” The Quarterly Journal of Economics, 2007, 122 (3), 1187–1234.
Eckstein, Zvi and Daniel Tsiddon, “Macroeconomic consequences of terror: theoryand the case of Israel,” Journal of Monetary Economics, 2004, 51, 971–1002.
Enikolopov, Ruben, Maria Petrova, and Ekaterina Zhuravskaya, “Media andpolitical persuasion: Evidence from Russia,” The American Economic Review, 2011,101 (7), 3253–3285.
Falck, Oliver, Robert Gold, and Stephan Heblich, “E-lections: Voting Behaviorand the Internet,” The American Economic Review, 2014, 104 (7), 2238–2265.
Fearon, James D., “Bargaining over objects that influence future bargaining power.,”October 1996. Paper presented APSA general meetings.
Gentzkow, Matthew, Jesse M Shapiro, and Michael Sinkinson, “The effect ofnewspaper entry and exit on electoral politics,” The American Economic Review, 2011,101 (7), 2980–3018.
Getmansky, Anna and Thomas Zeitzoff, “Terrorism and Voting: The Effect ofRocket Threat on Voting in Israeli Elections,” American Political Science Review,August 2014, 108 (3), 588–604.
Greenwood, Robin and Stefan Nagel, “Inexperienced investors and bubbles,” Jour-nal of Financial Economics, 2009, 93 (2), 239–258.
42

Grosfeld, Irena, Seyhun Orcan Sakalli, and Ekaterina Zhuravskaya, “Middle-man Minorities and Ethnic Violence: Anti Jewish Pogroms in Eastern Europe,” 2017.mimeo, Paris School of Economics.
Healy, Andrew J., Neil A. Malhotra, and Cecilia H. Mo, “Irrelevant EventsAffect Voters’ Evaluations of Government Performance.,” Proceedings of the NationalAcademy of Sciences, 2010, 29 (12), 804–9.
Hirschman, Albert O., The passions and the interests: political arguments for capi-talism before its triumph., Princeton, NJ: Princeton University Press, 1977.
Huberman, Gur, “Familiarity Breeds Investment,” Review of Financial Studies, 2001,14 (3), 659–680.
Imai, Kosuke, Luke Keele, Dustin Tingley, and Teppei Yamamoto, “Unpackingthe black box of causality: Learning about causal mechanisms from experimental andobservational studies,” American Political Science Review, 2011, 105 (4), 765–789.
Imas, Alex, “The realization effect: Risk-taking after realized versus paper losses,” TheAmerican Economic Review, 2016, 106 (8), 2086–2109.
Jayaraman, Rajshri, Debraj Ray, and Francis De Vericourt, “Anatomy of aContract Change,” American Economic Review, 2016, 106 (2), 316–358.
Jha, Saumitra, “Sharing the Future: Financial Innovation and Innovators in Solvingthe Political Economy Challenges of Development,” in Masahiko Aoki, Timur Kuran,and Gerard Roland, eds., Institutions and Comparative Economic Development, IEAConference Proceedings 150: Palgrave Macmillan 2012.
, “Trade, Institutions and Ethnic Tolerance: Evidence from South Asia,” AmericanPolitical Science Review, November 2013, 107 (4), 806–832.
, ““Unfinished Business”: Historic Complementarities, Political Competition and Eth-nic Violence in Gujarat,” Journal of Economic Behaviour and Organisation, August2014, 104, 18–36.
, “Financial Asset Holdings and Political Attitudes: Evidence from RevolutionaryEngland,” Quarterly Journal of Economics, August 2015, 103 (3), 1485–1545.
and Moses Shayo, “Learning by Trading,” 2018. mimeo, Stanford University.
, Kris Mitchener, and Masanori Takashima, “Swords into Bank Shares: Finance,Conflict and Political Reform in Meiji Japan,” 2017. mimeo.
, Yotam Margalit, and Moses Shayo, “Financial Market Exposure, Complemen-tarities and Support for International Integration: Evidence from Brexit,” in progress.
Karlan, Dean and Jonathan Morduch, “Access to Finance,” in Dani Rodrik andMark Rosenzweig, eds., Handbook of Development Economics, Elsevier, 2010, pp. 4703–84.
43
Kling, Jeffrey R., Jeffrey B. Liebman, and Lawrence F. Katz, “ExperimentalAnalysis of Neighborhood Effects,” Econometrica, 2007, 75 (1), 83–119.
Malmendier, Ulrike and Stefan Nagel, “Depression Babies: Do MacroeconomicExperiences Affect Risk Taking?,” Quarterly Journal of Economics, 2011, 126 (1),373–416.
Martin, Philippe, Thierry Mayer, and Mathias Thoenig, “Make Trade NotWar?,” Review of Economic Studies, 2008, 75 (3), 865–900.
Montesquieu, Charles-Louis de Secondat, The Spirit of the Laws, 1989 ed., Cam-bridge University Press, 1748.
Mullainathan, Sendhil and Ebonya Washington, “Sticking with Your Vote: Cog-nitive Dissonance and Political Attitudes,” American Economic Journal: Applied Eco-nomics, January 2009, 1 (1), 86–111.
Podsakoff, Philip M. et al., “Common Method Biases in Behavioral Research: ACritical Review of the Literature and Recommended Remedies,” Journal of AppliedPsychology, 2003, 88 (5), 879–903.
Rajan, Raghuram G., “The persistence of underdevelopment: constituencies and com-petitive rent preservation,” December 2006. manuscript.
Reuters, “Netanyahu says no Palestinian state as long as he’s prime minister,”www.reuters.com/article/2015/03/16/us-israel-election-idUSKBN0MC1I820150316March 16 2015.
Rohner, Dominic, Mathias Thoenig, and Fabrizio Zilibotti, “War Signals: ATheory of Trade, Trust and Conflict,” Review of Economic Studies, 2013, 80 (3),1114–1147.
Sambanis, Nicholas and Moses Shayo, “Social Identification and Ethnic Conflict,”American Political Science Review, May 2013, 107 (2), 294–325.
Shayo, Moses and Asaf Zussman, “Judicial In-Group Bias in the Shadow of Terror-ism,” Quarterly Journal of Economics, 2011, 126 (3), 1447–1484.
and , “Conflict and the Persistence of Ethnic Bias,” American Economic Journal:Applied Economics, forthcoming 2017.
Smooha, Sammy, Still Playing by the Rules: 2013 Index of Arab-Jewish Relations inIsrael, Israel Democracy Institute and University of Haifa, 2015.
The Zionist Union, “The Zionist Union - Platform 2015,” 2015. In Hebrew.
Voigtlander, Nico and Joachim Voth, “Persecution Perpetuated: The MedievalOrigins of Anti-Semitic Violence in Nazi Germany,” Quarterly Journal of Economics,2012, 127 (3), 1339–1392.
44

World Bank, World Development Report: Conflict, Security and Development, Wash-ington, DC: World Bank, 2011.
Yesh Atid, “Party Platform,” 2015. In Hebrew.
Zussman, Asaf, Noam Zussman, and Morten Orregaard Nielsen, “Asset MarketPerspectives on the Israeli-Palestinian Conflict,” Economica, 2008, 75, 84–115.
45
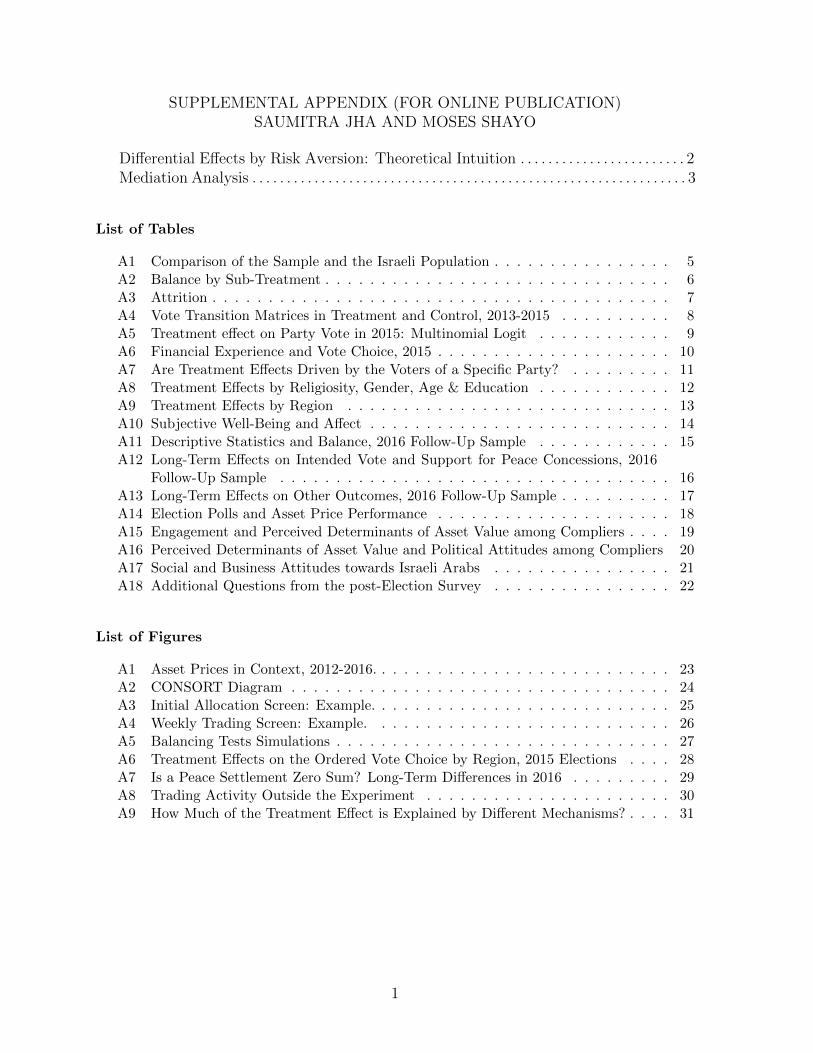
SUPPLEMENTAL APPENDIX (FOR ONLINE PUBLICATION)SAUMITRA JHA AND MOSES SHAYO
Differential Effects by Risk Aversion: Theoretical Intuition . . . . . . . . . . . . . . . . . . . . . . . . 2Mediation Analysis . . . . . . . . . . . . . . . . . . . . . . . . . . . . . . . . . . . . . . . . . . . . . . . . . . . . . . . . . . . . . . . 3
List of Tables
A1 Comparison of the Sample and the Israeli Population . . . . . . . . . . . . . . . . 5A2 Balance by Sub-Treatment . . . . . . . . . . . . . . . . . . . . . . . . . . . . . . . 6A3 Attrition . . . . . . . . . . . . . . . . . . . . . . . . . . . . . . . . . . . . . . . . . 7A4 Vote Transition Matrices in Treatment and Control, 2013-2015 . . . . . . . . . . 8A5 Treatment effect on Party Vote in 2015: Multinomial Logit . . . . . . . . . . . . 9A6 Financial Experience and Vote Choice, 2015 . . . . . . . . . . . . . . . . . . . . . 10A7 Are Treatment Effects Driven by the Voters of a Specific Party? . . . . . . . . . 11A8 Treatment Effects by Religiosity, Gender, Age & Education . . . . . . . . . . . . 12A9 Treatment Effects by Region . . . . . . . . . . . . . . . . . . . . . . . . . . . . . 13A10 Subjective Well-Being and Affect . . . . . . . . . . . . . . . . . . . . . . . . . . . 14A11 Descriptive Statistics and Balance, 2016 Follow-Up Sample . . . . . . . . . . . . 15A12 Long-Term Effects on Intended Vote and Support for Peace Concessions, 2016
Follow-Up Sample . . . . . . . . . . . . . . . . . . . . . . . . . . . . . . . . . . . 16A13 Long-Term Effects on Other Outcomes, 2016 Follow-Up Sample . . . . . . . . . . 17A14 Election Polls and Asset Price Performance . . . . . . . . . . . . . . . . . . . . . 18A15 Engagement and Perceived Determinants of Asset Value among Compliers . . . . 19A16 Perceived Determinants of Asset Value and Political Attitudes among Compliers 20A17 Social and Business Attitudes towards Israeli Arabs . . . . . . . . . . . . . . . . 21A18 Additional Questions from the post-Election Survey . . . . . . . . . . . . . . . . 22
List of Figures
A1 Asset Prices in Context, 2012-2016. . . . . . . . . . . . . . . . . . . . . . . . . . . 23A2 CONSORT Diagram . . . . . . . . . . . . . . . . . . . . . . . . . . . . . . . . . . 24A3 Initial Allocation Screen: Example. . . . . . . . . . . . . . . . . . . . . . . . . . . 25A4 Weekly Trading Screen: Example. . . . . . . . . . . . . . . . . . . . . . . . . . . 26A5 Balancing Tests Simulations . . . . . . . . . . . . . . . . . . . . . . . . . . . . . . 27A6 Treatment Effects on the Ordered Vote Choice by Region, 2015 Elections . . . . 28A7 Is a Peace Settlement Zero Sum? Long-Term Differences in 2016 . . . . . . . . . 29A8 Trading Activity Outside the Experiment . . . . . . . . . . . . . . . . . . . . . . 30A9 How Much of the Treatment Effect is Explained by Different Mechanisms? . . . . 31
1

Differential Effects by Risk Aversion: Theoretical Intuition
If the treatment primarily attenuates an individual’s perceived risk of pursuing a peaceinitiative, either by lowering the probability of bad outcomes or by increasing the returnsin the various states, then the treatment effect should be larger among the less risk averseindividuals, who may now be willing to take the risk of pursuing such an initiative.
To see the intuition more clearly, consider a simple example. Suppose that absentthe treatment, the payoff from the status quo (SQ) is 55 while a peace initiative (PI)is a gamble yielding 100 with probability 0.5 and 0 with probability 0.5. In this case,both a risk averse and a risk neutral individual would prefer SQ to PI. Now supposethe treatment leads individuals to reevaluate the odds of the good and the bad statesunder PI. Specifically, PI now yields 100 with probability 0.6 and 0 with probability 0.4.Note that a risk neutral individual would now prefer PI to SQ. However, a sufficientlyrisk averse individual would still prefer SQ. Alternatively, suppose the treatment leadsindividuals to reevaluate the returns in the various states under PI. Specifically, PI nowyields 107 with probability 0.5 and 7 with probability 0.5. Again, a risk neutral wouldnow prefer PI but a sufficiently risk averse individual would prefer SQ.
If, on the other hand, the treatment causes individuals to perceive greater risks fromcontinuing with the status quo (i.e. the treatment leads the perceived returns underthe status quo to be second order stochastically dominated relative to the control), thenthe treatment effect should be stronger among the more risk averse. Continuing theexample, suppose that absent the treatment, the payoff from the SQ is 55 and from PI50. But now suppose the treatment leads individuals to perceive a risk associated withSQ. Specifically, now SQ is seen as a gamble yielding 0 with probability 0.5 and 110 withprobability 0.5. A risk neutral would continue to prefer SQ but a sufficiently risk averseindividual would switch to preferring PI.
2

How Much Of The Effect Is Explained by Different Mechanisms?
As a heuristic exercise, this appendix examines how much of the estimated treatmenteffect is explained when we control for each of the candidate channels discussed in Section6 in the paper. While we do not claim to engage in a full-fledged mediation exercise,which requires strong orthogonality conditions (see discussion in Imai, Keele, Tingleyand Yamamoto, 2011), nevertheless this exercise can be illuminating.
Figure A9 shows the estimated treatment effect on the ordered vote choice, after con-trolling for different outcome variables. The change in coefficients suggests a consistentpattern that highlights the relationship between asset exposure, attitudes towards peaceand a focus on the gains to the broader economy. In the post-election social survey(top-left panel), individuals’ attitudes towards peace stand out as a major factor that isboth influenced by the treatment and is correlated with the vote choice: holding individ-uals’ post-treatment peace attitudes constant attenuates the treatment effect by 28.6%.Two other factors also stand out: the fact that, as we have seen, treated individuals are(somewhat) more likely to view socio-economics as the main issue in the election and thatthey also increase their assessment of the potential gains to the Israeli economy from apeace agreement. Both these factors also correlate with a vote for parties supportive ofthe peace process, and controlling for them attenuates the treatment effect by 9.6% and17.3% respectively.
In contrast, controlling for other factors that might influence one’s vote, such asan increased willingness to socialize with or do business with Israeli Arabs, subjectivewellbeing, the security and personal effects of the peace process, a focus on security, orinformation acquisition of political platforms or economic facts (bottom left panel), donot seem to explain the treatment effect.
Consider next the July financial survey (top-right panel). As we have seen, those ex-posed to financial assets also somewhat increase their conservatism on economic policy.Since this would encourage a vote for the right, controlling for it increases the esti-mated treatment effect on vote choice. Similarly, controlling for financial literacy slightlystrengthens the estimated effect.
It is perhaps interesting to note that simultaneously controlling for the three most in-fluential channels (peace attitudes, attention to economics and evaluation of the economiceffects of the peace process) attenuates the treatment effect by 39.5% (to 0.032 (0.0177)).Controlling for all the channels—including those that strengthen the effect—attenuatesit by 25.1% (to 0.041 (0.0195) in the common sample). Yet, the fact that there remainsa robust and significant effect of financial asset exposure on voting, even controlling forall these factors, might suggest that financial exposure may operate through additionalmechanisms that demand further research.
As one step in this direction, the bottom right panel of Figure A9 compares the extentto which controlling for different responses among the compliers augments or attenuatesthe treatment effect. First observe that controlling for those that traded outside theexperiment actually strengthens the treatment effect. This suggests that these outsidetrades might indeed have played a small role in undoing the treatment. Further, wefind some suggestive evidence for the parallel channels we discussed in subsection 6.6 (onthe Israeli and Palestinian sub-treatments). The more engaged and active in the study
3

(higher for the Israeli asset treatment) are more likely to change their voting decision,thus controlling for engagement attenuates the treatment effect. In parallel, however,as we have seen there is a correlation between compliers that emphasized the role ofinter-state peace in driving their asset’s value and support for peace (higher for thePalestinian treatment). Controlling for individuals’ evaluations of the drivers of theirasset also attenuates the treatment substantially. This attenuation is consistent withboth engagement in financial activity and the making of a link between financial assetsand peace potentially acting as parallel intermediating mechanisms.
4
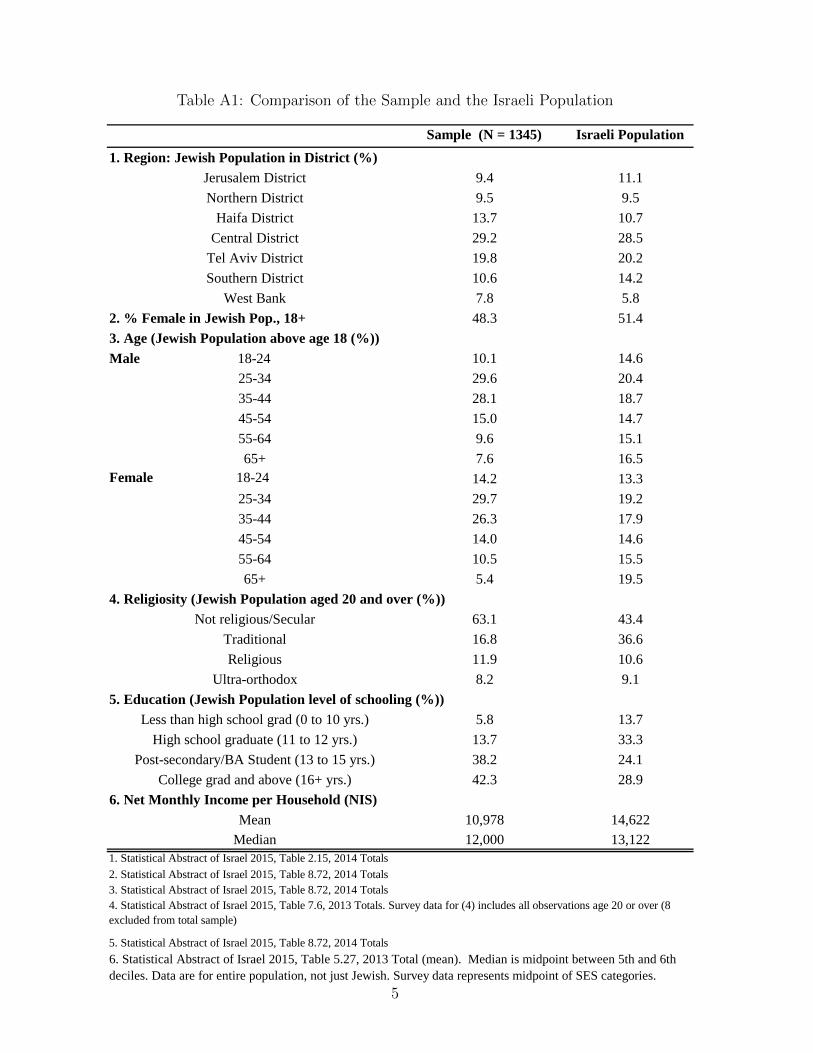
Table A1: Comparison of the Sample and the Israeli Population
Sample (N = 1345) Israeli Population1. Region: Jewish Population in District (%)
Jerusalem District 9.4 11.1Northern District 9.5 9.5
Haifa District 13.7 10.7Central District 29.2 28.5
Tel Aviv District 19.8 20.2Southern District 10.6 14.2
West Bank 7.8 5.82. % Female in Jewish Pop., 18+ 48.3 51.43. Age (Jewish Population above age 18 (%))Male 18-24 10.1 14.6
25-34 29.6 20.435-44 28.1 18.745-54 15.0 14.755-64 9.6 15.165+ 7.6 16.5
Female 18-24 14.2 13.325-34 29.7 19.235-44 26.3 17.945-54 14.0 14.655-64 10.5 15.565+ 5.4 19.5
4. Religiosity (Jewish Population aged 20 and over (%))Not religious/Secular 63.1 43.4
Traditional 16.8 36.6Religious 11.9 10.6
Ultra-orthodox 8.2 9.15. Education (Jewish Population level of schooling (%))
Less than high school grad (0 to 10 yrs.) 5.8 13.7High school graduate (11 to 12 yrs.) 13.7 33.3
Post-secondary/BA Student (13 to 15 yrs.) 38.2 24.1College grad and above (16+ yrs.) 42.3 28.9
6. Net Monthly Income per Household (NIS) Mean 10,978 14,622
Median 12,000 13,1221. Statistical Abstract of Israel 2015, Table 2.15, 2014 Totals2. Statistical Abstract of Israel 2015, Table 8.72, 2014 Totals3. Statistical Abstract of Israel 2015, Table 8.72, 2014 Totals
5. Statistical Abstract of Israel 2015, Table 8.72, 2014 Totals
4. Statistical Abstract of Israel 2015, Table 7.6, 2013 Totals. Survey data for (4) includes all observations age 20 or over (8 excluded from total sample)
6. Statistical Abstract of Israel 2015, Table 5.27, 2013 Total (mean). Median is midpoint between 5th and 6th deciles. Data are for entire population, not just Jewish. Survey data represents midpoint of SES categories.
5

Table A2: Balance by Sub-Treatment
Control Mean[SD] Diff. (SE) P-value Diff.
(SE)P-value Diff.
(SE)P-value Diff.
(SE)P-value Diff.
(SE)P-value
[1) (2) (3) (4) (5) (6) (7) (8) (9) (10) (11)0.245 0.000 0.994 -0.008 0.845 -0.002 0.952 -0.01 0.764 0.003 0.925
[0.431] (0.03) (0.039) (0.031) (0.032) (0.033)0.126 0.009 0.696 0.011 0.733 0.011 0.644 0.014 0.592 0.008 0.751
[0.332] (0.023) (0.031) (0.025) (0.026) (0.026)0.004 0.044 0.435 0.034 0.634 0.053 0.382 0.064 0.300 0.037 0.554
[0.784] (0.057) (0.072) (0.06) (0.061) (0.062)-0.005 0.009 0.821 0.012 0.832 0.000 0.993 0.037 0.397 -0.013 0.767[0.596] (0.04) (0.054) (0.042) (0.043) (0.045)0.368 -0.017 0.600 0.011 0.800 0.007 0.843 -0.007 0.843 -0.03 0.408
[0.483] (0.033) (0.044) (0.035) (0.037) (0.036)0.513 0.012 0.730 0.032 0.482 0.002 0.946 0.021 0.579 -0.017 0.656
[0.501] (0.035) (0.046) (0.036) (0.038) (0.038)41.53 -2.221 0.019 -3.904 0.002 -2.253 0.023 -2.079 0.048 -1.587 0.134
[14.293] (0.946) (1.254) (0.99) (1.048) (1.058)0.232 -0.021 0.460 0.021 0.596 -0.012 0.688 -0.001 0.965 -0.013 0.673
[0.423] (0.029) (0.039) (0.03) (0.032) (0.032)0.152 -0.011 0.641 -0.001 0.981 -0.007 0.780 0.012 0.669 -0.023 0.377
[0.360] (0.024) (0.033) (0.026) (0.028) (0.026)0.427 0.014 0.695 -0.033 0.462 0.012 0.738 -0.006 0.882 0.019 0.606
[0.495] (0.034) (0.045) (0.036) (0.038) (0.038)0.629 -0.043 0.205 -0.028 0.528 -0.043 0.228 -0.056 0.136 -0.009 0.812
[0.484] (0.034) (0.045) (0.036) (0.037) (0.037)0.636 -0.026 0.441 0.001 0.989 -0.016 0.646 -0.018 0.623 -0.003 0.935
[0.482] (0.034) (0.044) (0.035) (0.037) (0.037)0.172 0.006 0.825 -0.026 0.446 0.000 0.989 0.002 0.949 -0.011 0.701
[0.378] (0.026) (0.034) (0.027) (0.029) (0.028)0.119 0.013 0.579 0.017 0.573 -0.007 0.748 0.008 0.742 -0.005 0.836
[0.325] (0.023) (0.03) (0.023) (0.025) (0.024)0.073 0.007 0.696 0.008 0.743 0.023 0.258 0.008 0.693 0.019 0.369
[0.260] (0.019) (0.024) (0.021) (0.02) (0.021)0.096 0.003 0.870 0 0.998 -0.012 0.571 -0.005 0.809 -0.007 0.761
[0.295] (0.021) (0.027) (0.021) (0.022) (0.022)0.089 0.004 0.839 0.042 0.137 -0.005 0.803 -0.004 0.866 0.002 0.913
[0.286] (0.02) (0.028) (0.02) (0.021) (0.022)0.123 0.021 0.370 0.029 0.353 0.023 0.366 0.017 0.505 0.016 0.524
[0.328] (0.024) (0.031) (0.025) (0.026) (0.026)0.298 -0.009 0.783 -0.035 0.392 -0.018 0.592 -0.009 0.799 0.007 0.837
[0.458] (0.032) (0.041) (0.033) (0.035) (0.035)0.212 -0.015 0.600 -0.01 0.790 -0.006 0.838 -0.006 0.845 -0.033 0.269
[0.409] (0.028) (0.037) (0.03) (0.031) (0.03)0.116 -0.015 0.481 -0.045 0.097 0.006 0.810 0.004 0.864 -0.012 0.623
[0.321] (0.021) (0.027) (0.024) (0.025) (0.024)0.066 0.009 0.600 0.02 0.413 0.012 0.521 0.002 0.900 0.026 0.218
[0.249] (0.018) (0.024) (0.019) (0.019) (0.021)11162.16 -266.078 0.484 273.071 0.593 -196.23 0.629 -481.364 0.245 -58.627 0.889[5324.78] (380.176) (511.126) (406.342) (413.568) (419.387)
4.344 0.433 0.006 0.327 0.116 0.446 0.006 0.393 0.024 0.37 0.028[2.240] (0.157) (0.208) (0.162) (0.173) (0.168)0.642 0.002 0.963 0.039 0.364 0.046 0.179 0.029 0.418 -0.012 0.741
[0.480] (0.033) (0.043) (0.034) (0.036) (0.037)69.726 0.431 0.793 0.476 0.828 1.927 0.254 0.723 0.690 1.384 0.433
[23.917] (1.642) (2.194) (1.689) (1.809) (1.764)Notes : Standard deviations in brackets in Col 1. Standard errors in parentheses in Cols 2-11. Each entry in Cols 2-11 is derived from a separate OLS regression where the explanatory variable is an indicator for treatment. +: mid-point of SES income categories.
Financial literacy: % correct
Late Divest Voucher High Allocation
Region: Jerusalem
North
Haifa
Center
Tel Aviv
South
West Bank
Age [Yrs]
Post Secondary EducationBA Student
BA Graduate and Above
Palestinian Israeli Stock
Monthly Family Income [NIS]+Willing to Take Risks [1-10]
Voted Right '13
Voted Left '13
Peace Index
Economic Policy Index
Bought/Sold Shares in Last 6 Mths [0/1]Male
Time preference median or above
Married
Religiosity: Secular
Traditional
Religious
Ultra-Orthodox
6

Table A3: Attrition
Treatment ControlInitial assignment 1036 309
Observed vote in March 2015 elections 1009 302Proportion observed 0.974 0.977
Observed peace deal attitudes, March 2015 985 292Proportion observed 0.951 0.945
Observed economic attitudes, July 2015 854 257Proportion observed 0.824 0.832
Observed vote intention, April 2016 731 207Proportion observed 0.706 0.670
7

Tab
leA
4:V
ote
Tra
nsi
tion
Mat
rice
sin
Tre
atm
ent
and
Con
trol
,20
13-2
015
Rig
ht
Cen
ter
Left
Tota
lR
ight
C
ente
r Le
ft To
tal
Rig
ht83
.13
13.9
92.
8810
0R
ight
86.4
910
.81
2.7
100
Cen
ter
17.0
452
.87
30.1
100
Cen
ter
21.5
856
.32
22.1
110
0
Left
4.35
11.5
984
.06
100
Left
7.89
10.5
381
.58
100
Tota
l31
.22
37.8
630
.92
100
Tota
l35
.76
39.4
24.8
310
0
Vot
e in
20
13
Not
e: T
he ta
ble
show
s the
% sh
are
of in
divi
dual
s vot
ing
for s
peci
fic b
lock
s in
2015
by
thei
r vot
e in
201
3. It
incl
udes
onl
y pa
rtici
pant
s for
who
m w
e kn
ow th
eir v
ote
in 2
015
(131
1 ou
t of 1
345
assi
gned
to tr
eatm
ents
). Th
ese
incl
ude
1009
obs
erva
tions
in
the
treat
men
t gro
up a
nd 3
02 in
the
cont
rol g
roup
.
Vot
e in
201
5Tr
eatm
ent
Con
trol
Vot
e in
201
5
8

Table A5: Treatment effect on Party Vote in 2015: Multinomial Logit
Zionist Union 0.243 0.429 Yesh Atid 0.179 0.384 -0.439 (0.215) Likud 0.163 0.370 -0.681 (0.255) Habayit Hayehudi 0.097 0.296 -0.340 (0.301) Kulanu 0.084 0.277 -0.218 (0.283) Meretz 0.050 0.217 0.338 (0.386) Shas 0.043 0.204 0.014 (0.398) Haam Itanu 0.043 0.202 -0.492 (0.354) Yahadut HaTorah 0.042 0.201 -0.371 (0.364) Did Not Vote 0.021 0.142 0.155 (0.569) Israel Beitenu 0.020 0.139 -0.356 (0.486) Arab Joint List 0.002 0.048 14.417 (0.771) Other 0.013 0.113 -0.509 (0.545)
reference category
Notes: N=1311. The table presents Multinomial Logit estimates of the treatment effect on the party voted for in the 2015 elections. The parties are ordered by their vote share in the sample. The multinomial logit includes controls for 2013 vote, age(2), willingness to take risks and traded stocks pre-treatment. Robust standard errors in parentheses.
Multinomial Logit
Vote in 2015 elections [0/1] Sample Mean SD Treatment
Effect SE
9

Tab
leA
6:F
inan
cial
Exp
erie
nce
and
Vot
eC
hoi
ce,
2015
ITT
ITT
rew
eigh
ted
TOT
ITT
ITT
rew
eigh
ted
TOT
ITT
ITT
rew
eigh
ted
TOT
(1)
(2)
(3)
(4)
(5)
(6)
(7)
(8)
(9)
Bou
ght/S
old
Shar
es in
Las
t 6 M
ths [
0/1
0.09
60.
097
0.10
0-0
.002
-0.0
13-0
.004
0.04
90.
055
0.05
2(0
.045
)(0
.038
)(0
.046
)(0
.047
)(0
.055
)(0
.047
)(0
.037
)(0
.039
)(0
.037
)Tr
eatm
ent
0.01
80.
003
0.02
2-0
.042
-0.0
59-0
.049
0.03
00.
031
0.03
6(0
.043
)(0
.036
)(0
.050
)(0
.040
)(0
.049
)(0
.047
)(0
.033
)(0
.036
)(0
.039
)Tr
eatm
ent x
Inex
perie
nced
0.07
00.
071
0.09
0-0
.002
0.01
3-0
.007
0.03
60.
029
0.04
8(0
.051
)(0
.043
)(0
.061
)(0
.050
)(0
.059
)(0
.060
)(0
.040
)(0
.042
)(0
.048
)St
rata
FE
NO
NO
NO
NO
NO
NO
NO
NO
NO
Dem
ogra
phic
Con
trols
YES
YES
YES
YES
YES
YES
YES
YES
YES
Obs
erva
tions
1,31
11,
311
1,31
11,
311
1,31
11,
311
1,31
11,
311
1,31
1R
-squ
ared
0.35
40.
492
0.34
90.
453
0.49
10.
453
0.47
80.
565
0.47
4
Vot
e fo
r L
eft P
arty
in 2
015
Vot
e fo
r R
ight
Par
ty in
201
5O
rder
ed V
ote
Cho
ice
in 2
015
Not
es:
OLS
(ITT
) and
2SL
S (T
OT)
est
imat
es o
f the
trea
tmen
t effe
ct o
n th
e pr
obab
ility
that
an
indi
vidu
al v
oted
for a
left
or ri
ght p
arty
in 2
015,
and
the
orde
red
vote
cho
ice
(0-R
ight
, 0.5
-Cen
ter,
1-Le
ft).
``Ine
xper
ienc
ed'' i
s a d
umm
y th
at e
qual
s 1 if
an
indi
vidu
al h
ad n
ot b
ough
t or s
old
shar
es in
the
6 m
onth
s pre
cedi
ng th
e ex
perim
ent.
Rob
ust s
tand
ard
erro
rs in
par
enth
eses
. 2SL
S es
timat
es u
se a
ssig
nmen
t to
treat
men
t as
inst
rum
ent.
Dat
a in
Col
s 2,5
and
8 a
re re
wei
ghte
d to
repr
esen
t the
vot
e sh
are
of Je
wis
h pa
rties
in 2
013.
`D
emog
raph
ic c
ontro
ls' in
clud
e du
mm
ies f
or v
ote
for t
he le
ft an
d rig
ht in
201
3, se
x, a
ge, a
ge sq
uare
d, fo
ur
educ
atio
n ca
tego
ries,
mar
ital s
tatu
s, si
x re
gion
al d
umm
ies,
four
relig
iosi
ty c
ateg
orie
s, fiv
e in
com
e ca
tego
ries (
and
a du
mm
y fo
r mis
sing
), tim
e pr
efer
ence
abo
ve th
e m
edia
n, fi
nanc
ial l
itera
cy sc
ore
and
subj
ectiv
e w
illin
gnes
s to
take
risk
s. N
ote
that
we
do n
ot in
clud
e St
rata
FE
in th
ese
regr
essi
ons a
s we
stra
tifie
d on
pas
t tra
ding
exp
erie
nce,
and
thus
stra
ta fi
xed
effe
cts a
bsor
b th
e re
latio
nshi
p be
twee
n pa
st tr
adin
g ex
perie
nce
and
polit
ical
dec
isio
ns.
10

Table A7: Are Treatment Effects Driven by the Voters of a Specific Party?
Meretz Labour Hatnuah Yesh Atid Kadima Shas Yahadut HaTorah
Likud Beitenu
Habayit Hayehudi
Other Did Not Vote
(1) (2) (3) (4) (5) (6) (7) (8) (9) (10) (11)
Treatment Effect 0.051 0.057 0.046 0.059 0.041 0.052 0.055 0.059 0.052 0.043 0.052(0.019) (0.020) (0.019) (0.023) (0.019) (0.019) (0.019) (0.021) (0.020) (0.019) (0.019)
Observations 1,261 1,189 1,218 840 1,276 1,219 1,256 1,095 1,212 1,234 1,310R-squared 0.526 0.523 0.533 0.681 0.559 0.558 0.551 0.489 0.506 0.564 0.549Notes: The table presents OLS (ITT) estimates of the treatment effect on individual vote choice in the 2015 elections, ordered from Right (0), Center/Other (0.5), to Left (1). Each column drops the voters in the sample that voted for a specific party (or did not vote) in 2013, one by one. No one in our sample voted for an Arab party in 2013. All regressions include the full set of controls and Strata fixed effects from Table 3, Col 2. Robust standard errors in parentheses.
Omitting those who voted for (in 2013):
11

Table A8: Treatment Effects by Religiosity, Gender, Age & Education
(1) (2) (3) (4) (5) (6)Ordered Vote Peace Index Econ Index Ordered Vote Peace Index Econ Index
A: ReligiosityTreatment Effect 0.028 0.088 -0.038 0.053 0.095 0.005
(0.030) (0.095) (0.087) (0.022) (0.051) (0.041)
Sample Mean 0.225 -0.583 -0.050 0.554 0.231 -0.011Observations 269 259 273 1,042 1,018 1,072R-squared 0.649 0.419 0.347 0.518 0.394 0.222
B: SexTreatment Effect 0.059 0.109 0.039 0.051 0.125 -0.018
(0.029) (0.063) (0.053) (0.026) (0.065) (0.053)Sample Mean 0.494 -0.051 0.056 0.479 0.173 -0.086Observations 630 610 650 681 667 695R-squared 0.540 0.429 0.219 0.581 0.499 0.211
C: AgeTreatment Effect 0.072 0.162 0.055 0.021 0.066 -0.041
(0.029) (0.069) (0.059) (0.027) (0.064) (0.050)
Sample Mean 0.519 0.212 -0.026 0.456 -0.069 -0.012Observations 629 616 636 682 661 709R-squared 0.582 0.465 0.263 0.609 0.538 0.300
D: Educ AttainmentTreatment Effect 0.050 0.081 -0.057 0.045 0.107 0.037
(0.024) (0.060) (0.049) (0.031) (0.071) (0.056)
Sample Mean 0.520 0.158 -0.010 0.441 -0.058 0.005Observations 754 732 774 557 545 571R-squared 0.643 0.550 0.300 0.520 0.468 0.290Notes: This table shows the treatment effect, subsetting the sample by religiosity, demographics and educational attainment. The outcomes are ordered vote choice (March 2015), Peace Index (March 2015) and Economic Policy Index (July 2015). All regressions include the full set of controls and strata fixed effects from Table 3, Col. 2. Robust standard errors in parentheses.
Less than CollegeBA student and above
Religious and Ultra-Orthodox Secular and Traditional
Female Male
Age <=Median(=37.5)Age> Median (=37.5)
12

Table A9: Treatment Effects by Region
Effects by Region (1) (2) (3) (4) (5) (6)Ordered Vote Peace Index Econ Index Ordered Vote Peace Index Econ Index
Treatment Effect 0.025 0.021 0.099 0.083 0.373 -0.126(0.064) (0.202) (0.142) (0.092) (0.217) (0.186)
Sample Mean 0.547 0.177 -0.108 0.564 0.126 0.101Observations 180 173 184 125 122 128R-squared 0.657 0.572 0.483 0.812 0.658 0.568
Treatment Effect 0.099 0.150 -0.145 0.062 -0.041 0.077(0.054) (0.120) (0.093) (0.043) (0.095) (0.077)
Sample Mean 0.592 0.176 -0.023 0.488 0.152 -0.060Observations 260 256 266 383 373 393R-squared 0.681 0.633 0.432 0.570 0.544 0.319
Treatment Effect -0.003 -0.145 0.033 -0.004 0.277 -0.008(0.048) (0.177) (0.189) (0.059) (0.192) (0.154)
Sample Mean 0.322 -0.216 0.046 0.230 -0.431 -0.114Observations 121 117 126 102 101 105R-squared 0.896 0.796 0.600 0.849 0.824 0.637
Treatment Effect 0.147 -0.061 0.006(0.089) (0.188) (0.150)
Sample Mean 0.464 0.039 0.120Observations 140 135 143R-squared 0.686 0.677 0.616Notes: This table shows treatment effect, subsetting the data by region, on ordered vote choice (March 2015), Peace Index (March 2015) and Economic Policy Index (July 2015). All regressions include the full set of controls and strata fixed effects from Table 3, Col. 2. Robust standard errors in parentheses.
West BankJerusalem
Northern DistrictHaifa
CentralTel Aviv
Southern District
13

Table A10: Subjective Well-Being and Affect
Sample
Mean SD Treatment Effect SE Treatment
Effect SE
Subjective Well Being Index (OLS) 0.026 [0.727] 0.011 (0.047) -0.030 (0.060)
Specific Outcomes (Ordered Probits):
Overall, how satisfied are you with your life? [1-4] 3.057 [0.661] -0.023 (0.079) -0.061 (0.101)
On a scale from 0 to 10, how would you rate…The overall well-being of you and your family 6.492 [2.100] 0.048 (0.072) 0.026 (0.091)The happiness of your family 7.618 [1.885] -0.010 (0.072) -0.034 (0.094)Your health 7.777 [1.895] -0.021 (0.070) -0.006 (0.093)The extent to which you are a good, moral person and living according to your personal values
8.558 [1.379] 0.052 (0.071) 0.043 (0.092)
The quality of your family relationships 8.115 [1.765] 0.064 (0.070) 0.012 (0.092)
Your financial security 6.281 [2.304] 0.057 (0.071) 0.053 (0.088)Your sense of security about life and the future in general 6.564 [2.229] -0.017 (0.069) -0.106 (0.089)The extent to which you have many options and possibilities in your life and the freedom to choose among them
6.795 [2.238] -0.033 (0.071) -0.138 (0.090)
Your sense that your life is meaningful and has value 7.724 [2.053] 0.021 (0.071) -0.096 (0.090)
Observations
InexperiencedAll
Notes: The table reports the treatment effect from separate regressions with the dependent variable mentioned in the first column. All regressions include strata fixed effects and the full set of controls from Table 3, Col 2, with robust standard errors in parentheses. The outcomes include the top ten aspects that predict personal wellbeing from Benjamin et al. (2014, Table 2), excluding mental health. The first row reports the coefficient on an index constructed from the different measures following Kling et al. 2007.
1,276 818
14

Table A11: Descriptive Statistics and Balance, 2016 Follow-Up Sample
Obs.
Treatment Control Diff. P-value Diff. P-value(1) (2) (3) (4) (5) (6) (7)
0.220 0.231 -0.010 0.752 0.001 0.836 943[0.415] [0.422] (0.033) (0.006)0.136 0.135 0.001 0.957 0.004 0.401 943
[0.343] [0.342] (0.027) (0.004)0.089 0.123 -0.033 0.607 -0.014 0.794 943
[0.829] [0.814] (0.065) (0.055)0.014 [0.018 0.032 0.486 0.021 0.635 943
[0.575] [0.601] (0.046) (0.044)0.384 0.394 -0.011 0.783 -0.008 0.690 943
[0.487] [0.490] (0.038) (0.021)0.532 0.534 -0.002 0.966 0.005 0.741 943
[0.499] [0.500] (0.039) (0.014)40.641 42.096 -1.455 0.184 -1.016 0.331 943
[13.785] [14.436] (1.094) (1.045)0.216 0.245 -0.029 0.378 -0.016 0.630 943
[0.412] [0.431] (0.033) (0.032)0.135 0.115 0.019 0.466 0.014 0.603 943
[0.342] [0.320] (0.026) (0.027)0.453 0.476 -0.023 0.559 -0.022 0.555 943
[0.498] [0.501] (0.039) (0.038)0.599 0.601 -0.002 0.952 0.014 0.725 943
[0.491] [0.491] (0.039) (0.038)0.661 0.673 -0.012 0.750 -0.013 0.675 943
[0.474] [0.470] (0.037) (0.030)0.148 0.168 -0.020 0.480 -0.014 0.622 943
[0.356] [0.375] (0.028) (0.028)0.113 0.087 0.026 0.278 0.025 0.221 943
[0.317] [0.282] (0.024) (0.020)0.078 0.072 0.005 0.795 0.002 0.905 943
[0.268] [0.259] (0.021) (0.013)0.099 0.096 0.003 0.893 -0.003 0.904 943
[0.299] [0.296] (0.023) (0.021)0.095 0.082 0.014 0.553 0.022 0.277 943
[0.294] [0.275] (0.023) (0.020)0.150 0.125 0.025 0.372 0.036 0.140 943
[0.357] [0.332] (0.028) (0.024)0.294 0.322 -0.028 0.433 -0.034 0.241 943
[0.456] [0.468] (0.036) (0.029)0.196 0.221 -0.025 0.424 -0.043 0.109 943
[0.397] [0.416] (0.032) (0.027)0.094 0.120 -0.026 0.264 -0.019 0.379 943
[0.292] [0.326] (0.024) (0.021)0.072 0.034 0.038 0.045 0.040 0.025 943
[0.259] [0.181] (0.019) (0.018)11216.066 11390.244 -174.177 0.689 -229.985 0.588 927[5555.706] [5269.586] (434.784) (424.105)
4.724 4.380 0.344 0.051 0.396 0.019 943[2.263] [2.173] (0.176) (0.168)0.678 0.683 -0.005 0.889 -0.009 0.811 943
[0.468] [0.467] (0.037) (0.037)72.264 71.223 1.042 0.571 1.343 0.438 943
[23.311] [23.684] (1.837) (1.729)
Mean [SD]Without FEs With Strata FEs
Difference in Means
Monthly Family Income [NIS]+Willing to Take Risks [1-10]Time preference median or aboveFinancial literacy: % correct
Region: Jerusalem
North
Haifa
Center
Tel Aviv
South
West Bank
Age [Yrs]
Post Secondary EducationBA Student
BA Graduate and Above
Married
Religiosity: Secular
Traditional
Religious
Ultra-Orthodox
Male
Voted Right '13
Voted Left '13
Peace Deal Index
Economic Policy Index
Bought/Sold Shares in Last 6 Mths [0/1]
15

Tab
leA
12:
Lon
g-T
erm
Eff
ects
onIn
tended
Vot
ean
dSupp
ort
for
Pea
ceC
once
ssio
ns,
2016
Fol
low
-Up
Sam
ple
(1)
(2)
(3)
(4)
(5)
(6)
(7)
(8)
(9)
(10)
(11)
(12)
ITT
TOT
ITT
TOT
ITT
TOT
ITT
TOT
ITT
TOT
ITT
TOT
Trea
tmen
t0.
049
0.05
70.
029
0.03
5-0
.031
-0.0
37-0
.021
-0.0
240.
070
0.08
30.
034
0.04
0(0
.024
)(0
.026
)(0
.021
)(0
.023
)(0
.029
)(0
.032
)(0
.023
)(0
.026
)(0
.053
)(0
.058
)(0
.039
)(0
.042
)V
oted
Rig
ht '1
50.
002
0.00
20.
534
0.53
4(0
.023
)(0
.021
)(0
.045
)(0
.041
)V
oted
Lef
t '15
0.36
90.
370
-0.0
35-0
.036
(0.0
36)
(0.0
33)
(0.0
27)
(0.0
25)
Peac
e In
dex,
Mar
ch 2
015
0.65
80.
657
(0.0
31)
(0.0
28)
Stra
ta F
EY
ESY
ESY
ESY
ESY
ESY
ESY
ESY
ESY
ESY
ESY
ESY
ESD
emog
raph
ic C
ontro
lsY
ESY
ESY
ESY
ESY
ESY
ESY
ESY
ESY
ESY
ESY
ESY
ESF(
excl
uded
inst
rum
ents
)26
2225
6426
2225
6426
5726
47O
bser
vatio
ns94
394
393
993
994
394
393
993
993
993
992
292
2R
-squ
ared
0.46
40.
462
0.57
50.
575
0.46
00.
461
0.59
60.
597
0.43
90.
439
0.67
50.
675
Wou
ld V
ote
Left
2016
Wou
ld V
ote
Rig
ht 2
016
Peac
e In
dex,
201
6
Col
s 1-8
show
trea
tmen
t eff
ects
on
answ
ers t
o th
e qu
estio
n "I
f the
ele
ctio
ns w
ere
held
toda
y, w
hich
par
ty w
ould
you
vot
e fo
r" w
hen
surv
eyed
a y
ear a
fter
the
expe
rimen
t in
Mar
ch 2
016.
All
regr
essi
ons i
nclu
de th
e fu
ll se
t of c
ontro
ls fr
om T
able
3, C
ol 2
. Col
s 3-4
, 7-8
, 11-
12 e
xplo
re w
heth
er th
e lo
ng-te
rm
effe
ct e
xcee
ds th
e 20
15 e
ffec
t by
addi
ng c
ontro
ls fo
r the
pos
t-tre
atm
ent 2
015
vote
and
pea
ce d
eals
inde
x, re
spec
tivel
y. R
obus
t sta
ndar
d er
rors
in
pare
nthe
ses.
16

Table A13: Long-Term Effects on Other Outcomes, 2016 Follow-Up Sample
N Mean SDTreatment
Effect (SE)Peace Index [OLS] 937 0.038 0.815 0.067 (0.053)
Two states for two peoples [1-Disagree, 5- Agree] 937 2.713 1.099 0.058 (0.093)
1967 borders with a possibility of land exchanges [1-5] 937 2.239 1.093 0.089 (0.093)
Jerusalem will be split into two separate cities - Arab and Jewish [1-5]
937 1.998 1.059 0.016 (0.094)
Palestinian refugees will get compensation & allowed to return to Palestine only [1-5]
937 2.218 1.049 0.194 (0.090)
Social Relations Index [OLS] 934 0.054 0.955 0.096 (0.065)Arabs will live in Jewish neighborhoods [1-5] 934 2.224 1.057 0.139 (0.093)Arabs will attend Jewish high schools [1-5] 934 2.314 1.094 0.163 (0.093)
Business Index [OLS] 934 0.045 0.954 0.073 (0.065)
Arabs and Jews will form joint businesses [1-5] 934 2.885 1.003 0.089 (0.091)
Arabs will manage Jewish companies [1-5] 934 2.666 1.075 0.131 (0.093)
Arab parties will be part of the governing coalition [1-5] 934 2.208 1.067 0.159 (0.095)
Palestinians are the main culprits in the long conflict between them and the Jews [1-5]
934 2.988 0.997 -0.033 (0.090)
Israel should integrate with the West and maintain only necessary contacts with the Arab states. [1-5]
934 2.612 0.843 -0.023 (0.087)
What is the Main Issue in Israel Today? [OLS]Mainly or Solely Socioeconomic [0/1] [OLS] 936 0.288 0.453 -0.035 (0.036)Mainly or Solely Security and Political process [0/1][OLS] 936 0.147 0.355 0.054 (0.026)
Israel's economy 937 3.572 1.208 0.060 (0.089)Israel's security 937 3.295 1.353 0.089 (0.085)Your personal economic situation 937 3.114 0.829 0.003 (0.093)Your personal security 937 3.221 1.208 0.130 (0.085)
Israel's economic situation 936 3.324 0.907 -0.107 (0.083)Israel's security 936 3.412 1.065 -0.051 (0.090)Your own economic situation 936 3.120 0.609 0.042 (0.088)Your own personal security 936 3.296 0.831 -0.070 (0.096)
Consequences of not holding negotiations for the foreseeable future [1-Improve a lot, 5- Worsen substantially]
Consequences of a Two-State Agreement [1-Worsen substantially, 5- Improve a lot]
The table reports the treatment effects on all remaining questions not otherwise already reported from the April 2016 follow-up survey, 1 year post-intervention. Each row reports the treatment effect from an ordered-probit regression with the dependent variable indicated in the first column (unless otherwise mentioned). All regressions control for the full set of strata FE and controls from Table 3, Col 2. Robust standard errors in parentheses.
17

Table A14: Election Polls and Asset Price Performance
Closing Asset Price Each Day (% of Feb 12 price) (1) (2) (3) (4) (5)% Seats Predicted for the Right 0.476 0.652 0.639
(0.528) (0.407) (0.380)% Seats Predicted for the Left 0.222 0.286 0.300
(0.240) (0.246) (0.173)% Seats Right x Israeli Stock -1.593 -1.593 -1.593
(0.605) (0.607) (0.613)% Seats Right x Palestinian Stock -0.377 -0.377 -0.377
(0.532) (0.534) (0.539)% Seats Left x Israeli Stock -0.653 -0.653 -0.653
(0.472) (0.473) (0.478)% Seats Left x Palestinian Stock -0.298 -0.298 -0.298
(0.241) (0.242) (0.245)% Seats Predicted for the Likud 0.181 0.246
(0.143) (0.144)% Seats Predicted for the Zionist Union -0.162 -0.184
(0.186) (0.162)% Seats Likud x Israeli Stock -0.560 -0.560
(0.276) (0.279)% Seats Likud x Palestinian Stock -0.311 -0.311
(0.147) (0.149)% Seats Zionist Union x Israeli Stock 0.525 0.525
(0.383) (0.388)% Seats Zionist Union x Palestinian Stock -0.077 -0.077
(0.189) (0.192)Asset Ticker Fixed Effects Yes Yes Yes Yes YesQuadratic Time Trends No Yes Yes No YesWeek Fixed Effects No No Yes No YesObservations 330 330 330 330 330R-squared 0.569 0.574 0.580 0.493 0.505This is an OLS regression. The dependent variable is the daily closing price of each of the assets in our study, normalized by their value as of February 12. The main explanatory variables include the % of Seats for Left and Right based on the simple averages of all polls on each day linked in "Opinion Polling for the Israeli Legislative Election 2015" in Wikipedia and supplemented by an aggregation website maintained by Haaretz (www.haaretz.com/st/c/prod/eng/2015/elections/center). The assets include all those participating in the study: Israeli Stocks include LUMI, TA25, BEZQ. Palestinian Stocks include: PLE, PALTEL, BOP. We also include Reference Stocks from the region: AMGNRLX (the Amman Stock Exchange General Index) EGX30 (the Cairo 30 Index), XU030 (the Istanbul Index), CYFT (the Cyprus/FTSE 20). The set of days are all that included at least one poll between January 30 to March 18. All regressions include asset fixed effects. Errors are clustered at the asset level. We sequentially add Quadratic Time Trends and Fixed Effects for each week. Notice that the reference stocks are largely unaffected by the polls. However, Israeli stocks lose value with increases in predicted shares for the right. Looking at the two main parties which were the focus of the election (and for whom an increase in seat share would reduce reliance on coalition partners) in Columns 4 and 5 reveals that an increase in seat share for Likud was associated with a fall in the value of both Israeli and Palestinian stocks in our study.
18

Tab
leA
15:
Enga
gem
ent
and
Per
ceiv
edD
eter
min
ants
ofA
sset
Val
ue
amon
gC
omplier
s
Pane
l A. N
= 84
0M
ean
SD
Eng
agem
ent I
ndex
(Z-S
core
)0.
000
[0.7
39]
-0.3
33(0
.082
)0.
136
(0.0
65)
0.13
4(0
.051
)-0
.007
(0.0
56)
-0.0
36(0
.013
)D
ecile
s of T
ime
Spen
t upt
o M
ar 4
7.19
2[1
.881
]-0
.282
(0.2
34)
-0.3
47(0
.168
)0.
321
(0.1
31)
-0.0
24(0
.144
)-0
.065
(0.0
37)
Fact
s Cor
rect
on
Mar
4 [0
-4]
2.20
1[1
.280
]-1
.438
(0.1
44)
-0.0
34(0
.118
)0.
199
(0.0
83)
0.04
0(0
.092
)-0
.111
(0.0
23)
# D
ecis
ions
Reg
iste
red
[0-3
]2.
646
[0.7
52]
-0.2
71(0
.075
)0.
054
(0.0
69)
0.08
6(0
.054
)-0
.027
(0.0
58)
-0.0
37(0
.012
)#
Non
-Zer
o Tr
ades
to M
ar 4
[0-3
]1.
869
[1.2
00]
0.36
1(0
.145
)0.
821
(0.1
00)
0.11
6(0
.083
)-0
.011
(0.0
88)
0.03
1(0
.023
)#
Buy
Dec
isio
ns [0
-3]
0.94
2[1
.078
]-0
.067
(0.0
82)
1.81
7(0
.079
)0.
004
(0.0
54)
0.00
9(0
.058
)0.
010
(0.0
14)
# Se
ll D
ecis
ions
[0-3
]1.
200
[1.1
24]
0.42
8(0
.130
)-1
.024
(0.0
83)
0.08
8(0
.074
)0.
010
(0.0
79)
0.03
6(0
.020
)
Pane
l B: N
= 84
0#
Fact
s Cor
rect
on
Mar
42.
201
[1.2
80]
-1.4
38(0
.144
)-0
.034
(0.1
18)
0.19
9(0
.083
)0.
040
(0.0
92)
-0.1
11(0
.023
)Se
ctor
of S
tock
?0.
689
[0.4
63]
-0.1
75(0
.047
)-0
.278
(0.0
43)
0.08
1(0
.031
)-0
.038
(0.0
34)
-0.0
09(0
.008
)M
ovem
ent i
n Pr
ice
Last
Wee
k?0.
481
[0.5
00]
-0.3
02(0
.056
)0.
004
(0.0
49)
0.07
8(0
.035
)0.
034
(0.0
38)
-0.0
51(0
.009
)M
ovem
ent i
n Pr
ice
Last
3 Y
ears
?0.
630
[0.4
83]
-0.4
10(0
.052
)0.
039
(0.0
37)
0.04
9(0
.031
)0.
005
(0.0
35)
0.00
0(0
.008
)M
ovem
ent i
n Pr
ice
Nex
t Wee
k?0.
401
[0.4
90]
-0.5
51(0
.056
)0.
201
(0.0
47)
-0.0
08(0
.032
)0.
039
(0.0
34)
-0.0
51(0
.009
)
Pane
l C: P
erce
ived
Mos
t Im
port
ant D
eter
min
ant o
f an
Ass
et's
Val
ue M
ar 4
[N=7
46]
Com
pani
es' M
anag
emen
t0.
131
[0.3
38]
-0.1
93(0
.073
)0.
012
(0.0
42)
-0.0
25(0
.026
)-0
.027
(0.0
29)
-0.0
10(0
.010
)C
ompa
nies
' Em
ploy
ees
0.03
5[0
.184
]0.
029
(0.0
45)
-0.0
15(0
.025
)0.
006
(0.0
14)
-0.0
02(0
.014
)0.
006
(0.0
06)
Nat
iona
l Eco
n. P
olic
ies &
Con
ditio
ns0.
607
[0.4
89]
-0.4
31(0
.092
)0.
036
(0.0
55)
-0.0
14(0
.037
)0.
008
(0.0
40)
-0.0
29(0
.013
)D
omes
tic P
oliti
cal C
ondi
tions
0.06
3[0
.243
]0.
193
(0.0
46)
-0.0
07(0
.026
)0.
020
(0.0
19)
-0.0
07(0
.019
)0.
012
(0.0
06)
Peac
eful
Rel
atio
ns w
/ Nei
ghbo
rs0.
164
[0.3
70]
0.40
1(0
.062
)-0
.025
(0.0
36)
0.01
3(0
.026
)0.
028
(0.0
27)
0.02
1(0
.009
)
Not
es:
Eac
h ro
w re
pres
ents
a se
para
te O
LS re
gres
sion
of
mea
sure
s of e
ngag
emen
t on
the
subt
reat
men
ts a
s of M
arch
4, t
he la
st d
ate
at w
hich
bot
h ea
rly
and
late
div
este
rs to
ok th
e sa
me
surv
ey, w
ith c
oeff
icie
nts f
or P
ales
tinia
n St
ock,
Vou
cher
, Hig
h, L
ate
Div
estm
ent a
nd th
e %
Pric
e ch
ange
by
Mar
ch 4
. Th
e om
itted
cat
egor
y fo
r Pal
estin
ian
Stoc
k an
d V
ouch
er is
the
Isra
eli S
tock
Tre
atm
ent.
All
regr
essi
ons i
nclu
de st
rata
FE
and
cont
rols
from
Tab
le 2
, Col
2.
Pan
el B
pro
vide
s the
com
pone
nts o
f the
Fac
ts Q
uest
ions
. Pa
nel C
est
imat
es th
e ef
fect
of e
ach
subt
reat
men
t on
the
prob
abili
ty a
n in
divi
dual
will
as
crib
e th
e m
ost i
mpo
rtant
det
erm
inan
t of a
n as
set v
alue
to a
par
ticul
ar c
ause
as o
f Mar
ch 4
. Rob
ust s
tand
ard
erro
rs in
par
enth
eses
.
Pale
stin
ian
Stoc
k V
ouch
er
Tre
atm
ent
Hig
h A
lloca
tion
Lat
e D
ives
t%
Pri
ce c
hang
e
19

Table A16: Perceived Determinants of Asset Value and Political Attitudes among Com-pliers
(1) (2) (3)OLS OLS OLS
Ordered Vote Peace Index Econ. Policy IndexThe Main Determinant of My Asset's Value is:1 if Companies' Employees 0.012 -0.008 0.454
(0.067) (0.141) (0.132)1 if National Econ. Policies & Conditions 0.044 0.148 -0.002
(0.034) (0.081) (0.065)1 if Domestic Political Conditions 0.076 0.049 0.144
(0.052) (0.125) (0.099)1 if Peaceful Relations w/ Neighbors 0.038 0.279 0.041
(0.042) (0.102) (0.081)
Strata FE YES YES YESDemographic Controls YES YES YESObservations 741 732 721R-squared 0.609 0.526 0.322
An observation is a complier who answered the March 4 survey. Each column is a regression on a set of indicator variables for the main factor that an individual believed drives the value of their asset on March 4.The excluded category is that the asset's value is determined by companies' management. In Column 1, the individual's voting decision in 2015 is ranked (0) Right (0.5) Center/ Other (1) Left. All regressions include strata fixed effects and full set of controls from Table 3, Col 2. Robust standard errors in parentheses.
20

Tab
leA
17:
Soci
alan
dB
usi
nes
sA
ttit
udes
tow
ards
Isra
eli
Ara
bs
NM
ean
SDTr
eatm
ent
Effe
ctSE
(Pse
udo)
R2
Ara
b pa
rties
will
be
part
of th
e go
vern
ing
coal
ition
[O.P
robi
t]1,
279
2.08
81.
050
0.12
8(0
.078
)0.
174
Soci
al R
elat
ions
Inde
x [O
LS]
1,27
90.
005
0.98
70.
021
(0.0
55)
0.39
1A
rabs
will
live
in Je
wis
h ne
ighb
orho
ods [
O.P
robi
t]1,
279
2.17
71.
039
0.01
6(0
.075
)0.
166
Ara
bs w
ill a
ttend
Jew
ish
high
scho
ols [
O.P
robi
t]1,
279
2.24
51.
086
0.03
4(0
.077
)0.
195
Bus
ines
s Ind
ex [O
LS]
1,27
90.
009
0.98
30.
013
(0.0
56)
0.35
4A
rabs
and
Jew
s will
form
join
t bus
ines
ses [
O.P
robi
t]1,
279
2.76
71.
026
-0.0
10(0
.075
)0.
161
Ara
bs w
ill m
anag
e Je
wis
h-ow
ned
com
pani
es [O
.Pro
bit]
1,27
92.
548
1.08
10.
078
(0.0
74)
0.13
8
Not
es: T
he ta
ble
repo
rts th
e tre
atm
ent e
ffec
ts o
n a
serie
s of q
uest
ions
on
soci
al a
nd b
usin
ess a
ttitu
des t
owar
ds Is
rael
i Ara
bs. E
ach
row
re
ports
eith
er a
n O
LS re
gres
sion
on
a Z
Scor
e In
dex,
follo
win
g K
ling
et a
l 200
7, o
r an
orde
red-
prob
it re
gres
sion
on
the
com
pone
nt
depe
nden
t var
iabl
es in
dica
ted
in th
e fir
st c
olum
n. T
he so
cial
rela
tions
que
stio
ns a
re ta
ken
from
Sm
ooha
(201
3, 2
015)
. Am
ong
the
Jew
ish
popu
latio
n in
201
2, h
e fi
nds t
hat t
he p
ropo
rtion
s app
rovi
ng m
ixed
nei
ghbo
urho
ods w
ere
55%
and
on
mix
ed sc
hool
s 46%
. The
bu
sine
ss q
uest
ions
are
our
ow
n. A
ll re
gres
sion
s con
trol f
or th
e fu
ll se
t of s
trata
FE
and
cont
rols
from
Tab
le 3
, Col
umn
2. R
obus
t st
anda
rd e
rror
s in
pare
nthe
ses.
The
follo
ing
refe
r to
rela
tions
bet
wee
n Je
wis
h an
d Ar
ab c
itize
ns o
f Isr
ael [
1- d
isap
prov
e, 2
- ten
d to
dis
appr
ove,
3- t
end
to a
ppro
ve, 4
- ap
prov
e]
21

Tab
leA
18:
Addit
ional
Ques
tion
sfr
omth
ep
ost-
Ele
ctio
nSurv
ey
NM
ean
SDTr
eatm
ent E
ffect
SETo
whi
ch o
f the
follo
wing
gro
ups d
o yo
u m
ost b
elon
g [1
-mos
t, 2-
seco
nd m
ost,
3- o
ther
]Is
rael
is1,
286
1.75
30.
844
-0.0
65(0
.081
)Je
ws
1,28
61.
968
0.87
7-0
.012
(0.0
80)
Ara
bs1,
286
2.93
90.
264
-0.2
26(0
.162
)
Secu
lar
1,28
62.
558
0.71
30.
021
(0.0
92)
Trad
ition
al1,
286
2.87
00.
437
-0.3
48(0
.136
)R
elig
ious
1,28
62.
856
0.43
4-0
.313
(0.1
29)
Ultr
a O
rthod
ox1,
286
2.83
80.
472
-0.2
41(0
.152
)
Ric
h1,
286
2.94
00.
262
-0.2
41(0
.152
)M
iddl
e C
lass
1,28
62.
637
0.67
5-0
.033
(0.0
90)
Poor
1,28
62.
905
0.37
5-0
.265
(0.1
46)
Seph
ardi
1,28
62.
876
0.43
3-0
.160
(0.1
30)
Ash
kena
zi1,
286
2.86
70.
447
-0.1
83(0
.126
)N
ew Im
mig
rant
s1,
286
2.92
90.
304
-0.2
76(0
.151
)An
d ho
w pr
oud
are
you
of th
e fo
llowi
ng g
roup
s? [1
- Not
Pro
ud a
t all,
4- V
ery
Prou
d]Is
rael
is1,
282
2.97
50.
834
-0.0
25(0
.077
)Je
ws
1,28
23.
293
0.79
7-0
.072
(0.0
79)
Ara
bs1,
282
1.69
60.
706
0.11
2(0
.077
)
Secu
lar
1,28
22.
916
0.77
50.
070
(0.0
74)
Trad
ition
al1,
282
2.83
20.
719
-0.0
55(0
.076
)R
elig
ious
1,28
22.
562
0.83
40.
015
(0.0
74)
Ultr
a O
rthod
ox1,
282
1.92
50.
949
-0.0
54(0
.079
)
Ric
h1,
282
2.19
60.
807
0.03
5(0
.074
)M
iddl
e C
lass
1,28
22.
905
0.75
90.
019
(0.0
75)
Poor
1,28
22.
405
0.93
0-0
.059
(0.0
75)
Seph
ardi
1,28
22.
676
0.87
3-0
.014
(0.0
74)
Ash
kena
zi1,
282
2.77
20.
779
-0.0
26(0
.074
)N
ew Im
mig
rant
s1,
282
2.84
90.
828
-0.0
41(0
.073
)
I wou
ld ra
ther
live
in th
e st
ate
of Is
rael
than
in a
ny o
ther
cou
ntry
in th
e w
orld
.1,
281
3.29
70.
889
-0.0
60(0
.084
)W
hen
Isra
el w
ins s
ome
big
achi
evem
ents
in fi
elds
e.g
. spo
rts, s
cien
ce a
nd e
cono
mic
s, I f
eel
prou
d1,
281
3.41
10.
790
-0.0
32(0
.084
)Sh
ould
the
new
gove
rnm
ent i
ncre
ase
budg
etar
y su
ppor
t of i
sola
ted
settl
emen
ts?
[1- r
educ
e a
lot,
3- k
eep
the
sam
e, 5
- inc
reas
e a
lot]
1,27
62.
283
1.26
50.
044
(0.0
77)
The
Pale
stin
ians
are
the
mai
n cu
lprit
s in
the
long
con
flict
bet
wee
n th
em a
nd th
e Je
ws.
1,27
62.
994
0.94
1-0
.106
(0.0
76)
Isra
el sh
ould
inte
grat
e w
ith th
e W
est a
nd m
aint
ain
only
nec
essa
ry c
onta
cts w
ith A
rab
Stat
es.
1,27
62.
708
0.85
0-0
.039
(0.0
76)
To w
hat e
xten
t do
you
agre
e or
dis
agre
e wi
th th
e fo
llowi
ng se
nten
ces?
[1- d
o no
t agr
ee, 4
- agr
ee]*
Her
e ar
e so
me
mor
e qu
estio
ns a
bout
the
conf
lict b
etwe
en Is
rael
and
the
Pale
stin
ians
and
Isra
el's
posi
tions
in th
e re
gion
. To
what
ext
ent d
o yo
u ag
ree
or d
isag
ree
with
the
follo
wing
stat
emen
ts: [
1- d
o no
t agr
ee, 4
- agr
ee]*
The
tabl
e re
ports
the
treat
men
t eff
ects
on
all r
emai
ning
que
stio
ns fr
om th
e po
st-e
lect
ion
surv
ey (F
inal
Soc
ial S
urve
y, M
arch
19)
. Eac
h ro
w re
ports
the
treat
men
t eff
ect f
rom
an
orde
red-
prob
it re
gres
sion
with
the
depe
nden
t var
iabl
e in
dica
ted
in th
e fir
st c
olum
n. A
ll re
gres
sions
con
trol f
or th
e fu
ll se
t of
stra
ta F
E an
d co
ntro
ls fr
om T
able
3, C
ol 2
. Rob
ust s
tand
ard
erro
rs in
par
enth
eses
. Not
e th
at th
e be
long
ing
and
prid
e qu
estio
ns h
ave
ques
tiona
ble
resp
onse
s as t
hey
coul
d ha
ve b
een
reco
rded
inco
rrec
tly d
urin
g th
e ad
min
istr
atio
n of
the
surv
ey.
*: T
hese
two
ques
tions
take
n fr
om S
moo
ha (2
012)
.
22

Figure A1: Asset Prices in Context, 2012-2016.
2013
ele
ctio
ns
Pea
ce n
egot
iatio
ns re
star
t
Gaz
a W
ar
2015
ele
ctio
nsE
xper
imen
t
.6.8
11.
21.
4A
sset
Pric
e R
atio
(Ini
tial =
1)
Jan, 2012 Jan, 2013 Jan, 2014 Jan, 2015 Jan, 2016
TA25 PLEBEZQ PALTELLUMI BOP
Each week, participants were asked to gauge the performance of their asset in the prior three years
(2012-2015). During that time, Israeli and Palestinian asset prices had risen after the onset of peace
negotiations, and fallen after their collapse.
23

Figure A2: CONSORT Diagram
Invited and consented to participate (n=1681)
Excluded (n= 336) ♦ Not meeting inclusion criteria (n=73:
discrepancies*) ♦ Other reasons (n= 263: did not complete
both initial financial & social surveys)
Analysed (n= 1009 (Main Outcome)) ♦ Excluded from analysis (n=0)
Lost to follow-up (did not provide vote choice) (n= 27)
Allocated to intervention (n= 1036) ♦ Received allocated intervention (n=840 ) ♦ Did not receive allocated intervention (server
overload, lack of interest) (n=196)
Lost to follow-up (did not provide vote choice) (n=7)
Allocated to control (n=309) ♦ Received allocated intervention (n= 309 ) ♦ Did not receive allocated intervention (give
reasons) (n= 0 )
Analysed (n=302 (Main Outcome)) ♦ Excluded from analysis (n=0)
Allocation
Analysis
Follow-Up
Randomized (n= 1345)
Enrollment
*=The main reason for screening out was extremely quick completion of the survey, which could raise a concern regarding the reliability of the responses. Specifically, the initial financial survey included 33 questions and we screened out 53 subjects who completed the entire survey in less than 180 seconds (the median completion time was 461 and the mean was 600 seconds). The remaining 20 individuals were screened out due to incomplete or inconsistent answers. In particular, we screened out 14 respondents whose answer to our question about voting in the 2013 elections was different enough from the answer in the survey company's database to move them from right to left blocks or vice versa.
24

Figure A3: Initial Allocation Screen: Example.
•Here is a list of all the assets participating…• Both company stocks and index funds (explained).
• Note the asset you won and the # of shares you own. • If the price of your asset increases, the value of your assets will increase accordingly. If the price goes down…
total value
in NIS
total value
in JOD
# shares
current price in
JOD
25

Figure A4: Weekly Trading Screen: Example.
Link to website with info on
assigned stock
Composition, price and
updated value of portfolio
Buying decision (if
current portfolio includes cash)
Selling decision (if current portfolio
includes stocks)
_________________________________
26

Figure A5: Balancing Tests Simulations
0.0
5.1
.15
.2.2
5Fr
actio
n
0 2 4 6 8 10Number of significant differences at 10%
The figure reports the results from 500 simulations. In each, we randomly assign the sample of 1311
individuals in Tables 2 and 3 to fictitious treatment and control groups, with the same proportions as
those of the actual groups. We then perform the tests reported in columns 3-4 in Table 2 and count
the number of significant differences. The figure shows the distribution of the number of differences
significant at the 10% level.
27
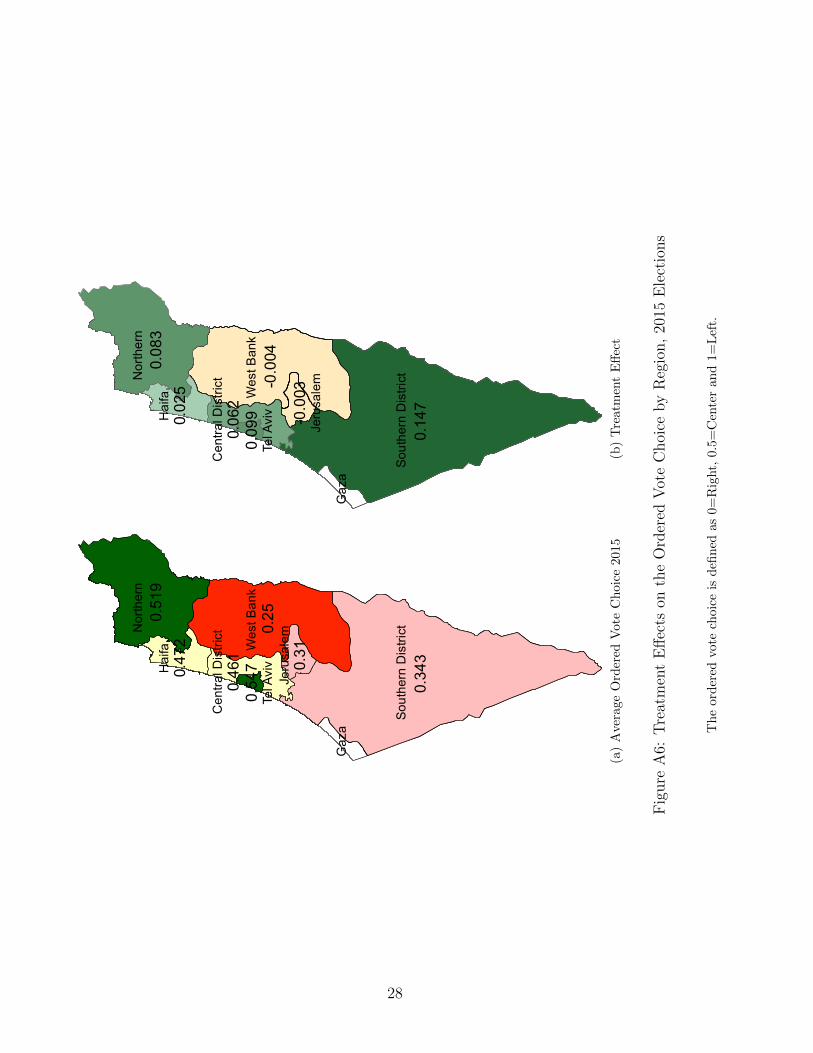
0.343
0.250.5
19
0.4610.4
72 0.31
0.547
South
ern D
istric
t
West
Bank
North
ernHa
ifa
Centr
al Dis
trict
Gaza
Jerus
alem
Tel A
viv
(a)
Aver
age
Ord
ered
Vote
Ch
oic
e2015
0.147
-0.00
4
0.083
0.0620.0
25
-0.00
3
0.099
South
ern D
istric
t
West
Bank
North
ernHa
ifa
Centr
al Dis
trict
Gaza
Jerus
alem
Tel A
viv
(b)
Tre
atm
ent
Eff
ect
Fig
ure
A6:
Tre
atm
ent
Eff
ects
onth
eO
rder
edV
ote
Choi
ceby
Reg
ion,
2015
Ele
ctio
ns
Th
eor
der
edvo
tech
oic
eis
defi
ned
as
0=
Rig
ht,
0.5
=C
ente
ran
d1=
Lef
t.
28

Figure A7: Is a Peace Settlement Zero Sum? Long-Term Differences in 2016
Not only Palestinians
Palestinians only
020
4060
80P
erce
nt
Treatment Control
Who Benefits from a Two State Solution?
In the 2016 follow-up survey we asked who would benefit from a permanent settlement based around a
two state solution. As the Figure reveals, 29.27% of the control believed that a settlement would benefit
only the Palestinians– this falls to 26.27% in the treatment group.
29

Figure A8: Trading Activity Outside the Experiment
.02
.04
.06
.08
Sh
are
of
Pa
rtic
ipa
nts
1 2 3 4 5 6Week of Experiment
Bought Sold
Inexperienced-- Any Stocks
.01
.01
5.0
2.0
25
.03
Sh
are
of
Pa
rtic
ipa
nts
1 2 3 4 5 6Week of Experiment
Bought Sold
Inexperienced-- Foreign Stocks
.18
.2.2
2.2
4.2
6.2
8S
ha
re o
f P
art
icip
an
ts
1 2 3 4 5 6Week of Experiment
Bought Sold
Experienced-- Any Stocks
.09
.1.1
1.1
2.1
3S
ha
re o
f P
art
icip
an
ts
1 2 3 4 5 6Week of Experiment
Bought Sold
Experienced-- Foreign Stocks
The figure shows, for each weekly survey, the share of compliers who say they have either bought or sold
domestic or foreign stocks in the preceding week, apart from any trading done as part of the study. The
top two graphs show inexperienced participants, namely those who have not traded in financial assets
in the six month preceding the experiment. The Bottom two graphs show experienced participants.
30

Figure A9: How Much of the Treatment Effect is Explained by Different Mechanisms?
Base ITT: SocialSurvey Sample [Mar
2015], N=1277
Peace Index
Arab Social Index
Arab Business Index
SubjectiveWell-Being Index
Two State Soln=>Isr.Security
Two State Soln=>Isr.Economy
Two StateSoln=>Pers. Safety
Two StateSoln=>Pers. Income
Main Issue inElection is
Socioeconomic
Main Issue inElection is Security
0 .02 .04 .06 .08 .1
Base ITT: FinancialFollow-up Sample
[Jul 2015], N=1115
Economic PolicyIndex
Pers. Inc.-Stock MktCorr. Percep.
Pers. Inc.-IsraeliEcon. Corr. Percep.
Reads Financial News
Reads Non-FinancialNews
Reads Haaretz
Reads Israel Hayom
Financial LiteracyScore
0 .02 .04 .06 .08 .1
Base ITT: InfoSurvey Sample [Apr
2015], N=1238
Political Platformsand Facts Score
Economic Facts Score
.02 .04 .06 .08 .1
Base TE: Compliersvs Control [Mar2015], N=1132
Engagement Index
Traded Outside Exp.Before Election
Drivers of StockValue Mar 12.
-.05 0 .05 .1 .15
These figures show how the estimated treatment effect on the ordered vote choice moves when control-
ling for different potential channels. Each figure represents a different wave of the survey, and hence
a somewhat different sample. The top coefficient in each shows the (ITT) treatment effect (and 95%
confidence interval), without controlling for other outcomes. The subsequent coefficients are after con-
trolling for the indicated variable. All regressions control for the full set of controls and strata FE from
Table 3, Col 2.
31
Related Documents