Available online at www.centmapress.org Int. J. Food System Dynamics 1 (2010) 82‐93 82 Valuing Consumer Preferences with the CUB Model: A CaseStudy of Fair Trade Coffee Gianni Cicia 1 , Marcella Corduas 2 , Teresa Del Giudice 3 , Domenico Piccolo 4 Università degli Studi di Napoli Federico II, Italy 1 [email protected], 2 [email protected], 3 [email protected], 4 [email protected] Received 31 st March 2009, accepted 16 th December 2009, available online 31 st January 2010 ABSTRACT D'Elia and Piccolo (2005) have recently proposed a mixture distribution, named CUB, for ordinal data. The use of such a mixture distribution for modelling ratings is justified by the following consideration: the judgment that a subject expresses is the result of two components, uncertainty and selectiveness. The possibility of relating the parameters of CUB models to covariates makes the formulation interesting for practical applications In this case study, a sample of 224 fair‐trade coffee consumers were interviewed at stores. With this data‐set, CUB model split consumers, according to their preferences, in two different segments: one showing high price elasticity, and one with a low price elasticity. As regards the potential of the CUB model, it showed a considerable integration capacity with stochastic utility models, namely latent class models. Indeed, by using the segmentation factors emerging from the CUB as covariates of segmentation in a latent class model and setting the number of classes equal to those emerging from the CUB, it was possible to estimate a model which not only validated the findings of the CUB but also allowed estimation of the WTP for the fair trade characteristic in the different groups. Keywords: CUB model, fair trade cofee, latent class choice model 1 Introduction In recent years, in the field of consumer behaviour, a large number of new models and instruments for preference analysis have been proposed. This strand of the literature has developed along two different lines. The first has produced approaches that have a more solid economic basis, but which at the same time require increasingly complex econometric analysis. Moreover, in this research field, based on stochastic utility theory and choice experiments, less weight is given to the socio‐economic and psychometric characteristics of the individual in determining preferences. By contrast, the second strand has given rise to many methods for analysing consumer behaviour based on quality approaches such as laddering or focus groups where behavioural characteristics and lifestyles have regained primary importance in explaining the choices and “tastes” of individuals. At the same time, product differentiation, especially in the agri‐food sector, has developed in novel ways. Indeed, while differentiation traditionally concerned mainly intrinsic product attributes, over time attention has shifted to the extrinsic characteristics and credence attributes of the product (Grunert, 2007). These attributes, including various forms of certification of production processes (organic farming, fair trade, respect for biodiversity, specific production area) are similar, according to economic theory, to confidence attributes (Nelson, 1970). How such characteristics may affect consumer preferences thus appears increasingly correlated not only to the “tastes” of individuals but also to their sensitivity, lifestyles and culture.

Welcome message from author
This document is posted to help you gain knowledge. Please leave a comment to let me know what you think about it! Share it to your friends and learn new things together.
Transcript
Available online at www.centmapress.org Int. J. Food System Dynamics 1 (2010) 82‐93
82
Valuing Consumer Preferences with the CUB Model:
A CaseStudy of Fair Trade Coffee
Gianni Cicia1, Marcella Corduas2, Teresa Del Giudice3, Domenico Piccolo4
Università degli Studi di Napoli Federico II, Italy [email protected], [email protected], [email protected], [email protected]
Received 31st March 2009, accepted 16th December 2009, available online 31st January 2010
ABSTRACT
D'Elia and Piccolo (2005) have recently proposed a mixture distribution, named CUB, for ordinal data. The use of such a mixture distribution for modelling ratings is justified by the following consideration: the judgment that a subject expresses is the result of two components, uncertainty and selectiveness. The possibility of relating the parameters of CUB models to covariates makes the formulation interesting for practical applications In this case study, a sample of 224 fair‐trade coffee consumers were interviewed at stores. With this data‐set, CUB model split consumers, according to their preferences, in two different segments: one showing high price elasticity, and one with a low price elasticity. As regards the potential of the CUB model, it showed a considerable integration capacity with stochastic utility models, namely latent class models. Indeed, by using the segmentation factors emerging from the CUB as covariates of segmentation in a latent class model and setting the number of classes equal to those emerging from the CUB, it was possible to estimate a model which not only validated the findings of the CUB but also allowed estimation of the WTP for the fair trade characteristic in the different groups.
Keywords: CUB model, fair trade cofee, latent class choice model
1 Introduction
In recent years, in the field of consumer behaviour, a large number of new models and instruments for preference analysis have been proposed. This strand of the literature has developed along two different lines. The first has produced approaches that have a more solid economic basis, but which at the same time require increasingly complex econometric analysis. Moreover, in this research field, based on stochastic utility theory and choice experiments, less weight is given to the socio‐economic and psychometric characteristics of the individual in determining preferences. By contrast, the second strand has given rise to many methods for analysing consumer behaviour based on quality approaches such as laddering or focus groups where behavioural characteristics and lifestyles have regained primary importance in explaining the choices and “tastes” of individuals.
At the same time, product differentiation, especially in the agri‐food sector, has developed in novel ways. Indeed, while differentiation traditionally concerned mainly intrinsic product attributes, over time attention has shifted to the extrinsic characteristics and credence attributes of the product (Grunert, 2007). These attributes, including various forms of certification of production processes (organic farming, fair trade, respect for biodiversity, specific production area) are similar, according to economic theory, to confidence attributes (Nelson, 1970). How such characteristics may affect consumer preferences thus appears increasingly correlated not only to the “tastes” of individuals but also to their sensitivity, lifestyles and culture.
Gianni Cicia et al. / Int. J. Food System Dynamics 1 (2010) 82‐93
83
Consumer perception and choices concerning products such as wine, fair trade goods and typical products where much of the product’s identity consists in intangible attributes are poorly suited to analysis with approaches that oversimplify the complexity of the individual. With a view to testing new approaches to provide an alternative or to supplement the above methods of analysis, this paper has a twofold objective. The first is to test a new model which, a priori, seems to supply both the rigour of econometric applications and the flexibility of quality techniques. The CUB model which we present herein allows the ranking expressed by an individual on a certain good/service (hence his/her preferences) to be linked to complex information relative to various psychographic characteristics. In particular, as illustrated in section 2, the covariates of the CUB model may be the evaluations given by the individual to various groups of items using classic Likert scales. The second is the attempt to use the proposed new model as a support for interpreting the results of latent class choice models, a recent trend in multinomial logit.
In the present study, to investigate the potential of the integrated approach described (the CUB model with latent models) to explain consumer choices and then segment the reference market, a survey of fair trade coffee consumption was carried out in an area of Lombardy (Brianza). The choice fell on this product for three reasons. The first consists in the fact that fair trade certification is a valid example of product differentiation based on intangible characteristics. The second reason concerns the fact that fair trade coffee is a well‐known product, also sold by the large distribution. In particular, in the context of fair trade, coffee plays a key role both because it was one of the first third‐world products to be traded according to nonprofit‐based rules and because it was the first product to be certified as such. Currently, coffee is chiefly imported from Central America (Nicaragua, Mexico etc.) and to a lesser extent from Africa (especially Tanzania). However, bean roasting and other forms of intermediate processing (decaffeinated coffee) occur in consumer countries according to the preferences of the latter. In 1973, the Dutch Fair Trade Organisation imported the first “fair trade” coffee from cooperatives of small‐holders in Guatemala. Today, over 30 years on, this product has become an economic reality, representing 25‐50% of sales of fair trade organisations.
The last reason for choosing coffee for the work in hand is the fact that, despite the importance of fair trade, there have been few studies concerning demand for such products and coffee in particular. The somewhat scant literature (Bird, Hughes, 1997; Browne et al., 2000; Arnot et al., 2006; Besnard et al., 2006, Maietta, 2004; Maietta, 2005) has focused on the existence of a segmented demand for fair trade products, with particular attention to demand elasticity to price. The most recent of these studies (Arnot et al., 2006) showed, using a real‐choice model, that for Canadian fair trade consumers, price elasticity of demand for fair trade coffee is considerably lower than that for a conventional product. Reference will be made below to these results so as to compare the quantity and quality of information obtained thanks to the alternative approach proposed herein.
The paper is structured as follows: after a brief introduction to the statistical model in question and its interpretation for our purposes, Section 3 describes the experiment conducted, Section 4 discusses the main results both in terms of comparisons among customers and in relation to the construction of latent covariates and Section 5 presents an integrated model among the CUB and Latent Class Choice Model. We conclude with some final reflections.
2 The mixture distribution
Evaluation that a subject gives on a certain item (for instance, products or services) is the result of a complex cognitive process. As other human decisions, evaluation is affected by individual’s trait (such as the subject’s mental image of the item under assessment) and in addition by the intrinsic uncertainty which characterizes any human choice. For this reason, judgements can be considered as the realizations of a stochastic mechanism.
Specifically, D'Elia and Piccolo (2005) discussed a simplified representation of the evaluation process where the subject’s selection of a certain score for the product/service under judgement is related to two latent components. The first one describes the intimate belief of respondents concerning the object in question or, in other words, the degree of liking/disliking expressed by raters with respect to the item (Piccolo, 2006). This is modelled by a shifted Binomial random variable. The second component typifies the uncertainty that a judge conveys when his/her opinion has to be summarized by means of a discrete grading scale. This is modelled by a discrete Uniform random variable. The two components are linearly combined in a mixture distribution1.
1The reader can refer to Everitt and Hand (1981) for an extensive discussion of mixture distributions.
Gianni Cicia et al. / Int. J. Food System Dynamics 1 (2010) 82‐93
84
Then, according to this approach, judgments or evaluations can be modelled by means of a discrete random variable (r.v.), R, with the following probability distribution:
;1)1()1(11
)Pr( 1
mrm
rR rmr πξξπ −+−⎟⎟⎠
⎞⎜⎜⎝
⎛−−
== −−
,,...,2,1 mr = (1)
where ξ ∈ [0, 1], π ∈ (0, 1], and m is the highest score that can be attributed to the item under evaluation and corresponds to the best positive judgement. For 3>m , R is a mixture of a shifted Binomial distribution with parameter ξ and a Uniform distribution with parameter m . The weights, π
and )1( π− , establish the role of these two distributions on )( rRP = .
In the literature other models for ordinal data have been proposed and are very widely applied. They are based on latent variables and rely on estimating cut‐points which transform a continuous unobservable variable into a discrete variable. Although the definition of CUB models relies on latent variables which are conceptually necessary to specify the nature of the mixture distribution, the inferential procedures do not depend upon the knowledge (or estimation) of cut‐points. As a consequence, given the model, this simplification turns into a more parsimonious parametric structure.
The proposed probabilistic model is very flexible and is capable of describing distributions with very different shapes. Piccolo (2003) derived the coefficients of asymmetry and kurtosis of the random variable R as function of the π and ξ parameters. Specifically, it can be shown that 0),( =ξπAsim , for 5.0=ξ
and, moreover, )1 ,() ,( ξπξπ −−= AsimAsim for any given ]1,0(∈π . When ξ<0.5, the distribution of R is skewed negatively and the probability that raters express positive opinions about the given item increases as ξ moves towards 0. The opposite consideration applies when ξ>0.5: the distribution of R is skewed positively and the probability that raters express negative opinions increases as ξ moves towards 1. Also, for a given ]1,0(∈π , the kurtosis increases as ξ approaches the borders of the parameter space
and, again, )1,(Kurt),(Kurt ξπξπ −= .
Piccolo (2006) and Piccolo and D’Elia (2008) extended the model (1) in order to relate the parameters ) ,( ξπ to explanatory variables (covariates) describing raters’ features which justify the different
behaviours of respondents2. In particular, denoting with r the rate given by the i‐th subject, the CUB(p,q) model is defined as:
;m1)1()1(
1r1m
),|Pr( irm
i1r
ii πξξπ −+−⎟⎟⎠
⎞⎜⎜⎝
⎛−−
== −−ii wy rR
where the parameters are linked to the i‐th subject’s covariates by means of a logistic function (which ensures that the r.v. is well defined for any real value of covariates):
,)exp(1
1βi
i y−+=π ;
)exp(11
γii w−+=ξ (2)
where ),...,,,1( 21 ′= ipii yyyiy and ),...,,,1( 21 ′= iqii wwwiw are the observed covariates for the i‐th
subject and ),...,,( 10 ′= pββββ and ),...,,( 10 ′= qγγγγ are parameter vectors.
The formulation (2) is general and includes all special cases where the dependency on covariates may be absent, restricted to one of the two parameters or related to both parameters. In order to distinguish these situations the following acronyms are used respectively: CUB(p,0), CUB(0,q), CUB(p,q); the model (1) is simply denoted as a CUB(0,0) model.
Given the observed sample consisting of ratings and covariates, ), ,( ′ii wyir , ni ,...,2,1= , estimation of
),( ′′′= γβθ for a CUB(p,q) model is performed by maximum likelihood using EM algorithms. The log‐
likelihood function is:
2This extended formulation is denoted by means of the acronym C(ovariates)U(niform)B(inomial).
Gianni Cicia et al. / Int. J. Food System Dynamics 1 (2010) 82‐93
85
∑=
−⎥⎥⎦
⎤
⎢⎢⎣
⎡+
⎭⎬⎫
⎩⎨⎧
−−+
−−⎟⎟⎠
⎞⎜⎜⎝
⎛−−
−+=
n
1i1m
i
ii
ii m1
m1
))exp(1())r1(exp(
1r1m
)exp(1
1 ln )(lγw
γwβy
θ . (3)
The estimator’s asymptotic properties and all inferential procedures for estimation were derived from Piccolo (2006).
In order to facilitate the interpretation of the results in the following section, we illustrate the CUB(0,1) model in the presence of discrete or continuous explanatory variables.
a) Let W be a discrete k‐valued explanatory variable. Replacing the parameter estimates, ( γ̂ ,π̂ ), in (2) we obtain k probability distributions, one for each value that W can assume. For instance, if W is a dichotomous variable, representing the subject’s gender, two probability distributions will be derived, one for females and the other for males.
b) Let W be a continuous variable. In this case, it is possible to determine the expected value of the rating R conditional upon the explanatory variable W, that is ) | ( wWRE = . In the next section, the conditional expectation of the importance that consumers give to price in their fair trade coffee purchase will be plotted as a function of the lifestyle attributes as summarized by the Multidimensional Scaling first component.
The CUB model refers to a single marginal random variable, in other words in complex surveys where several items are investigated the mixture distribution will be applied to model each item separately. Several applications in various fields have proved that the CUB model can successfully be used to fit empirical rating distributions (see Iannario, 2007; Iannario, Piccolo, 2008; 2009).
The classical approach based on Generalized Linear Models (McCullagh, 1980; McCullagh, Nelder, 1989; Agresti, 2002) directly relates the probability that a certain grade of a discrete scale is chosen by the subject (point of a Likert scale, rating, score, etc.) and the subject’s covariates. Moreover, this class of model relies on r.v. belonging to the exponential family. The proposed CUB model, instead, allows a straight relationship between the parameters characterizing the mixture distribution and the subject’s covariates. The reference to mean values is not needed. In addition, the model yields an immediate interpretation of the latent traits (selectivity and uncertainty) which drive the final judgments of raters.
3 The questionnaire and sample
The questionnaire used for the survey was structured into five sections. The first served as an introduction, and to define interviewee recruitability for the purposes of the survey. Those who stated they were not in charge of making purchases in their own family and those who did not consume coffee were excluded from the survey.
The second section investigated the structure of individual demand for coffee, the frequency of purchase, preferred products, consumption frequency, consumption mode, and – what was particularly important for the survey – how many packets of coffee, of the last 10 purchased, were of fair trade origin. The section concluded with an assessment, using a 1‐7 Likert scale (where 1 indicated completely unimportant and 7 extremely important), of 16 coffee attributes: a) taste; b) aroma; c) creaminess; d) blend; e) producer country; f) variety used; g) percentage of caffeine; h) certification (organic, fair trade, geographical origin); i) price; j) brand; k) packaging (paper, aluminium, plastic, etc.); l) biodegradable\recyclable packaging; m) use of organic production techniques; n) use of female labour in the production chain; o) use of properly paid labour; p) transport mode that minimizes CO2 emissions.
Section 3 aimed to survey the interviewee’s lifestyle by assigning a score from 1 to 7 (where 1 stands for fully disagree and 7 wholly agree) to 11 statements that all begin with “I think I’m a person ………” followed by: a) who is health‐conscious; b) with an active lifestyle; c) family‐oriented; d) who believes in traditions; e) environmentally responsible; f) very attentive to the quality of the food I buy; g) very attentive to the country of origin of the food I buy; h) sensitive to social inequalities; i) personally committed to action that can improve the quality of the environment; l) who adopts action that can lead to a more equitable world.
In section 4 consumers were given four hypothetical choice sets which each included three types of coffee: 1. conventional coffee; 2. fair trade coffee; 3. fair trade and organic coffee. These types differed in their price ranking. The pre‐selected levels ranged from €2.25/250gr to €3.75/250gr. In constructing the choice sets, two conditions were set a priori so as to improve the authenticity of the choice context and the competitive ranking of the various coffee categories. The conventional type, characterised in the
Gianni Cicia et al. / Int. J. Food System Dynamics 1 (2010) 82‐93
86
questionnaire as the “Lavazza” type3 always had the same price as the lowest level (€2.25/250gr). The fair trade product and the fair trade organic product were assigned the following prices: €2.5, 2.75, 3.00, 3.25, 3.5 and 3.75/250gr. To approximate reality, in constructing the experimental design the restriction was set that fair trade coffee assumed a greater price value than the conventional product, and lower than, or equal to, that of the organic fair trade product.
The design was thus “labelled” and not generic (Louviere et al., 2000), since each alternative was associated either with a specific coffee production mode or with non‐purchase. A design which allowed assessment of a hypothetical scenario in which this condition was not respected would not be consistent either with the real competitive situation of products or with the scenario of the proposed purchase, and would thus have led to bias in the absence of realism. Note that this restriction does not compromise the identifiability of the major parameters of the utility function in the estimation phase. Indeed, the relative information matrix of the multinomial logit model is positive definite and invertible, so as to ensure identification of a global maximum and the calculation of the standard errors of all parameters. Also note that in the context of experimental designs, aiming to estimate parameters of highly non‐linear models like logit discrete‐choice models, the property of orthogonality does not induce efficiency (minimum variance) when the parameters (as almost always happens) are other than zero. This is discussed extensively in recent contributions to the subject (Ferrini and Scarpa, 2007; Bliemer et al., 2007).
Section 5 is devoted to collecting a set of useful socio‐demographic data concerning the interviewee’s family. The questionnaire was administered during the spring of 2008 to a sample of 250 consumers, distributed at four fair trade shops (Botteghe del Mondo) in Brianza, a geographical area which comprises comuni in the provinces of Milan and Como. Of the 250 questionnaires collected, 28 were discarded since they were incomplete. The statistical survey is based on data collected on a sample of 222 consumers.
From an initial analysis of the socio‐demographic data, it emerges that the sample consists mostly of women (65%), with a generally high education level, well above the regional average: only 11% had been through merely compulsory schooling, 53% had attained a high‐school diploma, 26% had a university degree and as many as 10% had a post‐graduate qualification.
The sample mode falls within the 31 ‐ 45 age class. About half have a family with one or more children. The main occupations are those of office workers and the self‐employed or owners of businesses, followed at a certain distance by factory workers and teachers. Distribution of family net monthly income has a modal peak between 1,000 and 2,000 Euro: just under half of the sample declared this income, decidedly low in light of the average qualification of the same sample and the regional average. All the interviewees purchase fair trade coffee, even if 56% stated they bought it rarely.
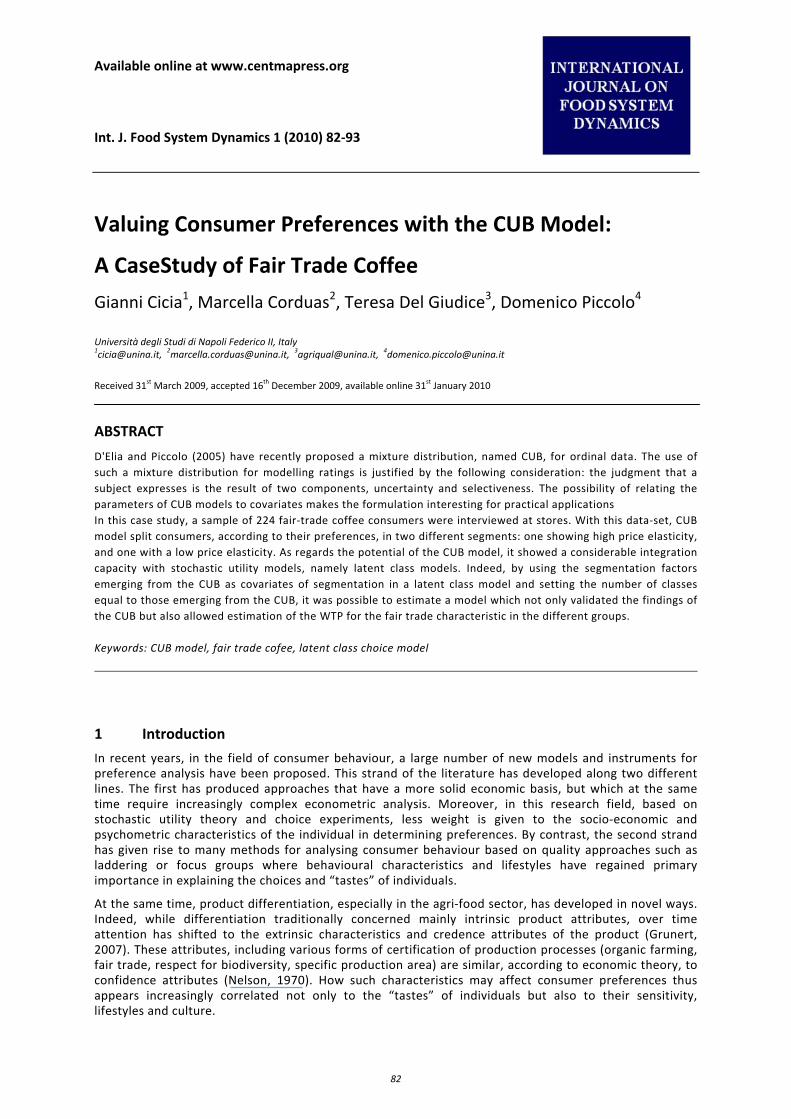
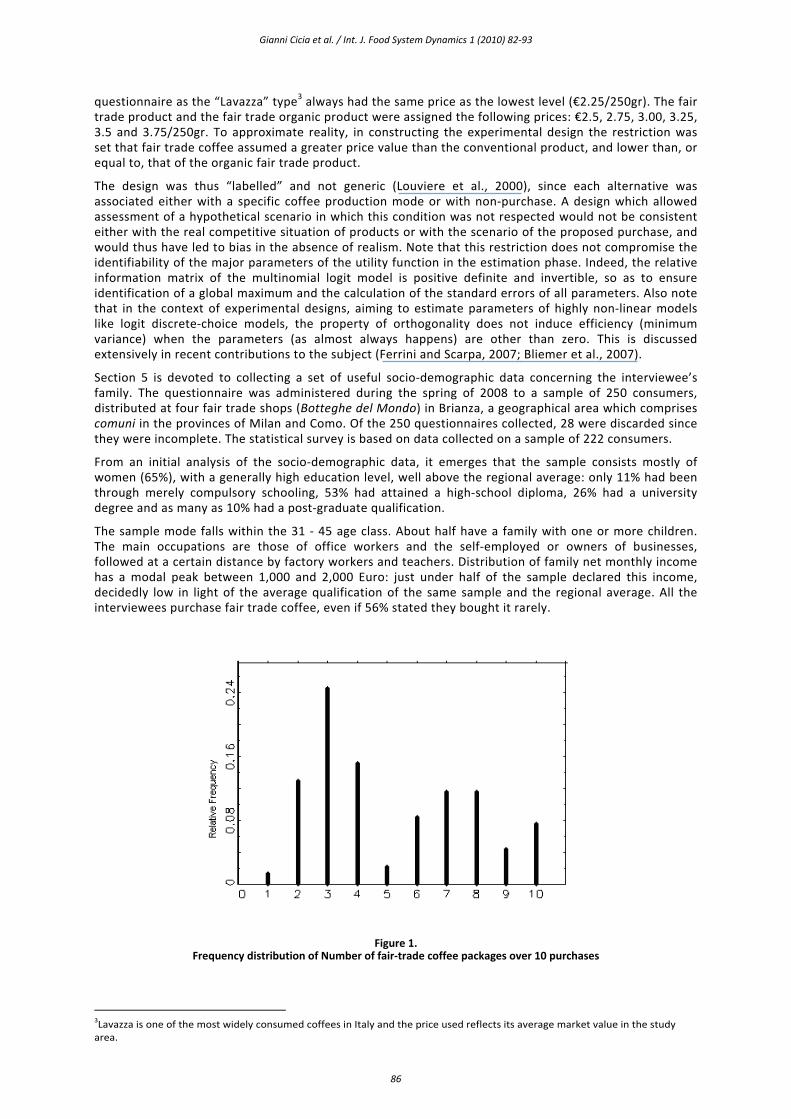
Figure 1. Frequency distribution of Number of fair‐trade coffee packages over 10 purchases
3Lavazza is one of the most widely consumed coffees in Italy and the price used reflects its average market value in the study area.
Gianni Cicia et al. / Int. J. Food System Dynamics 1 (2010) 82‐93
87
4 The results
The frequency distribution of the number of fair‐trade coffee packages over 10 purchases (see Figure 1) shows that the respondents are clustered into two groups: the first group consists of frequent buyers (more than 4 packages), the second group of infrequent buyers.
The next analysis focuses on the study of the “importance that respondents attach to price” in determining the purchase of fair‐trade coffee. A CUB(0,0) model was fitted to the observed judgments (in parenthesis the standard errors are reported, and 00l gives the value of maximized log‐likelihood):
=π̂ 0.630 (0.083); =ξ̂ 0.359(0.026); 00l = )ˆ(l θ = −408.613.
This model can be substantially improved by introducing a dichotomous variable representing the two purchase behaviours in order to explain the ξ parameter. For this purpose, a CUB(0,1) model was specified:
m1)1()1(
1r1m
)|rRPr( rmi
1ri πξξπ −+−⎟⎟
⎠
⎞⎜⎜⎝
⎛−−
== −−iw , where ;)]exp(1[ 1−−−+= 10 γγξ ii w (4)
and the observed covariate for the i‐th subject is defined by:
otherwise;; 4C se
w ii
≤
⎩⎨⎧
=,0,1
, (5)
Ci being the number of fair‐trade coffee packages over 10 purchases of the i‐th subject.
Estimation yields the following results:
π̂ =0.908 (0.046); 0γ̂ =0.302 (0.096); 1̂γ = −1.385 (0.143); 00l = )ˆ(θl =−360.569.
The goodness of fit is confirmed by the likelihood ratio test statistic which, in the case under investigation,
is asymptotically distributed as a 2)1(χ r. v.; specifically, 088.94)ll(2 oo01 =− is highly significant.
From (4), the estimate of parameter iξ conditional upon the value of the covariate W can be derived:
0.252)1w|ˆ( i ==ξ and 575 0.)0w|ˆ( i ==ξ . Note that, as stated above, parameter ξ is related to
the asymmetry of the mixture distribution; when ξ is close to zero, the distribution is negatively skewed, and then high ratings are characterized by larger probabilities. As regards the expected value of the importance that consumers attribute to price changes according to the groups they belong to, we have:
E(R| w=1)=5.35; E(R| w=0)=3.59.
The corresponding sample means are 5.36 and 3.64, respectively. They are therefore well fitted by the average of the estimated CUB distributions.
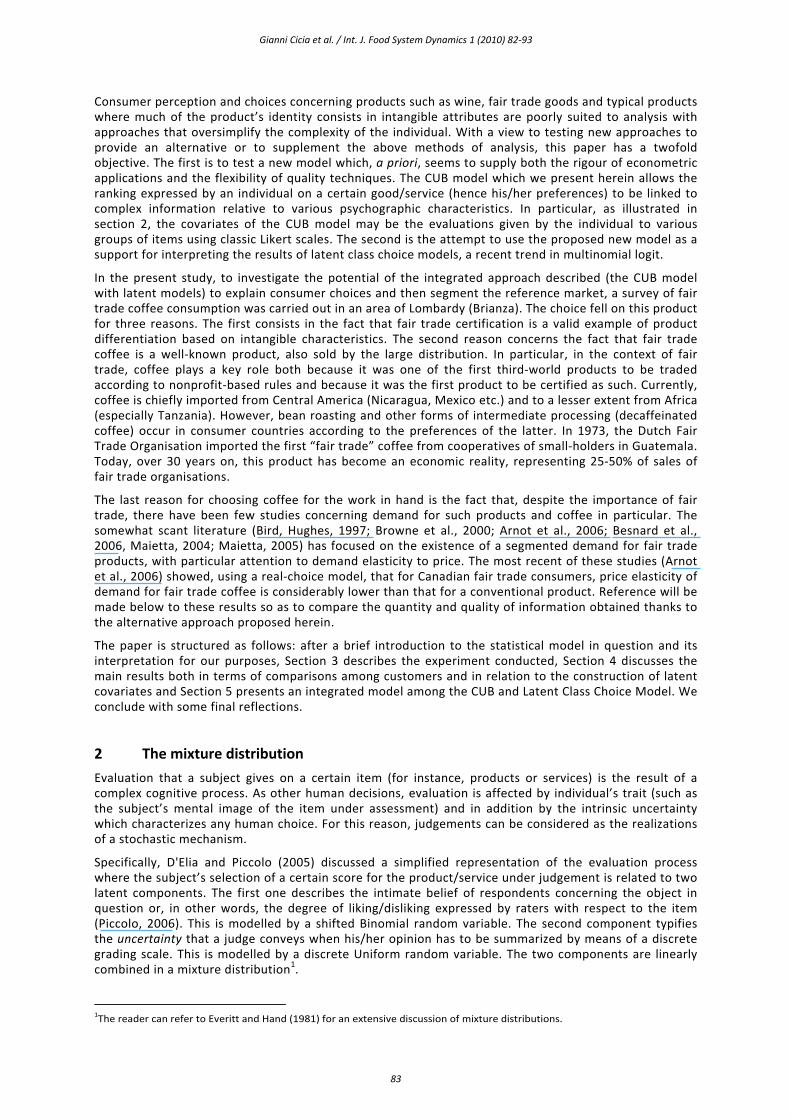
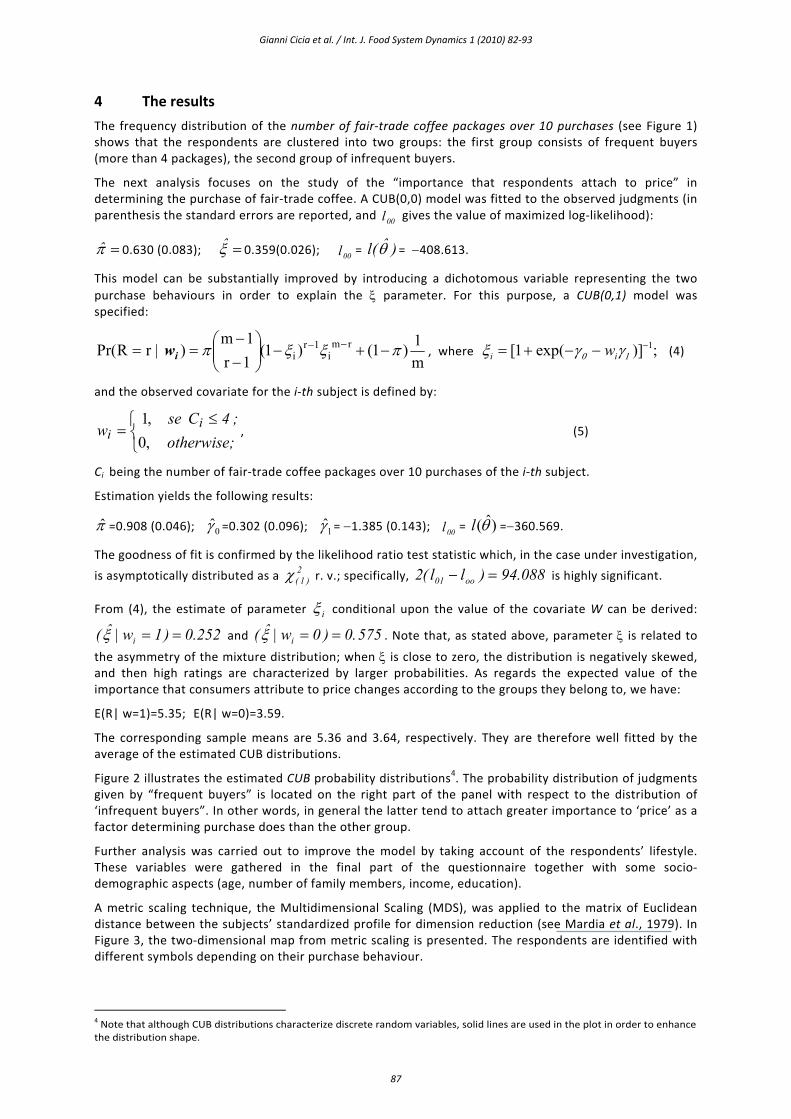
Figure 2 illustrates the estimated CUB probability distributions4. The probability distribution of judgments given by “frequent buyers” is located on the right part of the panel with respect to the distribution of ‘infrequent buyers”. In other words, in general the latter tend to attach greater importance to ‘price’ as a factor determining purchase does than the other group.
Further analysis was carried out to improve the model by taking account of the respondents’ lifestyle. These variables were gathered in the final part of the questionnaire together with some socio‐demographic aspects (age, number of family members, income, education).
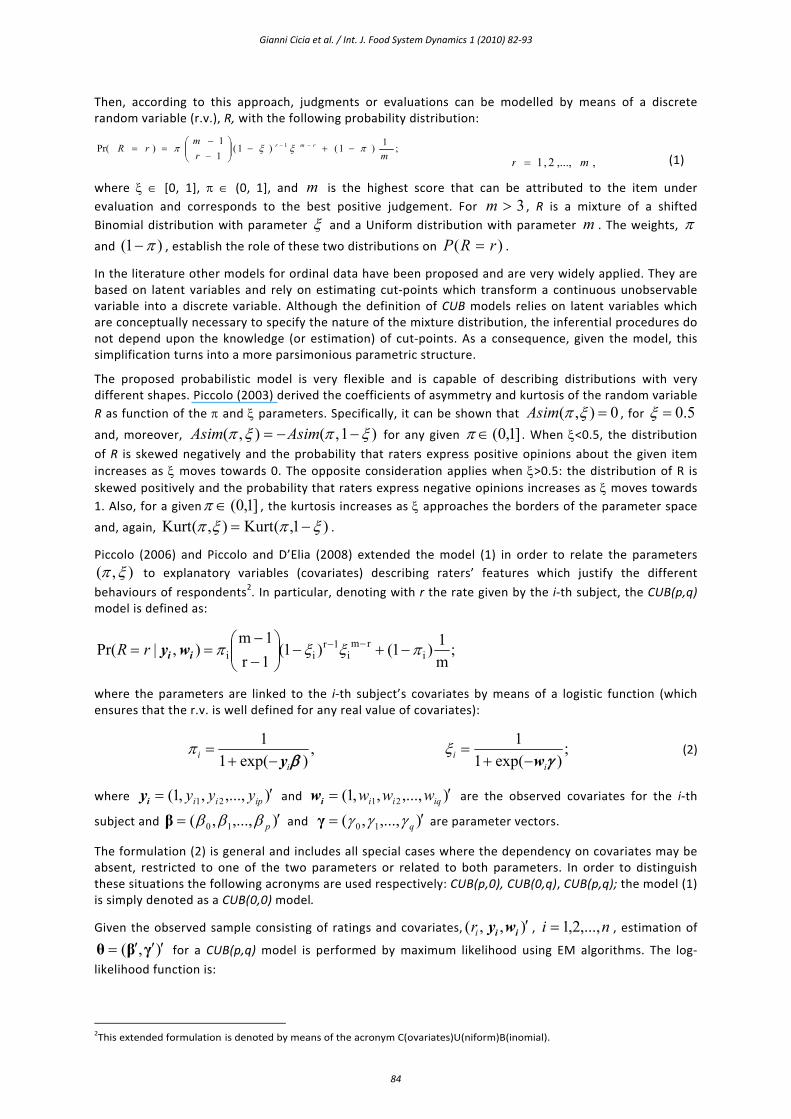
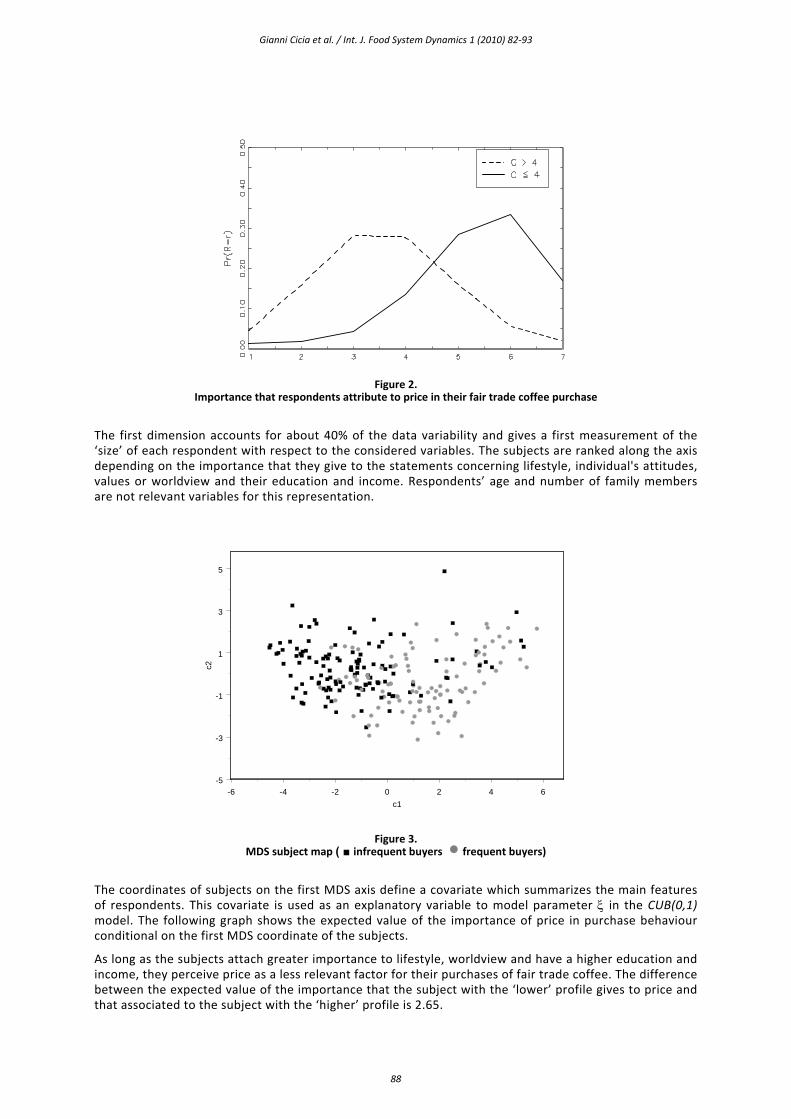
A metric scaling technique, the Multidimensional Scaling (MDS), was applied to the matrix of Euclidean distance between the subjects’ standardized profile for dimension reduction (see Mardia et al., 1979). In Figure 3, the two‐dimensional map from metric scaling is presented. The respondents are identified with different symbols depending on their purchase behaviour.
4 Note that although CUB distributions characterize discrete random variables, solid lines are used in the plot in order to enhance the distribution shape.
Gianni Cicia et al. / Int. J. Food System Dynamics 1 (2010) 82‐93
88
Figure 2. Importance that respondents attribute to price in their fair trade coffee purchase
The first dimension accounts for about 40% of the data variability and gives a first measurement of the ‘size’ of each respondent with respect to the considered variables. The subjects are ranked along the axis depending on the importance that they give to the statements concerning lifestyle, individual's attitudes, values or worldview and their education and income. Respondents’ age and number of family members are not relevant variables for this representation.
-6 -4 -2 0 2 4 6c1
-5
-3
-1
1
3
5
c2
Figure 3. MDS subject map ( ■ infrequent buyers n frequent buyers)
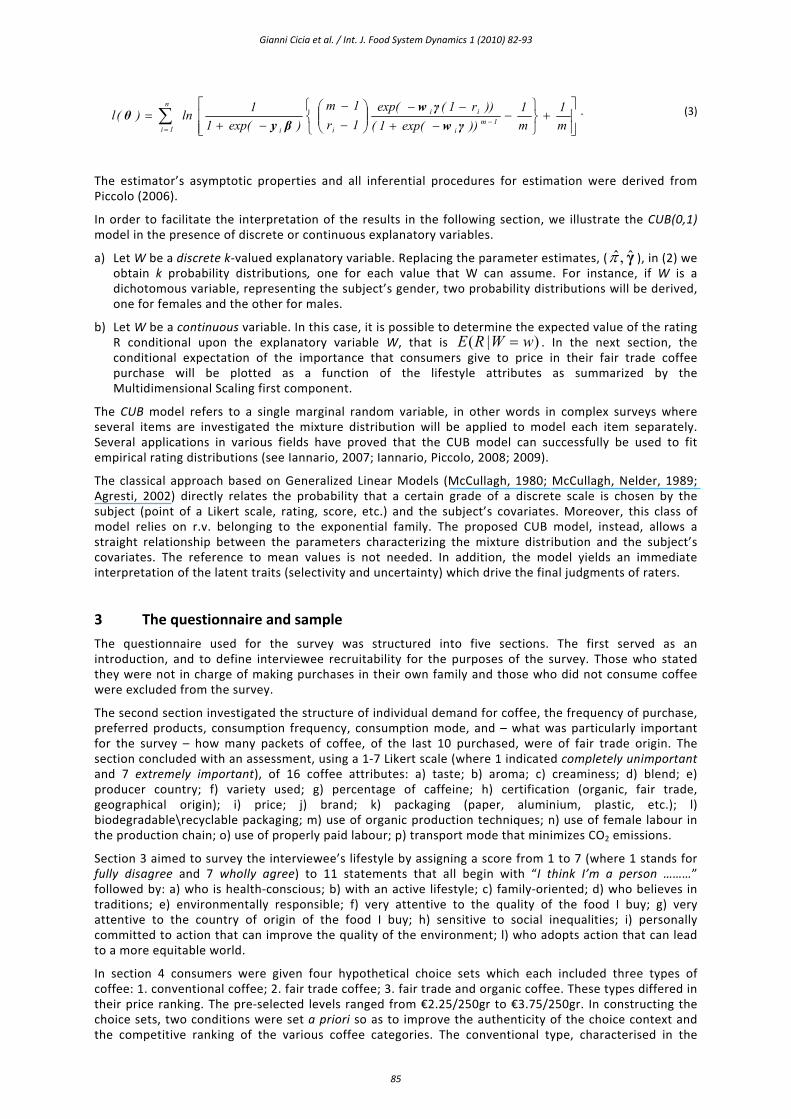
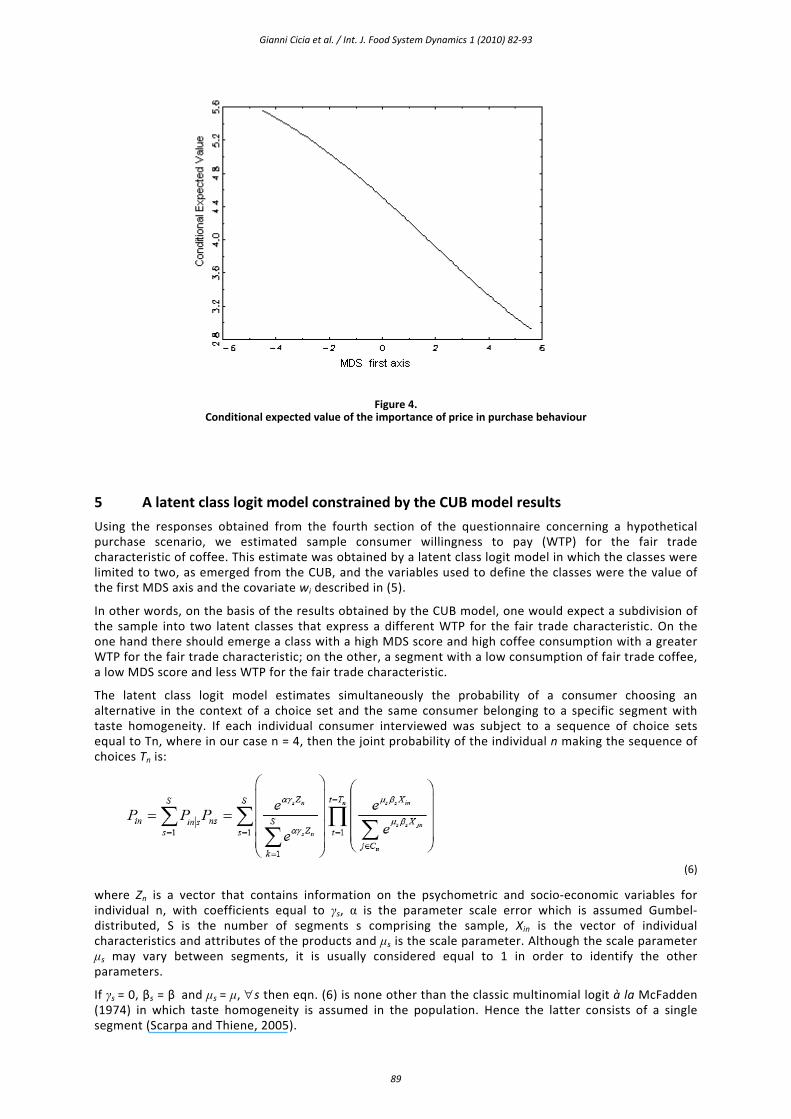
The coordinates of subjects on the first MDS axis define a covariate which summarizes the main features of respondents. This covariate is used as an explanatory variable to model parameter ξ in the CUB(0,1) model. The following graph shows the expected value of the importance of price in purchase behaviour conditional on the first MDS coordinate of the subjects.
As long as the subjects attach greater importance to lifestyle, worldview and have a higher education and income, they perceive price as a less relevant factor for their purchases of fair trade coffee. The difference between the expected value of the importance that the subject with the ‘lower’ profile gives to price and that associated to the subject with the ‘higher’ profile is 2.65.
Gianni Cicia et al. / Int. J. Food System Dynamics 1 (2010) 82‐93
89
Figure 4. Conditional expected value of the importance of price in purchase behaviour
5 A latent class logit model constrained by the CUB model results
Using the responses obtained from the fourth section of the questionnaire concerning a hypothetical purchase scenario, we estimated sample consumer willingness to pay (WTP) for the fair trade characteristic of coffee. This estimate was obtained by a latent class logit model in which the classes were limited to two, as emerged from the CUB, and the variables used to define the classes were the value of the first MDS axis and the covariate wi described in (5).
In other words, on the basis of the results obtained by the CUB model, one would expect a subdivision of the sample into two latent classes that express a different WTP for the fair trade characteristic. On the one hand there should emerge a class with a high MDS score and high coffee consumption with a greater WTP for the fair trade characteristic; on the other, a segment with a low consumption of fair trade coffee, a low MDS score and less WTP for the fair trade characteristic.
The latent class logit model estimates simultaneously the probability of a consumer choosing an alternative in the context of a choice set and the same consumer belonging to a specific segment with taste homogeneity. If each individual consumer interviewed was subject to a sequence of choice sets equal to Tn, where in our case n = 4, then the joint probability of the individual n making the sequence of choices Tn is:
(6)
where Zn is a vector that contains information on the psychometric and socio‐economic variables for individual n, with coefficients equal to γs, α is the parameter scale error which is assumed Gumbel‐distributed, S is the number of segments s comprising the sample, Xin is the vector of individual characteristics and attributes of the products and μs is the scale parameter. Although the scale parameter μs may vary between segments, it is usually considered equal to 1 in order to identify the other parameters.
If γs = 0, βs = β and μs = μ, ∀s then eqn. (6) is none other than the classic multinomial logit à la McFadden (1974) in which taste homogeneity is assumed in the population. Hence the latter consists of a single segment (Scarpa and Thiene, 2005).
Gianni Cicia et al. / Int. J. Food System Dynamics 1 (2010) 82‐93
90
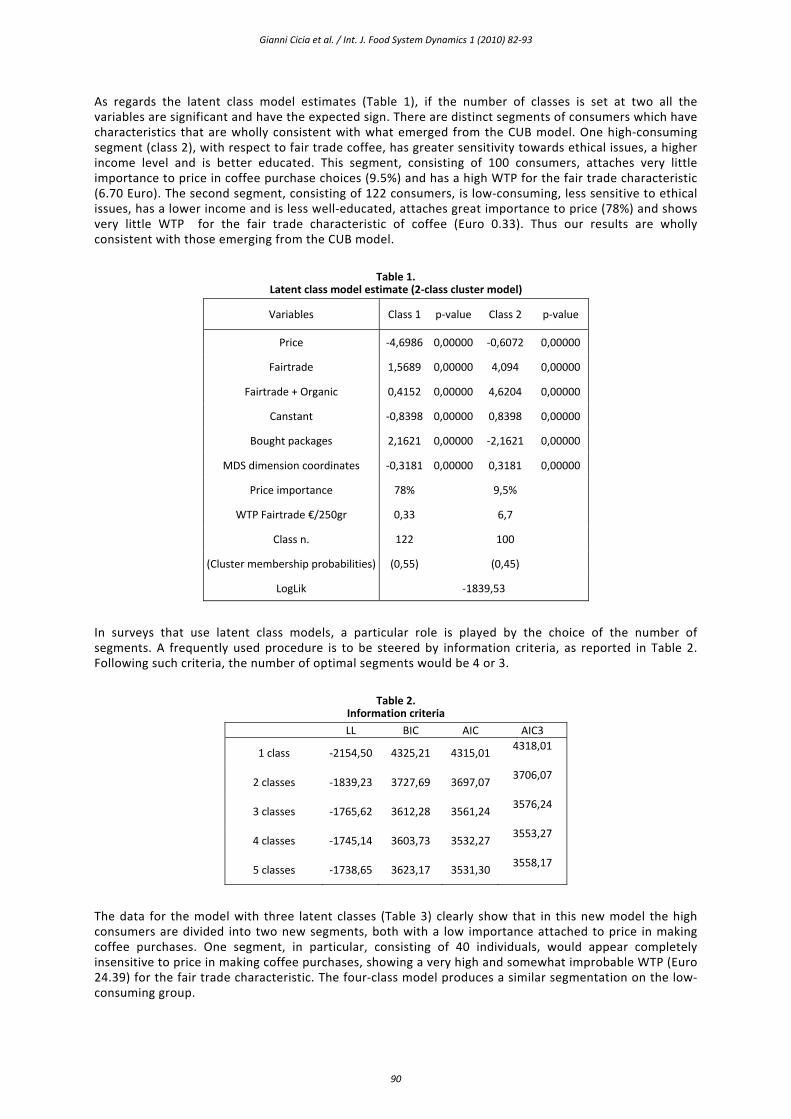
As regards the latent class model estimates (Table 1), if the number of classes is set at two all the variables are significant and have the expected sign. There are distinct segments of consumers which have characteristics that are wholly consistent with what emerged from the CUB model. One high‐consuming segment (class 2), with respect to fair trade coffee, has greater sensitivity towards ethical issues, a higher income level and is better educated. This segment, consisting of 100 consumers, attaches very little importance to price in coffee purchase choices (9.5%) and has a high WTP for the fair trade characteristic (6.70 Euro). The second segment, consisting of 122 consumers, is low‐consuming, less sensitive to ethical issues, has a lower income and is less well‐educated, attaches great importance to price (78%) and shows very little WTP for the fair trade characteristic of coffee (Euro 0.33). Thus our results are wholly consistent with those emerging from the CUB model.
Table 1. Latent class model estimate (2‐class cluster model)
Variables Class 1 p‐value Class 2 p‐value
Price ‐4,6986 0,00000 ‐0,6072 0,00000
Fairtrade 1,5689 0,00000 4,094 0,00000
Fairtrade + Organic 0,4152 0,00000 4,6204 0,00000
Canstant ‐0,8398 0,00000 0,8398 0,00000
Bought packages 2,1621 0,00000 ‐2,1621 0,00000
MDS dimension coordinates ‐0,3181 0,00000 0,3181 0,00000
Price importance 78% 9,5%
WTP Fairtrade €/250gr 0,33 6,7
Class n. 122 100
(Cluster membership probabilities) (0,55) (0,45)
LogLik ‐1839,53
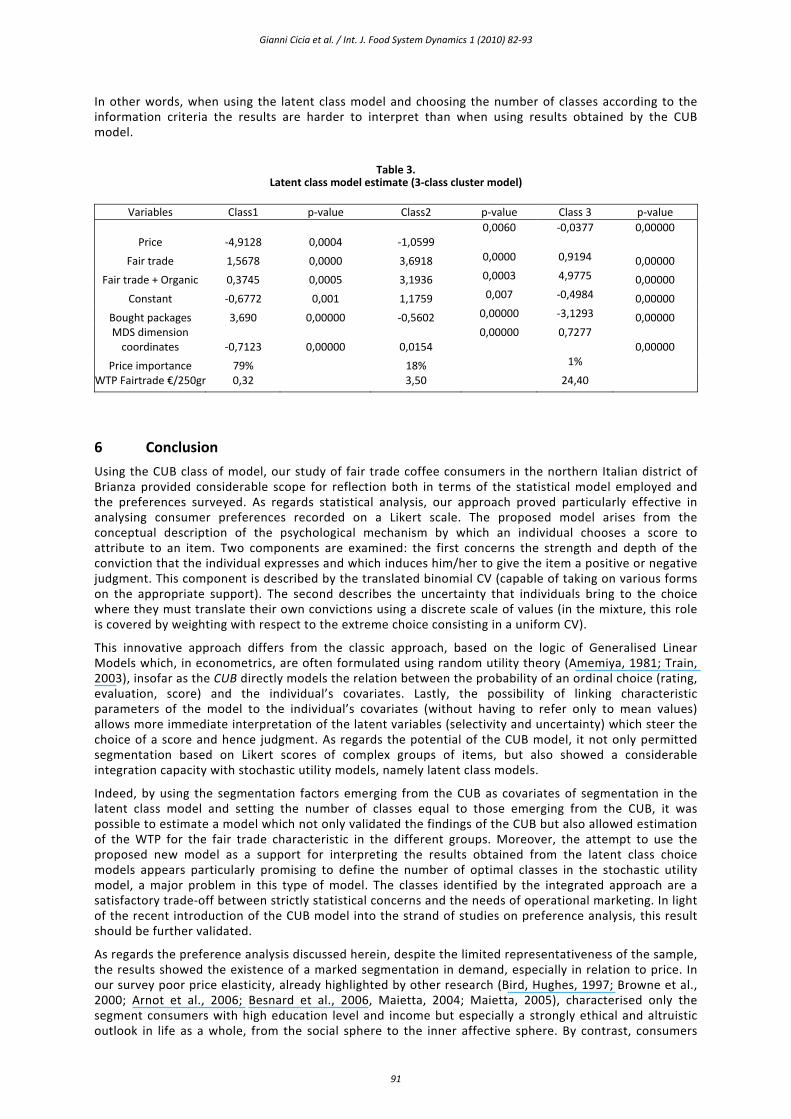
In surveys that use latent class models, a particular role is played by the choice of the number of segments. A frequently used procedure is to be steered by information criteria, as reported in Table 2. Following such criteria, the number of optimal segments would be 4 or 3.
Table 2. Information criteria
LL BIC AIC AIC3
1 class ‐2154,50 4325,21 4315,01 4318,01
2 classes ‐1839,23 3727,69 3697,07 3706,07
3 classes ‐1765,62 3612,28 3561,24 3576,24
4 classes ‐1745,14 3603,73 3532,27 3553,27
5 classes ‐1738,65 3623,17 3531,30 3558,17
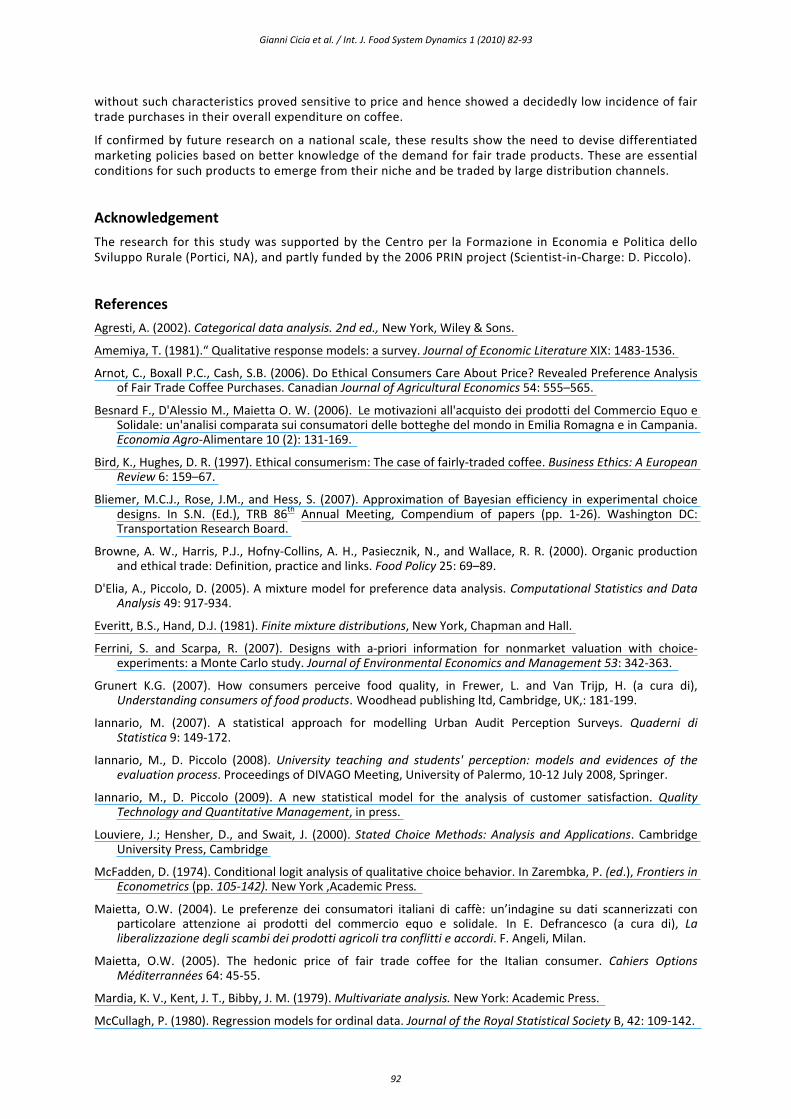
The data for the model with three latent classes (Table 3) clearly show that in this new model the high consumers are divided into two new segments, both with a low importance attached to price in making coffee purchases. One segment, in particular, consisting of 40 individuals, would appear completely insensitive to price in making coffee purchases, showing a very high and somewhat improbable WTP (Euro 24.39) for the fair trade characteristic. The four‐class model produces a similar segmentation on the low‐consuming group.
Gianni Cicia et al. / Int. J. Food System Dynamics 1 (2010) 82‐93
91
In other words, when using the latent class model and choosing the number of classes according to the information criteria the results are harder to interpret than when using results obtained by the CUB model.
Table 3. Latent class model estimate (3‐class cluster model)
Variables Class1 p‐value Class2 p‐value Class 3 p‐value
Price ‐4,9128 0,0004 ‐1,0599 0,0060 ‐0,0377 0,00000
Fair trade 1,5678 0,0000 3,6918 0,0000 0,9194 0,00000
Fair trade + Organic 0,3745 0,0005 3,1936 0,0003 4,9775 0,00000
Constant ‐0,6772 0,001 1,1759 0,007 ‐0,4984 0,00000
Bought packages 3,690 0,00000 ‐0,5602 0,00000 ‐3,1293 0,00000 MDS dimension coordinates ‐0,7123 0,00000 0,0154
0,00000 0,7277 0,00000
Price importance 79% 18% 1% WTP Fairtrade €/250gr 0,32 3,50 24,40
6 Conclusion
Using the CUB class of model, our study of fair trade coffee consumers in the northern Italian district of Brianza provided considerable scope for reflection both in terms of the statistical model employed and the preferences surveyed. As regards statistical analysis, our approach proved particularly effective in analysing consumer preferences recorded on a Likert scale. The proposed model arises from the conceptual description of the psychological mechanism by which an individual chooses a score to attribute to an item. Two components are examined: the first concerns the strength and depth of the conviction that the individual expresses and which induces him/her to give the item a positive or negative judgment. This component is described by the translated binomial CV (capable of taking on various forms on the appropriate support). The second describes the uncertainty that individuals bring to the choice where they must translate their own convictions using a discrete scale of values (in the mixture, this role is covered by weighting with respect to the extreme choice consisting in a uniform CV).
This innovative approach differs from the classic approach, based on the logic of Generalised Linear Models which, in econometrics, are often formulated using random utility theory (Amemiya, 1981; Train, 2003), insofar as the CUB directly models the relation between the probability of an ordinal choice (rating, evaluation, score) and the individual’s covariates. Lastly, the possibility of linking characteristic parameters of the model to the individual’s covariates (without having to refer only to mean values) allows more immediate interpretation of the latent variables (selectivity and uncertainty) which steer the choice of a score and hence judgment. As regards the potential of the CUB model, it not only permitted segmentation based on Likert scores of complex groups of items, but also showed a considerable integration capacity with stochastic utility models, namely latent class models.
Indeed, by using the segmentation factors emerging from the CUB as covariates of segmentation in the latent class model and setting the number of classes equal to those emerging from the CUB, it was possible to estimate a model which not only validated the findings of the CUB but also allowed estimation of the WTP for the fair trade characteristic in the different groups. Moreover, the attempt to use the proposed new model as a support for interpreting the results obtained from the latent class choice models appears particularly promising to define the number of optimal classes in the stochastic utility model, a major problem in this type of model. The classes identified by the integrated approach are a satisfactory trade‐off between strictly statistical concerns and the needs of operational marketing. In light of the recent introduction of the CUB model into the strand of studies on preference analysis, this result should be further validated.
As regards the preference analysis discussed herein, despite the limited representativeness of the sample, the results showed the existence of a marked segmentation in demand, especially in relation to price. In our survey poor price elasticity, already highlighted by other research (Bird, Hughes, 1997; Browne et al., 2000; Arnot et al., 2006; Besnard et al., 2006, Maietta, 2004; Maietta, 2005), characterised only the segment consumers with high education level and income but especially a strongly ethical and altruistic outlook in life as a whole, from the social sphere to the inner affective sphere. By contrast, consumers
Gianni Cicia et al. / Int. J. Food System Dynamics 1 (2010) 82‐93
92
without such characteristics proved sensitive to price and hence showed a decidedly low incidence of fair trade purchases in their overall expenditure on coffee.
If confirmed by future research on a national scale, these results show the need to devise differentiated marketing policies based on better knowledge of the demand for fair trade products. These are essential conditions for such products to emerge from their niche and be traded by large distribution channels.
Acknowledgement
The research for this study was supported by the Centro per la Formazione in Economia e Politica dello Sviluppo Rurale (Portici, NA), and partly funded by the 2006 PRIN project (Scientist‐in‐Charge: D. Piccolo).
References
Agresti, A. (2002). Categorical data analysis. 2nd ed., New York, Wiley & Sons.
Amemiya, T. (1981).“ Qualitative response models: a survey. Journal of Economic Literature XIX: 1483‐1536.
Arnot, C., Boxall P.C., Cash, S.B. (2006). Do Ethical Consumers Care About Price? Revealed Preference Analysis of Fair Trade Coffee Purchases. Canadian Journal of Agricultural Economics 54: 555–565.
Besnard F., D'Alessio M., Maietta O. W. (2006). Le motivazioni all'acquisto dei prodotti del Commercio Equo e Solidale: un'analisi comparata sui consumatori delle botteghe del mondo in Emilia Romagna e in Campania. Economia Agro‐Alimentare 10 (2): 131‐169.
Bird, K., Hughes, D. R. (1997). Ethical consumerism: The case of fairly‐traded coffee. Business Ethics: A European Review 6: 159–67.
Bliemer, M.C.J., Rose, J.M., and Hess, S. (2007). Approximation of Bayesian efficiency in experimental choice designs. In S.N. (Ed.), TRB 86th Annual Meeting, Compendium of papers (pp. 1‐26). Washington DC: Transportation Research Board.
Browne, A. W., Harris, P.J., Hofny‐Collins, A. H., Pasiecznik, N., and Wallace, R. R. (2000). Organic production and ethical trade: Definition, practice and links. Food Policy 25: 69–89.
D'Elia, A., Piccolo, D. (2005). A mixture model for preference data analysis. Computational Statistics and Data Analysis 49: 917‐934.
Everitt, B.S., Hand, D.J. (1981). Finite mixture distributions, New York, Chapman and Hall.
Ferrini, S. and Scarpa, R. (2007). Designs with a‐priori information for nonmarket valuation with choice‐experiments: a Monte Carlo study. Journal of Environmental Economics and Management 53: 342‐363.
Grunert K.G. (2007). How consumers perceive food quality, in Frewer, L. and Van Trijp, H. (a cura di), Understanding consumers of food products. Woodhead publishing ltd, Cambridge, UK,: 181‐199.
Iannario, M. (2007). A statistical approach for modelling Urban Audit Perception Surveys. Quaderni di Statistica 9: 149‐172.
Iannario, M., D. Piccolo (2008). University teaching and students' perception: models and evidences of the evaluation process. Proceedings of DIVAGO Meeting, University of Palermo, 10‐12 July 2008, Springer.
Iannario, M., D. Piccolo (2009). A new statistical model for the analysis of customer satisfaction. Quality Technology and Quantitative Management, in press.
Louviere, J.; Hensher, D., and Swait, J. (2000). Stated Choice Methods: Analysis and Applications. Cambridge University Press, Cambridge
McFadden, D. (1974). Conditional logit analysis of qualitative choice behavior. In Zarembka, P. (ed.), Frontiers in Econometrics (pp. 105‐142). New York ,Academic Press.
Maietta, O.W. (2004). Le preferenze dei consumatori italiani di caffè: un’indagine su dati scannerizzati con particolare attenzione ai prodotti del commercio equo e solidale. In E. Defrancesco (a cura di), La liberalizzazione degli scambi dei prodotti agricoli tra conflitti e accordi. F. Angeli, Milan.
Maietta, O.W. (2005). The hedonic price of fair trade coffee for the Italian consumer. Cahiers Options Méditerrannées 64: 45‐55.
Mardia, K. V., Kent, J. T., Bibby, J. M. (1979). Multivariate analysis. New York: Academic Press.
McCullagh, P. (1980). Regression models for ordinal data. Journal of the Royal Statistical Society B, 42: 109‐142.

Gianni Cicia et al. / Int. J. Food System Dynamics 1 (2010) 82‐93
93
McCullagh, P. and Nelder, J.A. (1989). Generalized Linear Models. London: Chapman & Hall.
Nelson, P. (1970). Information and consumer behavior. Journal of Political Economy 78: 311‐329.
Piccolo, D. (2003). On the moments of a mixture of Uniform and shifted Binomial random variables. Quaderni di Statistica 5: 86‐104.
Piccolo, D. (2006). Observed information matrix for MUB models. Quaderni di Statistica 8: 33‐78.
Piccolo, D., D'Elia, A. (2008). A new approach for modelling consumers' preferences. Food Quality and Preference 19: 247‐259.
Scarpa R., Thiene M. (2005). Destination choice models for rock‐climbing in the North‐Eastern Alps: a latent‐class approach based on intensity of preferences. August, Land Economics 85(3): 426‐444.
Train K. E. (2003). Discrete choice methods with simulation. Cambridge University Press, Cambridge.
Related Documents