Value Stream Mapping Webinar with APICS Heartland September 18, 2014

Welcome message from author
This document is posted to help you gain knowledge. Please leave a comment to let me know what you think about it! Share it to your friends and learn new things together.
Transcript

Value Stream Mapping
Webinar with APICS Heartland
September 18, 2014
You will learn…
• How to use value stream mapping as an organizational transformation & leadership alignment tool
• How to plan for a value stream mapping activity
• The mechanics of mapping, including key metrics for office/service/knowledge work
• How to create an actionable Value Stream Transformation Plan

Not One.
3

© 2014 The Karen Martin Group, Inc.
Wherever there is a request and a deliverable,
there is a value stream.
4

Value Stream Defined Value Stream: All of the activities required to transform a
customer request into a good or service.
5
First defined in The Machine That Changed the World, James Womack, Daniel Jones, & Daniel Roos, 1990.
Process Process Process
Customer
Request
Customer
Receipt

Work: Degrees of Granularity
Value Stream
Process Process Process
Step Step Step
6
Macro Perspective
• Define strategic direction (“what”)
• Heavy leadership involvement
• Value Stream Mapping
Micro Perspective
• Identify the tactical “how”
• Heavy frontline involvement
• Metrics-Based Process Mapping

7
Basic Current State Value Stream Map

Value Stream Mapping’s Roots
• Value
• Value Stream
• Flow
• Pull
• Perfection
1996

Value Stream Mapping Progression
Mike Rother & John Shook, 1999
Beau Keyte & Drew Locher, 2004
Karen Martin & Mike Osterling, 2014
www.bitly.com/VSMbk

Your Goal? Get the Most from Value Stream Mapping

Common Failings
• VSM used solely as a work design exercise
• VSM used to make tactical vs. strategic decisions
• Inappropriate mapping team—or no team at all
• Maps at process level, not value stream level
• Maps with no metrics
• Maps that are too narrow in scope, functionally
• The effects of improvement aren’t felt by the customer
• Not leveraging the method to shift leadership mindsets and culture

VSM Aids in Developing Systems Thinking
12
System Efficiency = Optimal Value Stream Performance
Individual Efficiency = Sub-optimization

Value Stream Mapping is a
Strategic, Leadership-Heavy
Activity

© 2014 The Karen Martin Group, Inc. 14
Who? Accountability Practice / Tool
Sr. Leaders “What has to happen” Hoshin Planning, Value Stream Mapping
Frontlines “How it will happen” Kaizen Events, Just-do-its, and Projects
Improvement Roles St
rate
gic
Tact
ical
Middle Management

Value Stream Maps: Strategy Before Tactics
Where am I? Where do I want
to go?
I-80 option I-40 option I-70 option
Which route should I take?
? ? ?
© 2014 The Karen Martin Group, Inc. 16
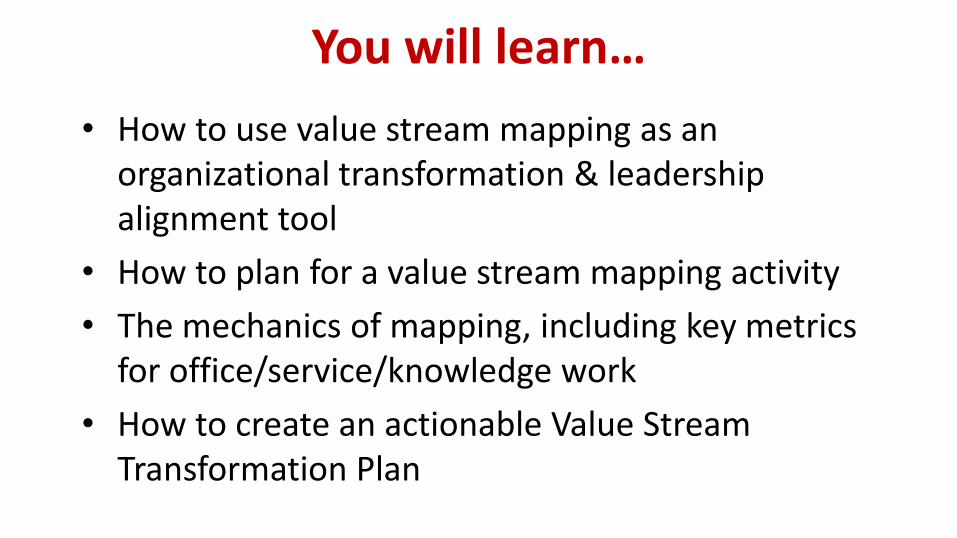
VSM Enables an Org to Get Above the Work

17

18
1 Information
Flow
2 Work Flow
3 Timeline
Basic Current State Value Stream Map

© 2014 The Karen Martin Group, Inc. 19
Lead Time vs. Process Time
Lead Time (LT)
Work Received
Work passed to next process or
department
Process Time (PT)
Lead Time = Elapsed time; Throughput time; turnaround time Process Time = Touch time; work time; cycle time
Work is Idle Work is Idle

© 2014 The Karen Martin Group, Inc.
Measuring Quality: Percent Complete & Accurate (%C&A)
Customer
Process 1
Process 2
Process 3
Process 4

© 2014 The Karen Martin Group, Inc. 21
Multiple downstream customers reporting different %C&As from the same supplier
Block 5 reported that they rework Block 4’s output 25% of the time Block 7 reported that they, too, rework Block 4’s output 50% of the time. (0.75 x 0.50) x 100 = 37.5%

22
Value Stream Maps Help Visualize Problems

© 2014 The Karen Martin Group, Inc.
VSM Helps Break Down Functional Silos
23
Function Function Function Function
Core Value Stream
Support Value Stream
Support Value Stream Customer
Customer
Customer

© 2014 The Karen Martin Group, Inc. 24
Customer
1
Process 3
Function E
LT = 0.5 days
PT = 30 mins.
%C&A = 95%
4
4
10 mins.
1 days
120 mins.
2 days
30 mins.
0.5 days Total LT = 3.5 days
Total PT = 160 mins.
Activity Ratio = 9.5%
Rolled %C&A = 89.3%
Process 2
Function C
LT = 2 days
PT = 120 mins.
%C&A = 95%
3
3
ABC Technology, Inc.
Future State Value Stream Map
Name of Value Stream Being Mapped
Demand Rate = XX / Year
Name of Value Stream Champion
Mapping Date
IT-1 IT-2
5 items
Process 1
Function A
LT = 1 days
PT = 10 mins.
%C&A = 99%
5
2
1 items 10 items
Standard
work
Modified
approvals
IT interface
Cross-
train
Cross-
train
Standard
workError
proof
Basic Value Stream Map: Future State

J F M A M J J A S O N D
1 PROJ Steve 0%
2 PROJ Steve 100%
3 KE Bruce 50%
4 KE Bruce 50%
5 PROJ Jessie 100%
6 PROJ Sally 100%
7 KE Jessie 0%
8 PROJ Mike 100%
9 JDI Jessie 50%
10 PROJ Steve 80%
11 PROJ Steve 10%
12 PROJ Bob 0%
13 JDI Jessie 100%
14 PROJ Marcia 25%
15 PROJ Tom 30%
16 KE Marcia 50%
17 PROJ Sally 50%
Value Stream Champion Sally Brooks
Value Stream Mapping Facilitator Karen Martin
Value Stream Transformation PlanValue Stream Product Y Scheduled Review Dates
Executive Sponsor Jim McMahon 2/10 + bi-weekly Thu 10 am
Socialize new criteria for engineering,
quality, & purchasing involvement.
Date Created 1/5/2014
Kaizen
Burst #Improvement Objective / Hypothesis Proposed Countermeasure
Exec.
Method *Owner
Planned Timeline for ExecutionStatus
Create procedure/train GS service engineers to
properly feedback suggestions to engineering.
Create bulletin re: standardized headplate
design to eliminate flange orientation.
Create visual "milestone" timeline to
educate customers.
Define technical info needed from
customer and when.
Signature: Signature: Signature:
Revise standard Ts & Cs to incorporate time limit
for customer approval for f inal payment.
Error proof P.O. info (correct specs, ship to,
etc.); notify customer re missing info and
drop dead date.
Create criteria for LOI acceptance.
Add initial project release in SF.
Resocialize existing customer-requested
CO procedure.
One piece engineering flow
Agreement
Executive Sponsor Value Stream Champion Value Stream Mapping Facilitator
* Execution Method = JDI (Just-do-it), KE (Kaizen Event), or Proj (Project)
Move to one release (pump & systems)
Date: Date: Date:
Create commodity management team &
supplier SLAs.
Standardize WPS/PQR from suppliers.
Revise proposal template to limit time to 4
revisions.
Create pull signal for invoicing.
Create trigger to release (BOMs) for
purchase.
Co
nfi
de
nti
al C
on
ten
t R
em
ove
d

Value Stream Performance Sample Results
Metric Current State Projected Future
State Projected
% Improvement
Lead Time (PO to shipping)
17 months 7.5 months 56%
Process Time 600 hours 450 hours 25% (22 FTEs)
Rolled % Complete & Accurate
0% 21% > 2,000%
On-time delivery 13% 90% 592%
# Internally-produced Change Orders
25/project 12/project 52%
Freed Cash flow $25M per year

27
Visualize the entire cycle of value delivery on a single sheet of paper
27

© 2014 The Karen Martin Group, Inc. 28
Executing Transformation
Plan
Value Stream Mapping
Making Specific
Improvements

Prepare Understand
Current State Design
Future State
Develop Transformation
Plan
Execute Transformation
Plan
Three Consecutive Days 4 Weeks Prior to Mapping
Following Mapping
Repeat
Value Stream Mapping Activity Phases and Timing
29

1
2 1
3 2
4 3
5 4
5
1 6
2 7
3 8
4 9
5 10
1
2 1
3 2
4 3
5 4
1
2
3
4 Date: Date:engagement, financials, lead time, safety records, etc.
effectiveness, market trends, customer satisfaction, employee Signature:
Date:
Relevant Data Agreement
Examples: work volume & volume variation, process quality &
Executive SponsorWhat data is required to understand relevant current state isues.
Signature: Signature:
How will the business, internal and external customers, and Function
internal and external suppliers benefit from value stream improvement? SMEs that may not be needed full time
Always a nice touch; keeps
the team from wandering
On-site, ample wall space,
quiet/private location
Benefits to Customers & Business On-Call Support
Increase <defined metric> from X to Y (Z% improvement).
Reduce <defined metric> from X to Y (Z% improvement).
Measurable Target Condition
What's driving the need for improvement? Function
Leadership-heavy
Current State Problems & Business Needs Mapping Team
Boundaries &
Limitations
Improvement Time
Frame
What is the team NOT authorized to change?
Typically 3-6 months
Last Step Task on last process block
Logistics
CoordinatorNot always needed
Aids in consensus building
and organizational learning.
Typically the last hour of the
day.
First Step Task on first process block
Briefing
Dates &
Times
Meals
Provided
Briefing
Attendees
** required
*optional
List the the people that are
required to attend the briefings (**)
and those whose attendance is
optional (*).
Demand Rate
Trigger
How many times is this done per wk, qtr, mo, or yr?
What initiates the process?
Value Stream Mapping CharterScope Accountable Parties Logistics
Required: typically VP or C-level
If needed—often director or
manager level
Specific
Conditions
What circumstances are included and excluded?
(e.g., type of customer, geographic location, etc.)
Value Stream
Champion
Value stream being improvedExecutive
SponsorValue Stream
Event Dates
& Times
3 days typically; consecutive
is best; 6 hrs per day
minimum; 7 or 8 hrs is best
Required: skilled, objective person
leading the activity
Base-camp
LocationFacilitator
Name
Name
FacilitatorValue Stream Champion
Contact Information
Contact Information
Charter: Critical planning, communication, and consensus-building tool
Available at www.ksmartin.com/vsm-charter

Daily Briefings
31
#1 – Reduce resistance
#2 – Build consensus
#3 – Gain commitment

Socializing the Charter
• Conversation, not merely an email attachment.
• To the entire workforce who will be affected by change.
• Adjust the charter if new discoveries or concerns surface.

Prepare Understand
Current State Design
Future State
Develop Transformation
Plan
Execute Transformation
Plan
Three Consecutive Days 4 Weeks Prior to Mapping
Following Mapping
Repeat
Value Stream Mapping Activity Phases and Timing
33

Current & Future State Notes
34
• Current State
– Walk the value stream
– Surface all problems: WIP, delays, errors/defects, work environment, morale, IT systems
– Visually depict
• Future State
– Use relevant countermeasures to add value and remove waste
– Design to the performance targets and timeframe defined in the Charter

Current State Value Stream Map
35
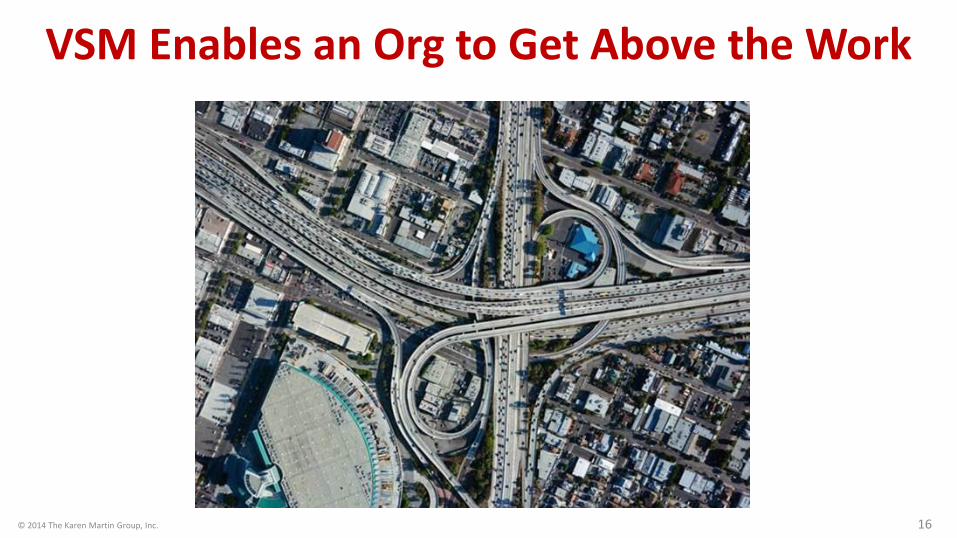
Future State Value Stream Map
36

Prepare Understand
Current State Design
Future State
Develop Transformation
Plan
Execute Transformation
Plan
Three Consecutive Days 4 Weeks Prior to Mapping
Following Mapping
Repeat
Value Stream Mapping Activity Phases and Timing
37

© 2014 The Karen Martin Group, Inc. 38
J F M A M J J A S O N D
1 PROJ Steve 0%
2 PROJ Steve 100%
3 KE Bruce 50%
4 KE Bruce 50%
5 PROJ Jessie 100%
6 PROJ Sally 100%
7 KE Jessie 0%
8 PROJ Mike 100%
9 JDI Jessie 50%
10 PROJ Steve 80%
11 PROJ Steve 10%
12 PROJ Bob 0%
13 JDI Jessie 100%
14 PROJ Marcia 25%
15 PROJ Tom 30%
16 KE Marcia 50%
17 PROJ Sally 50%
Value Stream Champion Sally Brooks
Value Stream Mapping Facilitator Karen Martin
Value Stream Transformation PlanValue Stream Product Y Scheduled Review Dates
Executive Sponsor Jim McMahon 2/10 + bi-weekly Thu 10 am
Socialize new criteria for engineering,
quality, & purchasing involvement.
Date Created 1/5/2014
Kaizen
Burst #Improvement Objective / Hypothesis Proposed Countermeasure
Exec.
Method *Owner
Planned Timeline for ExecutionStatus
Create procedure/train GS service engineers to
properly feedback suggestions to engineering.
Create bulletin re: standardized headplate
design to eliminate flange orientation.
Create visual "milestone" timeline to
educate customers.
Define technical info needed from
customer and when.
Signature: Signature: Signature:
Revise standard Ts & Cs to incorporate time limit
for customer approval for f inal payment.
Error proof P.O. info (correct specs, ship to,
etc.); notify customer re missing info and
drop dead date.
Create criteria for LOI acceptance.
Add initial project release in SF.
Resocialize existing customer-requested
CO procedure.
One piece engineering flow
Agreement
Executive Sponsor Value Stream Champion Value Stream Mapping Facilitator
* Execution Method = JDI (Just-do-it), KE (Kaizen Event), or Proj (Project)
Move to one release (pump & systems)
Date: Date: Date:
Create commodity management team &
supplier SLAs.
Standardize WPS/PQR from suppliers.
Revise proposal template to limit time to 4
revisions.
Create pull signal for invoicing.
Create trigger to release (BOMs) for
purchase.Co
nfi
de
nti
al C
on
ten
t R
em
ove
d
Value Stream Champion typically owns the
Transformation Plan

Physically Post the Future State Map
Physically Post
the Transformation Plan

And Repeat…
41
Who Owns the Value Stream?

Coach / Facilitator / Consultant / Trainer: Lean transformation & business performance improvement in all industries.
Teacher: University of California, San Diego
Author & Speaker: Karen Martin, President
The Karen Martin Group, Inc.
@karenmartinopex
42 www.ksmartin.com/subscribe
2013 Shingo Prize winner!
Related Documents