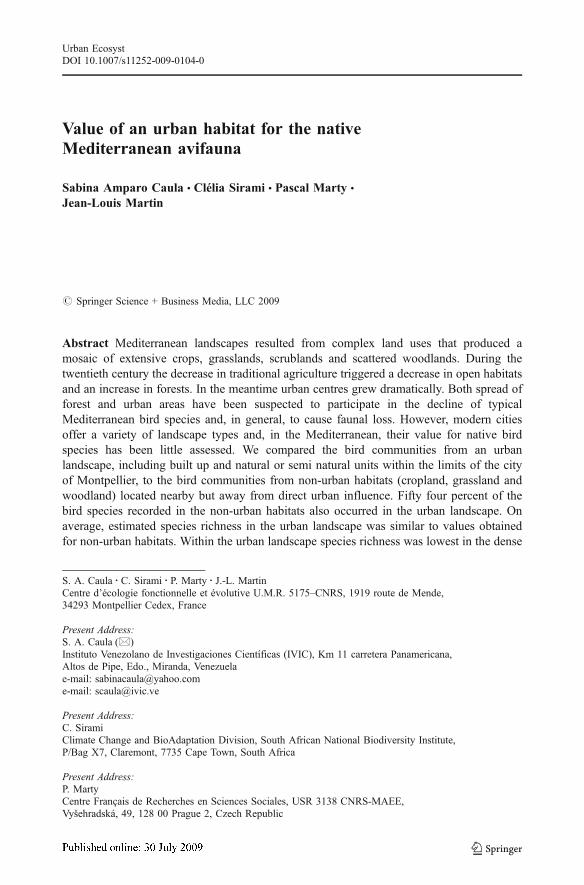
Value of an urban habitat for the native Mediterranean avifauna Sabina Amparo Caula & Clélia Sirami & Pascal Marty & Jean-Louis Martin # Springer Science + Business Media, LLC 2009 Abstract Mediterranean landscapes resulted from complex land uses that produced a mosaic of extensive crops, grasslands, scrublands and scattered woodlands. During the twentieth century the decrease in traditional agriculture triggered a decrease in open habitats and an increase in forests. In the meantime urban centres grew dramatically. Both spread of forest and urban areas have been suspected to participate in the decline of typical Mediterranean bird species and, in general, to cause faunal loss. However, modern cities offer a variety of landscape types and, in the Mediterranean, their value for native bird species has been little assessed. We compared the bird communities from an urban landscape, including built up and natural or semi natural units within the limits of the city of Montpellier, to the bird communities from non-urban habitats (cropland, grassland and woodland) located nearby but away from direct urban influence. Fifty four percent of the bird species recorded in the non-urban habitats also occurred in the urban landscape. On average, estimated species richness in the urban landscape was similar to values obtained for non-urban habitats. Within the urban landscape species richness was lowest in the dense Urban Ecosyst DOI 10.1007/s11252-009-0104-0 S. A. Caula : C. Sirami : P. Marty : J.-L. Martin Centre d’écologie fonctionnelle et évolutive U.M.R. 5175–CNRS, 1919 route de Mende, 34293 Montpellier Cedex, France Present Address: S. A. Caula (*) Instituto Venezolano de Investigaciones Científicas (IVIC), Km 11 carretera Panamericana, Altos de Pipe, Edo., Miranda, Venezuela e-mail: [email protected] e-mail: [email protected] Present Address: C. Sirami Climate Change and BioAdaptation Division, South African National Biodiversity Institute, P/Bag X7, Claremont, 7735 Cape Town, South Africa Present Address: P. Marty Centre Français de Recherches en Sciences Sociales, USR 3138 CNRS-MAEE, Vyšehradská, 49, 128 00 Prague 2, Czech Republic

Welcome message from author
This document is posted to help you gain knowledge. Please leave a comment to let me know what you think about it! Share it to your friends and learn new things together.
Transcript
Value of an urban habitat for the nativeMediterranean avifauna
Sabina Amparo Caula & Clélia Sirami & Pascal Marty &
Jean-Louis Martin
# Springer Science + Business Media, LLC 2009
Abstract Mediterranean landscapes resulted from complex land uses that produced amosaic of extensive crops, grasslands, scrublands and scattered woodlands. During thetwentieth century the decrease in traditional agriculture triggered a decrease in open habitatsand an increase in forests. In the meantime urban centres grew dramatically. Both spread offorest and urban areas have been suspected to participate in the decline of typicalMediterranean bird species and, in general, to cause faunal loss. However, modern citiesoffer a variety of landscape types and, in the Mediterranean, their value for native birdspecies has been little assessed. We compared the bird communities from an urbanlandscape, including built up and natural or semi natural units within the limits of the cityof Montpellier, to the bird communities from non-urban habitats (cropland, grassland andwoodland) located nearby but away from direct urban influence. Fifty four percent of thebird species recorded in the non-urban habitats also occurred in the urban landscape. Onaverage, estimated species richness in the urban landscape was similar to values obtainedfor non-urban habitats. Within the urban landscape species richness was lowest in the dense
Urban EcosystDOI 10.1007/s11252-009-0104-0
S. A. Caula : C. Sirami : P. Marty : J.-L. MartinCentre d’écologie fonctionnelle et évolutive U.M.R. 5175–CNRS, 1919 route de Mende,34293 Montpellier Cedex, France
Present Address:S. A. Caula (*)Instituto Venezolano de Investigaciones Científicas (IVIC), Km 11 carretera Panamericana,Altos de Pipe, Edo., Miranda, Venezuelae-mail: [email protected]: [email protected]
Present Address:C. SiramiClimate Change and BioAdaptation Division, South African National Biodiversity Institute,P/Bag X7, Claremont, 7735 Cape Town, South Africa
Present Address:P. MartyCentre Français de Recherches en Sciences Sociales, USR 3138 CNRS-MAEE,Vyšehradská, 49, 128 00 Prague 2, Czech Republic
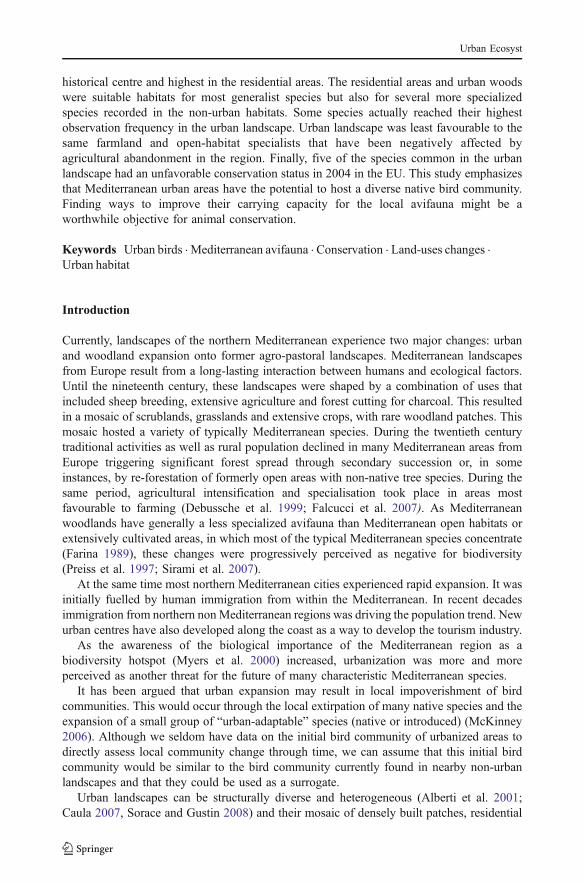
historical centre and highest in the residential areas. The residential areas and urban woodswere suitable habitats for most generalist species but also for several more specializedspecies recorded in the non-urban habitats. Some species actually reached their highestobservation frequency in the urban landscape. Urban landscape was least favourable to thesame farmland and open-habitat specialists that have been negatively affected byagricultural abandonment in the region. Finally, five of the species common in the urbanlandscape had an unfavorable conservation status in 2004 in the EU. This study emphasizesthat Mediterranean urban areas have the potential to host a diverse native bird community.Finding ways to improve their carrying capacity for the local avifauna might be aworthwhile objective for animal conservation.
Keywords Urban birds . Mediterranean avifauna . Conservation . Land-uses changes .
Urban habitat
Introduction
Currently, landscapes of the northern Mediterranean experience two major changes: urbanand woodland expansion onto former agro-pastoral landscapes. Mediterranean landscapesfrom Europe result from a long-lasting interaction between humans and ecological factors.Until the nineteenth century, these landscapes were shaped by a combination of uses thatincluded sheep breeding, extensive agriculture and forest cutting for charcoal. This resultedin a mosaic of scrublands, grasslands and extensive crops, with rare woodland patches. Thismosaic hosted a variety of typically Mediterranean species. During the twentieth centurytraditional activities as well as rural population declined in many Mediterranean areas fromEurope triggering significant forest spread through secondary succession or, in someinstances, by re-forestation of formerly open areas with non-native tree species. During thesame period, agricultural intensification and specialisation took place in areas mostfavourable to farming (Debussche et al. 1999; Falcucci et al. 2007). As Mediterraneanwoodlands have generally a less specialized avifauna than Mediterranean open habitats orextensively cultivated areas, in which most of the typical Mediterranean species concentrate(Farina 1989), these changes were progressively perceived as negative for biodiversity(Preiss et al. 1997; Sirami et al. 2007).
At the same time most northern Mediterranean cities experienced rapid expansion. It wasinitially fuelled by human immigration from within the Mediterranean. In recent decadesimmigration from northern nonMediterranean regions was driving the population trend. Newurban centres have also developed along the coast as a way to develop the tourism industry.
As the awareness of the biological importance of the Mediterranean region as abiodiversity hotspot (Myers et al. 2000) increased, urbanization was more and moreperceived as another threat for the future of many characteristic Mediterranean species.
It has been argued that urban expansion may result in local impoverishment of birdcommunities. This would occur through the local extirpation of many native species and theexpansion of a small group of “urban-adaptable” species (native or introduced) (McKinney2006). Although we seldom have data on the initial bird community of urbanized areas todirectly assess local community change through time, we can assume that this initial birdcommunity would be similar to the bird community currently found in nearby non-urbanlandscapes and that they could be used as a surrogate.
Urban landscapes can be structurally diverse and heterogeneous (Alberti et al. 2001;Caula 2007, Sorace and Gustin 2008) and their mosaic of densely built patches, residential
Urban Ecosyst
areas, and green spaces has the potential to host significant populations of a variety of songbirds (Bland et al. 2004, Cannon et al. 2005).
Our goal was to explore these assumptions to assess the avifaunal value of urbanizedareas in the northern Mediterranean. For this we compared the overall avifauna of anexpanding Mediterranean urban area, the city of Montpellier, to the avifauna found ina nearby non-urban areas. We had access to the data from two independent studies: (1) astudy on the avifauna of the urban landscape in the city of Montpellier (Caula 2007); (2) astudy on the ecology of the avifauna from a non-urban landscape situated north ofMontpellier (Preiss et al. 1997; Sirami et al. 2007). We specifically addressed fourquestions: (1) how rich is this urban Mediterranean bird community when compared to thenon-urban bird community; (2) is the urban bird community a simplified communitycomposed of only a few generalist species when compared to the non-urban community; (3)what birds typical from local semi-natural and natural native habitats can find a home inurban areas and how are they distributed within the urban area; (4) what is the proportion ofthe urban avifauna that is of conservation interest?
Methods
Study area
The Montpellier urban district is located 12 km north of the Mediterranean Sea (43°40 N,3°50E). In 2005, it covered approximately 5,700 ha and had one of the fastest growth ratesamong the 52 French cities of more than 150,000 inhabitants (pop 244,500; INSEE 2002). Thisurban area can be characterized as a gradient of building density going from a very densely builthistorical centre to suburbs that have an increasing proportion of vegetated land (Caula 2007).
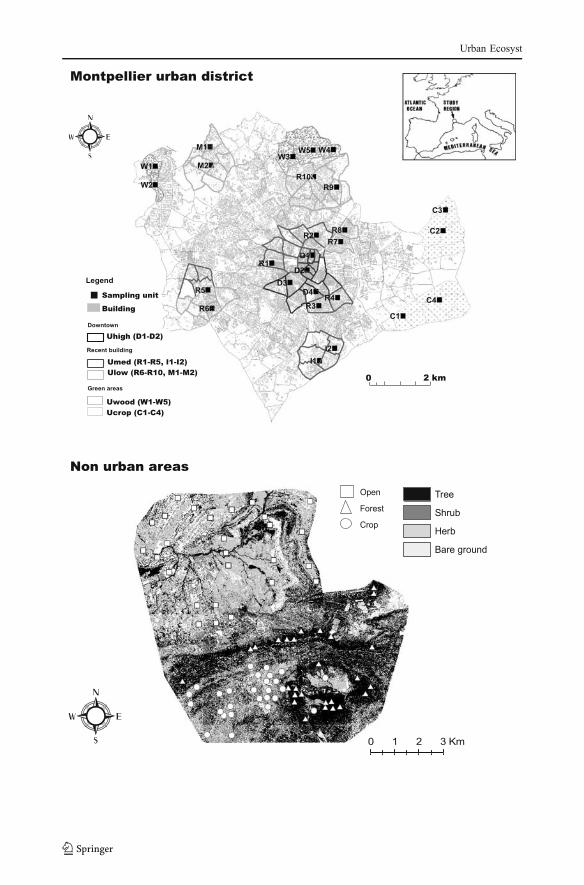
We defined five types of urban landscapes (Fig. 1) based on the percentage of builtsurface and context: (1) a densely build downtown landscape (Uhigh, quadrats D1-D4) inwhich building density is >45%); (2) a suburban landscape with medium building density(a mix of more recent residential (R), industrial (I) and multi purposes (M) neighbourhoods)(Umed, quadrats R1-R5, I1-I2) in which building density is 20–45%, (3) a suburbanlandscape with low building density (Ulow, quadrats R6-R10, M1-M2) in which buildingdensity is <20%; (4) urban woodlands and parks (Uwood, W1-W5) and (5) remnantvineyards and other crops (Ucrop, C1-C4) embedded in the urban matrix (Caula et al.2008). We excluded areas with atypical characteristics, such as large construction projects,large complexes of official buildings, temporarily abandoned areas or recent suburbs wherethe vegetation had not yet recovered.
The non-urban study area was located 20 km north of downtown Montpellier (43°47′N,03°50′E). It covered an area of 5,600 ha similar in size to the urban area studied. It wasmainly composed of three vegetation types: cropland (CROP), essentially vineyards andcereals; open vegetation (OPEN) that consisted of grasslands dominated by Brachypodiumretusum or Bromus erectus on plateaus and plains and of scrubland with Juniperusoxycedrus, Buxus sempervirens and Rosmarinus officinalis on the hills; finally woodlandvegetation (WOOD) dominated by Quercus ilex, Pinus halepensis or Quercus pubescens.
Bird sampling
The urban bird community was sampled by S. Caula in 2005. Because it was consideredthat point count sampling would be inadequate for most parts of the urban environment as a
Urban Ecosyst
Urban Ecosyst
result of noise or visual obstruction, we sampled the urban bird community by means ofsystematic and standardized walks. These walks lasted 30 min and covered an area of 250×250 m (about 6 ha; Caula et al. 2008). We surveyed a total of 27 plots distributed across thefive types of urban landscape units according to the proportion of each type: four in Uhigh,seven in Umed, seven in Ulow, five in Uwood and four in Ucrop.
The non-urban bird communitywas sampled by C. Sirami in each of the three habitattypes (OPEN habitats and WOODlands in 2003; and CROPlands in 2004). Sirami used20 min point counts with unlimited distance, corresponding to an area of at least 3 ha(Sirami et al. 2007). Twenty seven point-counts were sampled in each of the three non-urban habitats.
In order to obtain comparable sampling effort per census plot in urban and non-urban sites we excluded the 10 last minutes of each of the urban plots and obtained20 min counts that covered approximately 4 ha. As a result, the number of census plotsfrom the overall urban landscape was equivalent to the number of census plots in eachof the three non-urban habitats. But the sample size in the different urban landscapeunits was only the quarter of the sample size in each of the three non-urban habitats.We used presence-absence data in order to reduce biases involved by the differencein sampling methods. Raptors, aerial feeders (swallows, swifts and bee-eaters) andcrepuscular species were excluded from the analysis because the methods used were notappropriate to assess their presence. Species observed only once were also excludedfrom the analyses.
Data analysis
We compared overall species richness in the urban landscape (27 census plots) with thespecies richness found in the three non-urban habitats (27×3 = 81 census plots). Within theurban landscape, we compared the variation in species richness among the five types ofurban landscape units. We calculated corrected estimates of species richness with theCOMDYN software (Hines et al. 1999). COMDYN accounts for heterogeneity in speciesdetectability using the jackknife estimator.
We used the Sorensen similarity index to compare beta diversity (species turnover fromplot to plot) within the urban landscape and the non-urban habitats. The Sorensen similarityindex is defined as: Sij = 2a/(2a + b + c) where “a” is the number of species in both censusplots “i” and “j”; “b” and “c” are the numbers of species unique respectively to census plots“i” and “j”. The index varies between 0 and 1. The higher its value, the more similar thecensus plots compared. We calculated this index for all possible pairs of census plotswithin the urban landscape and within each one of the non-urban. We calculated theaverage similarity indices for the urban landscape and the non-urban habitats. We usedan ANOVA to statistically compare these averages. In order to test whether census plotsspatially closer were likely to have more similar bird communities (spatial autocorre-lation), we conducted a Mantel test (Mantel 1967) within the urban landscape and each
Fig. 1 Location of study areas in the basin Mediterranean and localizations of sampling units in: urban(5,700 ha) and non-urban habitats, (5,600 ha). In the urban area we defined five types of urban landscapesaccording to the percentage of built surface and land uses: (1) densely build downtown (Uhigh D1-D4;building density >45%); suburban landscape (a mix of residential (R), industrial (I) and multipurpose (M)neighborhoods) with (2) medium building density (Umed, R1-R5, I1-I2; building density 20–45%) or with(3) low building density (Ulow, R6-R10, M1-M2 ; building density <20%); (4) urban woodlands and parks(Uwood, W1-W5) and (5) remnant vineyards and other crops (Ucrop, C1-C4) embedded in the urbanlandscape
�
Urban Ecosyst
one of the non-urban habitats. We also compared averages in Sorensen indices among thefive types of urban landscape units and between urban woodland units and non-urbanwoodland habitats as well as between urban cropland units and non-urban croplandhabitats using Kruskal–Wallis tests.
To compare species composition between the urban landscape and the non-urbanhabitats, we calculated for each species the number of census plots where the species wasrecorded. We used the species specialization index (SSI) proposed by Julliard et al. (2006)to assess species distribution with respect to their degree of specialization. This indexestimates the level of habitat specialization of a species as the coefficient of variation (SD/mean) of its densities across 18 habitat classes based on information collected by observersat each point count of the FBBS (French Breeding Bird Survey). The higher its values, themore specialised a species and the lower its value the more generalist a species. Wecalculated the correlation between species occurrence in the urban landscape and SSI. Weused log-transformed values of SSI as it produces a more gradual variation of specializationindices among species.
Finally, we used a Correspondence Analysis to compare bird community compositionbetween the 108 census plots (27x4) (CANOCO Version 4.52, 2003).
Results
Species richness
A total of 41 species were recorded in the 108 census plots (Table 1). Twenty two of themwere present in the urban landscape. Of the nineteen species that were recorded exclusivelyin the non-urban landscape, 10 were actually observed in Montpellier during the 2004–2005 period but were not recorded during the actual counts done for the present study(Caula et al. 2008).
Estimated species richness was intermediate in the urban landscape (27, SE 3.20) whencompared to the values estimated for the three non-urban habitats. It was highest in non-urban cropland (36, SE 4.10) and open habitat (35, SE 3.80) and lowest in the non-urbanwoodland (19, SE 2.50) (Fig. 2).
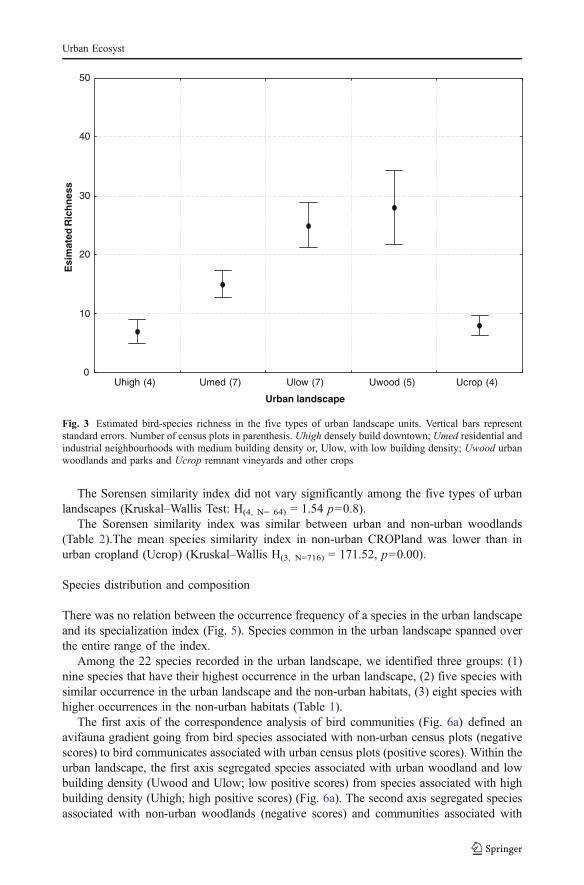
Within the five types of urban landscape units, estimated species richness was highest inthe urban woodlands (28, SE 5.30 and lowest in the urban croplands (8, SE 1.65) (Fig. 3).In the remainder of the urban landscape units (Ulow, Umed and Uhigh) estimated speciesrichness decreased with building density. Estimated species richness from the urbanlandscape units with low building density (Ulow) was comparable to the values observed inurban woodlands.
Similarity indexes
The geographical distance between census plots had no significant effect on similaritiesbetween bird communities (p-values mantel test respectively p=0.421; p=0.179; p=0.191and p=0.568 for open habitats, woodlands, croplands and urban landscape).
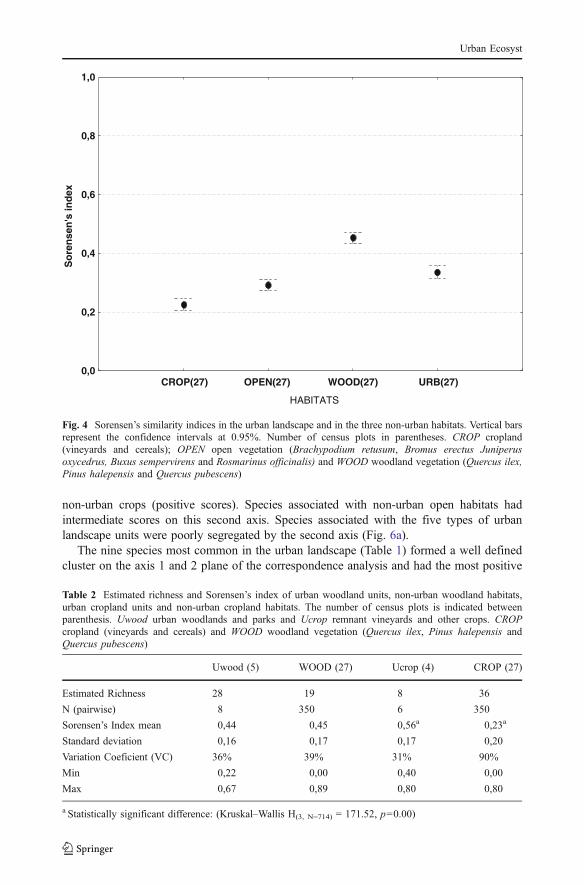
The Sorensen similarity index was highest in the non-urban woodland (0.45 SE 0.17)and lowest in non-urban cropland (0.22 SE 0.20) (Fig. 4). Urban landscape (0.34 SE 0.21)and non-urban open habitat (0.30 SE 0.18) had intermediate similarity index. Thedifferences among the samples were all statistically significant (ANOVA, F(3, 1455) = 36.8,p<0.05).
Urban Ecosyst
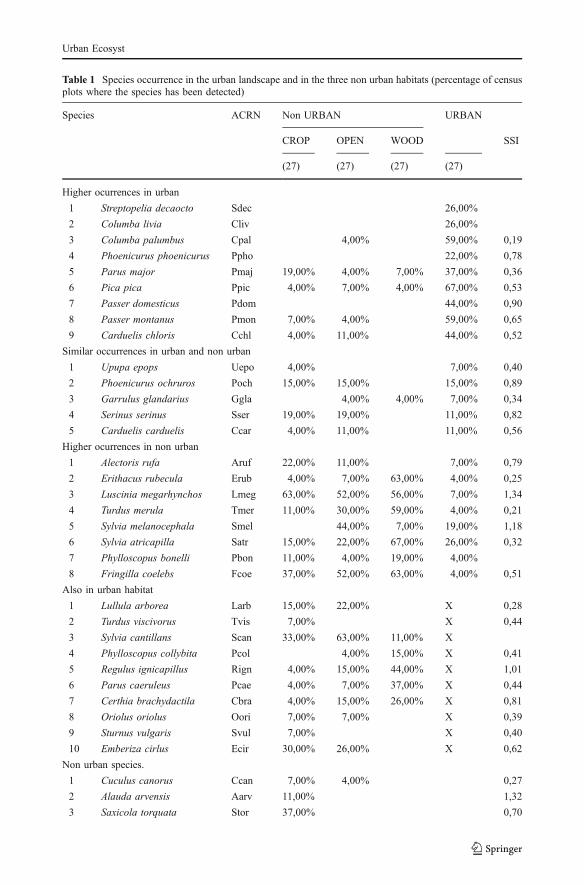
Table 1 Species occurrence in the urban landscape and in the three non urban habitats (percentage of censusplots where the species has been detected)
Species ACRN Non URBAN URBAN
CROP OPEN WOOD SSI
(27) (27) (27) (27)
Higher ocurrences in urban
1 Streptopelia decaocto Sdec 26,00%
2 Columba livia Cliv 26,00%
3 Columba palumbus Cpal 4,00% 59,00% 0,19
4 Phoenicurus phoenicurus Ppho 22,00% 0,78
5 Parus major Pmaj 19,00% 4,00% 7,00% 37,00% 0,36
6 Pica pica Ppic 4,00% 7,00% 4,00% 67,00% 0,53
7 Passer domesticus Pdom 44,00% 0,90
8 Passer montanus Pmon 7,00% 4,00% 59,00% 0,65
9 Carduelis chloris Cchl 4,00% 11,00% 44,00% 0,52
Similar occurrences in urban and non urban
1 Upupa epops Uepo 4,00% 7,00% 0,40
2 Phoenicurus ochruros Poch 15,00% 15,00% 15,00% 0,89
3 Garrulus glandarius Ggla 4,00% 4,00% 7,00% 0,34
4 Serinus serinus Sser 19,00% 19,00% 11,00% 0,82
5 Carduelis carduelis Ccar 4,00% 11,00% 11,00% 0,56
Higher ocurrences in non urban
1 Alectoris rufa Aruf 22,00% 11,00% 7,00% 0,79
2 Erithacus rubecula Erub 4,00% 7,00% 63,00% 4,00% 0,25
3 Luscinia megarhynchos Lmeg 63,00% 52,00% 56,00% 7,00% 1,34
4 Turdus merula Tmer 11,00% 30,00% 59,00% 4,00% 0,21
5 Sylvia melanocephala Smel 44,00% 7,00% 19,00% 1,18
6 Sylvia atricapilla Satr 15,00% 22,00% 67,00% 26,00% 0,32
7 Phylloscopus bonelli Pbon 11,00% 4,00% 19,00% 4,00%
8 Fringilla coelebs Fcoe 37,00% 52,00% 63,00% 4,00% 0,51
Also in urban habitat
1 Lullula arborea Larb 15,00% 22,00% X 0,28
2 Turdus viscivorus Tvis 7,00% X 0,44
3 Sylvia cantillans Scan 33,00% 63,00% 11,00% X
4 Phylloscopus collybita Pcol 4,00% 15,00% X 0,41
5 Regulus ignicapillus Rign 4,00% 15,00% 44,00% X 1,01
6 Parus caeruleus Pcae 4,00% 7,00% 37,00% X 0,44
7 Certhia brachydactila Cbra 4,00% 15,00% 26,00% X 0,81
8 Oriolus oriolus Oori 7,00% 7,00% X 0,39
9 Sturnus vulgaris Svul 7,00% X 0,40
10 Emberiza cirlus Ecir 30,00% 26,00% X 0,62
Non urban species.
1 Cuculus canorus Ccan 7,00% 4,00% 0,27
2 Alauda arvensis Aarv 11,00% 1,32
3 Saxicola torquata Stor 37,00% 0,70
Urban Ecosyst
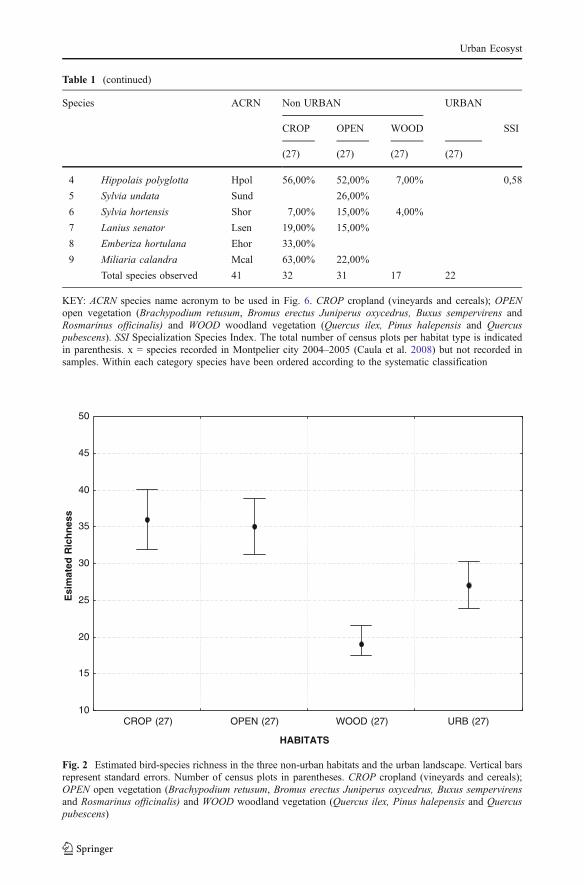
Table 1 (continued)
Species ACRN Non URBAN URBAN
CROP OPEN WOOD SSI
(27) (27) (27) (27)
4 Hippolais polyglotta Hpol 56,00% 52,00% 7,00% 0,58
5 Sylvia undata Sund 26,00%
6 Sylvia hortensis Shor 7,00% 15,00% 4,00%
7 Lanius senator Lsen 19,00% 15,00%
8 Emberiza hortulana Ehor 33,00%
9 Miliaria calandra Mcal 63,00% 22,00%
Total species observed 41 32 31 17 22
KEY: ACRN species name acronym to be used in Fig. 6. CROP cropland (vineyards and cereals); OPENopen vegetation (Brachypodium retusum, Bromus erectus Juniperus oxycedrus, Buxus sempervirens andRosmarinus officinalis) and WOOD woodland vegetation (Quercus ilex, Pinus halepensis and Quercuspubescens). SSI Specialization Species Index. The total number of census plots per habitat type is indicatedin parenthesis. x = species recorded in Montpelier city 2004–2005 (Caula et al. 2008) but not recorded insamples. Within each category species have been ordered according to the systematic classification
CROP (27) OPEN (27) WOOD (27) URB (27)
HABITATS
10
15
20
25
30
35
40
45
50
Esi
mat
ed R
ich
nes
s
Fig. 2 Estimated bird-species richness in the three non-urban habitats and the urban landscape. Vertical barsrepresent standard errors. Number of census plots in parentheses. CROP cropland (vineyards and cereals);OPEN open vegetation (Brachypodium retusum, Bromus erectus Juniperus oxycedrus, Buxus sempervirensand Rosmarinus officinalis) and WOOD woodland vegetation (Quercus ilex, Pinus halepensis and Quercuspubescens)
Urban Ecosyst
The Sorensen similarity index did not vary significantly among the five types of urbanlandscapes (Kruskal–Wallis Test: H(4, N= 64) = 1.54 p=0.8).
The Sorensen similarity index was similar between urban and non-urban woodlands(Table 2).The mean species similarity index in non-urban CROPland was lower than inurban cropland (Ucrop) (Kruskal–Wallis H(3, N=716) = 171.52, p=0.00).
Species distribution and composition
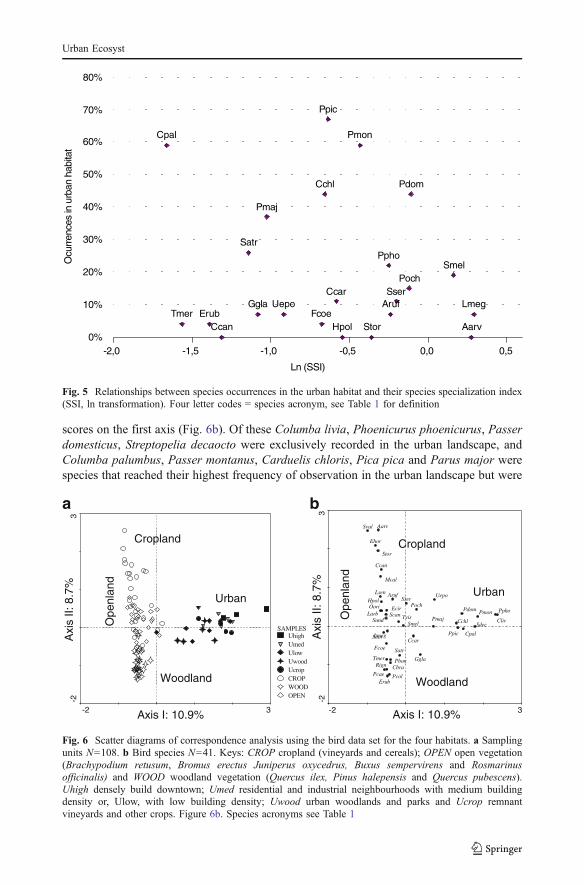
There was no relation between the occurrence frequency of a species in the urban landscapeand its specialization index (Fig. 5). Species common in the urban landscape spanned overthe entire range of the index.
Among the 22 species recorded in the urban landscape, we identified three groups: (1)nine species that have their highest occurrence in the urban landscape, (2) five species withsimilar occurrence in the urban landscape and the non-urban habitats, (3) eight species withhigher occurrences in the non-urban habitats (Table 1).
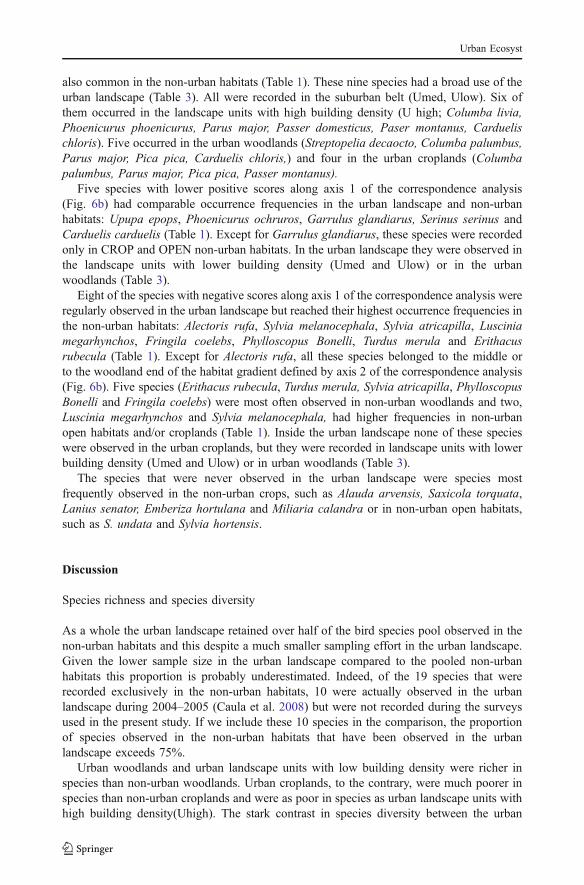
The first axis of the correspondence analysis of bird communities (Fig. 6a) defined anavifauna gradient going from bird species associated with non-urban census plots (negativescores) to bird communicates associated with urban census plots (positive scores). Within theurban landscape, the first axis segregated species associated with urban woodland and lowbuilding density (Uwood and Ulow; low positive scores) from species associated with highbuilding density (Uhigh; high positive scores) (Fig. 6a). The second axis segregated speciesassociated with non-urban woodlands (negative scores) and communities associated with
Uhigh (4) Umed (7) Ulow (7) Uwood (5) Ucrop (4)
Urban landscape
0
10
20
30
40
50E
sim
ated
Ric
hn
ess
Fig. 3 Estimated bird-species richness in the five types of urban landscape units. Vertical bars representstandard errors. Number of census plots in parenthesis. Uhigh densely build downtown; Umed residential andindustrial neighbourhoods with medium building density or, Ulow, with low building density; Uwood urbanwoodlands and parks and Ucrop remnant vineyards and other crops
Urban Ecosyst
non-urban crops (positive scores). Species associated with non-urban open habitats hadintermediate scores on this second axis. Species associated with the five types of urbanlandscape units were poorly segregated by the second axis (Fig. 6a).
The nine species most common in the urban landscape (Table 1) formed a well definedcluster on the axis 1 and 2 plane of the correspondence analysis and had the most positive
CROP(27) OPEN(27) WOOD(27) URB(27)
HABITATS
0,0
0,2
0,4
0,6
0,8
1,0S
ore
nse
n's
ind
ex
Fig. 4 Sorensen’s similarity indices in the urban landscape and in the three non-urban habitats. Vertical barsrepresent the confidence intervals at 0.95%. Number of census plots in parentheses. CROP cropland(vineyards and cereals); OPEN open vegetation (Brachypodium retusum, Bromus erectus Juniperusoxycedrus, Buxus sempervirens and Rosmarinus officinalis) and WOOD woodland vegetation (Quercus ilex,Pinus halepensis and Quercus pubescens)
Table 2 Estimated richness and Sorensen’s index of urban woodland units, non-urban woodland habitats,urban cropland units and non-urban cropland habitats. The number of census plots is indicated betweenparenthesis. Uwood urban woodlands and parks and Ucrop remnant vineyards and other crops. CROPcropland (vineyards and cereals) and WOOD woodland vegetation (Quercus ilex, Pinus halepensis andQuercus pubescens)
Uwood (5) WOOD (27) Ucrop (4) CROP (27)
Estimated Richness 28 19 8 36
N (pairwise) 8 350 6 350
Sorensen’s Index mean 0,44 0,45 0,56a 0,23a
Standard deviation 0,16 0,17 0,17 0,20
Variation Coeficient (VC) 36% 39% 31% 90%
Min 0,22 0,00 0,40 0,00
Max 0,67 0,89 0,80 0,80
a Statistically significant difference: (Kruskal–Wallis H(3, N=714) = 171.52, p=0.00)
Urban Ecosyst
scores on the first axis (Fig. 6b). Of these Columba livia, Phoenicurus phoenicurus, Passerdomesticus, Streptopelia decaocto were exclusively recorded in the urban landscape, andColumba palumbus, Passer montanus, Carduelis chloris, Pica pica and Parus major werespecies that reached their highest frequency of observation in the urban landscape but were
-2 3
-23
SAMPLESUhighUmedUlowUwoodUcropCROPWOODOPEN
Urban
Ope
nlan
d
Cropland
Woodland
Axis I: 10.9%
Axi
s II:
8.7
%
-2 3
-23
Lmeg
Fcoe Satr
Hpol
Scan
Tmer
Mcal
Ppic
Erub
Cchl
Cpal
Pmaj
Rign
Ecir
Smel
Pcae
Sser
Cbra
PmonPoch
Aruf
Larb
Stor
Ehor
Lsen
Pbon
Ccar
ClivSdec
Shor
Sund
Ppho
Pcol
Ggla
Oori
Aarv
Ccan
Pdom
Uepo
Svul
Tvis
Axi
s II:
8.7
%
Axis I: 10.9%
Ope
nlan
d
Cropland
Urban
Woodland
a b
Fig. 6 Scatter diagrams of correspondence analysis using the bird data set for the four habitats. a Samplingunits N=108. b Bird species N=41. Keys: CROP cropland (vineyards and cereals); OPEN open vegetation(Brachypodium retusum, Bromus erectus Juniperus oxycedrus, Buxus sempervirens and Rosmarinusofficinalis) and WOOD woodland vegetation (Quercus ilex, Pinus halepensis and Quercus pubescens).Uhigh densely build downtown; Umed residential and industrial neighbourhoods with medium buildingdensity or, Ulow, with low building density; Uwood urban woodlands and parks and Ucrop remnantvineyards and other crops. Figure 6b. Species acronyms see Table 1
-2,0 -1,5 -1,0 -0,5 0,0 0,50%
10%
20%
30%
40%
50%
60%
70%
80%
Ppic
Cpal Pmon
PdomCchl
Pmaj
SatrPpho
SmelPoch
SserCcarLmegArufUepoGgla
FcoeErubTmerStor AarvCcan Hpol
Ln (SSI)
Ocu
rren
ces
in u
rban
hab
itat
Fig. 5 Relationships between species occurrences in the urban habitat and their species specialization index(SSI, ln transformation). Four letter codes = species acronym, see Table 1 for definition
Urban Ecosyst
also common in the non-urban habitats (Table 1). These nine species had a broad use of theurban landscape (Table 3). All were recorded in the suburban belt (Umed, Ulow). Six ofthem occurred in the landscape units with high building density (U high; Columba livia,Phoenicurus phoenicurus, Parus major, Passer domesticus, Paser montanus, Carduelischloris). Five occurred in the urban woodlands (Streptopelia decaocto, Columba palumbus,Parus major, Pica pica, Carduelis chloris,) and four in the urban croplands (Columbapalumbus, Parus major, Pica pica, Passer montanus).
Five species with lower positive scores along axis 1 of the correspondence analysis(Fig. 6b) had comparable occurrence frequencies in the urban landscape and non-urbanhabitats: Upupa epops, Phoenicurus ochruros, Garrulus glandiarus, Serinus serinus andCarduelis carduelis (Table 1). Except for Garrulus glandiarus, these species were recordedonly in CROP and OPEN non-urban habitats. In the urban landscape they were observed inthe landscape units with lower building density (Umed and Ulow) or in the urbanwoodlands (Table 3).
Eight of the species with negative scores along axis 1 of the correspondence analysis wereregularly observed in the urban landscape but reached their highest occurrence frequencies inthe non-urban habitats: Alectoris rufa, Sylvia melanocephala, Sylvia atricapilla, Lusciniamegarhynchos, Fringila coelebs, Phylloscopus Bonelli, Turdus merula and Erithacusrubecula (Table 1). Except for Alectoris rufa, all these species belonged to the middle orto the woodland end of the habitat gradient defined by axis 2 of the correspondence analysis(Fig. 6b). Five species (Erithacus rubecula, Turdus merula, Sylvia atricapilla, PhylloscopusBonelli and Fringila coelebs) were most often observed in non-urban woodlands and two,Luscinia megarhynchos and Sylvia melanocephala, had higher frequencies in non-urbanopen habitats and/or croplands (Table 1). Inside the urban landscape none of these specieswere observed in the urban croplands, but they were recorded in landscape units with lowerbuilding density (Umed and Ulow) or in urban woodlands (Table 3).
The species that were never observed in the urban landscape were species mostfrequently observed in the non-urban crops, such as Alauda arvensis, Saxicola torquata,Lanius senator, Emberiza hortulana and Miliaria calandra or in non-urban open habitats,such as S. undata and Sylvia hortensis.
Discussion
Species richness and species diversity
As a whole the urban landscape retained over half of the bird species pool observed in thenon-urban habitats and this despite a much smaller sampling effort in the urban landscape.Given the lower sample size in the urban landscape compared to the pooled non-urbanhabitats this proportion is probably underestimated. Indeed, of the 19 species that wererecorded exclusively in the non-urban habitats, 10 were actually observed in the urbanlandscape during 2004–2005 (Caula et al. 2008) but were not recorded during the surveysused in the present study. If we include these 10 species in the comparison, the proportionof species observed in the non-urban habitats that have been observed in the urbanlandscape exceeds 75%.
Urban woodlands and urban landscape units with low building density were richer inspecies than non-urban woodlands. Urban croplands, to the contrary, were much poorer inspecies than non-urban croplands and were as poor in species as urban landscape units withhigh building density(Uhigh). The stark contrast in species diversity between the urban
Urban Ecosyst
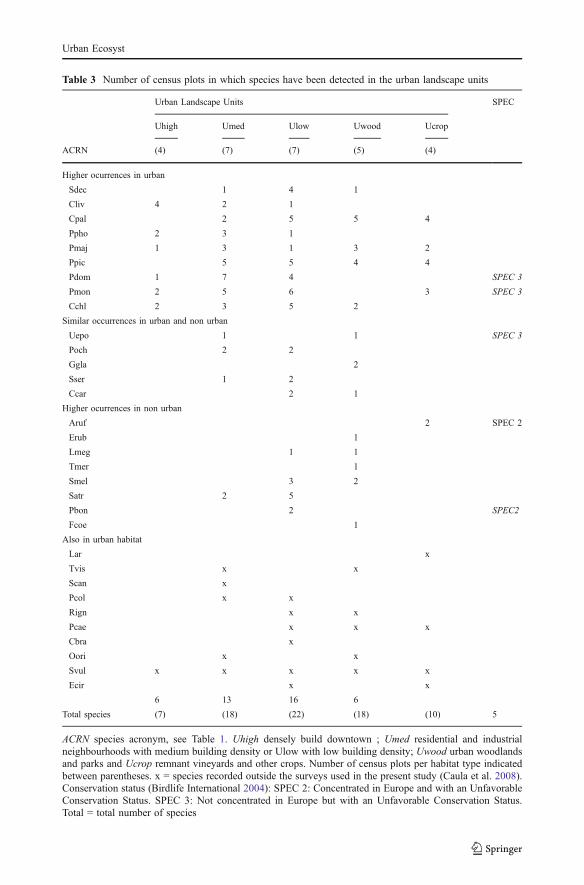
Table 3 Number of census plots in which species have been detected in the urban landscape units
Urban Landscape Units SPEC
Uhigh Umed Ulow Uwood Ucrop
ACRN (4) (7) (7) (5) (4)
Higher ocurrences in urban
Sdec 1 4 1
Cliv 4 2 1
Cpal 2 5 5 4
Ppho 2 3 1
Pmaj 1 3 1 3 2
Ppic 5 5 4 4
Pdom 1 7 4 SPEC 3
Pmon 2 5 6 3 SPEC 3
Cchl 2 3 5 2
Similar occurrences in urban and non urban
Uepo 1 1 SPEC 3
Poch 2 2
Ggla 2
Sser 1 2
Ccar 2 1
Higher ocurrences in non urban
Aruf 2 SPEC 2
Erub 1
Lmeg 1 1
Tmer 1
Smel 3 2
Satr 2 5
Pbon 2 SPEC2
Fcoe 1
Also in urban habitat
Lar x
Tvis x x
Scan x
Pcol x x
Rign x x
Pcae x x x
Cbra x
Oori x x
Svul x x x x x
Ecir x x
6 13 16 6
Total species (7) (18) (22) (18) (10) 5
ACRN species acronym, see Table 1. Uhigh densely build downtown ; Umed residential and industrialneighbourhoods with medium building density or Ulow with low building density; Uwood urban woodlandsand parks and Ucrop remnant vineyards and other crops. Number of census plots per habitat type indicatedbetween parentheses. x = species recorded outside the surveys used in the present study (Caula et al. 2008).Conservation status (Birdlife International 2004): SPEC 2: Concentrated in Europe and with an UnfavorableConservation Status. SPEC 3: Not concentrated in Europe but with an Unfavorable Conservation Status.Total = total number of species
Urban Ecosyst
cropland and open habitat and the non-urban cropland and open habitats can only be partlyexplained by the major difference in sample size (Tables 1 and 3). Overall, of the 5 speciesrecorded in the urban cropland and open habitat, only one can actually be considered as anopen habitat specialist (Alectoris rufa) (Table 3). This contrasts with the non-urbancropland and open habitat, from which a least three of the most common open habitat andcropland specialists such as Milaria calandra, Emberiza hortulana, and Saxicola torquatawould have been expected based on their frequency of observation in the non-urbanhabitats, as well as edge and shrubland species such as Emberiza cirlus, Hippolaispolyglotta, Sylvia cantillans and Luscinia megarhynchos, or woodland species such as Parusmajor (Table 1).
Beta diversity (based on Sorensen’s index) in the urban landscape was intermediate betweenthe highest beta diversity, recorded for non-urban cropland and non-urban open habitats, andthe lowest value which was observed for the non-urban woodlands. Given the landscapeheterogeneity found within our urban landscape the relatively high species similarity (low betadiversity) in the urban landscape suggests that many of the species present in the urbanlandscape were likely to be observed in most of the urban plots. At the other extreme, the lowsimilarity index (high beta diversity) found in the species rich non-urban croplands suggeststhat many species occurred only in a limited number of plots in this habitat.
Species composition
Overall we did not disclose a relationship between species occurrence frequency in theurban landscape and their degree of specialisation. Our urban landscape seemed to be ableto accommodate even species with relatively narrow ecological requirements.
The urban specialists set aside, the species with higher or similar occurrence frequenciesin the urban landscape were a mix of generalist and more specialized species mostly tied tonon-urban crops or open habitats.
The species commonly observed in the urban landscape, but with lower frequencies thanin the non-urban habitats, were mostly species tied to natural woodlands. These speciesmade use of the urban areas where woody vegetation was most prevalent (presence ofgardens). On average they were more specialized, and included species with a marked linkto woodlands such as Turdus merula or Sylvia atricapilla or to shrublands such as Sylviamelanocephala or Luscinia megarhynchos.
The species missing in the urban landscape were cropland and open habitat specialists.These species were even lacking from the urban croplands, despite the relative large size ofthese habitat patches (120–180 ha). The closer examination of the observed speciescomposition of urban and non-urban cropland and open habitats (CROP and Ucrop,Tables 1 and 3) suggests, despite a marked difference in sample size, that part of the paucityin species in the urban cropland and open habitat (Ucrop) could be caused by a moreintensive use by agriculture resulting in a less diverse landscape. This interpretation isconsistent with the higher similarity index observed for the urban cropland and open habitatwhen compared to the non-urban.
Thus, the species that seem to be eliminated by urbanisation are the same open-habitatand cropland specialists that are negatively affected by agricultural abandonment in thenon-urban areas (Preiss et al. 1997, Sirami et al. 2007; see also Gregory et al. 2005; Donaldet al. 2006). This agrees with results from Filippi-Codaccioni et al (2008) who found thatfarmland specialists decreased progressively in the event of landscape perturbation by urbandevelopment. Non-farmland birds, to the contrary were able to colonize urban areasprogressively as time since perturbation was increasing.
Urban Ecosyst
Species distribution within the urban landscape
In consistency with previous studies (see Blair 1996; Haddidian et al. 1997, Clergeau et al.1998; Sandstörm et al. 2006), the distribution of the avifauna within the urban landscapereflected variations in the structure of the urban landscape. Avian diversity was lowest in thedensely built-up areas (historical city core) and significantly higher in the well vegetatedbuilt-up areas (Ulow). The presence of urban woodlands “supplemented” (sensu Andrén et al.1997) this “residential” landscape by providing additional habitats for woodland specialistsand probably enabled them to spill over into the residential areas (e.g. Garrulus glandarius,pers. obs.). The latter may be especially important for species such as raptors (e.g. Strix alucoor Accipiter nisus) that were not part of this study but were regularly observed (pers. obs).
Similarly, the high species richness observed in the urban woodlands partly resulted ofthe spill over of generalist species into the woodland habitat. Some species found in thewell vegetated residential areas (e.g. Columba palumbus) were more abundant in theseurban landscape units than in the non-urban woodland habitats.
The multivariate analyses disclosed a well defined contrast in species composition anddistribution within the non-urban habitats and the urban landscape respectively (Fig. 6). Thenon urban habitats were ordered along a clear cropland—open habitat—woodland gradient(Fig. 6a) that reflected a well defined bird species gradient (Fig. 6b). Along this gradientbird species were ranked according to the habitat preferences usually associated to them,going from well identified open habitat species associated to the positive scores along axis 2of Fig. 6b, to well identified forest species associated to the negative scores of the sameaxis.
The urban plots, to the contrary, were poorly segregated (axis 1, Fig. 6a). This is alsoreflected by the ordering of the species associated on Fig. 6b to these urban plots (specieswith positive scores on axis 1). These species are a mix of species usually associated todifferent wooded or more open habitats. Their ranking along axis 1 does not reflect thishabitat preference. We interpret this as the consequence of the fine grained heterogeneity ofthe urban landscape that allows species with different requirements to accommodate theirneeds within the same section of the urban environment. The urban bird community cantherefore be seen as an assemblage of species that has no equivalent in natural or semi-natural surroundings. What this implies in terms of adjustments and novelty in speciesinteractions remains to be discovered.
Urban avifauna and avian conservation
Among the species we identified as common in the urban landscape, Alectoris rufa, Upupaepops, Phylloscopus bonelli, Passer domesticus and Passer montanus, had an unfavorableconservation status in 2004 in the EU and a 2004 SPEC category that scored between 2 and3 (Birdlife International 2004).
These few examples suggest that, despite the negative effects urbanization can have onbird diversity (Jokimäki and Kaisanlahti-Jokimäki 2003), we should not see urban areas asa lost cause that has no potential for species of conservation concerns. Based on ourexample, cities can provide habitats for declining species. This should encourage us tobetter understand and identify ways to increase the carrying capacity of our towns andsuburbs for wildlife, including the species that are in most need of protection.
On the debit side, the urban landscape we studied was unfavourable to open habitatspecialists such as Saxicola torquata, Alauda arvensis, Hippolais polyglotta, Miliariacalandra, Lanius senator or Sylvia undata, even in landscape units including potential
Urban Ecosyst
favourable patches. All these species are currently in decline in Mediterranean natural andsemi-natural landscapes (Sirami et al. 2007). The possibility to manage some of the areaswithin the broader urban landscape in order to accommodate some of these species remainsan uncharted territory.
Finally, it should be emphasized that these results were based on presence data with noinformation on reproductive success in the urban and non-urban bird communities. Finalconfirmation of the value of the urban habitat for its bird species will therefore depend onour ability to document their reproductive success and to verify that the urban areas do notwork as ecological sinks for some or all of these species.
Acknowledgments Sabina Caula’s doctoral research was funded by FUDAYACUCHO scholarship credit,Venezuela (Contract N°E-211-87-2001-1). The authors thank the anonymous referees for their constructivesuggestions.
References
Andrén H, Delin A, Seiler A (1997) Population response to landscape changes depends on specialization todifferent landscape elements. Oikos 80(1):193–196. doi:10.2307/3546534
Alberti M, Botsford E, Alex C (2001) Quantify the urban gradient: linking urban planning and ecology. In:Marzluff JM, Bowman R, Donnelly R (eds) Avian ecology and conservation in an urbanizing world.Kluwer Academic, Boston, pp 19–47
Birdlife International (2004) Birdlife in the European Union: a status assessment. Wageningen, the NetherlandsBlair RB (1996) Land-usage and avian species diversity along an urban gradient. Ecol Appl 6:506–519.
doi:10.2307/2269387Bland RL, Tully J, Greenwood JJD (2004) Birds breeding in British gardens: an underestimated population?
Bird Study 2:97–106Cannon AR, Chamberlain DE, Toms MP, Hatchwell BJ, Gaston KJ (2005) Trends in the use of private
gardens by wild birds in Great Britain 1995–2002. J Appl Ecol 42(4):659–671. doi:10.1111/j.1365-2664.2005.01050.x
Caula S (2007) L’usage de l’avifaune comme indicateur écologique et socio-économique dans l’espaceurbain. Doctoral These, Université de Montpellier II, France
Caula S, Marty P, Martin JL (2008) Seasonal variation in species composition of an urban bird community inMediterranean France. Landsc Urban Plan 87:1–9. doi:10.1016/j.landurbplan.2008.03.006
Clergeau P, Savard JPL, Mennechez G, Falardeau G (1998) Bird abundance and diversity along an urban–rural gradient: a comparative study between two cities on different continents. Condor 100:413–425.doi:10.2307/1369707
Debussche M, Lepart J, Dervieux A (1999) Mediterranean landscape changes: evidences from old postcard.Glob Ecol Biogeogr 8(1):3–15. doi:10.1046/j.1365-2699.1999.00316.x
Donald PF et al (2006) Further evidence of continent-wide impacts of agricultural intensification onEuropean farmland birds, 1990–2000. Agric Ecosyst Environ 116:189–196. doi:10.1016/j.agee.2006.02.007
Farina A (1989) Bird community patterns in Mediterranean farmlands: a comment. Agric Ecosyst Environ27:177–181. doi:10.1016/0167-8809(89)90083-2
Falcucci A,Maiorano L, Boitani L (2007) Changes in land-use/land-cover patterns in Italy and their implicationsfor biodiversity conservation. Landscape Ecol 22(4):617–631. doi:10.1007/s10980-006-9056-4
Filippi-Codaccioni O, Devictor V, Clobert J, Julliard R (2008) Effects of age and intensity of urbanization onfarmland bird. Biol Conserv . doi:10.1016/j.biocon.2008.08.006
Gregory RD, van Strien A, Vorisek P, Gmeling Meyling AW, Noble DG, Foppen RPB, Gibbons DW (2005)Developing indicators for European birds. Philos Trans R Soc B 360:269–288. doi:10.1098/rstb.2004.1602
Haddidian J, Sauer J, Swarth C, Handly P, Droege S, Williams C, Huff J, Didden G (1997) A city-widebreeding bird survey for Washington, D.C. Urban Ecosyst 1:87–102. doi:10.1023/A:1018563125184
Hines JE, Boulinier T, Nichols JD, Sauer JR, Pollock KH (1999) COMDYN: software to study the dynamicsof animal communities using a capture- recapture approach. Bird Study 46(suppl):S209–S217
Urban Ecosyst
Jokimäki J, Kaisanlahti-Jokimäki ML (2003) Spatial similarity of urban bird communities: a multi-scaleapproach. J Biogeogr 30:1183–1193. doi:10.1046/j.1365-2699.2003.00896.x
Julliard R, Clavel J, Devictor V, Jiguet F, Couvet D (2006) Spatial segregation of specialists and generalistsin bird communities. Ecol Lett 9:1237–1244
Mantel N (1967) The detection of disease clustering and a generalized regression approach. Cancer Res27:209–220
McKinney M (2006) Urbanization as a major cause of biotic homogenization. Biol Conserv 127:247–260.doi:10.1016/j.biocon.2005.09.005
Myers N, Mittermeier RA, Mittermeier CG, Da Fonseca GAB, Kent J (2000) Biodiversity hotspots forconservation priorities. Nature 403:853–858. doi:10.1038/35002501
Preiss E, Matin JL, Debussche M (1997) Rural depopulation and recent landscape changes in a Mediterraneanregion: consequences to the breeding avifauna. Landscape Ecol 12(1):51–61. doi:10.1007/BF02698207
Sandstörm UG, Angelstam P, Mikusinski G (2006) Ecological diversity of birds in relation to the structure ofurban green space. Landsc Urban Plan 77:39–53. doi:10.1016/j.landurbplan.2005.01.004
Sirami C, Brotons L, Martin JL (2007) Vegetation and songbird response to land abandonment: fromlandscape to census-plot. Divers Distrib 13:42–52
Sorace A, Gustin M (2008) Homogenization processes and local effects on avifaunal composition in Italiantowns. Acta Oecol 33:15–26. doi:10.1016/j.actao.2007.07.003
Urban Ecosyst
Related Documents