Annual Review 2017 VALUE INTEGRATION SUSTAINABILITY

Welcome message from author
This document is posted to help you gain knowledge. Please leave a comment to let me know what you think about it! Share it to your friends and learn new things together.
Transcript
Annual Review 2017
VALUEINTEGRATIONSUSTAINABILITY

INTRODUCTION VALUE CREATION DRIVERS HOW WE CREATE VALUE HOW WE SUSTAIN VALUE FINANCIAL INFORMATION ADDITIONAL INFO
How We Sustain Value
Oper
atin
g En
viro
nmen
t
Competitive Advantages
KeyRelationships
Growth
Strategy
How We Sustain Value
Susta
inabil
ity
Integ
ratio
n Integration
Integ
ratio
n
Integ
ratio
n
Susta
inabil
ity
Sustainability
Susta
inabil
ity
How We Create Value
How We Create Value
PAGE10
PAGE68
PAGE 68
PAGE14
PAGE 26
PAGE 30
PAGE30
PAGE24
VALUE
Integrated Value Chain 34
Map of Operations 36
Our Business 38
Operational Excellence 65
SIBUR Performance Management System 68
Production System of SIBUR 68
Competitive Advantages 12
Growth Strategy 16
Key Relationships 26
Operating Environment 28
Chairmen Letters 06
02
SIBU
R AN
NUA
L RE
VIEW
SIBUR Annual Review 2017 https://www.sibur.ru/en/
INTRODUCTION VALUE CREATION DRIVERS HOW WE CREATE VALUE HOW WE SUSTAIN VALUE FINANCIAL INFORMATION ADDITIONAL INFO
VALUEINTEGRATION
SUSTAINABILITYSIBUR 2017
Annual Review
Abbreviations And Units 112
Nameplate Capacity and Production Capacity Utilisation Rates
114
Disclaimer 114
Contact Information 115
Sustainability 72
Corporate Governance 82
Risk Management 106
03
SIBU
R AN
NUA
L RE
VIEW
SIBURAnnual Review 2017https://www.sibur.ru/en/
04
SIBU
R AT
A G
LAN
CE
SIBUR Annual Review 2017 https://www.sibur.ru/en/
INTRODUCTION VALUE CREATION DRIVERS HOW WE CREATE VALUE HOW WE SUSTAIN VALUE FINANCIAL INFORMATION ADDITIONAL INFO
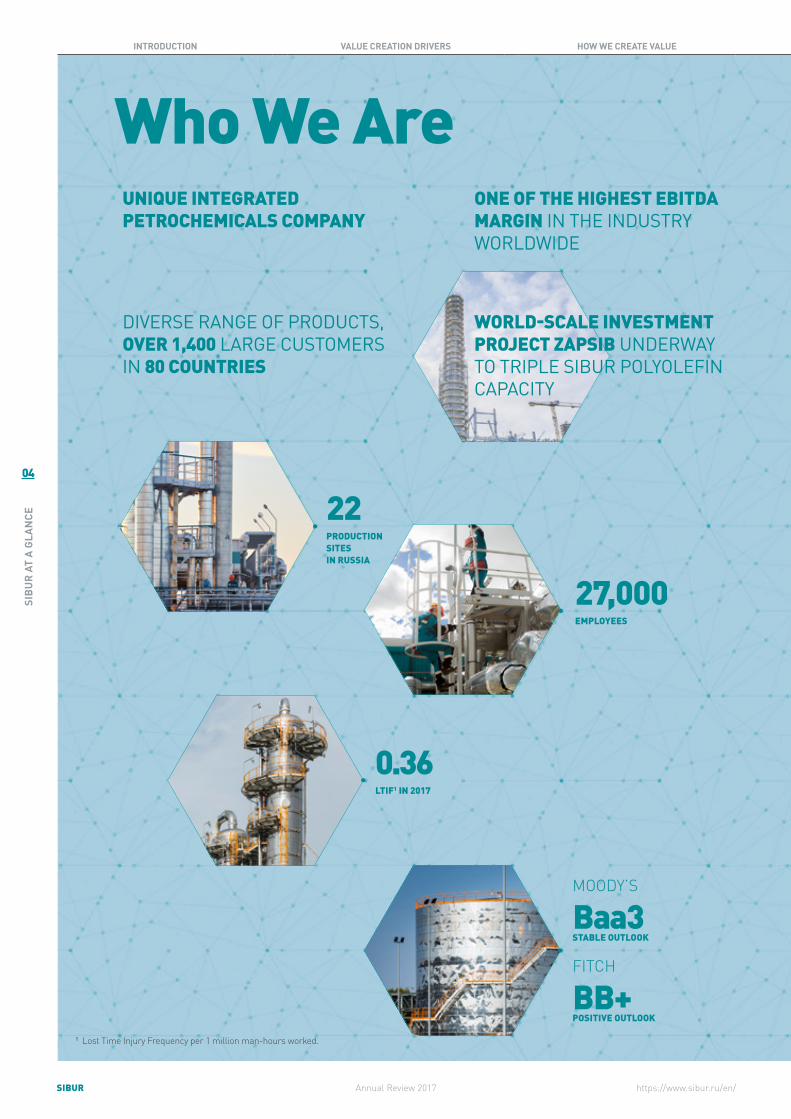
Who We Are
22PRODUCTION SITES IN RUSSIA
27,000EMPLOYEES
0.36LTIF1 IN 2017
MOODY’S
Baa3 STABLE OUTLOOK
FITCH
BB+ POSITIVE OUTLOOK
UNIQUE INTEGRATED PETROCHEMICALS COMPANY
ONE OF THE HIGHEST EBITDA MARGIN IN THE INDUSTRY WORLDWIDE
DIVERSE RANGE OF PRODUCTS, OVER 1,400 LARGE CUSTOMERS IN 80 COUNTRIES
1 Lost Time Injury Frequency per 1 million man-hours worked.
WORLD-SCALE INVESTMENT PROJECT ZAPSIB UNDERWAY TO TRIPLE SIBUR POLYOLEFIN CAPACITY

05
SIBU
R AT
A G
LAN
CE
SIBURAnnual Review 2017https://www.sibur.ru/en/
INTRODUCTION VALUE CREATION DRIVERS HOW WE CREATE VALUE HOW WE SUSTAIN VALUE FINANCIAL INFORMATION ADDITIONAL INFO
Gross revenue, RR bln EBITDA, RR blnEBITDA margin, %Net debt/ EBITDA, RR
FINANCIAL PERFORMANCE
Russia EuropeAsiaCIS
Other
Feedstock & EnergyPlastics, Elastomers & IntermediatesOlefins & PolyolefinsOther
SALES
2 Polypropylene and polyethylene. 3 Plastics include PET, glycols, EPS, alcohols, acrylates; Elastomers include commodity and specialty rubbers
and thermoplastic elastomers. 4 Adjusted for the estimated value of naphtha trading operations via Ust-Luga, ceased in 2015.
Feedstock & Energy segment leverages our access to hydrocarbons in Western Siberia. Following fractionation capacity expansion at our flagship Tobolsk site, we achieved all-time high processing and production volumes in 2017 and EBITDA margin of 39% for this segment.
We have more than doubled Olefins & Polyolefins production since 2013. In 2017, segment EBITDA margin was 40% – and 55% at our newest polymer production site in Tobolsk. The value creation potential of this segment supports the investment case for the ZapSib strategic project as SIBUR’s next leg of growth.
Plastics, Elastomers & Intermediates delivers EBITDA margins of around 20%, in line with the petrochemicals industry. SIBUR pursues selective opportunities for profitable growth in this segment mainly for customers in the domestic market.
RAW NGL FRACTIONATION VOLUMES, MLN TONNES
POLYOLEFINS PRODUCTION VOLUMES,2 ‘000 TONNES
PLASTICS AND ELASTOMERS PRODUCTION VOLUMES,3 ‘000 TONNES
19%
8%
32%
41%By Business Segments
6% 5% 1%
58%
30%By
Geography
PRODUCTION GROWTH AT OUR THREE INTEGRATED BUSINESS SEGMENTS
For further information visit our website:
https://www.sibur.ru/en/
2017
7.5
2013
5.3
2014
5.8
2015
6.6
2016
7.2
2017
1,378
2013
1,146
2014
1,130
2015
1,279
2016
1,344
2017
925
2013
403
2014
656
2015
764
2016
839
2016
412
140
34%
2015
380
103
36%4
2017
455
161
35%
2013
270
79
29%
2014
3194
79
32%
1.2x 1.7x 2.1x 2.0x 1.6x

https://www.sibur.ru/en/
06
INTR
ODUC
TION
Annual Review 2017SIBUR
INTRODUCTION VALUE CREATION DRIVERS HOW WE CREATE VALUE HOW WE SUSTAIN VALUE FINANCIAL INFORMATION ADDITIONAL INFO
This year our business model once again proved that SIBUR can thrive under different macroeconomic conditions and deliver strong, stable margins. SIBUR grew production and processing volumes to an all-time high and delivered low double-digit growth in our financial results in 2017.
Chairman of the Management Board
Strategically, we are a different company than we were even five years ago thanks to the surge in polyolefin production in Western Siberia. This has supported our profitability by helping us to balance swings in global energy and petrochemicals prices.
Construction of the ZapSibNeftekhim production at our flagship Tobolsk complex is on track for completion in 2019, positioning SIBUR for its next leg of growth and value creation. And with capital expenditures set to peak in the coming year, and significant deleveraging and debt refinancing in 2017 and early 2018, our balance sheet is strong.
DMITRY KONOV
Chairman of the Management Board

https://www.sibur.ru/en/
07
INTR
ODUC
TION
Annual Review 2017 SIBUR
INTRODUCTION VALUE CREATION DRIVERS HOW WE CREATE VALUE HOW WE SUSTAIN VALUE FINANCIAL INFORMATION ADDITIONAL INFO
OUR BUSINESS MODEL ONCE AGAIN THRIVED IN CHANGING MACRO CONDITIONS
The changed macro environment showed up in the segmental composition of SIBUR’s results. The outstanding performance of feedstock & energy was the major contributor to our overall growth in 2017, while performance of our petrochemicals business was relatively stable. SIBUR’s vertical integration acted once again as an internal hedge to counteract volatility in raw materials and end product markets. As a result, we delivered another strong year for the Company as a whole: Group total adjusted EBITDA increased by 13% to RR 169 billion, which translates into 30% growth in US dollars, while EBITDA margin rose slightly to 35% in 2017 from 34% a year earlier.
In 2017, the average price of Brent crude oil rebounded by 24% to $54 per barrel from $44 in 2016. Prices for LPG and naphtha increased even more – by 25% to 40% year-on-year. Petrochemical prices rose, too, but the increases were smaller. This resulted in tighter spreads between raw material input costs and selling prices, with consequent pressure on petrochemical profit margins. Russian exporters also contended with the effects of rouble appreciation, including a 13% rise versus the dollar, which created headwinds for rouble-reported revenues.
Looking back five years, the world has experienced drastic changes in macroeconomic conditions.
The average price of Brent crude oil fell by more than 60% from 2012 to 2016. Only in 2017 did the downward trend reverse, resulting in a robust year-on-year increase in oil prices. Throughout these swings, SIBUR has maintained superior profitability with a five-year average EBITDA margin of 33%.
These financial results validate our strategy to create a balanced, vertically integrated gas processing and petrochemicals business. While commodity pricing, currency movements and economic conditions are hard to predict, the performance of our business model is solidly in line with our expectations under various macro scenarios.

https://www.sibur.ru/en/
08
INTR
ODUC
TION
Annual Review 2017SIBUR
INTRODUCTION VALUE CREATION DRIVERS HOW WE CREATE VALUE HOW WE SUSTAIN VALUE FINANCIAL INFORMATION ADDITIONAL INFO
WE ARE MONETISING OUR FEEDSTOCK ADVANTAGE AND GROWING HIGHER MARGIN PRODUCTS
Olefins & Polyolefins offers high margins and the opportunity to further monetise SIBUR’s unique feedstock advantage, especially in Western Siberia. To demonstrate the superior dynamics of this business, this year for the first time we have broken out the profitability of polypropylene production at our flagship complex in Tobolsk: The EBITDA margin for polypropylene produced in Tobolsk was 55%, compared to 40% in total for the Olefins & Polyolefins segment. In 2017, we reached full capacity utilisation at this facility, which contributed strongly to an 11% increase in Group total polypropylene sales volumes.
Our ZapSib investment will enable SIBUR to ramp up to an additional 0.5 million tonnes of polypropylene and 1.5 million tonnes of polyethylene. The project was 70% complete at the end of 2017 and construction is targeted for completion in mid-2019.
That not only means 2 million more tonnes of higher margin production as ZapSib ramps up and launches commercial operations; it also represents a more profitable and less risky way to monetise large volumes of existing feedstock supplies that are sold at the moment in raw form or as lower margin fuels on the market.
This opportunity to move up the value chain by using abundant sources of Western Siberian feedstock makes growth in polyolefins uniquely attractive for SIBUR. In simple terms, we are at the moment leaving value on the table due to insufficient polyolefin capacity – which the additional production capacity at ZapSib will rectify. The market outlook for polyolefins in export markets such as China, Europe, Turkey as well as Russia and CIS countries further reinforces our belief in the investment case and strategy. ZapSib is a transformational project that changes our philosophy, as we move up the value chain from energy commodities to petrochemicals markets, their evolution and prospects.
OUR FINANCIAL POSITION IS STRONG
Rising cash generation, proceeds from divestments and debt repayment have significantly deleveraged our balance sheet. During the year our total debt decreased by 8.6% and net leverage improved to 1.6x compared to 2.0x at the start of 2017. At the end of January 2018, we have virtually no debt due for repayment for the coming year and average tenor totaled 7.4 years.
In recognition of our improved financial position, in January 2018 Moody’s upgraded SIBUR’s credit rating to Baa3 with a stable outlook. The rating agency highlighted the Company’s sustainable profitability enabled by our integrated business model, and projected further improved profitability after the launch of ZapSib. In April 2018, Fitch raised its outlook from “Negative” to “Positive” with a BB+ rating.
Our $4.21 billion remaining investment in ZapSib planned for 2018-2020 is fully funded. Outlays decreased 12% in 2017 and we expect this to peak in 2018. While we foresee that more drawdowns from committed credit lines and operational cash flow will be deployed for this project in the coming year, our financial position is set to strengthen further over subsequent years, with less debt and a stronger cash position as we reap the rewards of this strategic investment.
Chairman of the Management Board (continued)
1 The project budget is multi-currency and the residual figure calculated based on exchange rates as of 31 December 2017.

https://www.sibur.ru/en/
09
INTR
ODUC
TION
Annual Review 2017 SIBUR
INTRODUCTION VALUE CREATION DRIVERS HOW WE CREATE VALUE HOW WE SUSTAIN VALUE FINANCIAL INFORMATION ADDITIONAL INFO
We continue to make important strides to drive performance and excellence throughout our Company. We have further implemented programmes and initiatives to strengthen our corporate culture, professional development, enterprise risk management, environmental, and health and safety performance. We also published our first standalone sustainability report as part of our commitment to environmental, social and governance improvements and transparency for our stakeholders. I would like to thank our 27 thousand employees for their contributions in making this another strong year for SIBUR, and their commitment to continuous improvement and the highest standards of professional conduct.
Technology continues to be a major focus for us and we leveraged new IT infrastructure and strengthened our capabilities to drive digital solutions throughout our business. In 2017, we began to see significant returns from the implementation of SAP as our enterprise management system. This is a major milestone for our technological development that is already demonstrating its value in internal reporting and decision-making processes. In addition, the system is helping us to take external transparency a step further.
This includes increasing the speed and frequency of financial reporting, providing additional disclosures in this annual review.
I am especially proud of how SIBUR has managed the engineering and logistical complexities of the ZapSib project. The challenges are daunting and our people have risen to the challenge. We shipped heavy and oversize petrochemical equipment thousands of kilometers to Tobolsk ahead of schedule, which substantially mitigates our risks of project execution. We are now managing a gigantic construction effort with more than 20 thousand workers on site and training engineers and technical staff to be ready for operational launch.
With ZapSib nearing completion, we have begun planning SIBUR’s longer-term strategy to increase our access to new sources of feedstock and create opportunities for future growth. We are currently evaluating the potential for the development of petrochemicals production in the Far East, where ethane feedstock is expected to be available. The proposed Amur Gas Chemical Complex (GCC) is a large-scale ethane cracker coupled with polyolefins production facility that would supply domestic and export markets, notably China.
In February 2018, we signed a preliminary agreement with our strategic partner Gazprom for the supply of ethane to GCC. The project configuration will be defined based on completion of pre-feasibility studies: capacity of about 1.5 mtpa of ethylene and 1.5 mtpa of PE.
I am confident that SIBUR will keep its pace in 2018 and look forward to reporting on SIBUR’s development and our strategic and financial progress in 2018 and beyond.
DMITRY KONOV Chairman of the Management Board

10
VALU
E CR
EATI
ON D
RIVE
RS
SIBUR Annual Review 2017
INTRODUCTION VALUE CREATION DRIVERS HOW WE CREATE VALUE HOW WE SUSTAIN VALUE FINANCIAL INFORMATION ADDITIONAL INFO
https://www.sibur.ru/en/
ValueCreationDrivers
Competitive Advantages 12
Growth Strategy 16
Key Relationships 26
Operating Environment 28

11
VALU
E CR
EATI
ON D
RIVE
RS
SIBURAnnual Review 2017
INTRODUCTION VALUE CREATION DRIVERS HOW WE CREATE VALUE HOW WE SUSTAIN VALUE FINANCIAL INFORMATION ADDITIONAL INFO
https://www.sibur.ru/en/
Oper
atin
g En
viro
nmen
t
Competitive Advantages
KeyRelationships
Growth
StrategyPAGE
10
PAGE14
PAGE 26
PAGE24
Value Creation Drivers
VALUE

12
VALU
E CR
EATI
ON D
RIVE
RS
SIBUR Annual Review 2017
INTRODUCTION VALUE CREATION DRIVERS HOW WE CREATE VALUE HOW WE SUSTAIN VALUE FINANCIAL INFORMATION ADDITIONAL INFO
https://www.sibur.ru/en/
LOGISTICS
Competitive Advantages Value Creation Drivers
1 Associated petroleum gas (APG) is a by-product of oil production, in billion cubic metres per annum (bcmpa).2 Natural gas liquids (NGLs) include raw NGL, LPG (liquefied petroleum gas) and naphtha, in million tonnes per annum (mtpa). Raw NGL is a by-product of gas production.3 Includes LPG, naphtha and raw NGL. Composition may vary from year to year depending on market conditions and other limitations.4 JV sales include PVC, caustic soda (RusVinyl) and PP (Poliom).
Feedstock&Energy
Our integrated petrochemicals business model delivers resilient performance and superior margins compared to global industry competitors.
SUPPLIERS
Natural gas 18.5 bcmpa
LPG and naphtha 5.8 mtpa
Petrochemicals
OLEFINS & POLYOLEFINS PLASTICS, ELASTOMERS & INTERMEDIATES
CLIENTS
NGLs 6.0 mtpa
0.7 mtpa4 1.2 mtpa 2.4 mtpa
Feedstock3 3.4 mtpa
GAS FRACTIONATION 7.5 mtpa
GAS PROCESSING
Gas producers
NGLs2
3.6 mtpa
Oil producers
APG1
22.3 bcmpa

13
VALU
E CR
EATI
ON D
RIVE
RS
SIBURAnnual Review 2017
INTRODUCTION VALUE CREATION DRIVERS HOW WE CREATE VALUE HOW WE SUSTAIN VALUE FINANCIAL INFORMATION ADDITIONAL INFO
https://www.sibur.ru/en/
The main hub of our activities is strategically located in Western Siberia, home to two-thirds of Russia’s production of hydrocarbon feedstock. This gives SIBUR a reliable, long-term and attractively-priced source of raw materials. We have built unmatched infrastructure for monetising this feedstock advantage and driving long-term growth and value creation.
Competitive Advantages
5 Including Yuzhno-Priobskiy GPP operated under JV.6 Does not include financing of JV and petchem capacities construction.
STRATEGICALLY LOCATED ASSET BASE
SIBUR operates the largest and most extensive gas processing and petrochemicals facilities and pipeline and transportation infrastructure in Western Siberia. Our assets are located in close proximity to oil and gas fields that account for much of Russia’s energy production. The oil and gas extraction process produces APG and NGL by-products that are difficult for energy companies to transport and thus are effectively stranded in the region. SIBUR provides these companies with an economic solution, taking these by-products as feedstock for energy products and petrochemicals production.
UNMATCHED INFRASTRUCTURE
SIBUR’s strategically located assets give us substantial economies of scale. Our assets include eight5 out of the ten GPPs operating in the region; they process 57% of all APG in Russia and have direct links to oil fields in Western Siberia through point-to-point owned and third-party APG pipelines. SIBUR’s 1,639 kilometre raw NGL pipeline system connects most of the Group’s GPPs and raw NGL suppliers to consolidate all raw NGL flows and transport it to our Tobolsk fractionation facility, the largest in Eastern Europe.
LONG-TERM CONTRACTS
SIBUR’s abundant and reliable supplies of feedstock are backed by long-term contracts with Russian energy companies. The average weighted maturity of our feedstock contracts is approximately 14 years for APG and 16 years for NGLs. These contracts are priced very competitively compared to world markets. They are structured to pass on oil and oil derivative price swings to our suppliers, thereby locking in relatively stable margins and mitigating SIBUR’s exposure to energy market volatility.
COMPETITIVE BARRIERS TO ENTRY
Our multi-year investments have created an integrated platform with high competitive barriers to entry. SIBUR has invested $4.4 bln6 since 2009 in expansion and upgrades of its gas processing and transportation infrastructure in the region. Replicating this infrastructure would be difficult and require multi-billion dollar investments by competitors that would not be economically justifiable without comparable feedstock, vertical integration, scale economies and other competitive advantages that SIBUR has established.

14
VALU
E CR
EATI
ON D
RIVE
RS
SIBUR Annual Review 2017
INTRODUCTION VALUE CREATION DRIVERS HOW WE CREATE VALUE HOW WE SUSTAIN VALUE FINANCIAL INFORMATION ADDITIONAL INFO
https://www.sibur.ru/en/
COMPLEMENTARY ENERGY AND PETROCHEMICALS BUSINESSES
Our Feedstock & Energy business generally benefits from higher oil prices due to the structure of APG and NGLs feedstock purchase contracts, which allow SIBUR to lock in a relatively stable margin, and the high correlation of oil prices with prices for LPG and naphtha, our main products for this segment.
At the same time, our petrochemicals businesses (which acquire the majority of their raw materials internally from our Feedstock & Energy Segment) benefit from lower oil and oil derivative prices. During the years of record oil prices, we used strong cash generation from our feedstock and energy activities to fund our multi-year investment programme to expand petrochemicals production and create a better balanced, vertically integrated business.
This strategy has fundamentally changed our product mix and allowed us to capture more value for ourselves by processing feedstock into higher value added petrochemicals. Vertical integration enables us to achieve higher margins for end products like polypropylene through higher netbacks, lower transportation costs and the ability to achieve better pricing in different markets as compared to processing the same volumes of feedstock into LPG and other energy products.
Our diverse product portfolio and integrated business model reduce our exposure to global commodities price volatility. This enables SIBUR to deliver resilient financial performance and best-in-class margins.
CURRENCY STRUCTURE OF THE BUSINESS MODEL AS A NATURAL HEDGE AGAINST ENERGY CYCLES
Prices for a large portion of SIBUR’s feedstock and processed goods are directly or indirectly linked to oil or oil derivative prices. Our sales outside of Russia are primarily denominated in US dollars and, to a lesser extent, in euros. In many cases, domestic sales are also linked to international benchmark prices quoted in dollars and euros, though they may take a certain amount of time to adjust when the Russian rouble fluctuates substantially. At the same time, our operating costs are mainly denominated in roubles. The difference between dollar denominated revenues and rouble operating costs provides a natural hedge that protects our margins as the rouble tends to weaken in declining oil price environments and strengthens when oil prices are rising.

15
VALU
E CR
EATI
ON D
RIVE
RS
SIBURAnnual Review 2017
INTRODUCTION VALUE CREATION DRIVERS HOW WE CREATE VALUE HOW WE SUSTAIN VALUE FINANCIAL INFORMATION ADDITIONAL INFO
https://www.sibur.ru/en/
BEST-IN-CLASS MARGINS
SIBUR has delivered best-in-class performance compared to global industry competitors. Our results tell a powerful story about how our vertical integration drives resilient financial performance and sustains high margins in tough market conditions. This is a structural advantage for SIBUR throughout the cycle, and last year was a good demonstration of this resilience. In higher oil price environment of 2013, when oil was at $109 per barrel, our EBITDA was $2.5 billion, whereas in 2017, when oil dropped to $54 our EBITDA improved to $2.8 billion. Over the same period, Group EBITDA margin increased from 29% to 35%.
STABLE, BEST-IN-CLASS EBITDA MARGIN
VERTICAL INTEGRATION DELIVERS RESILIENT PERFORMANCE AND STABLE MARGINS
2012 2013 2014 2015 2016 2017
10%
20%
30%
40%
1 Adjusted for the estimated value of naphtha trading operations via Ust-Luga, ceased in 2015.
Petronas ChemicalsSIBURSABICBraskemLyondellBasellNizhnekamskneftekhim Dow Chemicals / Dow Dupont since 2016BASF
Brent price, avg $/bblSIBUR EBITDA, $ bln
2013
29%
7970
78
2014
32%1
10379
1516
2015
36%
13666
37
34
2016
34%
14061
49
32
2017
35%
16189
45
30
109100
53 4454
2.52.7
(8%)
+8%
+30%
+32%(17%)(6%)
(47%)
(17%) +24%
2.2 2.1
2.8
+32%+3%
+15%
35 % EBITDA MARGIN IN 2017
US$2.8 BLN EBITDA IN 2017
Source: Bloomberg.
EBITDA margin, %SIBUR EBITDA, RR blnFeedstock & EnergyOlefins & PolyolefinsPlastics, Elastomers & IntermediatesUnallocated

16
VALU
E CR
EATI
ON D
RIVE
RS
SIBUR Annual Review 2017
INTRODUCTION VALUE CREATION DRIVERS HOW WE CREATE VALUE HOW WE SUSTAIN VALUE FINANCIAL INFORMATION ADDITIONAL INFO
https://www.sibur.ru/en/
0 30 60 90 120 150 180
500
1,000
1,500
Ethylene cumulative capacity, mtpa
Cash Cost, $/tonne ZapSib
STRONG POSITION ON THE ETHYLENE COST CURVE (2021)
Growth Strategy Value Creation Drivers
MONETISE STRANDED FEEDSTOCK THROUGH CONSTRUCTION OF WORLD- SCALE PETROCHEMICAL FACILITIES
A key objective of our strategy is to secure long-term access to advantageously priced feedstock of Western Siberia as a basis for growing the business. SIBUR has developed a unique competitive position by consolidating large volumes of feedstock flows while simultaneously establishing strong relationships with suppliers.
As part of our strategy to monetise SIBUR’s Western Siberian feedstock advantage, we have substantially developed our petrochemicals production and transportation infrastructure in the region. This strategy is expected to result in further vertical integration of our business model and provide a more efficient and higher value added alternative for monetising NGLs than sales of energy products. Located near the major hub of feedstock supplies in Western Siberia, the ZapSib polymers project will enjoy significant transportation savings and economies of scale.
CAPTURE GLOBAL GROWTH OPPORTUNITIES AND ENHANCE MARKET LEADERSHIP IN RUSSIA
We are committed to reinforcing our leading position in the domestic petrochemicals market and seizing global growth opportunities in our strategic export markets, primarily China, Turkey and Europe. By leveraging its cost advantages and expanding production capacity, SIBUR is well positioned to succeed in this effort.
The ethylene cost curve shows how competitive ZapSib is in terms of feedstock costs; the marginal cost of converting this feedstock into polyolefins is relatively small. ZapSib is positioned at the low end of the cost curve next to Middle Eastern and North American producers. The competitive cost position of Middle East producers in olefins benefits from low or fixed ethane prices stemming from government policies. ZapSib’s costs are below the average both for U.S. and other Russian producers, which gives us a very strong position for polyolefins production globally and in the domestic market.
SIBUR’s petrochemicals business enhances our structural advantages and growth opportunities. We have grown our leadership and are targeting further significant increases by investing in our next leg of growth. The business case is compelling: SIBUR benefits from a global cost advantage, rising domestic demand trends in Russia and opportunities for growing value-added exports to China and other growth markets. In addition, SIBUR continues to pursue operational excellence to enhance its cost advantages, reduce risks and promote the long-term sustainability of its business by applying global best practices.
Middle EastZapSib
Oil Price Scenarios
High Case 70 $/bblMedium Case 50 $/bblLow Case 30 $/bbl
USARussia
Western EuropeChina
Source: Nexant.

17
VALU
E CR
EATI
ON D
RIVE
RS
SIBURAnnual Review 2017
INTRODUCTION VALUE CREATION DRIVERS HOW WE CREATE VALUE HOW WE SUSTAIN VALUE FINANCIAL INFORMATION ADDITIONAL INFO
https://www.sibur.ru/en/
Growth Strategy
EXPLORE NEW SOURCES OF FEEDSTOCK AND MARKET OPPORTUNITIES FOR FUTURE GROWTH
SIBUR has taken significant market share in Russia since ramping up petrochemicals production. We are a leader in the Russian petrochemicals industry with strong market share in the majority of our petrochemical products. For example, SIBUR has increased its domestic sales volumes of polypropylene by almost 50% since 2014, by displacing higher-priced imports and benefiting from structural growth of petrochemicals demand. Domestic consumption is well below international levels and both industrial and consumer sectors are making increasing use of these materials. Demand for polyethylene and polypropylene in Russia is projected to increase faster than in many of the world’s developed economies, creating growth opportunities for SIBUR.
In February 2018, SIBUR and Gazprom entered into a preliminary agreement on commercial terms for the supply of ethane from Gazprom’s Amur Gas Processing Plant (GPP), which is currently under construction, to SIBUR’s proposed Amur GCC. Gazprom will treat the natural gas intended for China and also produce liquefied petroleum gas, pentane-hexane fraction, helium and ethane fraction. SIBUR in turn plans to build the Amur GCC with annual capacity of about 1.5 mt of polyethylene. The Amur GCC will be linked to Gazprom GPP via pipeline and process ethane for the further production of monomers and polyethylene grades for customers in Russia and global export markets. In case of the positive decision the construction of the planned Amur complex can start in 2020 and come on stream in 2024.
In order to develop our feedstock base for the future, SIBUR is assessing new hydrocarbons such as ethane extracted from wet natural gas and dry natural gas. Ethane represents a mere 10% of the total feedstock currently used for petrochemicals production in Russia. Development of petrochemicals production in Eastern Siberia, where ethane feedstock is expected to be available, would create economically viable opportunities to supply domestic and export markets, notably China, from the Far East regions of Russia.
SIBUR is exploring the potential of ethane feedstock through the proposed Amur Gas Chemical Complex (GCC). This project, which is in pre-design development phase, comprises a large-scale ethane cracker coupled with polyolefins production facility.
https://www.sibur.ru/en/
18
VALU
E CR
EATI
ON D
RIVE
RS
SIBUR Annual Review 2017
INTRODUCTION VALUE CREATION DRIVERS HOW WE CREATE VALUE HOW WE SUSTAIN VALUE FINANCIAL INFORMATION ADDITIONAL INFO
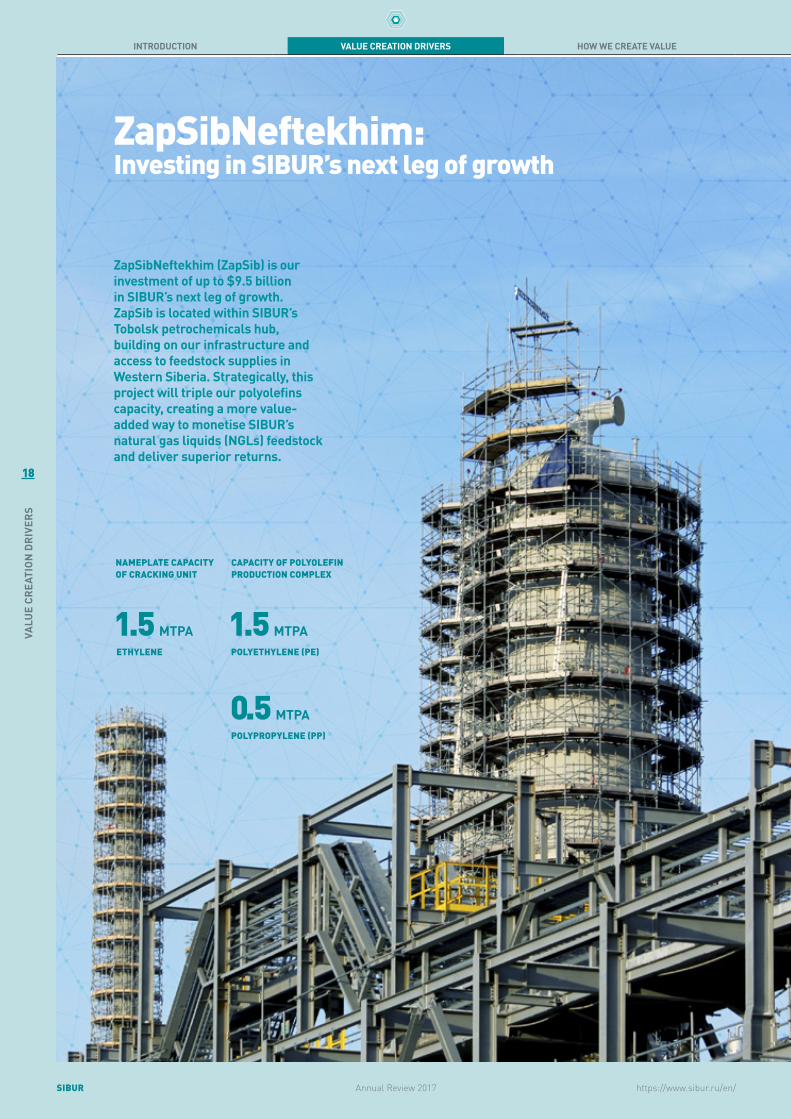
ZapSibNeftekhim: Investing in SIBUR’s next leg of growth
ZapSibNeftekhim (ZapSib) is our investment of up to $9.5 billion in SIBUR’s next leg of growth. ZapSib is located within SIBUR’s Tobolsk petrochemicals hub, building on our infrastructure and access to feedstock supplies in Western Siberia. Strategically, this project will triple our polyolefins capacity, creating a more value-added way to monetise SIBUR’s natural gas liquids (NGLs) feedstock and deliver superior returns.
1.5 MTPAETHYLENE
1.5 MTPAPOLYETHYLENE (PE)
0.5 MTPAPOLYPROPYLENE (PP)
CAPACITY OF POLYOLEFIN PRODUCTION COMPLEX
NAMEPLATE CAPACITY OF CRACKING UNIT
https://www.sibur.ru/en/
19
VALU
E CR
EATI
ON D
RIVE
RS
SIBURAnnual Review 2017
INTRODUCTION VALUE CREATION DRIVERS HOW WE CREATE VALUE HOW WE SUSTAIN VALUE FINANCIAL INFORMATION ADDITIONAL INFO
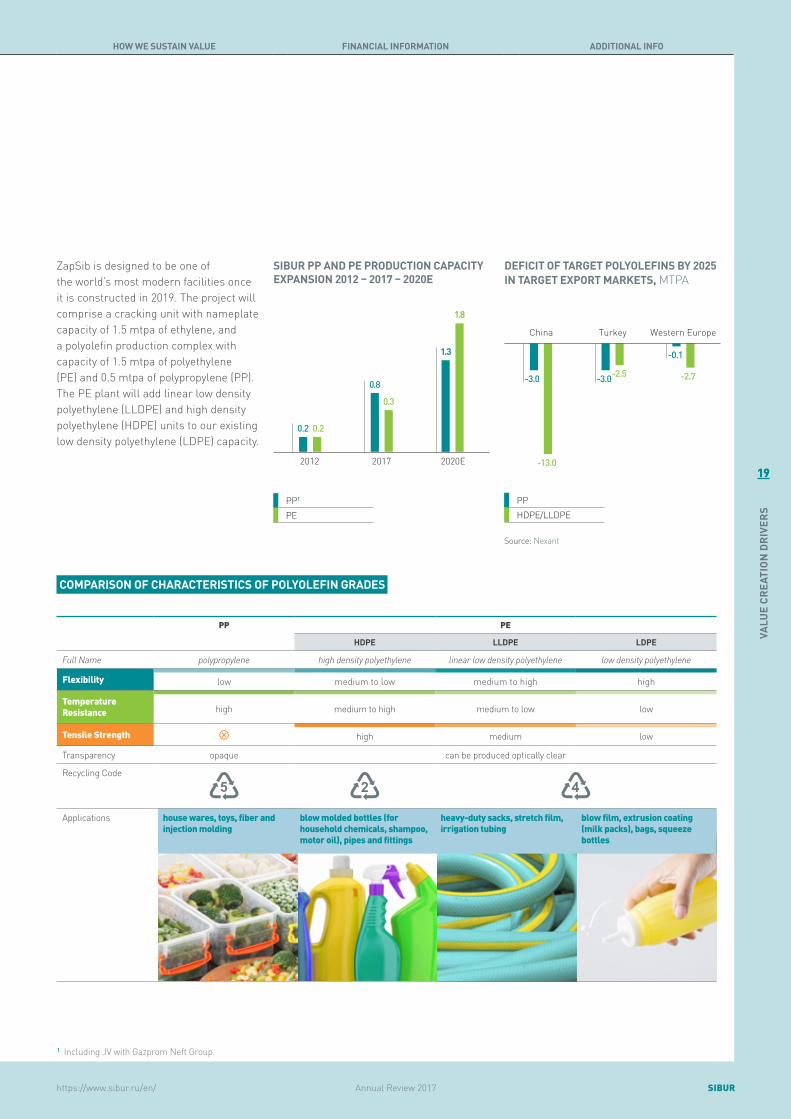
PP PE
HDPE LLDPE LDPE
Full Name polypropylene high density polyethylene linear low density polyethylene low density polyethylene
Flexibility low medium to low medium to high high
Temperature Resistance high medium to high medium to low low
Tensile Strength high medium low
Transparency opaque can be produced optically clear
Recycling Code
Applications house wares, toys, fiber and injection molding
blow molded bottles (for household chemicals, shampoo, motor oil), pipes and fittings
heavy-duty sacks, stretch film, irrigation tubing
blow film, extrusion coating (milk packs), bags, squeeze bottles
PP1
PE
2020E20172012
1.8
0.3
0.20.2
0.8
1.3
SIBUR PP AND PE PRODUCTION CAPACITY EXPANSION 2012 – 2017 – 2020E
PPHDPE/LLDPE
-2.7
-0.1
Western EuropeTurkeyChina
-13.0
-3.0 -2.5-3.0
DEFICIT OF TARGET POLYOLEFINS BY 2025 IN TARGET EXPORT MARKETS, MTPA
1 Including JV with Gazprom Neft Group.
COMPARISON OF CHARACTERISTICS OF POLYOLEFIN GRADES
ZapSib is designed to be one of the world’s most modern facilities once it is constructed in 2019. The project will comprise a cracking unit with nameplate capacity of 1.5 mtpa of ethylene, and a polyolefin production complex with capacity of 1.5 mtpa of polyethylene (PE) and 0.5 mtpa of polypropylene (PP). The PE plant will add linear low density polyethylene (LLDPE) and high density polyethylene (HDPE) units to our existing low density polyethylene (LDPE) capacity.
Source: Nexant

https://www.sibur.ru/en/
20
VALU
E CR
EATI
ON D
RIVE
RS
SIBUR Annual Review 2017
INTRODUCTION VALUE CREATION DRIVERS HOW WE CREATE VALUE HOW WE SUSTAIN VALUE FINANCIAL INFORMATION ADDITIONAL INFO
PPHDPELLDPELDPE
Source: Nexant
SIBUR expects to benefit from its low-cost producer advantage compared to competitors and projected demand growth trends for polyolefins in Russia and key export markets. According to Nexant, in 2016 global demand for all polyolefins (PP and PE) was 156 million tonnes and the market will expand with growth rates above GDP through 2025. Demand will be driven by key end products including films, injection moulding and fiber for PP and pipes and fitting for HDPE. While Asia, China and Turkey in the Middle East will be the largest growing consuming regions, the domestic market also has high potential to increase consumption towards levels in developed economies. According to Nexant’s forecast, Russia will become a net exporter of polyolefins by 2025, and will be positioned to fill supply shortfalls expected in target export markets.
13%
27%
18% 42%Capacity
179 milliontonnes
13%4% 2%
2%
1%
22%
17%
23%
16%
Capacity
179 milliontonnes
12%
23%
16% 36%Demand
156 milliontonnes
5%3%2%4%
7%15%
13%
21%
30%
Demand
156 milliontonnes
Asia (excl China)ChinaMiddle EastNorth America
Western Europe
South America
Central Europe
Eastern Europe
Africa
GLOBAL POLYOLEFINS CAPACITY AND DEMAND BY PRODUCT, 2016
GLOBAL POLYOLEFINS CAPACITY AND DEMAND BY REGION, 2016
Source: Nexant
Product CAGR 2025 – Global PP 4.1%HDPE 3.7%LLDPE 4.9%LDPE 2.8%
The projected demand growth
Source: Nexant
Domestic market potential: Russian polyolefins per capita consumption lags behind the developed markets (2016)
Product Russia Western Europe USA
PP 8 kg 18 kg 19 kg
HDPE 7 kg 12 kg 19 kg
LLDPE 1.5 kg 8.6 kg 14.1 kg
LDPE 4 kg 9 kg 6.5 kg
Source: Nexant
ZapSibNeftekhim: Investing in SIBUR’s next leg of growth(continued)
156 MLN TONNESGLOBAL DEMAND FOR ALL POLYOLEFINS (PP AND PE) IN 2016

https://www.sibur.ru/en/
21
VALU
E CR
EATI
ON D
RIVE
RS
SIBURAnnual Review 2017
INTRODUCTION VALUE CREATION DRIVERS HOW WE CREATE VALUE HOW WE SUSTAIN VALUE FINANCIAL INFORMATION ADDITIONAL INFO
In Western Siberia, SIBUR has access to stranded feedstock that is secured with contracts for the next 15 years on average. SIBUR has all the integrated infrastructure in place to collect and process these by-products of hydrocarbon production. After raw NGL is processed into marketable liquids, SIBUR has two options: either sell the liquids in European markets (because demand in Russia is limited), or push the liquids further up the value chain internally and produce polyolefins.
In the first option, half of the value of LPG produced in Tobolsk is eroded by the high costs of transporting hazardous flammable liquids by train using specialized tanks and the need to run empty wagons for the return trip to Russia, in addition to export duty. In the second option, we incur lower costs as there are plenty of inexpensive ways to transport polyolefin granules and no export duties, while spreads for polyolefins are higher and demand trends in end markets are favourable.
Project rationale: unlocking the value of our feedstock advantage
As of today, our petrochemicals facilities can only process approximately 35% of available feedstock into higher margin petrochemicals. The remaining 65% are sold on the market as liquefied petroleum gas (LPG) or naphtha. ZapSib will enable us to reroute secured feedstock into the part of our business with higher profitability and resilience to oil price volatility.
3-rd party supply
SIBUR’s raw NGL
production
F&E
O&P, incl. ZapSib
F&E
O&P
PE&I PE&I20%
40%
39%
Output 2022Output 2017Supply sources EBITDA margin 2017
1 Illustrative.2 Per 1.3 tonne of LPG utilised for production of 1 tonne of polyolefins.3 Polyolefin production cost less by-products.
Feedstock (LPG CIF ARA)End-product (PP raffia China Main Port. Spot)
SUSTAINED O&P SPREAD $/TONNE
POLYOLEFINS
RATIONALE FOR POLYOLEFIN PRODUCTION1
1. RAW NGL LIQUIDS
2. RAW NGL LIQUIDS POLYOLEFINS
LPG2
Conversion cost3 ADDED VALUE
LPG netback in Tobolsk
LPG market price
Transport & duties
Polyolefin market price
Polyolefin netback in Tobolsk
Transport & duties
2013 2014 2015
2013-2017 avg. spread670 $/tonne
500
1,000
1,500
2016 2017
https://www.sibur.ru/en/
22
VALU
E CR
EATI
ON D
RIVE
RS
SIBUR Annual Review 2017
INTRODUCTION VALUE CREATION DRIVERS HOW WE CREATE VALUE HOW WE SUSTAIN VALUE FINANCIAL INFORMATION ADDITIONAL INFO
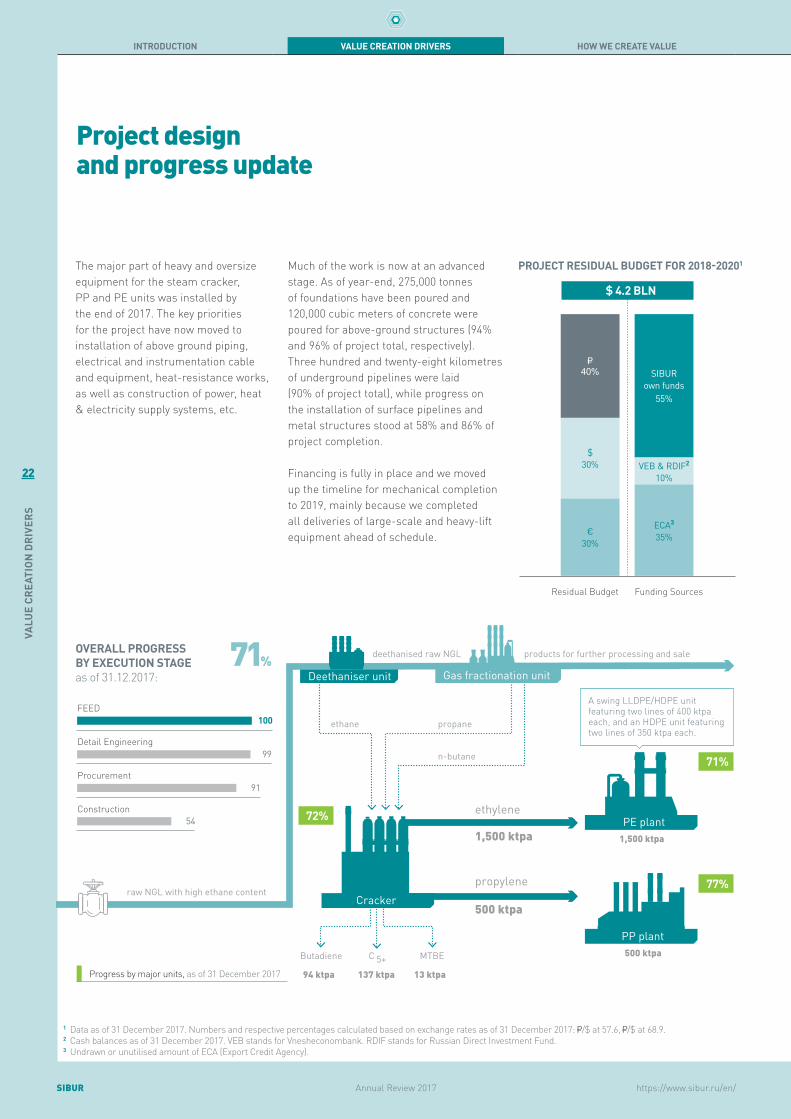
propylene
500 ktpa
500 ktpa PP plant
propane
n-butane
products for further processing and sale
Cracker
Butadiene
94 ktpa
C 5+137 ktpa
MTBE
13 ktpa
Deethaniser unit
ethane
deethanised raw NGL
Gas fractionation unit
ethylene
1,500 ktpa 1,500 ktpa PE plant
raw NGL with high ethane content
Project design and progress update
The major part of heavy and oversize equipment for the steam cracker, PP and PE units was installed by the end of 2017. The key priorities for the project have now moved to installation of above ground piping, electrical and instrumentation cable and equipment, heat-resistance works, as well as construction of power, heat & electricity supply systems, etc.
Much of the work is now at an advanced stage. As of year-end, 275,000 tonnes of foundations have been poured and 120,000 cubic meters of concrete were poured for above-ground structures (94% and 96% of project total, respectively). Three hundred and twenty-eight kilometres of underground pipelines were laid (90% of project total), while progress on the installation of surface pipelines and metal structures stood at 58% and 86% of project completion.
Financing is fully in place and we moved up the timeline for mechanical completion to 2019, mainly because we completed all deliveries of large-scale and heavy-lift equipment ahead of schedule.
1 Data as of 31 December 2017. Numbers and respective percentages calculated based on exchange rates as of 31 December 2017: /$ at 57.6, /$ at 68.9.2 Cash balances as of 31 December 2017. VEB stands for Vnesheconombank. RDIF stands for Russian Direct Investment Fund.3 Undrawn or unutilised amount of ECA (Export Credit Agency).
A swing LLDPE/HDPE unit featuring two lines of 400 ktpa each, and an HDPE unit featuring two lines of 350 ktpa each.
SIBUR own funds
55%
VEB & RDIF2
10%
ECA3
35%
40%
$30%
€30%
Residual Budget Funding Sources
PROJECT RESIDUAL BUDGET FOR 2018-20201
$ 4.2 BLN
71%
77%
72%
OVERALL PROGRESS BY EXECUTION STAGE as of 31.12.2017:
71%
100FEED
99Detail Engineering
91Procurement
54Construction
Progress by major units, as of 31 December 2017

https://www.sibur.ru/en/
23
VALU
E CR
EATI
ON D
RIVE
RS
SIBURAnnual Review 2017
INTRODUCTION VALUE CREATION DRIVERS HOW WE CREATE VALUE HOW WE SUSTAIN VALUE FINANCIAL INFORMATION ADDITIONAL INFO
KEY EXECUTION RISK MITIGATED
One of the major challenges was timely delivery of oversize petrochemical equipment from China, Japan and South Korea to Tobolsk. For example, a propane fractionation column 106 meters high and weighing 917 tonnes had to be transported in its fully assembled state. With maritime transportation as the only option, we had to make delivery within a very tight navigable window when the North Sea Route and Siberian rivers Ob and Irtysh are free of ice. Even a 10-day delay in the dispatch of any oversize equipment could have resulted in the project completion being postponed by one year.
TEAM
As of 2017 year-end the project was staffed by an operating team of 887 people, mainly represented by engineers and technical staff engaged in employee trainings, equipment maintenance, document inspection and commissioning planning. Recruitment of highly skilled professionals is under way, as well as training and relocation of SIBUR staff to Tobolsk. The ZapSib complex on its own will employ not more than 1,500 people when the plant is fully operational.
Jan MarFeb Apr May JulJun DecNovOctSeptAug
20,000+NUMBER OF CONSTRUCTION WORKERS ON SITE IN 2017
The logistical scale of this operation was impressive, involving 49 barge trips carrying 366 equipment units weighing some 164,000 freight tonnes in total. Originally we had planned delivery over three years from 2016 through 2018, but as a result of our efforts we shipped all equipment to Tobolsk ahead of schedule in September 2017. This removes one of key execution risks of this project. The pace of progress now depends mainly up to the number of construction workers on site, which has been rising steadily since the completion of equipment delivery.
Tobolsk
For more information see Employees section on p. 77
Sabetta
Ulsan port
ULSAN SABETTA VIA BERING STRAIT:
25 DAYS
ULSAN SABETTA VIA SUEZ CANAL:
45 DAYS
16 DAYS

https://www.sibur.ru/en/
24
VALU
E CR
EATI
ON D
RIVE
RS
SIBUR Annual Review 2017
INTRODUCTION VALUE CREATION DRIVERS HOW WE CREATE VALUE HOW WE SUSTAIN VALUE FINANCIAL INFORMATION ADDITIONAL INFO
PARTNERING WITH THE BEST EXPERTISE
We cooperate with leading international licensors and contractors who have experience in similar projects and offer us ready-made proven solutions.
Project design and progress update (continued)
CR Cracker
PE PE units
PP PP unit
> 100 RUSSIAN CONTRACTORSFROM 35 REGIONS FOR CONSTRUCTION MATERIALS DELIVERY, AS WELL AS TRANSPORTATION AND INSTALLATION SERVICES
LP Logistic platform
UIOUIO (utilities infrastructure & offsites)
EP PP
GERMANY
UIO
RUSSIA
LP
GERMANY
PE
FRANCEGERMANY
CR
LICENSOR PP
USA
PE
UKGERMANY
CR
CONSTRUCTION UIO
UNDER ERCM CONTRACT
PE
CHINA
PP LP
RUSSIATURKEY
CR
KEY EQUIPMENT SUPPLIERS
PP PP PEPE PP PE LP
JAPANSOUTH KOREA GERMANYNETHERLANDS
CR PP PECR
Fractionation columns
Industrial control system
Pneumatic conveying
Compressors SilosExtruders
LOGISTICS PROVIDERS
GERMANY NETHERLANDS
CR PECR PP PECR
General cargo Sea freight Large-scale

https://www.sibur.ru/en/
25
VALU
E CR
EATI
ON D
RIVE
RS
SIBURAnnual Review 2017
INTRODUCTION VALUE CREATION DRIVERS HOW WE CREATE VALUE HOW WE SUSTAIN VALUE FINANCIAL INFORMATION ADDITIONAL INFO
R&D CENTRE TO DRIVE POLYMER PRODUCT INNOVATIONS
SIBUR is creating an R&D centre for the development of innovative polymer and polyolefins applications at the Skolkovo Innovation Centre in Moscow. SIBUR plans to use this R&D site to develop and test new materials and product solutions, analyse and refine their properties, customise materials to meet customers’ needs and explore opportunities for enhancing polyolefin processing technologies. In 2017 we started building construction and technical equipment purchases. We also began the process for recruiting professional staff to be ready for the future launch of the R&D site.
LOGISTICS
To provide efficient distribution of polymer products to end customers, SIBUR is developing a logistics platform in Tobolsk for storage, packaging and shipment of polyolefins. The project overall progress was 52% as of the end of 2017.
In partnership with Karl Schmidt Spedition GmbH & Co. KG (KSS) a logistics hub is being built at the Freight Village Vorsino in the Kaluga Region. Accorging to the signed 20 year-long agreement for logistic services, KSS is reconstructing the existing storage complex for packaging polymer granules. The dispatch will be organised either in pallets or in bulk thus saving packaging materials costs for SIBUR and optimising logistics expenses for polymer products processors.
Launch of this hub will enable SIBUR to cut logistics expenses and increase productivity at ZapSib. The hub will ensure a safe end-product flow from the future site in Tobolsk to the central part of Russia, as well as efficient transportation to Western Europe, including distribution of polymer products from the existing SIBUR production sites.
26
VALU
E CR
EATI
ON D
RIVE
RS
SIBUR Annual Review 2017
INTRODUCTION VALUE CREATION DRIVERS HOW WE CREATE VALUE HOW WE SUSTAIN VALUE FINANCIAL INFORMATION ADDITIONAL INFO
https://www.sibur.ru/en/
Key RelationshipsValue Creation Drivers
Our cooperation with the major Russian oil and gas companies is only the most visible example of win-win partnerships. We have built the infrastructure to provide them with a profitable solution for utilising the by-products of the oil and gas extraction process and reducing harmful emissions from flaring, while securing feedstock for our business on the basis of long-term contracts. Our joint ventures including RusVinyl, NPP Neftekhimia, Poliom and Yuzhno-Priobskyi GPP are other examples of our collaborative growth model.
Our success would not be possible without cooperation with our diverse universe of stakeholders. We operate and develop our business in constant and open dialogue with them to address their interests. In turn, our stakeholders contribute to our development and help to create value for our business.
Our international partners also include China Petroleum & Chemical Corporation or Sinopec, which purchased a 10% stake in our Company in 2015 to strengthen the opportunities driven by our complementary businesses and geographic markets. The purchase of an additional 10% percent stake in our Company by China’s Silk Road Fund in January 2017 furthers our relationship with Chinese stakeholders.
Interaction with our stakeholders is guided by the Code of Corporate Ethics approved by the PJSC SIBUR Holding Board of Directors on 16 December 2014 (Revision No. 3).
Stakeholder groups Contribution to success Key interaction principles Interaction tools
SHAREHOLDERS Provide financial capital Value creation at levels of international benchmarks; equal treatment; transparent disclosure
Shareholder meetings; Board of Directors’ meetings, operational and financial reporting; internal restrictions on the use of insider information
EMPLOYEES Run business efficiently and provide creative solutions to business challenges
Equal opportunity; safe work environment; professional development
Collective labour agreements; internal communications; social benefits; training and career development programmes; internal restrictions on the use of insider information
Visit the Company’s website to find more information on these documents at: https://www.sibur.ru/en/about/corporate/documents/
27
VALU
E CR
EATI
ON D
RIVE
RS
SIBURAnnual Review 2017
INTRODUCTION VALUE CREATION DRIVERS HOW WE CREATE VALUE HOW WE SUSTAIN VALUE FINANCIAL INFORMATION ADDITIONAL INFO
https://www.sibur.ru/en/
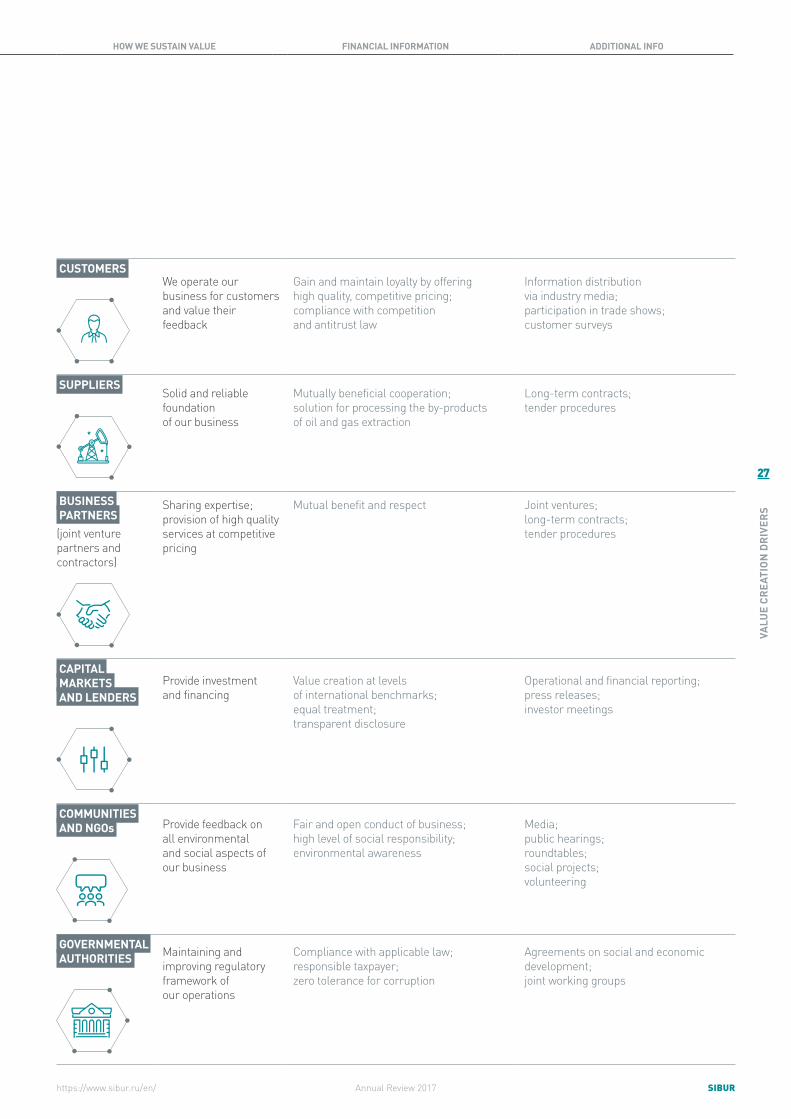
CUSTOMERS We operate our business for customers and value their feedback
Gain and maintain loyalty by offering high quality, competitive pricing; compliance with competition and antitrust law
Information distribution via industry media; participation in trade shows; customer surveys
SUPPLIERS Solid and reliable foundation of our business
Mutually beneficial cooperation; solution for processing the by-products of oil and gas extraction
Long-term contracts; tender procedures
BUSINESS PARTNERS (joint venture partners and contractors)
Sharing expertise; provision of high quality services at competitive pricing
Mutual benefit and respect Joint ventures; long-term contracts; tender procedures
CAPITAL MARKETS AND LENDERS
Provide investment and financing
Value creation at levels of international benchmarks; equal treatment; transparent disclosure
Operational and financial reporting; press releases; investor meetings
COMMUNITIES AND NGOs Provide feedback on
all environmental and social aspects of our business
Fair and open conduct of business; high level of social responsibility; environmental awareness
Media; public hearings; roundtables; social projects; volunteering
GOVERNMENTAL AUTHORITIES Maintaining and
improving regulatory framework of our operations
Compliance with applicable law; responsible taxpayer; zero tolerance for corruption
Agreements on social and economic development; joint working groups
28
VALU
E CR
EATI
ON D
RIVE
RS
SIBUR Annual Review 2017
INTRODUCTION VALUE CREATION DRIVERS HOW WE CREATE VALUE HOW WE SUSTAIN VALUE FINANCIAL INFORMATION ADDITIONAL INFO
https://www.sibur.ru/en/
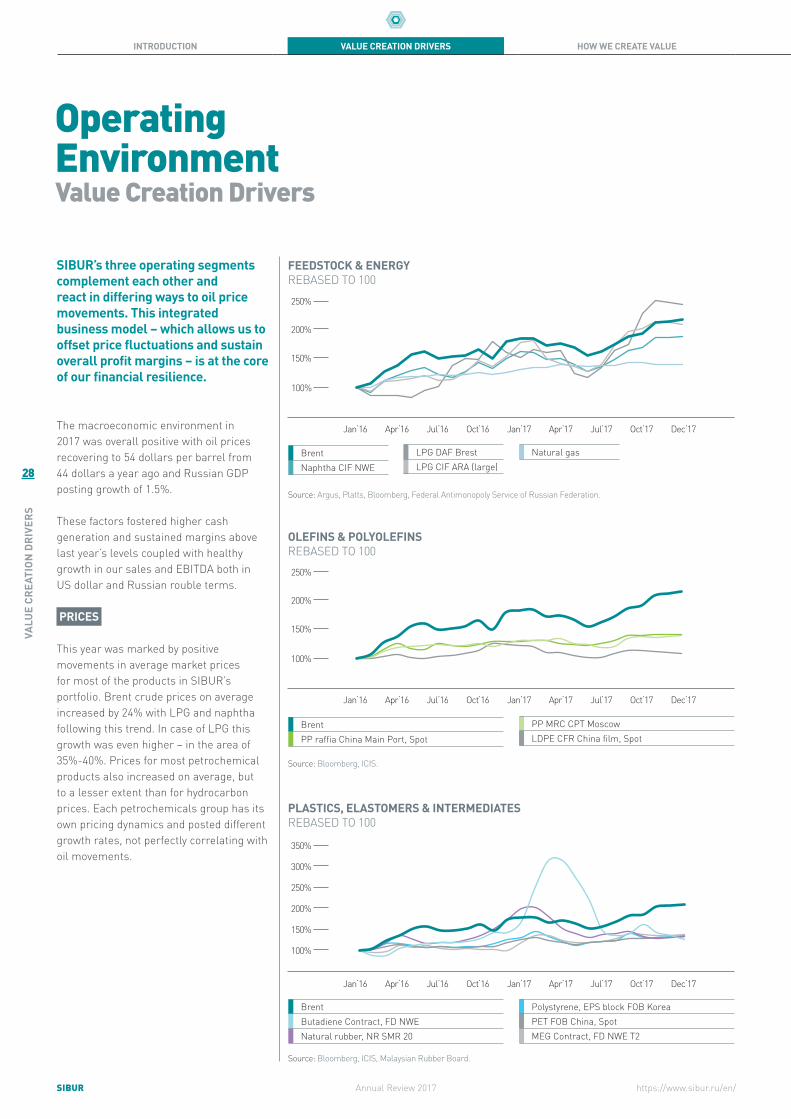
Operating EnvironmentValue Creation Drivers
The macroeconomic environment in 2017 was overall positive with oil prices recovering to 54 dollars per barrel from 44 dollars a year ago and Russian GDP posting growth of 1.5%.
These factors fostered higher cash generation and sustained margins above last year’s levels coupled with healthy growth in our sales and EBITDA both in US dollar and Russian rouble terms.
PRICES
This year was marked by positive movements in average market prices for most of the products in SIBUR’s portfolio. Brent crude prices on average increased by 24% with LPG and naphtha following this trend. In case of LPG this growth was even higher – in the area of 35%-40%. Prices for most petrochemical products also increased on average, but to a lesser extent than for hydrocarbon prices. Each petrochemicals group has its own pricing dynamics and posted different growth rates, not perfectly correlating with oil movements.
SIBUR’s three operating segments complement each other and react in differing ways to oil price movements. This integrated business model – which allows us to offset price fluctuations and sustain overall profit margins – is at the core of our financial resilience.
BrentNaphtha CIF NWE
BrentButadiene Contract, FD NWENatural rubber, NR SMR 20
BrentPP raffia China Main Port, Spot
FEEDSTOCK & ENERGY REBASED TO 100
OLEFINS & POLYOLEFINS REBASED TO 100
PLASTICS, ELASTOMERS & INTERMEDIATES REBASED TO 100
Source: Argus, Platts, Bloomberg, Federal Antimonopoly Service of Russian Federation.
Source: Bloomberg, ICIS.
Source: Bloomberg, ICIS, Malaysian Rubber Board.
Jan‘16
100%
150%
200%
250%
Apr‘16 Jul‘16 Oct‘16 Jan‘17 Dec‘17Apr‘17 Jul‘17 Oct‘17
Jan‘16 Apr‘16 Jul‘16 Oct‘16 Jan‘17 Dec‘17Apr‘17 Jul‘17 Oct‘17
100%
150%
200%
250%
300%
350%
Jan‘16
100%
150%
200%
250%
Apr‘16 Jul‘16 Oct‘16 Jan‘17 Dec‘17Apr‘17 Jul‘17 Oct‘17
LPG DAF BrestLPG CIF ARA (large)
Natural gas
Polystyrene, EPS block FOB Korea PET FOB China, SpotMEG Contract, FD NWE T2
PP MRC CPT MoscowLDPE CFR China film, Spot

29
VALU
E CR
EATI
ON D
RIVE
RS
SIBURAnnual Review 2017
INTRODUCTION VALUE CREATION DRIVERS HOW WE CREATE VALUE HOW WE SUSTAIN VALUE FINANCIAL INFORMATION ADDITIONAL INFO
https://www.sibur.ru/en/
EXCHANGE RATE
Our domestic currency, the Russian rouble, strengthened by 14.9% against the US dollar and 12.6% against the euro in 2017. Rouble appreciation more than offset the effect of higher oil prices and sales of our products denominated in US dollars, thus slowing Revenue and EBITDA growth in Rouble terms.
RUSSIAN ECONOMY
In 2017, the Russian economy posted a 1.5% increase in GDP compared to a 0.2% contraction in 2016. Industrial output increased at a moderate pace. Most of the industries that consume petrochemicals demonstrated growth. Important end customer segments for SIBUR including food and chemical industries, consumer rubber and plastic goods, and the automotive sector benefited from improved domestic demand. In addition, food import restrictions imposed by the Russian government continued to benefit domestic food industries and packaging producers.
Brent (USD per bbl)USD/RR
WA hydrocarbon feedstock priceLPG CIF ARA
LPG CIF ARAPP raffia China Main Port. Spot
6%6% 6%
-4%
Oil r
efin
ing
Met
als
Oil &
gas
pro
duct
ion
Vehi
cles
Prod
uctio
n in
dex
Lum
ber
Elec
tric
al g
oods
Cars
& E
quip
men
t
Rubb
er &
pla
stic
goo
ds
Chem
ical
Leat
her &
Foo
twea
r
Pulp
& P
aper
Min
ing
Food
Text
iles
1% 1% 1% 1%2%
3% 3%4% 4% 4%
5%
CHANGE IN INDUSTRIAL OUTPUT IN 2017, % Y-O-Y
USD/RR – OIL PRICE NEGATIVE CORRELATION
WIDENING F&E SPREAD SUSTAINED O&P SPREAD
Source: Russian Federal State Statistics Service.
Source: Bloomberg, CBR.
Source: Argus, ICIS.
Price spreads between purchased feedstock and end products help to illustrate the overall resilience of SIBUR’s margins. For the Feedstock & Energy segment, international benchmark prices for LPG, one of our key products, outpaced the prices at which we purchase hydrocarbon feedstock. This dynamic drove an improved margin for the business segment. The average spread expanded by a healthy 38% to USD 327 per tonne from USD 237 per tonne last year. At the same time, the spread between polypropylene and LPG remained essentially flat, at USD 611 down only 4% from USD 639 in the prior year.
Spread: PP benchmark – LPG benchmark
Spread: LPG benchmark – purchased hydrocarbons
Jan‘16 Apr‘16 Jul‘16 Oct‘16 Jan‘17 Dec‘17Apr‘17 Jul‘17 Oct‘17
85
75
55
45
35
65
2016 2017
avg. spread ~ 237 $/tonne
avg. spread ~ 327 $/tonne
2016 2017
avg. spread ~ 639 $/tonne
avg. spread ~ 611 $/tonne

30
VALU
E CR
EATI
ON D
RIVE
RS
SIBUR Annual Review 2017
INTRODUCTION VALUE CREATION DRIVERS HOW WE CREATE VALUE HOW WE SUSTAIN VALUE FINANCIAL INFORMATION ADDITIONAL INFO
https://www.sibur.ru/en/
2017
153
2016
138
OPERATING CASH FLOW, RR BLN
2017
161
2016
140
EBITDA, RR BLN
In 2017 our top-line growth was 10.4% and revenue totaled RR 454.6 billion. SIBUR’s well-balanced business model enabled us to demonstrate sustainably strong results in terms of cash generation and profitability. The decrease in our petrochemical segments performance was counterbalanced by healthy dynamics in our Feedstock & Energy business, which enabled us to generate 11% higher Group operating cash flow in rouble terms and a 27% increase in dollars for 2017, and an even higher EBITDA margin of 35.4% compared to 33.9% in the prior year.
SIBUR delivered record high processing volumes this year. We processed 22.8 bln cubic metres of APG, 1.6% higher than the previous year, and increased raw NGL fractionation volumes by almost 4% to 7.5 mln tonnes. We are proud to report that our polypropylene capacity in Tobolsk reached full utilisation rate on average.
Integrated Business Model Counterbalanced Segmental Performance Shifts
2017
455
2016
412
2017
117
2016
142
REVENUE, RR BLN
INVESTING CASH FLOW1, RR BLN
1 Includes Capex and M&A.
RR455BLNREVENUE
22.8 BLN CUBIC METRESAPG PROCESSING VOLUMES IN 2017
7.5 MLN TONNESRAW NGL FRACTIONATION VOLUMES IN 2017
RR161BLNEBITDA
35.4%EBITDA MARGIN

31
VALU
E CR
EATI
ON D
RIVE
RS
SIBURAnnual Review 2017
INTRODUCTION VALUE CREATION DRIVERS HOW WE CREATE VALUE HOW WE SUSTAIN VALUE FINANCIAL INFORMATION ADDITIONAL INFO
https://www.sibur.ru/en/
Our Feedstock & Energy segment revenues were up 7.9% in rouble terms and EBITDA increased by half compared to last year to RR 89.3 billion or 56% of total. Segmental EBITDA benefited from wider spreads on higher international benchmarks for liquids and higher total sales volumes of LPG on production growth (including intercompany sales). Additionally, we recorded lower transportation costs as we reduced gross sales of raw NGL, partially offset by higher deliveries of LPG and naphtha to our crackers. As a result, this business produced a significantly higher EBITDA margin of 39.0% in 2017 compared to 30.9% in 2016.
2017
89
2016
61
31%39%
FEEDSTOCK AND ENERGY
EBITDA, RR blnEBITDA margin, %
39% FEEDSTOCK AND ENERGY EBITDA MARGIN IN 2017
Olefins & Polyolefins revenue increased by 1.5% in 2017 while EBITDA decreased by 8.7% to RR 44.6 billion from RR 48.9 bln a year ago. The healthy growth in polypropylene and polyethylene production volumes and prices was fully offset by tighter polyolefin spreads caused by Russian rouble appreciation effects. This resulted in a softer O&P segment EBITDA margin of 39.5% in 2017 versus 45.5% in 2016. Our polypropylene production in Tobolsk delivered a 55% margin in 2017, well above the average for this segment.
Our Plastics, Elastomers & Intermediates revenues increased by 12.4% in 2017 on healthy elastomers performance. Segmental EBITDA declined by 3.6% to RR 30.4 billion or 19% of total as feedstock prices grew faster than prices for the majority of plastics & organic synthesis end-products, with the exception of elastomers, where prices outpaced feedstock costs. Segmental EBITDA margin declined from 23.8% to 20.3% year over year.
2017
45
2016
49
46%40%
OLEFINS AND POLYOLEFINS
EBITDA, RR blnEBITDA margin, %
40%OLEFINS AND POLYOLEFINS EBITDA MARGIN IN 2017
2017
30
2016
32
24%20%
PLASTICS, ELASTOMERS AND INTERMEDIATES
EBITDA, RR blnEBITDA margin, %
20%PLASTICS, ELASTOMERS AND INTERMEDIATES EBITDA MARGIN IN 2017
At the year-end our net leverage strengthened to 1.6x from 2.0x in Russian rouble terms or to 1.7x from 2.2x in USD terms. Despite the active phase of construction on the ZapSib project, SIBUR did not take on significant new borrowing and in fact repaid a portion of Group debt obligations and following the Eurobond redemption in early 2018 we extended the tenor to average maturity of 7.4 years.

32
HOW
WE
CREA
TE V
ALUE
SIBUR Annual Review 2017
INTRODUCTION VALUE CREATION DRIVERS HOW WE CREATE VALUE HOW WE SUSTAIN VALUE FINANCIAL INFORMATION ADDITIONAL INFO
https://www.sibur.ru/en/
How We Create Value
Integrated Value Chain 34
Map of Operations 36
Our Business 38
— Products and Markets 40
— Feedstock Sourcing 58
— Production Flows 60
— Transportation and Logistics 62
Operational Excellence 65
SIBUR Performance Management System 66
Production System of SIBUR 68
33
HOW
WE
CREA
TE V
ALUE
SIBURAnnual Review 2017
INTRODUCTION VALUE CREATION DRIVERS HOW WE CREATE VALUE HOW WE SUSTAIN VALUE FINANCIAL INFORMATION ADDITIONAL INFO
https://www.sibur.ru/en/
How We Create Value
PAGE 30
PAGE30
Integration
How We Create Value
Integ
ratio
nInt
egra
tion
How We Create Value
Integ
ratio
n
VALUE

34
HOW
WE
CREA
TE V
ALUE
SIBUR Annual Review 2017
INTRODUCTION VALUE CREATION DRIVERS HOW WE CREATE VALUE HOW WE SUSTAIN VALUE FINANCIAL INFORMATION ADDITIONAL INFO
https://www.sibur.ru/en/
Integrated Value Chain
10%
24%
19%
11%
10%
5%
5%
5%
Oilcompanies
SUPPLIERS CUSTOMERS
Gascompanies
Stranded APG purchased from oilcompanies processed by SIBUR’s GPPsto produce natural gas and raw NGL
APG
LPG
Raw NGL produced internally or purchasedfrom oil & gas companies fractionated at SIBUR GFUs into LPG and naphtha
Raw NGL
LPG and naphtha produced internally orpurchased from oil & gas companies aspetrochemical feedstock
Naphtha
MTBE produced from reaction of methanolwith isobutylene as an additive to gasoline
Methanol & other
0.4 mtnaphthapurchased
1.5 mtnaphthaproduced
LPG produced6.3 mt
0.6 mtLPG purchased
2.6 bcmraw NGLpurchased 71%
6%
94%
29%
53%
77%
9%
14%
5.4 bcmraw NGLproduced
19.3 bcmnatural gas produced
Intermediates polymerised or otherwise processed into higher value-addedpetrochemical products
Intermediates
Depending on local market balances andlogistical constraints we purchase certainvolumes of petrochemical products for further resale
Trading
22.3 bcm
18.5 bcmnatural gas
4.9 mtLPG
1.2 mtolefins & polyolefins
0.5 mtelastomers
0.8 mtplastics & organicsynthesis
0.2 mtmethanol purchased
4.4 mt*intermediates processed internally
Feedstock and Energy
Plastics, elastomers and intermediates
Olefins and polyolefins
Share in external revenueSales volumes
Petrochemicals sold externally
Energy products sold externally
Other revenue represented 11%of external revenue in 2017
LPG, naphtha andraw NGL processedat SIBUR’s crackers /PDH facility into a widerange of intermediatepetrochemical products
Cracking/dehydrogenation/
other chemicalProcessing
Intermediatesproduced5.1 mt*
Consolidationof naphtha flows
1.9 mt
Raw NGL fractionation
7.5 mt
Consolidationof raw NGL
flows8.0 mt
Consolidationof LPG flows
6.9 mt
Polymerisation & other processing
47%
* Gross volumes
Used to produce petrochemicals
Used to produce energy products
0.9 mtnaphtha
0.7 mtMTBE & fuel additives
FMCGConstructionChemicals
FMCGConstructionChemicals
Utilities
FuelsPetrochemicalsUtilities
AutomotiveConstruction
PetrochemicalsFuels
FuelsFuel additivesand components
Chemicals
0.5 mtintermediates
ILLUSTRATIVE
Gasprocessing
PROCESSING & PRODUCTION

35
HOW
WE
CREA
TE V
ALUE
SIBURAnnual Review 2017
INTRODUCTION VALUE CREATION DRIVERS HOW WE CREATE VALUE HOW WE SUSTAIN VALUE FINANCIAL INFORMATION ADDITIONAL INFO
https://www.sibur.ru/en/
10%
24%
19%
11%
10%
5%
5%
5%
Oilcompanies
SUPPLIERS CUSTOMERS
Gascompanies
Stranded APG purchased from oilcompanies processed by SIBUR’s GPPsto produce natural gas and raw NGL
APG
LPG
Raw NGL produced internally or purchasedfrom oil & gas companies fractionated at SIBUR GFUs into LPG and naphtha
Raw NGL
LPG and naphtha produced internally orpurchased from oil & gas companies aspetrochemical feedstock
Naphtha
MTBE produced from reaction of methanolwith isobutylene as an additive to gasoline
Methanol & other
0.4 mtnaphthapurchased
1.5 mtnaphthaproduced
LPG produced6.3 mt
0.6 mtLPG purchased
2.6 bcmraw NGLpurchased 71%
6%
94%
29%
53%
77%
9%
14%
5.4 bcmraw NGLproduced
19.3 bcmnatural gas produced
Intermediates polymerised or otherwise processed into higher value-addedpetrochemical products
Intermediates
Depending on local market balances andlogistical constraints we purchase certainvolumes of petrochemical products for further resale
Trading
22.3 bcm
18.5 bcmnatural gas
4.9 mtLPG
1.2 mtolefins & polyolefins
0.5 mtelastomers
0.8 mtplastics & organicsynthesis
0.2 mtmethanol purchased
4.4 mt*intermediates processed internally
Feedstock and Energy
Plastics, elastomers and intermediates
Olefins and polyolefins
Share in external revenueSales volumes
Petrochemicals sold externally
Energy products sold externally
Other revenue represented 11%of external revenue in 2017
LPG, naphtha andraw NGL processedat SIBUR’s crackers /PDH facility into a widerange of intermediatepetrochemical products
Cracking/dehydrogenation/
other chemicalProcessing
Intermediatesproduced5.1 mt*
Consolidationof naphtha flows
1.9 mt
Raw NGL fractionation
7.5 mt
Consolidationof raw NGL
flows8.0 mt
Consolidationof LPG flows
6.9 mt
Polymerisation & other processing
47%
* Gross volumes
Used to produce petrochemicals
Used to produce energy products
0.9 mtnaphtha
0.7 mtMTBE & fuel additives
FMCGConstructionChemicals
FMCGConstructionChemicals
Utilities
FuelsPetrochemicalsUtilities
AutomotiveConstruction
PetrochemicalsFuels
FuelsFuel additivesand components
Chemicals
0.5 mtintermediates
ILLUSTRATIVE
Gasprocessing
PROCESSING & PRODUCTION
36
HOW
WE
CREA
TE V
ALUE
SIBUR Annual Review 2017
INTRODUCTION VALUE CREATION DRIVERS HOW WE CREATE VALUE HOW WE SUSTAIN VALUE FINANCIAL INFORMATION ADDITIONAL INFO
https://www.sibur.ru/en/
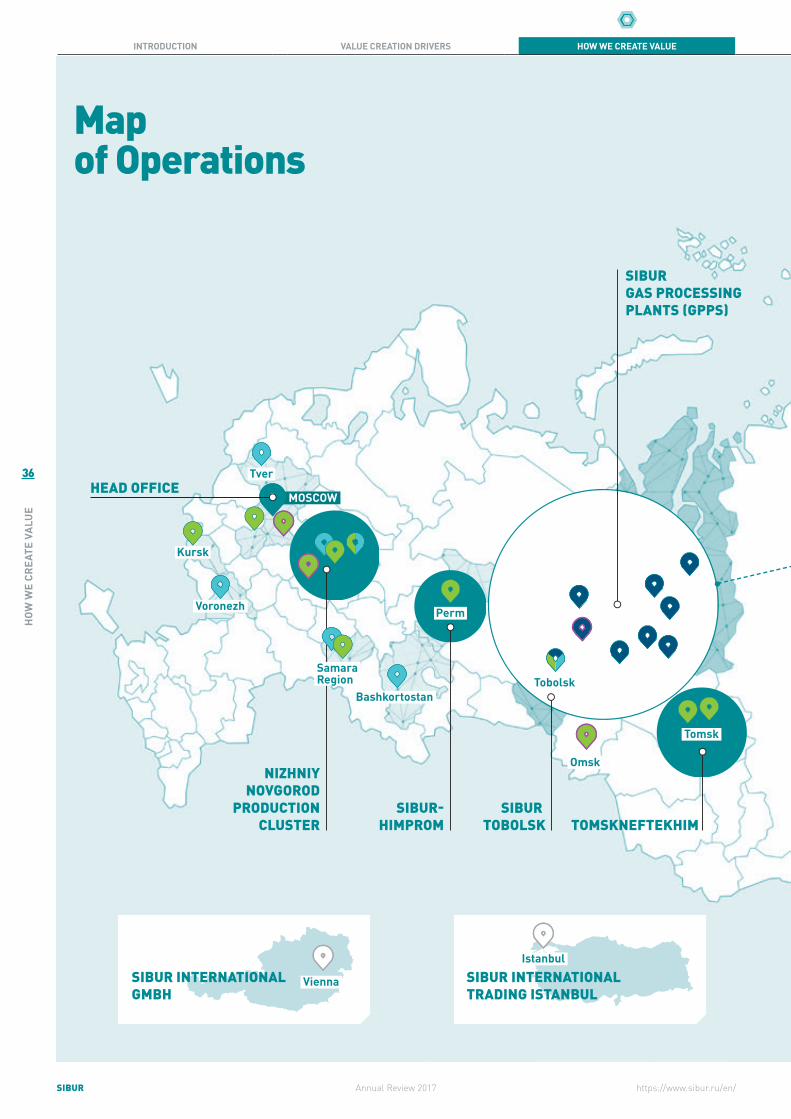
Voronezh
Tobolsk
Vienna
Bashkortostan
Tomsk Krasnoyarsk
Omsk
MOSCOW
Kursk
Perm
Tver
NIZHNIYNOVGOROD
PRODUCTIONCLUSTER
SIBUR GAS PROCESSING PLANTS (GPPS)
SIBUR INTERNATIONAL GMBH
IstanbulSIBUR INTERNATIONAL TRADING ISTANBUL Mumbai
HEAD OFFICE
SIBUR PETROCHEMICALINDIA PRIVATE LIMITED Shanghai
TOMSKNEFTEKHIMSIBUR-
HIMPROMSIBUR
TOBOLSK
Samara Region
SIBUR INTERNATIONALTRADING SHANGHAI
Map of Operations

37
HOW
WE
CREA
TE V
ALUE
SIBURAnnual Review 2017
INTRODUCTION VALUE CREATION DRIVERS HOW WE CREATE VALUE HOW WE SUSTAIN VALUE FINANCIAL INFORMATION ADDITIONAL INFO
https://www.sibur.ru/en/
Voronezh
Tobolsk
Vienna
Bashkortostan
Tomsk Krasnoyarsk
Omsk
MOSCOW
Kursk
Perm
Tver
NIZHNIYNOVGOROD
PRODUCTIONCLUSTER
SIBUR GAS PROCESSING PLANTS (GPPS)
SIBUR INTERNATIONAL GMBH
IstanbulSIBUR INTERNATIONAL TRADING ISTANBUL Mumbai
HEAD OFFICE
SIBUR PETROCHEMICALINDIA PRIVATE LIMITED Shanghai
TOMSKNEFTEKHIMSIBUR-
HIMPROMSIBUR
TOBOLSK
Samara Region
SIBUR INTERNATIONALTRADING SHANGHAI
Feedstock & Energy
Olefins & polyefins
Plastics, elastomers & intermediates
Sites operated under JV
Foreign trading offices
Key production facilities
Tobolsk
Pyt-Yakh
Purovsk
Noyabrsk
SIBUR TOBOLSKPRODUCTION SITE
Purovsky GCP(NOVATEK)
Yamal-NenetsAutonomous Area
Khanty-MansiAutonomous Area
TyumenRegion
SIBUR infrastructure
Third-party infrastructure
SIBUR ASSET BASE IN WESTERN SIBERIA

38
HOW
WE
CREA
TE V
ALUE
SIBUR Annual Review 2017
INTRODUCTION VALUE CREATION DRIVERS HOW WE CREATE VALUE HOW WE SUSTAIN VALUE FINANCIAL INFORMATION ADDITIONAL INFO
https://www.sibur.ru/en/
Our Business
FEEDSTOCK & ENERGY BUSINESS
SIBUR owns and operates Russia’s largest infrastructure for the processing and transportation of hydrocarbon feedstock.
SIBUR is a uniquely positioned vertically integrated gas processing and petrochemicals company. We own and operate Russia’s largest APG processing and raw NGL fractionation business and are a leader in the Russian petrochemicals industry.
We purchase by-products of the oil and gas extraction activities under long-term contracts from Russian energy companies, and process them into energy and petrochemical products.
Starting 2016, SIBUR introduced new segmental reporting to provide transparency on petrochemicals sub-segments with different profitability fundamentals. We now operate three business segments: Feedstock & Energy, Olefins & Polyolefins, and Plastics, Elastomers & Intermediates. The figures for the previous periods were changed to reflect the new segment structure introduced in 2016.
These business segments vary in their end-user markets, supply and demand trends, value drivers, and consequently profitability. However, they are highly integrated, with most of the feedstock for our petrochemicals businesses supplied by our Feedstock & Energy segment.
The Feedstock & Energy segment supplies approximately 37% of NGL volumes that could be sold on the open market internally as a feedstock for our petrochemicals business.
Our Feedstock & Energy (F&E) segment comprises:
• gathering APG from oil companies and processing it into natural gas and raw NGL at our Gas Processing Plants (GPPs);
• transportation, fractionation and other processing of NGLs, that we produce internally or purchase externally;
• production of energy products that are marketed and sold externally and are also used as feedstock by the Olefins and Polyolefins segment and the Plastics, Elastomers and Intermediates segment.
8 GPPs1
5 Compressor stations
2 GFUs
Assets and infrastructure of Feedstock & Energy businessesas of 31 December 2017
F&E FINANCIAL PERFORMANCE
External revenue, RR bln EBITDA, RR blnEBITDA margin, %
79
195
2014
35%
70
124
2013
46%
66
164
2015
35%
61
171
2016
31%
89
184
2017
39%
1 Including Yuzhno-Priobskiy GPP, JV between SIBUR and Gazprom Neft.

39
HOW
WE
CREA
TE V
ALUE
SIBURAnnual Review 2017
INTRODUCTION VALUE CREATION DRIVERS HOW WE CREATE VALUE HOW WE SUSTAIN VALUE FINANCIAL INFORMATION ADDITIONAL INFO
https://www.sibur.ru/en/
PETROCHEMICALS BUSINESSES
SIBUR operates an extensive petrochemicals production base and invests in capacity modernisation and expansion. Our Feedstock & Energy segment provides a reliable source of attractively priced raw materials for our petrochemicals businesses.
Starting 2016, SIBUR’s petrochemicals business comprises two reporting segments: Olefins & Polyolefins and Plastics, Elastomers & Intermediates. The figures for the previous periods were changed to reflect the new segment structure introduced in 2016.
The Olefins & Polyolefins (O&P) segment includes production and sales of polyolefins, such as polypropylene and polyethylene, BOPP-films and olefins comprising propylene and ethylene, which are either used internally in petrochemicals production or sold externally.
The Plastics, Elastomers & Intermediates (PE&I) segment produces a variety of petrochemical products, such as plastics and organic synthesis products, elastomers, methyl tertiary butyl ether (MTBE) and fuel additives, which are sold externally. The segment also produces intermediates, which are primarily used internally with a small share of volumes sold on the market.
Assets and infrastructure of the petrochemicals businessesas of 31 December 2016
1 PDH facility
3 Steam crackers
2 PP and LDPE production plants
5BOPP-films production plants
3 Elastomers production plants
4Plastic & organic synthesis production plants
External revenue, RR bln EBITDA, RR blnEBITDA margin, %
External revenue, RR bln EBITDA, RR blnEBITDA margin, %
O&P FINANCIAL PERFORMANCE) PE&I FINANCIAL PERFORMANCE)
1552
2014
21%
733
2013
13%37
75
2015
39%
49
87
2016
46%
45
88
2017
40%
8
105
2013
8%
16
106
2014
14%
34
128
2015
26%
32
131
2016
24%
30
147
2017
20%
40
HOW
WE
CREA
TE V
ALUE
SIBUR Annual Review 2017
INTRODUCTION VALUE CREATION DRIVERS HOW WE CREATE VALUE HOW WE SUSTAIN VALUE FINANCIAL INFORMATION ADDITIONAL INFO
https://www.sibur.ru/en/
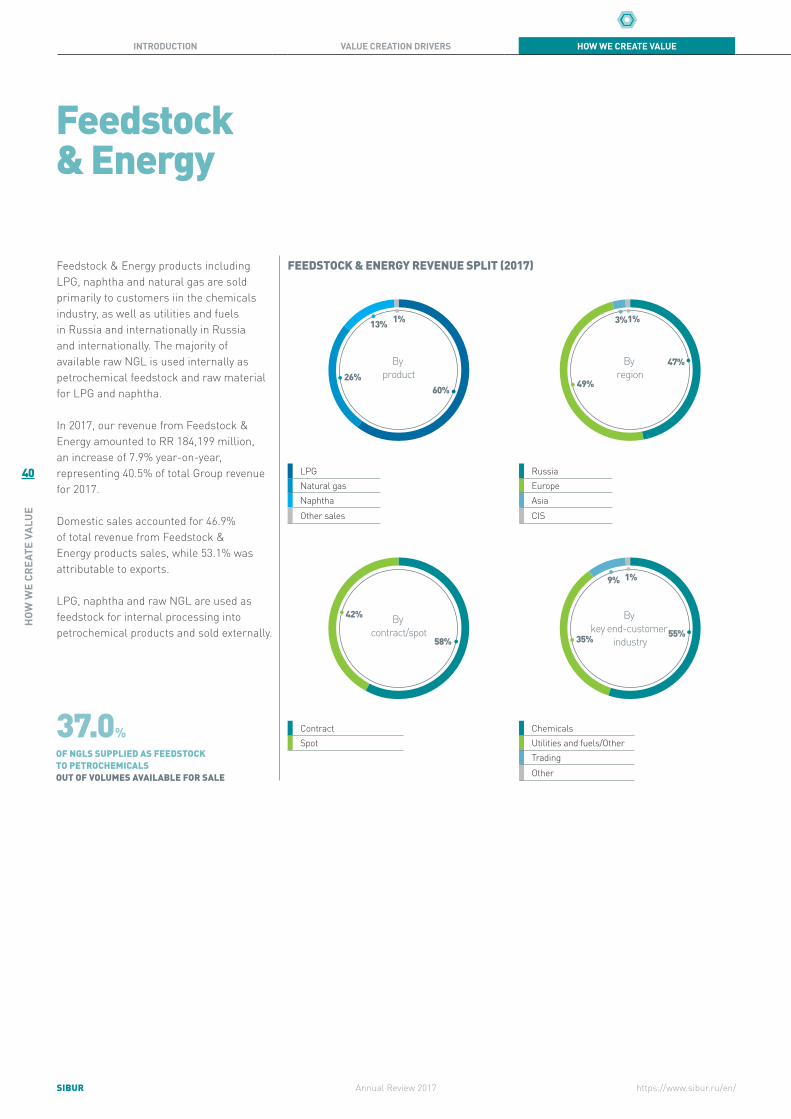
Feedstock & Energy
Feedstock & Energy products including LPG, naphtha and natural gas are sold primarily to customers iin the chemicals industry, as well as utilities and fuels in Russia and internationally in Russia and internationally. The majority of available raw NGL is used internally as petrochemical feedstock and raw material for LPG and naphtha.
In 2017, our revenue from Feedstock & Energy amounted to RR 184,199 million, an increase of 7.9% year-on-year, representing 40.5% of total Group revenue for 2017.
Domestic sales accounted for 46.9% of total revenue from Feedstock & Energy products sales, while 53.1% was attributable to exports.
LPG, naphtha and raw NGL are used as feedstock for internal processing into petrochemical products and sold externally.
FEEDSTOCK & ENERGY REVENUE SPLIT (2017)
26%60%
13% 1%
By product
By contract/spot
42%
58%
49%
47%
3%1%
By region
35% 55%
9% 1%
By key end-customer
industry
LPGNatural gasNaphthaOther sales
ContractSpot
RussiaEuropeAsiaCIS
ChemicalsUtilities and fuels/OtherTradingOther
37.0% OF NGLS SUPPLIED AS FEEDSTOCK TO PETROCHEMICALS OUT OF VOLUMES AVAILABLE FOR SALE
41
HOW
WE
CREA
TE V
ALUE
SIBURAnnual Review 2017
INTRODUCTION VALUE CREATION DRIVERS HOW WE CREATE VALUE HOW WE SUSTAIN VALUE FINANCIAL INFORMATION ADDITIONAL INFO
https://www.sibur.ru/en/
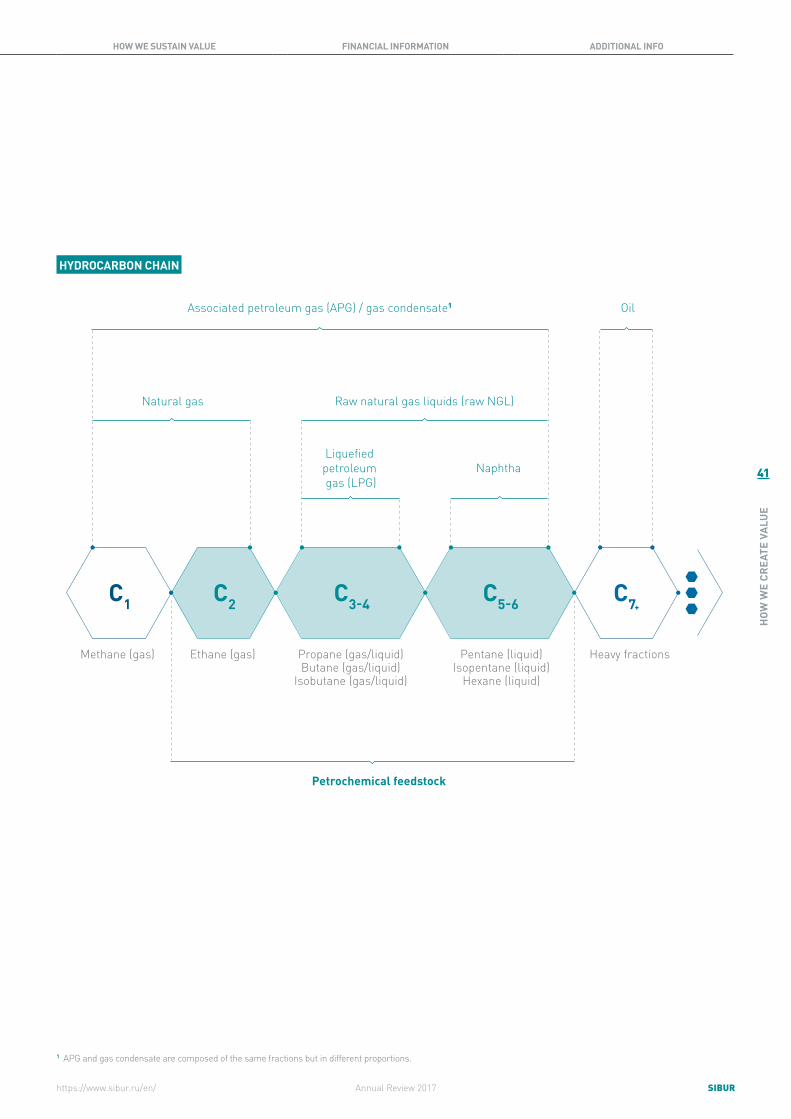
HYDROCARBON CHAIN
C1 C7+C2 C3-4 C5-6
Associated petroleum gas (APG) / gas condensate1 Oil
NaphthaLiquefied petroleum gas (LPG)
Natural gas
Methane (gas) Heavy fractionsEthane (gas) Propane (gas/liquid) Butane (gas/liquid)
Isobutane (gas/liquid)
Pentane (liquid) Isopentane (liquid)
Hexane (liquid)
Raw natural gas liquids (raw NGL)
Petrochemical feedstock
1 APG and gas condensate are composed of the same fractions but in different proportions.

42
HOW
WE
CREA
TE V
ALUE
SIBUR Annual Review 2017
INTRODUCTION VALUE CREATION DRIVERS HOW WE CREATE VALUE HOW WE SUSTAIN VALUE FINANCIAL INFORMATION ADDITIONAL INFO
https://www.sibur.ru/en/
Product Production site LocationNameplate capacity (tonnes)
as of 31 DecemberAverage capacity
utilisation, %
2017 2016 2017 2016
Processing capacity, billion cubic metres of APG
Natural gas raw NGL naphtha LPG
Gas processing plants (GPPs) Khanty-Mansi Autonomous Area Yamal-Nenets Autonomous Area 25.4 25.4 90% 88%
Processing capacity, million tonnes of raw NGL
LPG naphtha Gas fractionation units (GFUs) Tobolsk
Perm 8.6 9.51 94% 87%
Production capacity, million tonnes
Butadiene SIBUR Tobolsk Tobolsk 0.2 0.2 99% 95%
1 Including Uralorgsintez divested in 2017.
Feedstock & EnergyOlefins & PolyefinsPlastics & organic synthesis
Intermediates & other chemicalsMTBE & fuel additivesFacilities operated under Joint ventures
Feedstock & Energy (continued)
GUBKINSKIY GPP
MURAVLENKOVSKIY GPP
NYAGAN GPP
YUZHNO-PRIOBSKIY GPP
SIBUR-HIMPROM
VYNGAPUROVSKIY GPP
BELOZERNIY GPP
NIZHNEVARTOVSKIY GPP
YUZHNO-BALYKSKIY GPP
SIBUR-TOBOLSK
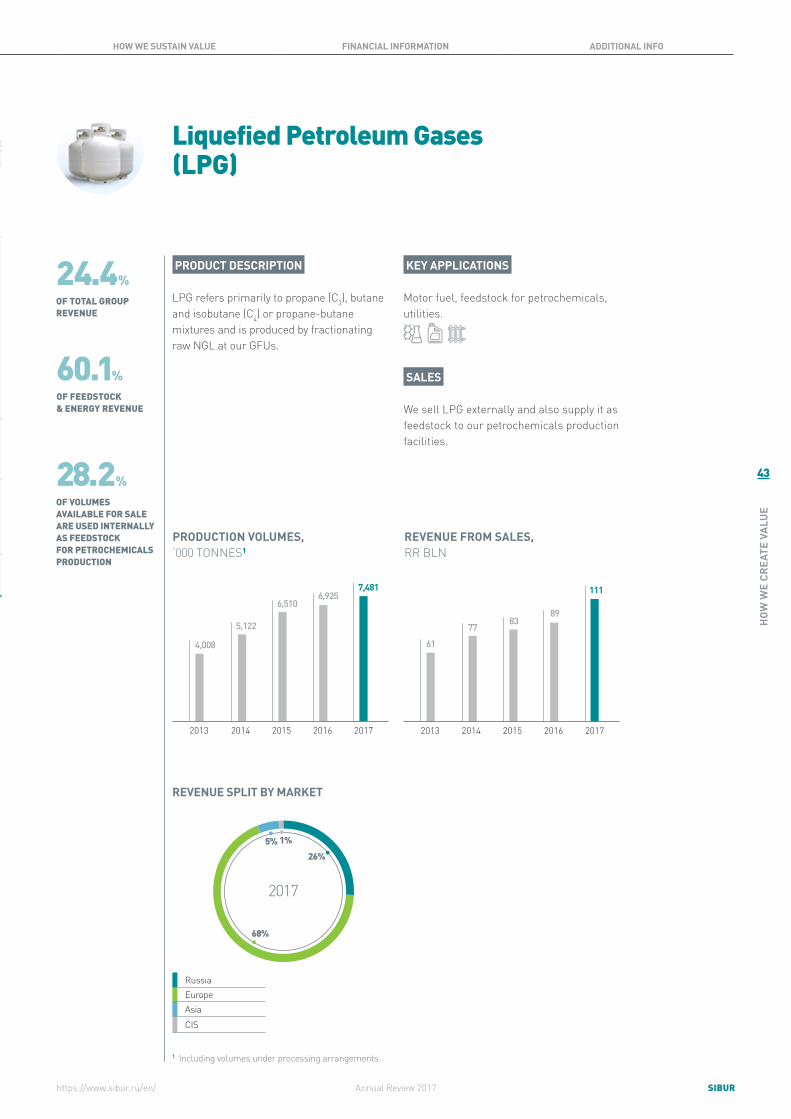
43
HOW
WE
CREA
TE V
ALUE
SIBURAnnual Review 2017
INTRODUCTION VALUE CREATION DRIVERS HOW WE CREATE VALUE HOW WE SUSTAIN VALUE FINANCIAL INFORMATION ADDITIONAL INFO
https://www.sibur.ru/en/
KEY APPLICATIONS
Motor fuel, feedstock for petrochemicals, utilities.
Liquefied Petroleum Gases (LPG)
SALES
We sell LPG externally and also supply it as feedstock to our petrochemicals production facilities.
24.4%OF TOTAL GROUP REVENUE
28.2%OF VOLUMES AVAILABLE FOR SALE ARE USED INTERNALLY AS FEEDSTOCK FOR PETROCHEMICALS PRODUCTION
60.1%OF FEEDSTOCK & ENERGY REVENUE
PRODUCT DESCRIPTION
LPG refers primarily to propane (C3), butane and isobutane (C4) or propane-butane mixtures and is produced by fractionating raw NGL at our GFUs.
7,481
2017
6,925
2016
6,510
2015
5,122
2014
4,008
2013
PRODUCTION VOLUMES, ‘000 TONNES1
111
2017
89
2016
83
2015
77
2014
61
2013
REVENUE FROM SALES, RR BLN
REVENUE SPLIT BY MARKET
68%
26%5% 1%
2017
RussiaEuropeAsiaCIS
1 Including volumes under processing arrangements.

44
HOW
WE
CREA
TE V
ALUE
SIBUR Annual Review 2017
INTRODUCTION VALUE CREATION DRIVERS HOW WE CREATE VALUE HOW WE SUSTAIN VALUE FINANCIAL INFORMATION ADDITIONAL INFO
https://www.sibur.ru/en/
KEY APPLICATIONS
Utilities.
SALES
We sell natural gas to Russian oil and gas companies and, to a limited extent, to Russian regional and municipal power companies. Natural gas is not used as feedstock for our petrochemicals business, only as fuel at our GPPs and for our own heat and power generation.
Natural Gas
PRODUCT DESCRIPTION
Natural gas comprises methane (C1) and ethane (C2). SIBUR produces natural gas at its GPPs through processing of APG purchased from oil companies, which we separate into natural gas and raw NGL.
2013
12
17
2014
19
2017
19
2016
18
2015
JVs’ share in production volumes
PRODUCTION VOLUMES, BLN CUBIC METRES
47
2017
46
2016
43
2015
38
2014
27
2013
REVENUE FROM SALES, RR BLN
REVENUE SPLIT BY MARKET
2017
100%
Russia
10.4%OF TOTAL GROUP REVENUE
25.8%OF FEEDSTOCK & ENERGY REVENUE
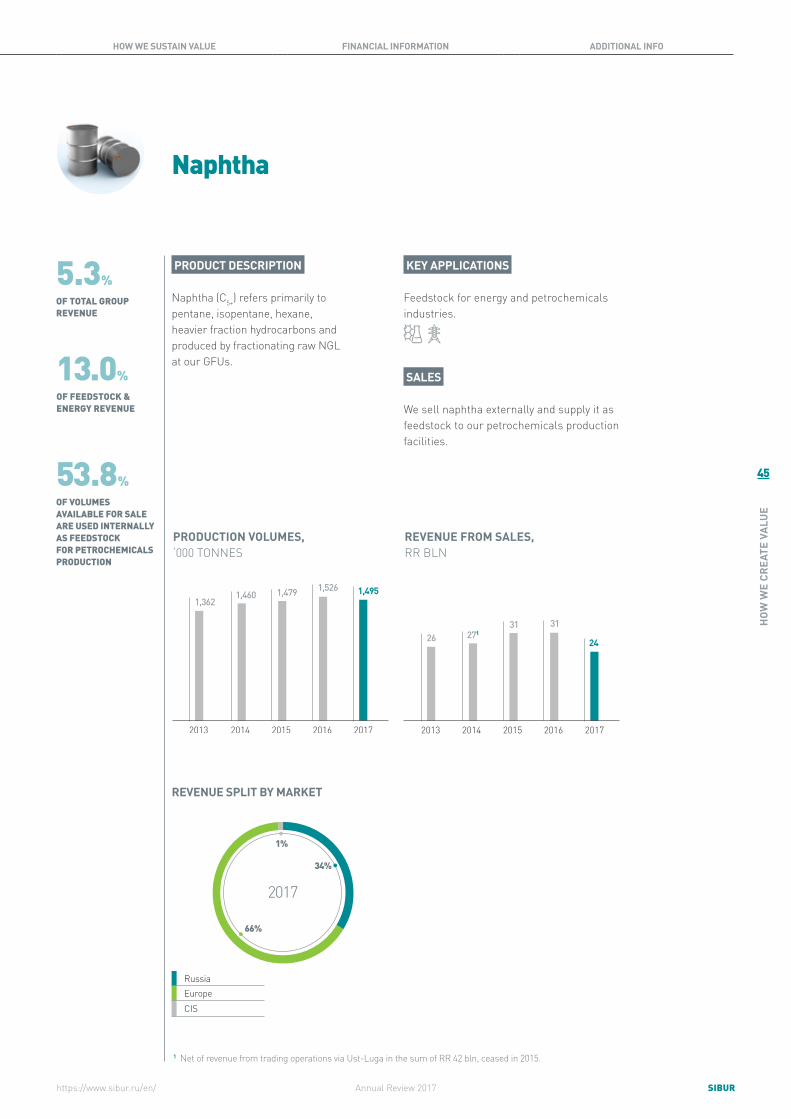
45
HOW
WE
CREA
TE V
ALUE
SIBURAnnual Review 2017
INTRODUCTION VALUE CREATION DRIVERS HOW WE CREATE VALUE HOW WE SUSTAIN VALUE FINANCIAL INFORMATION ADDITIONAL INFO
https://www.sibur.ru/en/
KEY APPLICATIONS
Feedstock for energy and petrochemicals industries.
SALES
We sell naphtha externally and supply it as feedstock to our petrochemicals production facilities.
Naphtha
PRODUCT DESCRIPTION
Naphtha (C5+) refers primarily topentane, isopentane, hexane,heavier fraction hydrocarbons andproduced by fractionating raw NGLat our GFUs.
1,495
2017
1,526
2016
1,479
2015
1,460
2014
1,362
2013
PRODUCTION VOLUMES, ‘000 TONNES
REVENUE FROM SALES, RR BLN
5.3%OF TOTAL GROUP REVENUE
53.8%OF VOLUMES AVAILABLE FOR SALE ARE USED INTERNALLY AS FEEDSTOCK FOR PETROCHEMICALS PRODUCTION
13.0%OF FEEDSTOCK & ENERGY REVENUE
24
2017
31
2016
31
2015
271
2014
26
2013
1 Net of revenue from trading operations via Ust-Luga in the sum of RR 42 bln, ceased in 2015.
REVENUE SPLIT BY MARKET
2017
34%
66%
1%
RussiaEuropeCIS
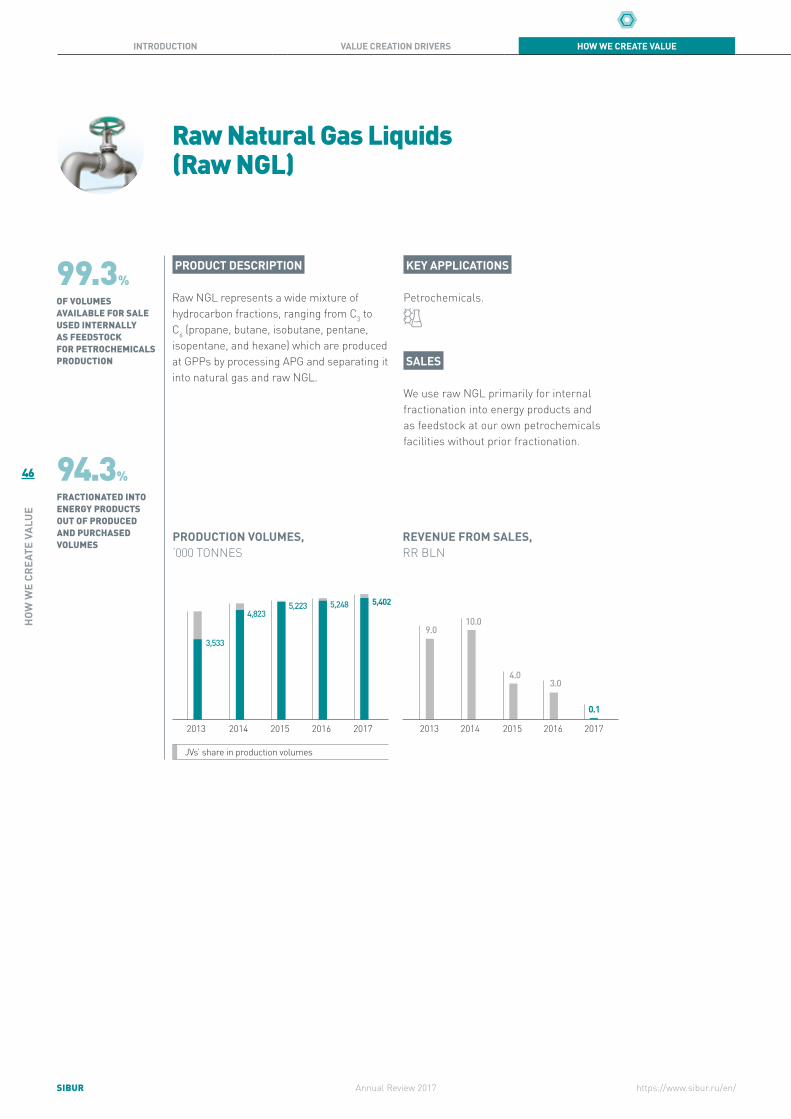
46
HOW
WE
CREA
TE V
ALUE
SIBUR Annual Review 2017
INTRODUCTION VALUE CREATION DRIVERS HOW WE CREATE VALUE HOW WE SUSTAIN VALUE FINANCIAL INFORMATION ADDITIONAL INFO
https://www.sibur.ru/en/
KEY APPLICATIONS
Petrochemicals.
SALES
We use raw NGL primarily for internal fractionation into energy products and as feedstock at our own petrochemicals facilities without prior fractionation.
Raw Natural Gas Liquids (Raw NGL)
99.3%OF VOLUMES AVAILABLE FOR SALE USED INTERNALLY AS FEEDSTOCK FOR PETROCHEMICALS PRODUCTION
94.3%FRACTIONATED INTO ENERGY PRODUCTS OUT OF PRODUCED AND PURCHASED VOLUMES
PRODUCT DESCRIPTION
Raw NGL represents a wide mixture of hydrocarbon fractions, ranging from C3 to C6 (propane, butane, isobutane, pentane, isopentane, and hexane) which are produced at GPPs by processing APG and separating it into natural gas and raw NGL.
0.1
2017
3.0
2016
4.0
2015
10.0
2014
9.0
2013
REVENUE FROM SALES, RR BLN
2017
5,402
2013
3,533
2016
5,248
2015
5,2234,823
2014
PRODUCTION VOLUMES, ‘000 TONNES
JVs’ share in production volumes

47
HOW
WE
CREA
TE V
ALUE
SIBURAnnual Review 2017
INTRODUCTION VALUE CREATION DRIVERS HOW WE CREATE VALUE HOW WE SUSTAIN VALUE FINANCIAL INFORMATION ADDITIONAL INFO
https://www.sibur.ru/en/
Olefins & Polyolefins
SIBUR’s Olefins & Polyolefins segment comprises polypropylene, polyethylene, BOPP-films and olefins. Polyolefins are sold primarily to customers in the fast moving consumer goods (FMCG), construction and chemical industries both on the domestic and export markets. The majority of olefins are used to produce higher value added petrochemical products and sold in Russia, primarily to RusVinyl.
In 2017, our revenue from Olefins & Polyolefins totaled RR 88,135 million, a 1.5% increase year-on-year, and accounted for 19.4% of the total Group revenue for 2017. Domestic sales accounted for 67% of total revenue from Olefins & Polyolefins sales, while 33% was attributable to exports.
OLEFINS & POLYOLEFINS REVENUE SPLIT (2017)
24%
48%
19%
2%7%
By product
64%
36%
By contract/spot
11%
67%
11%
11%
By region
10%63%
9%
9%9%
By key end-customer
industry
PPPE (LDPE)BOPP-filmsOlefins
Other
ContractSpot
RussiaEuropeAsiaCIS
FMCGTradingConstructionChemicalsOther
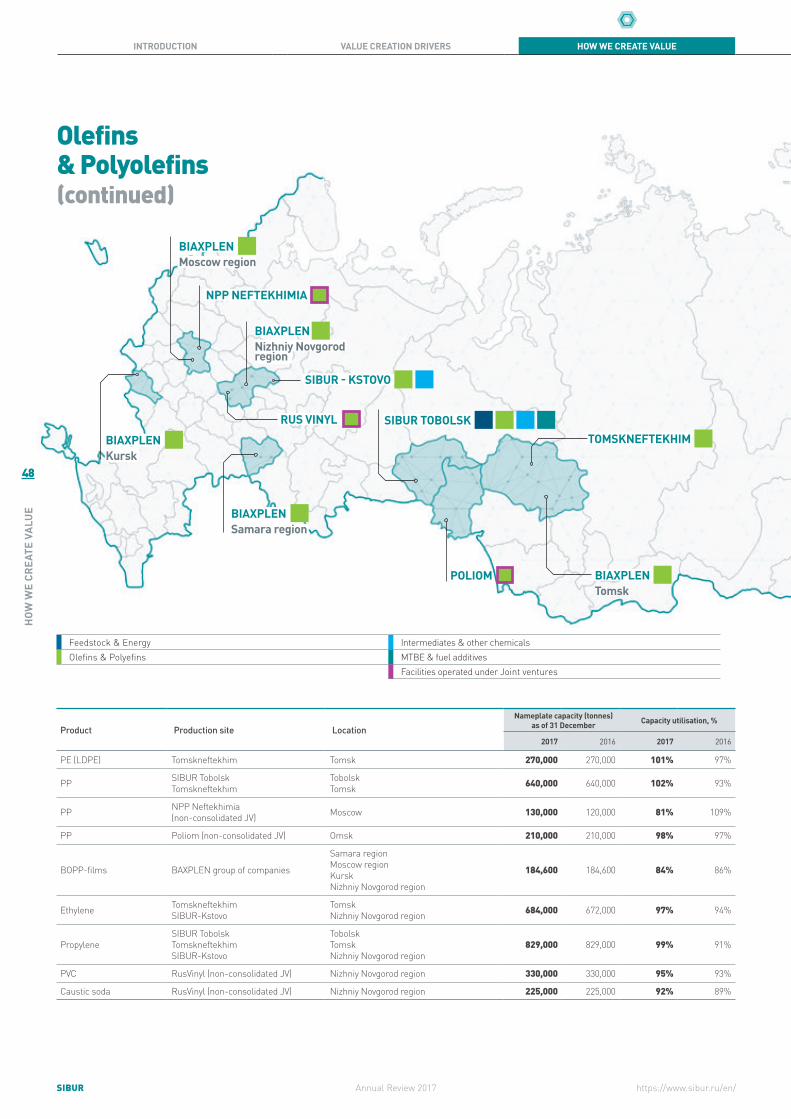
48
HOW
WE
CREA
TE V
ALUE
SIBUR Annual Review 2017
INTRODUCTION VALUE CREATION DRIVERS HOW WE CREATE VALUE HOW WE SUSTAIN VALUE FINANCIAL INFORMATION ADDITIONAL INFO
https://www.sibur.ru/en/
Product Production site LocationNameplate capacity (tonnes)
as of 31 December Capacity utilisation, %
2017 2016 2017 2016
PE (LDPE) Tomskneftekhim Tomsk 270,000 270,000 101% 97%
PP SIBUR Tobolsk Tomskneftekhim
Tobolsk Tomsk 640,000 640,000 102% 93%
PP NPP Neftekhimia (non-consolidated JV) Moscow 130,000 120,000 81% 109%
PP Poliom (non-consolidated JV) Omsk 210,000 210,000 98% 97%
BOPP-films BAXPLEN group of companies
Samara region Moscow region Kursk Nizhniy Novgorod region
184,600 184,600 84% 86%
Ethylene Tomskneftekhim SIBUR-Kstovo
Tomsk Nizhniy Novgorod region 684,000 672,000 97% 94%
PropyleneSIBUR Tobolsk Tomskneftekhim SIBUR-Kstovo
Tobolsk Tomsk Nizhniy Novgorod region
829,000 829,000 99% 91%
PVC RusVinyl (non-consolidated JV) Nizhniy Novgorod region 330,000 330,000 95% 93%
Caustic soda RusVinyl (non-consolidated JV) Nizhniy Novgorod region 225,000 225,000 92% 89%
Olefins & Polyolefins (continued)
Feedstock & EnergyOlefins & Polyefins
Intermediates & other chemicalsMTBE & fuel additivesFacilities operated under Joint ventures
SIBUR TOBOLSK
BIAXPLEN Samara region
BIAXPLEN Kursk
BIAXPLEN Moscow region
NPP NEFTEKHIMIA
RUS VINYL
BIAXPLEN Tomsk
POLIOM
TOMSKNEFTEKHIM
BIAXPLEN
regionNizhniy Novgorod

49
HOW
WE
CREA
TE V
ALUE
SIBURAnnual Review 2017
INTRODUCTION VALUE CREATION DRIVERS HOW WE CREATE VALUE HOW WE SUSTAIN VALUE FINANCIAL INFORMATION ADDITIONAL INFO
https://www.sibur.ru/en/
Olefins & Polyolefins
PRODUCT DESCRIPTION
SIBUR’s Olefins and Polyolefins include polypropylene (PP) and polyethylene (LDPE), BOPP-films and olefins.
PP and LDPE are granulated thermoplastic polymers that are derived from polymerisation of olefins – propylene and ethylene, respectively, that are produced internally.
BOPP-films include coextruded, coated, non-heat sealable or homopolymer films in a variety of finishes.
SALES
We sell polyolefins to external clients in Russia and abroad and also use certain volumes of PP internally in BOPP-films production.
While some olefins are sold externally to other petrochemicals companies, we process most of the volumes internally into higher value-added petrochemical products.
1 Due to introduction of the new segment breakdown, figures are available for 2014-2017 years only.
2,558
2017
2,379
2016
2,182
2015
1,780
2014
PRODUCTION VOLUMES1, ‘000 TONNES
19.4%OF TOTAL GROUP REVENUE
37.5%OF PETROCHEMICAL BUSINESSES REVENUE
REVENUE FROM SALES1, RR BLN
88
2017
87
2016
75
2015
52
2014
KEY APPLICATIONS
PP Consumer goods, packaging, BOPP-films, hygiene products, pipes, fibres and automotive components.
LDPE Consumer goods, coating materials for electrotechnical and energy industry, film for agricultural industry, various packaging.
BOPP-films Packaging and production of labels and adhesive tapes.
Olefins Production of PP and LDPE.

50
HOW
WE
CREA
TE V
ALUE
SIBUR Annual Review 2017
INTRODUCTION VALUE CREATION DRIVERS HOW WE CREATE VALUE HOW WE SUSTAIN VALUE FINANCIAL INFORMATION ADDITIONAL INFO
https://www.sibur.ru/en/
64%
36%
By contract/spot
Plastics, Elastomers & Intermediates
Within the Plastics, Elastomers & Intermediates segment we produce plastics and organic synthesis products comprising PET, glycols, expandable polystyrene, alcohols and acrylates; elastomers comprising various grades of commodity and specialty rubbers and thermoplastic elastomers; MTBE and fuel additives, which are sold externally. The segment also produces intermediates, which are primarily used internally with a small amount being sold on the market.
Each of these product groups has particular characteristics and distinct market fundamentals, however, all are sold to industrial customers in key end-markets, such as chemicals, automotive, construction, utilities & fuels, fast moving consumer goods (FMCG) and other sectors.
In 2017, SIBUR’s Plastics, Elastomers & Intermediates segment external revenue increased by 12.4% to RR 146,877 million and accounted for 32.3% of the total Group revenue. Domestic sales accounted for 57% of total revenue from Plastics, Elastomers & Intermediates sales, while 43% was attributable to exports.
We use a large portion of intermediates & other chemicals internally for processing into higher value added petrochemical products.
SIBUR’s integrated business model enables us to change the composition of our feedstock and product mix to optimise purchasing, production, sales and logistics in order to maximise our blended margins.
PLASTICS, ELASTOMERS & INTERMEDIATES REVENUE SPLIT (2017)
16%
35%16%
1%
32%
By product
23%57%
10%
2%8%
By region
13%
25%
14%
11%5%
18%
15%
By key end-customer
industry
ElastomersPlastics & organic synthesis productsIntermediates & other chemicalsMTBE & fuel additives
Other
ContractSpot
RussiaEuropeAsiaCIS
Other
ChemicalsAutomotiveConstructionUtilities and fuelsFMCGTradingOther
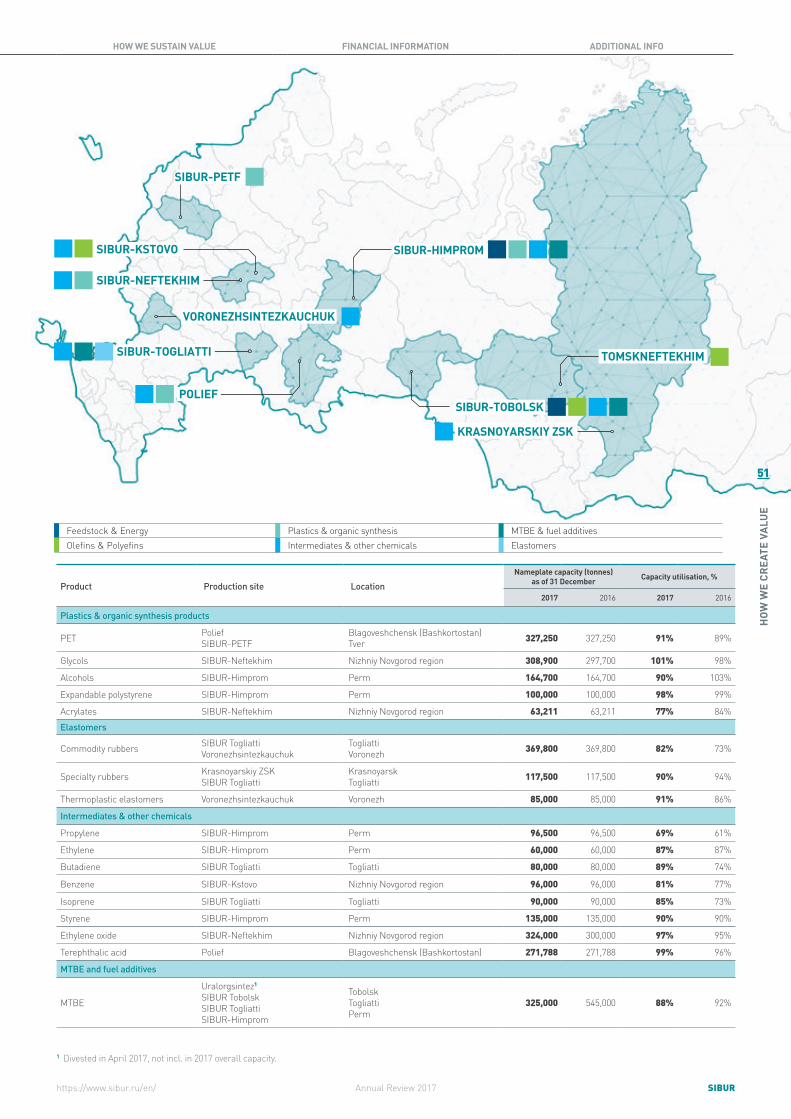
SIBURAnnual Review 2017
INTRODUCTION VALUE CREATION DRIVERS HOW WE CREATE VALUE HOW WE SUSTAIN VALUE FINANCIAL INFORMATION ADDITIONAL INFO
https://www.sibur.ru/en/
SIBUR-PETF
SIBUR-TOGLIATTI
SIBUR-KSTOVO SIBUR-HIMPROM
TOMSKNEFTEKHIM
VORONEZHSINTEZKAUCHUK
KRASNOYARSKIY ZSK
SIBUR-TOBOLSKPOLIEF
SIBUR-NEFTEKHIM
Product Production site LocationNameplate capacity (tonnes)
as of 31 December Capacity utilisation, %
2017 2016 2017 2016
Plastics & organic synthesis products
PET Polief SIBUR-PETF
Blagoveshchensk (Bashkortostan) Tver 327,250 327,250 91% 89%
Glycols SIBUR-Neftekhim Nizhniy Novgorod region 308,900 297,700 101% 98%
Alcohols SIBUR-Himprom Perm 164,700 164,700 90% 103%
Expandable polystyrene SIBUR-Himprom Perm 100,000 100,000 98% 99%
Acrylates SIBUR-Neftekhim Nizhniy Novgorod region 63,211 63,211 77% 84%Elastomers
Commodity rubbers SIBUR Togliatti Voronezhsintezkauchuk
Togliatti Voronezh 369,800 369,800 82% 73%
Specialty rubbers Krasnoyarskiy ZSK SIBUR Togliatti
Krasnoyarsk Togliatti 117,500 117,500 90% 94%
Thermoplastic elastomers Voronezhsintezkauchuk Voronezh 85,000 85,000 91% 86%
Intermediates & other chemicals
Propylene SIBUR-Himprom Perm 96,500 96,500 69% 61%
Ethylene SIBUR-Himprom Perm 60,000 60,000 87% 87%
Butadiene SIBUR Togliatti Togliatti 80,000 80,000 89% 74%
Benzene SIBUR-Kstovo Nizhniy Novgorod region 96,000 96,000 81% 77%
Isoprene SIBUR Togliatti Togliatti 90,000 90,000 85% 73%
Styrene SIBUR-Himprom Perm 135,000 135,000 90% 90%
Ethylene oxide SIBUR-Neftekhim Nizhniy Novgorod region 324,000 300,000 97% 95%
Terephthalic acid Polief Blagoveshchensk (Bashkortostan) 271,788 271,788 99% 96%
MTBE and fuel additives
MTBE
Uralorgsintez1 SIBUR Tobolsk SIBUR Togliatti SIBUR-Himprom
Tobolsk Togliatti Perm
325,000 545,000 88% 92%
1 Divested in April 2017, not incl. in 2017 overall capacity.
Feedstock & EnergyOlefins & Polyefins
Plastics & organic synthesisIntermediates & other chemicals
51
HOW
WE
CREA
TE V
ALUE
MTBE & fuel additivesElastomers
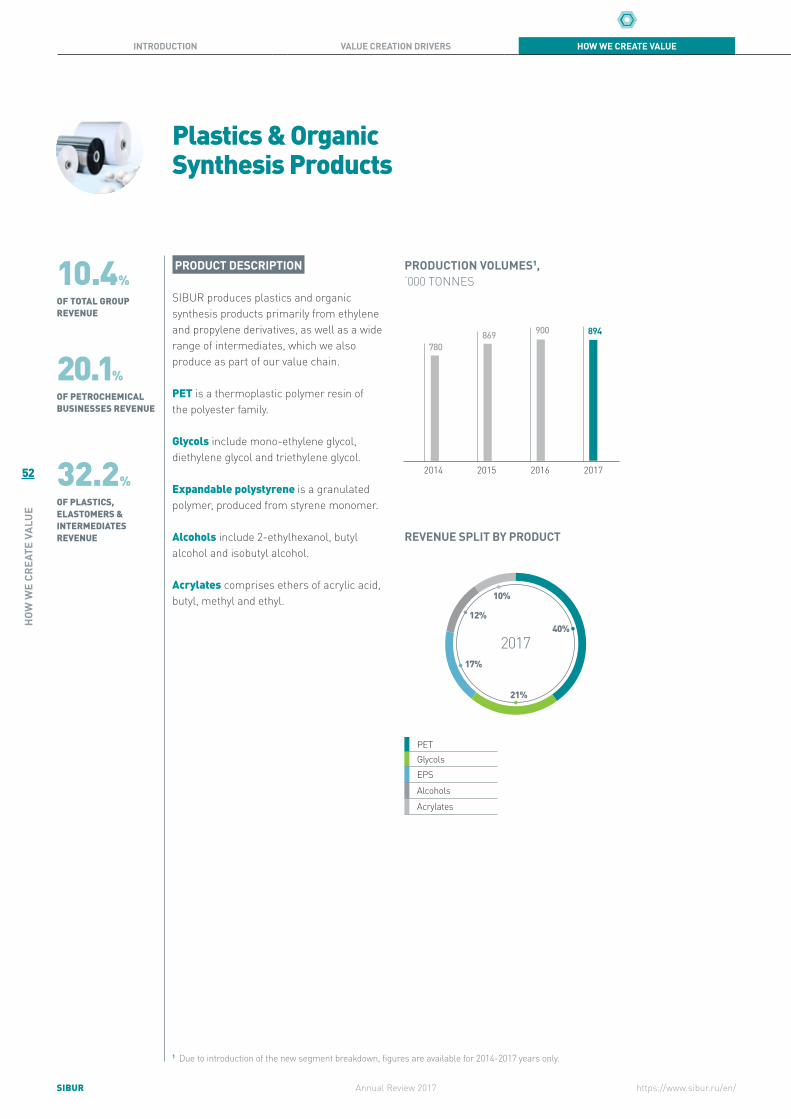
52
HOW
WE
CREA
TE V
ALUE
SIBUR Annual Review 2017
INTRODUCTION VALUE CREATION DRIVERS HOW WE CREATE VALUE HOW WE SUSTAIN VALUE FINANCIAL INFORMATION ADDITIONAL INFO
https://www.sibur.ru/en/
Plastics & Organic Synthesis Products
PRODUCT DESCRIPTION
SIBUR produces plastics and organic synthesis products primarily from ethylene and propylene derivatives, as well as a wide range of intermediates, which we also produce as part of our value chain.
PET is a thermoplastic polymer resin of the polyester family.
Glycols include mono-ethylene glycol, diethylene glycol and triethylene glycol.
Expandable polystyrene is a granulated polymer, produced from styrene monomer.
Alcohols include 2-ethylhexanol, butyl alcohol and isobutyl alcohol.
Acrylates comprises ethers of acrylic acid, butyl, methyl and ethyl.
1 Due to introduction of the new segment breakdown, figures are available for 2014-2017 years only.
894
2017
900
2016
869
2015
780
2014
PRODUCTION VOLUMES1, ‘000 TONNES
REVENUE SPLIT BY PRODUCT
201740%
21%
17%
10%
12%
PETGlycolsEPS
Alcohols
Acrylates
10.4%OF TOTAL GROUP REVENUE
32.2%OF PLASTICS, ELASTOMERS & INTERMEDIATES REVENUE
20.1%OF PETROCHEMICAL BUSINESSES REVENUE

53
HOW
WE
CREA
TE V
ALUE
SIBURAnnual Review 2017
INTRODUCTION VALUE CREATION DRIVERS HOW WE CREATE VALUE HOW WE SUSTAIN VALUE FINANCIAL INFORMATION ADDITIONAL INFO
https://www.sibur.ru/en/
KEY APPLICATIONS
PET Packaging for beverages and food, other containers.
Glycols PET, polyester fiber, de-icing liquids, cooling and antifreezing liquids, extragent for aromatic hydrocarbons and reagent for natural gas drying.
EPS Production of thermoinsulation blocks, packaging materials as well as for decorative elements.
Alcohols Production of plasticisers, acetates, acrylates, oil additives, as solvents for plastics and varnish, as antifoaming agent, as well as a component for perfume compounds.
Acrylates Production of acrylic emulsions, superabsorbents, building mixes and adhesives used in the construction and textile industries.
SALES
We sell these products to external customers in a variety of industries in Russia and abroad with a strong focus on domestic market for the majority of the products and also use certain volumes internally, primarily in the production of higher value-added products.
47
2017
46
2016
47
2015
35
2014
REVENUE FROM SALES1, RR BLN
REVENUE SPLIT BY MARKET
2017
77%
12%
2%9%
RussiaCISEurope
Asia
1 Due to introduction of the new segment breakdown, figures are available for 2014-2017 years only.

54
HOW
WE
CREA
TE V
ALUE
SIBUR Annual Review 2017
INTRODUCTION VALUE CREATION DRIVERS HOW WE CREATE VALUE HOW WE SUSTAIN VALUE FINANCIAL INFORMATION ADDITIONAL INFO
https://www.sibur.ru/en/
11.4%OF TOTAL GROUP REVENUE
Elastomers
PRODUCT DESCRIPTION
Elastomers comprise commodity rubbers, specialty rubbers and thermoplastic elastomers (SBS). Commodity rubbers have elastic and other properties that are somewhat similar to natural rubbers. Some specialty rubbers are characterised by oil and petrol resistance, gas impermeability, in addition to basic rubber properties. Thermoplastic elastomers demonstrate both thermoplastic and elastomeric properties.
REVENUE SPLIT BY PRODUCT
201760%21%
19%
Commodity rubbersSpecialty rubbersThermoplastic elastomers
35.3%OF PLASTICS, ELASTOMERS & INTERMEDIATES REVENUE
22.1%OF PETROCHEMICAL BUSINESSES REVENUE
485
2017
445
2016
409
2015
353
2014
418
2013
PRODUCTION VOLUMES, ‘000 TONNES

55
HOW
WE
CREA
TE V
ALUE
SIBURAnnual Review 2017
INTRODUCTION VALUE CREATION DRIVERS HOW WE CREATE VALUE HOW WE SUSTAIN VALUE FINANCIAL INFORMATION ADDITIONAL INFO
https://www.sibur.ru/en/
KEY APPLICATIONS
Commodity rubbers Tyres, mechanical rubber goods for automotive and machine building industries, asbestos technical (frictional) goods and adhesives, footwear.
Specialty rubbers Tyre inner tubes and vulcanising diaphragms, mechanical rubber goods for asbestos technical (frictional) goods and adhesives, footwear.
Thermoplastic elastomers Construction, healthcare, automotive and electronics.
SALES
We sell 100% of rubbers to external customers both in Russia and abroad.
REVENUE SPLIT BY MARKET
201736%
24%
5%6%
29%
RussiaEuropeAsia
CIS
Other
REVENUE FROM SALES, RR BLN
52
2017
39
2016
35
2015
28
2014
32
2013

56
HOW
WE
CREA
TE V
ALUE
SIBUR Annual Review 2017
INTRODUCTION VALUE CREATION DRIVERS HOW WE CREATE VALUE HOW WE SUSTAIN VALUE FINANCIAL INFORMATION ADDITIONAL INFO
https://www.sibur.ru/en/
MTBE & Fuel Additives
PRODUCT DESCRIPTION
МТBE is a fuel additive that is used to increase the octane level in gasoline and produced from the reaction of methanol with isobutylene fraction.
5.1%OF TOTAL GROUP REVENUE
15.7%OF PLASTICS, ELASTOMERS & INTERMEDIATES REVENUE
9.8%OF PETROCHEMICAL BUSINESSES REVENUE
786
2017
730
2016
674
2015
656
2014
727
2013
PRODUCTION VOLUMES, ‘000 TONNES
23
2017
23
2016
25
2015
23
2014
22
2013
REVENUE FROM SALES, RR BLN
REVENUE SPLIT BY PRODUCT
2017
82%
18%
MTBEOther fuels and fuel additives
REVENUE SPLIT BY MARKET
201743%
10%
2%
46%
RussiaCISEurope
Other
KEY APPLICATIONS
Motor fuel.
SALES
We sell 100% of MTBE externally to oil refineries in Russia and abroad.
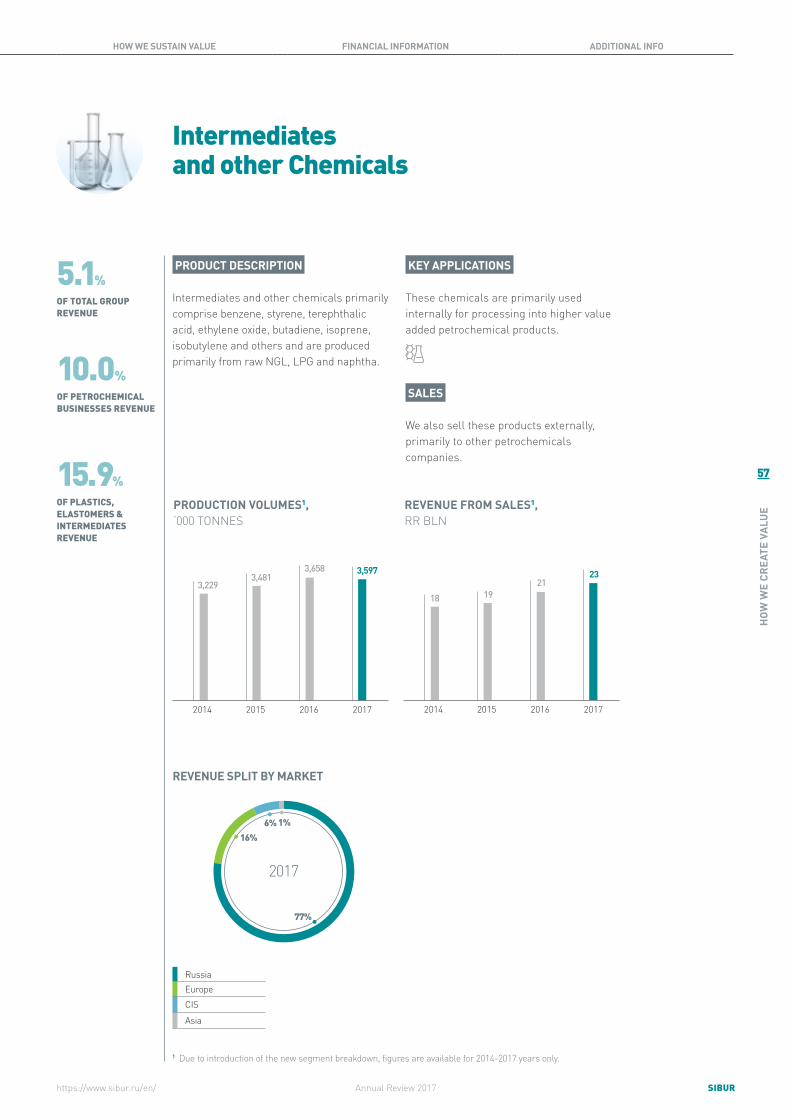
57
HOW
WE
CREA
TE V
ALUE
SIBURAnnual Review 2017
INTRODUCTION VALUE CREATION DRIVERS HOW WE CREATE VALUE HOW WE SUSTAIN VALUE FINANCIAL INFORMATION ADDITIONAL INFO
https://www.sibur.ru/en/
KEY APPLICATIONS
These chemicals are primarily used internally for processing into higher value added petrochemical products.
SALES
We also sell these products externally, primarily to other petrochemicals companies.
Intermediates and other Chemicals
PRODUCT DESCRIPTION
Intermediates and other chemicals primarily comprise benzene, styrene, terephthalic acid, ethylene oxide, butadiene, isoprene, isobutylene and others and are produced primarily from raw NGL, LPG and naphtha.
3,597
2017
3,658
2016
3,481
2015
3,229
2014
PRODUCTION VOLUMES1, ‘000 TONNES
23
2017
21
2016
19
2015
18
2014
REVENUE FROM SALES1, RR BLN
5.1%OF TOTAL GROUP REVENUE
15.9%OF PLASTICS, ELASTOMERS & INTERMEDIATES REVENUE
10.0%OF PETROCHEMICAL BUSINESSES REVENUE
1 Due to introduction of the new segment breakdown, figures are available for 2014-2017 years only.
REVENUE SPLIT BY MARKET
2017
77%
16%1%6%
RussiaEuropeCIS
Asia
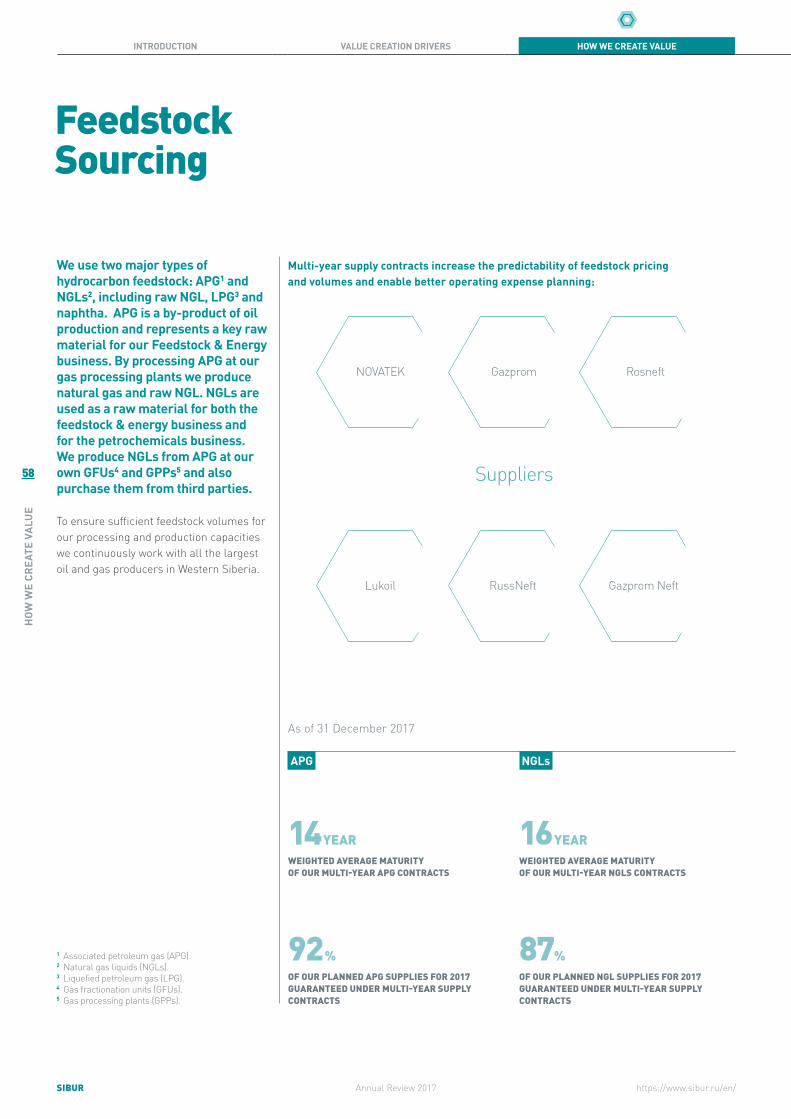
58
HOW
WE
CREA
TE V
ALUE
SIBUR Annual Review 2017
INTRODUCTION VALUE CREATION DRIVERS HOW WE CREATE VALUE HOW WE SUSTAIN VALUE FINANCIAL INFORMATION ADDITIONAL INFO
https://www.sibur.ru/en/
NOVATEK
Lukoil
Gazprom
RussNeft
Rosneft
Gazprom Neft
Feedstock Sourcing
We use two major types of hydrocarbon feedstock: APG1 and NGLs2, including raw NGL, LPG3 and naphtha. APG is a by-product of oil production and represents a key raw material for our Feedstock & Energy business. By processing APG at our gas processing plants we produce natural gas and raw NGL. NGLs are used as a raw material for both the feedstock & energy business and for the petrochemicals business. We produce NGLs from APG at our own GFUs4 and GPPs5 and also purchase them from third parties.
To ensure sufficient feedstock volumes for our processing and production capacities we continuously work with all the largest oil and gas producers in Western Siberia.
Multi-year supply contracts increase the predictability of feedstock pricing and volumes and enable better operating expense planning:
Suppliers
14 YEARWEIGHTED AVERAGE MATURITY OF OUR MULTI-YEAR APG CONTRACTS
16 YEARWEIGHTED AVERAGE MATURITY OF OUR MULTI-YEAR NGLS CONTRACTS
92 %OF OUR PLANNED APG SUPPLIES FOR 2017 GUARANTEED UNDER MULTI-YEAR SUPPLY CONTRACTS
87%OF OUR PLANNED NGL SUPPLIES FOR 2017 GUARANTEED UNDER MULTI-YEAR SUPPLY CONTRACTS
As of 31 December 2017
APG NGLs
1 Associated petroleum gas (APG).2 Natural gas liquids (NGLs).3 Liquefied petroleum gas (LPG).4 Gas fractionation units (GFUs).5 Gas processing plants (GPPs).

59
HOW
WE
CREA
TE V
ALUE
SIBURAnnual Review 2017
INTRODUCTION VALUE CREATION DRIVERS HOW WE CREATE VALUE HOW WE SUSTAIN VALUE FINANCIAL INFORMATION ADDITIONAL INFO
https://www.sibur.ru/en/
Feedstock Sourcing
FEEDSTOCK PRICING
APG
APG prices are negotiated by agreement between parties. There is no regulated or market price due to the limited options for oil producers to use APG. The base price for APG depends on target liquid fractions content, distance of an APG source from our GPPs, availability of collection and transportation infrastructure and costs to construct and maintain it.
We have two types of APG purchase contracts:
• APG price once agreed upon in absolute terms is typically regularly indexed to reflect changes in FAS regulated prices for natural gas;
• For our contract type, the APG price is indexed in line with changes in APG derivatives such as natural gas and raw NGL.
NGLs
Our NGLs feedstock is typically priced with reference to international prices for LPG and naphtha, and to a lesser extent to domestic LPG prices, while prices for raw NGL, depending on its composition, are largely correlated with prices for LPG and naphtha. As the supply of NGLs exceeds demand in Russia and particularly in Western Siberia, prices for NGLs are determined on an export netback basis, which reflects transportation costs and export duties. Pricing in NGLs supply contracts is determined by the respective netbacks and reflects the fraction content of NGLs, cost of fractionation, capital expenditures required to construct and maintain infrastructure, and alternative selling channels available for NGLs supplier.
FEEDSTOCK TRENDS IN WESTERN SIBERIA
The outlook for APG production mostly follows the trend of Russian oil production, which is stable in mature production areas like Western Siberia according to Wood Mackenzie estimates.
The following charts provide an outlook for Russian crude oil and APG production:
Given the maturity profile of oil fields, the concentration of liquid fractions in the APG may decline, but we expect this trend to be partially offset by a higher liquids recovery ratio. In recent years we substantially expanded our raw NGL transportation infrastructure to match the production growth at our suppliers’ gas fields in the Northern part of Western Siberia.
Going forward, we do not expect significant increases in NGLs feedstock supplied volumes; however we do expect to process an increasing portion of NGLs into petrochemicals as we expand capacity, as we currently sell approximately 65% of feedstock as raw NGLs or energy products on the open market and can use only 35% internally as raw material for higher added value petrochemicals.
OUTLOOK FOR RUSSIAN CRUDE OIL PRODUCTION, MLN TONNES
OUTLOOK FOR RUSSIAN APG PRODUCTION, BLN CUBIC METRES
Source: Wood Mackenzie.
2010 2014 2018 2022 20302026
100
200
300
400
500
600
2010 2014 2018 2022 20302026
20
40
60
80
100
APG SOURCING, BLN CUBIC METRES
22.8
2017
22.319.6
2013
13.9
22.4
2016
21.921.5
2015
21.220.8
2014
19.4
NGLs SOURCING, MLN TONNES
2017
3.03.6
2013
2.1
2016
3.4
2015
2.82.6
2014
2.2
share of our JV partners in APG purchases within JV purchases from JV partners within JV
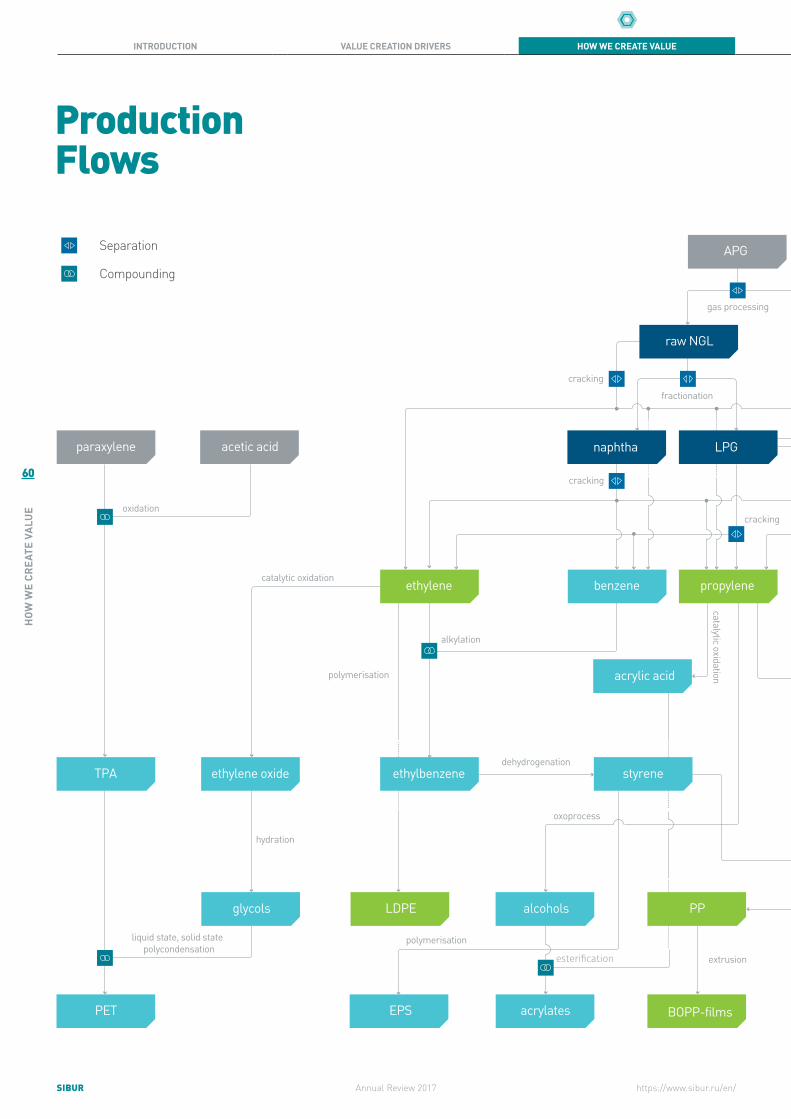
60
HOW
WE
CREA
TE V
ALUE
SIBUR Annual Review 2017
INTRODUCTION VALUE CREATION DRIVERS HOW WE CREATE VALUE HOW WE SUSTAIN VALUE FINANCIAL INFORMATION ADDITIONAL INFO
https://www.sibur.ru/en/
Production Flows
dissolution
gas processing
ethylene oxide
fractionation
cracking
oxidation
alkylation
hydration
polymerisation
catalytic oxidation
liquid state, solid statepolycondensation
dehydrogenation
oxoprocess
polymerisation
extrusion
cracking
cracking
catalytic oxidation
esterification
esterification
dehydrogenation
dehydrogenation
Separation
Compounding
solution copolymerisation
solution copolymerisation
solution copolymerisation
solution copolymerisation
emulsioncopolymerisation
separation
synthesis solution polymerisation
emulsion copolymerisation
hydration & dehydrogenation
emulsion copolymerisation
APG
ethylbenzene
butadiene
acetic acid
acrylic acid
TPA
PET EPS acrylates
propylenebenzene
LDPE
IR
natural gas
styrene
BR nd-PBR
IIR ESBR SBS SSBR
ESBR NBR
isobutylene
IIF BIF
BDF
BOPP-films
raw NGL
naphtha
glycols
ethylene
DMD
isoprene
paraxylene
PP
methanol
alpha-methylstyrene acrylonitrile
MTBEalcohols
LPG

61
HOW
WE
CREA
TE V
ALUE
SIBURAnnual Review 2017
INTRODUCTION VALUE CREATION DRIVERS HOW WE CREATE VALUE HOW WE SUSTAIN VALUE FINANCIAL INFORMATION ADDITIONAL INFO
https://www.sibur.ru/en/
Production Flows
dissolution
gas processing
ethylene oxide
fractionation
cracking
oxidation
alkylation
hydration
polymerisation
catalytic oxidation
liquid state, solid statepolycondensation
dehydrogenation
oxoprocess
polymerisation
extrusion
cracking
cracking
catalytic oxidation
esterification
esterificationdehydrogenation
dehydrogenation
Separation
Compounding
solution copolymerisation
solution copolymerisation
solution copolymerisation
solution copolymerisation
emulsioncopolymerisation
separation
synthesis solution polymerisation
emulsion copolymerisation
hydration & dehydrogenation
emulsion copolymerisation
APG
ethylbenzene
butadiene
acetic acid
acrylic acid
TPA
PET EPS acrylates
propylenebenzene
LDPE
IR
natural gas
styrene
BR nd-PBR
IIR ESBR SBS SSBR
ESBR NBR
isobutylene
IIF BIF
BDF
BOPP-films
raw NGL
naphtha
glycols
ethylene
DMD
isoprene
paraxylene
PP
methanol
alpha-methylstyrene acrylonitrile
MTBEalcohols
LPG
Feedstock sourced by SIBUR externallyFeedstock & EnergyOlefins & PolyolefinsPlastics, Elastomers & Intermediates

62
HOW
WE
CREA
TE V
ALUE
SIBUR Annual Review 2017
INTRODUCTION VALUE CREATION DRIVERS HOW WE CREATE VALUE HOW WE SUSTAIN VALUE FINANCIAL INFORMATION ADDITIONAL INFO
https://www.sibur.ru/en/
Transportation & Logistics
SIBUR’s core operations are located in regions that are thousands away from any end-markets. Our location gives us a unique competitive advantage in access to feedstock, but creates challenges for delivering end-products to market. Logistics plays an important role in ensuring the reliability of the Company’s operations and an uninterrupted supply of feedstock and finished products.
PIPELINES
APG pipelines
APG purchased from oil companies is transported via pipelines, which link oil fields to our GPPs. Most pipelines are owned by the oil companies, but some are owned by SIBUR.
Natural gas pipelines
SIBUR transports the gas it produces through its own pipelines into the Unified Gas Supply System (the UGSS), owned by Gazprom, and to regional power companies.
Raw NGL pipelines
We transport the majority of raw NGL to our GFUs via specialised raw NGL pipelines. The group has developed its own pipeline network that helps to secure long-term access to abundant raw NGL resources in Western Siberia.
201716% 60%
12%
1%11%
Rail transportationTransshipment in portsSea freightTruck transportation
Multimodal transportation services
TRANSPORTATION VOLUMES BY TYPE OF TRANSPORT
819 KMAPG PIPELINES
250 KMNATURAL GAS PIPELINES
1,643 KMRAW NGL PIPELINES
As of 31 December 2017
We use pipelines, railways, trucks, port facilities and multimodal transportation services for delivery of feedstock and finished products. SIBUR’s own infrastructure (pipelines and on-site railway facilities) partially meet our needs, but we rely on third-party services for the bulk of transported volumes.
In 2017, transportation volumes, including transportation between the Company's facilities, totaled 17.8 mln tonnes (excluding pipeline transportation), and logistics costs totalled RR 67.1 bln. Volumes transported between facilities accounted for 21% of total transported volumes.

63
HOW
WE
CREA
TE V
ALUE
SIBURAnnual Review 2017
INTRODUCTION VALUE CREATION DRIVERS HOW WE CREATE VALUE HOW WE SUSTAIN VALUE FINANCIAL INFORMATION ADDITIONAL INFO
https://www.sibur.ru/en/
RAIL TRANSPORTATION
SIBUR’s subsidiary AO SIBUR-Trans, a licensed railway operator, is responsible for handling rail logistics within Russia and for export deliveries. Rail transportation accounts for the largest share of SIBUR’s logistics mix in terms of transportation volumes and costs.
The main components of rail transportation costs are:
• tariffs for access to Russian Railways’ network and usage of locomotives, which is regulated by the Federal Antimonopoly Service of Russia (FAS);
• cost of forwarding services outside Russia;
• cost of contracted and rented rolling stock;
• cost of rolling stock maintenance.
PORT FACILITIES AND SEA FREIGHT
We deliver LPG, naphtha and certain other products to export markets through seaports. The largest of them are shown at the map below. In 2017, SIBUR transshipped 2.2 mln tonnes of LPG through the sea terminal in the port of Ust-Luga1, for which SIBUR performs the operational management.
Most of the transshipped LPG volumes were exported by 8 ice-class gas carrier vessels with 5,000-22,000 cubic metres in time-charter volume. In 2017, two new ice-class gas carriers, Navigator Luga and Navigator Yauza, were brought into service.
Sea ports by types of SIBUR’s products transshippedLPG, naphthaPolyolefinsPlastics, Elastomers and Intermediates
20,517RAIL CARS AND TANK WAGONS UNDER MANAGEMENT
8SEA VESSELS ON LONG-TERM LEASE
9REGIONAL BRANCHES COORDINATING DISPATCHING PERATIONS
49SIBUR’S OWN LOCOMOTIVES
As of 31 December 2017
EXPORT LOGISTICS THROUGH THIRD-PARTY FACILITIES
Riga (Latvia)
St. Petersburg (Russia)
Ust-Luga (Russia)
Nakhodka (Russia)
Vladivostok (Russia)
Taman (Russia)
Novorossiysk (Russia)
Temryuk (Russia)
Muuga (Estonia)
Kotka (Finland)
1 In November 2015, SIBUR sold a terminal inthe commercial port of Ust-Luga on the Baltic Sea. According to the agreement, SIBUR has long-term rights to utilise 100% of the LPG transshipment capacity on the pre-agreed terms.
Paldiski (Estonia)
Hamina (Finland)

64
HOW
WE
CREA
TE V
ALUE
SIBUR Annual Review 2017
INTRODUCTION VALUE CREATION DRIVERS HOW WE CREATE VALUE HOW WE SUSTAIN VALUE FINANCIAL INFORMATION ADDITIONAL INFO
https://www.sibur.ru/en/
MULTIMODAL TRANSPORTATION SERVICES
WAREHOUSES AND DISTRIBUTION CENTRES
Transportation & Logistics (continued)
TRUCKING SERVICES
For more details please see ZapSib description on p. 23
11,5 00VEHICLE DISPATCHES PER MONTH
Multimodal container shipping is the most efficient type of delivery for large consignments of goods over medium and long distances. We use large multimodal transportation operators to transport products such as polyolefins and elastomers in containers using a variety of shipping modes within Russia and to export markets.
SIBUR has its own sales desks in Russia and abroad. We purchase warehouse services to store petrochemical products close to our production sites or to key customer facilities. In preparation for the ZapSib launch, a logistic hub for polymer products is being established in the Kaluga Region.
We use a variety of different vehicles including box trucks, container trucks, refrigerator trucks, tank trucks and polyolefins-carrying trucks, to transport petrochemicals within Russia and to export markets. SIBUR uses leading Russian and foreign trucking service providers to handle approximately 11.5 thousand vehicle dispatches per month.

65
HOW
WE
CREA
TE V
ALUE
SIBURAnnual Review 2017
INTRODUCTION VALUE CREATION DRIVERS HOW WE CREATE VALUE HOW WE SUSTAIN VALUE FINANCIAL INFORMATION ADDITIONAL INFO
https://www.sibur.ru/en/
Uptime is the ratio of total time during which a machinery or equipment is fully operational and capable of producing end-products. Uptime may exceed the nameplate capacity utilization rate as it is based on actual production as a percentage of total available production time.
Uptime may fall below 100% due to unscheduled shutdowns, declines in quality or volume, losses on launches or switches of production lines, and external losses,such as weather-related events, energy and feedstock supply issues, demand trends, and logistical constraints. Thus, uptime helps to control production losses and pinpoint their root causes.
Operational Excellence
We continue to focus on improved productivity and excellence in all our operations. In 2017, around 2,300 efficiency enhancements requiring no or minimal additional capex were implemented within the Company. We estimate the economic value of such operational excellence enhancements to be several billion roubles annually.
In 2017 about half of implemented enhancements were aimed at uptime growth, a quarter involved technology optimisation and one-fifth addressed energy efficiency. The highest economic impact was achieved at SIBUR Tobolsk production site, gas processing plants in Western Siberia and a polyolefins production site in Tomsk.
Sustained improvement is our priority. Enhancing operational efficiency is an ongoing process that encompasses all of the Group’s operations. These initiatives promote our competitiveness and provide opportunities for rewards and recognition for employees who propose ideas according to the scale of eventual economic effect. This incentivised approach allows to engage all of our employees and stimulates a “bottom up” flow of ideas and initiatives.
ECONOMIC VALUE OF OPERATIONAL EXCELLENCE APPROACH, RR BLN
7.4
2017
7.5
2016
8.5
2015
9.8
2013
8.7
2014
We seek potential for efficiency enhancements among best practices. The economic value of operational improvements gradually declines as we narrow the gap between SIBUR's plants and international benchmarks.
Our operational excellence approach stands on three pillars:
1 Production uptime initiatives aimedat increasing volumes by maximising equipment uptime;
2 Energy optimisation initiatives aimedat cutting energy consumption and improving energy intensity rates, resulting in lower production costs;
3 Technology efficiency initiatives aimedat reducing raw materials consumption and increasing operational efficiency.
25%
49%
20%
7%
Production uptime initiativesTechnology efficiency initiativesEnergy optimisation initiativesOther
ECONOMIC VALUE IN 2017 BY TYPES OF INITIATIVES
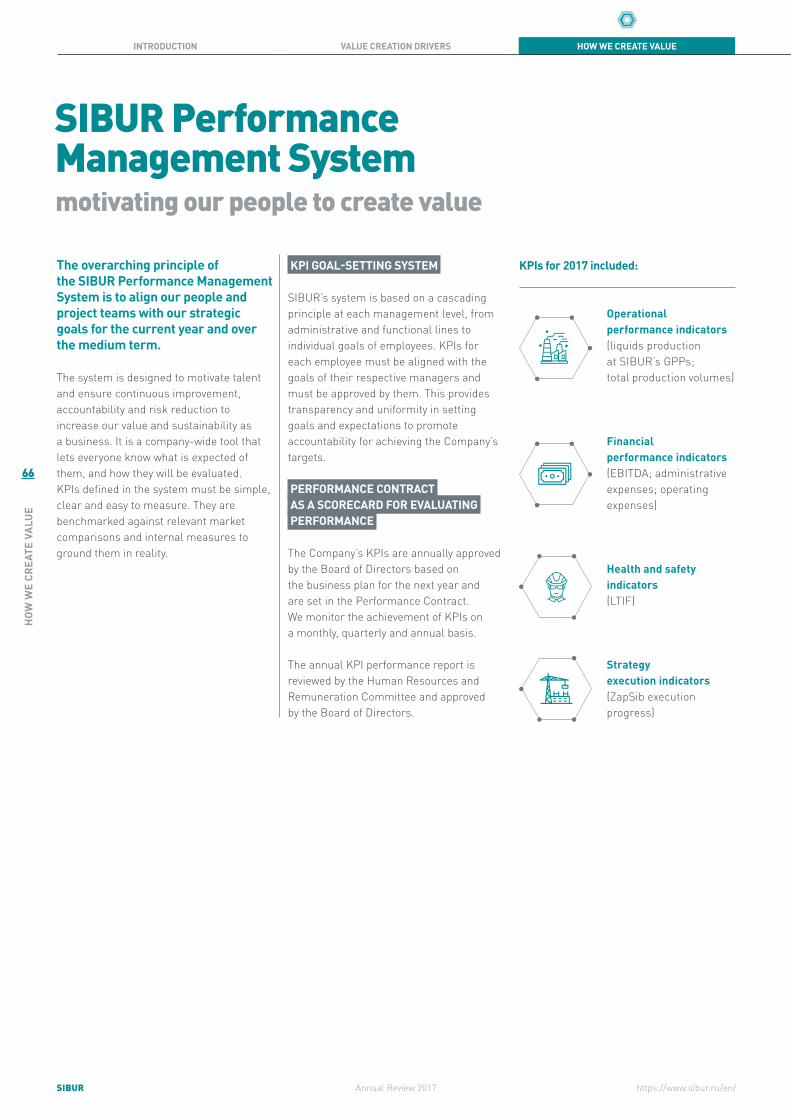
66
HOW
WE
CREA
TE V
ALUE
SIBUR Annual Review 2017
INTRODUCTION VALUE CREATION DRIVERS HOW WE CREATE VALUE HOW WE SUSTAIN VALUE FINANCIAL INFORMATION ADDITIONAL INFO
https://www.sibur.ru/en/
SIBUR Performance Management System
KPIs for 2017 included: KPI GOAL-SETTING SYSTEM
SIBUR’s system is based on a cascading principle at each management level, from administrative and functional lines to individual goals of employees. KPIs for each employee must be aligned with the goals of their respective managers and must be approved by them. This provides transparency and uniformity in setting goals and expectations to promote accountability for achieving the Company’s targets.
PERFORMANCE CONTRACT AS A SCORECARD FOR EVALUATING PERFORMANCE
The Company’s KPIs are annually approved by the Board of Directors based on the business plan for the next year and are set in the Performance Contract. We monitor the achievement of KPIs on a monthly, quarterly and annual basis.
The annual KPI performance report is reviewed by the Human Resources and Remuneration Committee and approved by the Board of Directors.
The overarching principle of the SIBUR Performance Management System is to align our people and project teams with our strategic goals for the current year and over the medium term.
The system is designed to motivate talent and ensure continuous improvement, accountability and risk reduction to increase our value and sustainability as a business. It is a company-wide tool that lets everyone know what is expected of them, and how they will be evaluated. KPIs defined in the system must be simple, clear and easy to measure. They are benchmarked against relevant market comparisons and internal measures to ground them in reality.
motivating our people to create value
Operational performance indicators (liquids production at SIBUR’s GPPs; total production volumes)
Financial performance indicators (EBITDA; administrative expenses; operating expenses)
Health and safety indicators (LTIF)
Strategy execution indicators (ZapSib execution progress)

67
HOW
WE
CREA
TE V
ALUE
SIBURAnnual Review 2017
INTRODUCTION VALUE CREATION DRIVERS HOW WE CREATE VALUE HOW WE SUSTAIN VALUE FINANCIAL INFORMATION ADDITIONAL INFO
https://www.sibur.ru/en/
CompanyChairman of
the Management Board and
COO
General Directors
of production sites
CASCADE OF PERFORMANCE CONTRACTS
CASCADE OF INDIVIDUAL KPIS
1These KPIs provide essential signals and motivation to employees and managers to make operational improvements and strengthen our business and financial results. They are, of course, are basis for monetary and non-monetary incentives, including career development opportunities and promotions.
Arrows indicate cascading and mapping of KPIs and performance contracts
Heads of business units
and functional divisions
Business units and
functional divisions
Production sites

68
HOW
WE
CREA
TE V
ALUE
SIBUR Annual Review 2017
INTRODUCTION VALUE CREATION DRIVERS HOW WE CREATE VALUE HOW WE SUSTAIN VALUE FINANCIAL INFORMATION ADDITIONAL INFO
https://www.sibur.ru/en/
culture of performance excellence
SIBUR’s PSS production management system instils our corporate culture, values and expectations into the conduct of every employee. It rewards idea generation as a way to solve problems and achieve targets. PSS gives every team and employee tools to identify issues and develop solutions, and share lessons learned, innovations and best practices across the Company.
Production System of SIBUR (PSS):
During 2017 SIBUR also activated following programmes and initiatives:
PSS key performance indicators for 2017 include:
• more than 57.5 thousand “small steps improvements” ideas were submitted for improving safety and health conditions, operational efficiency and loss minimisation, 34.6 thousand of which were considered and applied. The participation rate for Company employees was 20%, and the average period for implementation of ideas was 51 days.
• more than 100 “Six Sigma” projects were implemented within an average period of 44 days and with participation of 22% of Company employees.
• SIBUR created and launched a new training program to promote innovative exercises and solutions;
• Long-term targets and medium-term product portfolio programs were developed for the Sales and marketing division;
• SIBUR developed more than 160 value stream maps (VSM), a methodology to help employees identify and track processes and competencies across our large and integrated organisation. We implemented the VSM database throughout all Group companies and divisions, and more than 350 employees were trained to the value stream map methodology;
• 64 corporate coaches were trained in the Lean Production programme, which aims to develop employees’ competencies for driving continuous improvements, identifying and reducing losses;
• 336 production site best practices and 74 corporate best practices were identified and approved through SIBUR’s Best Practises web-portal.
Productivity Enhancement Programme.This initiative identified medium-term opportunities for increasing productivity and helped establish key measures to achieve our objectives. These include expansion of maintenance resources;, staff development, including relevant professional training; automation of production processes.
Process Simplification Programme. This aims to reduce labor intensity, eliminate excessive processes and layers of decision-making, redesign and automate operations to promote speed, efficiency and results.
Since 2015 SIBUR has participated in the A.K. Gastev Cup competition. This is the largest industrial competition in Russia and CIS for excellence in efficiency improvements and innovative management tools. SIBUR’s production sites regularly win prizes and top rankings.
To sustain performance and promote continuous improvements, the Company created a PSS development screening programme. This system allows us to diagnose the current implementation and performance of the Production System of SIBUR in each division, and set targets and plans for the year. The main focus of the programme is self-assessment carried out by a division, in order to independently determine the current level of development, to identify priority areas of focus and formulate activities to raise PSS implementation and performance at the divisional level.
PSS Development Screening allows us to compare divisions with each other to benchmark opportunities for improvement and monitor progress towards goals.
PSS has now been implemented at all of SIBUR’s production sites and with our
27 THOUSAND EMPLOYEES
PSS helps us develop our people’s potential. It motivates them to make the best use of resources and take personal responsibility for risk reduction, loss prevention, and safeguarding health and safety standards.

69
HOW
WE
CREA
TE V
ALUE
SIBURAnnual Review 2017
INTRODUCTION VALUE CREATION DRIVERS HOW WE CREATE VALUE HOW WE SUSTAIN VALUE FINANCIAL INFORMATION ADDITIONAL INFO
https://www.sibur.ru/en/
KEY TACTICS
Processes
how process are improved and made more
efficient in units/divisions
Management
System
how continuous improvements are
integrated into existing systems
Culture (people)
how managers and employees
adopt the culture of continuous improvement
THERE ARE THREE MAIN SECTIONS IN THE DEVELOPMENT SCREENING PROGRAMME:
7 Manager involvement in improvements
8 Employee involvement in improvement processes
4 Optimisation of production and business processes
5 Management of work areas and time-management
6 Continuous improvements
1 Regular creening
of current state
2 Goals management
system and visual management
3 Motivation system
and personnel development
PSS OBJECTIVES
9 Cross-functional teamwork
10 Self-development and subordinates’
Understand the Company’s goals and apply a common set of principles and approaches
Defineunify and standardise practices and business processes throughout the Company
External communications with professional communities to disseminate uniform principles, goals and best practices
Identify gaps compared to global industry benchmarks and develop programmes to narrow the gaps (over 3-5 years)
Diagnose losses and opportunities to reduce or eliminate them through process and management improvements
Implement continuous improvements processes aimed at identifying and reduction of losses on an ongoing basis
Encourage employees to identify and resolve operational problems
Help managers to grow professionally and better lead and manage employees through the Leader Standard Work programme
Encourage employees to be proactive in using PSS tools
Implement a “One SIBUR” philosophy including the creation of a system for collecting, analysing and using of the best practices
Increase the Company’s competitiveness by building a self-developing system of continuous improvements to eliminate all types of losses
Develop a strong corporate culture that empowers employees to maximise their potential and contribute to the development of other employees
The next milestone for our Production system is to teach our organisation to make smarter and faster decisions. We are implementing approaches to optimise business management and decision-making processes, increase productivity, delegate responsibility to appropriate levels, and use our IT systems and technologies to their full potential.
70
HOW
WE
SUST
AIN
VAL
UE
SIBUR Annual Review 2017
INTRODUCTION VALUE CREATION DRIVERS HOW WE CREATE VALUE HOW WE SUSTAIN VALUE FINANCIAL INFORMATION ADDITIONAL INFO
https://www.sibur.ru/en/
How We Sustain Value
71
HOW
WE
SUST
AIN
VAL
UE
SIBURAnnual Review 2017
INTRODUCTION VALUE CREATION DRIVERS HOW WE CREATE VALUE HOW WE SUSTAIN VALUE FINANCIAL INFORMATION ADDITIONAL INFO
https://www.sibur.ru/en/
How WeSustainValue
How We Sustain Value
How We Sustain Value
Susta
inabil
ity
SustainabilitySusta
inabil
itySu
staina
bility
PAGE 68
PAGE68
Sustainability 72
— Integrated Management System 73
Corporate Governance 82
— Board of Directors 85
— Board Committees 94
— Corporate Secretary 96
— Management Board 98
— Anti-Corruption Policiesand Compliance 102
— External Auditor 104
— Share Capital 104
— Dividends 105
Risk Management 106
VALUE

72
HOW
WE
SUST
AIN
VAL
UE
SIBUR Annual Review 2017
INTRODUCTION VALUE CREATION DRIVERS HOW WE CREATE VALUE HOW WE SUSTAIN VALUE FINANCIAL INFORMATION ADDITIONAL INFO
https://www.sibur.ru/en/
Sustainability
As the largest integrated gas processing and petrochemicals company in Russia, SIBUR believes strongly in being a good corporate citizen that benefits society as a whole. We treat health, safety and environmental matters as a top priority and are committed to having a positive impact on local communities in the regions where we operate.
Sustainable development is an integral part of the Company’s strategy underpinning its investment and production activities and stakeholder relations.
IntegratedManagement
System
Environmental safety We provide oil companies with an alternative to harmful flaring of associated petroleum gas, to reduce environmental impact and turn hydrocarbon by-products into value added products
Communities and society “Formula for Good Deeds,” SIBUR’s philanthropy programme, addresses social pressing needs in our communities
Social policy SIBUR supports and encourages the personal and professional development of its employees. The building blocks of our social policy include incentives, training and development, andsocial benefits
Health and safety The health and safety of our employees and of the wider communities where we operateis a key priority. We focus on continuous improvement through our operational risk management framework
Energy efficiency We are committed to continuously reducing energy consumption to mitigate our impact on the environment

73
HOW
WE
SUST
AIN
VAL
UE
SIBURAnnual Review 2017
INTRODUCTION VALUE CREATION DRIVERS HOW WE CREATE VALUE HOW WE SUSTAIN VALUE FINANCIAL INFORMATION ADDITIONAL INFO
https://www.sibur.ru/en/
ISO 50001 – Energy Management System
supports SIBUR’s energy efficiency improvement programmes
OHSAS 18001 – Occupational Health and Safety Management System
underpins the priority of healthand well-being of SIBUR’s personneland of all stakeholders over operating performance
ISO 14001 – Environmental Management System
is the basis for developing SIBUR’s environmental performance and environmental risk management system
Integrated Management System
We continuously evolve our management systems to meet the ever increasing requirements for Health, Safety and Environmental (HSE) performance, energy efficiency improvements, and innovations to meet market demand for higher product quality and customer experience.
To maintain growth momentum and ensure sustainable development in a competitive and volatile market environment, we are introducing a unified integrated management system (IMS) based on best international practices.
The IMS integrates SIBUR’s former stand-alone management systems and is compliant with four international standards, including ISO 9001, OHSAS 18001, ISO 14001 and ISO 50001.
ISO 9001 – Quality
Management System
supports product quality risk mitigation and identification of
opportunities for continuous process and overall system improvements
SIBUR IMS international
standards
74
HOW
WE
SUST
AIN
VAL
UE
SIBUR Annual Review 2017
INTRODUCTION VALUE CREATION DRIVERS HOW WE CREATE VALUE HOW WE SUSTAIN VALUE FINANCIAL INFORMATION ADDITIONAL INFO
https://www.sibur.ru/en/
Integrated Management System (IMS) strategic objectives:
• establish and maintain a safe working environment and protect the health of workers;
• mitigate risk of accidents;
• maintain sustainable production of competitive, quality products that meet customer requirements;
• reduce environmental impact, prevent pollution and balance socio-economic development with environmental needs; ensure rational use of natural resources;
• improve energy efficiency of production processes, eliminate wasteful use of energy, and reduce the cost of energy procurement and generation.
To achieve its IMS objectives, SIBUR’s leadership shall:
• prevent injuries and harm to employee health (as well as contractors and visitors);
• comply with applicable legal requirements and voluntary commitments;
• prevent environmental pollution;
• identify hazards and assess the risks of possible accidents at hazardous facilities, and take measures to reduce accident rates;
• consult with staff at hazardous facilities and their representatives on matters of industrial safety;
• ensure IMS compliance with applicable regulations;
• continuously improve IMS effectiveness;
• ensure that energy efficiency savings are factored into product and service procurement and design specifications;
• and ensure availability of resources, including information, for managers to achieve these objectives.
When planning its operations, the Company gives priority to ensuring the safety of its employees and residents of areas surrounding its operations; preventing accidents and work-related illnesses; and preventing pollution and reducing the environmental impact of our activities.
SIBUR has developed an Integrated Management System Policy document that codifies our principles and guidelines on Health, Safety and Environment (HSE), product quality and energy efficiency to ensure consistency and drive improvements across the Company.
Visit the Company’s website to see the document at: https://www.sibur.ru/sustainability/ims
Sustainability (continued)

75
HOW
WE
SUST
AIN
VAL
UE
SIBURAnnual Review 2017
INTRODUCTION VALUE CREATION DRIVERS HOW WE CREATE VALUE HOW WE SUSTAIN VALUE FINANCIAL INFORMATION ADDITIONAL INFO
https://www.sibur.ru/en/
Some of SIBUR’s production sites are categorized as hazardous industrial facilities that require the highest level of safety.
203 197 191 187
156
20172016201520142013
HAZARDOUS FACILITIES
0.76 0.73
0.63
0.300.36
2017*2016*201520142013
LOST TIME INJURY FREQUENCY RATE (LTIF)
* (since 2016 incl. contractors).
HEALTH AND SAFETY
As of the end of 2017, the number of hazardous industrial facilities has been reduced from 156 to a 20% decrease compared to 2016.
One of the Company’s key long-term objectives is to steadily improve its lost time injury frequency rate (LTIF). In 2017 there were 43 accidents involving SIBUR employees and contractors, including one tragic fatality involving an employee of one of our contractors. The increase in the number of accidents from 26 in 2016 is mostly related to a major ramp-up in construction activity at ZapSibNeftekhim at this stage of the project. All incidents that occurred at SIBUR’s enterprises were investigated, the reasons were determined and measures were taken to prevent occurrence of such cases in the future.
To improve safety across production sites, in 2017, SIBUR continued implementing its dedicated programmes to minimise incident rates among Company employees and contractors, including:
• cascading HSE KPIs throughout the business, and individual HSE contracts for the heads of SIBUR’s subsidiaries;
• developing a safety culture;
• implementing industrial accident risk management system, as well as a health and safety risk management system.
Since 2012, SIBUR has implemented an upgrade programme to improve safety at hazardous industrial facilities.

76
HOW
WE
SUST
AIN
VAL
UE
SIBUR Annual Review 2017
INTRODUCTION VALUE CREATION DRIVERS HOW WE CREATE VALUE HOW WE SUSTAIN VALUE FINANCIAL INFORMATION ADDITIONAL INFO
https://www.sibur.ru/en/
ENVIRONMENTAL PROTECTION
Converted into productsSIBUR emissions
9%
91%
CO2 EMISSIONS EFFICIENCYThe Company’s key environmental protection initiatives include:
• development and approval of sanitary protection zones;
• construction / reconstruction of wastewater treatment plants;
• measures to reduce emissions into the atmosphere;
• increasing the share of recycled and used waste;
• improvement of production safety and greenhouse gas measurement;
• improvement of the environmental management system (compliance with international standard ISO 14001);
• Cooperation with state bodies and international organisations in terms of environmental safety standards and best practises.
SIBUR’s involvement in the primary processing of associated petroleum gas (APG), which is a by-product of oil production stranded on oil fields, helps to reduce the amount of harmful emissions of APG from flaring. The Company processes these by-products into fuels and petrochemical products – including polyolefins, elastomers and plastics – which are economically useful and also less harmful to the environment than other industrial materials.
According to experts, flaring of 1 mcm of APG emits 300 tonnes of air pollutants, including nitrogen oxide, soot, carbon monoxide and other toxic substances. In 2016, APG processing at SIBUR enterprises totalled 22.8 billion cubic metres, equivalent to preventing 7 million tonnes of harmful emissions into the atmosphere as well as 72 million tonnes of greenhouse gases in CO2 equivalent.
91%OF EMISSIONS WERE CONVERTED INTO PRODUCTS
Sustainability (continued)

77
HOW
WE
SUST
AIN
VAL
UE
SIBURAnnual Review 2017
INTRODUCTION VALUE CREATION DRIVERS HOW WE CREATE VALUE HOW WE SUSTAIN VALUE FINANCIAL INFORMATION ADDITIONAL INFO
https://www.sibur.ru/en/
SIBUR’S ENVIRONMENTAL PROTECTION PROGRAMMES
Waste treatmentKey measures to improve waste management and prevent soil pollution include:
• Preparatory works for the construction of a sealed tank at the non-recyclable waste disposal site at SIBUR Tobolsk;
• Conservation of a sludge tank at SIBUR Togliatti and further technical reclamation and biological restoration of surrounding lands;
• Upsurge of waste recycling and its further usage at our production facilities (Biaxplen, SIBUR Kstovo, SIBUR Neftekhim, Tomskneftekhim, SiburTumenGas);
• Systematic introduction of paper and plastic waste sorting on production sites.
6454 56 55 52
20172016201520142013
WASTEWATER DISCHARGE, MLN CUBIC METRES
59 56 59 58 56
20172016201520142013
AIR POLLUTION, ‘000 TONNES
132
74 74 7764
20172016201520142013
SANITARY WASTE GENERATION, ‘000 TONNES
We develop and implement annual and long-term environmental programmes aimed at reducing SIBUR’s impact on the environment.
Over the past few years, we have significantly expanded the Company’s production capacities, while reducing our anthropogenic footprint on the environment, which is reflected in the decrease in EIS1 from 4.2 to 3.9 in 2017.
Water resources conservationKey measures implemented to reduce pollutants in wastewater discharge volumes:
• Construction and launch of modern biological waste water treatment facilities at SIBUR-PETF. By re-using wastewater we were able to achieve a three-fold reduction in water usage and ensure compliance with quality standards for wastewater discharge;
• An industrial wastewater treatment system reconstruction project was undertaken at Tomskneftekhim;
• A biochemical treatment unit for industrial sewage was constructed and installed at SIBUR-Khimprom;
• Reconstruction of local wastewater treatment facilities at "Krasnoyarsk Plant SK" reduced the content of suspended solids in wastewater and helped prevent loss of raw materials.
Air protectionKey measures implemented to reduce emissions of air pollutants include:
• Establishment of sanitary protection zones at SIBUR-PETF, Polyom, RusVinyl;
• Design and survey work for technical re-equipment and stabilisation of flare facilities at JSC SIBUR Togliatti;
• FEED on technical re-equipment and stabilisation of flare facilities at SIBUR Togliatti;
• Installation of pontoons for gasoline tanks on the commodity floor at SIBUR-Kstovo to reduce losses of oil products.
1 Environmental Impact Index (EIS) is an average indicator of the specific load on the environment as a ratio of all types of impacts (emissions, discharges and waste) to the volume of production.

78
HOW
WE
SUST
AIN
VAL
UE
SIBUR Annual Review 2017
INTRODUCTION VALUE CREATION DRIVERS HOW WE CREATE VALUE HOW WE SUSTAIN VALUE FINANCIAL INFORMATION ADDITIONAL INFO
https://www.sibur.ru/en/
ENERGY EFFICIENCY
Key energy efficiency initiatives include:
• Development and implementation of an Energy savings programme
• Energy audits at our production sites;
• Raising energy efficiency levels closer to international benchmarks over the medium-term;
• Implementation and sustainable development of ISO 50001 compliant energy management system.
In 2017 SIBUR initiated a project to standardise and systematise energy consumption and energy loss management. The project will enable us to perform a highly detailed analysis of deviations from energy consumption plans, specify the effects of particular factors and determine the best pathway to reduce energy consumption.
Electricity and heat consumption volumes increased by 1% year-on-year primarily due to the expansion of production at SIBUR’s facilities.
5.5
7.68.3 8.8 8.9
20172016201520142013
HEAT CONSUMPTION, MLN GCAL
17.2 18.420.3 21.1 21.4
20172016201520142013
ELECTRICITY CONSUMPTION1, BLN KW∙H
SIBUR has been making considerable efforts to increase energy efficiency and reduce costs through the safe and effective management of energy consumption, conservation efforts and efficiency improvements at our enterprises.
All our production sites develop and implement short- and long-term energy efficiency programmes. Best practices are subsequently rolled out across all of SIBUR’s facilities. In 2017, based on the TOP 50 best practices we formed and are currently implementing 173 energy saving initiatives with a potential economic effect of hundreds of millions of roubles. In 2018, we will continue to identify and implement best practices throughout our operations.
1 The decrease was mainly due to the fact that Yugragazpererabotka.
173ENERGY SAVING INITIATIVES WITH A POTENTIAL ECONOMIC EFFECT OF HUNDREDS OF MILLIONS OF ROUBLES
Sustainability (continued)

79
HOW
WE
SUST
AIN
VAL
UE
SIBURAnnual Review 2017
INTRODUCTION VALUE CREATION DRIVERS HOW WE CREATE VALUE HOW WE SUSTAIN VALUE FINANCIAL INFORMATION ADDITIONAL INFO
https://www.sibur.ru/en/
EMPLOYEES
9.3
12.314.0
14.916.5
20172016201520142013
REVENUES PER EMPLOYEE, RR MLN
18%
39%
23%
19%
Below 30 yearsFrom 30 to 40 yearsFrom 40 to 50 yearsOver 50 years
EMPLOYEES BY AGE GROUP
33%
16%
34%
17%
Feedstock and energy segmentOlefins and polyolefins segmentPlastics, elastomers and intermediates segmentLogistics, marketing and administrative functions
EMPLOYEES BY SEGMENT
Average headcountAverage monthly salary, RR
30,644
2012
43,786
28,916
2013
49,861
25,926
2014
56,535
27,135
2015
62,977
27,722
2016
70,969
27,344
2017
80,071
HEADCOUNT AND SALARY
Employee compensation
A transparent, performance-linked remuneration system is a key competitive advantage for attracting and retaining professional talent. SIBUR utilises a company-wide grade system at all Group enterprises to ensure a well-managed remuneration framework.
Compensation includes a base salary and performance bonuses that depend on the employee’s grade, their performance against KPI targets, and SIBUR’s overall results.
In 2017 SIBUR was ranked number one in the Russian Employers’ annual survey conducted by recruitment firm Headhunter and newspaper RBC. This is the second time that SIBUR won this award.
SIBUR was also recognised as the most attractive employer in the chemical industry by the Randstad Award and Universum annual international survey of the best employers. SIBUR has also received the Federation category award for most successful reputation as an employer from “HR-brand Award 2017” established by HeadHunter.
As of 31 December 2017, SIBUR had 27,188 employees. The breakdown by segment is as follows: feedstock and energy segment, 17%; olefins and polyolefins segment, 16%; plastics, elastomers and intermediates segment, 34%; and logistics, marketing and administrative functions, project offices and service centres, 33%.
Our workforce gender profile is in line with industry averages for the petrochemicals and gas processing industries: 66% men and 24% women, mostly in technical and engineering occupations.
Base pay is revised annually, taking into account the economic situation, labour market environment and the employee’s individual performance. In 2017, the average salary at SIBUR increased by 13% year on year, to RR 80,071 per month. All changes in the remuneration and incentive framework promote our corporate culture and objectives for motivating, attracting and retaining talent and enhancing our performance and competitive position.
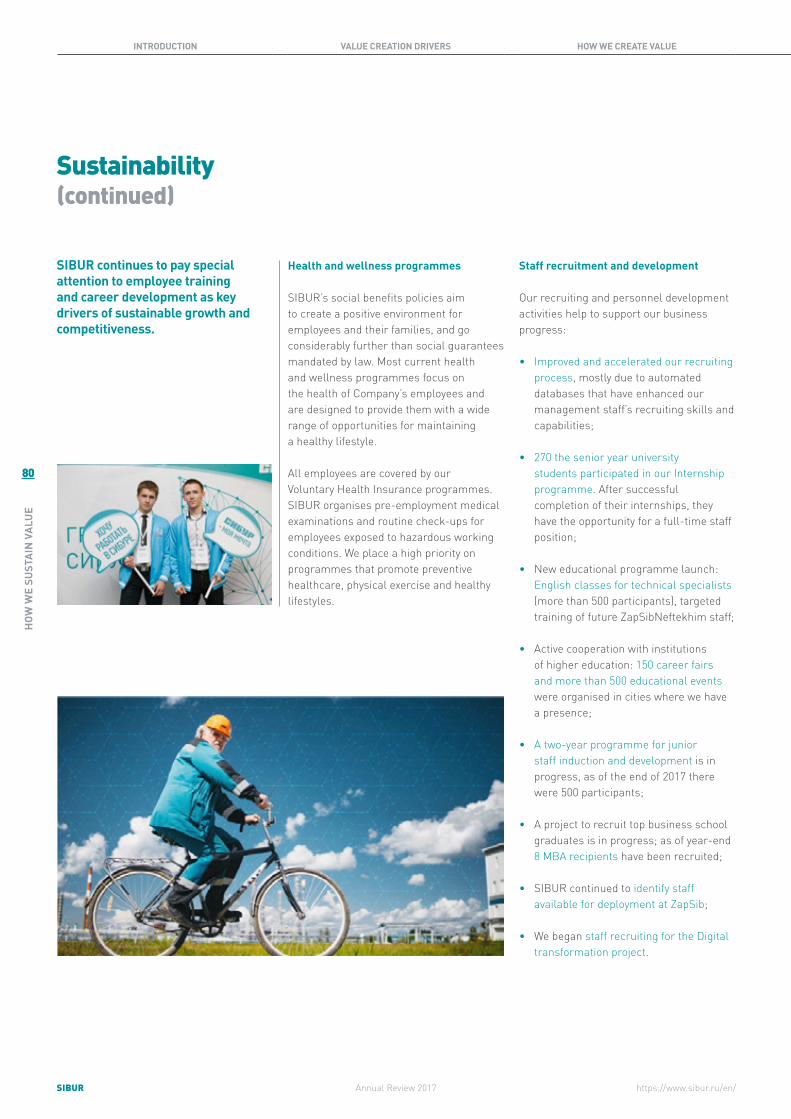
80
HOW
WE
SUST
AIN
VAL
UE
SIBUR Annual Review 2017
INTRODUCTION VALUE CREATION DRIVERS HOW WE CREATE VALUE HOW WE SUSTAIN VALUE FINANCIAL INFORMATION ADDITIONAL INFO
https://www.sibur.ru/en/
SIBUR continues to pay special attention to employee training and career development as key drivers of sustainable growth and competitiveness.
Health and wellness programmes
SIBUR’s social benefits policies aim to create a positive environment for employees and their families, and go considerably further than social guarantees mandated by law. Most current health and wellness programmes focus on the health of Company’s employees and are designed to provide them with a wide range of opportunities for maintaining a healthy lifestyle.
All employees are covered by our Voluntary Health Insurance programmes. SIBUR organises pre-employment medical examinations and routine check-ups for employees exposed to hazardous working conditions. We place a high priority on programmes that promote preventive healthcare, physical exercise and healthy lifestyles.
Staff recruitment and development
Our recruiting and personnel development activities help to support our business progress:
• Improved and accelerated our recruiting process, mostly due to automated databases that have enhanced our management staff’s recruiting skills and capabilities;
• 270 the senior year university students participated in our Internship programme. After successful completion of their internships, they have the opportunity for a full-time staff position;
• New educational programme launch: English classes for technical specialists (more than 500 participants), targeted training of future ZapSibNeftekhim staff;
• Active cooperation with institutions of higher education: 150 career fairs and more than 500 educational events were organised in cities where we have a presence;
• A two-year programme for junior staff induction and development is in progress, as of the end of 2017 there were 500 participants;
• A project to recruit top business school graduates is in progress; as of year-end 8 MBA recipients have been recruited;
• SIBUR continued to identify staff available for deployment at ZapSib;
• We began staff recruiting for the Digital transformation project.
Sustainability (continued)

81
HOW
WE
SUST
AIN
VAL
UE
SIBURAnnual Review 2017
INTRODUCTION VALUE CREATION DRIVERS HOW WE CREATE VALUE HOW WE SUSTAIN VALUE FINANCIAL INFORMATION ADDITIONAL INFO
https://www.sibur.ru/en/
COMMUNITIES AND SOCIETY
Charity and social investments are an important part of the Company’s commitment to the regions where it is present. SIBUR’s key partners are regional and municipal authorities with which priorities are defined and important projects for the regions are implemented.
A corporate charitable programme called “Formula for Good Deeds” was officially launched in 2016, bringing together all of the Company’s social initiatives. The programme won the “HR-Brand 2017” Prize for best corporate social responsibility project. SIBUR’s support for communities resulted in 130 grants in 2017 in addition to direct implementation of projects across six work streams:
130 GRANTSWERE SUPPORTED BY SIBUR IN 2017
BEST CORPORATE SOCIAL RESPONSIBILITY PROJECT – PROGRAMME “FORMULA FOR GOOD DEEDS”
Education and science work stream: providing financial support to universities, arranging conferences and festivals, establishment of educational summer camps for primary school students;
Culture work stream: Creation of the “#Artlab” collaborative working and exhibition space in Tobolsk, providing support to drama arts in key cities where we have operations;
Sports and healthy lifestyles work stream: organisation of dozens of sports competitions, construction of sports field, projects to enable disabled people to participate actively in sports;
Volunteering work stream: organisation of charitable football games and activities for children with physical disabilities, and creation of a corporate employee volunteering programme.
Urban development work stream: refurbishment of social services centres, urban landscape improvement, installation of three world-class tournament complexes;
Ecology work stream: projects on environmental education and preserving nature;

82
HOW
WE
SUST
AIN
VAL
UE
SIBUR Annual Review 2017
INTRODUCTION VALUE CREATION DRIVERS HOW WE CREATE VALUE HOW WE SUSTAIN VALUE FINANCIAL INFORMATION ADDITIONAL INFO
https://www.sibur.ru/en/
Corporate Governance
Good Сorporate governance, transparency and risk management are critically important to building long-term value for SIBURS’s shareholders and increasing our investment appeals.
Adherence to the Code of Corporate Conduct at all levels of the Company makes SIBUR a more robust, efficient, high-performing business and a more attractive long-term investment.
The Company complies with the requirements of the Code of Corporate Conduct, approved by the PJSC SIBUR Holding Board of Directors on 16 December 2014 (Revision No. 5), as well as with the revised Code of Corporate Conduct, approved by the Central Bank of the Russian Federation on 21 March 2014.
Corporate governance principles
1 Ability of shareholders to effectively exercise their rights
7 Active engagement with the Company’s investors, creditors and over stakeholders
6 Effective control overfinancial and business activities of the Company
2 Equal treatment of the Company’s shareholders
3 Strategic management of Company’s activities and effective supervision over the Company’s executive bodies by the Board of Directors
5 Timely and accurate disclosure of information about the Company
4 Reliable and responibleimplementation of Company pllans and management of business activities by the Company’s executive bodies
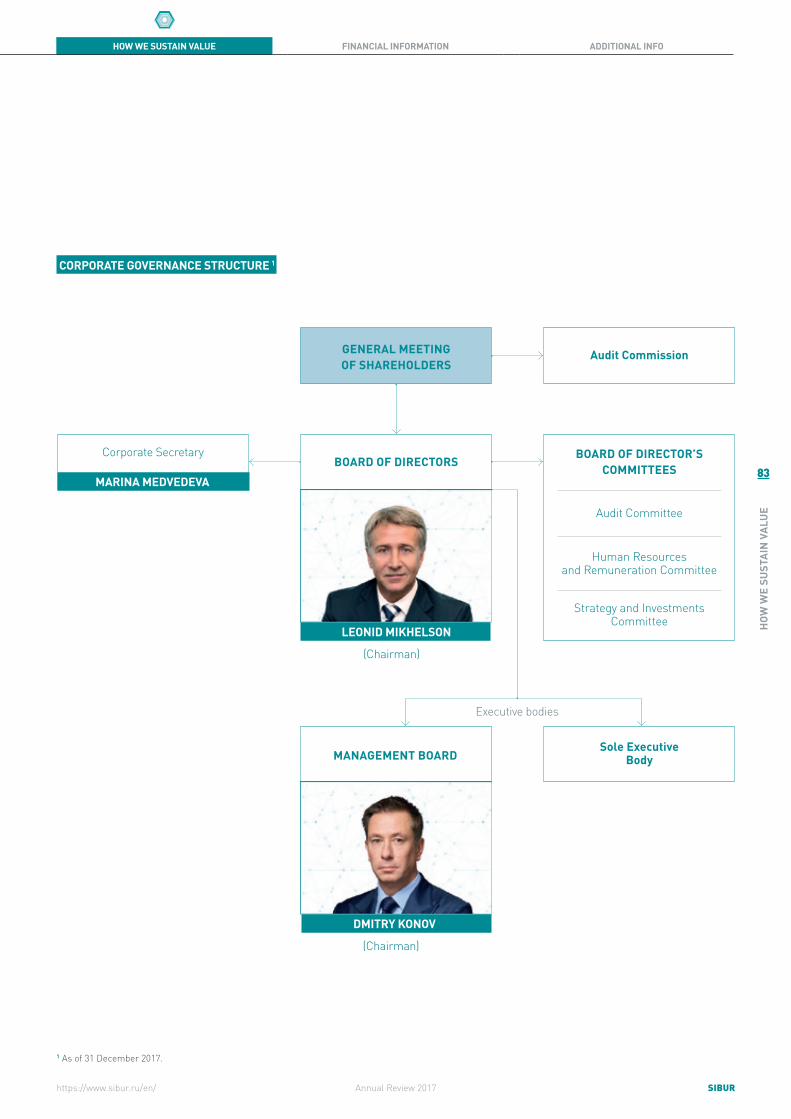
83
HOW
WE
SUST
AIN
VAL
UE
SIBURAnnual Review 2017
INTRODUCTION VALUE CREATION DRIVERS HOW WE CREATE VALUE HOW WE SUSTAIN VALUE FINANCIAL INFORMATION ADDITIONAL INFO
https://www.sibur.ru/en/
LEONID MIKHELSON
(Chairman)
BOARD OF DIRECTORS
GENERAL MEETING OF SHAREHOLDERS
Audit Commission
Sole Executive Body
Executive bodies
Audit Committee
Human Resources and Remuneration Committee
Strategy and Investments Committee
MANAGEMENT BOARD
BOARD OF DIRECTOR’S COMMITTEES
Corporate Secretary
MARINA MEDVEDEVA
CORPORATE GOVERNANCE STRUCTURE
DMITRY KONOV
(Chairman)
1
1 As of 31 December 2017.
84
HOW
WE
SUST
AIN
VAL
UE
SIBUR Annual Review 2017
INTRODUCTION VALUE CREATION DRIVERS HOW WE CREATE VALUE HOW WE SUSTAIN VALUE FINANCIAL INFORMATION ADDITIONAL INFO
https://www.sibur.ru/en/
SIBUR’s management structure consists of the General Meeting of Shareholders, the Group’s Board of Directors, the Management Board, the Sole Executive Body and the Audit Commission.
The General Meeting of Shareholders, which is the supreme governing body of SIBUR, is empowered to decide on the Group’s most critical issues and activities, expressly set forth in the Russian Federation Law “On Joint Stock Companies” and SIBUR’s Charter, including election of the Board of Directors. The most recent Annual General Shareholders’ Meeting took place on 27 April 2017.
The Board of Directors is the collegial governing body of SIBUR responsible for the strategic management of the Group’s activities, focused on creating and enhancing shareholder value. The Board of Directors makes decisions on all general management issues except for those that are the exclusive prerogative of the General Shareholders’ Meeting, Collegial and Sole Executive Bodies.
SIBUR’s Management Board is the Group’s collegial executive body, responsible for effective management of the Group. The Management Board develops and monitors implementation of the Company’s strategy, and implements resolutions adopted by the General Shareholders’ Meeting and the Group’s Board of Directors.
SIBUR’s Sole Executive Body is the Management Company OOO SIBUR, established as per a resolution of the General Shareholders’ Meeting. The rights and responsibilities of the Management Company are governed by the Federal Law “On Joint Stock Companies”, the Group’s Charter, and the agreement between PJSC SIBUR Holding and the Management Company. The responsibilities of the Management Company include all day-to-day management issues except for those that are the exclusive prerogative of the General Shareholders’ Meeting, the Board of Directors and the Management Board.
In accordance with Russian law, the General Shareholders’ Meeting elects the Group’s Audit Commission to review the preparation of accurate financial and accounting statements, other information about the Group’s financial and operational activities, and the status of the Group’s assets. The Audit Commission is also tasked with enhancing asset management effectiveness, mitigating SIBUR’s financial and operational risks, and optimising internal controls.
An external independent auditor conducts an annual audit of the Group’s financial statements in accordance with Russian Accounting Standards (RAS) and consolidated financial statements in accordance with International Financial Reporting Standards (IFRS).
The auditor is approved by the General Shareholders’ Meeting based on the recommendation of the Board of Directors.
All issues concerning the formation, responsibilities and activities of the Group’s governing and controlling bodies are stipulated in the Charter and relevant internal documents, including:
• by-laws of the General Shareholders’ Meeting of PJSC SIBUR Holding;
• by-laws of the Board of Directors of PJSC SIBUR Holding;
• by-laws of the Management Board of PJSC SIBUR Holding;
• by-laws of the Audit Commission of PJSC SIBUR Holding.
Visit the Company’s website to find more information on these documents at: https://www.sibur.ru/en/about/corporate/documents/
1 As of 31 December 2017.
Corporate Governance (continued)
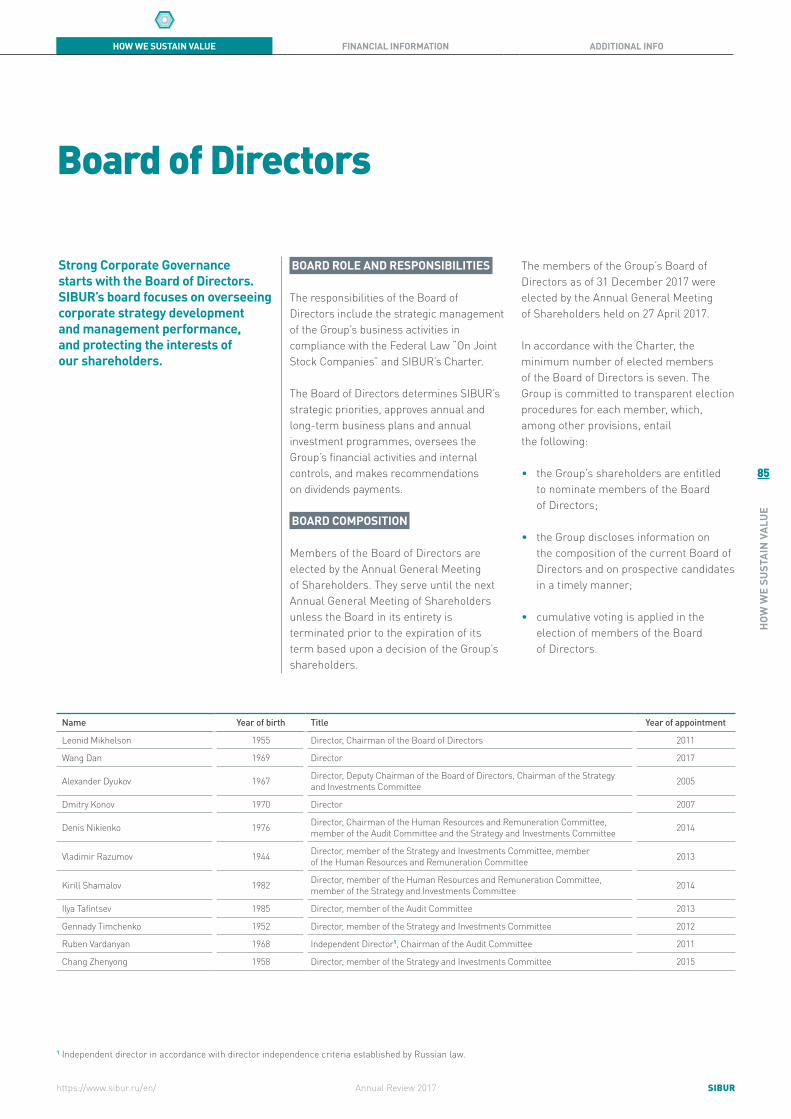
85
HOW
WE
SUST
AIN
VAL
UE
SIBURAnnual Review 2017
INTRODUCTION VALUE CREATION DRIVERS HOW WE CREATE VALUE HOW WE SUSTAIN VALUE FINANCIAL INFORMATION ADDITIONAL INFO
https://www.sibur.ru/en/
Strong Corporate Governance starts with the Board of Directors. SIBUR’s board focuses on overseeing corporate strategy development and management performance, and protecting the interests of our shareholders.
Board of Directors
BOARD ROLE AND RESPONSIBILITIES
The responsibilities of the Board of Directors include the strategic management of the Group’s business activities in compliance with the Federal Law “On Joint Stock Companies” and SIBUR’s Charter.
The Board of Directors determines SIBUR’s strategic priorities, approves annual and long-term business plans and annual investment programmes, oversees the Group’s financial activities and internal controls, and makes recommendations on dividends payments.
BOARD COMPOSITION
Members of the Board of Directors are elected by the Annual General Meeting of Shareholders. They serve until the next Annual General Meeting of Shareholders unless the Board in its entirety is terminated prior to the expiration of its term based upon a decision of the Group’s shareholders.
The members of the Group’s Board of Directors as of 31 December 2017 were elected by the Annual General Meeting of Shareholders held on 27 April 2017.
In accordance with the Charter, the minimum number of elected members of the Board of Directors is seven. The Group is committed to transparent election procedures for each member, which, among other provisions, entail the following:
• the Group’s shareholders are entitled to nominate members of the Board of Directors;
• the Group discloses information on the composition of the current Board of Directors and on prospective candidates in a timely manner;
• cumulative voting is applied in the election of members of the Board of Directors.
Name Year of birth Title Year of appointment
Leonid Mikhelson 1955 Director, Chairman of the Board of Directors 2011
Wang Dan 1969 Director 2017
Alexander Dyukov 1967 Director, Deputy Chairman of the Board of Directors, Chairman of the Strategy and Investments Committee 2005
Dmitry Konov 1970 Director 2007
Denis Nikienko 1976 Director, Chairman of the Human Resources and Remuneration Committee, member of the Audit Committee and the Strategy and Investments Committee 2014
Vladimir Razumov 1944 Director, member of the Strategy and Investments Committee, member of the Human Resources and Remuneration Committee 2013
Kirill Shamalov 1982 Director, member of the Human Resources and Remuneration Committee, member of the Strategy and Investments Committee 2014
Ilya Tafintsev 1985 Director, member of the Audit Committee 2013
Gennady Timchenko 1952 Director, member of the Strategy and Investments Committee 2012
Ruben Vardanyan 1968 Independent Director1, Chairman of the Audit Committee 2011
Chang Zhenyong 1958 Director, member of the Strategy and Investments Committee 2015
1 Independent director in accordance with director independence criteria established by Russian law.

86
HOW
WE
SUST
AIN
VAL
UE
SIBUR Annual Review 2017
INTRODUCTION VALUE CREATION DRIVERS HOW WE CREATE VALUE HOW WE SUSTAIN VALUE FINANCIAL INFORMATION ADDITIONAL INFO
https://www.sibur.ru/en/
ACTIVITIES REVIEW
In 2017, the Board of Directors held 8 meetings, including 5 meetings held remotely.
Strategic planning and investment activities:
• review and approval of the report on 2016 annual investment programme execution;
• review of strategy execution 2009-2016 and long-term strategy beyond 2020;
• ongoing review of ZapSib-2 execution progress, as well as other major investment projects;
• approval of Eurobonds issuance documentation.
Corporate governance:
• approval of revisions to SIBUR’s internal by-laws, including those governing environment, health and safety matters;
• election of newly composed Management Board with expanded membership;
• convening of the General Shareholders’ Meeting to review and approve a revised version of the Charter and Company by-laws.
Approval of PricewaterhouseCoopers as an independent auditor for SIBUR’s 2017 financial statements in accordance with RAS and IFRS.
Board of Directors (continued)
Held remotelyIn personAll
ActualPlan
171821
51
65
22
66
14
51
35
20172016201520142013
Budget planning and financing activities:
• review and recommendation for approval by General Meeting of Shareholders of 2016 annual report and financial results;
• review and approval of the report on 2016 annual business plan execution, including financial and operational performance;
• approval of the business plan and investment programme for 2018;
• approval of the SIBUR Performance Contract1 for 2018;
• approval of several financing transactions and issuance of independent guarantees;
• approval of the additional terms of the agreement on transferring power of attorney between SIBUR and the Management Company for the period of 2016-2018.
1 SIBUR Performance Contract is a set of indicators and targets against which the Company’s performance is evaluated. For more information see SIBUR Performance Contract on p. 64.
6 % 6 %
28 %
17 % 43 %
Financial managementCorporate GovernanceStrategic issuesOperational issuesOther
ISSUES CONSIDERED BY THE BOARD OF DIRECTORS MEETINGS IN 2017
NUMBER OF ISSUES CONSIDERED BY THE BOARD OF DIRECTORS MEETINGS
NUMBER OF BOARD MEETINGS
72
107
11107
7
58
33
54
3
20172016201520142013

87
HOW
WE
SUST
AIN
VAL
UE
SIBURAnnual Review 2017
INTRODUCTION VALUE CREATION DRIVERS HOW WE CREATE VALUE HOW WE SUSTAIN VALUE FINANCIAL INFORMATION ADDITIONAL INFO
https://www.sibur.ru/en/
PARTICIPATION OF MEMBERS OF THE BOARD OF DIRECTORS IN THE WORK OF THE BOARD OF DIRECTORS AND THE COMMITTEES IN 2017
Members of the Board of Directors in 2017 Independent director Board of Directors
(8 meetings)Audit Committee
(9 meetings)
Strategy and Investments Committee
(6 meetings)
Human Resources and Remuneration
Committee (5 meetings)
Leonid Mikhelson 8/8
Wang Dan (since 27 April 2017) 6/6
Alexander Dyukov 8/8 6/6 5/5
Dmitry Konov 8/8
Denis Nikienko 8/8 9/9 6/6 5/5
Vladimir Razumov 8/8 6/6 5/5
Kirill Shamalov 8/8 6/6 5/5
Ilya Tafintsev 8/8 9/9
Gennady Timchenko 8/8 6/6
Ruben Vardanyan 8/8 9/9
Chang Zhenyong 8/8 6/6
BOARD REMUNERATION
As of 31 December 2017, the Group’s Board of Directors comprised eleven individuals. Members of the Board of Directors are entitled to annual remuneration for the execution of their duties and compensation of the costs involved, as stated in the by-laws of the Remuneration Committee.
For the years ended 31 December 2017 and 2016, the Group accrued RR 98 million and RR 88 million net of social taxes as compensation to Board of Directors.
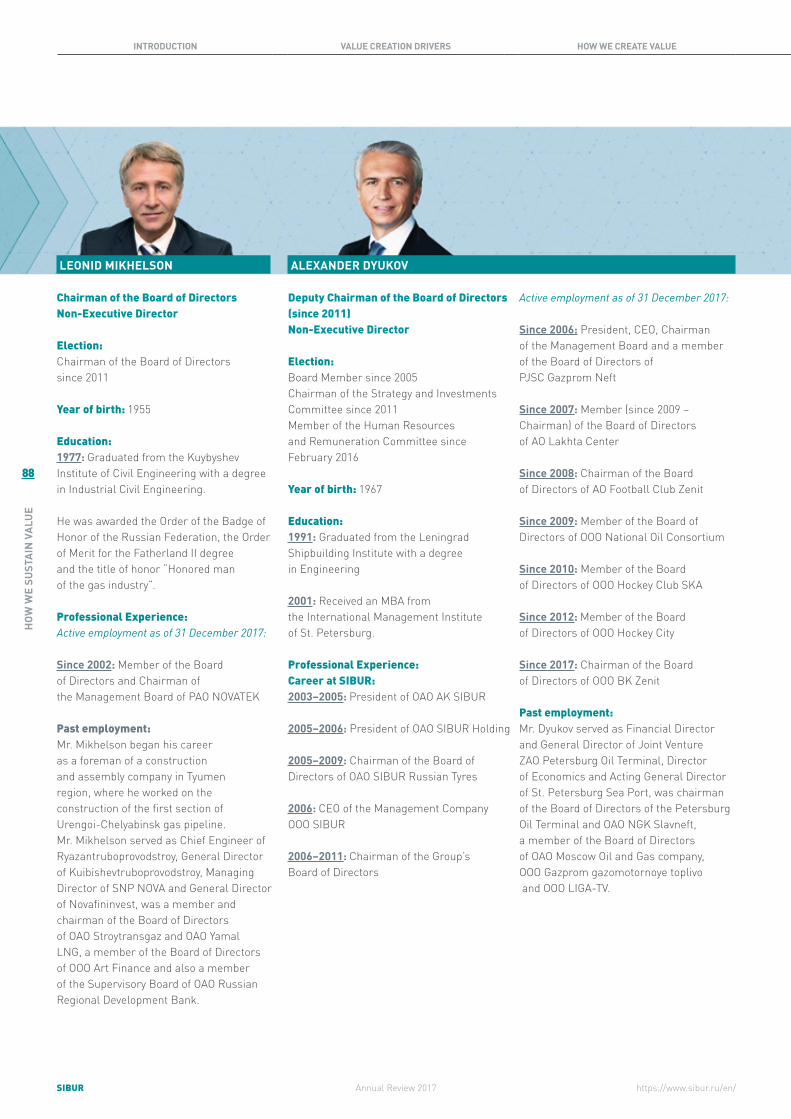
88
HOW
WE
SUST
AIN
VAL
UE
SIBUR Annual Review 2017
INTRODUCTION VALUE CREATION DRIVERS HOW WE CREATE VALUE HOW WE SUSTAIN VALUE FINANCIAL INFORMATION ADDITIONAL INFO
https://www.sibur.ru/en/
LEONID MIKHELSON
Chairman of the Board of Directors Non-Executive Director
Election: Chairman of the Board of Directors since 2011
Year of birth: 1955
Education: 1977: Graduated from the Kuybyshev Institute of Civil Engineering with a degree in Industrial Civil Engineering.
He was awarded the Order of the Badge of Honor of the Russian Federation, the Order of Merit for the Fatherland II degree and the title of honor “Honored man of the gas industry”.
Professional Experience: Active employment as of 31 December 2017: Since 2002: Member of the Board of Directors and Chairman of the Management Board of PAO NOVATEK
Past employment: Mr. Mikhelson began his career as a foreman of a construction and assembly company in Tyumen region, where he worked on the construction of the first section of Urengoi-Chelyabinsk gas pipeline. Mr. Mikhelson served as Chief Engineer of Ryazantruboprovodstroy, General Director of Kuibishevtruboprovodstroy, Managing Director of SNP NOVA and General Director of Novafininvest, was a member and chairman of the Board of Directors of OAO Stroytransgaz and OAO Yamal LNG, a member of the Board of Directors of OOO Art Finance and also a member of the Supervisory Board of OAO Russian Regional Development Bank.
Active employment as of 31 December 2017:
Since 2006: President, CEO, Chairman of the Management Board and a member of the Board of Directors of PJSC Gazprom Neft
Since 2007: Member (since 2009 – Chairman) of the Board of Directors of AO Lakhta Center
Since 2008: Chairman of the Board of Directors of AO Football Club Zenit
Since 2009: Member of the Board of Directors of OOO National Oil Consortium
Since 2010: Member of the Board of Directors of OOO Hockey Club SKA
Since 2012: Member of the Board of Directors of OOO Hockey City
Since 2017: Chairman of the Board of Directors of OOO BK Zenit
Past employment: Mr. Dyukov served as Financial Director and General Director of Joint Venture ZAO Petersburg Oil Terminal, Director of Economics and Acting General Director of St. Petersburg Sea Port, was chairman of the Board of Directors of the Petersburg Oil Terminal and OAO NGK Slavneft, a member of the Board of Directors of OAO Moscow Oil and Gas company, OOO Gazprom gazomotornoye toplivo and OOO LIGA-TV.
ALEXANDER DYUKOV
Deputy Chairman of the Board of Directors (since 2011) Non-Executive Director
Election: Board Member since 2005 Chairman of the Strategy and Investments Committee since 2011 Member of the Human Resources and Remuneration Committee since February 2016
Year of birth: 1967
Education: 1991: Graduated from the Leningrad Shipbuilding Institute with a degree in Engineering
2001: Received an MBA from the International Management Institute of St. Petersburg.
Professional Experience: Career at SIBUR: 2003–2005: President of OAO AK SIBUR
2005–2006: President of OAO SIBUR Holding
2005–2009: Chairman of the Board of Directors of OAO SIBUR Russian Tyres
2006: CEO of the Management Company OOO SIBUR
2006–2011: Chairman of the Group’s Board of Directors

89
HOW
WE
SUST
AIN
VAL
UE
SIBURAnnual Review 2017
INTRODUCTION VALUE CREATION DRIVERS HOW WE CREATE VALUE HOW WE SUSTAIN VALUE FINANCIAL INFORMATION ADDITIONAL INFO
https://www.sibur.ru/en/
WANG DAN
Non-Executive Director
Election: Board Member since 2017
Year of birth: 1969
Education: 1991: The Management School of Wuhan University, Bachelor’s degree with a major in International Finance
1994: Tsinghua University PBC School of Finance, Master’s Degree in International Finance
Professional Experience: Active employment as of 31 December 2017:
Since 2015: Executive Vice President, Silk Road Fund Co., Ltd
Past employment: 2012–2015: Deputy Director-General of the International Department and Monetary Policy Department II of the People’s Bank of China
2015–2017: Board Director, Pirelli & C. S.p.A.
Since 2007: Chairman of the Group’s Management Board
2008–2011: Chairman of the Board of Directors of OAO SIBUR-Fertilizers
Since 2009: Chairman of the Management Board of the Management Company OOO SIBUR
2010–2013: Member of the Board of Directors of OOO Tobolsk-Polymer
Active employment as of 31 December 2017: Since 2014: Member of the Board of Directors of AO Stroytransneftegaz
Member of the Board of Directors of OOO STGM
Since 2016: Chairman of the Board of Directors of AO NIPIGAZ
Since 2017: Member of the Board of Directors of PJSC AK ALROSA
Past employment: Mr. Konov served in the Treasury Department of OAO NK YUKOS, held various positions at AKB Trust and Investment Bank, including Vice President – Head of the Investment Banking Department and Managing Director of Corporate Finance Department, was a member of the Board of Directors of OAO Gazprom neftekhim Salavat and OAO Gazprombank, AO SDS AZOT, OOO Tobolsk-Polymer, Chairman of the Board of Directors of OOO RusVinyl, OOO SNHK, OAO Stroytransgaz.
Executive Director
Election: Board Member since 2007 Chairman of the Management Board since 2007
Year of birth: 1970
Education: 1994: Graduated from the Moscow State Institute of International Relations (MGIMO) with a degree in International Economic Relations
2001: Received an IMD MBA degree
Professional Experience: Career at SIBUR: 2004–2009: Various positions at OAO AK SIBUR, including Advisor to the President, Vice President for Corporate Policy and Strategy, Senior Vice President for Corporate Policy and Strategy, President, member of the Board of Directors
2005–2012: Chairman of the Board of Directors of OAO SIBUR Russian Tyres
Since 2006: President (2006-2001), General Director (2011-2016), Chairman of the Management Board of the Management Company OOO SIBUR
2007–2010: Member of the Board of Directors of OAO Polief
Chairman of the Board of Directors of ZAO SIBUR-Trans
DMITRY KONOV

90
HOW
WE
SUST
AIN
VAL
UE
SIBUR Annual Review 2017
INTRODUCTION VALUE CREATION DRIVERS HOW WE CREATE VALUE HOW WE SUSTAIN VALUE FINANCIAL INFORMATION ADDITIONAL INFO
https://www.sibur.ru/en/
VLADIMIR RAZUMOV
Executive Director
Election: Board Member in 2011 – April 2012 and since 2013Member of the Strategy and Investments Committee since 2012Member of the Human Resources and Remuneration Committee since 2015
Year of birth: 1944
Education: 1967: Graduated with honors from the Voronezh Technological Institute with a degree in Engineering
1980: Graduated from the Plekhanov Russian Academy of Economics, with a degree in Procurement
1987-1989: Studied at the Academy of the National Economy under the USSR Council of Ministers, specialising in Economics and Management of the National Economy
Professional Experience: Career at SIBUR: 1999–2002: Served as Vice President in charge of Production of Synthetic Rubber and Tyres and Senior Vice President in charge of Petrochemical Production of OAO AK SIBUR
2003-2005: Re-joined OAO AK SIBUR, served as Advisor to the President, Vice President in charge of Production, Senior Vice President in charge of Production and Marketing
2005–2006: Senior Executive Vice President at OAO SIBUR Holding
2005–2008: Member of the Board of Directors of OAO SIBUR-Russian Tyres
2006–2008: Member of the Board of Directors of OAO SIBUR-Neftekhim
2006–2009: Member of the Board of Directors of OAO Plastic
2006–2012: Member of the Board of Directors of AO SIBUR-Trans
Senior Executive Vice President at the Management Company OOO SIBUR
Since 2007: Member of the Management Board of PJSC SIBUR Holding
Since 2009: Member of the Management Board of the Management Company OOO SIBUR
2010–2011: Member of the Board of Directors of OAO SIBUR-Fertilisers
2010–2016: Chairman of the Board of Directors of OOO Tobolsk-Polymer
2012–2016: Executive Director of the Management Company OOO SIBUR
Since 2016: Member of the Management Board – Chairman of the Committee of the Management Company OOO SIBUR
Past employment: Mr. Razumov worked at Voronezh Synthetic Rubber Plant as an engineer, section manager, mechanic, shop manager and Deputy Director for Procurement and Marketing, was Director of the Volga Synthetic Rubber Plant, Head of the Main Procurement Department of the USSR Ministry of the Oil Refining and Petrochemicals Industry, USSR Deputy Minister of the Oil Refining and Petrochemicals Industry, Vice President and First Vice President of ZAO Korporatsiya Rosshina, Vice President of ZAO Roskhimneft, COO of OAO Avtotor Holding and a member of the Board of Directors of OAO VNIPIneft.
Non-Executive Director
Election: Board Member since 2014Member of the Audit Committee since 2014Member of the Strategy and Investments Committee since February 2016Chairman of the Human Resources and Remuneration Committee since February 2016
Year of birth: 1976
Education: 2000: Graduated from the Moscow State University with a degree in Law
2009: Completed executive management courses at INSEAD (Fontainebleau, France), participated in Gazprom Neft Leading in Global Economy programme
2010-2011: Completed executive management courses at Skolkovo Moscow School of Management (Moscow, Russia)
Professional Experience: Career at SIBUR: 2005–2009: Various positions at Legal department of the Management Company OOO SIBUR
2009-2014: Director of the Legal department, Director for legal support of the Management Company OOO SIBUR
Active employment as of 31 December 2017: Since 2014: General Director of OOO Ladoga Management
Since 2015: General Director of OOO Kronwerk Capital
Past employment: Served as a lawyer at Inkombank, general legal practice, was a Member of the Board of Directors of AO NIPIGAZ
DENIS NIKIENKO
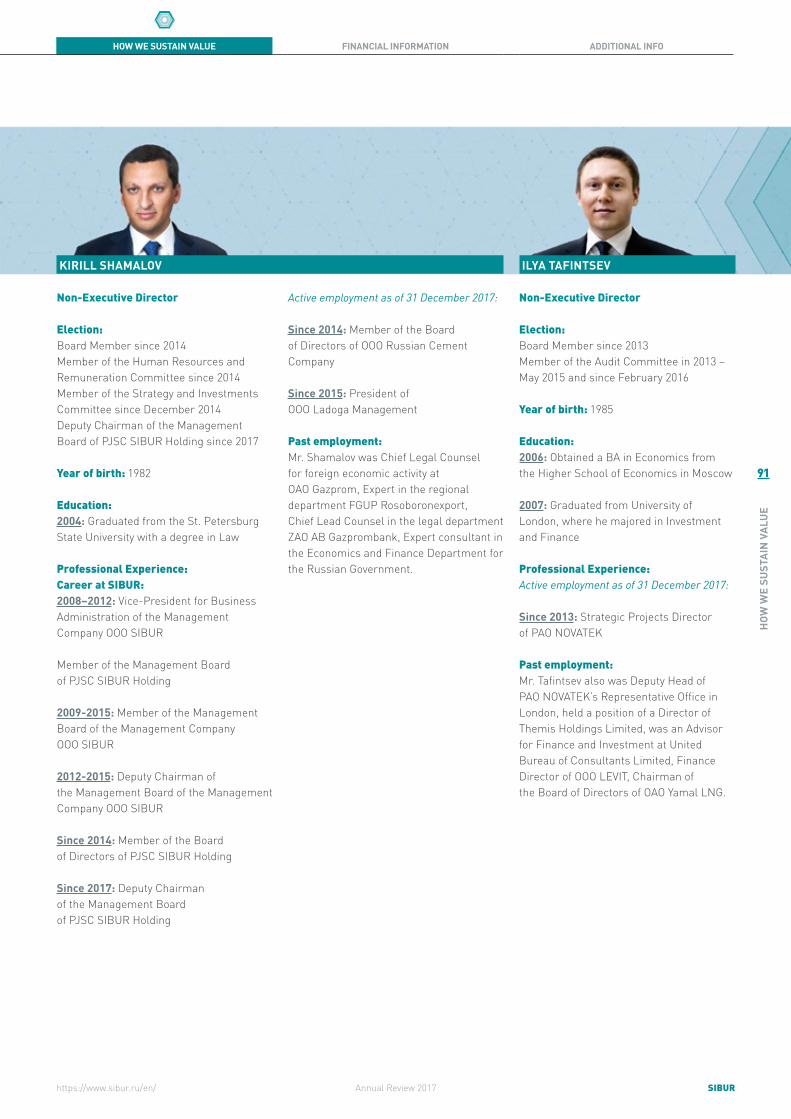
91
HOW
WE
SUST
AIN
VAL
UE
SIBURAnnual Review 2017
INTRODUCTION VALUE CREATION DRIVERS HOW WE CREATE VALUE HOW WE SUSTAIN VALUE FINANCIAL INFORMATION ADDITIONAL INFO
https://www.sibur.ru/en/
ILYA TAFINTSEV
Non-Executive Director
Election: Board Member since 2013 Member of the Audit Committee in 2013 – May 2015 and since February 2016
Year of birth: 1985
Education: 2006: Obtained a BA in Economics from the Higher School of Economics in Moscow
2007: Graduated from University of London, where he majored in Investment and Finance
Professional Experience: Active employment as of 31 December 2017:
Since 2013: Strategic Projects Director of PAO NOVATEK
Past employment: Mr. Tafintsev also was Deputy Head of PAO NOVATEK’s Representative Office in London, held a position of a Director of Themis Holdings Limited, was an Advisor for Finance and Investment at United Bureau of Consultants Limited, Finance Director of OOO LEVIT, Chairman of the Board of Directors of OAO Yamal LNG.
Active employment as of 31 December 2017:
Since 2014: Member of the Board of Directors of OOO Russian Cement Company
Since 2015: President of OOO Ladoga Management
Past employment: Mr. Shamalov was Chief Legal Counsel for foreign economic activity at OAO Gazprom, Expert in the regional department FGUP Rosoboronexport, Chief Lead Counsel in the legal department ZAO AB Gazprombank, Expert consultant in the Economics and Finance Department for the Russian Government.
KIRILL SHAMALOV
Non-Executive Director
Election: Board Member since 2014 Member of the Human Resources and Remuneration Committee since 2014 Member of the Strategy and Investments Committee since December 2014 Deputy Chairman of the Management Board of PJSC SIBUR Holding since 2017
Year of birth: 1982
Education: 2004: Graduated from the St. Petersburg State University with a degree in Law
Professional Experience:Career at SIBUR: 2008–2012: Vice-President for Business Administration of the Management Company OOO SIBUR
Member of the Management Board of PJSC SIBUR Holding
2009-2015: Member of the Management Board of the Management Company OOO SIBUR
2012-2015: Deputy Chairman of the Management Board of the Management Company OOO SIBUR
Since 2014: Member of the Board of Directors of PJSC SIBUR Holding
Since 2017: Deputy Chairman of the Management Board of PJSC SIBUR Holding

92
HOW
WE
SUST
AIN
VAL
UE
SIBUR Annual Review 2017
INTRODUCTION VALUE CREATION DRIVERS HOW WE CREATE VALUE HOW WE SUSTAIN VALUE FINANCIAL INFORMATION ADDITIONAL INFO
https://www.sibur.ru/en/
Member of the Board of Trustees of the All-Russian public organisation Russian Geographical Society
Since 2014: Chairman of the Russian Council of the NPO Russian Chinese Business Council
Chairman of the Board to promote OCD
Vice-President of the Olympic Committee of the Russian Federation
Past employment: Mr. Timchenko began his career at Izhorsk plant in Leningrad, which specialised in engineering and production of equipment for the energy industry. Mr. Timchenko also was Senior Engineer at the Ministry of Foreign Trade, Vice President of Kirishineftekhimexport, worked for Urals Finland, was Managing Director of IPP OY Finland and IPP AB Sweden, was also member and Chairman of the Board of Directors of OOO Transoil, a member of the Board of Directors of Airfix Aviation OY and OOO BaltTransService, Co-founder of Gunvor, a leading independent oil trading company. Mr. Timchenko has more than 20 years of experience in the Russian and international energy sectors. He has built interests in trading, logistics and transportation related companies.
Non-Executive Director
Election: Board Member since 2012Member of the Strategy and Investments Committee since 2012
Year of birth: 1952
Education: 1976: Graduated from the Leningradsky Mechanical University with a degree in Electromechanical Engineering
Professional Experience: Active employment as of 31 December 2017:
Since 2009: Member of PAO NOVATEK’s Board of Directors
Since 2011: Co-Сhairman of the Economic Council of the Franco-Russian Chamber of Commerce
Chairman of the Board of Directors of the Ice Hockey Club SKA St. Petersburg
Since 2012: Chairman of the Board of Directors of the Continental Hockey League (KHL)
GENNADY TIMCHENKO RUBEN VARDANYAN
1 In accordance with director independence criteria established by Russian law.
Independent Director1
Election: Board Member since 2011 Chairman of the Audit Committee since May 2015
Year of birth: 1968
Education: 1992: Graduated with honors from the Moscow State University with a degree in Economics
1992: Interned at Banca CRT in Italy, attended courses on emerging markets organised by Merrill Lynch in New York
2000: Completed executive management courses at INSEAD (Fontainebleau, France)
2001, 2005: Completed courses at the Harvard Business School (USA)
2012, 2013: Completed special programmes at Yale University and Stanford University Graduate School of Business
Professional Experience: Active employment as of 31 December 2017:
Since 2006: Founding Partner and member of Coordination Council of Moscow School of Management Skolkovo
Since 2007: Member of the Board of Directors of ZAO AmeriaBank
Since 2009: Member of the Board of Directors of OAO KAMAZ
Since 2013: Vice-Chairman of the International Advisory Board of Moscow School of Management Skolkovo
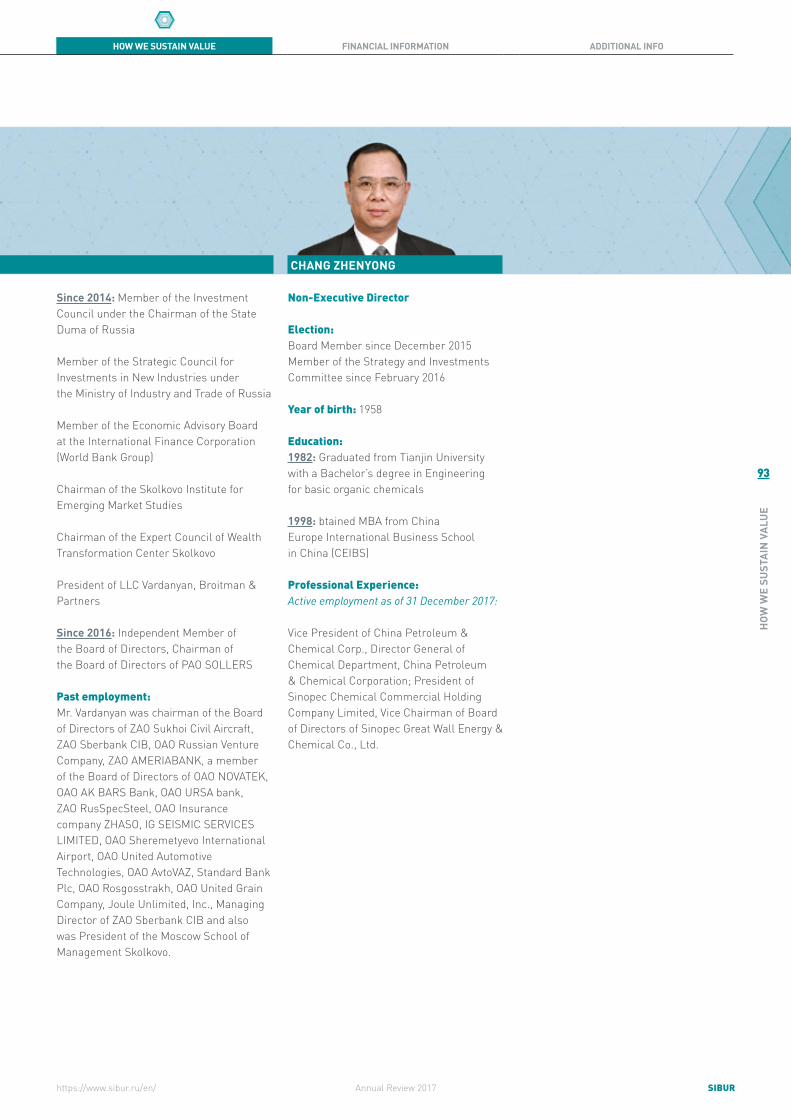
93
HOW
WE
SUST
AIN
VAL
UE
SIBURAnnual Review 2017
INTRODUCTION VALUE CREATION DRIVERS HOW WE CREATE VALUE HOW WE SUSTAIN VALUE FINANCIAL INFORMATION ADDITIONAL INFO
https://www.sibur.ru/en/
CHANG ZHENYONG
Non-Executive Director
Election: Board Member since December 2015 Member of the Strategy and Investments Committee since February 2016
Year of birth: 1958
Education: 1982: Graduated from Tianjin University with a Bachelor’s degree in Engineering for basic organic chemicals
1998: btained MBA from China Europe International Business School in China (CEIBS)
Professional Experience: Active employment as of 31 December 2017:
Vice President of China Petroleum & Chemical Corp., Director General of Chemical Department, China Petroleum & Chemical Corporation; President of Sinopec Chemical Commercial Holding Company Limited, Vice Chairman of Board of Directors of Sinopec Great Wall Energy & Chemical Co., Ltd.
RUBEN VARDANYAN
Since 2014: Member of the Investment Council under the Chairman of the State Duma of Russia
Member of the Strategic Council for Investments in New Industries under the Ministry of Industry and Trade of Russia
Member of the Economic Advisory Board at the International Finance Corporation (World Bank Group)
Chairman of the Skolkovo Institute for Emerging Market Studies
Chairman of the Expert Council of Wealth Transformation Center Skolkovo
President of LLC Vardanyan, Broitman & Partners
Since 2016: Independent Member of the Board of Directors, Chairman of the Board of Directors of PAO SOLLERS
Past employment: Mr. Vardanyan was chairman of the Board of Directors of ZAO Sukhoi Civil Aircraft, ZAO Sberbank CIB, OAO Russian Venture Company, ZAO AMERIABANK, a member of the Board of Directors of OAO NOVATEK, OAO AK BARS Bank, OAO URSA bank, ZAO RusSpecSteel, OAO Insurance company ZHASO, IG SEISMIC SERVICES LIMITED, OAO Sheremetyevo International Airport, OAO United Automotive Technologies, OAO AvtoVAZ, Standard Bank Plc, OAO Rosgosstrakh, OAO United Grain Company, Joule Unlimited, Inc., Managing Director of ZAO Sberbank CIB and also was President of the Moscow School of Management Skolkovo.
94
HOW
WE
SUST
AIN
VAL
UE
SIBUR Annual Review 2017
INTRODUCTION VALUE CREATION DRIVERS HOW WE CREATE VALUE HOW WE SUSTAIN VALUE FINANCIAL INFORMATION ADDITIONAL INFO
https://www.sibur.ru/en/
In order to ensure the effectiveness of the Board’s functions, SIBUR’s Board of Directors has established three Board Committees. They undertake a more detailed review of the issues within their areas of responsibility and make recommendations to the Board as necessary.
In accordance with corporate governance best practise, the Chairman of the Audit Committee is an independent director of the Board. Committee members are elected by the Board during the first meeting of the newly composed Board of Directors for a term lasting until the next Board of Directors’ election by the shareholders. The current Committee members have been elected by the Board on 10 May 2017.
Board Committees
AUDIT COMMITTEE
Committee roleResponsible for developing and issuing recommendations to the Board of Directors on:
• an annual independent external audit of the Group’s financial statements, including the IFRS financial statements;
• independent external auditor’s qualifications, the quality of the services rendered by the auditor, and whether the auditor satisfies the requirements for independence;
• improvements to internal controls and risk management functions;
• assessment of the effectiveness of internal controls and risk management functions and recommendations for further improvement;
• dividend amounts and payout schedules.
Committee composition:• Ruben Vardanyan
(Chairman) • Denis Nikienko• Ilya Tafintsev
HUMAN RESOURCES AND REMUNERATION COMMITTEE
Committee roleResponsible for developing and making recommendations to the Board of Directors on:
• the key Group’s human resource policies;
• the Group’s annual performance indicators and annual and semi-annual results;
• the Group’s long-term incentive programmes;
• criteria and policies for candidate selection to the management bodies;
• remuneration policy applicable to members of management bodies;
• implementation of personnel policy for subsidiaries and affiliates.
The Committee submits recommendations to the Group’s Board of Directors on improvements in Group and Management Company HR policies, and qualification criteria for Independent Directors.
Committee composition:• Denis Nikienko
(Chairman) • Alexander Dyukov • Vladimir Razumov • Kirill Shamalov
9 MEETINGSOF THE AUDIT COMMITTEE IN 2017

95
HOW
WE
SUST
AIN
VAL
UE
SIBURAnnual Review 2017
INTRODUCTION VALUE CREATION DRIVERS HOW WE CREATE VALUE HOW WE SUSTAIN VALUE FINANCIAL INFORMATION ADDITIONAL INFO
https://www.sibur.ru/en/
STRATEGY AND INVESTMENTS COMMITTEE
Committee role:Responsible for developing and issuing recommendations to the Board of Directors on:
• defining SIBUR’s priority areas for development;
• defining the Group’s long-term strategy (including financing strategy), objectives and key initiatives, as well as annual and long-term investment programmes;
• evaluating the Group’s investment programme and strategic planning process as well as the Group’s policy on interaction with investors and shareholders and proposing improvements;
• issues related to the Group’s establishment of commercial entities, as well as mergers, acquisitions, divestments or pledges of the Group’s assets;
• issuance of bonds or other securities.
Committee composition:• Alexander Dyukov
(Chairman) • Denis Nikienko• Vladimir Razumov• Kirill Shamalov• Gennady Timchenko• Chang Zhenyong
6 MEETINGSOF THE STRATEGY AND INVESTMENTS COMMITTEE IN 2017
5 MEETINGSOF THE HUMAN RESOURCES AND REMUNERATION COMMITTEE IN 2017
Issues on audit conductionRisk managementFinancial managementRecommendations on dividends
Other
HR policiesPerformance indicatorsOther
Financial managementStrategic issuesOperational issuesOther
ISSUES CONSIDERED BY THE AUDIT COMMITTEE MEETINGS IN 2017
ISSUES CONSIDERED BY THE HUMAN RESOURCES AND REMUNERATION COMMITTEE MEETINGS IN 2017
ISSUES CONSIDERED BY THE STRATEGY AND INVESTMENTS COMMITTEE MEETINGS IN 2017
6 %12 %
28 %
18 %
36 %31%
23%
8%
38%
25%
25%
50%
96
HOW
WE
SUST
AIN
VAL
UE
SIBUR Annual Review 2017
INTRODUCTION VALUE CREATION DRIVERS HOW WE CREATE VALUE HOW WE SUSTAIN VALUE FINANCIAL INFORMATION ADDITIONAL INFO
https://www.sibur.ru/en/
The Corporate Secretary position was established in the SIBUR in 2008.
The Corporate Secretary’s key responsibilities are to ensure efficient corporate procedures aimed at protecting shareholder rights and ensuring SIBUR’s commitment to their interests, as well as supporting management decision making, inter alia:
• Interaction with shareholders and their representatives to support the effective work of the Group’s governing bodies and ensure shareholders’ rights and commitment to their interests;
• Ensuring execution of procedures regulating the activities of collegial bodies in compliance with federal laws, SIBUR’s Charter and other internal corporate policies;
• Arrangement of the Company’s engagement with shareholders, preparation of replies to their requests and inquires;
• Advisory support to the Board of Directors, Management Board and shareholders;
Corporate Secretary
• Ensuring the efficient functioning of the collegial executive bodies of PJSC SIBUR Holding and the Management Company OOO SIBUR, including:
- General Meeting of Shareholders of PJSC SIBUR Holding,
- Board of Directors of PJSC SIBUR Holding,
- Management Board of SIBUR Holding,
- Board Committees of PJSC SIBUR Holding,
- Investment committee of the Management Company OOO SIBUR,
- Governing boards of investment projects,
- Organisational Projects committee of the Management Company OOO SIBUR,
- Management Board of the Management Company,
- Ethics and Compliance committee of the Management Company OOO SIBUR;
• Ensuring best practices in accordance with professional standards and bodies;
• Control over the implementation of decisions made by the governing bodies.
In 2017 SIBUR Corporate Secretary department head Svetlana Danilova won the “Director of the Year” award within the “Corporate Governance Director / Corporate Secretary” category, which was presented by the Association of Independent Directors and the Russian Union of Industrialists and Entrepreneurs in partnership with PwC, Moscow Exchange and Sberbank.

97
HOW
WE
SUST
AIN
VAL
UE
SIBURAnnual Review 2017
INTRODUCTION VALUE CREATION DRIVERS HOW WE CREATE VALUE HOW WE SUSTAIN VALUE FINANCIAL INFORMATION ADDITIONAL INFO
https://www.sibur.ru/en/
Corporate Secretary of PJSC SIBUR Holding
Ranked as one of 2017’s Top-50 Corporate Governance Directors as part of the annual Top-1000 Russian Managers list compiled by the the Association of Managers and the Kommersant Publishing House
“Director of the year” winner in 2014 / 2012 “Corporate Governance Director / Corporate Secretary” award from the Association of Independent Directors and the Russian Union of Industrialists and Entrepreneurs.
Education: 2000: Graduated with honours from the Moscow Academy of Economics and Law with a degree in Law
2004: Winner of the Edmund S. Muskie Graduate Fellowship Program (U.S. Department of State)
2008: Completed MBA course “International Oil & Gas Business” at the Faculty of Additional Professional Education at the Moscow State Institute of International Relations (MGIMO)
2004–2009: Completed executive management courses at INSEAD
Professional ExperienceActive employment as for 31 December 2017 Since 2016 General Director in ООО «OleFinInvest».Career at SIBURSince 2008 Served as Head of Governing and Executive bodies Administration, Administrative Services Director.
Since 2012 Member of the Board of Directors of Petrochemical India Private Limited.
Since 2012 Member of the Board of Directors of Reliance Sibur Elastomers Private Limited.
Since 2016 Member of the Management Board of the Management Company OOO SIBUR, Director, Corporate Secretary & Administrative Services
Supervisor of the Corporate electronic documentation workflow programme in SIBUR.
Corporate Secretary & Administrative Services also manage protocol and branding activities, processes management, international trade and business support services.
Secretary to the Board of Directors of PJSC SIBUR Holding, Secretary to the Board Committees, Secretary to the Management Board of PJSC SIBUR Holding and the Management Company OOO SIBUR.
MARINA MEDVEDEVA
Past employment
Ms. Medvedeva served as Head of the Management Board and Committees Services Department, Corporate Secretary to the Management Board of OJSC “TNK-BP Management”.
Ms. Medvedeva does not own shares of PJSC SIBUR Holding or its subsidiaries and affiliates; and is not related to other persons who are members of the governing bodies and/or bodies supervising financial and operational activities of PJSC SIBUR Holding.
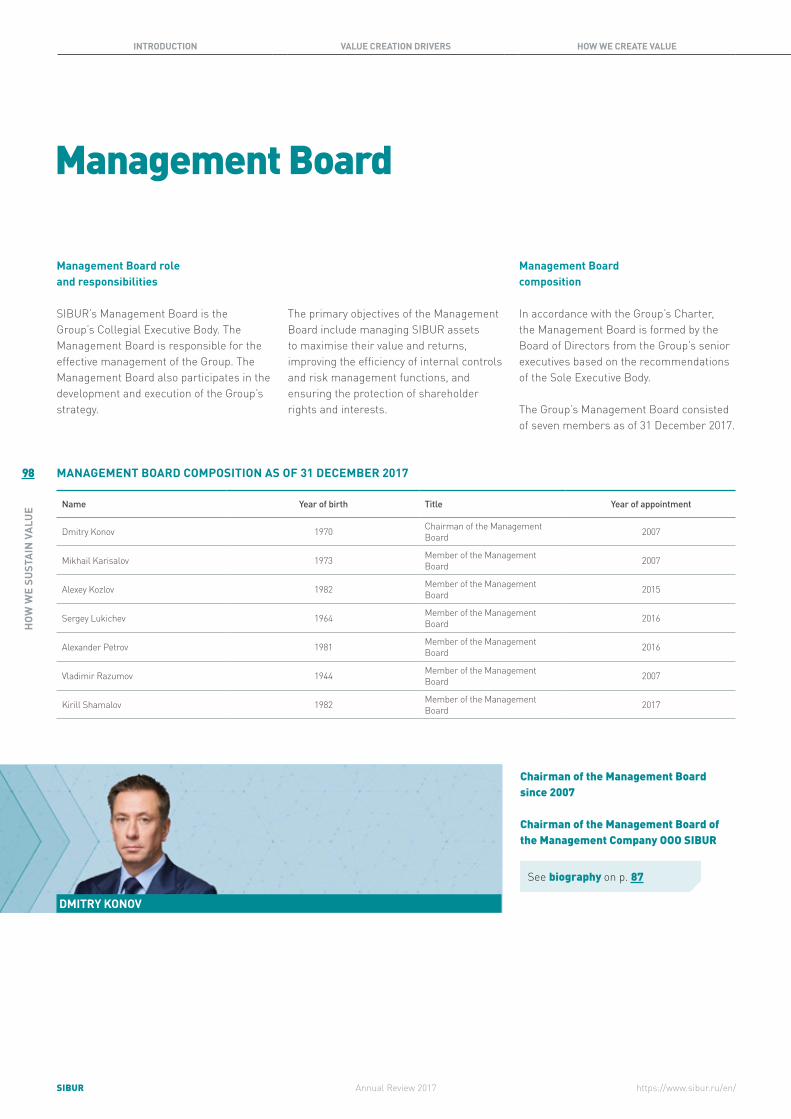
98
HOW
WE
SUST
AIN
VAL
UE
SIBUR Annual Review 2017
INTRODUCTION VALUE CREATION DRIVERS HOW WE CREATE VALUE HOW WE SUSTAIN VALUE FINANCIAL INFORMATION ADDITIONAL INFO
https://www.sibur.ru/en/
Management Board role and responsibilities
SIBUR’s Management Board is the Group’s Collegial Executive Body. The Management Board is responsible for the effective management of the Group. The Management Board also participates in the development and execution of the Group’s strategy.
Management Board
The primary objectives of the Management Board include managing SIBUR assets to maximise their value and returns, improving the efficiency of internal controls and risk management functions, and ensuring the protection of shareholder rights and interests.
MANAGEMENT BOARD COMPOSITION AS OF 31 DECEMBER 2017
Name Year of birth Title Year of appointment
Dmitry Konov 1970 Chairman of the Management Board 2007
Mikhail Karisalov 1973 Member of the Management Board 2007
Alexey Kozlov 1982 Member of the Management Board 2015
Sergey Lukichev 1964 Member of the Management Board 2016
Alexander Petrov 1981 Member of the Management Board 2016
Vladimir Razumov 1944 Member of the Management Board 2007
Kirill Shamalov 1982 Member of the Management Board 2017
Chairman of the Management Board since 2007
Chairman of the Management Board of the Management Company OOO SIBUR
See biography on p. 87
DMITRY KONOV
Management Board composition
In accordance with the Group’s Charter, the Management Board is formed by the Board of Directors from the Group’s senior executives based on the recommendations of the Sole Executive Body.
The Group’s Management Board consisted of seven members as of 31 December 2017.

99
HOW
WE
SUST
AIN
VAL
UE
SIBURAnnual Review 2017
INTRODUCTION VALUE CREATION DRIVERS HOW WE CREATE VALUE HOW WE SUSTAIN VALUE FINANCIAL INFORMATION ADDITIONAL INFO
https://www.sibur.ru/en/
Member of the Management Board of PJSC SIBUR Holding (Deputy Chairman 2007 – December 2017)
Member of the Management Board, Chief Operating Officer of the Management Company OOO SIBURYear of birth: 1973
Education1998: Graduated from the Russian Civil Service Academy under the President of the Russian Federation, where he majored in State and Municipal Management
2010: Completed professional retraining course in Chemical Technology of Natural Energy Sources and Carbon Materials at Tyumen State Oil and Gas University
Professional ExperienceCareer at SIBUR 2003–2005: Various positions at OAO AK SIBUR, including Advisor to the President, Director of Procurement, Head of Logistics and Capital Construction2005–2006: Various positions at OAO SIBUR Holding, including Head of Logistics and Capital Construction and Head of Hydrocarbon Feedstock Department2006–2008: General Director of OAO SiburTyumenGaz2006–2011: Vice-President – Head of Hydrocarbon Feedstock Department at the Management Company OOO SIBUR2007–2016: Member of the Board of Directors of OOO Yuzhno-Priobskiy GPP2007– December 2017: Deputy Chairman of the Management Board of PJSC SIBUR Holding2009–2016: Member of the Board of Directors of ООО Tobolsk-Polymer2009–2012: General Director of OOO Tobolsk-Polymer2011–2012: Executive Director of the Management Company OOO SIBUR2012–2016: Deputy Chairman of the Management Board of the Management Company OOO SIBURSince 2016: Member of the Management Board – Chief Operating Officer of OOO SIBURSince December 2017: Member of the Management Board of PJSC SIBUR Holding
MIKHAIL KARISALOV
Active employment as of 31 December 2017Since 2014: Chairman of the Board of Directors of OOO STGMSince 2016: Member of the Board of Directors of AO NIPIGAZ
Past employmentMr. Karisalov was General Director of OOO Oblkonservprom.

100
HOW
WE
SUST
AIN
VAL
UE
SIBUR Annual Review 2017
INTRODUCTION VALUE CREATION DRIVERS HOW WE CREATE VALUE HOW WE SUSTAIN VALUE FINANCIAL INFORMATION ADDITIONAL INFO
https://www.sibur.ru/en/
Member of the Management Board since February 2016
Member of the Management Board and Managing Director, Information Security of the Management Company OOO SIBURYear of birth: 1964
Education1986: Graduated from the Perm Krasnoznamennoe High Command Military Academy specialising in Physics and Power Plants
SERGEY LUKICHEV
Professional ExperienceCareer at SIBUR Since 2004: Director of the Information Security DepartmentSince 2011: Member of the Management Board and Managing Director, Information Security of the Management Company OOO SIBUR
Past employmentServed in the military.
Member of the Management Board of PJSC SIBUR Holding (Deputy Chairman 2015 – December 2017)Year of birth: 1982
Education2004: Graduated with honors from the Moscow State Law University with a degree in Law. Ph.D. in Law
Professional ExperienceCareer at SIBUR2015 – December 2017: Deputy Chairman of the Management Board of PJSC SIBUR HoldingSince December 2017: Member of the Management Board of PJSC SIBUR HoldingSince 2015: Member of the Management Board and Managing Director, Administrative support and GR of the Management Company OOO SIBUR
ALEXEY KOZLOV
Past employmentMr. Kozlov held various positions in the Russian Ministry for Economic Development, including Deputy Head of State Property Management; Chief Counselor at the Department of Priority National Projects and an Assistant to Deputy Chairman in the Government of the Russian Federation; Head of the Department of Social Development of the Government of the Russian Federation.

101
HOW
WE
SUST
AIN
VAL
UE
SIBURAnnual Review 2017
INTRODUCTION VALUE CREATION DRIVERS HOW WE CREATE VALUE HOW WE SUSTAIN VALUE FINANCIAL INFORMATION ADDITIONAL INFO
https://www.sibur.ru/en/
Member of the Management Board of PJSC SIBUR Holding
Member of the Management Board, Managing Director for Economics and Finance of the Management Company OOO SIBUR
Year of birth: 1981
Education2003: Graduated from the Finance Academy under the Government of the Russian Federation (currently, the Financial University under the Government of the Russian Federation) with a degree in Finance
2014: Graduated with MBA for executives from INSEAD
ALEXANDER PETROV
Member of the Management Board of PJSC SIBUR Holding
Member of the Management Board, Chairman of the Committee of the Management Company OOO SIBUR
See biography on p. 88
Member of the Management Board of PJSC SIBUR Holding since 2017
See biography on p. 89
VLADIMIR RAZUMOV KIRILL SHAMALOV
Professional ExperienceCareer at SIBUR2006-2016: Various positions at SIBUR, including Head of the Economics Department, CFO at SiburTyumenGaz, Financial Director of the Hydrocarbons Division, and Director for Financial Controlling
Since 2016: Member of the Management Board, Managing Director for Economics and Finance
Past employment
Mr. Petrov held various positions at PricewaterhouseCoopers Audit, including audit consultant and senior advisor.
102
HOW
WE
SUST
AIN
VAL
UE
SIBUR Annual Review 2017
INTRODUCTION VALUE CREATION DRIVERS HOW WE CREATE VALUE HOW WE SUSTAIN VALUE FINANCIAL INFORMATION ADDITIONAL INFO
https://www.sibur.ru/en/
Anti-Corruption Policies and ComplianceSIBUR complies with the requirements of anti-corruption legislation and codes of conduct in each country where we operate. SIBUR applies anti-corruption principles in its operating activities as well as in the implementation of strategic projects and participation in joint ventures, and in relations with commercial and financial counterparties.
The fundamental requirements and principles that each SIBUR employee must follow to protect property rights, safeguard against bribery or fraud and avoid potential conflicts of interest are contained in SIBUR’s Code of Corporate Conduct.
Visit the Company’s website to find more information on SIBUR’s Code of Corporate Conduct at: http://www.sibur.ru/en/about/corporate/documents/
SIBUR continuously reviews and strengthens its compliance management system and policies to prevent fraud, abuse and conflicts of interest. In this regard, the Company has adopted a by-law on managing conflicts of interests. In addition to policies that go above and beyond legal compliance that the Company has adopted voluntarily, SIBUR has approved guidelines and requirements for employees when interacting with governmental authorities and counterparties to ensure compliance with anti-corruption legislation. SIBUR regularly updates existing practices to adjust to changes in legislation and to align with international best practices.
The Company provides appropriate communication and education for employees regarding compliance with anti-corruption and conflicts of interest policies, including:
• Directly or indirectly offering bribes to government officials;
• Commercial bribery;
• Requesting, accepting or approving illegally-obtained money, securities or other material property from third parties;
• Illegal abuse of authority for personal or third-party gains and purposes contrary to SIBUR’s interests.
SIBUR’s key anti-corruption and compliance activities in 2017 included the following:
• Conducted trainings for all employees on ethical behavior
• Updated guidelines on compliance management
• Updated by-law on Ethics and Compliance Committee
• Developed educational videos, updated the intranet site page and published articles dedicated to compliance issues in our in-house corporate magazine
• Conducted Anti-corruption day dedicated to compliance standards at SIBUR
To prevent the taking and receiving of bribes, SIBUR issued employee guidelines on gift-giving.

103
HOW
WE
SUST
AIN
VAL
UE
SIBURAnnual Review 2017
INTRODUCTION VALUE CREATION DRIVERS HOW WE CREATE VALUE HOW WE SUSTAIN VALUE FINANCIAL INFORMATION ADDITIONAL INFO
https://www.sibur.ru/en/
The Ethics and Compliance Committee established by the Company’s management is comprised of the heads of the Security, Legal Services, Corporate Secretary & Administrative Services, and Human Resources Departments. The Committee’s key objective is to coordinate activities among SIBUR’s subsidiaries and ensure compliance with regulatory requirements, ethical business behavior, prevention of corrupt practices and violations, and resolution of conflicts of interest.
Ethics and Compliance Commissions at SIBUR’s production sites are headed by the sites’ General Directors, whose authority includes investigating conflicts of interest, evaluation of identified conflicts, and developing processes to mitigate conditions that may lead to conflicts of interest among employees.
According to SIBUR’s conflicts of interests policies, all employees are required to report any existing or potential conflicts of interest. A confidential hot line [email protected] was set up to report abuses.
All situations that may signal a conflict of interests are investigated by the Ethics and Compliance Committee and Commissions at production sites. In 2017, these bodies held 62 meetings in total, and investigated 73 potential conflicts of interests, out of which 54 were treated as material conflicts and each was separately evaluated and followed up with subsequent corrective actions.
SIBUR’s anti-corruption and compliance strategy and policies are designed to mitigate the risk of Company management and employee involvement in corrupt activities irrespective of their position, and minimise negative consequences for the Company resulting from employee conflicts of interest.
Direct subordination to close relatives
SIBUR employees’ associated persons seeking for positions
Plundering and fraud
Associated persons working for SIBUR’s counterpartiesImplementation of control function over associated persons
Violation of tendering procedures
Code of Corporate Ethics misconduct
ISSUES CONSIDERED BY THE AUDIT COMMITTEE MEETINGS IN 2017
4%4%
3 %
7 %
5 %30 %
1%

104
HOW
WE
SUST
AIN
VAL
UE
SIBUR Annual Review 2017
INTRODUCTION VALUE CREATION DRIVERS HOW WE CREATE VALUE HOW WE SUSTAIN VALUE FINANCIAL INFORMATION ADDITIONAL INFO
https://www.sibur.ru/en/
The share capital of PJSC SIBUR Holding amounts to RR 21,784,791,000. As of 31 December 2017, the share capital consisted of 2,178,479,100 ordinary shares with a par value of RR 10 each.
Share Capital
The Company annually hires an external auditor to perform an independent and unbiased assessment of the quality of its Russian Accounting Standards (RAS) and International Financial Reporting Standards (IFRS) financial statements.
External auditors are hired based on tenders providing an objective selection. The Company’s auditor is approved by the General Meeting of Shareholders based on a proposal from the Board of Directors. A preliminary assessment of auditor candidates is conducted by the Audit Committee. PricewaterhouseCoopers Audit JSC (PwC) was re-elected as the
The state registration number is 1-02-65134-D, with a registration date of 31 May 2012.
The number of authorised shares amount to 9,653,045,500 ordinary shares and 2,500,000,000 preferred shares with a par value of RR 10 each. No preferred shares have been issued.
Company’s auditor at the General Meeting of Shareholders in March 2017.
The fees for the audit according to RAS and IFRS of the SIBUR Holding PJSC financial statements for 2017, including review of interim semi-annual financial information, comprised RUB 41,840,000 (excluding VAT).
External Auditor
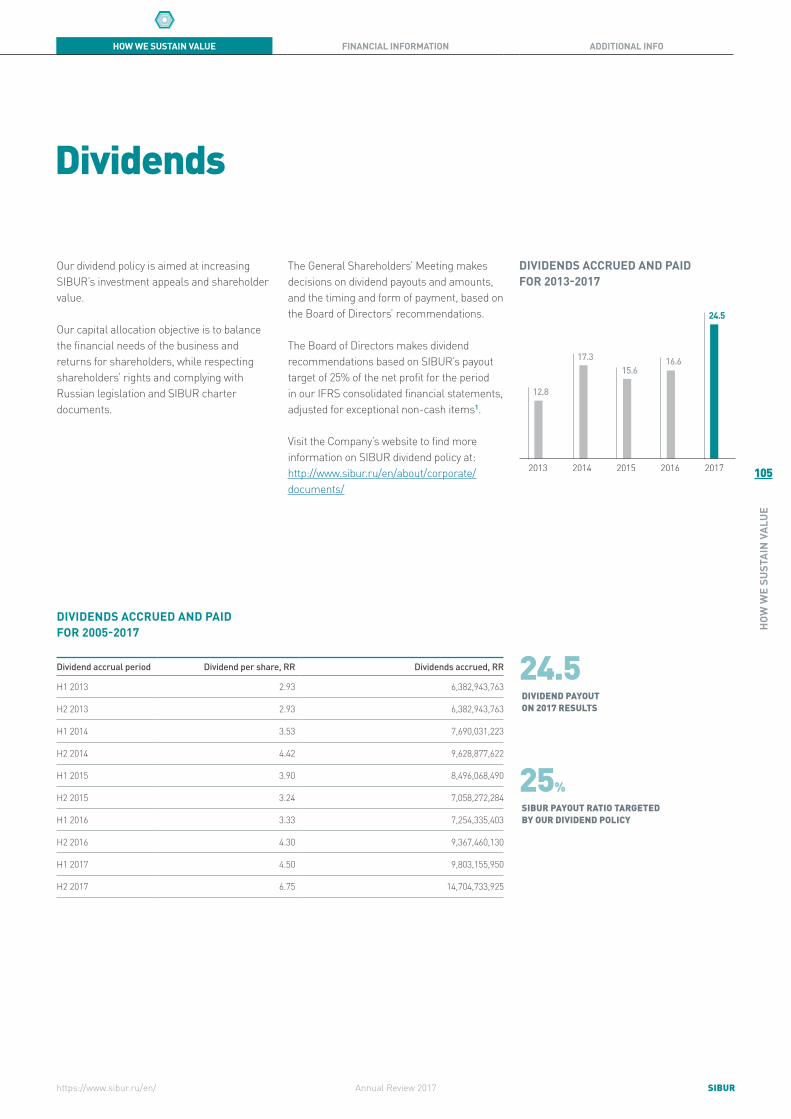
105
HOW
WE
SUST
AIN
VAL
UE
SIBURAnnual Review 2017
INTRODUCTION VALUE CREATION DRIVERS HOW WE CREATE VALUE HOW WE SUSTAIN VALUE FINANCIAL INFORMATION ADDITIONAL INFO
https://www.sibur.ru/en/
Our dividend policy is aimed at increasing SIBUR’s investment appeals and shareholder value.
Our capital allocation objective is to balance the financial needs of the business and returns for shareholders, while respecting shareholders’ rights and complying with Russian legislation and SIBUR charter documents.
DIVIDENDS ACCRUED AND PAID FOR 2005-2017
Dividend accrual period Dividend per share, RR Dividends accrued, RR
H1 2013 2.93 6,382,943,763
H2 2013 2.93 6,382,943,763
H1 2014 3.53 7,690,031,223
H2 2014 4.42 9,628,877,622
H1 2015 3.90 8,496,068,490
H2 2015 3.24 7,058,272,284
H1 2016 3.33 7,254,335,403
H2 2016 4.30 9,367,460,130
H1 2017 4.50 9,803,155,950
H2 2017 6.75 14,704,733,925
Dividends
The General Shareholders’ Meeting makes decisions on dividend payouts and amounts, and the timing and form of payment, based on the Board of Directors’ recommendations.
The Board of Directors makes dividend recommendations based on SIBUR’s payout target of 25% of the net profit for the period in our IFRS consolidated financial statements, adjusted for exceptional non-cash items1.
Visit the Company’s website to find more information on SIBUR dividend policy at: http://www.sibur.ru/en/about/corporate/documents/
25%SIBUR PAYOUT RATIO TARGETED BY OUR DIVIDEND POLICY
24.5DIVIDEND PAYOUT ON 2017 RESULTS
12.8
17.315.6
16.6
24.5
20172016201520142013
DIVIDENDS ACCRUED AND PAID FOR 2013-2017
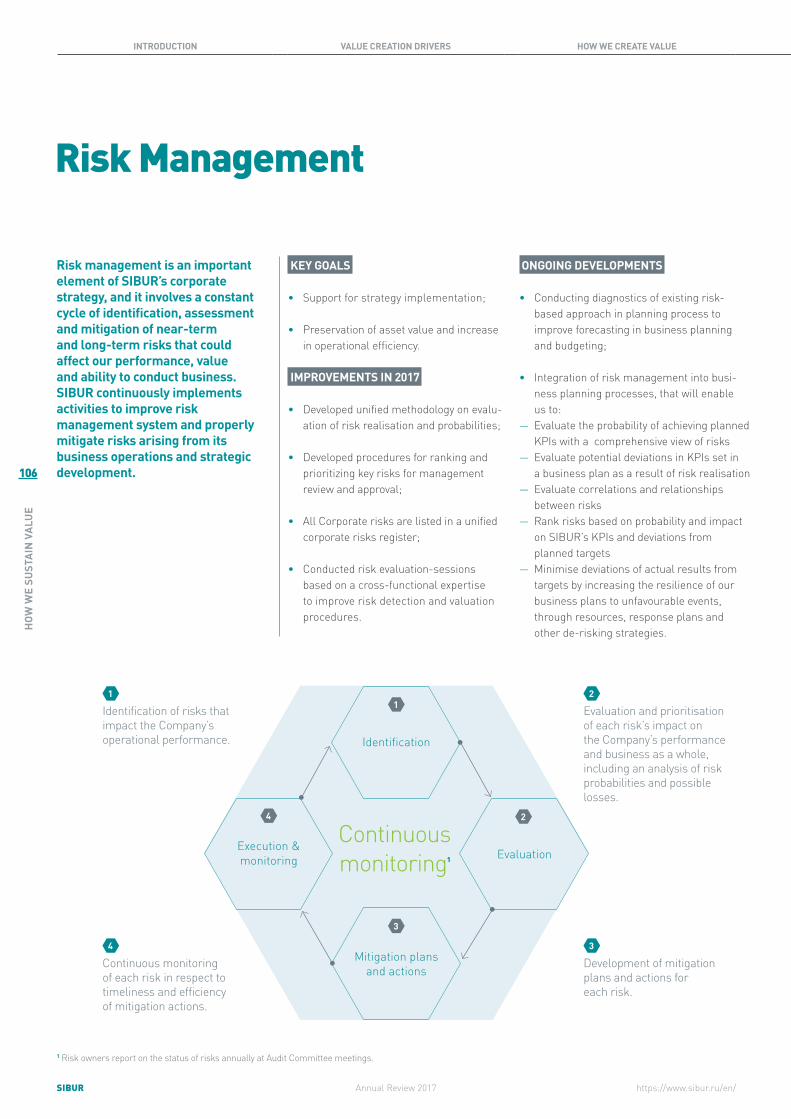
106
HOW
WE
SUST
AIN
VAL
UE
SIBUR Annual Review 2017
INTRODUCTION VALUE CREATION DRIVERS HOW WE CREATE VALUE HOW WE SUSTAIN VALUE FINANCIAL INFORMATION ADDITIONAL INFO
https://www.sibur.ru/en/
Evaluation
Identification
Mitigation plans and actions
Execution & monitoring
Continuous monitoring1
1
24
3
Risk management is an important element of SIBUR’s corporate strategy, and it involves a constant cycle of identification, assessment and mitigation of near-term and long-term risks that could affect our performance, value and ability to conduct business. SIBUR continuously implements activities to improve risk management system and properly mitigate risks arising from its business operations and strategic development.
Risk Management
KEY GOALS
• Support for strategy implementation;
• Preservation of asset value and increase in operational efficiency.
IMPROVEMENTS IN 2017
• Developed unified methodology on evalu-ation of risk realisation and probabilities;
• Developed procedures for ranking and prioritizing key risks for management review and approval;
• All Corporate risks are listed in a unified corporate risks register;
• Conducted risk evaluation-sessions based on a cross-functional expertise to improve risk detection and valuation procedures.
ONGOING DEVELOPMENTS
• Conducting diagnostics of existing risk-based approach in planning process to improve forecasting in business planning and budgeting;
• Integration of risk management into busi-ness planning processes, that will enable us to:
― Evaluate the probability of achieving planned KPIs with a comprehensive view of risks
― Evaluate potential deviations in KPIs set in a business plan as a result of risk realisation
― Evaluate correlations and relationships between risks
― Rank risks based on probability and impact on SIBUR’s KPIs and deviations from planned targets
― Minimise deviations of actual results from targets by increasing the resilience of our business plans to unfavourable events, through resources, response plans and other de-risking strategies.
1 Risk owners report on the status of risks annually at Audit Committee meetings.
1 Identification of risks that impact the Company’s operational performance.
4 Continuous monitoring of each risk in respect to timeliness and efficiency of mitigation actions.
3 Development of mitigation plans and actions for each risk.
2 Evaluation and prioritisation of each risk’s impact on the Company’s performance and business as a whole, including an analysis of risk probabilities and possible losses.
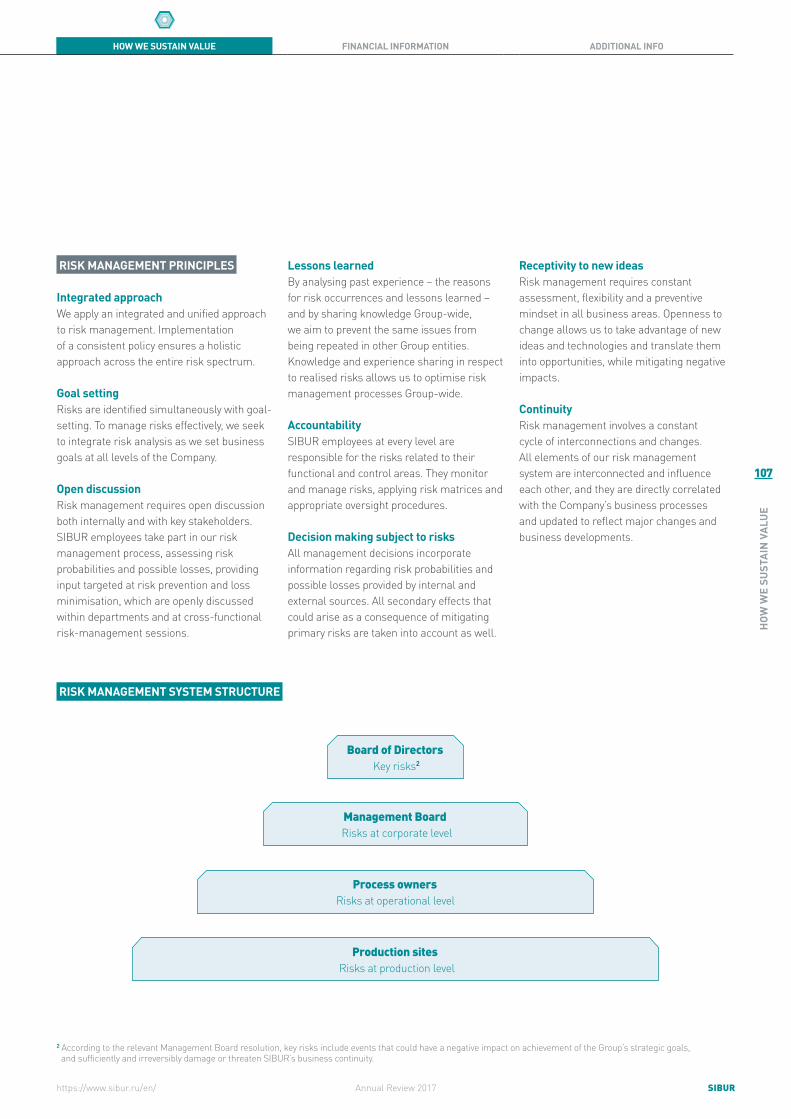
107
HOW
WE
SUST
AIN
VAL
UE
SIBURAnnual Review 2017
INTRODUCTION VALUE CREATION DRIVERS HOW WE CREATE VALUE HOW WE SUSTAIN VALUE FINANCIAL INFORMATION ADDITIONAL INFO
https://www.sibur.ru/en/
Board of Directors Key risks2
Management Board Risks at corporate level
Process owners Risks at operational level
Production sites Risks at production level
Risk Management
RISK MANAGEMENT PRINCIPLES
Integrated approachWe apply an integrated and unified approach to risk management. Implementation of a consistent policy ensures a holistic approach across the entire risk spectrum.
Goal setting Risks are identified simultaneously with goal-setting. To manage risks effectively, we seek to integrate risk analysis as we set business goals at all levels of the Company.
Open discussion Risk management requires open discussion both internally and with key stakeholders. SIBUR employees take part in our risk management process, assessing risk probabilities and possible losses, providing input targeted at risk prevention and loss minimisation, which are openly discussed within departments and at cross-functional risk-management sessions.
Lessons learned By analysing past experience – the reasons for risk occurrences and lessons learned – and by sharing knowledge Group-wide, we aim to prevent the same issues from being repeated in other Group entities. Knowledge and experience sharing in respect to realised risks allows us to optimise risk management processes Group-wide.
Accountability SIBUR employees at every level are responsible for the risks related to their functional and control areas. They monitor and manage risks, applying risk matrices and appropriate oversight procedures.
Decision making subject to risks All management decisions incorporate information regarding risk probabilities and possible losses provided by internal and external sources. All secondary effects that could arise as a consequence of mitigating primary risks are taken into account as well.
Receptivity to new ideas Risk management requires constant assessment, flexibility and a preventive mindset in all business areas. Openness to change allows us to take advantage of new ideas and technologies and translate them into opportunities, while mitigating negative impacts.
Continuity Risk management involves a constant cycle of interconnections and changes. All elements of our risk management system are interconnected and influence each other, and they are directly correlated with the Company’s business processes and updated to reflect major changes and business developments.
2 According to the relevant Management Board resolution, key risks include events that could have a negative impact on achievement of the Group’s strategic goals, and sufficiently and irreversibly damage or threaten SIBUR’s business continuity.
RISK MANAGEMENT SYSTEM STRUCTURE

108
HOW
WE
SUST
AIN
VAL
UE
SIBUR Annual Review 2017
INTRODUCTION VALUE CREATION DRIVERS HOW WE CREATE VALUE HOW WE SUSTAIN VALUE FINANCIAL INFORMATION ADDITIONAL INFO
https://www.sibur.ru/en/
1 According to the relevant Management Board resolution, key risks include events that could have a negative impact on achievement of the Group’s strategic goals, and sufficiently and irreversibly damage or threaten SIBUR’s business continuity.
2 The list of risks presented herein is not exhaustive and only reflects SIBUR’s opinion and estimates. This section does not include any analysis of general economic and social risks, such as slowdowns in economic growth or decreases in consumer purchasing power, among others.
Risk Management (continued)
SIBUR applies its risk-based approach in decision-making process and management of operations. Risks are considered an inherent part of operating the business, and risk management is built into each employee’s responsibilities. Regular monitoring and evaluation is conducted in relation to the identified risks, while the Company plans and monitors the implementation of specific actions aimed at risk prevention and mitigation.
Key risks1 and related response strategies are reviewed by the Management Board, discussed at meetings of the Company’s Audit Committee and are approved by the Board of Directors as a part of annual and long-term business plans and progress
reports on business plan implementation. Regular updates to the list of key risks help to guide Management and employee efforts to manage the most significant risks that could impact the Company’s operations.
The current list2 of key risks was approved in March 2016 and subsequently revised. Due to the economic and political volatility in Russia and worldwide, macroeconomic, country and regulatory risks remained the focus of management attention. Operational and feedstock undersupply risks also remained among the key factors to strengthen the Company’s focus
KEY RISKS
on business continuity and efficiency improvements at existing production sites. Market risk remains a key focus of management attention due to increasing competition on in our main markets, while we monitor logistical risks for potential increases in transportation costs.
Continued economic and political volatility could have a significant impact on the Company’s ability to implement its long-term investing activities. For this reason, risks to the Company’s long-term financial sustainability and potential non-performance of investment projects remain key focus areas for senior management.
MACROECONOMIC RISK LOGISTICAL RISK RISK OF FEEDSTOCK UNDERSUPPLY
REGULATORY RISK INDUSTRIAL ACCIDENT RISK IT SYSTEMS RISK
COUNTRY RISK MARKET RISK OPERATIONAL RISK
OPERATING ACTIVITY
RISK OF INVESTMENT PROJECT NON-PERFORMANCE
INVESTING ACTIVITY
RISKS TO THE COMPANY’S LONG-RUN FINANCIAL SUSTAINABILITY
FINANCING ACTIVITY
109
HOW
WE
SUST
AIN
VAL
UE
SIBURAnnual Review 2017
INTRODUCTION VALUE CREATION DRIVERS HOW WE CREATE VALUE HOW WE SUSTAIN VALUE FINANCIAL INFORMATION ADDITIONAL INFO
https://www.sibur.ru/en/
OPERATING ACTIVITY
COUNTRY RISK
Description The risk is related to political conditions in Russia and regions where the Company operates. The risk is associated with the political crisis in some countries, i.e. in Ukraine, and the possibility of further sanctions imposed by the United States and the European Union (i.e. a ban on supplies of equipment, technologies, goods and services could be an example of risk implementation).
Risk mitigation actions To reduce the risk, SIBUR diversifies its geographic mix of customers and suppliers, reduces activity in regions with uncertain economic environments, and develops alternative transportation routes.
MACROECONOMIC RISK Risks in the macroeconomic environment increase the potential for economic volatility in Russia and other regions where the Company operates. These risk factors include declining oil prices, currency volatility, interest rate fluctuations and inflation.
INFLATION RISK
Description Higher inflation may lead to financial losses stemming from higher operating costs, a decrease in the purchase power of available funds and the value of receivables when substantial delays in repayment take place.
Risk mitigation actions The Group continuously takes measures to optimise its receivables and cost structure through the development of cost management programmes and improvement in current assets turnover.
CURRENCY RISK
Description The Group’s operational and financial results, liquidity, sources of financing, are affected by changes in currency exchange rates. Movements of the Russian rouble against the US dollar and the euro result in a revaluation of our liabilities denominated in these currencies. When the Russian rouble depreciates against the US dollar or the euro, our liabilities denominated in these currencies increase in Russian rouble terms, as do interest costs on SIBUR’s foreign currency denominated borrowings.
Risk mitigation actions To minimise the effect of foreign exchange rate fluctuations on our foreign currency-denominated borrowings, SIBUR aims to match the currency split of its liabilities with the currency structure of the Company’s revenues. SIBUR uses derivative instruments to hedge foreign exchange rate fluctuations impact on borrowings.
INTEREST RATE RISK
Description The Group’s interest rate risk arises primarily from long-term borrowings with floating interest rates. An increase in interest rates results in higher interest expense on borrowings, decreasing the Company’s financial results.
Risk mitigation actions SIBUR analyses its interest rate exposure on a regular basis. Financing decisions are made after careful consideration of various scenarios and may include alternative financing at fixed interest rates.
REGULATORY RISK
Description Substantive changes to the legal or regulatory framework may have a negative effect on the Group’s business and operations through stronger antitrust regulation and foreign exchange, tax, customs or licensing controls. SIBUR faces particular risks with respect to regulatory increases in energy or transportation tariffs, export duties on energy products, import duties on production equipment, tighter foreign trade regulations imposed by other countries, as well as larger tax burdens or changes in judicial practices in relation to Company’s legal disputes.
Risk mitigation actions SIBUR maintains an information management system that monitors and analyses the Company’s counterparties, the regulatory environment and government initiatives, to enable the Group to react in a timely manner to relevant legislative and regulatory changes. SIBUR also plays an active role in discussions and the development of draft legislation, and conducts trainings of personnel on legislative matters.
MARKET RISK
Description SIBUR’s business and operational results may be negatively affected by lower demand or reduced prices for its products, changes in consumers’ requirements, higher competition as well as market share losses in its key markets. These factors may negatively affect the Company’s operational and financial results.

110
HOW
WE
SUST
AIN
VAL
UE
SIBUR Annual Review 2017
INTRODUCTION VALUE CREATION DRIVERS HOW WE CREATE VALUE HOW WE SUSTAIN VALUE FINANCIAL INFORMATION ADDITIONAL INFO
https://www.sibur.ru/en/
Risk Management (continued)
MARKET RISK (CONTINUED)
Risk mitigation actions To manage market risks, SIBUR focuses on the following key areas:
• monitoring and analysis of existing markets;
• segmental diversification;• developing the product portfolio;• diversification of sales geographies;• concluding long-term agreements with
both suppliers and customers;• meeting our customers’ expectations
through execution and fulfillment of specifications for product quality, trans-portation, packaging;
• developing sales channels for customers in end markets;
• conducting pre-marketing activities.
LOGISTICAL RISK
Description SIBUR may face an increase in logistics costs, delays in the supply of feedstock and finished products, changes in quality of products when delivering its products to customers.
Limitations of the transportation infrastructure, logistical bottlenecks and damage to products during shipment could negatively affect SIBUR’s ability to meet its contractual obligations related to delivery of intermediate or finished goods to customers and lead to a loss of revenue and increased logistics costs.
Risk mitigation actions SIBUR develops alternative transportation routes, implements measures for the creation and/or development of infrastructure facilities, and develops long-term logistical solutions in cooperation with the Russian Government and SIBUR’s logistics partners, including Russian Railways (RZD).
INDUSTRIAL ACCIDENT RISK
Description SIBUR’s operational activity may be affected by accidents at the Group’s production sites. Loss of containment and other factors may lead to fires, explosions, emission of explosive and toxic fumes and other hazardous conditions that could cause personnel injuries or death, property damage, environmental damage or interruption of operations, as well as costs for elimination of these damages.
Risk mitigation actions SIBUR takes active steps to minimise the potential impact of such risks. These include continuous monitoring of assets to prevent emergencies and accidents; promotion of an industrial safety culture among employees and continuous training of personnel; and ensuring appropriate insurance coverage is in place.
OPERATIONAL RISK
Description SIBUR’s production may be negatively affected by unscheduled shutdowns and failures in equipment at SIBUR’s production sites and those of its counterparties. Such factors as obsolescence of certain equipment, control systems failure, human error, energy supply failures and other factors may result in a decrease in output and losses from equipment downtime, as well as additional maintenance costs.
Risk mitigation actions To reduce operational risk, SIBUR conducts modernisation and reconstruction work on processing units, and continuously monitors their condition. SIBUR introduces advanced technologies and asset maintenance methods; provides trainings to improve technical skills of employees; conducts activities aimed at mitigating downtime losses and ensures appropriate insurance coverage is in place, both for property damage and potential disruptions of operations.
RISK OF FEEDSTOCK UNDERSUPPLY
Description The lack of sufficient feedstock volumes or of certain raw materials may result in increased competition among producers for the feedstock base as well as a decline in quality and quantity of supplied feedstock.
Risk mitigation actions SIBUR manages risk through a number of key measures:
• SIBUR’s production facilities are located in close proximity to the feedstock base;
• SIBUR implements projects to increase liquids recovery ratio at our GPPs;
• SIBUR has long-term contracts with oil and gas companies for feedstock supplies;
• SIBUR invests in the feedstock process-ing and transportation infrastructure to consolidate feedstock flows and cement its access to the resource base;
• SIBUR strives to diversify its supplier base where possible.
IT SYSTEMS RISK
Description SIBUR’s business and operations may be negatively affected by failures of the Group’s IT systems and equipment, unauthorised access to confidential information, and distortion of information during data transfers that may cause disruptions in the Group’s decision-making process. In particular, the risk relates to potential negative consequences that could arise in the process of integrating IT systems on production sites within the Group. These factors may result in lower operating efficiency and affect SIBUR’s operational and financial reporting.
Risk mitigation actions To minimise IT-related risks, SIBUR has implemented and continues to develop back-up and information protection systems.

111
HOW
WE
SUST
AIN
VAL
UE
SIBURAnnual Review 2017
INTRODUCTION VALUE CREATION DRIVERS HOW WE CREATE VALUE HOW WE SUSTAIN VALUE FINANCIAL INFORMATION ADDITIONAL INFO
https://www.sibur.ru/en/
INVESTING ACTIVITY
RISK OF INVESTMENT PROJECT NON-PERFORMANCE
Description The risk covers the negative potential impacts on the timing, quality and costs of SIBUR’s investment projects. SIBUR’s strategic objectives include implementation of largescale investment projects and modernisation of the Group’s production facilities and infrastructure. Non-conforming procurements and shortages of skilled workers could result in delays to the completion of these projects and cause actual costs to exceed planned levels, negatively affecting our future operational performance.
Risk mitigation actions SIBUR actively develops mechanisms to make the contractor selection process more efficient, and the Group is also strengthening its in-house technical supervision capabilities to ensure appropriate design and construction quality, while implementing efficient business processes and controls to manage counterparties and contractors.
FINANCING ACTIVITY
RISK TO THE COMPANY’S LONG-RUN FINANCIAL SUSTAINABILITY
Description The risk relates to the Company’s inability to meet its obligations in relation to investment and operating activities due to insufficient liquidity.
Risk mitigation actions The Company undertakes five-year, annual, quarterly and monthly cash flow planning, monitors investment programmes, manages accounts receivable, and also analyses the impact of macroeconomic and political factors on the Company’s operations.
INSURANCE
To mitigate operational risks, SIBUR maintains insurance coverage that meets global standards and best practices. Insurance policies are underwritten by reputable Russian insurance companies, with partial placement of risks on international insurance and reinsurance markets.
All of the Group’s production facilities are covered under comprehensive property damage insurance programmes (PD). PD insurance is maintained for full replacement value based on an independent valuation. An independent surveyor identifies risks at each production facility. Based on the surveyor’s reports, estimated maximum losses are determined, and the Group then implements and monitors compliance with the surveyor’s recommendations.
For the facilities where accidents could incur the largest financial impact and replacement costs, the Group maintains insurance coverage against property damage and business interruption (PD / BI).
The Group also maintains liability insurance for harm to the life, health, or property of third parties. This liability policy is supplemental to the compulsory insurance of hazardous production facilities, to provide efficient coverage against possible third-party claims resulting from accidents and risk occurrences at the Group’s production sites.
The Group also maintains directors and officers liability insurance (D&O) that protects the Group and its directors and officers against possible third-party lawsuits that may arise from unintentional and/or erroneous actions.
To protect its trading operations and risks to product supplies on extended payment terms, the Group maintains comprehensive cargo and credit insurance programmes.
Additionally, the Group maintains insurance coverage for construction risks at its major investment projects, including risks related to construction, third-party liabilities, cargo transportation and financial losses resulting from delays in commissioning of new facilities due to material damage or destruction of insured objects.
The Group regularly reviews the terms of its insurance coverage and relationships with reinsurance market players. Reinsurance is provided by major reinsurance companies with a credit rating of “A-” or better on the S&P Global Ratings’ financial strength rating scale.
The Group believes that insurance coverage is only one of the risk mitigation actions it must take as part of a comprehensive risk mitigation approach, and works to implement other measures to decrease its maximum cumulative risk.

112
ADDI
TION
AL IN
FO
SIBUR Annual Review 2017
INTRODUCTION VALUE CREATION DRIVERS HOW WE CREATE VALUE HOW WE SUSTAIN VALUE FINANCIAL INFORMATION ADDITIONAL INFO
https://www.sibur.ru/en/
Abbreviations And Units
ABBREVIATIONS
APG Associated petroleum gas
BDF Butylene-divinyl fraction
BIF Butylene-isobutylene fraction
BOPP-films Biaxially oriented polypropylene films
BR Polybutadiene rubber
CBR Central Bank of Russia
CIS Commonwealth of Independent States
COO Chief Operating Officer
DMD Dimethyl dioxane
ECA Export credit agency
ECHA European Chemicals Agency
EIS Environmental Impact Index
EP Engineering and procurement
EPC Engineering, procurement and construction
EPS Expandable polystyrene
ESBR Emulsion styrene-butadiene rubber
FAS Federal Antimonopoly Service
FEED Front-end engineering and design
FMCG Fast moving consumer goods
GCC Gas chemical complex
GCP Gas condensate plant
GDP Gross domestic product
GFU Gas fractionation unit
GPP Gas processing plant
HDPE High-density polyethylene
HPP Heating and Power Plant
HSE Health, Safety and Environment
IFRS International Financial Reporting Standards
IHS Independent industry and research consulting firm (Information Handling Services)
IIF Isobutane-isobutylene fraction
IIR Butyl rubber
IMS Integrated management system
IR Polyisoprene rubber
ISO International Organisation for Standardisation
JV Joint venture
KPI Key performance indicator
LDPE Low-density polyethylene
LLDPE Linear low-density polyethylene
LPG Liquefied petroleum gas
LTIF Lost Time Injury Frequency

113
ADDI
TION
AL IN
FO
SIBURAnnual Review 2017
INTRODUCTION VALUE CREATION DRIVERS HOW WE CREATE VALUE HOW WE SUSTAIN VALUE FINANCIAL INFORMATION ADDITIONAL INFO
https://www.sibur.ru/en/
MEG Monoethylene glycol
MGC Medium gas carrier
MTBE Methyl tertiary butyl ether
NBR Nitrile-butadiene rubber
nd-PBR Polybutadiene rubber (Neodymium based)
NGLs Natural gas liquids
NGO Non-governmental organization
OHSAS Occupational Health and Safety Assessment Series
PDH facility Propane dehydrogenation facility
PE Polyethylene
PET Polyethylene terephthalate
PP Polypropylene
PSS Production System of SIBUR
PVC Polyvinyl chloride
R&D Research and Development
RAS Russian Accounting Standards
Raw NGL Raw natural gas liquid
RDIF Russian direct investment fund
REACH Registration, Evaluation and Authorization of Chemicals
SBS Styrene- butadiene- styrene thermoplastic elastomers
SRF Silk Road Fund
SSBR Solution styrene-butadiene rubber
TPA Terephthalic acid
UGSS Unified Gas Supply System
VAT Value added tax
UNITS
barrel One stock tank barrel, or 42 US gallons of liquid volume
bbl Barrel(s)
bcm Billion cubic metres
bcmpa Billion cubic metres per annum
EUR Euro
Gcal Gigacalories
km Kilometres
kW/h Kilowatt-hour
mt Million tonnes
mtpa Million tonnes per annum
MW Megawatt
RR Russian rouble
USD United States dollar
114
ADDI
TION
AL IN
FO
SIBUR Annual Review 2017
INTRODUCTION VALUE CREATION DRIVERS HOW WE CREATE VALUE HOW WE SUSTAIN VALUE FINANCIAL INFORMATION ADDITIONAL INFO
https://www.sibur.ru/en/
Nameplate Capacity and Production Capacity Utilisation Rates
Disclaimer
The nameplate capacity of our production sites is the capacity registered with the Federal Service for Environmental, Technological and Nuclear Supervision (“Rostekhnadzor”). It is defined as the volume of products that could be produced by a plant or a unit if it operates a certain number of hours per annum, usually less than the number of hours in a calendar year. As such, the nameplate capacity implicitly assumes scheduled shutdowns, but it does not take into account possible cyclicality of scheduled shutdowns (for example, two year maintenance cycle adopted at some of SIBUR’s facilities).
The nameplate capacity also does not take into account quality, grade and other characteristics of the products produced. For our petrochemical facilities we provide
capacity for each product group separately, since certain petrochemicals are used for production of other products.
Capacity utilisation is calculated as total production as a percentage of the weighted average capacity during the year. Weighted average capacity during the year may differ from nameplate capacity as of the year-end, if the capacity was expanded or the asset was consolidated during the respective period. We seek to operate our production facilities at optimal levels of capacity utilisation, taking into consideration prevailing general economic conditions, availability of feedstock, demand for our products and other factors. Capacity utilization below 100% at GPPs is driven primarily by availability of feedstock at a particular location. Capacity utilization below 100% at other production facilities
The information contained herein pertaining to SIBUR (the “Group”) has been provided by the Company solely for information purposes. By reading this Annual Review, you agree to be bound by the limitations set out below.
The material contained in this Annual Review is presented solely for information purposes and is not to be construed as providing investment advice. As such, it has no regard to the specific investment objectives, financial situation or particular needs of any recipient. It should not be regarded by recipients as a substitute for the exercise of their own judgment.
There may be material variances between estimated data set forth in this Annual Review and actual results, and between the data set forth in this Annual Review and corresponding data previously published by or on behalf of the Company.
is driven more by a combination of market demand for each particular product and our decision and ability to switch the production between different types of products.
In addition, capacity utilisation levels below 100% may reflect lost days of production due to unscheduled shutdowns at our own facilities as well as at facilities of our suppliers or customers. Capacity utilisation exceeds 100% when we are able to run a facility more efficiently over time, upgrading the technology and implementing various debottlenecking measures. As the nameplate capacity includes scheduled shutdowns, the capacity utilisation at a particular facility may exceed 100% during those periods in which the frequency and duration of shutdowns is less than scheduled.
This Annual Review contains forward-looking statements, including (without limitation) statements, based on the current expectations and projections of the Company about future events and are subject to change without notice. All statements, other than statements of historical fact, contained herein are forward-looking statements.
Forward-looking statements are subject to inherent risks and uncertainties, such that future events and actual results may differ materially from those set forth in, contemplated by or underlying such forward-looking statements. The Company may not actually achieve or realise its plans, intentions or expectations.
There can be no assurance that the Company’s actual results will not differ materially from the expectations set forth in such forward-looking statements.
Factors that could cause actual results to differ from such expectations include, but are not limited to, the state of the global economy, the ability of the petrochemical sector to maintain levels of growth and development, risks related to petrochemical prices and regional political and security concerns. The above is not an exhaustive list of the factors that could cause actual results to differ materially from the expectations set forth in such forward-looking statements. The Company and its Affiliates are under no obligation to update the information, opinions or forward- looking statements in this Annual Review.

115
ADDI
TION
AL IN
FO
SIBURAnnual Review 2017
INTRODUCTION VALUE CREATION DRIVERS HOW WE CREATE VALUE HOW WE SUSTAIN VALUE FINANCIAL INFORMATION ADDITIONAL INFO
https://www.sibur.ru/en/
Contact Information
LEGAL OFFICE
Building 30, No. 6, Quarter 1, Vostochniy Industrial District, Tobolsk, Tyumen Region, 626150
Tel./Fax: +7 (3456) 266 686
HEAD OFFICE
16/1 Krzhizhanovskogo St., Moscow, GSP-7, 117997
Tel./Fax: +7 (495) 777 5500
MEDIA CENTER
International Media Relations
Tel.: + 7 (495) 937 1726E-mail: [email protected]
INVESTOR RELATIONS
Olga KostyurinaHead of IRTel.: +7 (495) 777 5500 (*34-99)
Daria BelovaIR managerTel.: +7 (495) 777 5500 (*67-48)
Anastasiia LevinaIR managerTel.: +7 (495) 777 5500 (*61-39)
E-mail: [email protected]
WEBSITE
http://www.sibur.ru/(Russian version)
http://www.sibur.ru/en/(English version)
Related Documents


