*For correspondence: [email protected] Competing interests: The authors declare that no competing interests exist. Funding: See page 26 Received: 03 January 2018 Accepted: 26 April 2018 Published: 08 May 2018 Reviewing editor: Daeyeol Lee, Yale School of Medicine, United States Copyright Norbury et al. This article is distributed under the terms of the Creative Commons Attribution License, which permits unrestricted use and redistribution provided that the original author and source are credited. Value generalization in human avoidance learning Agnes Norbury 1 *, Trevor W Robbins 2,3 , Ben Seymour 1,4 1 Computational and Biological Learning Laboratory, Department of Engineering, University of Cambridge, Cambridge, United Kingdom; 2 Department of Psychology, University of Cambridge, Cambridge, United Kingdom; 3 Behavioural and Clinical Neuroscience Institute, University of Cambridge, Cambridge, United Kingdom; 4 Center for Information and Neural Networks, National Institute of Information and Communications Technology, Suita City, Japan Abstract Generalization during aversive decision-making allows us to avoid a broad range of potential threats following experience with a limited set of exemplars. However, over- generalization, resulting in excessive and inappropriate avoidance, has been implicated in a variety of psychological disorders. Here, we use reinforcement learning modelling to dissect out different contributions to the generalization of instrumental avoidance in two groups of human volunteers (N = 26, N = 482). We found that generalization of avoidance could be parsed into perceptual and value-based processes, and further, that value-based generalization could be subdivided into that relating to aversive and neutral feedback with corresponding circuits including primary sensory cortex, anterior insula, amygdala and ventromedial prefrontal cortex. Further, generalization from aversive, but not neutral, feedback was associated with self-reported anxiety and intrusive thoughts. These results reveal a set of distinct mechanisms that mediate generalization in avoidance learning, and show how specific individual differences within them can yield anxiety. DOI: https://doi.org/10.7554/eLife.34779.001 Introduction During aversive decision-making, generalization allows application of direct experience with a lim- ited subset of dangerous real-world stimuli to a much larger set of potentially related stimuli. For example, if eating a particular foraged fruit has led to food poisoning in the past, it may be adaptive to avoid similar-appearing fruit in the future. As an evolutionarily well-conserved process, generaliza- tion enables safe and efficient navigation of a complex and multidimensional world (Sutton and Barto, 1998; Ghirlanda and Enquist, 2003). However, over-generalization, resulting in inappropri- ate avoidance of safe stimuli, actions or contexts, has been suggested as a possible pathological mechanism in a range of psychological disorders including anxiety, chronic pain, and depression (Duits et al., 2015; Dymond et al., 2015; Vlaeyen and Linton, 2012; Harvie et al., 2017; Pearson et al., 2015). Previous work on aversive generalization has focused on predicting punishments in passive (Pav- lovian) designs. Such studies have revealed evidence of heightened subjective, physiological and neural responses to stimuli that bear perceptual similarity to learned exemplars (Dymond et al., 2015). However, the extent to which these observations extend to a decision-making context that is whether or not to make an avoidance response in the face of certain stimuli, allowing us to exert control over experience of aversive outcomes is unclear. Although Pavlovian processes can influence avoidance learning, the latter involves acquisition of a fundamentally distinct set of values relating to actions themselves. This is a clinically important distinction, as theories of many psycho- logical disorders relate specifically to excessive avoidant behaviour over and above subjective fear Norbury et al. eLife 2018;7:e34779. DOI: https://doi.org/10.7554/eLife.34779 1 of 30 RESEARCH ARTICLE

Welcome message from author
This document is posted to help you gain knowledge. Please leave a comment to let me know what you think about it! Share it to your friends and learn new things together.
Transcript

*For correspondence:
Competing interests: The
authors declare that no
competing interests exist.
Funding: See page 26
Received: 03 January 2018
Accepted: 26 April 2018
Published: 08 May 2018
Reviewing editor: Daeyeol Lee,
Yale School of Medicine, United
States
Copyright Norbury et al. This
article is distributed under the
terms of the Creative Commons
Attribution License, which
permits unrestricted use and
redistribution provided that the
original author and source are
credited.
Value generalization in human avoidancelearningAgnes Norbury1*, Trevor W Robbins2,3, Ben Seymour1,4
1Computational and Biological Learning Laboratory, Department of Engineering,University of Cambridge, Cambridge, United Kingdom; 2Department of Psychology,University of Cambridge, Cambridge, United Kingdom; 3Behavioural and ClinicalNeuroscience Institute, University of Cambridge, Cambridge, United Kingdom;4Center for Information and Neural Networks, National Institute of Information andCommunications Technology, Suita City, Japan
Abstract Generalization during aversive decision-making allows us to avoid a broad range of
potential threats following experience with a limited set of exemplars. However, over-
generalization, resulting in excessive and inappropriate avoidance, has been implicated in a variety
of psychological disorders. Here, we use reinforcement learning modelling to dissect out different
contributions to the generalization of instrumental avoidance in two groups of human volunteers (N
= 26, N = 482). We found that generalization of avoidance could be parsed into perceptual and
value-based processes, and further, that value-based generalization could be subdivided into that
relating to aversive and neutral feedback � with corresponding circuits including primary sensory
cortex, anterior insula, amygdala and ventromedial prefrontal cortex. Further, generalization from
aversive, but not neutral, feedback was associated with self-reported anxiety and intrusive
thoughts. These results reveal a set of distinct mechanisms that mediate generalization in
avoidance learning, and show how specific individual differences within them can yield anxiety.
DOI: https://doi.org/10.7554/eLife.34779.001
IntroductionDuring aversive decision-making, generalization allows application of direct experience with a lim-
ited subset of dangerous real-world stimuli to a much larger set of potentially related stimuli. For
example, if eating a particular foraged fruit has led to food poisoning in the past, it may be adaptive
to avoid similar-appearing fruit in the future. As an evolutionarily well-conserved process, generaliza-
tion enables safe and efficient navigation of a complex and multidimensional world (Sutton and
Barto, 1998; Ghirlanda and Enquist, 2003). However, over-generalization, resulting in inappropri-
ate avoidance of safe stimuli, actions or contexts, has been suggested as a possible pathological
mechanism in a range of psychological disorders including anxiety, chronic pain, and depression
(Duits et al., 2015; Dymond et al., 2015; Vlaeyen and Linton, 2012; Harvie et al., 2017;
Pearson et al., 2015).
Previous work on aversive generalization has focused on predicting punishments in passive (Pav-
lovian) designs. Such studies have revealed evidence of heightened subjective, physiological and
neural responses to stimuli that bear perceptual similarity to learned exemplars (Dymond et al.,
2015). However, the extent to which these observations extend to a decision-making context �
that is whether or not to make an avoidance response in the face of certain stimuli, allowing us to
exert control over experience of aversive outcomes � is unclear. Although Pavlovian processes can
influence avoidance learning, the latter involves acquisition of a fundamentally distinct set of values
relating to actions themselves. This is a clinically important distinction, as theories of many psycho-
logical disorders relate specifically to excessive avoidant behaviour over and above subjective fear
Norbury et al. eLife 2018;7:e34779. DOI: https://doi.org/10.7554/eLife.34779 1 of 30
RESEARCH ARTICLE

(Krypotos et al., 2015) � for example, by reducing opportunities for extinction of inappropriate
fear or allowing unnecessary avoidance to transfer to habit-based control (Arnaudova et al., 2017;
LeDoux et al., 2017; Gillan et al., 2014).
There are a number of potential mechanisms by which avoidance generalization could be imple-
mented by the brain. As emphasised in some accounts, perceptual uncertainty in stimulus identity
alone can effectively yield generalization. Although there is debate about how well discriminative
ability is controlled for in many generalization experiments (Struyf et al., 2015), there is good evi-
dence that experience with aversive outcomes alters the representation of predictive stimuli in pri-
mary sensory cortices (Weinberger, 2007; Sasaki et al., 2010; Wigestrand et al., 2017), and that
this may result in changes to absolute stimulus discriminability (Resnik et al., 2011; Laufer and Paz,
2012; Aizenberg and Geffen, 2013). On the other hand, generalization may also occur at the level
of value representations, by the transfer of acquired value to similar, but discriminable cues during
learning. In the Pavlovian case, several well-established behavioural phenomena implicate value-
related processes at play in generalization across species (Hanson, 1959; Schechtman et al., 2010).
That both perceptual and value processes might operate in parallel may explain why recent neuroim-
aging studies have highlighted different brain areas (e.g. limbic cortex vs primary sensory regions) as
being key to Pavlovian aversive generalization in humans (Onat and Buchel, 2015; Laufer et al.,
2016).
A further important factor in the control of avoidance learning is reinforcement by neutral (or
‘safety’) states, that signal omission of punishment. It is likely that generalization over these states
can also influence behaviour: for example in the Pavlovian case, evidence for this is seen in ‘peak-
shift’ effects, whereby the presence of a perceptually similar safety cue appears to inhibit response
to nearby aversive cues (Hanson, 1959). It is therefore possible that under-generalization of safety
cues, as opposed to over-generalization of aversive cues, might be a contributing factor to suscepti-
bility to disorders such as generalized anxiety in humans (Grupe and Nitschke, 2013).
Here, we address three key questions: first, is there good evidence for generalization in avoid-
ance learning in humans?; second, can we distinguish behavioural and neural components relating to
eLife digest People apply what they have learned from past experiences to similar situations, a
phenomenon known as generalization. For example, if eating a particular food caused illness, a
person will likely avoid foods that look or smell similar in the future. Generalization can be helpful
because it allows people to decide how to act in new situations. But over-generalizing after a bad
experience could lead an individual to fear benign scenarios. This may lead to unnecessary anxiety.
It can also create a negative cycle where people avoid certain situations or objects, which prevents
them from learning that they are safe.
Now, Norbury et al. show what happens in the brain when making decisions that involve
generalization. In the experiments, volunteers were told seeing a particular flower design would lead
to a painful electric shock, unless they pushed a button to ‘avoid’ that image. Individuals completed
this task in a magnetic resonance imaging machine so Norbury et al. could observe their brain
activity while they completed the task. A second group of individuals were asked to complete a
similar task online, but instead of being shocked they lost money if they failed to hit a key when they
saw the ‘dangerous’ flower. The online participants also filled out a survey about their experience of
various psychological symptoms.
Norbury et al. used computer modeling to reconstruct how people decided whether or not to
avoid images that looked similar to the harm-associated images but were in fact safe (did not lead
to pain or losing money). The experiments showed that different parts of the brain were involved in
different parts of the generalization process. Areas of the brain that interpret vision, fear, and safety
played distinct roles. People who generalized more from harmful outcomes were more likely to
report feeling anxious and having intrusive negative thoughts in their everyday lives. A better
understanding of the brain processes that cause these symptoms in different situations might help
scientists develop better treatments for conditions like anxiety in the future.
DOI: https://doi.org/10.7554/eLife.34779.002
Norbury et al. eLife 2018;7:e34779. DOI: https://doi.org/10.7554/eLife.34779 2 of 30
Research article Neuroscience
perceptual, aversive value, and safety value?; and third, which if any component predicts relevant
psychological symptoms? We used a custom-designed perceptual task in conjunction with reinforce-
ment learning modelling to study two groups: a laboratory-based sample (N = 26) who performed a
pain avoidance task with concurrent neuroimaging (fMRI), and a larger cohort of individuals
(N = 482), who performed a monetary loss avoidance task online alongside a battery of question-
naires designed to probe relevant psychological symptom dimensions (Gillan and Daw, 2016).
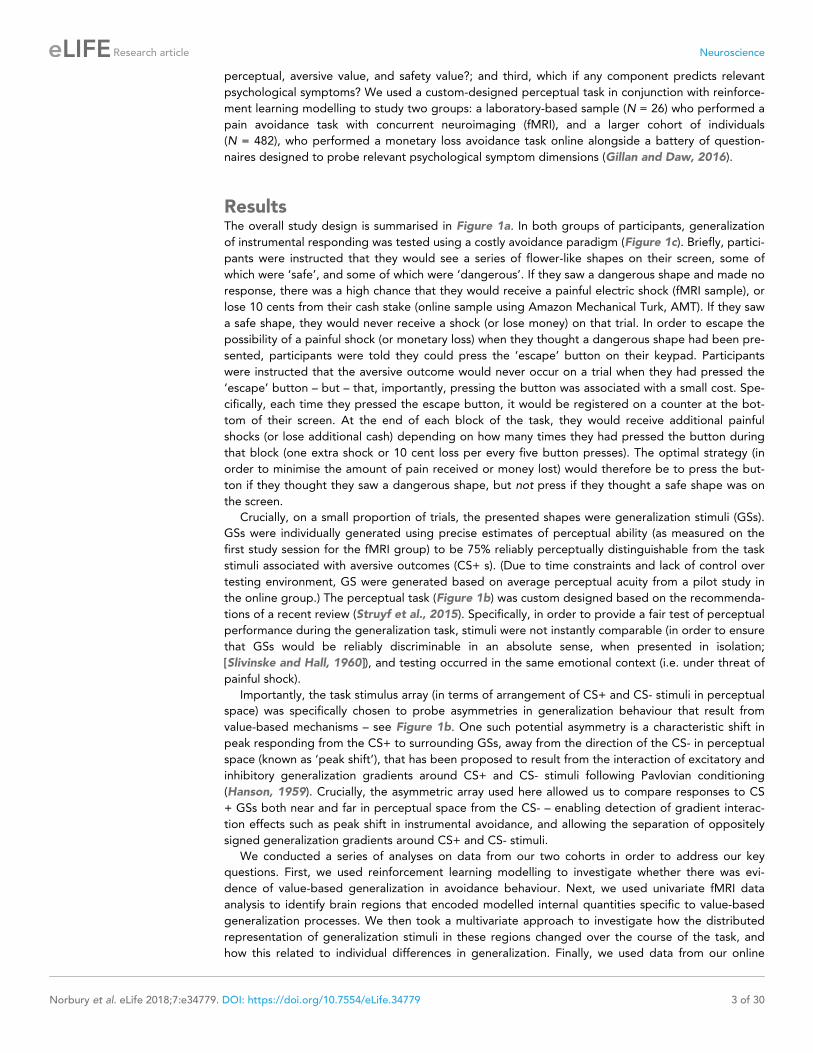
ResultsThe overall study design is summarised in Figure 1a. In both groups of participants, generalization
of instrumental responding was tested using a costly avoidance paradigm (Figure 1c). Briefly, partici-
pants were instructed that they would see a series of flower-like shapes on their screen, some of
which were ‘safe’, and some of which were ‘dangerous’. If they saw a dangerous shape and made no
response, there was a high chance that they would receive a painful electric shock (fMRI sample), or
lose 10 cents from their cash stake (online sample using Amazon Mechanical Turk, AMT). If they saw
a safe shape, they would never receive a shock (or lose money) on that trial. In order to escape the
possibility of a painful shock (or monetary loss) when they thought a dangerous shape had been pre-
sented, participants were told they could press the ‘escape’ button on their keypad. Participants
were instructed that the aversive outcome would never occur on a trial when they had pressed the
‘escape’ button – but – that, importantly, pressing the button was associated with a small cost. Spe-
cifically, each time they pressed the escape button, it would be registered on a counter at the bot-
tom of their screen. At the end of each block of the task, they would receive additional painful
shocks (or lose additional cash) depending on how many times they had pressed the button during
that block (one extra shock or 10 cent loss per every five button presses). The optimal strategy (in
order to minimise the amount of pain received or money lost) would therefore be to press the but-
ton if they thought they saw a dangerous shape, but not press if they thought a safe shape was on
the screen.
Crucially, on a small proportion of trials, the presented shapes were generalization stimuli (GSs).
GSs were individually generated using precise estimates of perceptual ability (as measured on the
first study session for the fMRI group) to be 75% reliably perceptually distinguishable from the task
stimuli associated with aversive outcomes (CS+ s). (Due to time constraints and lack of control over
testing environment, GS were generated based on average perceptual acuity from a pilot study in
the online group.) The perceptual task (Figure 1b) was custom designed based on the recommenda-
tions of a recent review (Struyf et al., 2015). Specifically, in order to provide a fair test of perceptual
performance during the generalization task, stimuli were not instantly comparable (in order to ensure
that GSs would be reliably discriminable in an absolute sense, when presented in isolation;
[Slivinske and Hall, 1960]), and testing occurred in the same emotional context (i.e. under threat of
painful shock).
Importantly, the task stimulus array (in terms of arrangement of CS+ and CS- stimuli in perceptual
space) was specifically chosen to probe asymmetries in generalization behaviour that result from
value-based mechanisms – see Figure 1b. One such potential asymmetry is a characteristic shift in
peak responding from the CS+ to surrounding GSs, away from the direction of the CS- in perceptual
space (known as ‘peak shift’), that has been proposed to result from the interaction of excitatory and
inhibitory generalization gradients around CS+ and CS- stimuli following Pavlovian conditioning
(Hanson, 1959). Crucially, the asymmetric array used here allowed us to compare responses to CS
+ GSs both near and far in perceptual space from the CS- – enabling detection of gradient interac-
tion effects such as peak shift in instrumental avoidance, and allowing the separation of oppositely
signed generalization gradients around CS+ and CS- stimuli.
We conducted a series of analyses on data from our two cohorts in order to address our key
questions. First, we used reinforcement learning modelling to investigate whether there was evi-
dence of value-based generalization in avoidance behaviour. Next, we used univariate fMRI data
analysis to identify brain regions that encoded modelled internal quantities specific to value-based
generalization processes. We then took a multivariate approach to investigate how the distributed
representation of generalization stimuli in these regions changed over the course of the task, and
how this related to individual differences in generalization. Finally, we used data from our online
Norbury et al. eLife 2018;7:e34779. DOI: https://doi.org/10.7554/eLife.34779 3 of 30
Research article Neuroscience

fMR
I (N
=2
6)
AM
T (
N=
55
0)
session 1 session 2 session 3 single session
generalisation of
instrumental avoidance
task (pain)
generalisation of
instrumental avoidance
task ($ loss)
delayed-
punished
perceptual task
delayed-
punished
perceptual task
psychological
questionnaire batteryquiz
shock intensity work-up
procedurestandardised instructionsconsent / debrief task
fail quiz
a
b c
CS+1
CS+2
CS-
GS GS GS GS
ρ (or 1 - ρ)
Same or
different?+End of
block You got 10
out of 40
wrong!
ITI
(2500 ms)
ISI
(4000 ms)
1500 ms500 ms
1500 ms500 ms
2500 ms
+
or
or
or
0
1
1
0
+
+
decision time
(3000 ms)
ITI
(4-5000ms / 2000 ms)
outcome time
(3000 ms / 1500 ms)
End of
block You pressed
the button
20 times or
“You lose
an extra
40 cents”
1
0
0
0
0
0
0
0
_
_
0.10
0
0.2
0.4
0.6
0.8
1
0 0.20
Δ ρ
P (
diffe
ren
t)
CS-, GS
CS+
0.8
0.2
θ
0.75
-θ θ -θ θ
mean proportionate avoidance mean avoidance RT (ms) mean pain expectancy rating
0
0.2
0.4
0.6
0.8
1.0
CS- GS CS+
0
500
1000
1500
2000
2500
GS
0
200
400
600
800
1000
1200
1400****
* ****
**
0
0.2
0.4
0.6
0.8
1.0
CS- GS CS+CS+ GS CS+
0
20
40
60
80
100
CS+
****
****
GSCS-
0
25
50
75
100
CS+GSCS-
mean proportionate avoidance mean avoidance RT (ms) mean loss expectancy rating
d e AMTfMRI
Figure 1. Study design and overall behaviour summary. (a) Study design and protocol for the two participant groups; fMRI, laboratory and functional
imaging sample; AMT, Amazon Mechanical Turk (web-based) sample. (b) Delayed-punished perceptual task, used to determine 75% reliably
perceptually distinguishable generalization stimuli (GSs) on in individual basis for the generalization of instrumental avoidance task (c) in the fMRI
sample (in the AMT sample, GSs were generated based on mean perceptual acuity determined in pilot testing). (d) Summary of behaviour on the
generalization task in fMRI and (e) AMT samples. ISI, inter-stimulus interval; ITI, inter-trial interval; CS+, conditioned stimulus with pain or loss outcome,
CS-, conditioned stimulus with neutral outcome (no pain or loss). Error bars represent SD. *p=0.006, **p<0.001, paired sample t-tests.
DOI: https://doi.org/10.7554/eLife.34779.003
The following figure supplements are available for figure 1:
Figure supplement 1. Relationship between mean avoidance on generalization stimulus (GS) trials during the generalization of instrumental avoidance
task, and mean post-task visual analogue scale pain/loss expectancy ratings.
DOI: https://doi.org/10.7554/eLife.34779.004
Figure supplement 2. Proportionate avoidance for individiual task stimuli (top row) and by CS type and block number (bottom row) for the
generalization of instrumental avoidance task.
DOI: https://doi.org/10.7554/eLife.34779.005
Figure supplement 3. Effects of conditioning on perceptual acuity for task stimuli.
DOI: https://doi.org/10.7554/eLife.34779.006
Norbury et al. eLife 2018;7:e34779. DOI: https://doi.org/10.7554/eLife.34779 4 of 30
Research article Neuroscience

questionnaire battery to determine whether specific elements of avoidance generalization were
related self-reported psychological symptoms.
Evidence for generalization in avoidance behaviourFor both groups of participants, the frequency of avoidance in response to generalization stimuli
was intermediate to that evoked by CS- and CS+ stimuli (all p<0.0001, paired-sample t tests; fMRI:
GS vs CS- t25 = 7.57, mean difference = 0.18 [95%CI 0.14–0.24], GS vs CS+ t25 = �17.6, mean
difference = �0.60 [95%CI �0.67 to �0.54]; AMT: GS vs CS- t481 = 27.0, mean difference = 0.35
[95%CI 0.33 – 0.38], GS vs CS+ t481 = �26.6, mean difference = �0.20 [95%CI �0.19 to �0.21];
Figure 1d,e). Despite never having been associated with the aversive outcome, participants also
rated GSs significantly higher than CS- (but lower than CS+) stimuli on post-task pain/loss expec-
tancy scales (all p<0.0001, paired-sample t tests; fMRI: GS vs CS- t25 = 5.69, mean difference = 24.1
[95%CI 15–33], GS vs CS+ t25 = �8.14, mean difference = -52 [95% CI �39 to �66]; AMT: GS vs CS-
t481 = 29.4, mean difference = 41.7 [95%CI 40.0–44.6], GS vs CS+ t481 = �16.5, mean different = -18
[95% CI �16.0 to �20.3], on visual analogue scales ranging 0–100; [Figure 1d,e]).
There was also a significant positive relationship between relative GS avoidance and relative GS
pain/loss expectancy rating post-task in both groups (fMRI, Spearman’s r = 0.655, p=0.00027; AMT,
Spearman’s r = 0.432, p=2.2e-16; both measures within-participant z-transformed, for relationships
between raw scores see [Figure 1—figure supplement 1]). This suggests that a higher frequency of
avoidance responding (plus associated lack of extinction) translated into higher conscious negative
expectancy beliefs for generalization stimuli. There was no relationship between proportionate
avoidance on GS trials and perceptual acuity at session 1 (individual q values) or absolute intensity of
the painful electrical stimulation (current amplitude) in the fMRI sample (all p>0.2).
This raises the question as to whether the observed avoidance on the GS trials was over and
above that which would be expected from perceptual uncertainty alone. Notably, mean proportion-
ate avoidance on GS trials in the fMRI group was around 0.2 (or ~0.25 when scaled relative to indi-
vidual mean CS+ avoidance) – which, given that GSs were generated to be 75% reliably
distinguishable from CS+s, is what might have been predicted from a purely perceptual account of
task performance. Mean reaction times for making avoidance responses were also significantly
slower for GS compared to CS+ stimuli in both groups, suggesting greater uncertainty on these tri-
als (p=0.006, p=2.07e-11, paired sample t tests; fMRI: t25 = 3.00, mean difference = 167 ms [95% CI
51.2–282], AMT: t481 = 6.87, mean difference = 38.8 ms [95% CI 27.7–49.9]; [Figure 1d,e]). To
resolve this issue, we tested for the presence of additional value-based generalization processes in
both datasets using a principled model comparison approach.
Simply, we fitted a series of reinforcement learning models to avoidance data from both samples
(modified Q-learning algorithms, with trial-by-trial varying learning rates determined by the Pearce-
Hall associability rule, [Sutton and Barto, 1998; Le Pelley, 2004] – see Materials and methods).
Firstly, we fit a model with perceptual ‘generalization’ only (modelled as 25% chance of perceptual
confusion between GSs and the adjacent CS+) – that is where all task stimuli were treated as inde-
pendent states, with no transfer of value across states. Secondly, we fit a model with perceptual gen-
eralization plus an additional value-based generalization process. As there is some evidence that
generalization functions are approximately Gaussian in shape, at least along a single perceptual
dimension (Ghirlanda and Enquist, 2003), this was implemented as a Gaussian smoothing of stimu-
lus value across perceptual space, with a single free parameter (s) governing the width of this func-
tion. Thirdly, we fit a model with perceptual generalization plus two additional free parameters
governing width of additional value-based generalization processes – one for aversive (shock/loss)
and one for neutral (no shock/no loss) feedback (sA and sN, respectively). This model was informed
by previous empirical observations that generalization functions vary in gradient or width for aver-
sive, neutral, and rewarding feedback (Schechtman et al., 2010; Resnik and Paz, 2015;
Laufer et al., 2016).
The above models were fit to avoidance data from both groups using a variational Bayes
approach to model inversion, under a mixed-effects framework (whereby within-subject priors are
iteratively refined and matched to the inferred parent population distribution; see
Materials and methods). Random-effects Bayesian model comparison indicated that in both samples
the model with two additional value-generalization mechanisms (separately governing width of gen-
eralization from aversive and neutral feedback) best accounted for the avoidance data, as indexed
Norbury et al. eLife 2018;7:e34779. DOI: https://doi.org/10.7554/eLife.34779 5 of 30
Research article Neuroscience
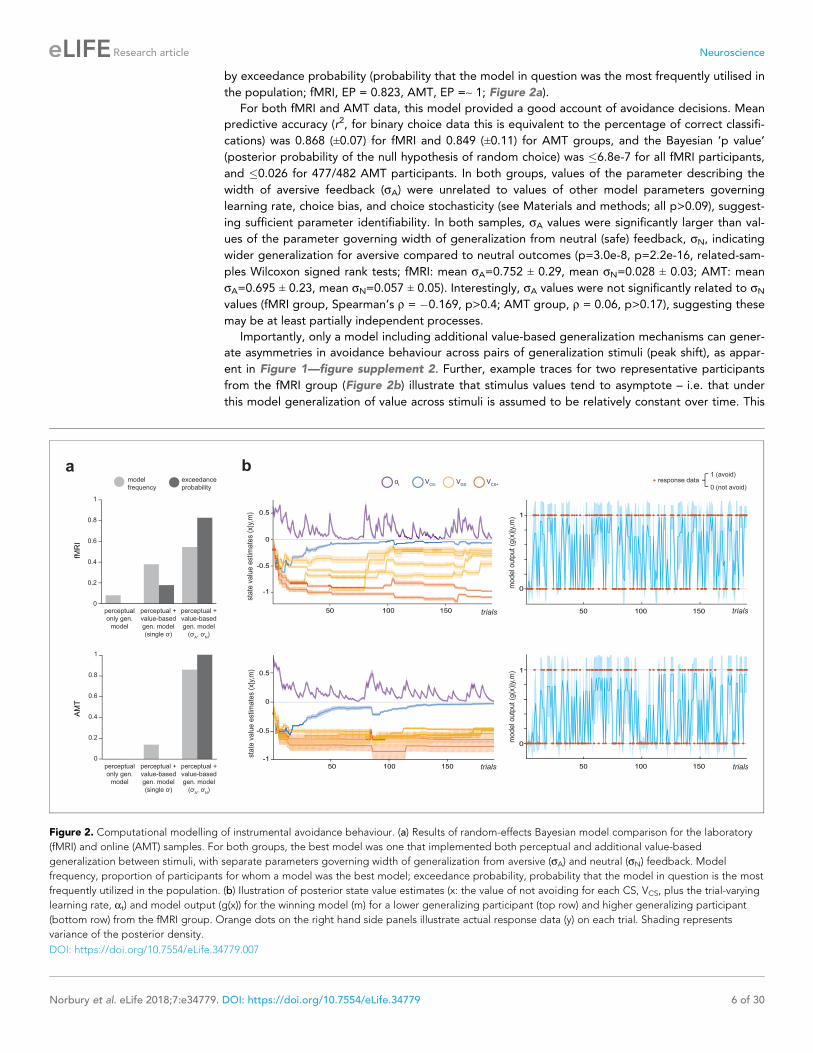
by exceedance probability (probability that the model in question was the most frequently utilised in
the population; fMRI, EP = 0.823, AMT, EP =~ 1; Figure 2a).
For both fMRI and AMT data, this model provided a good account of avoidance decisions. Mean
predictive accuracy (r2, for binary choice data this is equivalent to the percentage of correct classifi-
cations) was 0.868 (±0.07) for fMRI and 0.849 (±0.11) for AMT groups, and the Bayesian ‘p value’
(posterior probability of the null hypothesis of random choice) was �6.8e-7 for all fMRI participants,
and �0.026 for 477/482 AMT participants. In both groups, values of the parameter describing the
width of aversive feedback (sA) were unrelated to values of other model parameters governing
learning rate, choice bias, and choice stochasticity (see Materials and methods; all p>0.09), suggest-
ing sufficient parameter identifiability. In both samples, sA values were significantly larger than val-
ues of the parameter governing width of generalization from neutral (safe) feedback, sN, indicating
wider generalization for aversive compared to neutral outcomes (p=3.0e-8, p=2.2e-16, related-sam-
ples Wilcoxon signed rank tests; fMRI: mean sA=0.752 ± 0.29, mean sN=0.028 ± 0.03; AMT: mean
sA=0.695 ± 0.23, mean sN=0.057 ± 0.05). Interestingly, sA values were not significantly related to sN
values (fMRI group, Spearman’s r = �0.169, p>0.4; AMT group, r = 0.06, p>0.17), suggesting these
may be at least partially independent processes.
Importantly, only a model including additional value-based generalization mechanisms can gener-
ate asymmetries in avoidance behaviour across pairs of generalization stimuli (peak shift), as appar-
ent in Figure 1—figure supplement 2. Further, example traces for two representative participants
from the fMRI group (Figure 2b) illustrate that stimulus values tend to asymptote – i.e. that under
this model generalization of value across stimuli is assumed to be relatively constant over time. This
0
0.2
0.4
0.6
0.8
1
perceptual
only gen.
model
perceptual +
value-based
gen. model
(single ơ)
perceptual +
value-based
gen. model
(ơA, ơ
N)
model
frequency
exceedance
probability
0
0.2
0.4
0.6
0.8
1
perceptual
only gen.
model
perceptual +
value-based
gen. model
(single ơ)
perceptual +
value-based
gen. model
(ơA, ơ
N)
a
fMR
IA
MT
b
trials
trials
αt
VCS-
VGS
VCS+
sta
te v
alu
e e
stim
ate
s (x
|y,m
)
50 100 150
-1
-0.5
0
0.5
sta
te v
alu
e e
stim
ate
s (x
|y,m
)
50 100 150-1
-0.5
0
0.5
0
1
50 100 150
mo
de
l ou
tpu
t (g
(x)|
y,m
)
trials
0
1
50 100 150 trials
response data
mo
de
l ou
tpu
t (g
(x)|
y,m
)
1 (avoid)
0 (not avoid)
Figure 2. Computational modelling of instrumental avoidance behaviour. (a) Results of random-effects Bayesian model comparison for the laboratory
(fMRI) and online (AMT) samples. For both groups, the best model was one that implemented both perceptual and additional value-based
generalization between stimuli, with separate parameters governing width of generalization from aversive (sA) and neutral (sN) feedback. Model
frequency, proportion of participants for whom a model was the best model; exceedance probability, probability that the model in question is the most
frequently utilized in the population. (b) Ilustration of posterior state value estimates (x: the value of not avoiding for each CS, VCS, plus the trial-varying
learning rate, at) and model output (g(x)) for the winning model (m) for a lower generalizing participant (top row) and higher generalizing participant
(bottom row) from the fMRI group. Orange dots on the right hand side panels illustrate actual response data (y) on each trial. Shading represents
variance of the posterior density.
DOI: https://doi.org/10.7554/eLife.34779.007
Norbury et al. eLife 2018;7:e34779. DOI: https://doi.org/10.7554/eLife.34779 6 of 30
Research article Neuroscience

assumption is consistent with our behavioural data, in that a time-on-task analysis showed that after
initial period of exploratory learning (blocks 1–2), generalization in terms of GS avoidance remains
fairly stable. In both groups of participants, there were significant effects of both CS type and block
number, and a CS type*block interaction, on proportionate avoidance responding (fMRI:
F2,50=406.3, F4,100=6.14, F8,200=8.68, respectively; AMT: F2,962=1077.9, F4,1962=24.3, F8,3848=263.0,
respectively; all p<0.001, repeated-measures ANOVA). In the fMRI sample, the CS type*block inter-
action was driven by lower avoidance for CS+ stimuli in block one compared to the rest of the task
(p�0.004; other CS types no significant differences between blocks; pairwise comparisons Bonfer-
roni corrected for multiple comparisons). This suggests a strategy of exploratory non-avoidance to
enable proper learning of CS+ stimuli in block 1, but fairly constant generalization of avoidance
across later blocks. In the AMT sample, there was also lower avoidance for CS+ stimuli in block one
vs other blocks (all p<0.001), but a decrease in avoidance for CS- stimuli in later blocks (3-5) vs ear-
lier blocks (1 and 2; all p<0.001). Overall GS avoidance showed small increases then decreases over
first three blocks (p<0.001), before stabilising between blocks 4 and 5 (p>0.5, Bonferroni-corrected
pairwise comparisons; see [Figure 1—figure supplement 2]).
Evidence for effects of conditioning on perceptual acuityIn the fMRI group, perceptual acuity for task stimuli was tested both before and after carrying our
the generalization of instrumental avoidance paradigm, in order to test for possible effects of aver-
sive conditioning on discriminability of the generalization stimuli (the three test sessions were carried
out on three consecutive days for all participants, so any detected changes would likely reflect post-
consolidation changes in perceptual performance).
There was no strong evidence for change in perceptual acuity in terms of q value (difference in
shape ‘spikiness’ parameter rho for 75% reliable perceptual discrimination) pre- vs post- conditioning
(mean q 0.071 ± 0.015 on session 1, 0.065 ± 0.019 on session 3; non-significant trend towards
greater acuity on session 3, p=0.061, related-samples Wilcoxon signed rank test; [Figure 1—figure
supplement 3]). Bayesian model comparison indicated that a model where generalization stimulus
discriminability was held constant at 75% better accounted for avoidance data than one where dis-
criminability was held constant at the estimated post-test (session 3) level, or a model where GS dis-
criminability was assumed to be linear between session 1 and session three values (exceedance
probability for the 75% constant model = ~1; [Figure 1—figure supplement 3]). Therefore GS dis-
criminability was held constant across trials at 75% in all models.
Differences in avoidance behaviour between lab-based and onlinecohortsAs can be seen in Figure 1, both mean avoidance and mean aversive outcome expectancy ratings
for GSs (under non-avoidance) were higher in the AMT compared to the MRI sample (mean propor-
tionate GS avoidance in MRI group: 0.22 ± 0.14, AMT: 0.63 ± 0.18; mean pain/loss expectancy rating
[out of 100] in MRI group: 30 ± 23, AMT: 63 ± 19). One potential explanation for this difference is
that there was lower absolute discriminability of generalization stimuli for the AMT participants.
Although q values (difference in r between CS+ and GS stimuli) were similar for the online and lab-
based cohorts (0.071 ± 0.015 for the MRI group, and 0.065 for all AMT participants), we were unable
to control factors such as participant distance from screen, and experimental window minimisation,
that may have led to GSs being less discriminable than estimated in our pilot study (see
Materials and methods). In addition, it is possible that participants conducting the study online paid
less attention to the task than supervised lab-based participants (e.g. were multi-tasking), resulting
in higher rates of stimulus-independent responding. Finally, it is possible that there were group-level
differences in decision bias for the monetary loss compared to the pain reinforcer – for example due
to differences in overall aversiveness between the two outcomes. Indeed, there was evidence of a
difference in decision bias, as captured by the softmax bias parameter, between groups. The mean
bias against deciding to avoid was 0.415 ± 0.14 in the MRI sample, and 0.315 ± 0.15 in AMT sample
(p=0.0013, 95% CI for difference 0.04–0.16, t28.5=3.56; Welch-Satterthwaite two-sample t test; nb
large difference in N between groups).
Norbury et al. eLife 2018;7:e34779. DOI: https://doi.org/10.7554/eLife.34779 7 of 30
Research article Neuroscience

Brain regions encoding model quantities specific to value-basedgeneralizationAs our behavioural data provided evidence for the presence of generalization in instrumental avoid-
ance in both groups, we next employed a univariate analysis approach to our functional imaging
data in order to investigate whether model quantities specific to value-related generalization pro-
cesses were encoded in regional blood oxygen level-dependent (BOLD) signals.
In addition to work highlighting the role of the insula, amygdala, and primary sensory cortex in
aversive generalization following Pavlovian conditioning (Ghosh and Chattarji, 2015; Onat and
Buchel, 2015; Resnik and Paz, 2015; Laufer et al., 2016), previous functional imaging studies have
identified the striatum and prefrontal cortex as encoding generalization gradients in healthy human
volunteers (Dunsmoor et al., 2011; Greenberg et al., 2013; Lissek et al., 2014). However, the con-
tribution of perceptual uncertainty (i.e. absolute discriminability of ‘generalization stimuli’ compared
with other conditioned stimuli) is not always adequately addressed in the study of such gradients.
Here, we used a strict parametric approach to identify additional variance in regional BOLD that can
be attributed to our winning value-based generalization model, over and above that which can be
explained by a purely perceptual account. This was achieved by using serially orthogonalised regres-
sors derived from each model to predict trial-by-trial variation in BOLD signal in our regions of inter-
est (see Figure 3a and Materials and methods).
We found evidence for the encoding of additional variance in trial-by-trial expected stimulus val-
ues derived from the value-based generalization model in both the anterior insular cortex and the
dorsal striatum (Figure 3b). BOLD signal was greater when the expected value of a particular stimu-
lus was lower (or the predicted probability of receiving a painful shock if an avoidance response was
not made was higher) in the left anterior insula (pWB = 0.0073, k = 73, peak voxel [�30,23,–4],
Z = 4.71; sub-threshold trend in the right anterior insula: pSVC = 0.073, k = 9, peak voxel [42,23,-1],
Z = 3.45), and right caudate (pSVC = 0.024, k = 20, peak voxel [9,8,8], Z = 3.95). There was no evi-
dence for univariate encoding of this signal in primary visual cortex (V1) or the amygdala. We also
found no evidence for negative encoding of aversive value (greater BOLD signal with lower pre-
dicted probability of shock, or ‘safety signalling’) in the ventromedial prefrontal cortex (vmPFC).
In addition to expected value signals, we examined potential encoding of prediction errors, which
are the main learning signals in reinforcement learning (PEs; defined as the difference between
actual and predicted outcome on any given trial – see Materials and methods). We focused our anal-
ysis on negatively signed PEs (generated on trials where no shock was received, but the predicted P
(shock) was >0), as this both constrains analysis to trials where an avoidance response was not made
(on avoidance trials PE = 0, by definition), and gives greater weighting to generalization trials where,
due to perceptual uncertainty alone, predicted P(shock) will be >0, but no aversive outcome is ever
delivered. (Positively signed PEs are highly collinear with shock administration and therefore are
hard to detect under our design.)
We also found evidence of significant encoding of additional variance in PE signals from the
value-based generalization model in insula and striatum (Figure 3c). Specifically, BOLD signal was
greater when trial PE was more negative in the anterior insula, bilaterally (left: pSVC = 9.72e-5,
k = 93, peak voxel [�33,20,11], Z = 5.48; right: pSVC = 0.024, k = 19, peak voxel [33,26,-4], Z = 4.35),
right insula more posteriorly (pSVC = 5.85e-5, k = 65, peak voxel [48,8,-4], Z = 4.40), putamen, bilat-
erally (left: pSVC = 0.024, k = 20, peak voxel [�27,–4,�1], Z = 4.29; right: pSVC = 0.009, k = 31, peak
voxel [33,2,-1], Z = 4.06), and right pallidum (pSVC = 0.046, k = 14, peak voxel [18,5,2], Z = 3.74). Sig-
nificant clusters were also observed in the mid cingulate cortex (pWB = 0.001, k = 103, peak voxel
[6,14,44], Z = 4.46), left parietal operculum (pWB = 3.56e-5, k = 168, peak voxel [�48,–25,14],
Z = 4.10), right inferior parietal lobule (pWB = 0.003, k = 90, peak voxel [54,-40,26], Z = 3.82) and
inferior frontal gyrus (pWB = 0.023, k = 56, peak voxel [42,5,35], Z = 4.31) � but we found no evi-
dence of encoding of value generalization-derived PE signals in V1, the amygdala, or vmPFC.
Changes in neural representation of generalization stimuli over thecourse of the task: relationship to individual differences in avoidancebehaviourPrevious studies in animal models have shown that over the course of conditioning, the representa-
tion of the conditioned stimulus (CS+) in terms of response pattern across many individual units may
Norbury et al. eLife 2018;7:e34779. DOI: https://doi.org/10.7554/eLife.34779 8 of 30
Research article Neuroscience

a
b
0 3 6 11.5 –12.5
time (s)
c
0
perceptual + value-
based model
perceptual only
model
+
-
pre
dic
ted
va
lue
ad
ditio
na
l va
ria
nce
pre
dic
tio
n e
rro
r a
dd
itio
na
l va
ria
nce
CS onset outcome
y=8
y=2
5
4
3
2
1
0t
6
4
3
2
1
0t
y=23 z=4
y=8 z=8
4
2
0
6
t
5
4
3
2
1
0t
y=20 z=11
y=2 z=-1
Figure 3. Univariate statistical maps highlight brain regions where changes in BOLD signal is significantly related to trial-by-trial variance in internal
model quantities from the value-based generalization model, over and above that which can be explained by a purely perceptual account. (a)
Schematic of a single trial for the fMRI group, showing the difference in estimated probability of receiving a shock (if no avoidance response is made)
and outcome prediction error, as derived from the perceptual only vs the perceptual + additional value-based generalization models. (b) Significant
Figure 3 continued on next page
Norbury et al. eLife 2018;7:e34779. DOI: https://doi.org/10.7554/eLife.34779 9 of 30
Research article Neuroscience
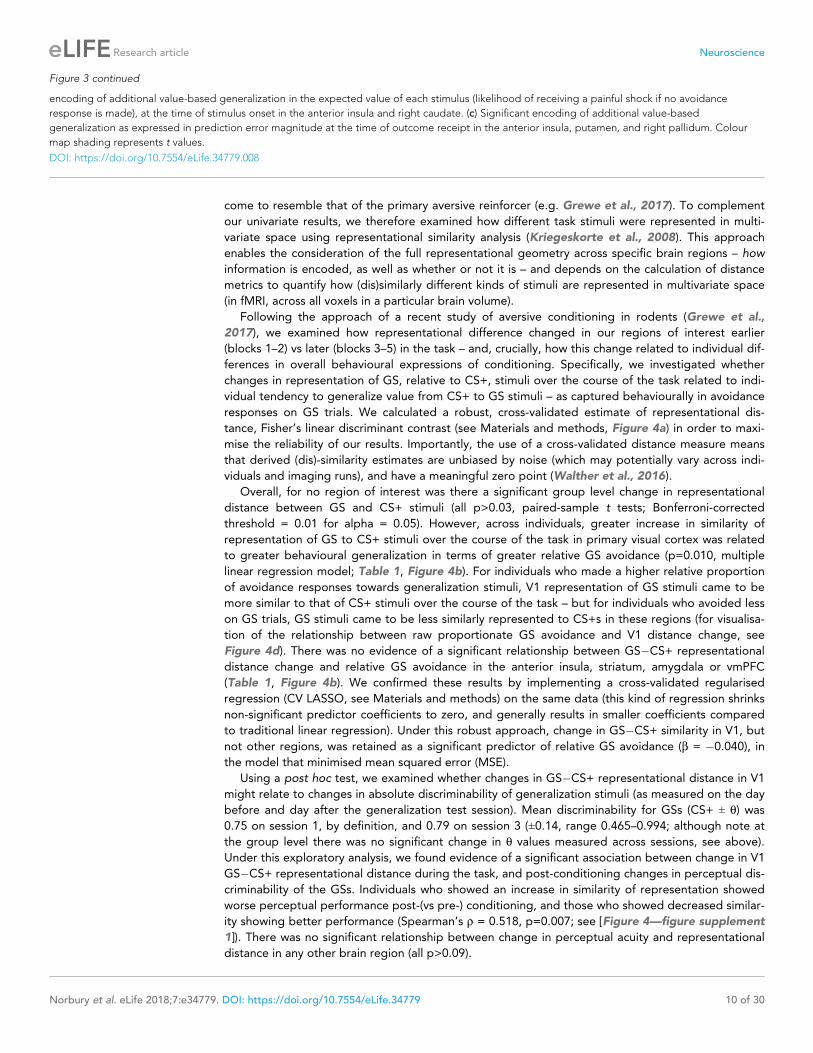
come to resemble that of the primary aversive reinforcer (e.g. Grewe et al., 2017). To complement
our univariate results, we therefore examined how different task stimuli were represented in multi-
variate space using representational similarity analysis (Kriegeskorte et al., 2008). This approach
enables the consideration of the full representational geometry across specific brain regions – how
information is encoded, as well as whether or not it is – and depends on the calculation of distance
metrics to quantify how (dis)similarly different kinds of stimuli are represented in multivariate space
(in fMRI, across all voxels in a particular brain volume).
Following the approach of a recent study of aversive conditioning in rodents (Grewe et al.,
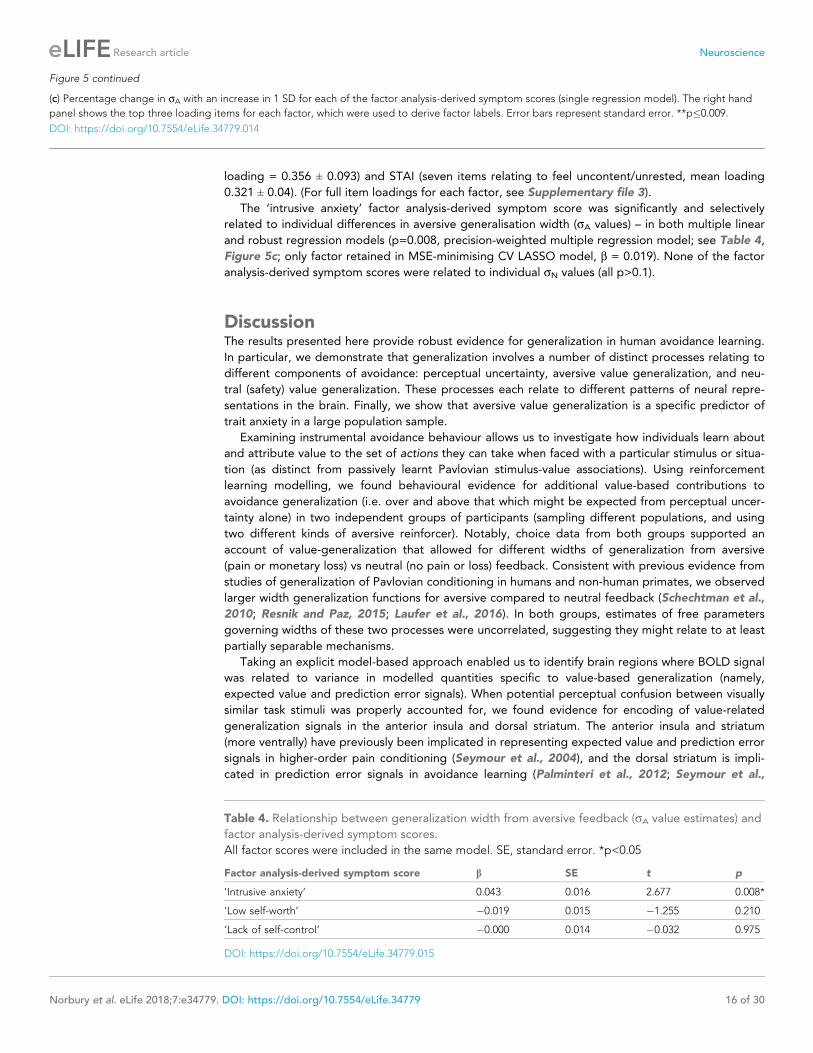
2017), we examined how representational difference changed in our regions of interest earlier
(blocks 1–2) vs later (blocks 3–5) in the task – and, crucially, how this change related to individual dif-
ferences in overall behavioural expressions of conditioning. Specifically, we investigated whether
changes in representation of GS, relative to CS+, stimuli over the course of the task related to indi-
vidual tendency to generalize value from CS+ to GS stimuli – as captured behaviourally in avoidance
responses on GS trials. We calculated a robust, cross-validated estimate of representational dis-
tance, Fisher’s linear discriminant contrast (see Materials and methods, Figure 4a) in order to maxi-
mise the reliability of our results. Importantly, the use of a cross-validated distance measure means
that derived (dis)-similarity estimates are unbiased by noise (which may potentially vary across indi-
viduals and imaging runs), and have a meaningful zero point (Walther et al., 2016).
Overall, for no region of interest was there a significant group level change in representational
distance between GS and CS+ stimuli (all p>0.03, paired-sample t tests; Bonferroni-corrected
threshold = 0.01 for alpha = 0.05). However, across individuals, greater increase in similarity of
representation of GS to CS+ stimuli over the course of the task in primary visual cortex was related
to greater behavioural generalization in terms of greater relative GS avoidance (p=0.010, multiple
linear regression model; Table 1, Figure 4b). For individuals who made a higher relative proportion
of avoidance responses towards generalization stimuli, V1 representation of GS stimuli came to be
more similar to that of CS+ stimuli over the course of the task – but for individuals who avoided less
on GS trials, GS stimuli came to be less similarly represented to CS+s in these regions (for visualisa-
tion of the relationship between raw proportionate GS avoidance and V1 distance change, see
Figure 4d). There was no evidence of a significant relationship between GS�CS+ representational
distance change and relative GS avoidance in the anterior insula, striatum, amygdala or vmPFC
(Table 1, Figure 4b). We confirmed these results by implementing a cross-validated regularised
regression (CV LASSO, see Materials and methods) on the same data (this kind of regression shrinks
non-significant predictor coefficients to zero, and generally results in smaller coefficients compared
to traditional linear regression). Under this robust approach, change in GS�CS+ similarity in V1, but
not other regions, was retained as a significant predictor of relative GS avoidance (b = �0.040), in
the model that minimised mean squared error (MSE).
Using a post hoc test, we examined whether changes in GS�CS+ representational distance in V1
might relate to changes in absolute discriminability of generalization stimuli (as measured on the day
before and day after the generalization test session). Mean discriminability for GSs (CS+ ± q) was
0.75 on session 1, by definition, and 0.79 on session 3 (±0.14, range 0.465–0.994; although note at
the group level there was no significant change in q values measured across sessions, see above).
Under this exploratory analysis, we found evidence of a significant association between change in V1
GS�CS+ representational distance during the task, and post-conditioning changes in perceptual dis-
criminability of the GSs. Individuals who showed an increase in similarity of representation showed
worse perceptual performance post-(vs pre-) conditioning, and those who showed decreased similar-
ity showing better performance (Spearman’s r = 0.518, p=0.007; see [Figure 4—figure supplement
1]). There was no significant relationship between change in perceptual acuity and representational
distance in any other brain region (all p>0.09).
Figure 3 continued
encoding of additional value-based generalization in the expected value of each stimulus (likelihood of receiving a painful shock if no avoidance
response is made), at the time of stimulus onset in the anterior insula and right caudate. (c) Significant encoding of additional value-based
generalization as expressed in prediction error magnitude at the time of outcome receipt in the anterior insula, putamen, and right pallidum. Colour
map shading represents t values.
DOI: https://doi.org/10.7554/eLife.34779.008
Norbury et al. eLife 2018;7:e34779. DOI: https://doi.org/10.7554/eLife.34779 10 of 30
Research article Neuroscience

a
b
c
d
e
voxel 1 activity
vo
xe
l 2
activity
condition 1
condition 2
Fisher linear discriminant
(run A)
voxel 1 activity
vo
xe
l 2
activity
Figure 4. Multivariate fMRI results highlight regions where change in representational geometry over the course of the task between generalization
stimuli (GSs) and pain-associated stimuli (CS+s) is related to individual differences in overall GS avoidance and the model parameter governing width of
generalization from aversive feedback (sA). (a) Schematic of linear discriminant contrast analysis (based on [Kriegeskorte et al., 2007]). Within cross-
validation folds, data from one imaging run is projected onto the optimal decision boundary derived from other runs, in order to remove inflation by
Figure 4 continued on next page
Norbury et al. eLife 2018;7:e34779. DOI: https://doi.org/10.7554/eLife.34779 11 of 30
Research article Neuroscience

All the univariate fMRI findings presented above remained significant if re-ran using regressors
derived from a model where perceptual discriminability of GSs changes linearly over the course of
the task from pre- to post-conditioning measured acuity levels (full, unthresholded statistical maps
for all analyses are available at Neurovault; neurovault.org/collections/3177).
Changes in neural representation of generalization stimuli over thecourse of the task: relationship to individual differences in value-basedgeneralizationWe also sought to relate individual changes in similarity of representation of GS towards CS+ stimuli
over the course of the task to individual model parameter estimates governing width of generaliza-
tion, specifically from aversive feedback (sA values).
We found that greater increases in similarity of representation of the GS relative to CS+ stimuli
over the course of the task in the anterior insula and amygdala were related to larger generalization
from aversive feedback parameter estimates (p=0.024, p=0.012, respectively, precision-weighted
multiple linear regression model; see Table 2, Figure 4c,e). We also found that GS�CS+ representa-
ational distance change in V1 was related to individual differences in aversive feedback generalisa-
tion – in the opposite direction (p<0.001; Table 2). Somewhat counter-intuitively, increases in
GS�CS+ similarity in V1 were associated with lower aversive value generalisation parameter values
(Figure 4c,e). One possible explanation for this finding is that it is a result of V1-mediated changes
in perceptual acuity for GSs – that is increased GS�CS+ representational similarity over the course
of the task, associated with decreased perceptual acuity for GS stimuli, results in a lower require-
ment for additional value-based generalization in these individuals. Notably, this bi-directional rela-
tionship persisted if individual sA values were re-calculated using a behavioural model that took into
account potential conditioning-induced changes in perceptual acuity (i.e. perceptual discriminability
of generalization stimuli changed linearly across trials from pre- to post- generalization test mea-
sured values; amygdala: b = �0.353, SE = 0.07, t = �5.42, p=2.65e-5; V1: b = 0.204, SE = 0.04,
t = 5.08, p=5.77e-5). This suggests that a putative perceptual vs value-based generalization trade-
Figure 4 continued
noise in the final distance estimate (obtained by averaging across folds). (b) Multiple regression models detailing how changes in representational (dis)
similarity over the course of the task in each ROI relate to overall relative avoidance on generalization trials, and (c) to individual differences in the
model parameter governing width of generalization from aversive feedback. Error bars represent standard error. (d) Visualisation of bivariate
relationships between change in representational geometry and raw GS avoidance (in primary visual cortex), and (e) between change in
representational geometry and individual sA values (in the anterior insula, amygdala, and V1), weighted by individual parameter estimate precision (1/
posterior variance). Larger bubble size represents greater precision (and therefore higher regression weight). Light blue shading on structural images
illustrates the ROI volumes data were extracted from in each case. CV LDC, leave-one-out cross-validated linear discriminant contrast; a insula, anterior
insula; vmPFC, ventromedial prefontal cortex. *p<0.05, **p<0.01.
DOI: https://doi.org/10.7554/eLife.34779.009
The following figure supplement is available for figure 4:
Figure supplement 1. Relationship between change in stimulus discriminability, pre vs post-conditioning, and change in GS�CS+ representational
distance (CV LDC) in the primary visual cortex (V1) over the course of the generalization task.
DOI: https://doi.org/10.7554/eLife.34779.010
Table 1. Changes in representational distance (cross-validated LDC) with conditioning: relationship
to overall generalization stimulus (GS) avoidance.
Change in GS–CS+ representational distance b SE t p
a. insula �0.04287 0.06798 �0.631 0.535
caudate �0.02304 0.04173 �0.552 0.587
amygdala �0.09792 0.09905 �0.989 0.335
V1 �0.10072 0.03531 �2.852 0.010*
vmPFC �0.07407 0.07938 �0.933 0.362
DOI: https://doi.org/10.7554/eLife.34779.011
Norbury et al. eLife 2018;7:e34779. DOI: https://doi.org/10.7554/eLife.34779 12 of 30
Research article Neuroscience

off exists at the brain, rather than the behavioural level. Representational distance change in no
region survived as a predictor of sA values in the more robust CV LASSO model.
Although less well-studied compared to the aversive domain, there is evidence that the amygdala
is also involved in the acquisition of information about safety in rodents and non-human primates
(Rogan et al., 2005; Genud-Gabai et al., 2013), and that medial prefrontal entrainment of the
amygdala is associated with learned safety (successful overcoming of generalized conditioned fear)
in mice (Likhtik et al., 2014). This fits with a large literature on the vmPFC playing a role in ‘safety
signalling’ in humans (Fullana et al., 2016). As a further exploratory analysis, we therefore investi-
gated whether there was a relationship between change in GS-CS- similarity over the course of the
task in the amygdala and vmPFC and individual values of the parameter governing width of generali-
zation from neutral (non-pain) feedback, sN. (Nb, due to the arrangement of task stimuli, see
Figure 1b, our design is not optimised to probe GS–CS- value generalization at the stimulus cate-
gory level.)
We found evidence of significant relationships between GS�CS- similarity change in the amyg-
dala and vmPFC and individual sN values – such that individuals where representation of GSs came
to be more similar to CS- in both these regions had greater neutral (‘safety’) generalization parame-
ter values (amygdala: b = �0.043, SE 0.0086, t = �5.02, p=4.43e-5; vmPFC: b = �0.069, SE 0.009,
t = �7.58, p=1.07e-7; precision-weighted multiple linear regression model). Representational
change in the vmPFC (but not amygdala) was retained in the MSE-minimising CV LASSO model
(b = �0.032).
Relationship between individual differences in value-basedgeneralization and self-reported psychopathologyHypotheses about the role of generalization in psychological disorders tend to relate to an over-gen-
eralization of aversive information – but it has also been proposed that poor discrimination (e.g.
between CS+ and CS- in anxiety groups) may be due to inadequate learning about safety cues. We
therefore looked first at how psychological symptoms scores related to individual sA values, but also
examined possible relationships with individual sN values, in our online cohort (N = 482).
Following the approach of Gillan et al. (2016), the online group completed a battery of self-
report questionnaires that probed symptoms hypothesized to be related to aversive over-generaliza-
tion (trait anxiety, mood disorder symptoms, obsessive-compulsive traits, and ‘global’ cognitive
style), in addition to some positive control measures (apathy and impulsivity scales). (A summary of
scores on these measures and other demographic information for both samples is available in
Supplementary file 1). To enable comparison with the findings of Gillan et al., self-report informa-
tion was first compared to individual parameter estimates using precision-weighted linear regression
models, controlling for age and gender identity (see Materials and methods). This approach was
then complemented by the implementation of cross-validated regularised regression models (CV
LASSO regression), as in the previous section (these models also included age and gender identity
as regressors of no interest).
First, we sought to identify whether individual values of the parameter governing width of gener-
alization from aversive feedback (sA) were related to symptom scores on any measure. Total scores
Table 2. Changes in representational distance (cross-validated LDC) with conditioning: relationship
to model parameter governing width of generalization from aversive feedback (sA). a. insula,
anterior insula; vmPFC, ventromedial prefrontal cortex; V1, primary visual cortex; SE, standard error.
*p<0.05
Change in GS–CS+ representational distance b SE t p
a. insula �0.357 0.146 �2.448 0.024*
caudate �0.082 0.043 �1.908 0.071
amygdala �0.285 0.103 �2.761 0.012*
V1 0.299 0.064 4.684 <0.001*
vmPFC 0.277 0.217 1.277 0.216
DOI: https://doi.org/10.7554/eLife.34779.012
Norbury et al. eLife 2018;7:e34779. DOI: https://doi.org/10.7554/eLife.34779 13 of 30
Research article Neuroscience

across measures exhibited good to excellent internal reliability (mean Cronbach’s a = 0.882, see
Supplementary file 2), and, as might be expected, covaried significantly across participants (mean
absolute r for inter-correlation between scores = 0.479). Regression of total scores against parame-
ter estimates was therefore implemented in separate models for each measure, in order to enable
meaningful partition of variance. The Nyholt-Bonferroni corrected p value for significance across
these separate models of non-independent measures was p<0.010 to maintain an alpha of 0.05
(effective number of independent variables = 5.0, see Materials and methods).
Parameter estimates governing width of generalization from aversive feedback were found to be
significantly positively associated with trait anxiety scores (greater width with greater anxiety), and
significantly negatively associated with trait apathy (smaller width with greater apathy; anxiety,
p=0.009, apathy, p<0.001, individual precision-weighted linear regression models controlling for
age and gender; see Table 3, Figure 5a). These two effects remained significant when trait anxiety
and apathy scores were included in the same model, suggesting they were independent (anxiety:
b = 0.050, SE 0.015, t = 3.34, apathy: b = �0.060, SE 0.014, t = �4.28; both p<0.001). This result
was confirmed under the cross-validated and regularised analysis; when all predictors were entered
in the same model both anxiety and apathy total scores were retained as predictors in the model
that minimised MSE (b = 0.021, b = �0.032, respectively). No questionnaire total scores were signifi-
cantly related to sN values (p>0.05).
As per Gillan et al, we also sought to reduce collinearity in our battery of self-report measures by
entering all recorded items (N = 142) into a factor analysis. Using an identical method to that
described in the previously cited paper (see Materials and methods), we derived a three-factor solu-
tion (for scree plot see Figure 5b). These factors were labelled ‘intrusive anxiety’, ‘low self-worth’,
and ‘low self-control’ on the basis of their top loading items (see Figure 5c).
The ‘intrusive anxiety’ factor was mostly composed of items from the trait scale of State-Trait
Anxiety Inventory (STAI; 20 items, mean loading = 0.457 ± 0.12), Obsessive-Compulsive Index (OCI;
18 items, mainly items probing intrusive thoughts and checking behaviour, mean
loading = 0.602 ± 0.087), Physician’s Health Questionnaire (PHQ9; eight items probing mood disor-
der symptoms, mean loading = 0.531 ± 0.056), and the Barratt Impulsivity Scale (BIS; six items per-
taining to racing/intrusive thoughts and restlessness, mean loading = 0.386 ± 0.15). ‘Low self-worth’
was mostly comprised of items from the Cognitive Style Questionnaire (CSQ; 37 items, mainly from
low self-worth and internal attribution subscales, mean loading = 0.518 ± 0.13) and the STAI (11
items, mainly related to low self-worth/negative self-affect, mean loading = 0.322 ± 0.054). ’Low
self-control’ mostly comprised items from the BIS (23 items, mainly from the non-planning and atten-
tional impulsivity subscales, mean loading = 0.485 ± 0.15), with some loading from the apathy moti-
vation index (AMI; six items from the behavioural amotivation subscale, mean
Table 3. Relationship between width of generalisation from aversive feedback (sA value estimates)
and questionnaire total scores.
Each line represents the results of a separate model, as questionnaire scores were significantly collin-
ear. STAI, Spielberger State-Trait Anxiety Inventory (trait scale); AMI, Apathy Motivation Index; OCI-R,
Obsessive-Compulsive Index (Revised); PHQ9, Physician’s Health Questionnaire 9 (a brief measure of
mood disorder symptoms); BIS-11, Barratt Impulsivity Scale (version 11); CSQ global, Cognitive Style
Questionnaire cognitive globalisation score. SE, standard error. *p<0.010 (Nyholt-Bonferroni cor-
rected p value for multiple tests on non-independent data, alpha = 0.05).
Questionnaire measure b SE t p
STAI total 0.039 0.015 2.626 0.009*
AMI total �0.051 0.014 �3.687 <0.001*
OCI-R total 0.005 0.014 0.373 0.710
PHQ9 total 0.021 0.015 1.476 0.141
BIS-11 total �0.005 0.013 �0.410 0.682
CSQ global �0.014 0.014 �0.978 0.328
DOI: https://doi.org/10.7554/eLife.34779.013
Norbury et al. eLife 2018;7:e34779. DOI: https://doi.org/10.7554/eLife.34779 14 of 30
Research article Neuroscience

-30
-25
-20
-15
-10
-5
0
5
10
15
20
a b%
ch
an
ge
in
ave
risve
ge
ne
ralis
atio
n (
ơA) ** **
Anx
iety
Apa
thy
OCD
Dep
ress
ion
Impu
lsivity
Globa
l cog
nitiv
e style 0
5
10
15
20
25
30
0
5
10
15
20
25
30
1 2 3 4 5 6 7 8 9 1011121314151617181920
number of factorse
ige
nva
lue
-15
-10
-5
0
5
10
15
20
% c
ha
ng
e in
ave
risve
ge
ne
ralis
atio
n (
ơA)
“Intru
sive
anx
iety”
“Low
self-w
orth
”
“Low
self-c
ontro
l”
I am upset by unpleasant thougths that come into my mind against my will
I find it difficult to control my thoughts
I frequently get nasty thoughts and have difficulty in getting rid of them
That people were not interested in me [...] says something about meas a person
Getting a negative reaction [...] says something about me as a person
People not being interested in me [...] means there is something wrongwith me as a person
I don’t plan tasks carefully
I am not a careful thinker
I am not self-controlled
**c
Figure 5. Associations between individual differences in aversive generalization and psychological symptom scores. (a) Percentage change in the
model parameter governing width of generalization from aversive feedback (sA) with a one standard deviation increase in total score on each individual
questionnaire measure used (individual regression models). (b) Scree plot indicating results of a factor analysis in which all response items from these
measures (N = 142) were entered (inset, first 20 factors). A three-factor solution (lighter shaded bars) was indicated as the most parsimonious structure.
Figure 5 continued on next page
Norbury et al. eLife 2018;7:e34779. DOI: https://doi.org/10.7554/eLife.34779 15 of 30
Research article Neuroscience
loading = 0.356 ± 0.093) and STAI (seven items relating to feel uncontent/unrested, mean loading
0.321 ± 0.04). (For full item loadings for each factor, see Supplementary file 3).
The ‘intrusive anxiety’ factor analysis-derived symptom score was significantly and selectively
related to individual differences in aversive generalisation width (sA values) – in both multiple linear
and robust regression models (p=0.008, precision-weighted multiple regression model; see Table 4,
Figure 5c; only factor retained in MSE-minimising CV LASSO model, b = 0.019). None of the factor
analysis-derived symptom scores were related to individual sN values (all p>0.1).
DiscussionThe results presented here provide robust evidence for generalization in human avoidance learning.
In particular, we demonstrate that generalization involves a number of distinct processes relating to
different components of avoidance: perceptual uncertainty, aversive value generalization, and neu-
tral (safety) value generalization. These processes each relate to different patterns of neural repre-
sentations in the brain. Finally, we show that aversive value generalization is a specific predictor of
trait anxiety in a large population sample.
Examining instrumental avoidance behaviour allows us to investigate how individuals learn about
and attribute value to the set of actions they can take when faced with a particular stimulus or situa-
tion (as distinct from passively learnt Pavlovian stimulus-value associations). Using reinforcement
learning modelling, we found behavioural evidence for additional value-based contributions to
avoidance generalization (i.e. over and above that which might be expected from perceptual uncer-
tainty alone) in two independent groups of participants (sampling different populations, and using
two different kinds of aversive reinforcer). Notably, choice data from both groups supported an
account of value-generalization that allowed for different widths of generalization from aversive
(pain or monetary loss) vs neutral (no pain or loss) feedback. Consistent with previous evidence from
studies of generalization of Pavlovian conditioning in humans and non-human primates, we observed
larger width generalization functions for aversive compared to neutral feedback (Schechtman et al.,
2010; Resnik and Paz, 2015; Laufer et al., 2016). In both groups, estimates of free parameters
governing widths of these two processes were uncorrelated, suggesting they might relate to at least
partially separable mechanisms.
Taking an explicit model-based approach enabled us to identify brain regions where BOLD signal
was related to variance in modelled quantities specific to value-based generalization (namely,
expected value and prediction error signals). When potential perceptual confusion between visually
similar task stimuli was properly accounted for, we found evidence for encoding of value-related
generalization signals in the anterior insula and dorsal striatum. The anterior insula and striatum
(more ventrally) have previously been implicated in representing expected value and prediction error
signals in higher-order pain conditioning (Seymour et al., 2004), and the dorsal striatum is impli-
cated in prediction error signals in avoidance learning (Palminteri et al., 2012; Seymour et al.,
Figure 5 continued
(c) Percentage change in sA with an increase in 1 SD for each of the factor analysis-derived symptom scores (single regression model). The right hand
panel shows the top three loading items for each factor, which were used to derive factor labels. Error bars represent standard error. **p�0.009.
DOI: https://doi.org/10.7554/eLife.34779.014
Table 4. Relationship between generalization width from aversive feedback (sA value estimates) and
factor analysis-derived symptom scores.
All factor scores were included in the same model. SE, standard error. *p<0.05
Factor analysis-derived symptom score b SE t p
‘Intrusive anxiety’ 0.043 0.016 2.677 0.008*
‘Low self-worth’ �0.019 0.015 �1.255 0.210
‘Lack of self-control’ �0.000 0.014 �0.032 0.975
DOI: https://doi.org/10.7554/eLife.34779.015
Norbury et al. eLife 2018;7:e34779. DOI: https://doi.org/10.7554/eLife.34779 16 of 30
Research article Neuroscience

2012; Eldar et al., 2016), suggesting an important role for these structures in aversive learning (see
also Delgado et al., 2009). Dorsal, rather than more ventral striatal control has also been implicated
in the transfer from goal-directed to habit-based avoidance in instrumental paradigms
(LeDoux et al., 2017). Greater understanding of habitual control in excessive avoidance has particu-
lar clinical relevance as it may explain why maladaptive avoidance can persist following extinction
(e.g. contributing to treatment-resistance in exposure therapy for anxiety disorders, [Treanor and
Barry, 2017]), and has been proposed as core mechanism in obsessive-compulsive disorder
(Gillan et al., 2014). We found no evidence of univariate encoding specific to value-based model
quantities in the amygdala, primary visual cortex (V1), or ventromedial prefrontal cortex (vmPFC).
However, this may be because this kind of analysis is not ideally suited to detect distributed repre-
sentations involved in associative learning.
In previous studies of Pavlovian aversive conditioning, it has been demonstrated that positively
conditioned stimuli come to be more closely represented to the primary aversive outcome in multi-
variate space (e.g. across neural ensemble activity in the basolateral amygdala, [Grewe et al.,
2017]). Here, we used a robust, cross-validated measure of representational distance to analyse
data across all voxels in regions of interest, and found that increased similarity of representation of
GS to CS +stimuli over the course of the task in primary sensory cortex was related to higher overall
behavioural generalization (higher proportionate avoidance on generalization trials). Individuals for
whom GS stimuli came to be more closely represented to CS +s in these brain regions (despite
never having been directly associated with the aversive outcome) chose to avoid more in the face of
GS stimuli � and vice versa. This change in representational geometry, in association with the lack of
opportunity for extinction of inappropriately generalized value in an avoidance context, may have
contributed towards the stability of generalization (in terms of overall GS avoidance) we observed
over the later phases of the task.
Consistent with perceptual accounts of generalization, a post-hoc analysis suggested that repre-
sentational change for GSs relative to CS +stimuli over the course of the task in primary visual cortex
might account for some of the generalisation in avoidance we observed (in addition or parallel to
value-based mechanisms identified above). Individuals who avoided more frequently on generaliza-
tion trials, and who showed associated increases in GS�CS +representational similarity in V1, exhib-
ited decreased perceptual acuity for task stimuli on next day perceptual testing - with the opposite
pattern observed in participants who showed lower GS avoidance. Absolute decreases in discrimina-
bility for task stimuli result in increased generalization ‘for free’ (without having to involve additional
mechanisms), and therefore may contribute to maintenance of generalization in some participants.
However, consistent with accounts that favour the involvement of a wider network of brain
regions in coordinating generalization across stimuli, we also found a role for multivariate anterior
insula and amygdalar representations in individual differences in aversive value generalization. Indi-
viduals who had higher estimates for the model parameter governing value generalization specifi-
cally from aversive feedback showed greater increases in similarity of GS�CS +representation in
these regions. Somewhat surprisingly, the opposite relationship was observed in primary visual cor-
tex, such that increases GS-CS +similarity in this region were associated with lower individual aver-
sive generalization parameter estimates. One potential explanation for this finding is that some kind
of compensatory mechanism exists between perceptual and value-based generalization processes,
acting at the brain rather than behaviour level. Interestingly, changes in discriminative ability follow-
ing aversive conditioning have recently been associated with altered insula and amygdalar process-
ing of visual stimuli in humans (Shalev et al., 2018). However, this result was unexpected and would
therefore benefit considerably from further investigation in future work.
Although less well optimised under our design, we also conducted an analysis to probe whether
changes in GS relative to CS- stimuli might be associated with individual estimates of the model
parameter governing width of generalization specifically from neutral (or ‘safe’) outcomes (in this
case, omission of painful shock). Individuals with higher values of the parameter governing extent of
generalization from neutral feedback exhibited greater increases in GS�CS- similarity over the
course of the task in both the amygdala and vmPFC. This adds to a body of work suggesting that
amygdalar function is not only important for the generalization of fear responses, but that it is also
involved in safety learning (Genud-Gabai et al., 2013; Likhtik et al., 2014). A recent study in
rodents suggests that the lateral amygdala may be particularly important region for understanding
individual differences in fear behaviour towards perceptually ambiguous novel stimuli, with different
Norbury et al. eLife 2018;7:e34779. DOI: https://doi.org/10.7554/eLife.34779 17 of 30
Research article Neuroscience

neuronal sub-populations involved in successful discrimination of novel safe stimuli and inappropriate
fear responses – in a way that would be hard to detect by averaging signal across this region as a
whole (Grosso et al., 2018). Although the vmPFC has previously been demonstrated to show
inverse perceptual similarity-derived generalization gradients following aversive conditioning (e.g.
Lissek et al., 2014; Onat and Buchel, 2015), it is not always clear from the experimental design
whether this represents the simple inverse of aversive gradients (stemming from the CS+), or rather
the positive signalling of safety gradients (stemming from the CS-). The evidence presented here
provides tentative support for the latter account, at least in an instrumental context.
Excessive avoidance in response to contexts or stimuli which do not pose a threat to an individu-
al’s health or well-being can significantly impair general functioning and is often associated with high
levels of psychological distress (Arnaudova et al., 2017). Such maladaptive avoidance has been
identified as a core pathological dimension across several psychological disorders, including anxiety
disorders, obsessive-compulsive disorder, chronic pain, and depression (LeDoux et al., 2017). Over-
generalization of aversive feedback to encompass non-threatening but psychologically similar stimuli
or contexts has been proposed as a key mechanism underlying the initiation and maintenance of
excessive avoidance in these conditions (Duits et al., 2015; Dymond et al., 2015; Harvie et al.,
2017; Pearson et al., 2015) – however, the link between generalization of negative value and inap-
propriate avoidance behaviour has been relatively underexplored.
We found selective relationships between psychological symptom scores and individual parame-
ter estimates governing width of value generalization from aversive, but not safe/neutral outcomes.
The largest positive relationship between symptom score and magnitude of aversive generalisation
was for the factor-analysis derived score labelled ‘intrusive anxiety’, which mainly comprised items
probing self-reported trait anxiety, but also reports of intrusive thoughts from the obsessive-compul-
sive inventory (% increase in parameter value with a 1SD increase in symptom score was 11.0% for
intrusive anxiety, and 10.6% for trait anxiety alone). We also found a significant negative relationship
between self-reported apathy and aversive generalization (22.9% decrease in parameter value with a
1SD increase in symptom score) – an effect which appeared to be independent from that relating to
self-reported anxiety. This is an interesting finding, as we often think about apathy as involving a
greater sensitivity to perceived effort, or decreased sensitivity to potential rewards, rather than a
decreased impact of information about punishments (e.g. Bonnelle et al., 2015). As, to our knowl-
edge, there has been no previously reported link between self-reported apathy and aversive gener-
alization, this finding would benefit from future replication.
In summary, the findings reported here demonstrate the benefits of parsing complex processes
such as generalization into separate components, and examining individual relationships between
these components and both neural mechanisms and self-reported psychopathology. This approach
may help unify previous apparently contradictory observations, and underlines that both perceptual
and value-based processes are likely at work in generalization phenomena. Identification of patients
across diagnostic categories who may have a primary deficit in excessive aversive generalization may
help target them towards treatments which work more effectively. Further, greater understanding of
the mechanisms of over-generalization of avoidance (including transfer to habit-based control sys-
tems) may help improve understanding of treatment resistance in these disorders.
Materials and methods
Code and data availabilityAll relevant code for stimulus generation, data collection, and data analysis, in addition to raw
behavioural data, are available at the project’s Open Science Framework page (osf.io/25t3f). Raw
functional imaging data is deposited at openfMRI (openfmri.org/dataset/ds000249) and derived sta-
tistical maps are available at NeuroVault (neurovault.org/collections/3177).
DesignfMRI sampleProtocolEach participant completed three testing sessions on 3 consecutive days. On the first day, partici-
pants were pre-screened, gave informed consent, and performed initial sensory acuity testing for
Norbury et al. eLife 2018;7:e34779. DOI: https://doi.org/10.7554/eLife.34779 18 of 30
Research article Neuroscience

the generalization task stimuli. On the second day, participants completed the generalization of
instrumental avoidance task (performed in fMRI scanner, using individually-generated conditioning
stimuli [CSs] derived from day 1perceptual performance), followed by visual analogue scale (VAS)
ratings of pain expectancy for each CS. On the third day, participants repeated the perceptual acuity
test.
All participants were recruited via online advertisement. Exclusion criteria were left-handedness
and history of neurological or psychological illness, in addition to usual MR safety criteria. The sam-
ple size was chosen on the basis of a power calculation. Previous functional imaging studies in
humans have found effect sizes in the region of r = ~0.5 for generalization-related BOLD signal and
individual difference measures (Greenberg et al., 2013; Lissek et al., 2014; Cha et al., 2014). We
calculated that a sample of N = 26 would allow us to detect r = 0.5 with an alpha of 0.05 and power
of 80%, two-tailed (correlation point biserial model, G*Power version 3.1.9.2). Volunteers were paid
£20/hr in recompense for their time and discomfort arising from the painful electrical stimulation.
The study was approved by the University of Cambridge Psychology Research Ethics Committee.
Delayed-punished perceptual discrimination taskPrior to starting the task, participants were introduced to the shock and electrode and a work-up
procedure was performed (as described below) to set the level of painful stimulation. The delayed-
punished perceptual task was then carried out, as summarized in Figure 1b. Briefly, on each trial,
participants viewed an individual shape (target or comparison stimulus, order randomized on each
trial), followed by a mask (scrambled mean shape image), delay period (blank screen), second shape,
and second mask. At the end of each trial, participants had to indicate whether they thought the
two shapes had been the same, or different. The inter-stimulus delay period of four seconds was
chosen to be long enough such that comparison of stimuli could not be achieved by instantaneous
mechanisms, but required comparison in short-term memory (e.g. primate data suggests discrimina-
tion performance for visual features decreases significantly from <1 s to around 4–5 s inter-stimulus
delay, [Pasternak and Greenlee, 2005]), and roughly matched to the inter-trial interval from the
generalization task. There were 16 trials per absolute value interval per target (160 trials total), and
trials were divided into four equal blocks. At the end of each block, participants received feedback
on how many incorrect judgments they had made, and received a proportionate number of painful
electric shocks as punishment (one painful shock per five incorrect judgments).
Stimuli were five-fold radially symmetric flower-like shapes, as described in van Dam and Ernst,
2015. These were selected on the basis that they can be continuously generated along a single per-
ceptual axis of ‘spikiness’ using the mathematical description provided in the paper, and psycho-
physical evidence demonstrating that they are perceptually linear (i.e., that discrimination thresholds
are constant along this axis). Shape ‘spikiness’ is parameterized by a single value, � (where 0 < � <1),
which relates the inner and outer radii of the shape such that stimuli are of constant surface area.
Target stimuli were shapes with r values of the two CS+ stimuli from the generalization task (0.25
and 0.75). These target stimuli were compared to comparison stimuli of intervals of ±0, 0.05, 0.075,
0.1, and 0.15 �, such that the possible range of different shapes was well tiled. Participants worked
on a pre-defined set of comparison stimuli (opposed to a stair-cased approach) so that pre-exposure
to conditioning task stimuli (and therefore opportunity for perceptual learning) would be matched
across individuals.
Generalization of instrumental avoidance task (pain version)Participants completed five blocks of 38 trials each. On each trial, participants were presented with
a stimulus in the centre of their screen. This initiated a 3 s decision period, during which they must
decide whether or not to make an ‘escape’ (avoidance) response. Following this, a yellow bounding
box appeared around the shape, indicating the time when an avoidance response could be made
was over and they would receive the outcome for that trial. If an avoidance response was made, no
shock was ever delivered on that trial. If no avoidance was made, and the stimulus was a ‘safe’ shape
(CS-), no shock was delivered. If the stimulus was a ‘dangerous’ shape (CS+), a painful shock was
delivered on 80% of non-avoidance trials at the end of this outcome period (i.e. 6 s from stimulus
onset, Figure 1c).
On a low frequency of trials, shapes were generalization stimuli (GSs; 2 presentations of each GS
per 38 trial block). These stimuli were individually generated to be 75% reliably distinguishable from
Norbury et al. eLife 2018;7:e34779. DOI: https://doi.org/10.7554/eLife.34779 19 of 30
Research article Neuroscience

adjacent CS+ s based on day 1 perceptual task performance (see Figure 1b), and were never associ-
ated with painful shock. Trial types were presented in the following ratio: 10 CS-: 10 CS+(*2): 2 GS
(*two per CS+) in a pseudorandom sequence, in order to minimise learning about GS stimuli.
Although previous studies have tended to employ designs with multiple generalization stimuli, use
of a single GS around each CS+ in perceptual space is the most efficient design if the perceptual dis-
criminability of probe stimuli is accurately known, and you are agnostic as to the precise identity of
the generalization function (e.g. exponential vs Gaussian, assuming this constant across individuals).
Frequency of individual GS presentation (10 per GS) was comparable to recent functional imaging
studies of Pavlovian generalization (e.g. 7 and 34 presentations per GS during generalization test
phases, respectively: [Laufer et al, 2016; Onat and Buchel, 2015]).
The stimulus array was asymmetric in perceptual space (see Figure 1b), with two CS+ (and four
associated GS) stimuli – one nearer and further from an intermediary CS-. This array was chosen in
order to probe the presence of characteristic asymmetries in conditioned responses that are hypoth-
esised to arise from the interaction of oppositely signed generalization gradients (e.g. peak shift,
[Hanson, 1959]), and on the basis of previous observations that change in perceptual discriminability
of aversively conditioned stimuli (CS+ s) may depend on the relative ‘nearness’ of safety stimuli (CS-
s) in perceptual space (Aizenberg and Geffen, 2013). Axis direction (in terms of increasing or
decreasing ‘spikiness’) was counterbalanced across participants.
Online sampleProtocolIn order to test relationship with real-world psychological symptoms in an appropriately powered
sample, an online version of the study was also carried out, following the approach of Gillan et al.
(Gillan and Daw, 2016; Gillan et al., 2016). Participants were Amazon Mechanical Turk (AMT) work-
ers based in the USA (in practice, had an AMT account linked to US bank with provision of an US
social security number). Participants were required to be over 18 years of age, but otherwise
remained anonymous.
Participants completed an online consent procedure, and provided limited demographic informa-
tion (age and gender identity). They then read several screens of detailed task instructions (including
visual examples of sample trials), based on the standardized instructions given to lab study partici-
pants. Participants were required to pass a 10 item true/false quiz on task structure before continu-
ing (scoring less than 10/10 returned participants to the instruction screens). They then performed a
monetary loss-based version of the generalization of instrumental avoidance task (see below), fol-
lowed by a battery of questionnaires probing psychological symptoms and cognitive style.
We calculated that a final sample size >459 should be powered to detect a small effect size of
0.13 or greater (association between behavioural and self-report parameters), at alpha = 0.05 and
80% power (two-tailed point biserial model). As expected attrition following quality control
was ~15% (Gillan et al., 2016), we collected N = 550 complete datasets, yielding a final expected
sample size of ~468.
Payment rates were based on UK ethical standards for online experiments (equivalent to a mini-
mum of £5 ph). Participants were paid a flat rate of $2.50 for taking part, plus up to around $3.00
additional bonus payment depending on task performance. The average bonus payment was $2.21
(±0.82) and the average time between accepting and submitting the task was 42 min (equivalent to
$6.72 mean hourly payment rate). The study was approved by the University of Cambridge Psychol-
ogy Research Ethics Committee.
Generalization of instrumental avoidance task (loss version)The generalization task was identical in structure to that performed by the lab-based participants,
but used monetary loss instead of painful shock as the aversive reinforcer (Figure 1c). Prior to start-
ing the task, participants were endowed with a $6.00 stake, and instructed that, although a certain
amount of loss was inevitable, whatever total remained at the end of the task would be paid directly
to them as a bonus (the loss therefore had real-world value). As BOLD data was not being collected,
trials were slightly shorter than for the fMRI group (second set of timing figures, Figure 1c) –
although the length of the decision period was kept the same.
Norbury et al. eLife 2018;7:e34779. DOI: https://doi.org/10.7554/eLife.34779 20 of 30
Research article Neuroscience

Perceptual testing was not performed in the online sample due to time constraints, and the inabil-
ity to control the testing environment (e.g. participant distance from screen, window size, etc.) over
the course of testing. Generalization stimuli were therefore the same for all participants, and gener-
ated on the basis of mean perceptual performance on the perceptual task in a pilot sample. This
pilot testing was carried out under the same conditions and timing parameters as described for the
MRI sample, with the exception that no punishment shocks were administered (and no pain-delivery
apparatus was attached to participants).
Questionnaire batteryFollowing completion of the generalization task, participants completed several self-report measures
(questionnaire order was randomized across participants). These measures were chosen to probe
psychological constructs hypothesized to be related to over-generalization of aversive outcomes
(anxiety, depression, and obsessive-compulsive symptomatology), as well as positive controls that
might suggest a more general effect of psychopathology on task performance (impulsivity, apathy).
Questionnaires consisted of the trait scale of the State-Trait Anxiety Inventory (STAI;
[Spielberger et al., 1970]); the Physician’s Healthy Questionnaire 9 (PHQ9; [Martin et al., 2006]), a
brief measure of mood disorder symptoms; the revised (short-form) Obsessive-Compulsive Index
(OCI-R; [Foa et al., 2002]); the Barratt Impulsiveness Scale v11 (BIS-11; [Patton et al., 1995]); and
the Apathy Motivation Index (AMI; [Ang et al., 2017]). All chosen measures have previously been
shown to be suitable for use in the general population.
A short version of the Cognitive Style Questionnaire (CSQ-SF; [Meins et al., 2012]) was also
administered. This self-report measure asks participants to imagine themselves in various scenarios
(e.g. ‘Imagine you go to a party and people are not interested in you’), and then probes the imag-
ined causes of this scenario along dimensions of ‘internal’, ‘global’, and ‘stable’ attributions, plus low
self-worth. On this measure, a more ‘global’ cognitive style reflects a tendency to attribute negative
events to causes which are general, rather than specific (a cognitive form of over-generalization),
and has been found to be a predictor of future depressed mood (Pearson et al., 2015). The CSQ-
SF was administered at the end of the battery of questionnaires for all participants in order to avoid
possible mood-induction effects.
Quality control procedureFollowing previous studies utilizing AMT (Crump et al., 2013; Gillan et al., 2016), a number of
exclusion criteria were applied sequentially to the dataset to attempt to exclude poor quality
responses. Firstly, we excluded participants who made avoidance responses on less than 50% of
total CS+ trials (indicating lack of learning/random responding on these trials), N = 62. Secondly, we
further excluded participants who selected the wrong answer to a catch item inserted into the ques-
tionnaire battery (‘Please select the answer ‘a little’ if you are reading this question’), N = 6. 68 data-
sets were excluded in total (12.3% of those collected), yielding a final sample size of 482.
Questionnaire data quality was further assessed via calculation of internal reliability coefficients for
each measure (Cronbach’s a).
Data collectionfMRI sampleStimulus presentation and response collection was coded using Cogent2000 v1.30, run in Matlab
R2015b (Mathworks). Perceptual testing on day one and three took place in a laboratory, and gener-
alization testing in an fMRI scanner. Size of stimuli in terms of visual angle subtended were matched
between lab and scanner environments in order to ensure ~constant discriminability.
For the painful stimulation, electric current was generated using DS7A constant current stimulator
(Digitimer), delivered to a custom fMRI-compatible annular electrode (which delivers a highly
unpleasant, pin-prick like sensation), worn on the back of the participant’s dominant (right) hand. All
participants underwent a standardized intensity work-up procedure at the start of each testing day,
in order to match subjective pain levels across sessions to a level that was reported to be painful,
but bearable (8 out of 10 on a VAS ranging from 0 [‘no pain’] to 10 [‘worst imaginable pain’]). The
pain delivery setup was identical for lab-based and MR sessions.
Functional imaging data were collected on a 3T Siemens Magnetom Skyra (Siemens Healthcare),
equipped with a 32-channel head coil. Respiration data were collected during functional scanning
Norbury et al. eLife 2018;7:e34779. DOI: https://doi.org/10.7554/eLife.34779 21 of 30
Research article Neuroscience

using a pneumatic breathing belt (BrainProducts), and choice (avoidance) data were recorded using
an MR-compatible button box.
Field maps were acquired in order to correct for inhomogeneities in the static magnetic field
(short TE = 5.19 ms, long TE = 7.56 ms, 32 � 3 mm slices). Five functional sessions of 212 volumes
were collected using a gradient echo planar imaging (EPI) sequence (TR = 2000 ms, TE = 30 ms, flip
angle = 90˚, tilt=-30˚, slices per volume = 25, voxel size 3 � 3 � 3 mm; this included three dummy
volumes, in addition to the three pre-discarded by the scanner). Limited field of view (constrained by
equipment used for additional physiological data collection) was aligned to the base of brain and
angled away from the orbits, such that there was full coverage of the occipital and temporal lobes,
plus prefrontal cortex. A T1-weighted MPRAGE structural scan (voxel size 1 � 1 � 1 mm) was also
collected. Full sequence metadata are available at openfMRI (openfmri.org/dataset/ds000249).
Online sampleThe experiment was coded in javascript using jsPsych ([de Leeuw, 2015]; available at github.com/
jspsych/jsPsych), and was deployed to Amazon Mechanical Turk via the psiTurk engine
([Gureckis et al., 2016]; available at github.com/NYUCCL/psiTurk). The experiment was hosted in
the cloud using an Amazon Web Services EC2 instance. A more detailed description of this setup is
available at osf.io/mjgtr. The task was not made available on mobile devices (phones or tablets) in
an attempt to ensure minimum screen size.
AnalysisPerceptual acuityFor fMRI sample participants, psychometric functions (a logistic function with free parameters gov-
erning slope, bias, and lapse, or stimulus-independent error, rate) were fitted to response data from
the perceptual task using the psignifit toolbox v2.5.6 (available at bootstrap-software.org/psignifit),
run in Matlab. Formally,
PðdiffÞ ¼ 1=ð1þ expðða�D�Þ=bÞÞ
where P(diff) is the probability of reporting the comparison shape as different (restricted between
the bounds of 0 and 1�lapse rate), D� is the difference in shape parameter � between target and
comparison stimuli, and a determines the bias, and b governs slope, of the logistic function. This
toolbox implements the constrained maximum-likelihood method of psychometric function fitting
described in Wichmann and Hill (2001).
Individual psychometric functions were then used to calculate the different in � value necessary
for the comparison stimulus to be distinguishable from the target on 75% of trials (henceforth, �).
Instrumental avoidance behaviourAvoidance behaviour was modelled using a set of modified Q-learning algorithms (Sutton and
Barto, 1998). Each stimulus was modelled as a different state, with the value of executing each
action (avoid or notAvoid) in each state (Vs,a) updated after each trial (t) on the basis of a simple
Rescorla-Wagner rule – that is, on the basis of difference between the predicted value of that state-
action pair, and the actual outcome of each trial (Rt; coded as 0 for no shock/no loss and �1 for
shock/monetary loss). Formally,
Vs,a,t+1 = Vs,a,t + k*at*(Rt – Vs,a,t)
Learning rate (at) was updated on each trial, according to the empirically well-supported Pearce-
Hall associability rule (Le Pelley, 2004):
at+1 = h*|(Rt – Vs,a,t)| + (1 – h)* at
According to this rule, the learning rate on each trial is determined by the absolute magnitude of
past prediction errors, such that state-action value estimates are updated by more when previous
outcomes have been more surprising, and by less when they were less surprising. This allows for
learning in terms of modelled value adjustment to be greater when outcomes are more surprising
(e.g. at the start of the task), but to be lesser (leading to more stable values) when outcomes are
better predicted. A non-constant learning rate also ensures that parameters governing width of
value-based generalization, which are assumed to be constant over the course of the task, are identi-
fiable during parameter estimation (see below equations). Individual differences in degree of
Norbury et al. eLife 2018;7:e34779. DOI: https://doi.org/10.7554/eLife.34779 22 of 30
Research article Neuroscience
dependence on prediction error history and overall scaling of learning rate are governed by the free
parameters k and h.
To model perceptual ‘generalization’ (possibility of identity confusion between GSs and adjacent
CS+ s), the value of not avoiding for GSs on any given trial was defined as:
VGS,notAvoid = 0.75*VGS,notAvoid,t + 0.25*Vadjacent CS+,notAvoid,t
For the models with additional value-based generalization, on each trial the values of all states
were updated in proportion to their perceptual similarity to the current state, i, using a rule similar
to those employed in previous studies (Kahnt et al., 2012; van Dam and Ernst, 2015) – that is
according to a variable-width Gaussian function across perceptual space. For each state, j:
Gj = 1/exp((ri – rj)2 / (2*s2))
Vj,a,t+1 = Vj,a,t + k*at*(Rt – Vi,a,t)*Gj
where � is the parameter governing shape ‘spikiness’, and the width of Gaussian function govern-
ing generalization is determined by the free parameter s. For the fMRI sample, average � values
were used during model fitting for all subjects, as stimuli had been matched in subjective perceptual
space. For the 2-width model, different s values were fit depending on whether the outcome for
that trial was aversive or neutral (sA and sN, respectively).
As participants were explicitly instructed that they would never receive the aversive outcome if
they made an avoidance response, the value of avoiding in any state (Vs,Avoid,t) was held constant at
0. Value estimates were fit to binary choice data via a softmax observation function, taking into
account the cost of making an avoidance response (additional shock or unit monetary loss to be
received at the end of that block for every five button presses made, or 0.2 per avoidance decision):
P(avoid)=1/(1 + exp(-b*(Vs,avoid,t – Vs,notAvoid,t – 0.2 – bias)))
where the free parameter b determines how driven P(avoid) is by the difference in value between
the two possible actions (Vs,avoid,t – Vs,notAvoid,t), and the bias parameter determines overall bias
towards choosing a particular action (avoiding or not avoiding).
For both samples, models were fit to choice (avoidance) data using the variational Bayes
approach to model inversion implemented in the VBA toolbox ([Daunizeau et al., 2014]; available at
mbb-team.github.io/VBA-toolbox), run in Matlab. Model fit was performed in a mixed-effects frame-
work. Simply, after the first round of model inversion, the individual posterior free parameter value
estimates are used to approximate the population distribution these values were drawn from, which
is then used as prior for the next round of inference, until convergence (no further group-level reduc-
tion free energy). This approach reduces the likelihood of outliers in any individual parameter
estimates.
Model comparison was by random-effects Bayesian model comparison (Rigoux et al., 2014). This
method of model comparison assumes that the population is composed of subjects that differ in
terms of the model that describes them best, then induces a hierarchical probabilistic model that
can be inverted to derive the posterior density over model frequencies, given participants’ data.
Under this approach, the critical metric for any given model is its exceedance probability, or the like-
lihood that that particular model is more frequent than all other models in the comparison set.
Functional imaging dataPre-processingFunctional imaging data were pre-processed using SPM12 (Wellcome Trust Centre for Neuroimag-
ing, www.fil.ion.ucl.ac.uk/spm) in Matlab. Briefly, functional images were realigned to the first func-
tional image in each sequence, unwarped, corrected for time of acquisition, and normalized to MNI
space via tissue probability maps derived from the co-registered structural image. The full pre-proc-
essing pipeline available is available at osf.io/f9drs as a BIDS-compatible Matlab script
(Gorgolewski et al., 2016). Finally, images were smoothed via convolution with an 8 mm full-width
at half-maximum Gaussian kernel for the univariate (but not multivariate) analysis.
Breathing belt data were processed using the PhysIO toolbox ([Kasper et al., 2017]; available at
translationalneuromodeling.org/tapas), which provides physiological noise correction for functional
imaging data using the Fourier expansion of respiratory phase implemented in the RETROICOR
algorithm (Glover et al., 2000).
Norbury et al. eLife 2018;7:e34779. DOI: https://doi.org/10.7554/eLife.34779 23 of 30
Research article Neuroscience

Univariate analysisFunctional imaging data were first analysed according to a mass univariate approach based on the
general linear model for time series data in each voxel, as implemented in SPM12. This enables
detection of whether variance in BOLD in each voxel is significantly related to modelled internal
quantities (i.e. if particular model terms are encoded in BOLD signal time course), with relative spa-
tial specificity. Several models were fit to individual BOLD time series data using restricted maximum
likelihood estimation to produce individual statistical maps at the first level, which were used to
determine significance at the second level using one-sample t-tests in a random-effects framework.
All first level models included the following regressors of no interest: 8 respiration and 6 move-
ment regressors (with translation >1.5 mm or rotation >1˚ on any trial resulting in the inclusion of an
additional outlier regressor), plus delta functions at the time of avoidance responses and shock
receipt (avoidance response onsets included a parametric modulator representing reaction time, as
overall we observed different mean RTs for GS and CS+ stimuli). In addition:
Model 1: Expected value analysis. We investigated encoding of modelled internal signals repre-
senting initial stimulus evaluation (i.e. the outcome that would be expected if no avoidance response
was made), rather than values associated with chosen action on each trial (i.e. expected value of the
outcome on that trial, following choice). For ease of interpretation, modelled internal value of not
avoiding on a given trial (Vs,notAvoid,t) was multiplied by �1 to effectively represent predicted P
(shock) for that particular stimulus. The imaging model consisted of delta functions for CS onset (all
trials), with parametric modulators of (i) estimated P(shock) according to the perceptual only model
(ii) estimated P(shock) according to the perceptual +value based generalization model.
Model 2: Prediction error analysis. Prediction error (PE) was defined as the difference between
predicted and actual outcome on a given trial, or (Rt – Vs,a,t). NB by definition this is equal to 0 on all
trials where an avoidance response was made. The imaging model consisted of delta functions at
the time of expected outcome delivery (all trials), with parametric modulators of (i) trial PE according
to the perceptual only model (ii) trial PE according to the perceptual +value-based generalization
model. Again, for ease of interpretability, PE terms were multiplied by �1 – such that positive PEs
represented shock receipt (where predicted P(shock) was <1), and negative PEs represented shock
omission (where predicted P(shock) was >0).
All regressors were convolved with a canonical haemodynamic response function, with correction
for low-frequency drift using high-pass filtering (1/128 s) and correction for serially correlated errors
by fitting of a first-order autoregressive process (AR(1)).
Computational model-based regressors were derived using individual subject free parameter val-
ues, and all regressors were orthogonalised during model estimation. SPM assigns variance to
parametric modulators in a successive fashion, such that in an orthogonalised framework, a signifi-
cant finding from a second parametric modulator represents that due to variance over and above
that which has been assigned to the first modulator (Mumford et al., 2015). Due to the nature of
our task design (i.e. that participants are only required to make motor responses on trials on which
they wish to avoid that outcome of the presented stimulus), it is possible that expected value (pre-
dicted P(shock)) responses are partially contaminated by motor preparation responses (despite inclu-
sion of appropriate nuisance regressors), due to the relative timing of these events. This should not
be the case for the outcome prediction error analysis, as this focuses on trials where an avoidance
response was not made (see Results). Additionally, there is greater variability in prediction error
compared with expected value signals over the course of the task, making the former easier to dis-
cern statistically. However, changes in categorical stimulus representation associated with value are
well evaluated using a multivariate approach (see below).
An initial cluster-forming threshold of p<0.001 (uncorrected), cluster size �10, was applied to 2nd
level statistical maps, followed by cluster-level family wise error (FWE) rate correction at the whole-
brain level (pWB). Small-volume correction (pSVC) was applied in a priori regions of interest (ROIs):
namely the insula, amygdala, striatum, primary visual cortex (V1) and ventromedial prefrontal cortex
(vmPFC) (see main text). ROIs were defined anatomically using the automatic anatomical labelling
(aal) atlas (Tzourio-Mazoyer et al., 2002) in SPM (‘striatum’=caudate + putamen+pallidum;
‘V1’=Brodmann Area 17; ‘vmPFC’=medial orbitofrontal cortices).
Only voxels present in all subjects were included in the analysis. For display purposes, statistical
maps were thresholded at p<0.001 (uncorrected), and overlain on a high-quality mean MNI-space
Norbury et al. eLife 2018;7:e34779. DOI: https://doi.org/10.7554/eLife.34779 24 of 30
Research article Neuroscience

structural image available as part of the MRIcroGL package. All quoted voxel coordinates refer to
MNI space, in mm.
Multivariate analysisRepresentational similarity analysis (RSA) was carried out using materials from the RSA toolbox
([Nili et al., 2014]; available at github.com/rsagroup/rsatoolbox), run in Matlab.
For this analysis, time series data extracted from all voxels of each ROI were first multivariately
noise normalized (data were beta images drawn from a simple categorical general linear model that
consisted of stimulus onset by type and the same nuisance regressors as the univariate analyses). We
calculated linear discriminant contrast values between pairs of stimulus categories (CS-, GS, CS+) as
a robust estimate of representational dissimilarity (Walther et al., 2016). This approach involves con-
struction of an optimal decision boundary (hyperplane) between pairs of multivariate representations
(i.e. BOLD signal in all voxels, see Figure 4a). LDC values are a continuous measure of representa-
tional distance (dissimilarity) drawn by sampling of a dimension orthogonal to this decision boundary
(Fisher’s linear discriminant). To ensure distances were unbiased by noise (and therefore had a mean-
ingful zero point), LDC values were estimated using a leave-one-out cross-validation approach across
functional imaging runs (this constitutes a cross-validated estimate of the Mahlanobis distance;
[Walther et al., 2016]).
A priori regions of interest were the same as for the univariate analysis. However, per our analysis
plan, where possible anatomical ROIs were replaced by functional ROIs defined from the group-level
univariate analysis. Specifically, the anterior insula and caudate clusters identified in Figure 3b were
substituted for whole structure anatomical ROIs. This was done on the basis that (1) the univariate
analysis indicated involvement of these voxels in specific value-related generalisation processes, and
(2) previous analysis has shown that reliability of LDC RDMs falls off sharply for larger ROIs (>~250
voxels, [Walther et al., 2016]; anatomical ROIs for whole insula = 1019 voxels, for whole stria-
tum = 3482 voxels; functional anterior insula ROI = 71 voxels, functional caudate ROI = 20 voxels,
masks available at osf.io/25t3f).
Questionnaire dataQuestionnaire total and individual item scores were feature scaled (z-scored across participants)
prior to further analysis.
Factor analysis was carried out as described in Gillan et al (2016): implemented in R v3.4.0 (R
Foundation for Statistical Computing), using the factanal function (psych package) with oblique (obli-
min) rotation. The number of factors to extract was determined using the Cattell-Nelson-Gorsuch
(Gorsuch and Nelson, 1981) method (nFactors package), whereby successive scree plot gradients
are analysed to determine the ‘elbow’ point after which there is little gain in retaining additional fac-
tors. Factor names were chosen on the basis of the highest-loading items for each factor.
Individual differencesNormality of distribution of individual variables (or within-subject differences in variables) was
assessed using the Shapiro-Wilk test, and, where appropriate, non-parametric statistics were
employed for pairwise tests.
In the fMRI sample, multivariate representational similarity estimates from all ROIs were com-
pared to overall GS avoidance using an ordinary least squares multiple linear regression model.
Mean avoidance across different trial types was z-scored within-participants, in order to gain a mea-
sure of relative GS avoidance (i.e. taking into individual variation in tendency to avoid on CS- and
CS +trials).
Individual model parameters governing value-based generalization (sA/sN) were related to varia-
bles of interest (multivariate representational similarity in the fMRI sample, self-reported psychopa-
thology in online sample) using weighted least squares multiple linear regression models. This
method produces the maximum likelihood regression estimate when noise is not constant across
measurements (i.e. data are heteroscedatic; [Carroll and Ruppert, 1988]). As the VBA toolbox yields
the variance of posterior parameter estimates as well as the mean, weights were defined as the pre-
cision of individual parameter estimates (i.e. 1/posterior variance). Regression analyses were imple-
mented in R using the function lm (psych package). Age (z-scored) and gender (binary scored as
Norbury et al. eLife 2018;7:e34779. DOI: https://doi.org/10.7554/eLife.34779 25 of 30
Research article Neuroscience

male vs female/other) information were also included in all questionnaire data regression models as
predictors of no interest. In R syntax: fit.wls = lm(sA ~ predictor(s)+ageZ + gender, weights = sA
precision)
Where candidate predictors were significantly collinear (as was the case for the questionnaire
total scores data), they were implemented in separate regression models. Multiple comparisons cor-
rection for these models was achieved via the Nyholt-Bonferroni correction (Li and Ji, 2005), which
yields a modified Bonferroni correction for non-independent (related) variables by estimating the
‘effective number of independent variables’ from the eigenvalues of their correlation matrix.
Although we collected trait anxiety data in the MRI group (in order to characterise general anxiety
levels in the sample, and screen out any individuals with undiagnosed pathologically significant anxi-
ety), we did not plan to compare individual differences in behaviour to trait anxiety in this sample, as
effect sizes from previous studies relating decision-making model parameters to psychological symp-
toms suggest this would be significantly underpowered (e.g. [Gillan et al., 2016]).
As a more robust test, we complemented our linear regression analyses with cross-validated regu-
larized regression models, where all predictors were included in a single model. Specifically, we
used least absolute shrinkage and selection operator (LASSO) regression (Tibshirani, 1996) with
leave-one-out cross-validation. This approach effectively shrinks non-significant predictors to zero,
and provides a more robust estimate of regression coefficients. This was implemented using the
glmnet package in R. In R syntax: fit.cv = cv.glmnet(y= sA, x = all predictors, alpha = 1, nfolds = N,
weights = sA precision)
AcknowledgementsThis study was funded by the Wellcome Trust (grant number 097490/Z/11/A to BS). TWR was funded
by a Wellcome Trust Senior Investigator Award (grant number 104631/Z/14/Z). The authors declare
no relevant conflicts of interest.
Additional information
Funding
Funder Grant reference number Author
Wellcome 097490/Z/11/A Ben Seymour
Wellcome 104631/Z/14/Z Trevor W Robbins
The funders had no role in study design, data collection and interpretation, or the
decision to submit the work for publication.
Author contributions
Agnes Norbury, Conceptualization, Data curation, Software, Formal analysis, Investigation, Visualiza-
tion, Methodology, Writing—original draft, Project administration, Writing—review and editing; Tre-
vor W Robbins, Conceptualization, Methodology, Writing—review and editing; Ben Seymour,
Conceptualization, Supervision, Funding acquisition, Methodology, Writing—review and editing
Author ORCIDs
Agnes Norbury http://orcid.org/0000-0002-4377-3164
Ben Seymour http://orcid.org/0000-0003-1724-5832
Ethics
Human subjects: Written, informed consent was obtained from all study volunteers. Both studies
were approved by the University of Cambridge Psychology Research Ethics Committee
(PRE.2015.101; PRE.2016.061).
Decision letter and Author response
Decision letter https://doi.org/10.7554/eLife.34779.027
Norbury et al. eLife 2018;7:e34779. DOI: https://doi.org/10.7554/eLife.34779 26 of 30
Research article Neuroscience

Author response https://doi.org/10.7554/eLife.34779.028
Additional files
Supplementary files. Supplementary file 1. Demographic information for study participants. Unless otherwise specified,
figures represent mean (SD). STAI, Spielberger State-Trait Anxiety Inventory (trait score only); AMI,
Apathy Motivation Index; OCI-R, Obsessive-Compulsive Index (Revised); PHQ9, Physician’s Health
Questionnaire 9 (a brief measure of mood disorder symptoms); BIS-11, Barratt Impulsivity Scale (ver-
sion 11); CSQ global, Cognitive Style Questionnaire (short-form) ‘cognitive globalisation’ subscale.
DOI: https://doi.org/10.7554/eLife.34779.016
. Supplementary file 2. Internal reliability of questionnaire scores in the AMT sample. STAI, Spiel-
berger State-Trait Anxiety Inventory (trait score only); AMI, Apathy Motivation Index; OCI-R, Obses-
sive-Compulsive Index (Revised); PHQ9, Physician’s Health Questionnaire 9 (a brief measure of
mood disorder symptoms); BIS-11, Barratt Impulsivity Scale (version 11); CSQ, Cognitive Style Ques-
tionnaire (short-form).
DOI: https://doi.org/10.7554/eLife.34779.017
. Supplementary file 3. Individual item loadings derived from factor analysis of questionnaire data in
the AMT sample. Item loadings are only shown above a threshold of ±0.25). Text in square brackets
is to aid interpretation of reverse-scored items.
DOI: https://doi.org/10.7554/eLife.34779.018
. Transparent reporting form
DOI: https://doi.org/10.7554/eLife.34779.019
Data availability
All relevant code for stimulus generation, data collection, and data analysis, in addition to raw
behavioural data, is available at the project’s Open Science Framework page (osf.io/25t3f). Raw
functional imaging data is deposited at openfMRI (openfmri.org/dataset/ds000249) and derived sta-
tistical maps are available at NeuroVault (neurovault.org/collections/3177).
The following datasets were generated:
Author(s) Year Dataset title Dataset URL
Database, license,and accessibilityinformation
Agnes Norbury 2017 Value generalization in humanavoidance learning
https://neurovault.org/collections/3177/
Publicly available atNeurovault (accessionno. 3177)
Agnes Norbury 2017 Value generalization in humanavoidance learning
https://osf.io/25t3f/ Publicly available atthe Open ScienceFramework
Agnes Norbury, BenSeymour
2018 Value generalization in humanavoidance learning
https://openneuro.org/datasets/ds000249/ver-sions/00002
Publicly available atOpen Neuro
ReferencesAizenberg M, Geffen MN. 2013. Bidirectional effects of aversive learning on perceptual acuity are mediated bythe sensory cortex. Nature Neuroscience 16:994–996. DOI: https://doi.org/10.1038/nn.3443, PMID: 23817548
Ang YS, Lockwood P, Apps MA, Muhammed K, Husain M. 2017. Distinct subtypes of apathy revealed by theapathy motivation index. Plos One 12:e0169938. DOI: https://doi.org/10.1371/journal.pone.0169938, PMID: 28076387
Arnaudova I, Kindt M, Fanselow M, Beckers T. 2017. Pathways towards the proliferation of avoidance in anxietyand implications for treatment. Behaviour Research and Therapy 96:3–13. DOI: https://doi.org/10.1016/j.brat.2017.04.004, PMID: 28457483
Bonnelle V, Veromann KR, Burnett Heyes S, Lo Sterzo E, Manohar S, Husain M. 2015. Characterization of rewardand effort mechanisms in apathy. Journal of Physiology-Paris 109:16–26. DOI: https://doi.org/10.1016/j.jphysparis.2014.04.002, PMID: 24747776
Norbury et al. eLife 2018;7:e34779. DOI: https://doi.org/10.7554/eLife.34779 27 of 30
Research article Neuroscience

Carroll RJ, Ruppert D. 1988. Transformation and Weighting in Regression. CRC Press . DOI: https://doi.org/10.1007/978-1-4899-2873-3
Cha J, Carlson JM, Dedora DJ, Greenberg T, Proudfit GH, Mujica-Parodi LR. 2014. Hyper-reactive human ventraltegmental area and aberrant mesocorticolimbic connectivity in overgeneralization of fear in generalized anxietydisorder. Journal of Neuroscience 34:5855–5860. DOI: https://doi.org/10.1523/JNEUROSCI.4868-13.2014,PMID: 24760845
Crump MJ, McDonnell JV, Gureckis TM. 2013. Evaluating Amazon’s mechanical turk as a tool for experimentalbehavioral research. PLoS ONE 8:e57410. DOI: https://doi.org/10.1371/journal.pone.0057410,PMID: 23516406
Daunizeau J, Adam V, Rigoux L. 2014. VBA: a probabilistic treatment of nonlinear models for neurobiologicaland behavioural data. PLoS Computational Biology 10:e1003441. DOI: https://doi.org/10.1371/journal.pcbi.1003441, PMID: 24465198
de Leeuw JR. 2015. jsPsych: a JavaScript library for creating behavioral experiments in a Web browser. BehaviorResearch Methods 47:1–12. DOI: https://doi.org/10.3758/s13428-014-0458-y, PMID: 24683129
Delgado MR, Jou RL, Ledoux JE, Phelps EA. 2009. Avoiding negative outcomes: tracking the mechanisms ofavoidance learning in humans during fear conditioning. Frontiers in Behavioral Neuroscience 3:33. DOI: https://doi.org/10.3389/neuro.08.033.2009, PMID: 19847311
Duits P, Cath DC, Lissek S, Hox JJ, Hamm AO, Engelhard IM, van den Hout MA, Baas JM. 2015. Updated meta-analysis of classical fear conditioning in the anxiety disorders. Depression and Anxiety 32:239–253.DOI: https://doi.org/10.1002/da.22353, PMID: 25703487
Dunsmoor JE, Prince SE, Murty VP, Kragel PA, LaBar KS. 2011. Neurobehavioral mechanisms of human feargeneralization. NeuroImage 55:1878–1888. DOI: https://doi.org/10.1016/j.neuroimage.2011.01.041,PMID: 21256233
Dymond S, Dunsmoor JE, Vervliet B, Roche B, Hermans D. 2015. Fear generalization in humans: systematicreview and implications for anxiety disorder research. Behavior Therapy 46:561–582. DOI: https://doi.org/10.1016/j.beth.2014.10.001, PMID: 26459838
Eldar E, Hauser TU, Dayan P, Dolan RJ. 2016. Striatal structure and function predict individual biases in learningto avoid pain. PNAS 113:4812–4817. DOI: https://doi.org/10.1073/pnas.1519829113, PMID: 27071092
Foa EB, Huppert JD, Leiberg S, Langner R, Kichic R, Hajcak G, Salkovskis PM. 2002. The obsessive-compulsiveinventory: development and validation of a short version. Psychological Assessment 14:485–496. DOI: https://doi.org/10.1037/1040-3590.14.4.485, PMID: 12501574
Fullana MA, Harrison BJ, Soriano-Mas C, Vervliet B, Cardoner N, Avila-Parcet A, Radua J. 2016. Neuralsignatures of human fear conditioning: an updated and extended meta-analysis of fMRI studies. MolecularPsychiatry 21:500–508. DOI: https://doi.org/10.1038/mp.2015.88, PMID: 26122585
Genud-Gabai R, Klavir O, Paz R. 2013. Safety signals in the primate amygdala. Journal of Neuroscience 33:17986–17994. DOI: https://doi.org/10.1523/JNEUROSCI.1539-13.2013, PMID: 24227710
Ghirlanda S, Enquist M. 2003. A century of generalization. Animal Behaviour 66:15–36. DOI: https://doi.org/10.1006/anbe.2003.2174
Ghosh S, Chattarji S. 2015. Neuronal encoding of the switch from specific to generalized fear. NatureNeuroscience 18:112–120. DOI: https://doi.org/10.1038/nn.3888, PMID: 25436666
Gillan CM, Daw ND. 2016. Taking Psychiatry Research Online. Neuron 91:19–23. DOI: https://doi.org/10.1016/j.neuron.2016.06.002, PMID: 27387647
Gillan CM, Kosinski M, Whelan R, Phelps EA, Daw ND. 2016. Characterizing a psychiatric symptom dimensionrelated to deficits in goal-directed control. eLife 5:e11305. DOI: https://doi.org/10.7554/eLife.11305, PMID: 26928075
Gillan CM, Morein-Zamir S, Urcelay GP, Sule A, Voon V, Apergis-Schoute AM, Fineberg NA, Sahakian BJ,Robbins TW. 2014. Enhanced avoidance habits in obsessive-compulsive disorder. Biological Psychiatry 75:631–638. DOI: https://doi.org/10.1016/j.biopsych.2013.02.002, PMID: 23510580
Glover GH, Li TQ, Ress D. 2000. Image-based method for retrospective correction of physiological motioneffects in fMRI: RETROICOR. Magnetic Resonance in Medicine 44:162–167. DOI: https://doi.org/10.1002/1522-2594(200007)44:1<162::AID-MRM23>3.0.CO;2-E, PMID: 10893535
Gorgolewski KJ, Auer T, Calhoun VD, Craddock RC, Das S, Duff EP, Flandin G, Ghosh SS, Glatard T, HalchenkoYO, Handwerker DA, Hanke M, Keator D, Li X, Michael Z, Maumet C, Nichols BN, Nichols TE, Pellman J, PolineJB, et al. 2016. The brain imaging data structure, a format for organizing and describing outputs ofneuroimaging experiments. Scientific Data 3:160044. DOI: https://doi.org/10.1038/sdata.2016.44,PMID: 27326542
Gorsuch RL, Nelson J. 1981. CNG scree test: an objective procedure for determining the number of factors.Annual Meeting of the Society of Multivariate Experimental Psychology.
Greenberg T, Carlson JM, Cha J, Hajcak G, Mujica-Parodi LR. 2013. Neural reactivity tracks fear generalizationgradients. Biological Psychology 92:2–8. DOI: https://doi.org/10.1016/j.biopsycho.2011.12.007,PMID: 22200657
Grewe BF, Grundemann J, Kitch LJ, Lecoq JA, Parker JG, Marshall JD, Larkin MC, Jercog PE, Grenier F, Li JZ,Luthi A, Schnitzer MJ. 2017. Neural ensemble dynamics underlying a long-term associative memory. Nature543:670–675. DOI: https://doi.org/10.1038/nature21682, PMID: 28329757
Grosso A, Santoni G, Manassero E, Renna A, Sacchetti B. 2018. A neuronal basis for fear discrimination in thelateral amygdala. Nature Communications 9:1214. DOI: https://doi.org/10.1038/s41467-018-03682-2, PMID: 29572443
Norbury et al. eLife 2018;7:e34779. DOI: https://doi.org/10.7554/eLife.34779 28 of 30
Research article Neuroscience

Grupe DW, Nitschke JB. 2013. Uncertainty and anticipation in anxiety: an integrated neurobiological andpsychological perspective. Nature Reviews Neuroscience 14:488–501. DOI: https://doi.org/10.1038/nrn3524,PMID: 23783199
Gureckis TM, Martin J, McDonnell J, Rich AS, Markant D, Coenen A, Halpern D, Hamrick JB, Chan P. 2016.psiTurk: An open-source framework for conducting replicable behavioral experiments online. BehaviorResearch Methods 48:829–842. DOI: https://doi.org/10.3758/s13428-015-0642-8, PMID: 26428910
Hanson HM. 1959. Effects of discrimination training on stimulus generalization. Journal of ExperimentalPsychology 58:321–334. DOI: https://doi.org/10.1037/h0042606, PMID: 13851902
Harvie DS, Moseley GL, Hillier SL, Meulders A. 2017. Classical conditioning differences associated with chronicpain: a systematic review. The Journal of Pain 18:889–898. DOI: https://doi.org/10.1016/j.jpain.2017.02.430,PMID: 28385510
Kahnt T, Park SQ, Burke CJ, Tobler PN. 2012. How glitter relates to gold: similarity-dependent reward predictionerrors in the human striatum. Journal of Neuroscience 32:16521–16529. DOI: https://doi.org/10.1523/JNEUROSCI.2383-12.2012, PMID: 23152634
Kasper L, Bollmann S, Diaconescu AO, Hutton C, Heinzle J, Iglesias S, Hauser TU, Sebold M, Manjaly ZM,Pruessmann KP, Stephan KE. 2017. The PhysIO toolbox for modeling physiological noise in fMRI Data. Journalof Neuroscience Methods 276:56–72. DOI: https://doi.org/10.1016/j.jneumeth.2016.10.019, PMID: 27832957
Kriegeskorte N, Formisano E, Sorger B, Goebel R. 2007. Individual faces elicit distinct response patterns inhuman anterior temporal cortex. PNAS 104:20600–20605. DOI: https://doi.org/10.1073/pnas.0705654104,PMID: 18077383
Kriegeskorte N, Mur M, Bandettini P. 2008. Representational similarity analysis - connecting the branches ofsystems neuroscience. Frontiers in Systems Neuroscience 2:4. DOI: https://doi.org/10.3389/neuro.06.004.2008,PMID: 19104670
Krypotos AM, Effting M, Kindt M, Beckers T. 2015. Avoidance learning: a review of theoretical models andrecent developments. Frontiers in Behavioral Neuroscience 9:189. DOI: https://doi.org/10.3389/fnbeh.2015.00189, PMID: 26257618
Laufer O, Israeli D, Paz R. 2016. Behavioral and neural mechanisms of overgeneralization in anxiety. CurrentBiology 26:713–722. DOI: https://doi.org/10.1016/j.cub.2016.01.023, PMID: 26948881
Laufer O, Paz R. 2012. Monetary loss alters perceptual thresholds and compromises future decisions viaamygdala and prefrontal networks. Journal of Neuroscience 32:6304–6311. DOI: https://doi.org/10.1523/JNEUROSCI.6281-11.2012, PMID: 22553036
Le Pelley ME. 2004. The role of associative history in models of associative learning: a selective review and ahybrid model. The Quarterly Journal of Experimental Psychology Section B 57:193–243. DOI: https://doi.org/10.1080/02724990344000141
LeDoux JE, Moscarello J, Sears R, Campese V. 2017. The birth, death and resurrection of avoidance: areconceptualization of a troubled paradigm. Molecular Psychiatry 22:24–36. DOI: https://doi.org/10.1038/mp.2016.166, PMID: 27752080
Li J, Ji L. 2005. Adjusting multiple testing in multilocus analyses using the eigenvalues of a correlation matrix.Heredity 95:221–227. DOI: https://doi.org/10.1038/sj.hdy.6800717, PMID: 16077740
Likhtik E, Stujenske JM, Topiwala MA, Harris AZ, Gordon JA. 2014. Prefrontal entrainment of amygdala activitysignals safety in learned fear and innate anxiety. Nature Neuroscience 17:106–113. DOI: https://doi.org/10.1038/nn.3582, PMID: 24241397
Lissek S, Bradford DE, Alvarez RP, Burton P, Espensen-Sturges T, Reynolds RC, Grillon C. 2014. Neuralsubstrates of classically conditioned fear-generalization in humans: a parametric fMRI study. Social Cognitiveand Affective Neuroscience 9:1134–1142. DOI: https://doi.org/10.1093/scan/nst096, PMID: 23748500
Martin A, Rief W, Klaiberg A, Braehler E. 2006. Validity of the brief patient health questionnaire mood scale(PHQ-9) in the general population. General Hospital Psychiatry 28:71–77. DOI: https://doi.org/10.1016/j.genhosppsych.2005.07.003, PMID: 16377369
Meins E, McCarthy-Jones S, Fernyhough C, Lewis G, Bentall RP, Alloy LB. 2012. Assessing negative cognitivestyle: development and validation of a short-form version of the cognitive style questionnaire. Personality andIndividual Differences 52:581–585. DOI: https://doi.org/10.1016/j.paid.2011.11.026, PMID: 22389545
Mumford JA, Poline JB, Poldrack RA. 2015. Orthogonalization of regressors in FMRI models. PLoS One 10:e0126255. DOI: https://doi.org/10.1371/journal.pone.0126255, PMID: 25919488
Nili H, Wingfield C, Walther A, Su L, Marslen-Wilson W, Kriegeskorte N. 2014. A toolbox for representationalsimilarity analysis. PLoS Computational Biology 10:e1003553. DOI: https://doi.org/10.1371/journal.pcbi.1003553, PMID: 24743308
Onat S, Buchel C. 2015. The neuronal basis of fear generalization in humans. Nature Neuroscience 18:1811–1818. DOI: https://doi.org/10.1038/nn.4166, PMID: 26571459
Palminteri S, Justo D, Jauffret C, Pavlicek B, Dauta A, Delmaire C, Czernecki V, Karachi C, Capelle L, Durr A,Pessiglione M. 2012. Critical roles for anterior insula and dorsal striatum in punishment-based avoidancelearning. Neuron 76:998–1009. DOI: https://doi.org/10.1016/j.neuron.2012.10.017, PMID: 23217747
Pasternak T, Greenlee MW. 2005. Working memory in primate sensory systems. Nature Reviews Neuroscience 6:97–107. DOI: https://doi.org/10.1038/nrn1603, PMID: 15654324
Patton JH, Stanford MS, Barratt ES. 1995. Factor structure of the Barratt impulsiveness scale. Journal of ClinicalPsychology 51:768–774. DOI: https://doi.org/10.1002/1097-4679(199511)51:6<768::AID-JCLP2270510607>3.0.CO;2-1, PMID: 8778124
Norbury et al. eLife 2018;7:e34779. DOI: https://doi.org/10.7554/eLife.34779 29 of 30
Research article Neuroscience

Pearson RM, Heron J, Button K, Bentall RP, Fernyhough C, Mahedy L, Bowes L, Lewis G. 2015. Cognitive stylesand future depressed mood in early adulthood: the importance of global attributions. Journal of AffectiveDisorders 171:60–67. DOI: https://doi.org/10.1016/j.jad.2014.08.057, PMID: 25285900
Resnik J, Paz R. 2015. Fear generalization in the primate amygdala. Nature Neuroscience 18:188–190.DOI: https://doi.org/10.1038/nn.3900, PMID: 25531573
Resnik J, Sobel N, Paz R. 2011. Auditory aversive learning increases discrimination thresholds. NatureNeuroscience 14:791–796. DOI: https://doi.org/10.1038/nn.2802, PMID: 21552275
Rigoux L, Stephan KE, Friston KJ, Daunizeau J. 2014. Bayesian model selection for group studies - revisited.NeuroImage 84:971–985. DOI: https://doi.org/10.1016/j.neuroimage.2013.08.065, PMID: 24018303
Rogan MT, Leon KS, Perez DL, Kandel ER. 2005. Distinct neural signatures for safety and danger in the amygdalaand striatum of the mouse. Neuron 46:309–320. DOI: https://doi.org/10.1016/j.neuron.2005.02.017, PMID: 15848808
Sasaki Y, Nanez JE, Watanabe T. 2010. Advances in visual perceptual learning and plasticity. Nature ReviewsNeuroscience 11:53–60. DOI: https://doi.org/10.1038/nrn2737, PMID: 19953104
Schechtman E, Laufer O, Paz R. 2010. Negative valence widens generalization of learning. Journal ofNeuroscience 30:10460–10464. DOI: https://doi.org/10.1523/JNEUROSCI.2377-10.2010, PMID: 20685988
Seymour B, Daw ND, Roiser JP, Dayan P, Dolan R. 2012. Serotonin selectively modulates reward value in humandecision-making. Journal of Neuroscience 32:5833–5842. DOI: https://doi.org/10.1523/JNEUROSCI.0053-12.2012, PMID: 22539845
Seymour B, O’Doherty JP, Dayan P, Koltzenburg M, Jones AK, Dolan RJ, Friston KJ, Frackowiak RS2004.Temporal difference models describe higher-order learning in humans. Nature 429:664–667. DOI: https://doi.org/10.1038/nature02581, PMID: 15190354
Shalev L, Paz R, Avidan G. 2018. Visual aversive learning compromises sensory discrimination. The Journal ofNeuroscience 38:2766–2779. DOI: https://doi.org/10.1523/JNEUROSCI.0889-17.2017, PMID: 29439168
Slivinske AJ, Hall JF. 1960. The discriminability of tones used to test stimulus-generalization. The AmericanJournal of Psychology 73:581–586. DOI: https://doi.org/10.2307/1419947
Spielberger CD, Gorsuch RL, Lushene RE. 1970. The State-Trait Anxiety Inventory: Test Manual for Form X. PaloAlto, CA: Consulting Psychologists Press.
Struyf D, Zaman J, Vervliet B, Van Diest I. 2015. Perceptual discrimination in fear generalization: mechanistic andclinical implications. Neuroscience & Biobehavioral Reviews 59:201–207. DOI: https://doi.org/10.1016/j.neubiorev.2015.11.004, PMID: 26571437
Sutton RS, Barto AG. 1998. Reinforcement Learning: An Introduction. MIT Press.Tibshirani R. 1996. Regression Shrinkage and Selection via the Lasso. Journal of the Royal Statistical Society.Series B 58:267–288.
Treanor M, Barry TJ. 2017. Treatment of avoidance behavior as an adjunct to exposure therapy: Insights frommodern learning theory. Behaviour Research and Therapy 96:30–36. DOI: https://doi.org/10.1016/j.brat.2017.04.009, PMID: 28477845
Tzourio-Mazoyer N, Landeau B, Papathanassiou D, Crivello F, Etard O, Delcroix N, Mazoyer B, Joliot M. 2002.Automated anatomical labeling of activations in SPM using a macroscopic anatomical parcellation of the MNIMRI single-subject brain. NeuroImage 15:273–289. DOI: https://doi.org/10.1006/nimg.2001.0978, PMID: 11771995
van Dam LC, Ernst MO. 2015. Mapping shape to visuomotor mapping: learning and generalisation ofsensorimotor behaviour based on contextual information. PLoS Computational Biology 11:e1004172.DOI: https://doi.org/10.1371/journal.pcbi.1004172, PMID: 25815787
Vlaeyen JW, Linton SJ. 2012. Fear-avoidance model of chronic musculoskeletal pain: 12 years on. Pain 153:1144–1147. DOI: https://doi.org/10.1016/j.pain.2011.12.009, PMID: 22321917
Walther A, Nili H, Ejaz N, Alink A, Kriegeskorte N, Diedrichsen J. 2016. Reliability of dissimilarity measures formulti-voxel pattern analysis. NeuroImage 137. DOI: https://doi.org/10.1016/j.neuroimage.2015.12.012,PMID: 26707889
Weinberger NM. 2007. Associative representational plasticity in the auditory cortex: a synthesis of twodisciplines. Learning & Memory 14:1–16. DOI: https://doi.org/10.1101/lm.421807, PMID: 17202426
Wichmann FA, Hill NJ. 2001. The psychometric function: I. Fitting, sampling, and goodness of fit. Perception &Psychophysics 63:1293–1313. DOI: https://doi.org/10.3758/BF03194544, PMID: 11800458
Wigestrand MB, Schiff HC, Fyhn M, LeDoux JE, Sears RM. 2017. Primary auditory cortex regulates threatmemory specificity. Learning & Memory 24:55–58. DOI: https://doi.org/10.1101/lm.044362.116, PMID: 27980076
Norbury et al. eLife 2018;7:e34779. DOI: https://doi.org/10.7554/eLife.34779 30 of 30
Research article Neuroscience
Related Documents