1 Danny Graham Director, Privately Financed Projects NSW Treasury Value For Money in PPP Procurement

Welcome message from author
This document is posted to help you gain knowledge. Please leave a comment to let me know what you think about it! Share it to your friends and learn new things together.
Transcript

1
Danny Graham
Director, Privately Financed Projects
NSW Treasury
Value For Money
in PPP Procurement

Outline
1. New South Wales, Australia
2. Procurement Options
3. PPP Framework
4. Public Sector Comparator
5. Benchmarking Studies
6. Post Implementation Reviews
7. Contract Management
8. Conclusion
2

1. New South Wales, Australia
3
Source: Geoscience Australia, www.ga.gov.au
2009
Spain $1,438
Australia $920
Netherlands $790
Indonesia $515
Sweden $398
Norway $369
New South Wales* $367
Ireland $227
Portugal $220
Hong Kong SAR $209
Singapore $163
New Zealand $110
Source: International Monetary Fund, World Economic Outlook Database, October 2009
* Source: ABS Cat. No. 5220 Australian National Accounts: State Accounts ; AUD$/US$ = 0.9115
Gross Domestic Product
US$bn

2. Investment vs. Procurement Decision
Investment Decision – should we buy the Project?
Cost benefit analysis
Prioritisation within State Asset Acquisition Program
Projects must undergo standard investment appraisals and be
approved and funded for conventional procurement, before a
decision is taken to pursue PPP procurement
Procurement Decision – what’s the best way of buying?
Value for Money (‘VFM’) assessment based on quality and cost
Public interest evaluation, procurement plan, preliminary
accounting treatment
4

5
2. Procurement Options
Which method of procurement?
Value
For
Money
PPPs
Large, complex and long
term projects
Capacity to allocate
appropriate significant risk
to the private sector
Capacity to transfer
significant non-core
services to the private
sector
Design and Construction
Operate and Maintain
Alliance
Build Own Operate
Managing contractor
Traditional
Procurement

2. Alliance (or Partnering) Contracting
Alliance contracting is a co-operative model characterised
by openness, trust and an alignment of interests, and
incorporates
risk sharing
no blame / no dispute / no legally binding contract
an alliance board, comprising representatives of the
Government and contractor
Most risks remain with the Government
Contractors are likely to bid on projects because of lower
liability exposures and guaranteed cost plus approach
6

7
2. Procurement Options
“PPPs remain the least preferred procurement method…– reflecting
the high cost of participation?”
Procurement preferences of the Australian Construction Industry
Source: Davis Langdon, Construction Sentiment, Findings Report 11, March 2010
8
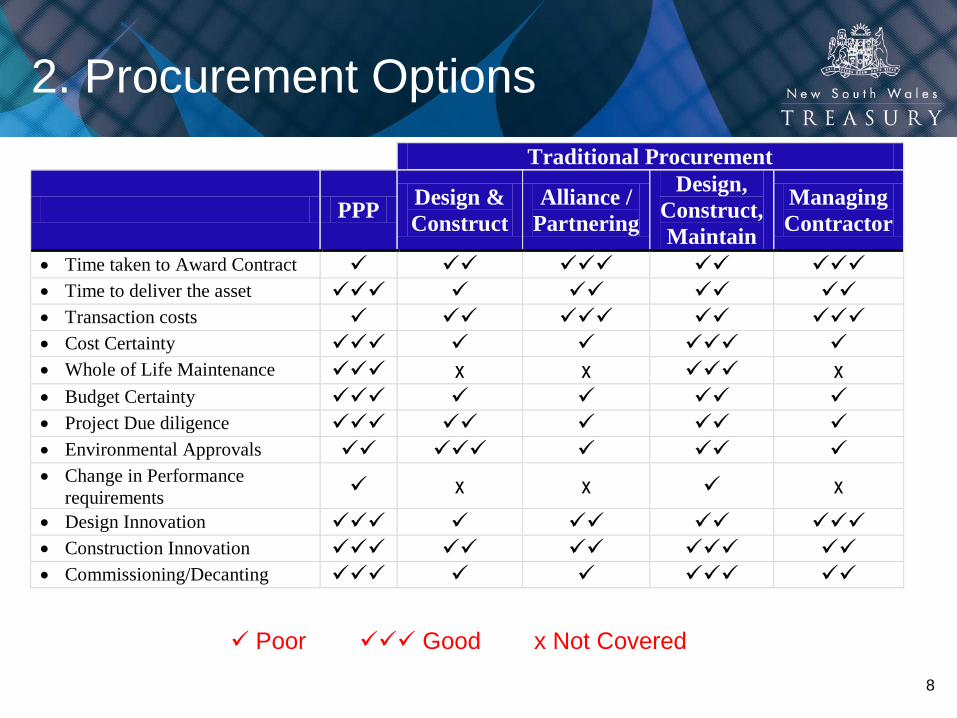
2. Procurement Options
Traditional Procurement
PPP Design &
Construct
Alliance /
Partnering
Design,
Construct,
Maintain
Managing
Contractor
Time taken to Award Contract Time to deliver the asset Transaction costs Cost Certainty Whole of Life Maintenance x x x Budget Certainty Project Due diligence Environmental Approvals Change in Performance
requirements x x x
Design Innovation Construction Innovation Commissioning/Decanting
Poor Good x Not Covered
9
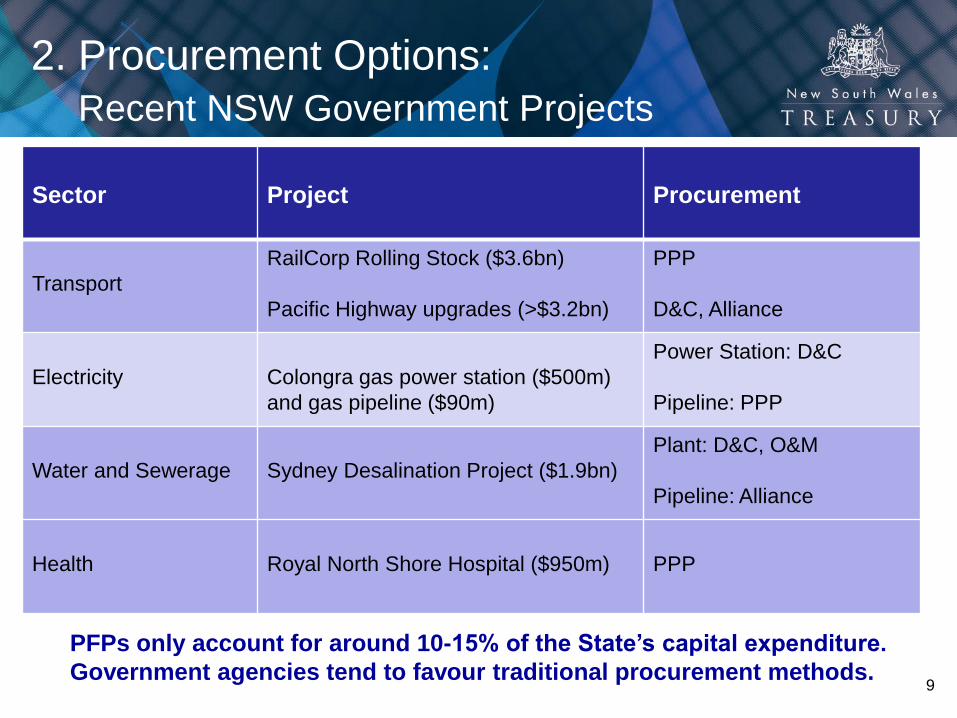
2. Procurement Options:
Recent NSW Government Projects
PFPs only account for around 10-15% of the State’s capital expenditure.
Government agencies tend to favour traditional procurement methods.
Sector
Project
Procurement
Transport
RailCorp Rolling Stock ($3.6bn)
Pacific Highway upgrades (>$3.2bn)
PPP
D&C, Alliance
Electricity
Colongra gas power station ($500m)
and gas pipeline ($90m)
Power Station: D&C
Pipeline: PPP
Water and Sewerage
Sydney Desalination Project ($1.9bn)
Plant: D&C, O&M
Pipeline: Alliance
Health
Royal North Shore Hospital ($950m)
PPP
3. PPP Framework: PPP Policy
Value For Money (‘VFM’) is the Treasury objective
Public sector comparator: main VFM quantitative test
Other qualitative factors are also evaluated e.g. build quality,
innovation in design, etc
Risk transfer assists in achieving VFM, with risks being
transferred to the party best capable of managing them
PPP is only one of a number of procurement options – not used
to achieve off-balance sheet financing
10

3. PPP Framework: Approval
Public Authorities (Financial Arrangements) Act 1987 (NSW)
The PAFA Act contains the legislative basis through which the
various arms of government are authorised to enter into PPP – i.e.
a ‘Joint Financing Arrangement’ (‘JFA’)
Part 2B of the PAFA Act regulates JFAs, and section 20 gives a
Public Authority the power to enter into a JFA:
11
An authority may enter a joint financing arrangement, on the
recommendation of the Minister for the authority, and with the
written approval of the Treasurer specifically given in the case of
each arrangement.

3. PPP Framework: Guidelines
The Council of Australian Governments (‘COAG’) agreed to new
National PPP policy and guidelines for PPPs in November 2008
The National policy and guidelines builds on NSW’s and Victoria’s
existing PPP frameworks
A suite of six policy documents have been developed, and are now
effective across the country - they include:
12
Procurement Options Analysis Public Sector Comparator Guidance
Practitioners’ Guide Discount Rate Methodology Guidance
Commercial Principals for Social Infrastructure Jurisdictional Requirements
4. Public Sector Comparator
PPP project must demonstrate it will save money
compared to a publicly financed alternative
The policy framework mandates that a Public Sector
Comparator (‘PSC’) is required to be developed
Assessing the PPP bids against the PSC is a way of
testing whether the PPP would provide better VFM than
traditional procurement
13
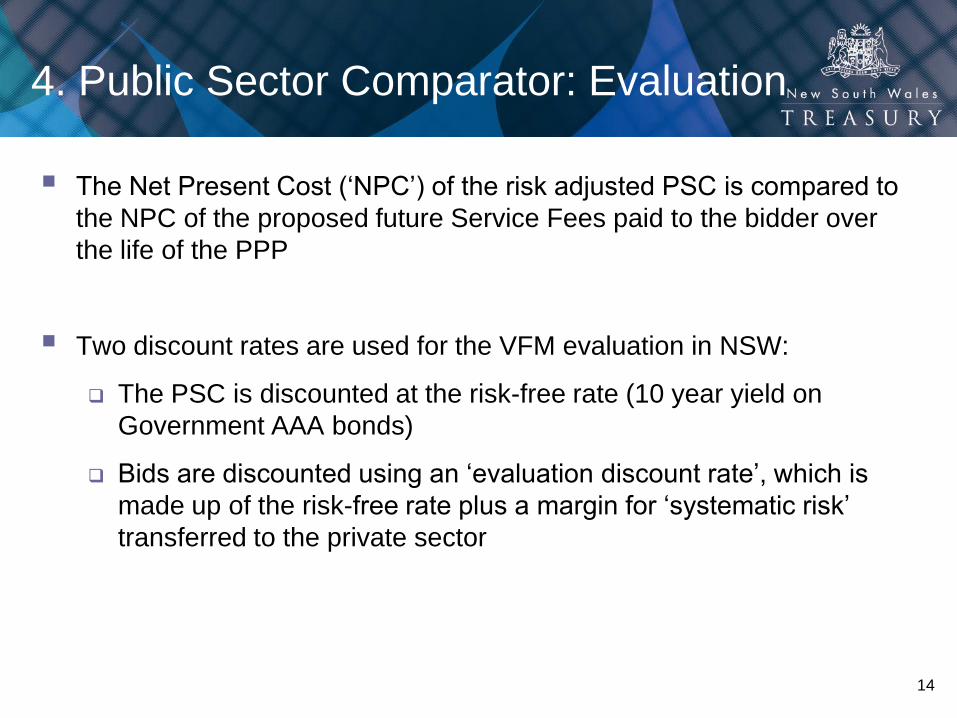
4. Public Sector Comparator: Evaluation
The Net Present Cost (‘NPC’) of the risk adjusted PSC is compared to
the NPC of the proposed future Service Fees paid to the bidder over
the life of the PPP
Two discount rates are used for the VFM evaluation in NSW:
The PSC is discounted at the risk-free rate (10 year yield on
Government AAA bonds)
Bids are discounted using an ‘evaluation discount rate’, which is
made up of the risk-free rate plus a margin for ‘systematic risk’
transferred to the private sector
14
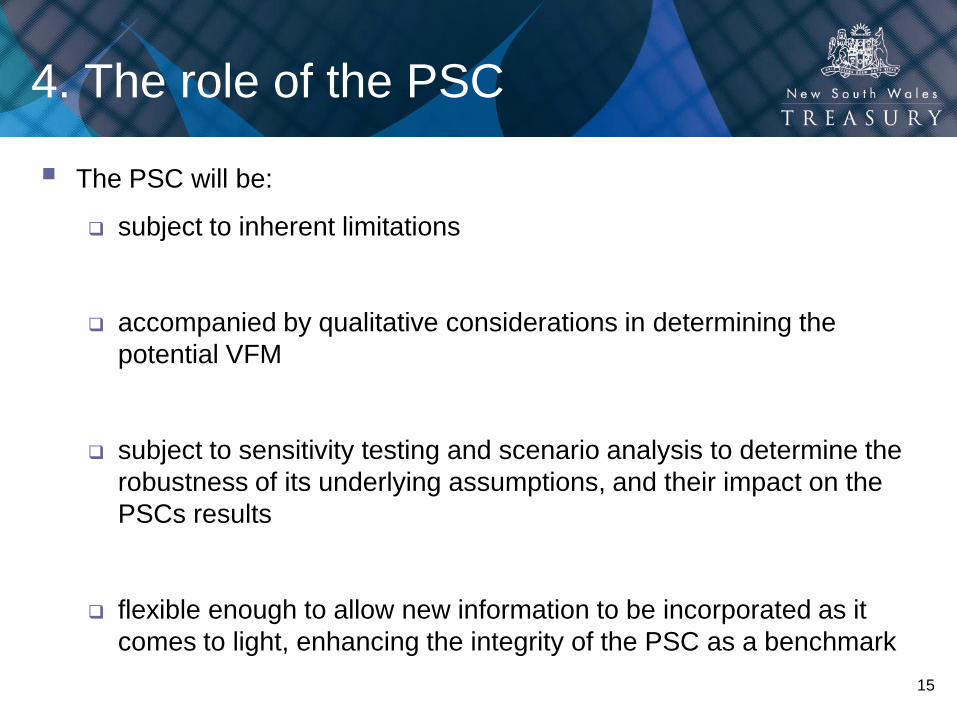
4. The role of the PSC
The PSC will be:
subject to inherent limitations
accompanied by qualitative considerations in determining the
potential VFM
subject to sensitivity testing and scenario analysis to determine the
robustness of its underlying assumptions, and their impact on the
PSCs results
flexible enough to allow new information to be incorporated as it
comes to light, enhancing the integrity of the PSC as a benchmark
15
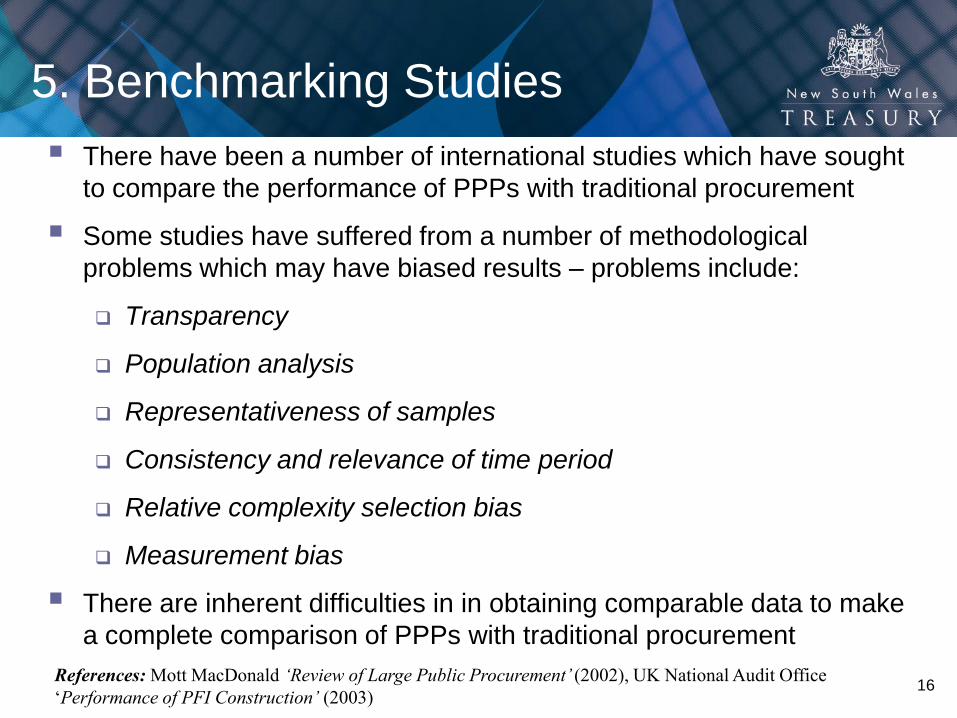
5. Benchmarking Studies
There have been a number of international studies which have sought
to compare the performance of PPPs with traditional procurement
Some studies have suffered from a number of methodological
problems which may have biased results – problems include:
Transparency
Population analysis
Representativeness of samples
Consistency and relevance of time period
Relative complexity selection bias
Measurement bias
There are inherent difficulties in in obtaining comparable data to make
a complete comparison of PPPs with traditional procurement
16 References: Mott MacDonald ‘Review of Large Public Procurement’ (2002), UK National Audit Office
‘Performance of PFI Construction’ (2003)
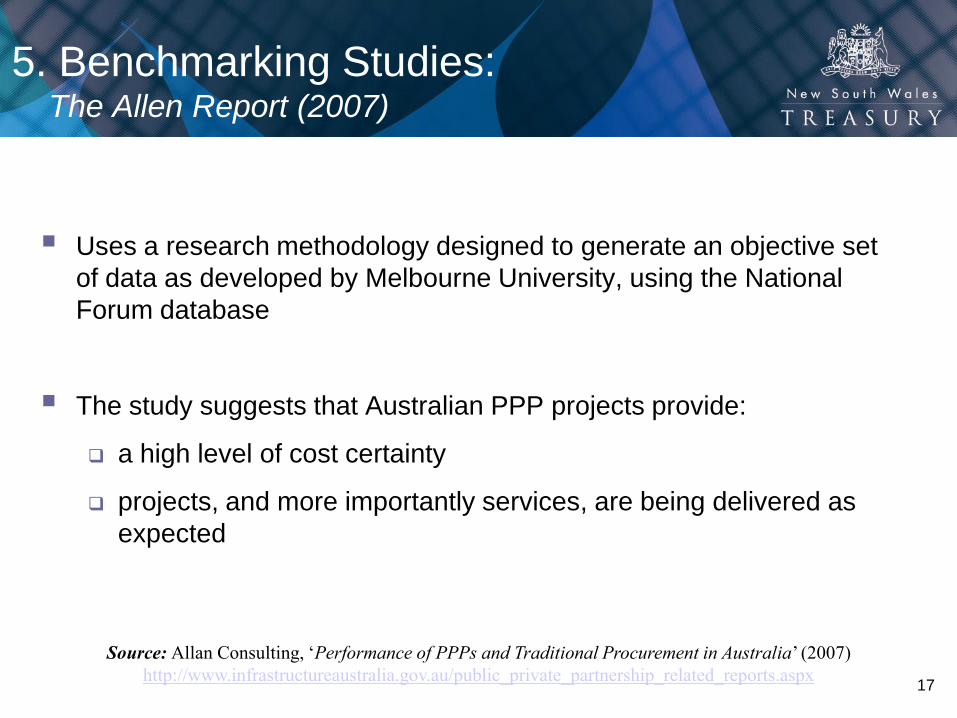
5. Benchmarking Studies: The Allen Report (2007)
Uses a research methodology designed to generate an objective set
of data as developed by Melbourne University, using the National
Forum database
The study suggests that Australian PPP projects provide:
a high level of cost certainty
projects, and more importantly services, are being delivered as
expected
17
Source: Allan Consulting, ‘Performance of PPPs and Traditional Procurement in Australia’ (2007)
http://www.infrastructureaustralia.gov.au/public_private_partnership_related_reports.aspx
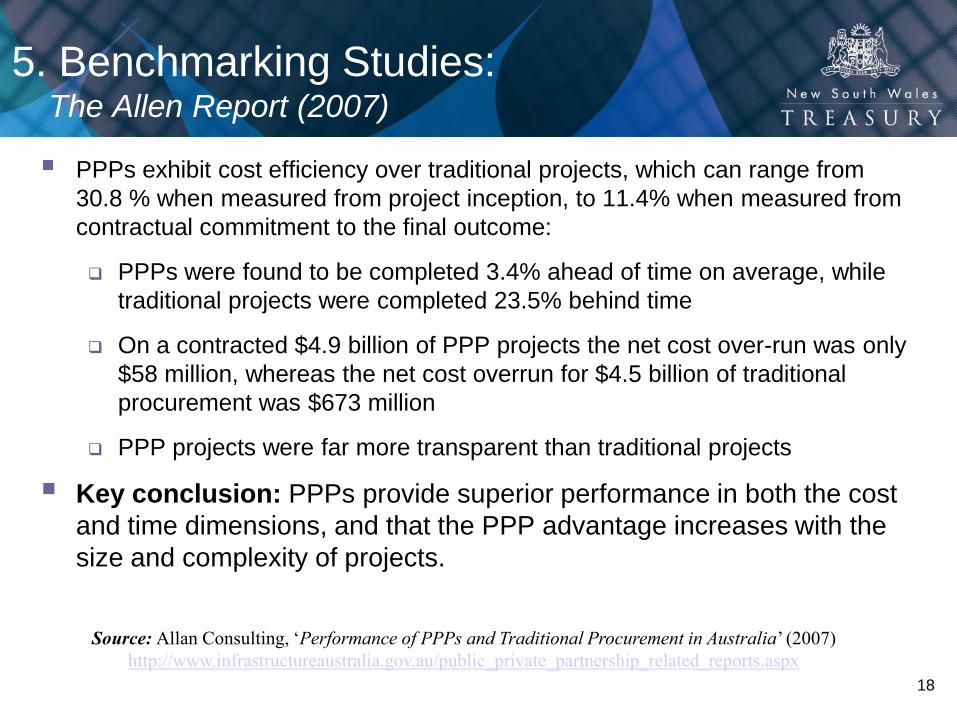
5. Benchmarking Studies: The Allen Report (2007)
PPPs exhibit cost efficiency over traditional projects, which can range from
30.8 % when measured from project inception, to 11.4% when measured from
contractual commitment to the final outcome:
PPPs were found to be completed 3.4% ahead of time on average, while
traditional projects were completed 23.5% behind time
On a contracted $4.9 billion of PPP projects the net cost over-run was only
$58 million, whereas the net cost overrun for $4.5 billion of traditional
procurement was $673 million
PPP projects were far more transparent than traditional projects
Key conclusion: PPPs provide superior performance in both the cost
and time dimensions, and that the PPP advantage increases with the
size and complexity of projects.
18
Source: Allan Consulting, ‘Performance of PPPs and Traditional Procurement in Australia’ (2007)
http://www.infrastructureaustralia.gov.au/public_private_partnership_related_reports.aspx
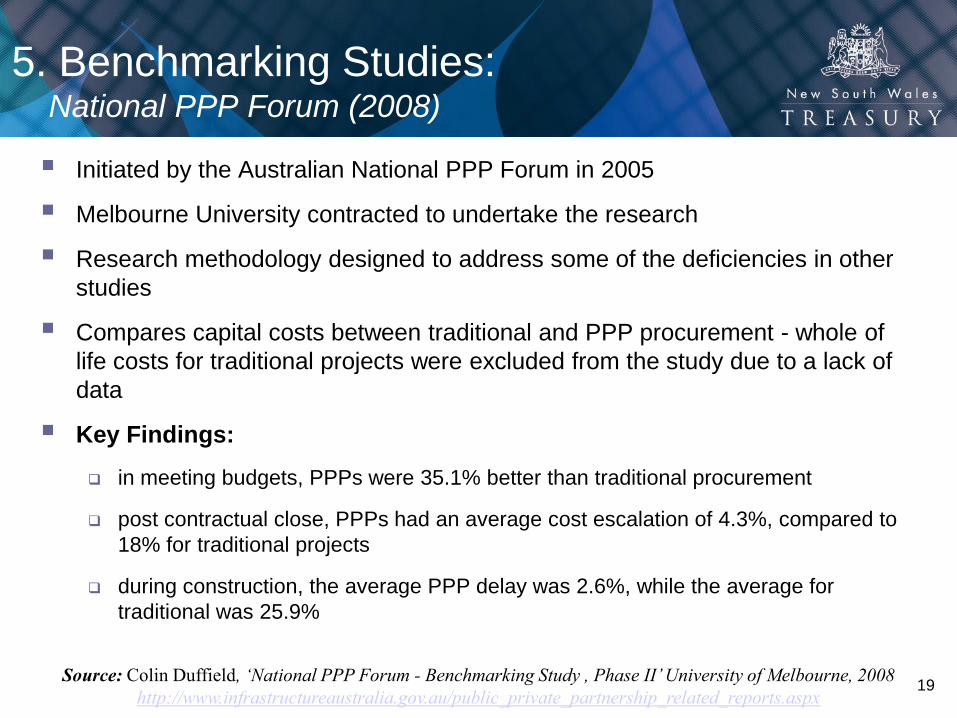
5. Benchmarking Studies: National PPP Forum (2008)
Initiated by the Australian National PPP Forum in 2005
Melbourne University contracted to undertake the research
Research methodology designed to address some of the deficiencies in other
studies
Compares capital costs between traditional and PPP procurement - whole of
life costs for traditional projects were excluded from the study due to a lack of
data
Key Findings:
in meeting budgets, PPPs were 35.1% better than traditional procurement
post contractual close, PPPs had an average cost escalation of 4.3%, compared to
18% for traditional projects
during construction, the average PPP delay was 2.6%, while the average for
traditional was 25.9%
19
Source: Colin Duffield, ‘National PPP Forum - Benchmarking Study , Phase II’ University of Melbourne, 2008
http://www.infrastructureaustralia.gov.au/public_private_partnership_related_reports.aspx

5. Benchmarking Studies Alliancing:
In Pursuit of Additional Value (2009)
20
A study aimed at determining the rationale for the increased use of alliancing,
and whether VFM could be enhanced
Detailed benchmarking study of alliancing across Australia undertaken by
Melbourne University, and investigates whether alliancing delivers incremental
VFM against other forms of procurement
Approximately 30% of all Australian State Government capital programs are
delivered via alliancing
The study found that the initial Total Outturn Cost (‘TOC’) estimates were 35-
45% higher than the business case cost estimate. The final TOC on average
increased 5-10% on the initial TOC
The report indicated PPPs provide the greatest cost certainty at the business
case stage, followed by traditional procurement, with alliancing providing the
least cost certainty

5. Benchmarking Studies: In Pursuit of Additional Value (2009)
21 Source: DT&F, ‘In Pursuit of Additional Value: a benchmarking study into additional value’ (2009)
http://www.nswprocurement.com.au/Government-Procurement-Frameworks/Construction/Framework/Project-Alliancing.aspx
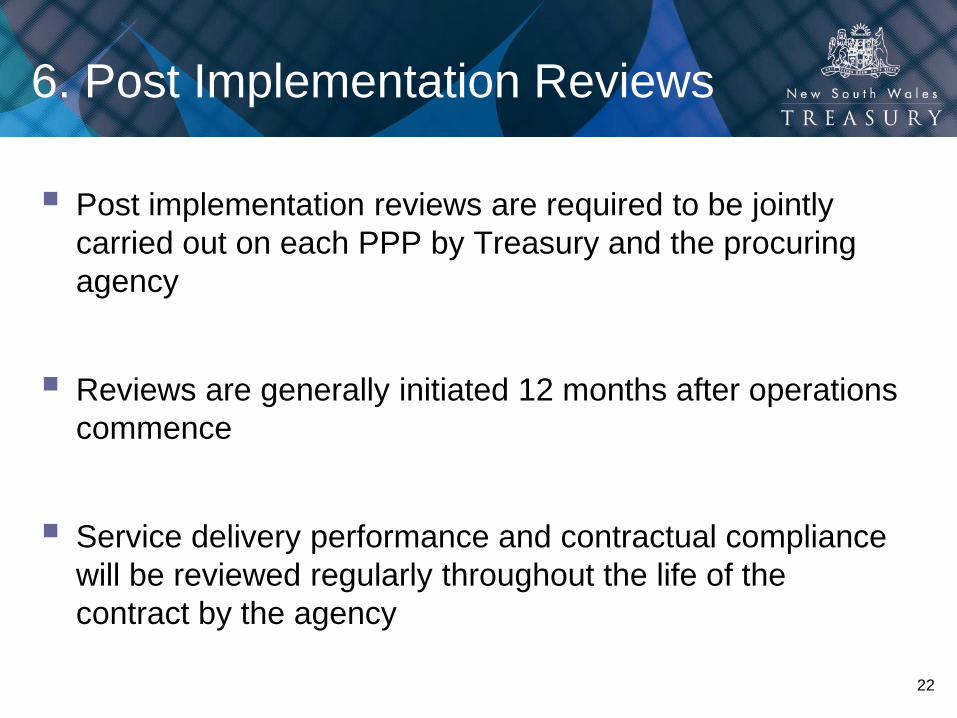
6. Post Implementation Reviews
Post implementation reviews are required to be jointly
carried out on each PPP by Treasury and the procuring
agency
Reviews are generally initiated 12 months after operations
commence
Service delivery performance and contractual compliance
will be reviewed regularly throughout the life of the
contract by the agency
22

7. Contract Management
VFM outcomes are contingent on effective contract management over
the concession term
Poor contract management can result in higher costs, wasted
resources, impaired performance and public concern, hence PPPs
require careful oversight and regular audits
NSW Treasury hosts quarterly contract management working groups,
where PPP contract managers discuss and share knowledge on
current issues
23
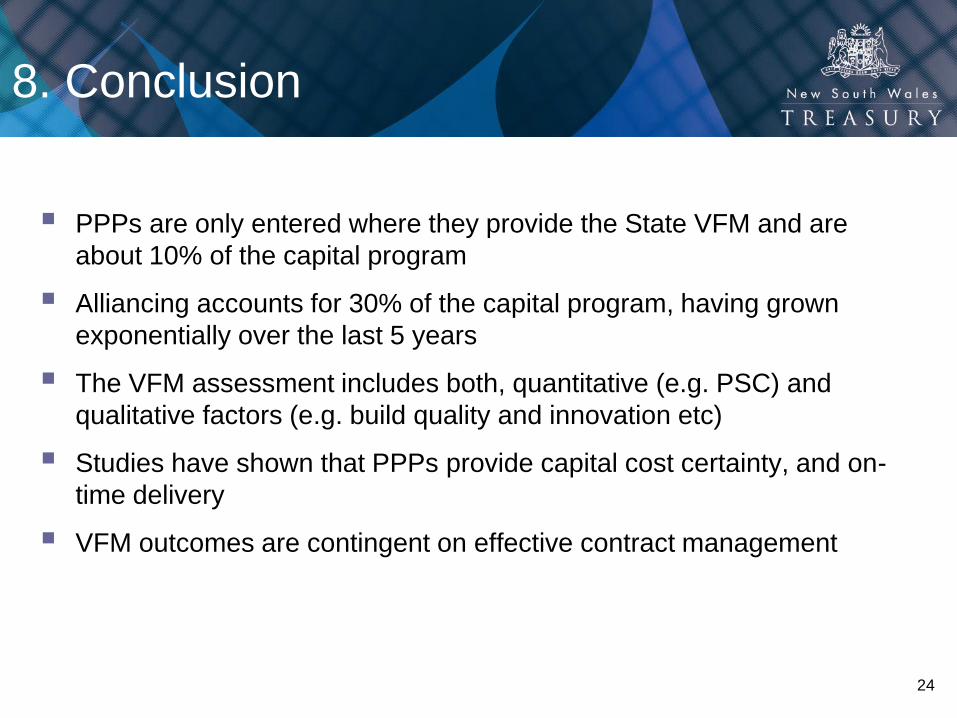
8. Conclusion
PPPs are only entered where they provide the State VFM and are
about 10% of the capital program
Alliancing accounts for 30% of the capital program, having grown
exponentially over the last 5 years
The VFM assessment includes both, quantitative (e.g. PSC) and
qualitative factors (e.g. build quality and innovation etc)
Studies have shown that PPPs provide capital cost certainty, and on-
time delivery
VFM outcomes are contingent on effective contract management
24

25
Questions?
Related Documents