Research article Value chain analysis of potato in Farta District of South Gondar Zone, Amhara National Regional State of Ethiopia Gedefaw Kindu Wubet a, * , Lemma Zemedu b, ** , Bosena Tegegne c, *** a Debre Tabor University, Debre Tabor, Ethiopia b Debre Zeit Research Institute, Ethiopia c Bahirdar University, Ethiopia ARTICLE INFO Keywords: Farta district Potato Value chain Value chain map Value chain actors Household head Heckman two-stage ABSTRACT Potatoes are the world's most important root and tuber crop. It is grown in over 125 countries and consumed by over a billion people daily. Millions of people in impoverished countries rely on potatoes product to their survival. Today, developing countries are the world's major producers and distributors of potatoes and potato products. Potato can be effective produce for allowing smallholder families to achieve their food security. Ethiopia has probably the maximum prospective country for potato production. However, in Ethiopia, various factors influence potato production and commercialization. It is the main tuber crop produced in Farta District. Potato production and value chain status are not studied well. Hence the main aim of this study was to evaluate the value chains of potatoes in the Farta district, Ethiopia. 123 sample potato farmers were chosen using a two-stage random sam- pling technique in four kebeles. Descriptive, inferential, value chain approach and econometrics analysis were employed. In addition, Heckman's two-stage selection econometrics model was employed to analyze the de- terminants of potato market participation and sales quantity. Producers, traders, chain supports, chain enablers, and final consumers were the main value chain actors for potato in the study area. Wholesalers control the potato value chain due to their finances advantage. Probit model estimation result provides that: distance to the nearby market, family size, oxen owned by farmers, market information, land size allocated for potato production, and quantity of inorganic fertilizer were the significant variables affecting the decision to market participation positively except family size. The OLS estimation result provides that: the education level of the farmers, farming experience, the number of extension contact, the land size allocated for potatoes, and the quantity of inorganic fertilizer is the significant variables influencing the amount of potato market supply positively. The main con- straints for potato production and commercialization in study area were: Shortage of improved seed, lack of capacity building training to the post-harvest management approach, price fluctuation, shortage of market in- formation, absence of policy framework in price-setting strategy was produced and marketing constraints of potatoes. Therefore, the study suggests that; increasing access to farm inputs, introducing new and improved crop varieties, establishing suitable post-harvest management facilities. In addition, follow up misconduct practice for price-setting strategies, strengthening market information service, facilitating conditions that can promote the smallholder farmers for participating in the market and minimize those constraints which impede the complete value chain in potato production and development. * Corresponding author. ** Corresponding author. *** Corresponding author. E-mail addresses: [email protected] (G.K. Wubet), [email protected] (L. Zemedu), [email protected] (B. Tegegne). Contents lists available at ScienceDirect Heliyon journal homepage: www.cell.com/heliyon https://doi.org/10.1016/j.heliyon.2022.e09142 Received 13 October 2021; Received in revised form 3 January 2022; Accepted 14 March 2022 2405-8440/© 2022 The Author(s). Published by Elsevier Ltd. This is an open access article under the CC BY-NC-ND license (http://creativecommons.org/licenses/by- nc-nd/4.0/). Heliyon 8 (2022) e09142

Welcome message from author
This document is posted to help you gain knowledge. Please leave a comment to let me know what you think about it! Share it to your friends and learn new things together.
Transcript
Heliyon 8 (2022) e09142
Contents lists available at ScienceDirect
Heliyon
journal homepage: www.cell.com/heliyon
Research article
Value chain analysis of potato in Farta District of South Gondar Zone,Amhara National Regional State of Ethiopia
Gedefaw Kindu Wubet a,*, Lemma Zemedu b,**, Bosena Tegegne c,***
a Debre Tabor University, Debre Tabor, Ethiopiab Debre Zeit Research Institute, Ethiopiac Bahirdar University, Ethiopia
A R T I C L E I N F O
Keywords:Farta districtPotatoValue chainValue chain mapValue chain actorsHousehold headHeckman two-stage
* Corresponding author.** Corresponding author.*** Corresponding author.
E-mail addresses: [email protected]
https://doi.org/10.1016/j.heliyon.2022.e09142Received 13 October 2021; Received in revised for2405-8440/© 2022 The Author(s). Published by Elsnc-nd/4.0/).
A B S T R A C T
Potatoes are the world's most important root and tuber crop. It is grown in over 125 countries and consumed byover a billion people daily. Millions of people in impoverished countries rely on potatoes product to their survival.Today, developing countries are the world's major producers and distributors of potatoes and potato products.Potato can be effective produce for allowing smallholder families to achieve their food security. Ethiopia hasprobably the maximum prospective country for potato production. However, in Ethiopia, various factors influencepotato production and commercialization. It is the main tuber crop produced in Farta District. Potato productionand value chain status are not studied well. Hence the main aim of this study was to evaluate the value chains ofpotatoes in the Farta district, Ethiopia. 123 sample potato farmers were chosen using a two-stage random sam-pling technique in four kebeles. Descriptive, inferential, value chain approach and econometrics analysis wereemployed. In addition, Heckman's two-stage selection econometrics model was employed to analyze the de-terminants of potato market participation and sales quantity. Producers, traders, chain supports, chain enablers,and final consumers were the main value chain actors for potato in the study area. Wholesalers control the potatovalue chain due to their finances advantage. Probit model estimation result provides that: distance to the nearbymarket, family size, oxen owned by farmers, market information, land size allocated for potato production, andquantity of inorganic fertilizer were the significant variables affecting the decision to market participationpositively except family size. The OLS estimation result provides that: the education level of the farmers, farmingexperience, the number of extension contact, the land size allocated for potatoes, and the quantity of inorganicfertilizer is the significant variables influencing the amount of potato market supply positively. The main con-straints for potato production and commercialization in study area were: Shortage of improved seed, lack ofcapacity building training to the post-harvest management approach, price fluctuation, shortage of market in-formation, absence of policy framework in price-setting strategy was produced and marketing constraints ofpotatoes. Therefore, the study suggests that; increasing access to farm inputs, introducing new and improved cropvarieties, establishing suitable post-harvest management facilities. In addition, follow up misconduct practice forprice-setting strategies, strengthening market information service, facilitating conditions that can promote thesmallholder farmers for participating in the market and minimize those constraints which impede the completevalue chain in potato production and development.
(G.K. Wubet), [email protected] (L. Zemedu), [email protected] (B. Tegegne).
m 3 January 2022; Accepted 14 March 2022evier Ltd. This is an open access article under the CC BY-NC-ND license (http://creativecommons.org/licenses/by-
G.K. Wubet et al. Heliyon 8 (2022) e09142
1. Introduction
1.1. Background
Vegetable production is vital economic activity in the world andEthiopia particularly. The production method start from homegrown tosmallholder farming and in commercial farms maintained togetherthrough public and private enterprises (ATA, 2014).
Potato is the world's most significant root and tuber produce. It isgrown in over 125 countries and consumed almost daily by more than abillion people. Potato is crucial to the survival of millions of people indeveloping countries. Potato production is increasing sturdily in theevolving world, where potato ease of production and nutritionalcomfortable has prepared it valued food security and commercial crop formillions of farm households. Today, developing countries are the world'smajor producers and distributors of potatoes and potato products. Onceharvested; potatoes can be used for a variety of purposes: as a freshvegetable for cooking at home, as raw material for processing intofoodstuff produces, food components, starch, then alcohol, as fodder foranimals, and as seed tubers for growing the subsequent crop seasons. Allacross the world, consumer demand is ever-changing from fresh tuberstowards processed products. An ever-greater quantity of potato is pro-cessed to meet the increasing demand for suitability diet and snacks.Expanding urban populations, rising revenue, diversification of food, anda way of life that leaves fewer time for making fresh products for con-sumption are all key drivers of this movement. The development of profitand viable potato subsector in non-developed countries rests on mea-surement to overcome several persistent constraints (FAO, 2009). Po-tatoes are members of the nightshade family like tomatoes, eggplants,and peppers. They have not rooted vegetables; potatoes are the enlargedportion of the stem of the permanent Solanum tuberosum. This section ofthe plant is known as a tuber, and it gives to feed the plant's leafy part.Potato is one of the most widely distributed crops in the world, and it isgrown in places where poverty, inequality, hunger, and malnutrition areprevalent. It has the potential to help smallholder families achieve foodsecurity and rise out of poverty (Haverkort et al., 2013). Potato pro-duction is affected by different climate changes or/and factors. The fac-tors which affect potato production are high temperature, increasedinsects and diseases, water supply, and increased carbon levels in theatmosphere. Climate change curves global potato production severely.However, potatoes are produced everywhere because of their adapt-ability (IPC, 2013). Potato produce is severely harmed by global warming(Hijmans, 2003). Potato is a temperate crop, and rising day temperaturesmake some places unsuitable for potato production because tuber yieldsand quality suffer. Temperature variations outside of 5–30 �C have asignificant impact on tuber growth and production (M. K. Jatav et al.,2017). From any country in Africa, Ethiopia has probably the maximumcapacity for potato production. It is estimated that; 160,000ha are nowplanted annually by approximately one million potato farmers. Accord-ing to (Adane et al., 2010), many factors affect potato production inEthiopia. From which: Shortage of improved varieties, poor tuber posi-tion due to substantial rains and extremely excessive temperatures, dis-eases, viral or/bacteriological fade diseases seem to be importantchallenges. Given the variety in Ethiopia, there are no certified or uni-versally recognized varieties used, but most varieties are generally lowyielding (8 tones/ha) and susceptible to disease and pests. Now a day,less than 3% of Ethiopian farmers have access to improved or uncon-taminated seeds (Vita, 2013). The climatic and edaphic conditions inEthiopia are ideal for increased potato productivity and production(Endale et al., 2008a). In Ethiopia, potato is a short-duration cropcompared to cereals, yielding up to 30–35 tone/ha in 3–4months (Endaleet al., 2008b). Ethiopia is a major producer of seed and ware potatoes.According to the CSA, 2016 report, about 1,288,146 private peasantholders participated in potato production in Ethiopia, on 67,361.87 ha(having 31.13% distribution) covered by potatoes 9,218,320.70 quintalsof potato were produced, with an average yielding of 136.85qt/ha in
2
Meher Season. Amhara Region is the second major producer of potatoesin the country, next to Oromia. The total area covered by potatoes in theyear 2016 in Amhara Region was 17,719.49 ha, by 484,554 privatepeasant holders with total production was 2,735,267.06 quintals with itsaverage productivity was 154.36 quintals/ha. In addition, the areacovered by potatoes in the study Zone was 6,125.49 ha by 96,262 privatepeasant holders were engaged in potato cultivation with the total pro-duction of potato was 935,059.17quintals with average productivity was152.65 quintals/ha. In contemporary agricultural development debates,value chains appear to be the catchword, along with rural economicdevelopment and agribusiness advancement. To tackle different chal-lenges, value chains have built rural-urban linkages that can benefit bothrural producers and urban customers. The value chain approach en-courages looking at the production process from the consumer's end(Methu et al., 2013). According to Tewodros et al. (2014), Due to theirhigh yield potential and nutritional quality tuber, short growing time,and broader adaptability, potatoes are a high potential food security cropin Ethiopia. However, the production and marketing of potatoes aresubject to various challenges. Farmers are faced; with many problems inthe production and marketing of potatoes (Getachew, 2015). Ethiopia isbecoming a leading potato producer country in Africa. However, despiteits growing importance to Ethiopia's food security, infrastructuraldevelopment to increase the productivity and production of potato cropsremains very low. Suitable land and climatic situation, enabling policyenvironment and potential support from NGOs, great demand for seedand ware potatoes are a list of opportunities for potato production.However, value chain of potato is affected by many constraints. Ac-cording to Wabbi et al. (2013), institutional and product-related con-straints were the major inhibitors for potato value chain development.Although potatoes are a vital crop towards food self-sufficiency, theattention given by policymakers, extension workers, and researchers isfound at lower levels. Smallholder potato farmers confront two majorchallenges production and marketing (ARARI, 2013). There are manytypes of research done on farmers' market participation, fromwhichmostof those studies seemed to focus on other crops. Adequate weight has notbeen given to potato crops. Systematic and adequate information on theprocess of market participation, key-value chain actors, and their rolehave not yet been studied and analyzed for the target study area, eventhough there is enormous potential for potato production. Therefore, thisstudy was initiated to identify key value chain actors for potato productand their roles, analyze determinants of potato market participation andvolume sales, and finally, the main opportunities and constraints.
1.2. The study's objectives
The study's overall objective was to evaluate the value chain of po-tatoes in the study area;
The study's specific objectives were:
1. To map value chain of potato and identify main actors, their role, andlinkages in the chain
2. To analyze the determinants of potato market participation and in-tensity of participation
3. To identify main opportunities and constraints in the entire valuechain.
1.3. Conceptual framework
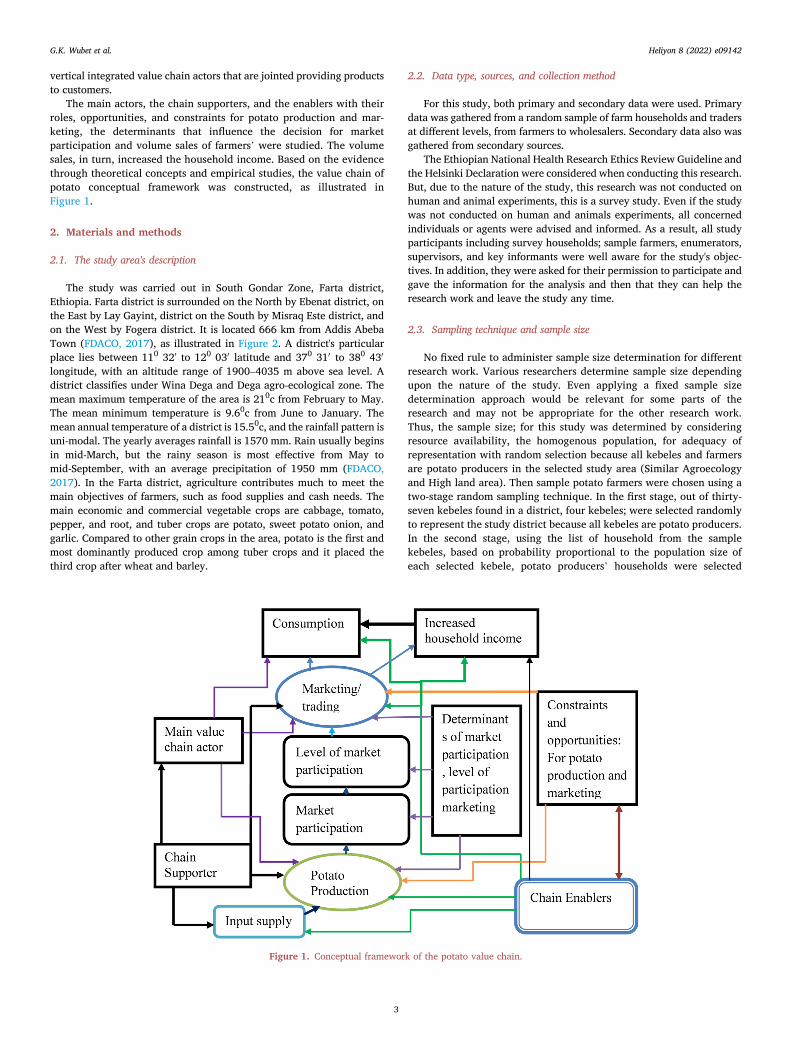
Analysis of value chain is an approach that provides a framework thatcan bring a better understanding between producers and global markets.The framework allows for the evaluations of chain performance by dis-tinguishing the strengths and weaknesses associated with differentiationactivities and linkages and identifying barriers to chain development. Inturn, this information uses to prioritize interventions that can be madealong the chain to improve chain performances (FAO, 2010). Potatovalue chain conceptual framework shows as a network of horizontal and
G.K. Wubet et al. Heliyon 8 (2022) e09142
vertical integrated value chain actors that are jointed providing productsto customers.
The main actors, the chain supporters, and the enablers with theirroles, opportunities, and constraints for potato production and mar-keting, the determinants that influence the decision for marketparticipation and volume sales of farmers’ were studied. The volumesales, in turn, increased the household income. Based on the evidencethrough theoretical concepts and empirical studies, the value chain ofpotato conceptual framework was constructed, as illustrated inFigure 1.
2. Materials and methods
2.1. The study area's description
The study was carried out in South Gondar Zone, Farta district,Ethiopia. Farta district is surrounded on the North by Ebenat district, onthe East by Lay Gayint, district on the South by Misraq Este district, andon the West by Fogera district. It is located 666 km from Addis AbebaTown (FDACO, 2017), as illustrated in Figure 2. A district's particularplace lies between 110 32ʼ to 120 030 latitude and 370 310 to 380 430
longitude, with an altitude range of 1900–4035 m above sea level. Adistrict classifies under Wina Dega and Dega agro-ecological zone. Themean maximum temperature of the area is 210c from February to May.The mean minimum temperature is 9.60c from June to January. Themean annual temperature of a district is 15.50c, and the rainfall pattern isuni-modal. The yearly averages rainfall is 1570 mm. Rain usually beginsin mid-March, but the rainy season is most effective from May tomid-September, with an average precipitation of 1950 mm (FDACO,2017). In the Farta district, agriculture contributes much to meet themain objectives of farmers, such as food supplies and cash needs. Themain economic and commercial vegetable crops are cabbage, tomato,pepper, and root, and tuber crops are potato, sweet potato onion, andgarlic. Compared to other grain crops in the area, potato is the first andmost dominantly produced crop among tuber crops and it placed thethird crop after wheat and barley.
Figure 1. Conceptual framewor
3
2.2. Data type, sources, and collection method
For this study, both primary and secondary data were used. Primarydata was gathered from a random sample of farm households and tradersat different levels, from farmers to wholesalers. Secondary data also wasgathered from secondary sources.
The Ethiopian National Health Research Ethics Review Guideline andthe Helsinki Declaration were considered when conducting this research.But, due to the nature of the study, this research was not conducted onhuman and animal experiments, this is a survey study. Even if the studywas not conducted on human and animals experiments, all concernedindividuals or agents were advised and informed. As a result, all studyparticipants including survey households; sample farmers, enumerators,supervisors, and key informants were well aware for the study's objec-tives. In addition, they were asked for their permission to participate andgave the information for the analysis and then that they can help theresearch work and leave the study any time.
2.3. Sampling technique and sample size
No fixed rule to administer sample size determination for differentresearch work. Various researchers determine sample size dependingupon the nature of the study. Even applying a fixed sample sizedetermination approach would be relevant for some parts of theresearch and may not be appropriate for the other research work.Thus, the sample size; for this study was determined by consideringresource availability, the homogenous population, for adequacy ofrepresentation with random selection because all kebeles and farmersare potato producers in the selected study area (Similar Agroecologyand High land area). Then sample potato farmers were chosen using atwo-stage random sampling technique. In the first stage, out of thirty-seven kebeles found in a district, four kebeles; were selected randomlyto represent the study district because all kebeles are potato producers.In the second stage, using the list of household from the samplekebeles, based on probability proportional to the population size ofeach selected kebele, potato producers’ households were selected
k of the potato value chain.
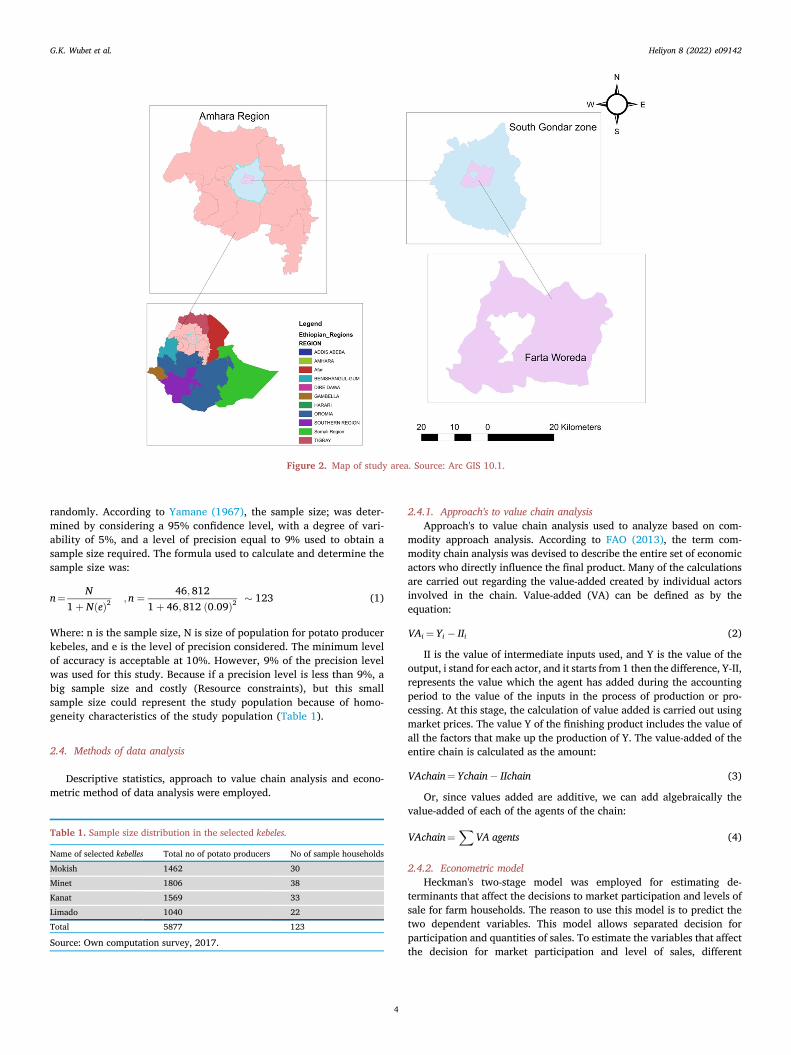
Figure 2. Map of study area. Source: Arc GIS 10.1.
G.K. Wubet et al. Heliyon 8 (2022) e09142
randomly. According to Yamane (1967), the sample size; was deter-mined by considering a 95% confidence level, with a degree of vari-ability of 5%, and a level of precision equal to 9% used to obtain asample size required. The formula used to calculate and determine thesample size was:
n¼ N1þ NðeÞ2 ; n ¼ 46; 812
1þ 46;812 ð0:09Þ2 � 123 (1)
Where: n is the sample size, N is size of population for potato producerkebeles, and e is the level of precision considered. The minimum levelof accuracy is acceptable at 10%. However, 9% of the precision levelwas used for this study. Because if a precision level is less than 9%, abig sample size and costly (Resource constraints), but this smallsample size could represent the study population because of homo-geneity characteristics of the study population (Table 1).
2.4. Methods of data analysis
Descriptive statistics, approach to value chain analysis and econo-metric method of data analysis were employed.
Table 1. Sample size distribution in the selected kebeles.
Name of selected kebelles Total no of potato producers No of sample households
Mokish 1462 30
Minet 1806 38
Kanat 1569 33
Limado 1040 22
Total 5877 123
Source: Own computation survey, 2017.
4
2.4.1. Approach's to value chain analysisApproach's to value chain analysis used to analyze based on com-
modity approach analysis. According to FAO (2013), the term com-modity chain analysis was devised to describe the entire set of economicactors who directly influence the final product. Many of the calculationsare carried out regarding the value-added created by individual actorsinvolved in the chain. Value-added (VA) can be defined as by theequation:
VAi ¼Yi � IIi (2)
II is the value of intermediate inputs used, and Y is the value of theoutput, i stand for each actor, and it starts from 1 then the difference, Y-II,represents the value which the agent has added during the accountingperiod to the value of the inputs in the process of production or pro-cessing. At this stage, the calculation of value added is carried out usingmarket prices. The value Y of the finishing product includes the value ofall the factors that make up the production of Y. The value-added of theentire chain is calculated as the amount:
VAchain¼Ychain� IIchain (3)
Or, since values added are additive, we can add algebraically thevalue-added of each of the agents of the chain:
VAchain¼X
VA agents (4)
2.4.2. Econometric modelHeckman's two-stage model was employed for estimating de-
terminants that affect the decisions to market participation and levels ofsale for farm households. The reason to use this model is to predict thetwo dependent variables. This model allows separated decision forparticipation and quantities of sales. To estimate the variables that affectthe decision for market participation and level of sales, different
Table 3. Sample farm households’ characteristics by dummy variables.
Variables Marketparticipants
Non Marketparticipants
Total sample χ2-value
Freq. % Freq. % Freq. %
Sex of farmers 0.07
Male 76 79.17 22 81.48 98 79.67
Female 20 20.83 5 18.52 25 20.33
Total 96 100 27 100 123 100
Access to market information 3.09*
Access to 79 82.29 18 66.67 97 78.86
No access to 17 17.71 9 33.33 26 21.14
Total 96 100 27 100 123 100
Non/off farm activities 0.28
Yes 17 17.71 6 22.22 23 18.70
No 79 82.29 21 77.78 100 81.3
Total 96 100 27 100 123 100
* Significant at 10% level; Freq. ¼ Frequency; % ¼ percent. Source: own surveyresult, 2017
G.K. Wubet et al. Heliyon 8 (2022) e09142
researchers used different models as various kinds of the literaturerevealed. The commonly used ones are the well-known Tobit andHeckman's two-stage sample selection model. However, the Tobit modelassumes that both the independent variables used to determine the de-cision to participate and the amount of product marketed are given.These problems can be overcome using Heckman's sample selectionmodel where a probit model for the participation or selection equation isestimated and a regression model, which is corrected for selectivity bias,is specified to account for the level of the amount marketed (Astewel,2010; Amare, 2014; Getachew, 2015 and Habtamu, 2015). The specifi-cation of the Heckman two stages procedure is written in terms of thelikelihood of potato market participation (PMP) and level of sale (LS).
The participation Equation/the binary Probit Equation
Y1i ¼X1i B1 þ U1 i U1 � Nð0;1Þ (5)
PMP ¼ 1 if Y > 0PMP ¼ 0 if Y < 0
Where: Y1i is the latent dependent variable, which is unobserved, X1i isvectors of explanatory variable that affect participation in potato market,B1 is a vector of an unknown parameter in participation equation, U1i areresiduals that are independently and normally distributed. The obser-vation/the supply equation;
LP¼Y1 ¼ X2 iB2 þ U2 i U2 � ð0; δ2Þ (6)
Y1 is observed if and only if PMP ¼ 1, Where: Y is the observeddependent variable, X2 is factors that affect the level of participation, B2is a vector of an unknown parameter in the supply equation, U2 is re-siduals in the supply equation.
3. Results
Descriptive Statistics Result: The mean age of the sample farmhouseholds was 47.6 years, and it ranged from 22 to 80 years. Onaverage, 5.16 people in the farm households. The potato farmingexperience of all sample farm households was 27.51 years. Theaverage educational achievement of all sample farm households whoattended informal education was 2.21 years in schooling. In the pro-duction year, the overall average annual potato production by samplefarm households was 82.2 quintals with a 47.06 standard deviation. Ata 1% level, annual potato production was statistically significant,which means in terms of yearly potato produce, there was a meanvariation between potato market participants and non-market
Table 2. Two-sample t test (mean- comparison test) for continuous variables.
Variable Participants (N ¼ 96) Non Partic
Mean Std. Dev. Mean
Age 46.88 12.65 50.04
Family size 5.25 1.58 4.85
Adult equivalent 4.80 1.58 4.45
Farming experience 27.37 10.33 28.04
Education level 2.27 2.65 2
Land holding 2.87 0.76 2.14
Land allocated 0.80 0.36 0.52
Irrigated land 0.15 0.19 0.20
Annual potato product 91.25 48.5 50.11
Quantity of inorganic fertilizer 1.39 0.47 0.97
Oxen owned 1.99 0.88 1.78
Distance to nearest market 17.84 6.44 15.96
Amount of credit obtained 6469.8 4064.8 7014.8
*** Significant at 1% probability level. Std. Dev. ¼ Standard Deviation.Source: Own survey result, 2017.
5
participants. Overall mean land size holding of the sample farmhousehold was 2.71 ha with a 0.79 standard deviation. With a stan-dard deviation of 0.35, the land allocated for potato production was0.74 ha. From an average part of land allotted for potatoes, 0.16 hawas irrigable land. From total land owned by sample farm households,about 27.31% of the land was earmarked for potato production. At a1% level, landholding and land allotted were statistically significant.This means that there was a significant mean difference betweenmarket participants and non-market participants in terms of land sizeholding and land allotted for potato production. Sample farmers uselesser amounts of inorganic fertilizer for potato production. However,market participant households used more fertilizer than non-marketparticipants. At a 1% significance level, the amount of inorganic fer-tilizer was statistically significant. Sample households were located17.43 km away from the nearest market on average even marketparticipant households located far from 17.84 km to the nearestmarket. But, it might not be the factor for their market participation(Table 2). According to the survey result, nearly 70% of samplehouseholds were male-headed. And more than 75% of sample farmhouseholds were informed with different market information sources.At 10% significant level, access to market information is statistically
ipants (N ¼ 27) Total samples (N ¼ 123) t-ratio
Std. Dev. Mean Std. Dev.
9.87 47.57 12.13
1.70 5.16 1.61 -1.14
1.57 4.73 1.53 -1.06
9.4 27.51 10.09 0.31
2.84 2.21 2.69 -0.46
0.61 2.71 0.79 -4.56***
0.14 0.74 0.35 -4.02***
0.22 0.16 0.20 1.20
20.58 82.22 47.06 -4.29***
0.31 1.3 0.48 -4.46***
1.01 1.94 0.91 -1.07
5.18 17.43 6.22 -1.39
2650.2 6589.4 3796.6 0.66
G.K. Wubet et al. Heliyon 8 (2022) e09142
significant. This means that in terms of market information avail-ability, there was a significant mean difference between market par-ticipants and non-market participants. Of the total sample households,81.3% mainly focused on agricultural activity, and the remainingmight be engaged in other non-farm activities (Table 3).
Over 90% of all sample households were married. Family memberswere the main sources of market information for sample farm householdswho lived in the town. The government bank provides credit services forwealthy farmers. But, other institutions offer credit for medium andlower-income level farmers. According to the result of survey, 94.31% ofthe sample farm households benefited from extension service. At 5%significant level, frequency of extension contact was statistically signifi-cant. According to the findings, participants and non-participants had asubstantial mean difference (Table 4).
Table 4. Sample farm households’ characteristics by categorical variables.
Variables Marketparticipation
Non marketparticipation
Total sample Chi2
Freq. % Freq. % Freq. %
Marital status 8.78**
Single 1 1.04 0 0 1 0.81
Married 90 93.75 21 77.78 111 90.24
Divorced 3 3.13 5 18.52 8 6.5
Widowed 2 2.08 1 3.70 3 2.44
Total 96 100 27 100 123 100
Sources of information 3.41
Family members 30 38.46 8 44.44 38 39.58
Friends 28 35.90 7 38.88 35 36.46
Traders 6 7.7 2 11.11 8 8.33
Self-assessment 14 17.95 1 5.55 15 15.63
Total 78 100 18 100 96 100
Means of transportation 5.31*
Man power 0 0 1 3.70 1 0.81
Back animals 78 81.25 18 66.67 96 78.05
Man power and backanimals
18 18.75 8 29.63 26 21.14
Total 96 100 27 100 123 100
No of extension contact 8.61**
No Contact 4 4.17 3 11.11 7 5.69
52 times in a year 35 36.46 5 18.52 40 32.52
26 times in a year 4 4.17 0 0 4 3.25
12 times in a year 39 40.63 11 40.74 50 40.65
2 times in a year 8 8.33 6 22.22 14 11.38
1 times in a year 6 6.25 2 7.41 8 6.50
Total 96 100 27 100 123 100
Source of credit 8.12**
Governmental bank 5 5.21 0 0 5 4.07
ACSI 65 67.7 25 92.59 90 73.2
Cooperatives 2 2.08 1 3.70 3 2.44
Governmental bankand ACSI
24 25.0 1 3.70 25 20.33
Total 96 100 27 100 123 100
Sources of income 2.18
On-farm income 2 2.08 1 3.70 3 2.44
On-farm income andlivestock production
81 84.38 25 92.59 106 86.18
On-farm income,livestock productionand other source
13 13.54 1 3.70 14 11.38
Total 96 100 27 100 123 100
**, * Significant at 5% and at 10% level respectively; Freq. ¼ Frequency; % ¼percent.Source: Own survey result, 2017.
6
3.1. Value chain map, actors, and the roles they play and linkages
Value chain map of potato was drawn to identify value chain actors,their linkage, and the transaction between each actor. It was done in bothqualitative and quantitative terms, with visuals depicting the variousparticipants in the chain, their linkages, and all chain activities from pre-production (input supply) to industrial processing and marketing. Potatovalue chain maps were drawn using the basic map format to identify theactivities that have been done and the actors that did those activities,information, products, and services were exchanged. Potato value chainmap in Farta district is depicted in Figure 3.
3.1.1. Actors and their functional role in the value chain of potatoThe identified value chain actors for potato produce in the study area
were; input suppliers, producers, local collectors, wholesalers, pro-cessors, retailers, and final consumers. Value chain actors are dividedinto three main groups based on their functions. Main actors: in a valuechain of potato included input suppliers, producers, collectors, whole-salers retailers, processors, and final consumers. Input suppliers: As weconfirmed from the survey response, the agricultural office in the district,farmers' association, research centre, NGOs (Vita), and traders were inputsuppliers. Their functions were supplied inputs for potato production.The significant difference between non-market participant and marketparticipants’ households is by utilization of seed type and to concludethat potato market participants were used more improved seed than non-market participants (Table 5).
In the study area, some varieties of potato seed are being used byfarmers like Belete, Jalene, Gudene, Gossaye, and Hochech. The highestyielding and disease resistance variety was Belete, which is used by62.3% of farmers. Out of the total sample of farmers, more than 55% offarmers used only family labour. The share of labor for potato productionused is depicted in Figure 4.
Producers: Their functions: produce potatoes mainly for consumptionand generating income through marketing. More than 54% of farmersused rain-fed (Table 6).
Potato local collectors: Their functions; collect potatoes from pro-ducers in settlement markets then resale at a better price to other actors.Wholesalers: Value-adding functions done by wholesalers are buying andassembling, cleaning, washing, creating place, and adding time and placeutilities for their product. Processors: Their main value-adding activitiesare creating form utility to the product. However, processors have nogreat contribution to the value chain of potato produce in the study area.Retailers: Retailers’ main value-adding functions are cleaning, gradingbased on size, and weighting with scale. Consumers: are the end actors inthe value chain of potato produce and those purchasing the products forconsumption. Chain supporters: Their function is to support main valuechain activities. In the study area, chain supporters such as extensionagents, agriculture and rural development office, NGOs (Vita, Amharacredit and saving institution (ACSI), research centres, and DebretaborUniversity. Chain influencers: The function of chain influencers is toenable the environment to be suitable for the complete potato valuechain activities. Regulatory frameworks, land tenure security rights, legalservices, and security for farmers/actors were chain influencers in thedistrict.
3.1.2. Value chain actors’ linkageIn the study area, potato value chain actors were linked backwards
and forward, vertical and horizontal, as shown in Figure 5.
3.1.3. Value added of actors in value chain analysis approachThe financial analysis examines a business from various perspectives
to fully understand the greater financial situation and determine howbest to strengthen the current industry. Based on the above justificationfor the potatoes value chain, economic analysis helps; identify the pro-cess of product flow, the linkage between actors, the distribution of in-come and the creation of value-added, the amounts of benefit received by
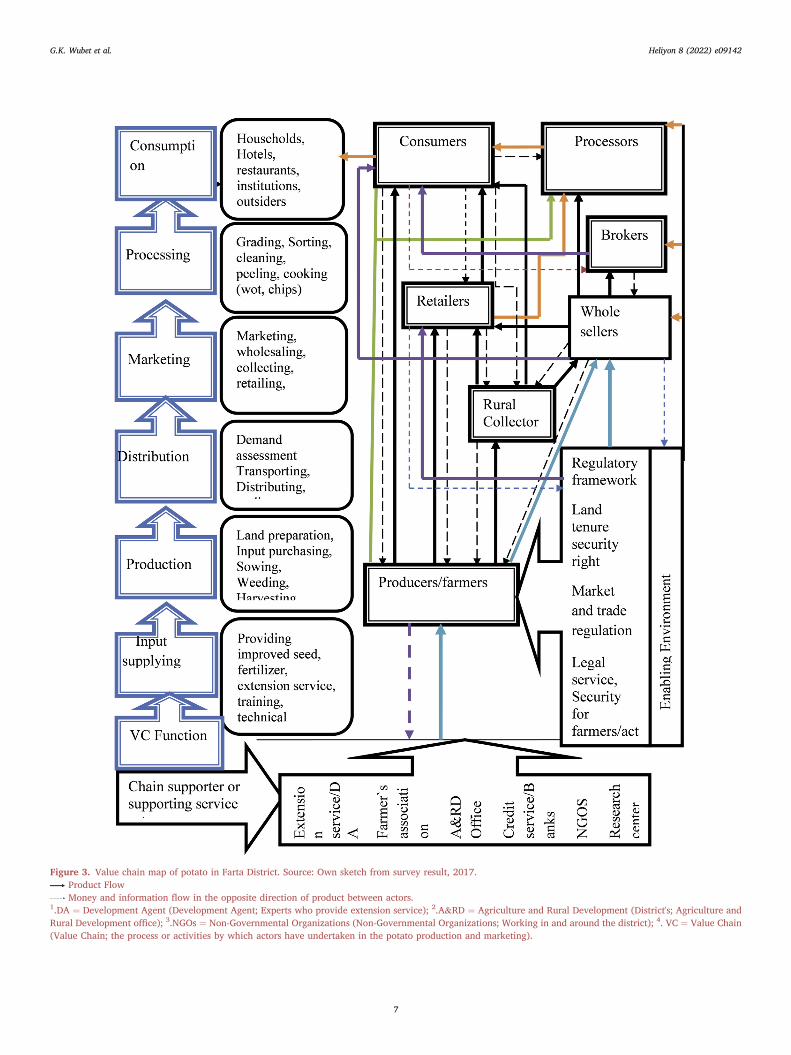
Figure 3. Value chain map of potato in Farta District. Source: Own sketch from survey result, 2017.Product FlowMoney and information flow in the opposite direction of product between actors.
1.DA ¼ Development Agent (Development Agent; Experts who provide extension service); 2.A&RD ¼ Agriculture and Rural Development (District's; Agriculture andRural Development office); 3.NGOs ¼ Non-Governmental Organizations (Non-Governmental Organizations; Working in and around the district); 4. VC ¼ Value Chain(Value Chain; the process or activities by which actors have undertaken in the potato production and marketing).
G.K. Wubet et al. Heliyon 8 (2022) e09142
7
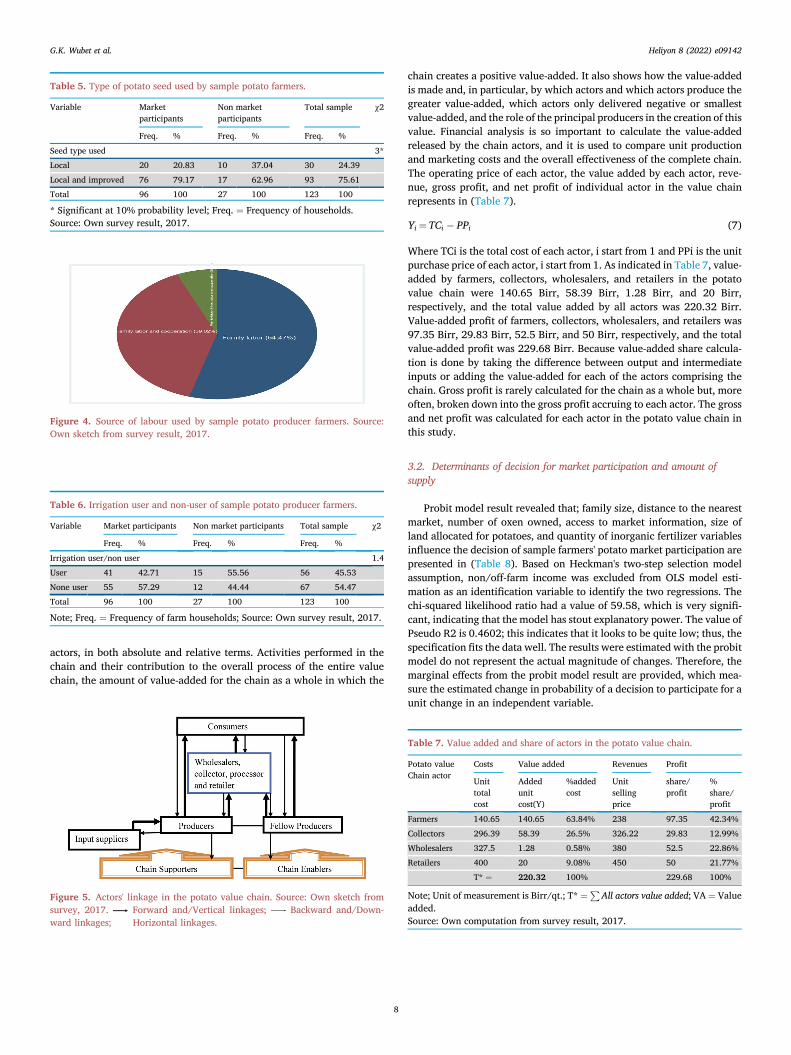
Table 5. Type of potato seed used by sample potato farmers.
Variable Marketparticipants
Non marketparticipants
Total sample χ2
Freq. % Freq. % Freq. %
Seed type used 3*
Local 20 20.83 10 37.04 30 24.39
Local and improved 76 79.17 17 62.96 93 75.61
Total 96 100 27 100 123 100
* Significant at 10% probability level; Freq. ¼ Frequency of households.Source: Own survey result, 2017.
Figure 4. Source of labour used by sample potato producer farmers. Source:Own sketch from survey result, 2017.
Table 6. Irrigation user and non-user of sample potato producer farmers.
Variable Market participants Non market participants Total sample χ2
Freq. % Freq. % Freq. %
Irrigation user/non user 1.4
User 41 42.71 15 55.56 56 45.53
None user 55 57.29 12 44.44 67 54.47
Total 96 100 27 100 123 100
Note; Freq. ¼ Frequency of farm households; Source: Own survey result, 2017.
G.K. Wubet et al. Heliyon 8 (2022) e09142
actors, in both absolute and relative terms. Activities performed in thechain and their contribution to the overall process of the entire valuechain, the amount of value-added for the chain as a whole in which the
Figure 5. Actors' linkage in the potato value chain. Source: Own sketch fromsurvey, 2017. Forward and/Vertical linkages; Backward and/Down-ward linkages; Horizontal linkages.
8
chain creates a positive value-added. It also shows how the value-addedis made and, in particular, by which actors and which actors produce thegreater value-added, which actors only delivered negative or smallestvalue-added, and the role of the principal producers in the creation of thisvalue. Financial analysis is so important to calculate the value-addedreleased by the chain actors, and it is used to compare unit productionand marketing costs and the overall effectiveness of the complete chain.The operating price of each actor, the value added by each actor, reve-nue, gross profit, and net profit of individual actor in the value chainrepresents in (Table 7).
Yi ¼TCi � PPi (7)
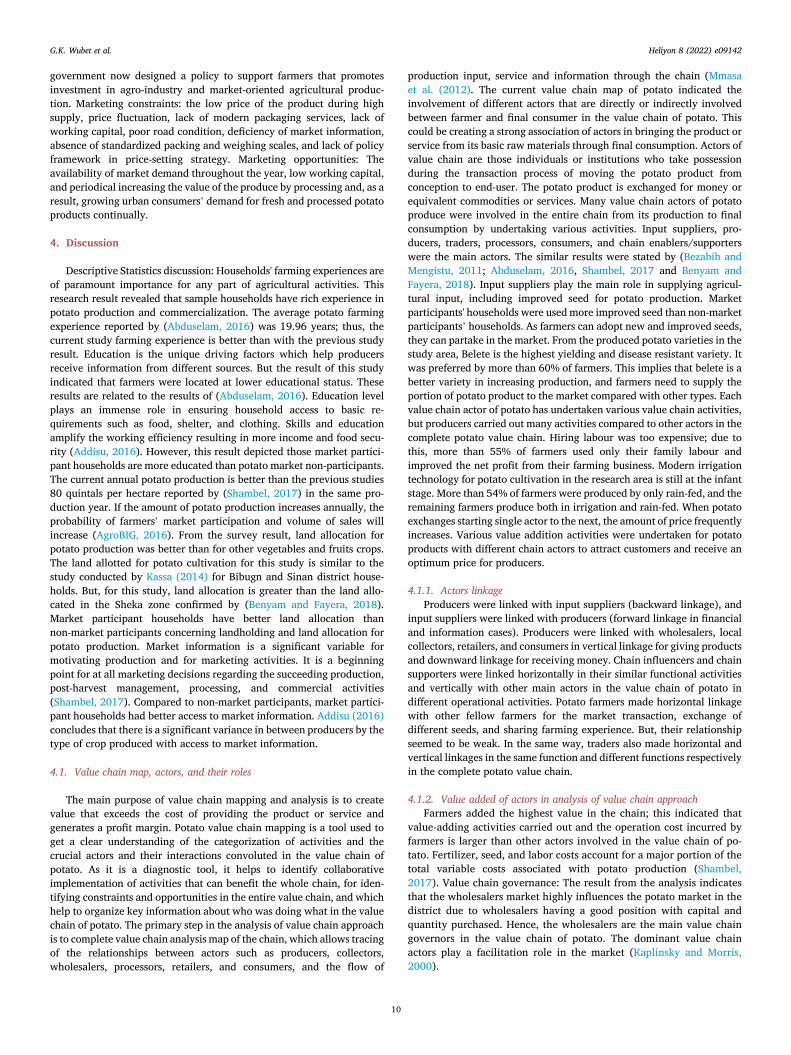
Where TCi is the total cost of each actor, i start from 1 and PPi is the unitpurchase price of each actor, i start from 1. As indicated in Table 7, value-added by farmers, collectors, wholesalers, and retailers in the potatovalue chain were 140.65 Birr, 58.39 Birr, 1.28 Birr, and 20 Birr,respectively, and the total value added by all actors was 220.32 Birr.Value-added profit of farmers, collectors, wholesalers, and retailers was97.35 Birr, 29.83 Birr, 52.5 Birr, and 50 Birr, respectively, and the totalvalue-added profit was 229.68 Birr. Because value-added share calcula-tion is done by taking the difference between output and intermediateinputs or adding the value-added for each of the actors comprising thechain. Gross profit is rarely calculated for the chain as a whole but, moreoften, broken down into the gross profit accruing to each actor. The grossand net profit was calculated for each actor in the potato value chain inthis study.
3.2. Determinants of decision for market participation and amount ofsupply
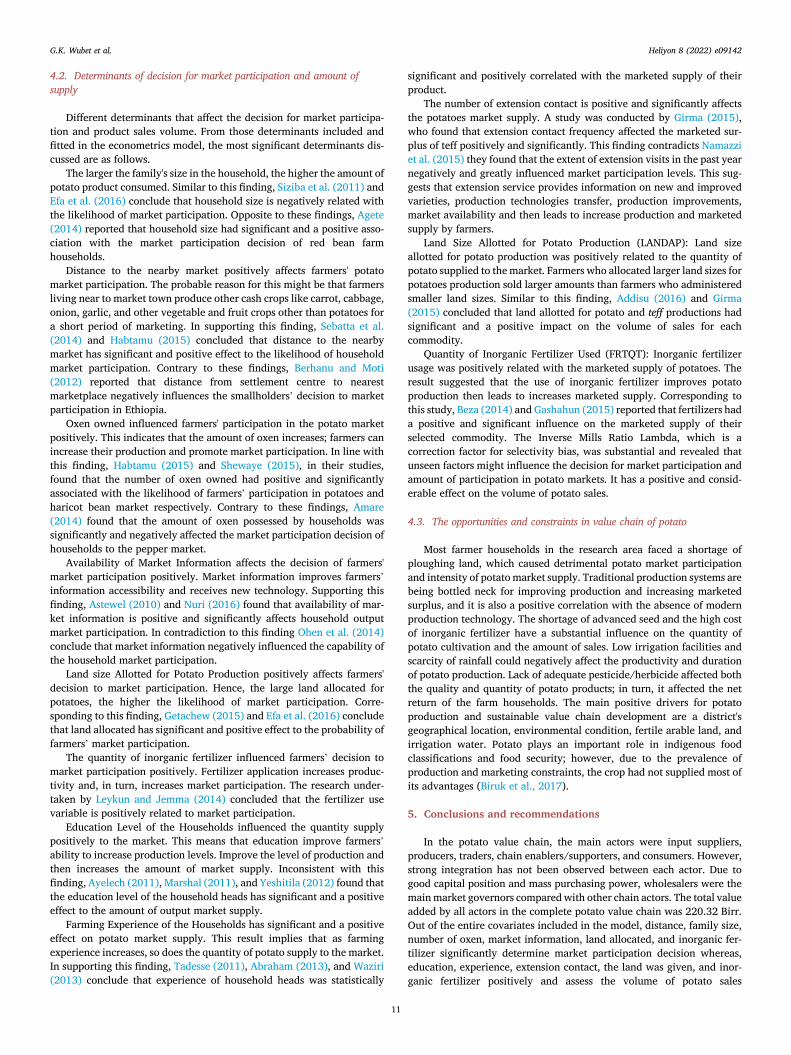
Probit model result revealed that; family size, distance to the nearestmarket, number of oxen owned, access to market information, size ofland allocated for potatoes, and quantity of inorganic fertilizer variablesinfluence the decision of sample farmers' potato market participation arepresented in (Table 8). Based on Heckman's two-step selection modelassumption, non/off-farm income was excluded from OLS model esti-mation as an identification variable to identify the two regressions. Thechi-squared likelihood ratio had a value of 59.58, which is very signifi-cant, indicating that the model has stout explanatory power. The value ofPseudo R2 is 0.4602; this indicates that it looks to be quite low; thus, thespecification fits the data well. The results were estimated with the probitmodel do not represent the actual magnitude of changes. Therefore, themarginal effects from the probit model result are provided, which mea-sure the estimated change in probability of a decision to participate for aunit change in an independent variable.
Table 7. Value added and share of actors in the potato value chain.
Potato valueChain actor
Costs Value added Revenues Profit
Unittotalcost
Addedunitcost(Y)
%addedcost
Unitsellingprice
share/profit
%share/profit
Farmers 140.65 140.65 63.84% 238 97.35 42.34%
Collectors 296.39 58.39 26.5% 326.22 29.83 12.99%
Wholesalers 327.5 1.28 0.58% 380 52.5 22.86%
Retailers 400 20 9.08% 450 50 21.77%
T* ¼ 220.32 100% 229.68 100%
Note; Unit of measurement is Birr/qt.; T* ¼PAll actors value added; VA ¼ Value
added.Source: Own computation from survey result, 2017.
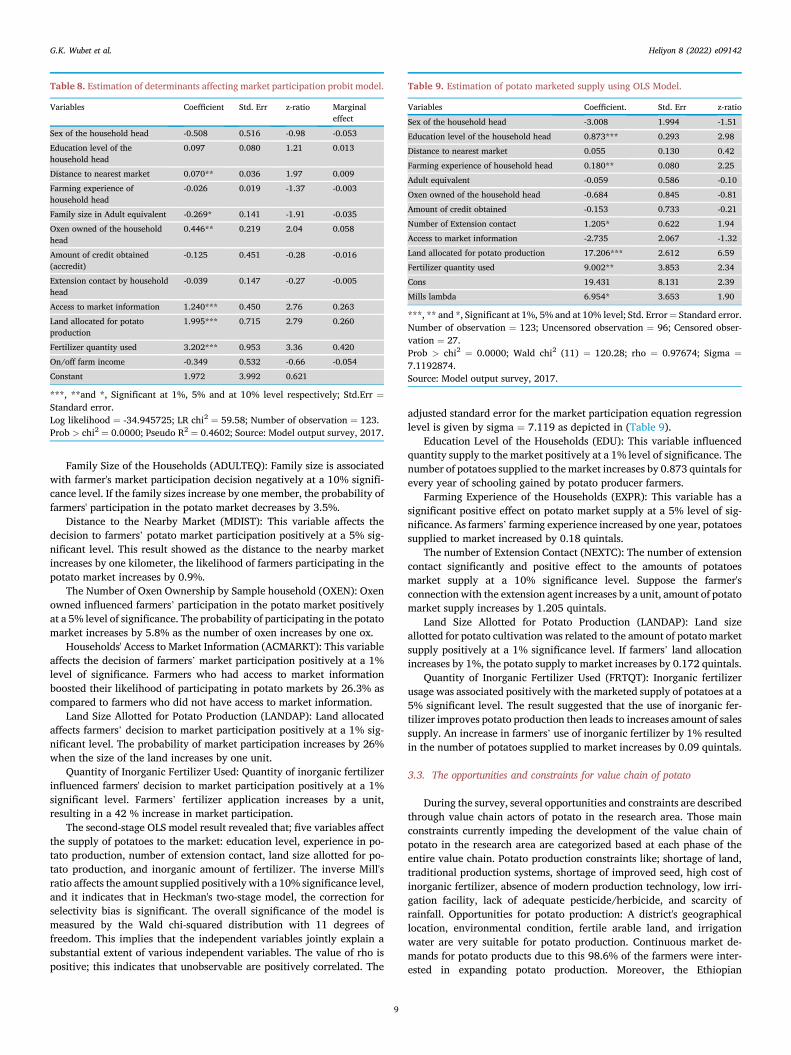
Table 8. Estimation of determinants affecting market participation probit model.
Variables Coefficient Std. Err z-ratio Marginaleffect
Sex of the household head -0.508 0.516 -0.98 -0.053
Education level of thehousehold head
0.097 0.080 1.21 0.013
Distance to nearest market 0.070** 0.036 1.97 0.009
Farming experience ofhousehold head
-0.026 0.019 -1.37 -0.003
Family size in Adult equivalent -0.269* 0.141 -1.91 -0.035
Oxen owned of the householdhead
0.446** 0.219 2.04 0.058
Amount of credit obtained(accredit)
-0.125 0.451 -0.28 -0.016
Extension contact by householdhead
-0.039 0.147 -0.27 -0.005
Access to market information 1.240*** 0.450 2.76 0.263
Land allocated for potatoproduction
1.995*** 0.715 2.79 0.260
Fertilizer quantity used 3.202*** 0.953 3.36 0.420
On/off farm income -0.349 0.532 -0.66 -0.054
Constant 1.972 3.992 0.621
***, **and *, Significant at 1%, 5% and at 10% level respectively; Std.Err ¼Standard error.Log likelihood ¼ -34.945725; LR chi2 ¼ 59.58; Number of observation ¼ 123.Prob > chi2 ¼ 0.0000; Pseudo R2 ¼ 0.4602; Source: Model output survey, 2017.
Table 9. Estimation of potato marketed supply using OLS Model.
Variables Coefficient. Std. Err z-ratio
Sex of the household head -3.008 1.994 -1.51
Education level of the household head 0.873*** 0.293 2.98
Distance to nearest market 0.055 0.130 0.42
Farming experience of household head 0.180** 0.080 2.25
Adult equivalent -0.059 0.586 -0.10
Oxen owned of the household head -0.684 0.845 -0.81
Amount of credit obtained -0.153 0.733 -0.21
Number of Extension contact 1.205* 0.622 1.94
Access to market information -2.735 2.067 -1.32
Land allocated for potato production 17.206*** 2.612 6.59
Fertilizer quantity used 9.002** 3.853 2.34
Cons 19.431 8.131 2.39
Mills lambda 6.954* 3.653 1.90
***, ** and *, Significant at 1%, 5% and at 10% level; Std. Error¼ Standard error.Number of observation ¼ 123; Uncensored observation ¼ 96; Censored obser-vation ¼ 27.Prob > chi2 ¼ 0.0000; Wald chi2 (11) ¼ 120.28; rho ¼ 0.97674; Sigma ¼7.1192874.Source: Model output survey, 2017.
G.K. Wubet et al. Heliyon 8 (2022) e09142
Family Size of the Households (ADULTEQ): Family size is associatedwith farmer's market participation decision negatively at a 10% signifi-cance level. If the family sizes increase by one member, the probability offarmers' participation in the potato market decreases by 3.5%.
Distance to the Nearby Market (MDIST): This variable affects thedecision to farmers’ potato market participation positively at a 5% sig-nificant level. This result showed as the distance to the nearby marketincreases by one kilometer, the likelihood of farmers participating in thepotato market increases by 0.9%.
The Number of Oxen Ownership by Sample household (OXEN): Oxenowned influenced farmers’ participation in the potato market positivelyat a 5% level of significance. The probability of participating in the potatomarket increases by 5.8% as the number of oxen increases by one ox.
Households' Access to Market Information (ACMARKT): This variableaffects the decision of farmers’ market participation positively at a 1%level of significance. Farmers who had access to market informationboosted their likelihood of participating in potato markets by 26.3% ascompared to farmers who did not have access to market information.
Land Size Allotted for Potato Production (LANDAP): Land allocatedaffects farmers’ decision to market participation positively at a 1% sig-nificant level. The probability of market participation increases by 26%when the size of the land increases by one unit.
Quantity of Inorganic Fertilizer Used: Quantity of inorganic fertilizerinfluenced farmers' decision to market participation positively at a 1%significant level. Farmers’ fertilizer application increases by a unit,resulting in a 42 % increase in market participation.
The second-stage OLS model result revealed that; five variables affectthe supply of potatoes to the market: education level, experience in po-tato production, number of extension contact, land size allotted for po-tato production, and inorganic amount of fertilizer. The inverse Mill'sratio affects the amount supplied positively with a 10% significance level,and it indicates that in Heckman's two-stage model, the correction forselectivity bias is significant. The overall significance of the model ismeasured by the Wald chi-squared distribution with 11 degrees offreedom. This implies that the independent variables jointly explain asubstantial extent of various independent variables. The value of rho ispositive; this indicates that unobservable are positively correlated. The
9
adjusted standard error for the market participation equation regressionlevel is given by sigma ¼ 7.119 as depicted in (Table 9).
Education Level of the Households (EDU): This variable influencedquantity supply to the market positively at a 1% level of significance. Thenumber of potatoes supplied to the market increases by 0.873 quintals forevery year of schooling gained by potato producer farmers.
Farming Experience of the Households (EXPR): This variable has asignificant positive effect on potato market supply at a 5% level of sig-nificance. As farmers’ farming experience increased by one year, potatoessupplied to market increased by 0.18 quintals.
The number of Extension Contact (NEXTC): The number of extensioncontact significantly and positive effect to the amounts of potatoesmarket supply at a 10% significance level. Suppose the farmer'sconnectionwith the extension agent increases by a unit, amount of potatomarket supply increases by 1.205 quintals.
Land Size Allotted for Potato Production (LANDAP): Land sizeallotted for potato cultivation was related to the amount of potato marketsupply positively at a 1% significance level. If farmers’ land allocationincreases by 1%, the potato supply to market increases by 0.172 quintals.
Quantity of Inorganic Fertilizer Used (FRTQT): Inorganic fertilizerusage was associated positively with the marketed supply of potatoes at a5% significant level. The result suggested that the use of inorganic fer-tilizer improves potato production then leads to increases amount of salessupply. An increase in farmers’ use of inorganic fertilizer by 1% resultedin the number of potatoes supplied to market increases by 0.09 quintals.
3.3. The opportunities and constraints for value chain of potato
During the survey, several opportunities and constraints are describedthrough value chain actors of potato in the research area. Those mainconstraints currently impeding the development of the value chain ofpotato in the research area are categorized based at each phase of theentire value chain. Potato production constraints like; shortage of land,traditional production systems, shortage of improved seed, high cost ofinorganic fertilizer, absence of modern production technology, low irri-gation facility, lack of adequate pesticide/herbicide, and scarcity ofrainfall. Opportunities for potato production: A district's geographicallocation, environmental condition, fertile arable land, and irrigationwater are very suitable for potato production. Continuous market de-mands for potato products due to this 98.6% of the farmers were inter-ested in expanding potato production. Moreover, the Ethiopian
G.K. Wubet et al. Heliyon 8 (2022) e09142
government now designed a policy to support farmers that promotesinvestment in agro-industry and market-oriented agricultural produc-tion. Marketing constraints: the low price of the product during highsupply, price fluctuation, lack of modern packaging services, lack ofworking capital, poor road condition, deficiency of market information,absence of standardized packing and weighing scales, and lack of policyframework in price-setting strategy. Marketing opportunities: Theavailability of market demand throughout the year, low working capital,and periodical increasing the value of the produce by processing and, as aresult, growing urban consumers’ demand for fresh and processed potatoproducts continually.
4. Discussion
Descriptive Statistics discussion: Households' farming experiences areof paramount importance for any part of agricultural activities. Thisresearch result revealed that sample households have rich experience inpotato production and commercialization. The average potato farmingexperience reported by (Abduselam, 2016) was 19.96 years; thus, thecurrent study farming experience is better than with the previous studyresult. Education is the unique driving factors which help producersreceive information from different sources. But the result of this studyindicated that farmers were located at lower educational status. Theseresults are related to the results of (Abduselam, 2016). Education levelplays an immense role in ensuring household access to basic re-quirements such as food, shelter, and clothing. Skills and educationamplify the working efficiency resulting in more income and food secu-rity (Addisu, 2016). However, this result depicted those market partici-pant households are more educated than potato market non-participants.The current annual potato production is better than the previous studies80 quintals per hectare reported by (Shambel, 2017) in the same pro-duction year. If the amount of potato production increases annually, theprobability of farmers’ market participation and volume of sales willincrease (AgroBIG, 2016). From the survey result, land allocation forpotato production was better than for other vegetables and fruits crops.The land allotted for potato cultivation for this study is similar to thestudy conducted by Kassa (2014) for Bibugn and Sinan district house-holds. But, for this study, land allocation is greater than the land allo-cated in the Sheka zone confirmed by (Benyam and Fayera, 2018).Market participant households have better land allocation thannon-market participants concerning landholding and land allocation forpotato production. Market information is a significant variable formotivating production and for marketing activities. It is a beginningpoint for at all marketing decisions regarding the succeeding production,post-harvest management, processing, and commercial activities(Shambel, 2017). Compared to non-market participants, market partici-pant households had better access to market information. Addisu (2016)concludes that there is a significant variance in between producers by thetype of crop produced with access to market information.
4.1. Value chain map, actors, and their roles
The main purpose of value chain mapping and analysis is to createvalue that exceeds the cost of providing the product or service andgenerates a profit margin. Potato value chain mapping is a tool used toget a clear understanding of the categorization of activities and thecrucial actors and their interactions convoluted in the value chain ofpotato. As it is a diagnostic tool, it helps to identify collaborativeimplementation of activities that can benefit the whole chain, for iden-tifying constraints and opportunities in the entire value chain, and whichhelp to organize key information about who was doing what in the valuechain of potato. The primary step in the analysis of value chain approachis to complete value chain analysis map of the chain, which allows tracingof the relationships between actors such as producers, collectors,wholesalers, processors, retailers, and consumers, and the flow of
10
production input, service and information through the chain (Mmasaet al. (2012). The current value chain map of potato indicated theinvolvement of different actors that are directly or indirectly involvedbetween farmer and final consumer in the value chain of potato. Thiscould be creating a strong association of actors in bringing the product orservice from its basic raw materials through final consumption. Actors ofvalue chain are those individuals or institutions who take possessionduring the transaction process of moving the potato product fromconception to end-user. The potato product is exchanged for money orequivalent commodities or services. Many value chain actors of potatoproduce were involved in the entire chain from its production to finalconsumption by undertaking various activities. Input suppliers, pro-ducers, traders, processors, consumers, and chain enablers/supporterswere the main actors. The similar results were stated by (Bezabih andMengistu, 2011; Abduselam, 2016, Shambel, 2017 and Benyam andFayera, 2018). Input suppliers play the main role in supplying agricul-tural input, including improved seed for potato production. Marketparticipants' households were used more improved seed than non-marketparticipants’ households. As farmers can adopt new and improved seeds,they can partake in the market. From the produced potato varieties in thestudy area, Belete is the highest yielding and disease resistant variety. Itwas preferred by more than 60% of farmers. This implies that belete is abetter variety in increasing production, and farmers need to supply theportion of potato product to the market compared with other types. Eachvalue chain actor of potato has undertaken various value chain activities,but producers carried out many activities compared to other actors in thecomplete potato value chain. Hiring labour was too expensive; due tothis, more than 55% of farmers used only their family labour andimproved the net profit from their farming business. Modern irrigationtechnology for potato cultivation in the research area is still at the infantstage. More than 54% of farmers were produced by only rain-fed, and theremaining farmers produce both in irrigation and rain-fed. When potatoexchanges starting single actor to the next, the amount of price frequentlyincreases. Various value addition activities were undertaken for potatoproducts with different chain actors to attract customers and receive anoptimum price for producers.
4.1.1. Actors linkageProducers were linked with input suppliers (backward linkage), and
input suppliers were linked with producers (forward linkage in financialand information cases). Producers were linked with wholesalers, localcollectors, retailers, and consumers in vertical linkage for giving productsand downward linkage for receiving money. Chain influencers and chainsupporters were linked horizontally in their similar functional activitiesand vertically with other main actors in the value chain of potato indifferent operational activities. Potato farmers made horizontal linkagewith other fellow farmers for the market transaction, exchange ofdifferent seeds, and sharing farming experience. But, their relationshipseemed to be weak. In the same way, traders also made horizontal andvertical linkages in the same function and different functions respectivelyin the complete potato value chain.
4.1.2. Value added of actors in analysis of value chain approachFarmers added the highest value in the chain; this indicated that
value-adding activities carried out and the operation cost incurred byfarmers is larger than other actors involved in the value chain of po-tato. Fertilizer, seed, and labor costs account for a major portion of thetotal variable costs associated with potato production (Shambel,2017). Value chain governance: The result from the analysis indicatesthat the wholesalers market highly influences the potato market in thedistrict due to wholesalers having a good position with capital andquantity purchased. Hence, the wholesalers are the main value chaingovernors in the value chain of potato. The dominant value chainactors play a facilitation role in the market (Kaplinsky and Morris,2000).
G.K. Wubet et al. Heliyon 8 (2022) e09142
4.2. Determinants of decision for market participation and amount ofsupply
Different determinants that affect the decision for market participa-tion and product sales volume. From those determinants included andfitted in the econometrics model, the most significant determinants dis-cussed are as follows.
The larger the family's size in the household, the higher the amount ofpotato product consumed. Similar to this finding, Siziba et al. (2011) andEfa et al. (2016) conclude that household size is negatively related withthe likelihood of market participation. Opposite to these findings, Agete(2014) reported that household size had significant and a positive asso-ciation with the market participation decision of red bean farmhouseholds.
Distance to the nearby market positively affects farmers' potatomarket participation. The probable reason for this might be that farmersliving near to market town produce other cash crops like carrot, cabbage,onion, garlic, and other vegetable and fruit crops other than potatoes fora short period of marketing. In supporting this finding, Sebatta et al.(2014) and Habtamu (2015) concluded that distance to the nearbymarket has significant and positive effect to the likelihood of householdmarket participation. Contrary to these findings, Berhanu and Moti(2012) reported that distance from settlement centre to nearestmarketplace negatively influences the smallholders’ decision to marketparticipation in Ethiopia.
Oxen owned influenced farmers' participation in the potato marketpositively. This indicates that the amount of oxen increases; farmers canincrease their production and promote market participation. In line withthis finding, Habtamu (2015) and Shewaye (2015), in their studies,found that the number of oxen owned had positive and significantlyassociated with the likelihood of farmers’ participation in potatoes andharicot bean market respectively. Contrary to these findings, Amare(2014) found that the amount of oxen possessed by households wassignificantly and negatively affected the market participation decision ofhouseholds to the pepper market.
Availability of Market Information affects the decision of farmers'market participation positively. Market information improves farmers’information accessibility and receives new technology. Supporting thisfinding, Astewel (2010) and Nuri (2016) found that availability of mar-ket information is positive and significantly affects household outputmarket participation. In contradiction to this finding Ohen et al. (2014)conclude that market information negatively influenced the capability ofthe household market participation.
Land size Allotted for Potato Production positively affects farmers'decision to market participation. Hence, the large land allocated forpotatoes, the higher the likelihood of market participation. Corre-sponding to this finding, Getachew (2015) and Efa et al. (2016) concludethat land allocated has significant and positive effect to the probability offarmers’ market participation.
The quantity of inorganic fertilizer influenced farmers’ decision tomarket participation positively. Fertilizer application increases produc-tivity and, in turn, increases market participation. The research under-taken by Leykun and Jemma (2014) concluded that the fertilizer usevariable is positively related to market participation.
Education Level of the Households influenced the quantity supplypositively to the market. This means that education improve farmers’ability to increase production levels. Improve the level of production andthen increases the amount of market supply. Inconsistent with thisfinding, Ayelech (2011), Marshal (2011), and Yeshitila (2012) found thatthe education level of the household heads has significant and a positiveeffect to the amount of output market supply.
Farming Experience of the Households has significant and a positiveeffect on potato market supply. This result implies that as farmingexperience increases, so does the quantity of potato supply to the market.In supporting this finding, Tadesse (2011), Abraham (2013), and Waziri(2013) conclude that experience of household heads was statistically
11
significant and positively correlated with the marketed supply of theirproduct.
The number of extension contact is positive and significantly affectsthe potatoes market supply. A study was conducted by Girma (2015),who found that extension contact frequency affected the marketed sur-plus of teff positively and significantly. This finding contradicts Namazziet al. (2015) they found that the extent of extension visits in the past yearnegatively and greatly influenced market participation levels. This sug-gests that extension service provides information on new and improvedvarieties, production technologies transfer, production improvements,market availability and then leads to increase production and marketedsupply by farmers.
Land Size Allotted for Potato Production (LANDAP): Land sizeallotted for potato production was positively related to the quantity ofpotato supplied to themarket. Farmers who allocated larger land sizes forpotatoes production sold larger amounts than farmers who administeredsmaller land sizes. Similar to this finding, Addisu (2016) and Girma(2015) concluded that land allotted for potato and teff productions hadsignificant and a positive impact on the volume of sales for eachcommodity.
Quantity of Inorganic Fertilizer Used (FRTQT): Inorganic fertilizerusage was positively related with the marketed supply of potatoes. Theresult suggested that the use of inorganic fertilizer improves potatoproduction then leads to increases marketed supply. Corresponding tothis study, Beza (2014) and Gashahun (2015) reported that fertilizers hada positive and significant influence on the marketed supply of theirselected commodity. The Inverse Mills Ratio Lambda, which is acorrection factor for selectivity bias, was substantial and revealed thatunseen factors might influence the decision for market participation andamount of participation in potato markets. It has a positive and consid-erable effect on the volume of potato sales.
4.3. The opportunities and constraints in value chain of potato
Most farmer households in the research area faced a shortage ofploughing land, which caused detrimental potato market participationand intensity of potato market supply. Traditional production systems arebeing bottled neck for improving production and increasing marketedsurplus, and it is also a positive correlation with the absence of modernproduction technology. The shortage of advanced seed and the high costof inorganic fertilizer have a substantial influence on the quantity ofpotato cultivation and the amount of sales. Low irrigation facilities andscarcity of rainfall could negatively affect the productivity and durationof potato production. Lack of adequate pesticide/herbicide affected boththe quality and quantity of potato products; in turn, it affected the netreturn of the farm households. The main positive drivers for potatoproduction and sustainable value chain development are a district'sgeographical location, environmental condition, fertile arable land, andirrigation water. Potato plays an important role in indigenous foodclassifications and food security; however, due to the prevalence ofproduction and marketing constraints, the crop had not supplied most ofits advantages (Biruk et al., 2017).
5. Conclusions and recommendations
In the potato value chain, the main actors were input suppliers,producers, traders, chain enablers/supporters, and consumers. However,strong integration has not been observed between each actor. Due togood capital position and mass purchasing power, wholesalers were themainmarket governors comparedwith other chain actors. The total valueadded by all actors in the complete potato value chain was 220.32 Birr.Out of the entire covariates included in the model, distance, family size,number of oxen, market information, land allocated, and inorganic fer-tilizer significantly determine market participation decision whereas,education, experience, extension contact, the land was given, and inor-ganic fertilizer positively and assess the volume of potato sales
G.K. Wubet et al. Heliyon 8 (2022) e09142
substantially. A district's suitability for potato production, availability ofcontinuous market demand, and increased product value were the mainopportunities whereas, shortage of improved seed, diseases, naturalfactors, lack of a post-harvest management system, lack of policyframework for price-setting were the main constraints in the value chainof potato. Value chain actors build strong linkage to develop a sustainablepotato value chain. The government gives special attention to stabilizingprices improving farmers' market share. Expansion information andcommunication technology is needed from the government and otherconcerned bodies, especially in a remote corner of the area. Farmers'farming experience should be strengthened for improving productionand increase their market participation. Input suppliers would be moti-vated to supply adequate inputs for farmers. Private seed multipliers,research centres, NGOs, and other institutions should introduce new/improved seed varieties. Establishing a post-harvest managementapproach is also paramount for a substantial influence on the competi-tiveness of potato value chain.
Declarations
Author contribution statement
Gedefaw Kindu Wubet: Conceived and designed the experiments;Performed the experiments; Analyzed and interpreted the data;Contributed reagents, materials, analysis tools or data; Wrote the paper.
Lemma Zemedu; Bosena Tegegne: Analyzed and interpreted the data;Wrote the paper.
Funding statement
This work was supported by Ministry of Education, Ethiopia.
Data availability statement
Data will be made available on request.
Declaration of interests statement
The authors declare no conflict of interest.
Additional information
No additional information is available for this paper.
References
Abduselam, Faris, 2016. Value Chain Analysis of Potato in Dedo District of Jimma Zone,Ethiopia.
Abraham, Tegegn, 2013. Value Chain Analysis of Vegetables: the Case of Habro andKombolcha Woredas in Oromiya Region, Ethiopia. MSc Thesis. Haramaya University,Haramaya, Ethiopia.
Adane, Hirpa, Meuwissen, M.P., Tesfaye, Agajie, Lommen, W.J., Lansink, A.O.,Tsegaye, Admasu, Struik, P.C., 2010. Analysis of seed potato systems in Ethiopia. Am.J. Potato Res. 87 (6), 537–552.
Addisu, Hailu, 2016. Value Chain Analysis of Vegetables: the Case of Ejere District, WestShowa Zone, Oromia National Regional State, Ethiopia. MSc Thesis. HaramayaUniversity, Haramaya, Ethiopia.
Agete, Jerena, 2014. An Analysis of Factors Influencing Participation of SmallholderFarmers in Red Bean Marketing in Halaba Special District, Ethiopia. MSc Thesis.University of Nairobi.
AgroBIG, 2016. Annual Report JANUARY – DECEMBER 2015, Bahir Dar, Ethiopia.Amare, Tesfaw, 2014. Determinants of agricultural commodity market supply. J. Econ.
Sustain. Dev. 5, 7.Astewel, Takele, 2010. Analysis of rice Profitability and Marketing Chain: the Case of
Fogera Woreda, South Gondar Zone, Amhara National Regional State, Ethiopia. MScThesis. Haramaya University, Haramaya, Ethiopia.
ATA (Agricultural Transformation Agency), 2014. The plan for accelerated developmentto end poverty. In: Transforming Agriculture in Ethiopia, Annual Report.
Ayelech, Tadesse, 2011. Market Chain Analysis of Fruits for Gomma Woreda, JimmaZone, Oromia National Regional State. MSc Thesis. Haramaya University, Haramaya,Ethiopia.
12
Benyam, Tadesse, Fayera, Bakala, 2018. Value chain analysis of potato: the case of ShekaZone, Southwest Ethiopia. Int. J. Hortic. Agric. ISSN Number: 2572-3154.
Berhanu, Gebremedhin, Jaleta, Moti, 2012. Market orientation and market participationof smallholders in Ethiopia: implications for Commercial Transformation. In: SelectedPaper Prepared for Presentation at the International Association of AgriculturalEconomists. Triennial Conference, Foz do Lguacu, Brazil, 18-24 August 2012.
Beza, Erko, 2014. Maize and Fava Bean Value Chains: the Case of Bako Tibe and GobuSeyo Districts in Central Western Ethiopia. MSc Thesis. Haramaya University,Haramaya, Ethiopia.
Bezabih, Emana, Mengistu, Nigussie, 2011. Value Chain Analysis and Development inEthiopian Case of Tigray and SNNP Regions. International Potato Center, AddisAbeba Ethiopia.
Biruk, Kemaw, Shiferaw, Diriba, Seid-Sani, Chalchisa, Tamiru, 2017. Opportunities andconstraints of ware potato value chain analysis: west Showa zone, Central Ethiopia.J. Econ. Sustain. Dev. 8 (11).
CSA (Central Statistical Agency), 2016. Agricultural sample survey report onarea and production of major crops (private peasant holdings Meher season 2015/2016 (2008 E.C.) Addis Ababa, Ethiopia. In: The FDRE Statistical Bulletin 578,Volume I.
Efa, Gobena, Goshu, Degye, Demisie, Tinsae, Tadesse, Kenea, 2016. Determinants ofmarket participation and intensity of marketed surplus of teff producers in Bacho andDawo Districts of Oromia State, Ethiopia. J. Agric. Econom. Dev. 5 (2), 20–32.
Endale, Gebre, Gebremedhin, W/Giorgis, Berga, Lemaga, 2008a. Potato seedmanagement. In: Gebremedhin, W., Endale, G., Lemaga, B. (Eds.), Root and TuberCrops: the Untapped Resources. Ethiopian Institute of Agricultural Research, AddisAbaba, pp. 53–78.
Endale, Gebre, Gebremedhin, W/Giorgis, Bekele, K., Berga, Lemaga, 2008b. Post-harvestmanagement. In: Wold Giorgis, G.M., Endale, G., Lemaga, B. (Eds.), Root and TuberCrops: the Untapped Resources. Ethiopian Institute of Agricultural Research, AddisAbaba, pp. 113–130.
FAO (Food and Agriculture Organization), 2009. Sustainable Potato Production:International Year of the Potato. Guidelines for Developing Countries, UnitedNations.
FAO (Food and Agricultural Organization), 2010. Strengthening Potato Value chains.Technical and Policy Options for Developing Countries, Rome, Italy.
FAO (Food and Agricultural Organization), 2013. Value Chain Analysis for Policy MakingMethodological Guidelines, Country Cases to a Quantitative Approach. Rome, Italy.
FDACO (Farta District Agriculture and Communication Office), 2017. Annual Report ofthe Woreda. Farta, South Gondar Zone, Amhara Region, Ethiopia.
Gashahun, Kelemework, 2015. White Pea Bean (Phaseolus vulgaris L.) Value ChainAnalysis: the Case of Adami Tulu Jido Kombolcha District, Eastern Shewa Zone,Oromia National Regional State, Ethiopia. MSc Thesis. Haramaya University.
Getachew, Biru, 2015. Analysis of Potato Seed Tuber Value Chain: the Case of Small-ScaleFarmers in Jeldu District of West Shawa Zone, Oromia, Ethiopia. MSc Thesis.Haramaya University, Haramaya, Ethiopia.
Girma, Alemu, 2015. Market Performance and Determinants of the Marketed Surplus ofTeff: the Case of Bacho Woreda in South West Shewa Zone, Oromia National RegionalState. MSc Thesis. Haramaya University, Haramaya, Ethiopia.
Habtamu, Gebre, 2015. Analysis of Potato Value Chain in Hadiya Zone of Ethiopia. MScThesis. Haramaya University, Haramaya, Ethiopia.
Haverkort, A.J., de Ruijter, F.J., van Evert, F.K., Conijn, J.G., Rutgers, B., 2013.Worldwide sustainability hotspots in potato cultivation. 1. Identification andmapping. Potato Res. 56, 343–353.
Hijmans, R.J., 2003. The effect of climate change on global potato production. Am. J.Potato Res. 80, 271–279.
International Potato Center, EIAR and ARARI (Ethiopian Institute of Research andAmahara Regional Agricultural Research Institute), 2013. Seed potato tuberproduction and dissemination. Experiences, challenges, and prospects. In:Woldegiorgis, Gebremedihin, Steffn, S., Baye, Berihun (Eds.), Proceedings of theNational Workshop on Seed Potato Tuber Production and Dissemination, 12-14March 2012, Bahir Dar, Ethiopia.
Jatav, M.K., Dua, V.K., Govindakrishnan, P.M., Sharma, R.P., 2017. Impact of ClimateChange in Potato Production in India. IGI Global Publisher of Timely Knowledge.
Kaplinsky, Raphael, Morris, Mike, 2000. A Handbook for Value Chain Research.International Development Research Center, Ottawa.
Kassa, Alemu, 2014. Potato value chain in Ethiopia: cases of sinan and Bibugn districts, inEast Gojjam. J. Agric. Vet. Sci. 2 (6), 114–124.
Leykun, Birhanu, Haji, Jemma, 2014. Econometric analysis of factors affecting marketparticipation of smallholder farming in central Ethiopia. J. Agric. Econom. Ext. RuralDev. 2 (6), 94–104.
Marshal, Negussie, 2011. Value Chain Analysis of Sugarcane: the Case of Kalu District,South Wollo Zone of Amhara National Regional State, Ethiopia. MSc Thesis.Haramaya University, Haramaya, Ethiopia.
Methu, J., Nyangaga, J., Waweru, A., Akishule, D., 2013. Agricultural Innovation Systemsand Value Chains Development: A Training Manual. ASARECA, Entebbe.
Mmasa, J.J., Msuya, E.E., 2012. Mapping of the sweet potato value chain linkagesbetween actors, processes and activities in the value chain: a case of Michelle andmatobolwa products. Sustain. Agric. Res. 1 (1), 130.
Namazzi, S., Ekere, W., Kyazze, F.B., Bareeba, F., 2015. Determinants of participation ofsmallholder farmers in marketing of grain amaranth in Kamuli District, Uganda.J. Agric. Econom. Dev. 4 (5), 75–82.
Nuri, Lefebo, 2016. Value Chain Analysis of Enset (Ensete Ventricosum) in Hadiya Zone,Southern Ethiopia. Ph.D. Dissertation. Haramaya University, Haramaya, Ethiopia.
Ohen, S.B., Umeze, G.E., Cobham, M.E., 2014. Determinants of market participation bycucumber farmers in Odukpani local government area, Cross River State, Nigeria.J. Econ. Sustain. Dev. 5, 2.
G.K. Wubet et al. Heliyon 8 (2022) e09142
Sebatta, C., Mugisha, J., Katungi, E., Kashaaru, A., Kyomugisha, H., 2014. Smallholderfarmers’ decision and level of participation in the potato market in Uganda. Mod.Econ. 5, 895–906.
Shambel, Bekele, 2017. Potato value chain analysis: the case of chencha woreda, gamogofa zone, southern Ethiopia. Develop. Countr. Stud. 7 (4), 2017.
Shewaye, Abera, 2015. Determinants of Haricot Bean Market Participation: the Caseof East Badawacho District, Hadiya Zone, Southern Nations Nationalities andPeoples Regional State, Ethiopia. MSc Thesis, Haramaya University, Haramaya,Ethiopia.
Siziba, S., Nyikahadzoi, K., Diagne, A., Fatunbi, A.O., Adekunle, A.A., 2011. Determinantsof cereal market participation by sub-Saharan Africa smallholder farmers. J. Agric.Environ. Stud. 2 (1), 180–193.
Tadesse, Negash, 2011. Value Chain Analysis of Vegetables in Daro Lebu District of WestHararghe Zone, Oromia Region, Ethiopia. MSc Thesis. Haramaya University,Haramaya, Ethiopia.
13
Tewodros, Ayalew, Struik, P.C., Adane, Hirpa, 2014. Characterization of seed potato(Solanum tuberosum l.) storage, pre-planting treatment, and marketing systems inEthiopia: the case of West-Arsi Zone. Afr. J. Agric. Res. 9 (15), 1218–1226.
Vita, 2013. Potatoes in Development: A Model of Collaboration for Farmers in Africa.Fighting Hunger and Climate Change in Africa. Irish Potato Federation, Europe.
Wabbi, B.J., Ayo, S., Mugolona, Taylor, D.B., Kirinya, J., Tenywa, M., 2013. Theperformance of potato markets in South western Uganda. J. Dev. Agric. Econ. 5 (6),225–235.
Waziri, Mkani, 2013. Cassava and Sweet Potato Value Chains in Mvomero and KongwaDistricts in Tanzania: MSc Thesis. Sokoine University, Morogoro, Tanzania.
Yamane, T., 1967. Statistics, an Introductory Analysis, 2ndEdition. Harper & Row, NewYork.
Yeshitila, Alemu, 2012. Analysis of Vegetable Marketing in Eastern Ethiopia: the Case ofPotato and Cabbage in Kombolcha Woreda, East Hararghe Zone, Oromia NationalRegional State. MSc Thesis. Haramaya University, Haramaya, Ethiopia.
Related Documents