Value-Based Purchasing in NY Medicaid Deborah Bachrach, Esq. Medicaid Director Deputy Commissioner Office of Health Insurance Programs New York State Department of Health Presentation to State Coverage Initiatives National Meeting July 30, 2009 Care Coordination and Payment Reform

Value-Based Purchasing in NY Medicaid Deborah Bachrach, Esq. Medicaid Director Deputy Commissioner Office of Health Insurance Programs New York State Department.
Dec 27, 2015
Welcome message from author
This document is posted to help you gain knowledge. Please leave a comment to let me know what you think about it! Share it to your friends and learn new things together.
Transcript

Value-Based Purchasing in NY Medicaid
Deborah Bachrach, Esq.Medicaid DirectorDeputy CommissionerOffice of Health Insurance ProgramsNew York State Department of Health
Presentation to State Coverage Initiatives National MeetingJuly 30, 2009
Care Coordination and Payment Reform
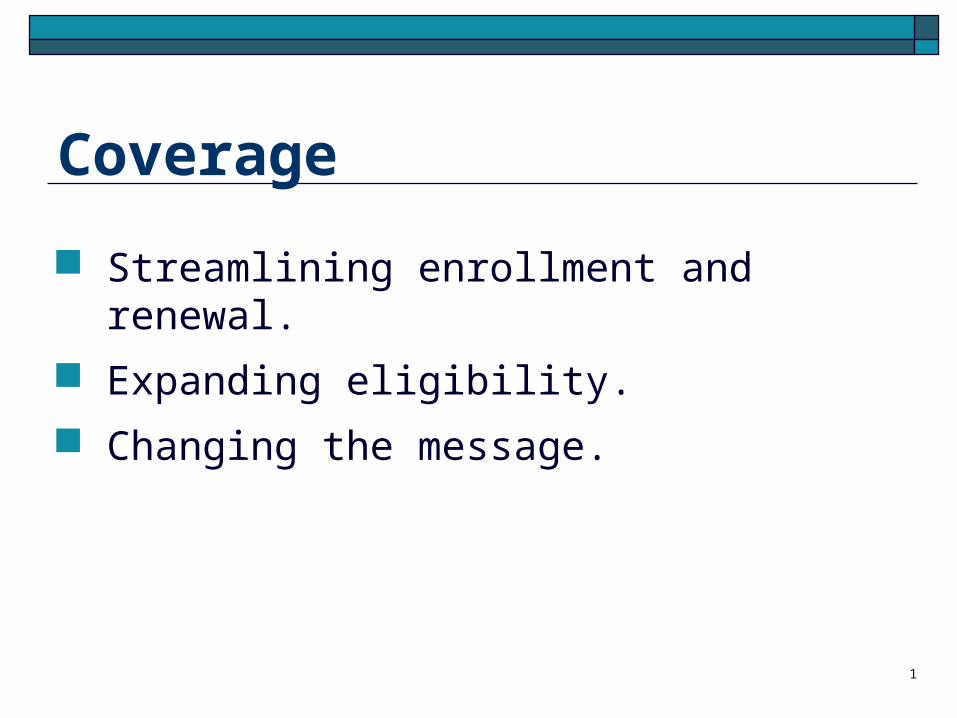
Coverage
Streamlining enrollment and renewal.
Expanding eligibility.
Changing the message.
1

Access to Care Supporting practices in medically underserved
areas and specialties. Loan repayment. Start-up grants. Enhanced Medicaid payment rates.
Expanding Medicaid’s physician network. Improving access to care outside of business
hours.
2

Medicaid Managed Care Mandatory program began in 1997 under an 1115
Waiver. 2.9 million beneficiaries are enrolled in managed
care plans. Improved quality and contained costs.
Significant and sustained improvements over time; even as a sicker population enrolls (SSI, SPMI).
Narrowing of the gap between commercial and Medicaid rates of performance.
3

Reward Good Performance Health plans earn rewards up
to 3% of premium for good performance: HEDIS or NYS-specific
quality measures. CAHPS measures. Regulatory compliance
(reporting, access and availability, provider network).
Plans must qualify for incentive to receive auto-assignments.
4
6.4 6.9
20.9
43.750.0
62.3
75.0
$0
$10
$20
$30
$40
$50
$60
$70
$80
2002* 2003* 2004** 2005** 2006** 2007** 2008**
millions

Medicaid Children’s Measures
Measure 2000 2007 % change
Immunization Status 54% 70% +16%
Lead screening 76% 86% +10%
Well Child 0-15 months 57% 79% +22%
Well Child 3-6 years 65% 81% +16%
Adolescent Well Care 41% 58% +17%
Annual Dental visit, ages 4-21
29% 48% +19%
5
2000-2007

Medicaid Diabetes Care Measures
Measure 2000 2007 % change
HbA1c tested 76% 87% +11%
HbA1C poor control*
52% 34% -18%*
Cholesterol Screening
68% 85% +17%
Nephropathy 45% 82% +37%
Eye Exam 49% 62% +13%
* A lower rate is better
6
2000-2007

Build on Managed Care Successes
Expanding mandatory to more complex and costly populations.
Evaluating the benefit package.
Phasing-in risk adjusted rates. Adjusting for case mix differences. Priced regionally, not plan-specific.
Aligning Medicaid fee-for-service.
7

1995-2006 Medicaid Managed Medicaid Managed Care Raises the BarCare Raises the Bar
1995-2006 Medicaid Managed Medicaid Managed Care Raises the BarCare Raises the Bar
Pre-1995Medicaid Stood StillMedicaid Stood Still
Pre-1995Medicaid Stood StillMedicaid Stood Still
2007 & Beyond Medicaid FFS & Medicaid FFS & Managed Care Managed Care Raise the BarRaise the Bar
2007 & Beyond Medicaid FFS & Medicaid FFS & Managed Care Managed Care Raise the BarRaise the Bar
Improves Access, Quality, & Accountability
Improves Access, Quality, & Accountability
Value Value
Quality Quality
Accountability Accountability
Transparency Transparency
Medicaid Fee-For-Service Medicaid Managed Care
Working In Tandem To Raise The Bar
Access Access
EfficiencyEfficiency
8

Medicaid Fee-For-Service Payment Policies Demanding transparency and accountability.
Rationalizing and updating payment methodologies for hospitals, clinics, nursing homes and home care.
Rationalizing payment levels – reducing inpatient rates and investing in outpatient rates.
Incentivizing the development of patient-centered medical homes. Medical home incentives both fee-for-service and managed care. Adirondack multi-payer medical home pilot (except Medicare). Primary care case management in non-mandatory counties.
Paying for quality; not paying for poor quality.9

Medicaid Fee-For-Service Program Policies Focusing on specific services and populations to
improve quality of care and control costs. Selective Contracting.
Bariatric surgery. Breast cancer surgery.
Retrospective utilization management. Chronic illness demonstration programs. Prior authorization of certain radiology services.
10

Selective Contracting for Bariatric Surgery Medicaid will contract with 5 New York City hospitals to
perform bariatric surgery; currently 25 perform such surgeries.
Why Bariatric Surgery? New York, like the rest of the nation, has an “obesity epidemic.” The volume of bariatric surgery is increasing, in part because of
claims that bariatric surgery “cures” Type 2 diabetes and greatly diminishes many co-morbidities associated w/ long term obesity.
The literature and our own research indicates that there are significant complication rates associated with bariatric surgery.
There is significant variation in outcomes and re-admissions across NYC hospitals.
11

Selective Contracting for Breast Cancer Surgery
The literature documents significantly higher 5-Year survival rates for women who have breast cancer surgery at high volume facilities.
New York Medicaid now limits reimbursement for breast cancer surgery to sites that have performed more than 30 surgeries per year (both hospitals and ambulatory surgery centers).
Exceptions granted to some sites due to access and provider experience.
12

Retrospective Utilization Review of Fee-For-Service Claims Contract awarded to APS through RFP process. 7 million fee-for-service claims per month will be reviewed. Evidence based guidelines, disease management analysis
and resource utilization review techniques will be used to identify patterns of over-utilization and under-utilization.
Providers demonstrating patterns above or below the norm will be notified and educated by peer consultants.
Interventions will be identified for high-cost, high risk Medicaid beneficiaries.
Total annual cost (with FFP) of $7 million; anticipated annual State share savings of $15M, or $45M over the 3 years of the contract.
13

Coordinating the Care of High-Cost, Medically Complicated Beneficiaries The Chronic Illness Demonstration Program (CIDP)
will run for three years at seven sites at a cost of $30M (including FFP).
Each project is required to have an integrated network of providers to assure facilitated access to medical, mental health and substance abuse services for participants and collaboration with community-based social services.
CIDP uses a predictive algorithm to identify patients at high risk (est. 70%) for medical, substance abuse, or psychiatric hospitalizations in the next 12 months.
14

Coordinating the Care of High-Cost, Medically Complicated Beneficiaries (cont.)
These patients have largely uninterrupted Medicaid eligibility, but limited engagement in primary care. Per patient average cost in the prior 12 months was
$37,500. Average cost in the next 12 months is expected to be
$46,000 without intervention.
Shared risk and savings will be introduced in the second and third years of the project.
15

Moving Forward Continue to streamline and expand
coverage and enhance access. Continue with finance reforms that
hold providers accountable and support delivery system reform. Reduce potentially preventable complications. Reduce potentially preventable readmissions. Consider bundling of inpatient services. Support integrated care models.
Continue with program reform. Support meaningful use of EHRs. Evaluate improvement in quality and reduction in costs. Align with federal health care reform.
16
Related Documents