115 4 Value-added tax Introduction Value-added tax (VAT) is levied at a standard rate of 14 percent by registered vendors on most goods and services subject to certain exemptions, exceptions and zero-ratings provided for in the Value-Added Tax Act (1991). VAT is also levied on the importation of goods and services into South Africa. This chapter gives an overview of: • Number of registered VAT vendors • Domestic VAT: Payments and refunds • Turnover • The debate around current VAT concessions. Number of registered VAT vendors The number of vendors registered for VAT shows a steady increase of 8 percent per year over the past five years. (See table 4.1.) Table 4.1: Number of registered VAT vendors, 2002/03 – 2007/08 Number Registered 1 Active vendors Percentage of registered 2002/03 506 098 487 736 96.4% 2003/04 536 281 507 203 94.6% 2004/05 578 138 530 865 91.8% 2005/06 633 703 618 417 97.6% 2006/07 677 153 2007/08 745 487 1. As per register as at 31 March of each year. Excludes coded cases where status is in suspense, estate and address unknown. Domestic VAT: Payments and refunds Table 4.1.1 1 and table 4.1.2 show the number of vendors, payments and refunds per sector. The largest number of VAT vendors in 2005/06 was in the financing, insurance, real estate and business services sector (32.5 percent), followed by the agriculture, forestry and fishing (12.9 percent) and the retail trade (10.4 percent) sectors. 1 Tables numbered in italics are included at the end of the chapter.

Welcome message from author
This document is posted to help you gain knowledge. Please leave a comment to let me know what you think about it! Share it to your friends and learn new things together.
Transcript

115
4 Value-added tax
Introduction Value-added tax (VAT) is levied at a standard rate of 14 percent by registered vendors on most goods and services subject to certain exemptions, exceptions and zero-ratings provided for in the Value-Added Tax Act (1991). VAT is also levied on the importation of goods and services into South Africa.
This chapter gives an overview of:
• Number of registered VAT vendors • Domestic VAT: Payments and refunds • Turnover • The debate around current VAT concessions.
Number of registered VAT vendors The number of vendors registered for VAT shows a steady increase of 8 percent per year over the past five years. (See table 4.1.)
Table 4.1: Number of registered VAT vendors, 2002/03 – 2007/08
NumberRegistered1 Active
vendorsPercentage of
registered2002/03 506 098 487 736 96.4%
2003/04 536 281 507 203 94.6%
2004/05 578 138 530 865 91.8%
2005/06 633 703 618 417 97.6%
2006/07 677 153
2007/08 745 487
1. As per register as at 31 March of each year. Excludes coded cases where status is in suspense, estate and address unknown.
Domestic VAT: Payments and refunds Table 4.1.11 and table 4.1.2 show the number of vendors, payments and refunds per sector. The largest number of VAT vendors in 2005/06 was in the financing, insurance, real estate and business services sector (32.5 percent), followed by the agriculture, forestry and fishing (12.9 percent) and the retail trade (10.4 percent) sectors.
1 Tables numbered in italics are included at the end of the chapter.

2008 TAX STATISTICS
116
Companies in the mining and quarrying sector constitute 0.5 percent of the number of vendors and 3.8 percent of the total gross VAT payments for 2005/06, but are a negative contributor to net VAT (after refunds). The financing, insurance, real estate and business services sector made the largest gross domestic VAT payments in 2005/06, totalling R37.9 billion (29.1 percent).
By payment category
The requirement for monthly VAT payments applies primarily to larger vendors with taxable supplies (turnover) in excess of R30 million per year.
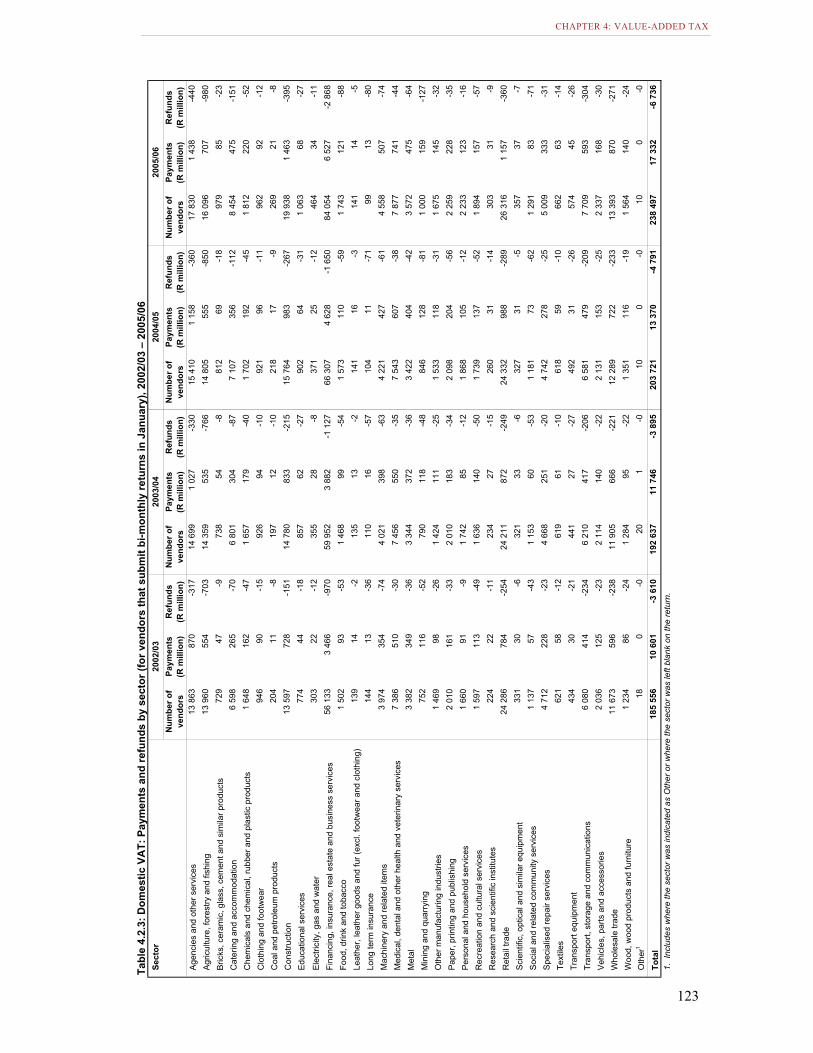
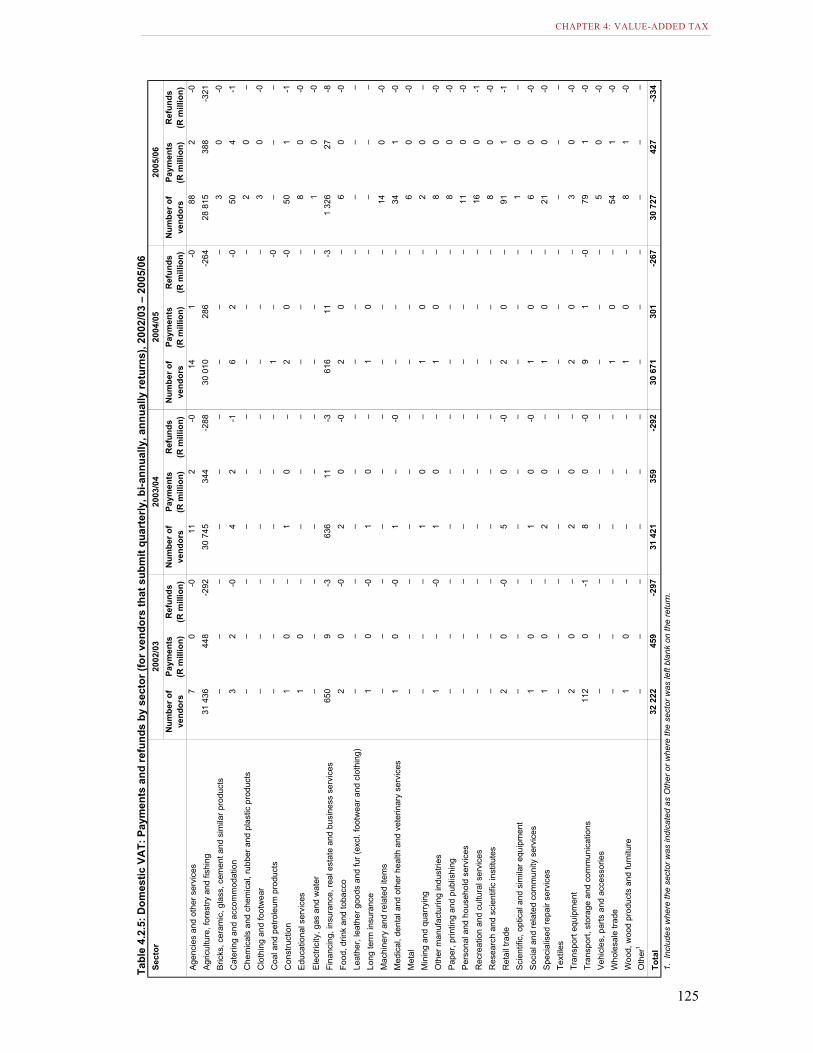
Around 90 percent of vendors submit returns on a bi-monthly basis (see table 4.2.1). Tables 4.2.2 to 4.2.5 provide a breakdown of the various sectors’ payments and refunds for the different payment periods.
By type of enterprise
Corporations (companies and close corporations) formed the bulk of VAT vendors in 2005/06 (66.3 percent in 2005/06), followed by individuals – sole proprietors (23.9 percent). Corporations accounted for 89.3 percent of gross domestic VAT collections. (See table 4.3.1.)
Turnover For 2006/07, 47.1 percent of VAT vendors registered voluntarily; this means they had an annual turnover of less than R300 000. About 67 percent of VAT vendors had a turnover of R1 million or less, accounting for 1.6 percent of net domestic VAT collections. The top 5 percent of VAT vendors had an annual turnover in excess of R14 million and accounted for 73 percent of the total net domestic VAT collections. It should be noted that less than 1 percent of vendors had an annual turnover greater than R100 million and this category accounted for 44 percent of the net domestic VAT collections. (See table 4.4.1.)
Current VAT concessions Based on the 2005/06 Income and Expenditure Survey (IES)2 the poorest 10 percent of households spend on average 34.9 percent of their income on food, beverages and tobacco as opposed to 8 percent for the top 10 percent of high-income households. (See table 4.5.1.) The zero-rating of 19 basic foodstuffs and illuminating paraffin was intended to alleviate the impact of VAT on the poor. The basic food items are: brown bread, maize meal, samp, mealie rice, dried mealies, dried beans, lentils, pilchards, milk powder, dairy powder blend, rice, fresh vegetables, fresh fruit, vegetable oil, milk, cultured milk, brown wheaten meal, eggs, legumes and pulses3.
• Bread and cereals account for 27.8 percent of the poorest 10 percent of household expenditure on food, beverages and tobacco. The corresponding figure for the top 10 percent of households is 10 percent and 18.9 percent for all households. (See table 4.5.2.)
• Meat accounts for 19.8 percent of the poorest 10 percent of household expenditure on food, beverages and tobacco. The corresponding figure for the top 10 percent of households is 21.3 percent and 22.8 percent for all households.
• Vegetables account for 11.7 percent of the poorest 10 percent of household expenditure on food, beverages and tobacco. The corresponding figure for the top 10 percent of households is 7.5 percent and 9 percent for all households.
• Milk, cheese and eggs account for 8 percent of the poorest 10 percent of household expenditure on food, beverages and tobacco. The corresponding figure for the top 10 percent of households is 10 percent and 9 percent for all households.
2. Statistics South Africa. 3. Value-Added Tax Act (1991), Schedule 2, Part B.

CHAPTER 4: VALUE-ADDED TAX
117
While the VAT zero-rating of basic foodstuffs (and paraffin) is targeted to assist the poor, higher income households also benefit from these concessions. As the non-poor spend significantly more on food, high income households receive greater VAT relief in rand terms. The Katz Commission found that the highest income households benefit approximately six times more in monetary terms than the poorest households. The zero-rating reduces the VAT burden of the poorest households by about 18 percent, compared to a 6 percent reduction for the highest income groups. However, of the total estimated revenue forgone due to the zero-rating, only about a third benefits households in the bottom half of the income distribution4.
Impact of VAT zero-ratings Further, empirical evidence based on household spending patterns suggests that existing VAT zero-ratings and exemptions, almost in all cases, confer substantially more benefits on higher income than on lower income groups. There are very few concessionary items where the absolute spending by lower income expenditure groups exceeds that of higher income expenditure groups. This is particularly true of some “basic foodstuff” items where the share of expenditure by the low income expenditure quintiles is relatively low, given the pattern of income inequality in South Africa5.
Table 4.5.3 indicates that the bottom 50 percent of households based on income, account for only 31.9 percent of the total expenditure on food, beverages and tobacco. The top 20 percent of households based on income, account for 37.8 percent of total expenditure on food, beverages and tobacco.
With the exception of maize meal, bread flour and maize rice, the savings derived by higher income groups from current zero-ratings are generally substantially higher than those enjoyed by lower income groups. In absolute terms the total savings from current VAT concessions enjoyed by the high and very high expenditure groups are estimated to have exceeded that accruing to the very low and low expenditure groups by almost R2 825 million in 20066. It should be noted that suppliers of maize meal and fresh milk benefit more from the current zero-rating than consumers, whereas the bulk of the zero-rating benefits in respect of rice and brown bread accrue to consumers.
Efficacy of VAT zero-ratings It needs to be noted, however, that revenue lost through zero-rating has to be made up elsewhere, most probably through a higher VAT standard rate or higher personal income taxes.
Arguments in favour of VAT zero-rating are based on the assumption that it results in lower absolute and relative prices of zero-rated goods than would have been obtained otherwise. But it is unrealistic to assume that the full benefit of zero-rating will accrue to the consumer in the form of lower prices. The extent of the price change will depend on the market structure and the relevant price elasticities of supply and demand. Even when the differential tax treatment of goods has significant immediate effects on relative prices, these effects normally diminish over time as shifts in demand from taxed goods to non-taxed substitutes tend to raise the prices of non-taxed goods. Also, a significant number of poor consumers purchase their basic necessities from informal businesses that are not VAT vendors or businesses that are subject to limited competition. This is true especially in rural areas, but also applies to urban informal settlements where consumers effectively have limited alternative sources of supply. In such cases the benefits of a VAT zero-rating are unlikely to be passed on to consumers. A prime example is paraffin, where very little of the VAT zero-rating benefit has been passed on to the poor despite the subsequent price regulation measures - the nationally prescribed maximum retail price.
Implications for tax compliance and administration Differentiated VAT rates involve an increase in compliance costs for businesses, particularly small businesses. A firm that deals in products with different rates, for example, a grocer that sells zero-rated milk along with standard rated soft drinks, has to keep separate accounts for the different rated items. International experience indicates that firms with multiple-rate outputs have up to double the compliance costs of firms with single-rate outputs7.
4. Katz Commission: Interim Report of the Commission of Inquiry into certain aspects of the Tax Structure of South
Africa (1994) pg 113 5. National Treasury: The VAT Treatment of Merit Goods and Services (2007) pg 115. 6. Ibid. 7. Cnossen S.: VAT in South Africa: Single, Dual or Multiple Rate Structure? (1999) pg. 8.

2008 TAX STATISTICS
118
It is apparent that relief through VAT zero-rating assists the poor modestly in absolute rand terms, while benefiting the non-poor by substantially greater amounts. There are compelling arguments against further VAT zero-rating of goods in a context where expenditure programmes can provide effective relief from poverty and where such programmes are under-funded or not appropriately targeted.
The impact of VAT on the poor should be considered alongside other components of public expenditure and other forms of tax, most notably the income tax system which is in its design infinitely more suited to address the distributional objectives of government. Further attempts to provide relief to the poor through VAT exemptions and zero-ratings are likely to be both unsound in terms of tax policy and ineffective in terms of social policy. Instead of trying to amend and distort the VAT system, its strengths should be used to generate revenue that will enable the government to help the poor in more effective ways, such as targeted expenditure programmes in the form of social grants. This would be a more positive approach than manipulating VAT to the point where its merits as a revenue-productive, neutral tax instrument are eroded8. 8. Tait A.: Value-Added Tax: International Practice and Problems, IMF (1991) pg. 44
•
Tables
Table 4.1.1 Domestic VAT: Payments and refunds by sector, 2002/03 – 2005/06 ............... 119 Table 4.1.2 Domestic VAT: Payments and refunds by sector, 2002/03 – 2005/06 [percentage of
total]............................................................................................................................. 120
Table 4.2.1 Domestic VAT: Payments and refunds by payment category, 2002/03 – 2005/06.................................................................................................................... 121
Table 4.2.2 Domestic VAT: Payments and refunds by sector (for vendors that submit monthly returns), 2002/03 – 2005/06......................................................................................... 122
Table 4.2.3 Domestic VAT: Payments and refunds by sector (for vendors that submit bi-monthly returns in January), 2002/03 – 2005/06........................................................................ 123
Table 4.2.4 Domestic VAT: Payments and refunds by sector (for vendors that submit bi-monthly returns in February), 2002/03 – 2005/06...................................................................... 124
Table 4.2.5 Domestic VAT: Payments and refunds by sector (for vendors that submit quarterly, bi-annually, annually returns), 2002/03 – 2005/06 ...................................................... 125
Table 4.3.1 Domestic VAT: Payments and refunds by type of enterprise, 2002/03 – 2005/06.................................................................................................................... 126
Table 4.4.1 Domestic VAT: Vendors per annualised turnover (payments and refunds), 2006/07.................................................................................................................... 127
Table 4.5.1 Household consumption expenditure by main expenditure group and income deciles, 2005/06 ...................................................................................................... 128
Table 4.5.2 Household consumption expenditure by third expenditure group and income deciles for Food, beverages and tobacco, 2005/06................................................................... 129
Table 4.5.3 Household consumption expenditure by third expenditure group and income deciles for Food, beverages and tobacco, 2005/06 [percentage across deciles]....................... 130

Tabl
e 4.
1.1:
Dom
estic
VA
T: P
aym
ents
and
refu
nds
by s
ecto
r, 20
02/0
3 –
2005
/06
Sect
or20
02/0
320
03/0
420
04/0
520
05/0
6N
umbe
r of
vend
ors
Paym
ents
(R
mill
ion)
Ref
unds
(R m
illio
n)N
umbe
r of
vend
ors
Paym
ents
(R
mill
ion)
Ref
unds
(R m
illio
n)N
umbe
r of
vend
ors
Paym
ents
(R
mill
ion)
Ref
unds
(R m
illio
n)N
umbe
r of
vend
ors
Paym
ents
(R
mill
ion)
Ref
unds
(R m
illio
n)A
genc
ies
and
othe
r ser
vice
s33
727
6
025
-4 4
7035
994
7
306
-4 2
8337
316
8
161
-4 5
7943
040
10
652
-5
378
Agr
icul
ture
, for
estry
and
fish
ing
75 2
53
4 14
3
-4
236
75 9
57
3 89
1
-4
436
76 3
89
4 15
5
-4
768
80 0
28
5 41
2
-6
113
Bric
ks, c
eram
ic, g
lass
, cem
ent a
nd s
imila
r pro
duct
s1
772
409
-1
191
785
488
-1
291
936
548
-2
292
448
723
-3
45
Cat
erin
g an
d ac
com
mod
atio
n15
853
1
235
-202
16 4
16
1 37
1
-2
9717
267
1
555
-356
20 5
45
2 00
1
-4
62
Che
mic
als
and
chem
ical
, rub
ber a
nd p
last
ic p
rodu
cts
4 34
9
2
337
-1 3
644
443
2 50
3
-1
351
4 53
8
2
599
-1 2
584
885
2 78
7
-1
237
Clo
thin
g an
d fo
otw
ear
2 31
9
49
5
-193
2 30
2
61
5
-143
2 29
3
63
6
-140
2 36
0
61
9
-80
Coa
l and
pet
role
um p
rodu
cts
568
54
7
-831
573
1
071
-1 2
7360
3
1 71
3
-2
033
761
2
870
-2 7
67
Con
stru
ctio
n32
535
3
224
-1 0
3735
349
3
797
-1 0
6037
664
4
574
-1 3
7947
785
6
901
-1 9
30
Edu
catio
nal s
ervi
ces
1 86
3
16
5
-93
2 03
5
22
1
-193
2 12
2
26
9
-170
2 47
4
30
9
-139
Ele
ctric
ity, g
as a
nd w
ater
818
2
608
-182
885
2
502
-150
925
2
395
-110
1 11
7
2
123
-546
Fina
ncin
g, in
sura
nce,
real
est
ate
and
busi
ness
ser
vice
s13
4 60
5
21 6
26
-7 0
9714
4 61
6
25 1
01
-7 7
1915
8 25
0
29 4
56
-8 9
5920
1 01
2
37 9
09
-13
125
Food
, drin
k an
d to
bacc
o4
090
4 19
3
-1
720
4 09
1
4
419
-1 5
164
237
5 44
3
-1
435
4 80
5
5
884
-1 4
55
Leat
her,
leat
her g
oods
and
fur (
excl
. foo
twea
r and
clo
thin
g)37
4
105
-9
736
9
108
-6
638
4
114
-8
839
6
96
-5
9
Long
term
insu
ranc
e50
8
1 59
9
-4
1842
7
1 57
8
-4
6242
8
1 43
2
-7
4162
5
883
-1
372
Mac
hine
ry a
nd re
late
d ite
ms
9 41
4
2
571
-1 0
129
559
2 82
4
-8
489
835
3 05
4
-8
7410
749
3
438
-1 1
72
Med
ical
, den
tal a
nd o
ther
hea
lth a
nd v
eter
inar
y se
rvic
es16
585
2
135
-261
16 8
08
2 45
2
-1
6016
973
2
800
-138
17 9
08
3 33
6
-1
98
Met
al8
159
2 62
6
-2
148
8 16
6
2
643
-2 5
878
316
3 54
6
-2
624
8 94
5
3
558
-4 2
72
Min
ing
and
quar
ryin
g2
341
2 27
6
-8
869
2 42
7
2
430
-10
012
2 57
2
2
686
-9 7
573
113
5 00
5
-1
4 16
8
Oth
er m
anuf
actu
ring
indu
strie
s3
505
703
-1
174
3 57
6
83
2
-989
3 71
1
94
5
-1 0
344
164
1 07
4
-1
384
Pap
er, p
rintin
g an
d pu
blis
hing
4 59
7
1
445
-410
4 64
6
1
561
-406
4 84
1
1
706
-467
5 25
8
2
011
-494
Per
sona
l and
hou
seho
ld s
ervi
ces
3 90
0
26
5
-24
4 04
1
28
7
-29
4 31
3
34
4
-32
5 23
6
40
3
-48
Rec
reat
ion
and
cultu
ral s
ervi
ces
3 83
9
82
9
-215
3 93
8
89
5
-225
4 09
1
93
4
-284
4 57
9
1
237
-243
Res
earc
h an
d sc
ient
ific
inst
itute
s53
6
131
-1
0655
7
176
-1
0459
6
149
-1
2770
9
301
-7
4
Ret
ail t
rade
57 8
74
5 26
3
-2
343
58 3
14
6 18
3
-2
104
58 9
76
6 94
7
-2
470
64 5
81
8 54
8
-2
758
Sci
entif
ic, o
ptic
al a
nd s
imila
r equ
ipm
ent
768
15
3
-120
773
20
9
-89
798
18
7
-106
870
23
7
-91
Soc
ial a
nd re
late
d co
mm
unity
ser
vice
s2
436
174
-1
762
476
180
-2
172
549
212
-2
242
776
260
-2
11
Spe
cial
ised
repa
ir se
rvic
es10
783
70
7
-504
10 8
58
739
-2
1510
940
87
1
-172
11 6
06
1 05
0
-1
41
Text
iles
1 53
2
52
2
-282
1 57
4
59
0
-185
1 59
4
59
8
-181
1 68
7
56
8
-231
Tran
spor
t equ
ipm
ent
1 06
5
21
3
-274
1 10
7
22
8
-276
1 20
3
26
2
-289
1 44
4
36
4
-291
Tran
spor
t, st
orag
e an
d co
mm
unic
atio
ns14
973
5
977
-3 9
0715
299
7
200
-3 8
6016
270
8
011
-4 0
8119
126
9
195
-4 0
08
Veh
icle
s, p
arts
and
acc
esso
ries
5 04
7
1
852
-4 5
055
178
2 07
9
-4
009
5 31
4
2
568
-4 0
185
987
2 70
0
-5
987
Who
lesa
le tr
ade
28 6
27
4 64
4
-3
425
29 4
44
5 36
0
-2
882
30 2
85
5 80
7
-2
886
33 5
14
6 82
4
-3
650
Woo
d, w
ood
prod
ucts
and
furn
iture
3 08
9
42
7
-246
3 18
7
46
6
-245
3 31
4
60
4
-262
3 86
2
77
4
-195
Oth
er1
32
6
-633
16
-6
22
13
-422
10
-1
0
Tota
l48
7 73
6
81 6
31
-52
067
507
203
92
319
-5
2 52
853
0 86
5
105
294
-5
6 27
661
8 41
7
130
061
-7
4 63
61.
Inc
lude
s w
here
the
sect
or w
as in
dica
ted
as O
ther
or w
here
the
sect
or w
as le
ft bl
ank
on th
e re
turn
.
CHAPTER 4: VALUE-ADDED TAX
119

Tabl
e 4.
1.2:
Dom
estic
VA
T: P
aym
ents
and
refu
nds
by s
ecto
r, 20
02/0
3 –
2005
/06
[per
cent
age
of to
tal]
Sect
or20
02/0
320
03/0
420
04/0
520
05/0
6N
umbe
r of
vend
ors
Paym
ents
Ref
unds
Num
ber o
f ve
ndor
sPa
ymen
tsR
efun
dsN
umbe
r of
vend
ors
Paym
ents
Ref
unds
Num
ber o
f ve
ndor
sPa
ymen
tsR
efun
ds
Age
ncie
s an
d ot
her s
ervi
ces
6.9%
7.4%
8.6%
7.1%
7.9%
8.2%
7.0%
7.8%
8.1%
7.0%
8.2%
7.2%
Agr
icul
ture
, for
estry
and
fish
ing
15.4
%5.
1%8.
1%15
.0%
4.2%
8.4%
14.4
%3.
9%8.
5%12
.9%
4.2%
8.2%
Bric
ks, c
eram
ic, g
lass
, cem
ent a
nd s
imila
r pro
duct
s0.
4%0.
5%0.
2%0.
4%0.
5%0.
2%0.
4%0.
5%0.
4%0.
4%0.
6%0.
5%
Cat
erin
g an
d ac
com
mod
atio
n3.
3%1.
5%0.
4%3.
2%1.
5%0.
6%3.
3%1.
5%0.
6%3.
3%1.
5%0.
6%
Che
mic
als
and
chem
ical
, rub
ber a
nd p
last
ic p
rodu
cts
0.9%
2.9%
2.6%
0.9%
2.7%
2.6%
0.9%
2.5%
2.2%
0.8%
2.1%
1.7%
Clo
thin
g an
d fo
otw
ear
0.5%
0.6%
0.4%
0.5%
0.7%
0.3%
0.4%
0.6%
0.2%
0.4%
0.5%
0.1%
Coa
l and
pet
role
um p
rodu
cts
0.1%
0.7%
1.6%
0.1%
1.2%
2.4%
0.1%
1.6%
3.6%
0.1%
2.2%
3.7%
Con
stru
ctio
n6.
7%3.
9%2.
0%7.
0%4.
1%2.
0%7.
1%4.
3%2.
5%7.
7%5.
3%2.
6%
Edu
catio
nal s
ervi
ces
0.4%
0.2%
0.2%
0.4%
0.2%
0.4%
0.4%
0.3%
0.3%
0.4%
0.2%
0.2%
Ele
ctric
ity, g
as a
nd w
ater
0.2%
3.2%
0.3%
0.2%
2.7%
0.3%
0.2%
2.3%
0.2%
0.2%
1.6%
0.7%
Fina
ncin
g, in
sura
nce,
real
est
ate
and
busi
ness
ser
vice
s27
.6%
26.5
%13
.6%
28.5
%27
.2%
14.7
%29
.8%
28.0
%15
.9%
32.5
%29
.1%
17.6
%
Food
, drin
k an
d to
bacc
o0.
8%5.
1%3.
3%0.
8%4.
8%2.
9%0.
8%5.
2%2.
6%0.
8%4.
5%2.
0%
Leat
her,
leat
her g
oods
and
fur (
excl
. foo
twea
r and
clo
thin
g)0.
1%0.
1%0.
2%0.
1%0.
1%0.
1%0.
1%0.
1%0.
2%0.
1%0.
1%0.
1%
Long
term
insu
ranc
e0.
1%2.
0%0.
8%0.
1%1.
7%0.
9%0.
1%1.
4%1.
3%0.
1%0.
7%1.
8%
Mac
hine
ry a
nd re
late
d ite
ms
1.9%
3.2%
1.9%
1.9%
3.1%
1.6%
1.9%
2.9%
1.6%
1.7%
2.6%
1.6%
Med
ical
, den
tal a
nd o
ther
hea
lth a
nd v
eter
inar
y se
rvic
es3.
4%2.
6%0.
5%3.
3%2.
7%0.
3%3.
2%2.
7%0.
2%2.
9%2.
6%0.
3%
Met
al1.
7%3.
2%4.
1%1.
6%2.
9%4.
9%1.
6%3.
4%4.
7%1.
4%2.
7%5.
7%
Min
ing
and
quar
ryin
g0.
5%2.
8%17
.0%
0.5%
2.6%
19.1
%0.
5%2.
6%17
.3%
0.5%
3.8%
19.0
%
Oth
er m
anuf
actu
ring
indu
strie
s0.
7%0.
9%2.
3%0.
7%0.
9%1.
9%0.
7%0.
9%1.
8%0.
7%0.
8%1.
9%
Pap
er, p
rintin
g an
d pu
blis
hing
0.9%
1.8%
0.8%
0.9%
1.7%
0.8%
0.9%
1.6%
0.8%
0.9%
1.5%
0.7%
Per
sona
l and
hou
seho
ld s
ervi
ces
0.8%
0.3%
0.0%
0.8%
0.3%
0.1%
0.8%
0.3%
0.1%
0.8%
0.3%
0.1%
Rec
reat
ion
and
cultu
ral s
ervi
ces
0.8%
1.0%
0.4%
0.8%
1.0%
0.4%
0.8%
0.9%
0.5%
0.7%
1.0%
0.3%
Res
earc
h an
d sc
ient
ific
inst
itute
s0.
1%0.
2%0.
2%0.
1%0.
2%0.
2%0.
1%0.
1%0.
2%0.
1%0.
2%0.
1%
Ret
ail t
rade
11.9
%6.
4%4.
5%11
.5%
6.7%
4.0%
11.1
%6.
6%4.
4%10
.4%
6.6%
3.7%
Sci
entif
ic, o
ptic
al a
nd s
imila
r equ
ipm
ent
0.2%
0.2%
0.2%
0.2%
0.2%
0.2%
0.2%
0.2%
0.2%
0.1%
0.2%
0.1%
Soc
ial a
nd re
late
d co
mm
unity
ser
vice
s0.
5%0.
2%0.
3%0.
5%0.
2%0.
4%0.
5%0.
2%0.
4%0.
4%0.
2%0.
3%
Spe
cial
ised
repa
ir se
rvic
es2.
2%0.
9%1.
0%2.
1%0.
8%0.
4%2.
1%0.
8%0.
3%1.
9%0.
8%0.
2%
Text
iles
0.3%
0.6%
0.5%
0.3%
0.6%
0.4%
0.3%
0.6%
0.3%
0.3%
0.4%
0.3%
Tran
spor
t equ
ipm
ent
0.2%
0.3%
0.5%
0.2%
0.2%
0.5%
0.2%
0.2%
0.5%
0.2%
0.3%
0.4%
Tran
spor
t, st
orag
e an
d co
mm
unic
atio
ns3.
1%7.
3%7.
5%3.
0%7.
8%7.
3%3.
1%7.
6%7.
3%3.
1%7.
1%5.
4%
Veh
icle
s, p
arts
and
acc
esso
ries
1.0%
2.3%
8.7%
1.0%
2.3%
7.6%
1.0%
2.4%
7.1%
1.0%
2.1%
8.0%
Who
lesa
le tr
ade
5.9%
5.7%
6.6%
5.8%
5.8%
5.5%
5.7%
5.5%
5.1%
5.4%
5.2%
4.9%
Woo
d, w
ood
prod
ucts
and
furn
iture
0.6%
0.5%
0.5%
0.6%
0.5%
0.5%
0.6%
0.6%
0.5%
0.6%
0.6%
0.3%
Oth
er0.
0%0.
0%0.
0%0.
0%0.
0%0.
0%0.
0%0.
0%0.
0%0.
0%0.
0%0.
0%
Tota
l10
0.0%
100.
0%10
0.0%
100.
0%10
0.0%
100.
0%10
0.0%
100.
0%10
0.0%
100.
0%10
0.0%
100.
0%
Perc
enta
ge o
f tot
al
2008 TAX STATISTICS
120

Tabl
e 4.
2.1:
Dom
estic
VA
T: P
aym
ents
and
refu
nds
by p
aym
ent c
ateg
ory,
200
2/03
– 2
005/
06Pa
ymen
t cat
egor
y20
02/0
320
03/0
420
04/0
520
05/0
6N
umbe
r of
vend
ors
Paym
ents
(R
mill
ion)
Ref
unds
(R m
illio
n)N
umbe
r of
vend
ors
Paym
ents
(R
mill
ion)
Ref
unds
(R m
illio
n)N
umbe
r of
vend
ors
Paym
ents
(R
mill
ion)
Ref
unds
(R m
illio
n)N
umbe
r of
vend
ors
Paym
ents
(R
mill
ion)
Ref
unds
(R m
illio
n)A
: M
onth
ly24
159
56 6
75
-4
2 57
124
524
64 8
00
-4
2 25
025
035
74 3
28
-4
4 34
931
016
89 7
03
-5
7 85
0
B:
Bi-M
onth
ly (J
an)
185
556
10
601
-3 6
1019
2 63
7
11 7
46
-3
895
203
721
13
370
-4 7
9123
8 49
7
17 3
32
-6
736
C:
Bi-M
onth
ly (F
eb)
245
799
13
896
-5 5
9025
8 62
1
15 4
15
-6
091
271
438
17
295
-6 8
6931
8 17
7
22 5
99
-9
716
D:
4 M
onth
ly–
–
–
–
–
–
–
–
–
1
063
24
-12
E:
6 M
onth
ly31
196
444
-289
30 5
05
33
9
-2
8729
776
284
-263
28 4
56
38
2
-3
18
F:A
nnua
lly1
026
15
-791
6
20
-589
5
18
-41
208
21
-5
Tota
l48
7 73
6
81 6
31
-5
2 06
750
7 20
3
92 3
19
-5
2 52
853
0 86
5
105
294
-5
6 27
661
8 41
7
130
061
-7
4 63
6
A:
Mon
thly
5.0%
69.4
%81
.8%
4.8%
70.2
%80
.4%
4.7%
70.6
%78
.8%
5.0%
69.0
%77
.5%
B:
Bi-M
onth
ly (J
an)
38.0
%13
.0%
6.9%
38.0
%12
.7%
7.4%
38.4
%12
.7%
8.5%
38.6
%13
.3%
9.0%
C:
Bi-M
onth
ly (F
eb)
50.4
%17
.0%
10.7
%51
.0%
16.7
%11
.6%
51.1
%16
.4%
12.2
%51
.5%
17.4
%13
.0%
D:
4 M
onth
ly0.
0%0.
0%0.
0%0.
0%0.
0%0.
0%0.
0%0.
0%0.
0%0.
2%0.
0%0.
0%
E:
6 M
onth
ly6.
4%0.
5%0.
6%6.
0%0.
4%0.
5%5.
6%0.
3%0.
5%4.
6%0.
3%0.
4%
F:A
nnua
lly0.
2%0.
0%0.
0%0.
2%0.
0%0.
0%0.
2%0.
0%0.
0%0.
2%0.
0%0.
0%
Tota
l10
0.0%
100.
0%10
0.0%
100.
0%10
0.0%
100.
0%10
0.0%
100.
0%10
0.0%
100.
0%10
0.0%
100.
0%
Perc
enta
ge o
f tot
al
CHAPTER 4: VALUE-ADDED TAX
121

Tabl
e 4.
2.2:
Dom
estic
VA
T: P
aym
ents
and
refu
nds
by s
ecto
r (fo
r ven
dors
that
sub
mit
mon
thly
retu
rns)
, 200
2/03
– 2
005/
06Se
ctor
2002
/03
2003
/04
2004
/05
2005
/06
Num
ber o
f ve
ndor
sPa
ymen
ts
(R m
illio
n)R
efun
ds(R
mill
ion)
Num
ber o
f ve
ndor
sPa
ymen
ts
(R m
illio
n)R
efun
ds(R
mill
ion)
Num
ber o
f ve
ndor
sPa
ymen
ts
(R m
illio
n)R
efun
ds(R
mill
ion)
Num
ber o
f ve
ndor
sPa
ymen
ts
(R m
illio
n)R
efun
ds(R
mill
ion)
Age
ncie
s an
d ot
her s
ervi
ces
2 21
6
4
035
-3 7
882
284
5 00
5
-3
544
2 27
4
5
592
-3 7
632
645
7 42
6
-4
399
Agr
icul
ture
, for
estry
and
fish
ing
1 11
6
1
778
-1 5
901
140
1 67
5
-1
588
1 14
5
1
988
-1 7
911
338
2 47
7
-2
330
Bric
ks, c
eram
ic, g
lass
, cem
ent a
nd s
imila
r pro
duct
s14
1
291
-9
513
0
349
-1
0713
9
378
-1
8718
6
516
-2
89
Cat
erin
g an
d ac
com
mod
atio
n48
5
608
-4
047
7
651
-8
746
9
722
-9
353
2
869
-8
8
Che
mic
als
and
chem
ical
, rub
ber a
nd p
last
ic p
rodu
cts
618
1
969
-1 2
5062
4
2 09
5
-1
251
612
2
155
-1 1
5970
3
2 29
9
-1
122
Clo
thin
g an
d fo
otw
ear
165
29
9
-157
161
41
1
-117
162
43
0
-111
169
42
0
-55
Coa
l and
pet
role
um p
rodu
cts
105
52
3
-815
105
1
043
-1 2
5111
4
1 68
1
-2
012
143
2
826
-2 7
41
Con
stru
ctio
n1
390
1 56
1
-6
351
368
1 89
9
-5
481
393
2 32
9
-7
181
888
3 64
1
-1
002
Edu
catio
nal s
ervi
ces
67
69
-60
67
83
-140
70
10
7
-117
74
12
5
-94
Ele
ctric
ity, g
as a
nd w
ater
64
2
554
-158
65
2
441
-129
69
2
335
-74
93
2
039
-522
Fina
ncin
g, in
sura
nce,
real
est
ate
and
busi
ness
ser
vice
s5
044
13 8
42
-4 6
975
385
16 2
29
-4 9
625
731
18 9
78
-5 2
347
756
23 2
20
-6 7
69
Food
, drin
k an
d to
bacc
o59
1
3 98
3
-1
591
566
4
185
-1 3
7855
7
5 18
6
-1
289
635
5
590
-1 2
90
Leat
her,
leat
her g
oods
and
fur (
excl
. foo
twea
r and
clo
thin
g)41
70
-9
140
72
-5
840
78
-7
842
63
-5
1
Long
term
insu
ranc
e20
7
1 55
6
-3
5518
9
1 53
7
-3
7318
9
1 40
1
-6
0540
1
851
-1
204
Mac
hine
ry a
nd re
late
d ite
ms
671
1
808
-843
676
1
989
-708
664
2
154
-732
777
2
381
-999
Med
ical
, den
tal a
nd o
ther
hea
lth a
nd v
eter
inar
y se
rvic
es41
4
1 03
5
-1
9540
7
1 26
8
-8
440
1
1 49
6
-6
345
4
1 68
3
-9
5
Met
al77
3
1 85
1
-2
055
770
1
815
-2 4
9976
2
2 66
0
-2
524
901
2
517
-4 1
13
Min
ing
and
quar
ryin
g47
2
1 99
2
-8
702
498
2
147
-9 8
5451
9
2 37
4
-9
583
656
4
607
-13
867
Oth
er m
anuf
actu
ring
indu
strie
s29
8
486
-1
116
309
58
9
-932
308
67
9
-965
347
75
4
-1 3
13
Pap
er, p
rintin
g an
d pu
blis
hing
344
1
089
-340
337
1
162
-342
337
1
271
-375
399
1
536
-424
Per
sona
l and
hou
seho
ld s
ervi
ces
94
84
-391
99
-1
91
12
3
-397
127
-5
Rec
reat
ion
and
cultu
ral s
ervi
ces
195
58
4
-108
192
60
0
-111
192
63
1
-176
229
86
4
-132
Res
earc
h an
d sc
ient
ific
inst
itute
s41
81
-9
043
119
-8
340
86
-1
0247
232
-4
6
Ret
ail t
rade
3 08
4
3
470
-1 7
343
100
4 18
2
-1
509
3 22
7
4
717
-1 7
854
059
5 88
3
-1
929
Sci
entif
ic, o
ptic
al a
nd s
imila
r equ
ipm
ent
55
94
-110
54
14
1
-77
54
11
7
-95
68
15
4
-74
Soc
ial a
nd re
late
d co
mm
unity
ser
vice
s21
7
41
-8
821
7
50
-1
1522
1
62
-1
1322
2
78
-8
0
Spe
cial
ised
repa
ir se
rvic
es26
3
203
-4
5525
2
188
-1
6824
3
254
-1
1527
5
302
-6
3
Text
iles
202
39
3
-249
198
45
5
-160
190
46
1
-158
220
43
1
-197
Tran
spor
t equ
ipm
ent
84
15
0
-231
84
16
5
-218
85
19
1
-234
112
26
3
-230
Tran
spor
t, st
orag
e an
d co
mm
unic
atio
ns1
170
5 07
6
-3
391
1 12
6
6
275
-3 3
121
169
6 94
3
-3
534
1 32
2
7
853
-3 2
88
Veh
icle
s, p
arts
and
acc
esso
ries
597
1
567
-4 4
4960
1
1 77
0
-3
962
605
2
226
-3 9
6374
5
2 32
9
-5
912
Who
lesa
le tr
ade
2 72
5
3
308
-2 8
882
751
3 85
5
-2
377
2 74
5
4
177
-2 3
753
246
4 89
4
-2
979
Woo
d, w
ood
prod
ucts
and
furn
iture
207
22
3
-199
214
24
2
-197
215
33
6
-220
232
44
6
-139
Oth
er1
3
3
-53
13
-6
3
9
-43
6
-1
0
Tota
l24
159
56
675
-4
2 57
124
524
64
800
-4
2 25
025
035
74
328
-4
4 34
931
016
89
703
-5
7 85
01.
Inc
lude
s w
here
the
sect
or w
as in
dica
ted
as O
ther
or w
here
the
sect
or w
as le
ft bl
ank
on th
e re
turn
.
2008 TAX STATISTICS
122
Tabl
e 4.
2.3:
Dom
estic
VA
T: P
aym
ents
and
refu
nds
by s
ecto
r (fo
r ven
dors
that
sub
mit
bi-m
onth
ly re
turn
s in
Jan
uary
), 20
02/0
3 –
2005
/06
Sect
or20
02/0
320
03/0
420
04/0
520
05/0
6N
umbe
r of
vend
ors
Paym
ents
(R
mill
ion)
Ref
unds
(R m
illio
n)N
umbe
r of
vend
ors
Paym
ents
(R
mill
ion)
Ref
unds
(R m
illio
n)N
umbe
r of
vend
ors
Paym
ents
(R
mill
ion)
Ref
unds
(R m
illio
n)N
umbe
r of
vend
ors
Paym
ents
(R
mill
ion)
Ref
unds
(R m
illio
n)A
genc
ies
and
othe
r ser
vice
s13
863
87
0
-317
14 6
99
1 02
7
-3
3015
410
1
158
-360
17 8
30
1 43
8
-4
40
Agr
icul
ture
, for
estry
and
fish
ing
13 9
60
554
-7
0314
359
53
5
-766
14 8
05
555
-8
5016
096
70
7
-980
Bric
ks, c
eram
ic, g
lass
, cem
ent a
nd s
imila
r pro
duct
s72
9
47
-9
738
54
-881
2
69
-1
897
9
85
-2
3
Cat
erin
g an
d ac
com
mod
atio
n6
598
265
-7
06
801
304
-8
77
107
356
-1
128
454
475
-1
51
Che
mic
als
and
chem
ical
, rub
ber a
nd p
last
ic p
rodu
cts
1 64
8
16
2
-47
1 65
7
17
9
-40
1 70
2
19
2
-45
1 81
2
22
0
-52
Clo
thin
g an
d fo
otw
ear
946
90
-15
926
94
-10
921
96
-11
962
92
-12
Coa
l and
pet
role
um p
rodu
cts
204
11
-819
7
12
-1
021
8
17
-9
269
21
-8
Con
stru
ctio
n13
597
72
8
-151
14 7
80
833
-2
1515
764
98
3
-267
19 9
38
1 46
3
-3
95
Edu
catio
nal s
ervi
ces
774
44
-18
857
62
-27
902
64
-31
1 06
3
68
-27
Ele
ctric
ity, g
as a
nd w
ater
303
22
-12
355
28
-837
1
25
-1
246
4
34
-1
1
Fina
ncin
g, in
sura
nce,
real
est
ate
and
busi
ness
ser
vice
s56
133
3
466
-970
59 9
52
3 88
2
-1
127
66 3
07
4 62
8
-1
650
84 0
54
6 52
7
-2
868
Food
, drin
k an
d to
bacc
o1
502
93
-5
31
468
99
-5
41
573
110
-5
91
743
121
-8
8
Leat
her,
leat
her g
oods
and
fur (
excl
. foo
twea
r and
clo
thin
g)13
9
14
-2
135
13
-214
1
16
-3
141
14
-5
Long
term
insu
ranc
e14
4
13
-3
611
0
16
-5
710
4
11
-7
199
13
-8
0
Mac
hine
ry a
nd re
late
d ite
ms
3 97
4
35
4
-74
4 02
1
39
8
-63
4 22
1
42
7
-61
4 55
8
50
7
-74
Med
ical
, den
tal a
nd o
ther
hea
lth a
nd v
eter
inar
y se
rvic
es7
386
510
-3
07
456
550
-3
57
543
607
-3
87
877
741
-4
4
Met
al3
382
349
-3
63
344
372
-3
63
422
404
-4
23
572
475
-6
4
Min
ing
and
quar
ryin
g75
2
116
-5
279
0
118
-4
884
6
128
-8
11
000
159
-1
27
Oth
er m
anuf
actu
ring
indu
strie
s1
469
98
-2
61
424
111
-2
51
533
118
-3
11
675
145
-3
2
Pap
er, p
rintin
g an
d pu
blis
hing
2 01
0
16
1
-33
2 01
0
18
3
-34
2 09
8
20
4
-56
2 25
9
22
8
-35
Per
sona
l and
hou
seho
ld s
ervi
ces
1 66
0
91
-91
742
85
-1
21
868
105
-1
22
233
123
-1
6
Rec
reat
ion
and
cultu
ral s
ervi
ces
1 59
7
11
3
-49
1 63
6
14
0
-50
1 73
9
13
7
-52
1 89
4
15
7
-57
Res
earc
h an
d sc
ient
ific
inst
itute
s22
4
22
-1
123
4
27
-1
526
0
31
-1
430
3
31
-9
Ret
ail t
rade
24 2
86
784
-2
5424
211
87
2
-249
24 3
32
988
-2
8926
316
1
157
-360
Sci
entif
ic, o
ptic
al a
nd s
imila
r equ
ipm
ent
331
30
-632
1
33
-6
327
31
-535
7
37
-7
Soc
ial a
nd re
late
d co
mm
unity
ser
vice
s1
137
57
-4
31
153
60
-5
31
181
73
-6
21
291
83
-7
1
Spe
cial
ised
repa
ir se
rvic
es4
712
228
-2
34
668
251
-2
04
742
278
-2
55
009
333
-3
1
Text
iles
621
58
-12
619
61
-10
618
59
-10
662
63
-14
Tran
spor
t equ
ipm
ent
434
30
-21
441
27
-27
492
31
-26
574
45
-26
Tran
spor
t, st
orag
e an
d co
mm
unic
atio
ns6
080
414
-2
346
210
417
-2
066
581
479
-2
097
709
593
-3
04
Veh
icle
s, p
arts
and
acc
esso
ries
2 03
6
12
5
-23
2 11
4
14
0
-22
2 13
1
15
3
-25
2 33
7
16
8
-30
Who
lesa
le tr
ade
11 6
73
596
-2
3811
905
66
6
-221
12 2
89
722
-2
3313
393
87
0
-271
Woo
d, w
ood
prod
ucts
and
furn
iture
1 23
4
86
-24
1 28
4
95
-22
1 35
1
11
6
-19
1 56
4
14
0
-24
Oth
er1
18
0
-020
1
-0
10
0
-010
0
-0
Tota
l18
5 55
6
10 6
01
-3 6
1019
2 63
7
11 7
46
-3 8
9520
3 72
1
13 3
70
-4 7
9123
8 49
7
17 3
32
-6 7
361.
Inc
lude
s w
here
the
sect
or w
as in
dica
ted
as O
ther
or w
here
the
sect
or w
as le
ft bl
ank
on th
e re
turn
.
CHAPTER 4: VALUE-ADDED TAX
123

Tabl
e 4.
2.4:
Dom
estic
VA
T: P
aym
ents
and
refu
nds
by s
ecto
r (fo
r ven
dors
that
sub
mit
bi-m
onth
ly re
turn
s in
Feb
ruar
y), 2
002/
03 –
200
5/06
Sect
or20
02/0
320
03/0
420
04/0
520
05/0
6N
umbe
r of
vend
ors
Paym
ents
(R
mill
ion)
Ref
unds
(R m
illio
n)N
umbe
r of
vend
ors
Paym
ents
(R
mill
ion)
Ref
unds
(R m
illio
n)N
umbe
r of
vend
ors
Paym
ents
(R
mill
ion)
Ref
unds
(R m
illio
n)N
umbe
r of
vend
ors
Paym
ents
(R
mill
ion)
Ref
unds
(R m
illio
n)A
genc
ies
and
othe
r ser
vice
s17
641
1
119
-364
19 0
00
1 27
2
-4
0919
618
1
409
-455
22 4
77
1 78
6
-5
38
Agr
icul
ture
, for
estry
and
fish
ing
28 7
41
1 36
3
-1
651
29 7
13
1 33
7
-1
795
30 4
29
1 32
5
-1
864
33 7
79
1 84
0
-2
481
Bric
ks, c
eram
ic, g
lass
, cem
ent a
nd s
imila
r pro
duct
s90
2
71
-1
691
7
85
-1
398
5
101
-2
41
280
122
-3
3
Cat
erin
g an
d ac
com
mod
atio
n8
767
361
-9
29
134
414
-1
239
685
474
-1
5011
509
65
4
-223
Che
mic
als
and
chem
ical
, rub
ber a
nd p
last
ic p
rodu
cts
2 08
3
20
7
-67
2 16
2
22
8
-59
2 22
4
25
1
-55
2 36
8
26
9
-63
Clo
thin
g an
d fo
otw
ear
1 20
8
10
6
-21
1 21
5
11
0
-15
1 21
0
11
1
-17
1 22
6
10
7
-13
Coa
l and
pet
role
um p
rodu
cts
259
13
-927
1
15
-1
227
0
16
-1
234
9
23
-1
7
Con
stru
ctio
n17
547
93
4
-251
19 2
00
1 06
5
-2
9720
505
1
263
-393
25 9
09
1 79
6
-5
33
Edu
catio
nal s
ervi
ces
1 02
1
51
-15
1 11
1
77
-26
1 15
0
98
-22
1 32
9
11
6
-18
Ele
ctric
ity, g
as a
nd w
ater
451
32
-12
465
32
-13
485
36
-24
559
50
-14
Fina
ncin
g, in
sura
nce,
real
est
ate
and
busi
ness
ser
vice
s72
778
4
310
-1 4
2778
643
4
979
-1 6
2785
596
5
839
-2 0
7210
7 87
6
8 13
5
-3
479
Food
, drin
k an
d to
bacc
o1
995
117
-7
62
055
134
-8
32
105
147
-8
72
421
173
-7
8
Leat
her,
leat
her g
oods
and
fur (
excl
. foo
twea
r and
clo
thin
g)19
4
21
-4
194
23
-520
3
20
-7
213
20
-4
Long
term
insu
ranc
e15
6
30
-2
712
7
25
-3
213
4
19
-6
612
5
19
-8
7
Mac
hine
ry a
nd re
late
d ite
ms
4 76
9
40
9
-95
4 86
2
43
8
-77
4 95
0
47
3
-81
5 40
0
55
0
-100
Med
ical
, den
tal a
nd o
ther
hea
lth a
nd v
eter
inar
y se
rvic
es8
784
591
-3
58
944
634
-4
19
029
696
-3
89
543
912
-5
8
Met
al4
004
427
-5
64
052
455
-5
24
132
482
-5
84
466
566
-9
5
Min
ing
and
quar
ryin
g1
117
168
-1
151
138
166
-1
101
206
184
-9
31
455
238
-1
74
Oth
er m
anuf
actu
ring
indu
strie
s1
737
119
-3
21
842
132
-3
31
869
148
-3
82
134
175
-3
9
Pap
er, p
rintin
g an
d pu
blis
hing
2 24
3
19
6
-36
2 29
9
21
5
-30
2 40
6
23
1
-35
2 59
2
24
7
-34
Per
sona
l and
hou
seho
ld s
ervi
ces
2 14
6
90
-12
2 20
8
10
3
-15
2 35
4
11
7
-17
2 89
5
15
3
-27
Rec
reat
ion
and
cultu
ral s
ervi
ces
2 04
7
13
2
-58
2 11
0
15
4
-63
2 16
0
16
7
-56
2 44
0
21
5
-54
Res
earc
h an
d sc
ient
ific
inst
itute
s27
1
27
-5
280
29
-629
6
32
-1
135
1
38
-1
9
Ret
ail t
rade
30 5
02
1 01
0
-3
5530
998
1
128
-346
31 4
15
1 24
2
-3
9734
115
1
506
-468
Sci
entif
ic, o
ptic
al a
nd s
imila
r equ
ipm
ent
382
29
-539
8
35
-6
417
39
-644
4
47
-1
0
Soc
ial a
nd re
late
d co
mm
unity
ser
vice
s1
081
76
-4
61
105
69
-4
91
146
77
-4
91
257
100
-6
0
Spe
cial
ised
repa
ir se
rvic
es5
807
276
-2
65
936
300
-2
75
954
339
-3
26
301
414
-4
7
Text
iles
709
70
-21
757
74
-15
786
79
-13
805
74
-21
Tran
spor
t equ
ipm
ent
545
33
-22
580
36
-31
624
40
-28
755
56
-35
Tran
spor
t, st
orag
e an
d co
mm
unic
atio
ns7
611
486
-2
807
955
508
-3
428
511
588
-3
3810
016
74
8
-416
Veh
icle
s, p
arts
and
acc
esso
ries
2 41
4
15
9
-33
2 46
3
17
0
-25
2 57
8
18
9
-30
2 90
0
20
2
-44
Who
lesa
le tr
ade
14 2
29
740
-3
0014
788
83
9
-284
15 2
50
908
-2
7716
821
1
059
-400
Woo
d, w
ood
prod
ucts
and
furn
iture
1 64
7
11
8
-23
1 68
9
13
0
-27
1 74
7
15
2
-24
2 05
8
18
7
-32
Oth
er1
11
3
-010
2
-0
9
3
-09
3
–
Tota
l24
5 79
9
13 8
96
-5 5
9025
8 62
1
15 4
15
-6 0
9127
1 43
8
17 2
95
-6 8
6931
8 17
7
22 5
99
-9 7
161.
Inc
lude
s w
here
the
sect
or w
as in
dica
ted
as O
ther
or w
here
the
sect
or w
as le
ft bl
ank
on th
e re
turn
.
2008 TAX STATISTICS
124
Tabl
e 4.
2.5:
Dom
estic
VA
T: P
aym
ents
and
refu
nds
by s
ecto
r (fo
r ven
dors
that
sub
mit
quar
terly
, bi-a
nnua
lly, a
nnua
lly re
turn
s), 2
002/
03 –
200
5/06
Sect
or20
02/0
320
03/0
420
04/0
520
05/0
6N
umbe
r of
vend
ors
Paym
ents
(R
mill
ion)
Ref
unds
(R m
illio
n)N
umbe
r of
vend
ors
Paym
ents
(R
mill
ion)
Ref
unds
(R m
illio
n)N
umbe
r of
vend
ors
Paym
ents
(R
mill
ion)
Ref
unds
(R m
illio
n)N
umbe
r of
vend
ors
Paym
ents
(R
mill
ion)
Ref
unds
(R m
illio
n)A
genc
ies
and
othe
r ser
vice
s7
0
-0
11
2
-014
1
-0
88
2
-0
Agr
icul
ture
, for
estry
and
fish
ing
31 4
36
448
-2
9230
745
34
4
-288
30 0
10
286
-2
6428
815
38
8
-321
Bric
ks, c
eram
ic, g
lass
, cem
ent a
nd s
imila
r pro
duct
s–
–
–
–
–
–
–
–
–
3
0
-0
Cat
erin
g an
d ac
com
mod
atio
n3
2
-0
4
2
-16
2
-0
50
4
-1
Che
mic
als
and
chem
ical
, rub
ber a
nd p
last
ic p
rodu
cts
–
–
–
–
–
–
–
–
–
2
0
–
Clo
thin
g an
d fo
otw
ear
–
–
–
–
–
–
–
–
–
3
0
-0
Coa
l and
pet
role
um p
rodu
cts
–
–
–
–
–
–
1
–
-0–
–
–
Con
stru
ctio
n1
0
–
1
0
–
2
0
-0
50
1
-1
Edu
catio
nal s
ervi
ces
1
0
–
–
–
–
–
–
–
8
0
-0
Ele
ctric
ity, g
as a
nd w
ater
–
–
–
–
–
–
–
–
–
1
0
-0
Fina
ncin
g, in
sura
nce,
real
est
ate
and
busi
ness
ser
vice
s65
0
9
-3
636
11
-361
6
11
-3
1 32
6
27
-8
Food
, drin
k an
d to
bacc
o2
0
-0
2
0
-02
0
–
6
0
-0
Leat
her,
leat
her g
oods
and
fur (
excl
. foo
twea
r and
clo
thin
g)–
–
–
–
–
–
–
–
–
–
–
–
Long
term
insu
ranc
e1
0
-0
1
0
–
1
0
–
–
–
–
Mac
hine
ry a
nd re
late
d ite
ms
–
–
–
–
–
–
–
–
–
14
0
-0
Med
ical
, den
tal a
nd o
ther
hea
lth a
nd v
eter
inar
y se
rvic
es1
0
-0
1
–
-0–
–
–
34
1
-0
Met
al–
–
–
–
–
–
–
–
–
6
0
-0
Min
ing
and
quar
ryin
g–
–
–
1
0
–
1
0
–
2
0
–
Oth
er m
anuf
actu
ring
indu
strie
s1
–
-0
1
0
–
1
0
–
8
0
-0
Pap
er, p
rintin
g an
d pu
blis
hing
–
–
–
–
–
–
–
–
–
8
0
-0
Per
sona
l and
hou
seho
ld s
ervi
ces
–
–
–
–
–
–
–
–
–
11
0
-0
Rec
reat
ion
and
cultu
ral s
ervi
ces
–
–
–
–
–
–
–
–
–
16
0
-1
Res
earc
h an
d sc
ient
ific
inst
itute
s–
–
–
–
–
–
–
–
–
8
0
-0
Ret
ail t
rade
2
0
-05
0
-0
2
0
–
91
1
-1
Sci
entif
ic, o
ptic
al a
nd s
imila
r equ
ipm
ent
–
–
–
–
–
–
–
–
–
1
0
–
Soc
ial a
nd re
late
d co
mm
unity
ser
vice
s1
0
–
1
0
-01
0
–
6
0
-0
Spe
cial
ised
repa
ir se
rvic
es1
0
–
2
0
–
1
0
–
21
0
-0
Text
iles
–
–
–
–
–
–
–
–
–
–
–
–
Tran
spor
t equ
ipm
ent
2
0
–
2
0
–
2
0
–
3
0
-0
Tran
spor
t, st
orag
e an
d co
mm
unic
atio
ns11
2
0
-1
8
0
-09
1
-0
79
1
-0
Veh
icle
s, p
arts
and
acc
esso
ries
–
–
–
–
–
–
–
–
–
5
0
-0
Who
lesa
le tr
ade
–
–
–
–
–
–
1
0
–
54
1
-0
Woo
d, w
ood
prod
ucts
and
furn
iture
1
0
–
–
–
–
1
0
–
8
1
-0
Oth
er1
–
–
–
–
–
–
–
–
–
–
–
–
Tota
l32
222
45
9
-297
31 4
21
359
-2
9230
671
30
1
-267
30 7
27
427
-3
341.
Inc
lude
s w
here
the
sect
or w
as in
dica
ted
as O
ther
or w
here
the
sect
or w
as le
ft bl
ank
on th
e re
turn
.
CHAPTER 4: VALUE-ADDED TAX
125

Tabl
e 4.
3.1:
Dom
estic
VA
T: P
aym
ents
and
refu
nds
by ty
pe o
f ent
erpr
ise,
200
2/03
– 2
005/
06Ty
pe o
f ent
erpr
ise
2002
/03
2003
/04
2004
/05
2005
/06
Num
ber o
f ve
ndor
sPa
ymen
ts
(R m
illio
n)R
efun
ds(R
mill
ion)
Num
ber o
f ve
ndor
sPa
ymen
ts
(R m
illio
n)R
efun
ds(R
mill
ion)
Num
ber o
f ve
ndor
sPa
ymen
ts
(R m
illio
n)R
efun
ds(R
mill
ion)
Num
ber o
f ve
ndor
sPa
ymen
ts
(R m
illio
n)R
efun
ds(R
mill
ion)
A :
Indi
vidu
al14
2 58
1
3 82
8
-1
949
142
505
3
965
-2 1
1614
1 43
5
4 30
4
-2
129
147
566
5
384
-2 5
92
B :
Par
tner
ship
17 9
42
2
083
-1 2
6917
622
2 13
3
-1
419
17 4
29
2
224
-1 4
3617
533
3 03
6
-2
096
C :
Com
pany
/Clo
se c
orpo
ratio
n29
1 19
9
70 9
81
-4
6 71
131
0 02
7
81 2
60
-4
6 60
333
3 45
1
93 5
78
-4
9 71
041
0 23
5
116
112
-6
5 74
6
D :
Loca
l/Pub
lic a
utho
rity
793
2
485
-819
725
2
560
-898
728
2
418
-1 2
5488
0
2 20
7
-1
990
E :
Ass
ocia
tion
not f
or g
ain
2 44
4
66
1
-372
2 51
1
78
9
-446
2 58
6
99
1
-566
2 84
1
1
044
-384
F :
Est
ate/
Trus
t30
588
1 25
7
-7
2031
640
1 38
5
-8
0833
060
1 53
2
-9
8737
204
2 04
9
-1
446
G :
Clu
b94
7
131
-1
4692
7
138
-1
4591
8
156
-1
0086
0
138
-2
21
H :
Wel
fare
org
anis
atio
n1
166
17
-7
41
170
18
-8
91
186
26
-9
21
235
29
-1
21
Oth
er76
187
-7
76
72
-572
64
-4
63
62
-41
Tota
l48
7 73
6
81 6
31
-5
2 06
750
7 20
3
92 3
19
-5
2 52
853
0 86
5
105
294
-5
6 27
661
8 41
7
130
061
-7
4 63
6
A :
Indi
vidu
al29
.2%
4.7%
3.7%
28.1
%4.
3%4.
0%26
.6%
4.1%
3.8%
23.9
%4.
1%3.
5%
B :
Par
tner
ship
3.7%
2.6%
2.4%
3.5%
2.3%
2.7%
3.3%
2.1%
2.6%
2.8%
2.3%
2.8%
C :
Com
pany
/Clo
se c
orpo
ratio
n59
.7%
87.0
%89
.7%
61.1
%88
.0%
88.7
%62
.8%
88.9
%88
.3%
66.3
%89
.3%
88.1
%
D :
Loca
l/Pub
lic a
utho
rity
0.2%
3.0%
1.6%
0.1%
2.8%
1.7%
0.1%
2.3%
2.2%
0.1%
1.7%
2.7%
E :
Ass
ocia
tion
not f
or g
ain
0.5%
0.8%
0.7%
0.5%
0.9%
0.8%
0.5%
0.9%
1.0%
0.5%
0.8%
0.5%
F :
Est
ate/
Trus
t6.
3%1.
5%1.
4%6.
2%1.
5%1.
5%6.
2%1.
5%1.
8%6.
0%1.
6%1.
9%
G :
Clu
b0.
2%0.
2%0.
3%0.
2%0.
1%0.
3%0.
2%0.
1%0.
2%0.
1%0.
1%0.
3%
H :
Wel
fare
org
anis
atio
n0.
2%0.
0%0.
1%0.
2%0.
0%0.
2%0.
2%0.
0%0.
2%0.
2%0.
0%0.
2%
Oth
er0.
0%0.
2%0.
0%0.
0%0.
1%0.
0%0.
0%0.
1%0.
0%0.
0%0.
0%0.
1%
Tota
l10
0.0%
100.
0%10
0.0%
100.
0%10
0.0%
100.
0%10
0.0%
100.
0%10
0.0%
100.
0%10
0.0%
100.
0%
Perc
enta
ge o
f tot
al
2008 TAX STATISTICS
126

Tabl
e 4.
4.1:
Dom
estic
VA
T: V
endo
rs p
er a
nnua
lised
turn
over
(pay
men
ts a
nd re
fund
s), 2
006/
07Tu
rnov
er c
ateg
ory
Num
ber o
f ve
ndor
sTu
rnov
er1
(R m
illio
n)Pa
ymen
ts(R
mill
ion)
Ref
unds
(R m
illio
n)A
: 0
to 1
00 0
0022
2 30
6
2 68
3
1 83
0
-5 5
37
B:
100
001
to 2
00 0
0039
018
5 72
6
514
-683
C:
200
001
to 3
00 0
0030
987
7 67
5
593
-561
D:
300
001
to 5
00 0
0049
320
19 4
33
1
303
-7
82
E:
500
001
to 7
00 0
0035
968
21 3
85
1
329
-7
37
F:70
0 00
1 to
1 0
00 0
0038
118
31 9
51
1
857
-7
93
G:
1 00
0 00
1 to
2 0
00 0
0068
457
97 2
79
5
211
-1
797
H:
2 00
0 00
1 to
3 0
00 0
0032
573
79 6
57
3
896
-1
190
I:3
000
001
to 5
000
000
31 9
60
12
3 39
3
5 58
3
-1 7
54
J:5
000
001
to 1
0 00
0 00
029
737
208
438
8
636
-2
467
K:
10 0
00 0
01 to
14
000
000
10 5
34
12
4 22
5
4 73
0
-1 3
47
L:14
000
001
to 2
0 00
0 00
08
381
13
9 75
7
5 00
1
-1 6
17
M:
20 0
00 0
01 to
30
000
000
7 23
2
175
919
5
840
-1
876
N:
30 0
00 0
01 to
50
000
000
6 00
9
231
596
7
787
-2
843
O:
50 0
00 0
00 to
100
000
000
4 92
2
342
989
11
009
-3 8
20
P:
100
mill
ion
+5
194
3
893
931
77 0
67
-4
7 84
3
Tota
l62
0 71
6
5 50
6 03
9
14
2 18
6
-75
645
A:
0 to
100
000
35.8
%0.
0%1.
3%7.
3%
B:
100
001
to 2
00 0
006.
3%0.
1%0.
4%0.
9%
C:
200
001
to 3
00 0
005.
0%0.
1%0.
4%0.
7%
D:
300
001
to 5
00 0
007.
9%0.
4%0.
9%1.
0%
E:
500
001
to 7
50 0
005.
8%0.
4%0.
9%1.
0%
F:75
0 00
1 to
1 0
00 0
006.
1%0.
6%1.
3%1.
0%
G:
1 00
0 00
1 to
2 0
00 0
0011
.0%
1.8%
3.7%
2.4%
H:
2 00
0 00
1 to
3 0
00 0
005.
2%1.
4%2.
7%1.
6%
I:3
000
001
to 5
000
000
5.1%
2.2%
3.9%
2.3%
J:5
000
001
to 1
0 00
0 00
04.
8%3.
8%6.
1%3.
3%
K:
10 0
00 0
01 to
14
000
000
1.7%
2.3%
3.3%
1.8%
L:14
000
001
to 2
0 00
0 00
01.
4%2.
5%3.
5%2.
1%
M:
20 0
00 0
01 to
30
000
000
1.2%
3.2%
4.1%
2.5%
N:
30 0
00 0
01 to
50
000
000
1.0%
4.2%
5.5%
3.8%
O:
50 0
00 0
00 to
100
000
000
0.8%
6.2%
7.7%
5.0%
P:
100
mill
ion
+0.
8%70
.7%
54.2
%63
.2%
Tota
l10
0.0%
100.
0%10
0.0%
100.
0%1.
VA
T ex
clus
ive.
Perc
enta
ge o
f tot
al
CHAPTER 4: VALUE-ADDED TAX
127

Tabl
e 4.
5.1:
Hou
seho
ld c
onsu
mpt
ion
expe
nditu
re b
y m
ain
expe
nditu
re g
roup
and
inco
me
deci
les,
200
5/06
Mai
n ex
pend
iture
gro
upIn
com
e de
cile
sTo
tal
Perc
enta
geLo
wer
23
45
67
89
Upp
erFo
od a
nd n
on-a
lcoh
olic
bev
erag
es32
.8%
33.2
%30
.9%
29.7
%28
.9%
26.1
%22
.2%
16.8
%11
.1%
7.3%
14.4
%A
lcoh
olic
bev
erag
es a
nd to
bacc
o2.
1%2.
2%1.
7%1.
8%1.
8%2.
1%1.
9%1.
4%1.
0%0.
7%1.
2%C
loth
ing
and
foot
wea
r8.
2%8.
0%8.
3%8.
2%8.
2%7.
6%7.
6%6.
2%4.
4%3.
1%5.
0%H
ousi
ng, w
ater
, ele
ctric
ity, g
as a
nd o
ther
fuel
s18
.9%
17.6
%19
.0%
18.3
%18
.3%
18.3
%19
.9%
22.4
%24
.7%
26.3
%23
.6%
Furn
ishi
ngs,
hou
seho
ld e
quip
men
t and
rout
ine
mai
nten
ance
of t
he d
wel
ling
6.2%
7.2%
8.2%
8.3%
7.8%
8.4%
7.8%
7.3%
5.9%
6.6%
6.9%
Hea
lth1.
3%1.
7%1.
6%1.
6%1.
8%1.
7%1.
4%1.
6%1.
6%1.
8%1.
7%Tr
ansp
ort
10.5
%12
.3%
10.9
%10
.9%
11.4
%13
.2%
14.3
%16
.4%
22.9
%24
.0%
19.9
%C
omm
unic
atio
n3.
0%2.
9%3.
3%3.
2%3.
5%3.
4%3.
9%3.
7%3.
6%3.
5%3.
5%
Rec
reat
ion
and
cultu
re2.
2%2.
2%3.
1%3.
1%3.
6%3.
9%4.
2%3.
8%4.
3%5.
6%4.
6%
Edu
catio
n2.
2%1.
9%1.
8%2.
0%2.
0%1.
7%2.
4%3.
9%2.
7%2.
2%2.
4%
Res
taur
ants
and
hot
els
4.2%
2.3%
2.2%
2.1%
2.3%
2.7%
2.6%
2.0%
2.1%
2.1%
2.2%
Mis
cella
neou
s go
ods
and
serv
ices
8.2%
8.3%
8.7%
10.7
%10
.3%
10.7
%11
.5%
14.3
%15
.4%
16.5
%14
.4%
Oth
er u
ncla
ssifi
ed e
xpen
ses
0.2%
0.2%
0.2%
0.2%
0.3%
0.3%
0.3%
0.3%
0.3%
0.3%
0.3%
Tota
l10
0.0%
100.
0%10
0.0%
100.
0%10
0.0%
100.
0%10
0.0%
100.
0%10
0.0%
100.
0%10
0.0%
Sou
rce:
Tab
le 2
.13
of 2
005/
06 In
com
e an
d E
xpen
ditu
re S
urve
y (IE
S),
Sta
tistic
s S
outh
Afri
ca.
2008 TAX STATISTICS
128
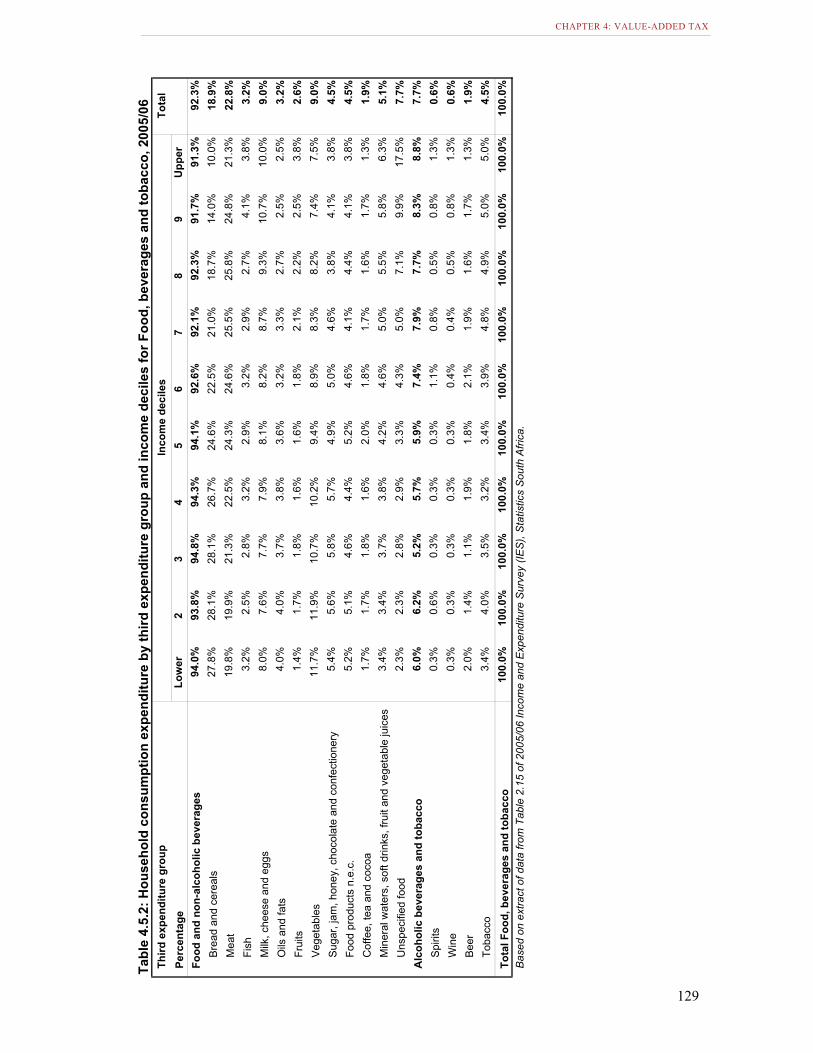
Tabl
e 4.
5.2:
Hou
seho
ld c
onsu
mpt
ion
expe
nditu
re b
y th
ird e
xpen
ditu
re g
roup
and
inco
me
deci
les
for F
ood,
bev
erag
es a
nd to
bacc
o, 2
005/
06Th
ird e
xpen
ditu
re g
roup
Inco
me
deci
les
Tota
lPe
rcen
tage
Low
er2
34
56
78
9U
pper
Food
and
non
-alc
ohol
ic b
ever
ages
94.0
%93
.8%
94.8
%94
.3%
94.1
%92
.6%
92.1
%92
.3%
91.7
%91
.3%
92.3
%B
read
and
cer
eals
27.8
%28
.1%
28.1
%26
.7%
24.6
%22
.5%
21.0
%18
.7%
14.0
%10
.0%
18.9
%M
eat
19.8
%19
.9%
21.3
%22
.5%
24.3
%24
.6%
25.5
%25
.8%
24.8
%21
.3%
22.8
%Fi
sh3.
2%2.
5%2.
8%3.
2%2.
9%3.
2%2.
9%2.
7%4.
1%3.
8%3.
2%M
ilk, c
hees
e an
d eg
gs8.
0%7.
6%7.
7%7.
9%8.
1%8.
2%8.
7%9.
3%10
.7%
10.0
%9.
0%O
ils a
nd fa
ts4.
0%4.
0%3.
7%3.
8%3.
6%3.
2%3.
3%2.
7%2.
5%2.
5%3.
2%Fr
uits
1.4%
1.7%
1.8%
1.6%
1.6%
1.8%
2.1%
2.2%
2.5%
3.8%
2.6%
Veg
etab
les
11.7
%11
.9%
10.7
%10
.2%
9.4%
8.9%
8.3%
8.2%
7.4%
7.5%
9.0%
Sug
ar, j
am, h
oney
, cho
cola
te a
nd c
onfe
ctio
nery
5.4%
5.6%
5.8%
5.7%
4.9%
5.0%
4.6%
3.8%
4.1%
3.8%
4.5%
Food
pro
duct
s n.
e.c.
5.2%
5.1%
4.6%
4.4%
5.2%
4.6%
4.1%
4.4%
4.1%
3.8%
4.5%
Cof
fee,
tea
and
coco
a1.
7%1.
7%1.
8%1.
6%2.
0%1.
8%1.
7%1.
6%1.
7%1.
3%1.
9%M
iner
al w
ater
s, s
oft d
rinks
, fru
it an
d ve
geta
ble
juic
es3.
4%3.
4%3.
7%3.
8%4.
2%4.
6%5.
0%5.
5%5.
8%6.
3%5.
1%U
nspe
cifie
d fo
od2.
3%2.
3%2.
8%2.
9%3.
3%4.
3%5.
0%7.
1%9.
9%17
.5%
7.7%
Alc
ohol
ic b
ever
ages
and
toba
cco
6.0%
6.2%
5.2%
5.7%
5.9%
7.4%
7.9%
7.7%
8.3%
8.8%
7.7%
Spi
rits
0.3%
0.6%
0.3%
0.3%
0.3%
1.1%
0.8%
0.5%
0.8%
1.3%
0.6%
Win
e0.
3%0.
3%0.
3%0.
3%0.
3%0.
4%0.
4%0.
5%0.
8%1.
3%0.
6%B
eer
2.0%
1.4%
1.1%
1.9%
1.8%
2.1%
1.9%
1.6%
1.7%
1.3%
1.9%
Toba
cco
3.4%
4.0%
3.5%
3.2%
3.4%
3.9%
4.8%
4.9%
5.0%
5.0%
4.5%
Tota
l Foo
d, b
ever
ages
and
toba
cco
100.
0%10
0.0%
100.
0%10
0.0%
100.
0%10
0.0%
100.
0%10
0.0%
100.
0%10
0.0%
100.
0%B
ased
on
extra
ct o
f dat
a fro
m T
able
2.1
5 of
200
5/06
Inco
me
and
Exp
endi
ture
Sur
vey
(IES
), S
tatis
tics
Sou
th A
frica
.
CHAPTER 4: VALUE-ADDED TAX
129

Third
exp
endi
ture
gro
upIn
com
e de
cile
sTo
tal
Perc
enta
geLo
wer
23
45
67
89
Upp
erFo
od a
nd n
on-a
lcoh
olic
bev
erag
es4.
6%5.
7%6.
4%7.
5%8.
1%9.
1%9.
8%11
.4%
14.8
%22
.5%
100.
0%B
read
and
cer
eals
6.6%
8.3%
9.2%
10.2
%10
.3%
10.7
%10
.7%
10.9
%11
.1%
12.1
%10
0.0%
Mea
t3.
8%4.
9%5.
8%7.
1%8.
4%9.
8%10
.9%
12.7
%16
.1%
20.6
%10
0.0%
Fish
4.6%
4.5%
5.1%
7.5%
7.2%
8.6%
8.4%
10.1
%17
.6%
26.5
%10
0.0%
Milk
, che
ese
and
eggs
4.1%
4.9%
5.4%
6.6%
7.2%
8.3%
9.7%
12.0
%17
.5%
24.3
%10
0.0%
Oils
and
fats
5.9%
7.3%
7.7%
9.5%
9.3%
9.7%
10.5
%11
.4%
12.1
%16
.6%
100.
0%Fr
uits
2.8%
3.8%
4.8%
5.2%
6.0%
6.6%
8.1%
10.5
%17
.0%
35.2
%10
0.0%
Veg
etab
les
6.0%
7.6%
7.5%
8.4%
8.5%
9.2%
9.0%
10.5
%13
.0%
20.3
%10
0.0%
Sug
ar, j
am, h
oney
, cho
cola
te a
nd c
onfe
ctio
nery
5.4%
6.8%
7.7%
8.9%
8.7%
9.5%
9.5%
9.8%
13.0
%20
.7%
100.
0%Fo
od p
rodu
cts
n.e.
c.5.
4%6.
4%6.
7%7.
6%9.
3%9.
3%9.
5%11
.5%
13.7
%20
.7%
100.
0%C
offe
e, te
a an
d co
coa
4.5%
5.7%
6.6%
7.3%
8.9%
8.9%
9.8%
9.7%
14.5
%24
.1%
100.
0%M
iner
al w
ater
s, s
oft d
rinks
, fru
it an
d ve
geta
ble
juic
es3.
1%3.
8%4.
5%5.
6%6.
4%8.
5%9.
6%12
.5%
17.5
%28
.5%
100.
0%U
nspe
cifie
d fo
od1.
3%1.
6%2.
2%2.
8%3.
3%5.
0%6.
3%10
.1%
18.0
%49
.4%
100.
0%A
lcoh
olic
bev
erag
es a
nd to
bacc
o3.
7%4.
6%4.
5%5.
8%6.
4%9.
0%10
.6%
11.9
%17
.3%
26.1
%10
0.0%
Spi
rits
2.1%
3.3%
3.3%
3.5%
2.6%
13.4
%7.
5%8.
4%14
.1%
41.9
%10
0.0%
Win
e1.
7%2.
2%1.
8%3.
9%3.
3%3.
9%5.
2%6.
3%20
.0%
51.7
%10
0.0%
Bee
r5.
3%4.
5%4.
4%8.
1%9.
3%10
.9%
12.4
%11
.7%
17.5
%15
.9%
100.
0%To
bacc
o3.
7%5.
3%5.
1%5.
6%6.
5%8.
2%11
.4%
13.5
%17
.4%
23.3
%10
0.0%
Tota
l Foo
d, b
ever
ages
and
toba
cco
4.5%
5.6%
6.3%
7.4%
8.0%
9.1%
9.8%
11.4
%15
.0%
22.8
%10
0.0%
Cum
ulat
ive
perc
enta
ge4.
5%10
.2%
16.4
%23
.9%
31.9
%41
.0%
50.8
%62
.2%
77.2
%10
0.0%
Bas
ed o
n ex
tract
of d
ata
from
Tab
le 2
.33
of 2
005/
06 In
com
e an
d E
xpen
ditu
re S
urve
y (IE
S),
Sta
tistic
s S
outh
Afri
ca.
Tabl
e 4.
5.3:
Hou
seho
ld c
onsu
mpt
ion
expe
nditu
re b
y th
ird e
xpen
ditu
re g
roup
and
inco
me
deci
les
for F
ood,
bev
erag
es a
nd to
bacc
o, 2
005/
06
[per
cent
age
acro
ss d
ecile
s]
2008 TAX STATISTICS
130
Related Documents