©2021 Grant Thornton Bharat LLP. All rights reserved. Q1 FY 22 Valuation Pulse – IT and ITeS industry

Welcome message from author
This document is posted to help you gain knowledge. Please leave a comment to let me know what you think about it! Share it to your friends and learn new things together.
Transcript
©2021 Grant Thornton Bharat LLP. All rights reserved.
Q1 FY 22
Valuation Pulse –
IT and ITeS industry
©2021 Grant Thornton Bharat LLP. All rights reserved.
Foreword
2
Manish Saxena Partner
Grant Thornton Bharat LLP
Note: Market data has been updated till 30 July 2021 and the earnings release of majority of the companies used for our analysis is up to 30 June 2021
We are pleased to present Valuation Pulse for the first quarter ending Financial Year 2022 (Q1 FY 22).
Indian IT and ITeS companies witnessed a sequential revenue growth and healthy deal wins, driven by broad-
based demand of IT services across sectors, primarily in cloud-led digital transformation, data analytics and
artificial intelligence (AI). Technology has become a necessity for organisations to survive post the pandemic.
Majority of the IT spends have now become a survival investment for efficient operations of businesses.
Companies that were primarily operating in an old economy are now focusing on modernising their core
operations, which has accelerated initial phases of strong technology upcycle in both Indian and global IT
sectors.
With accelerated demand and liquidity in the markets, the valuations of global tech and Indian IT and ITeS
companies have surged to highest levels in last five years. The industry has outperformed the overall market
indices, with NIFTY IT up by 17.9% since 31 March 2021, while NIFTY 50 is up by only 7.3%. Within the Indian
IT sector, the valuations of small and mid-cap IT companies and engineering services have seen the biggest
upside in Q1.
Key trends observed in the industry during Q1:
• Strong growth in revenue, primarily led by BFSI, retail and trade, life sciences and health-care verticals.
• Deal wins, supported by accelerated hiring to meet the demand, have continued to remain strong in this
quarter for all the IT companies, which provides a good visibility of revenue in the near-term
• Strong demand in areas of digital engineering, electric autonomous and connected vehicle (EACV), 5G and
medical technology has supported revenue growth in the engineering IT sector
• Margins were impacted by wage hikes, higher hiring costs to backfill attrition and fulfill strong order book,
increased sub-contracting and visa costs, offset partly by increase in offshore mix and operating leverage
On the transactions front [mergers and acquisitions (M&A) and funding], the sector witnessed a record
transaction activity in Q1 FY 22, both in value and volume in the last three years. IT companies focused on
acquiring technologies (such as cyber-security platforms) and IT consultancy companies are offering digital
transformation, data and business analytics and business process management solutions. Further, funding by
private equity (PE)/venture capital (VC) saw good activity, predominantly in the area of digital payments and
analytics/AI.
We hope you will find this publication insightful and informative.
©2021 Grant Thornton Bharat LLP. All rights reserved.
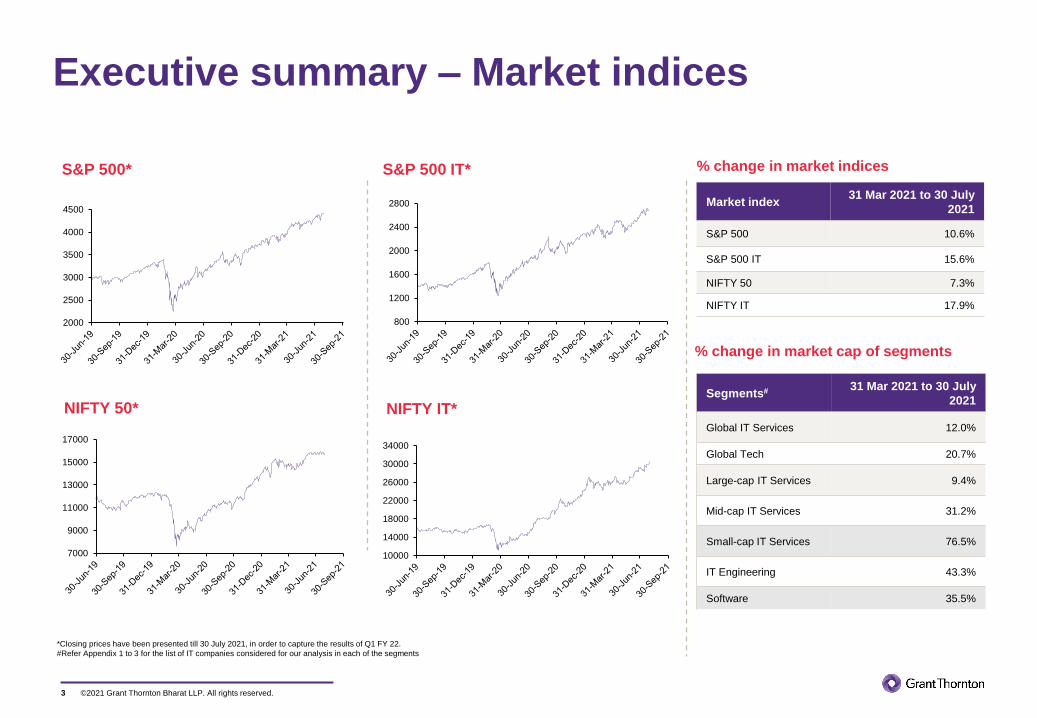
Executive summary – Market indices
3
*Closing prices have been presented till 30 July 2021, in order to capture the results of Q1 FY 22.
#Refer Appendix 1 to 3 for the list of IT companies considered for our analysis in each of the segments
Market index31 Mar 2021 to 30 July
2021
S&P 500 10.6%
S&P 500 IT 15.6%
NIFTY 50 7.3%
NIFTY IT 17.9%
% change in market indices
Segments# 31 Mar 2021 to 30 July
2021
Global IT Services 12.0%
Global Tech 20.7%
Large-cap IT Services 9.4%
Mid-cap IT Services 31.2%
Small-cap IT Services 76.5%
IT Engineering 43.3%
Software 35.5%
% change in market cap of segments
S&P 500* S&P 500 IT*
NIFTY 50* NIFTY IT*
2000
2500
3000
3500
4000
4500
800
1200
1600
2000
2400
2800
7000
9000
11000
13000
15000
17000
10000
14000
18000
22000
26000
30000
34000
©2021 Grant Thornton Bharat LLP. All rights reserved.
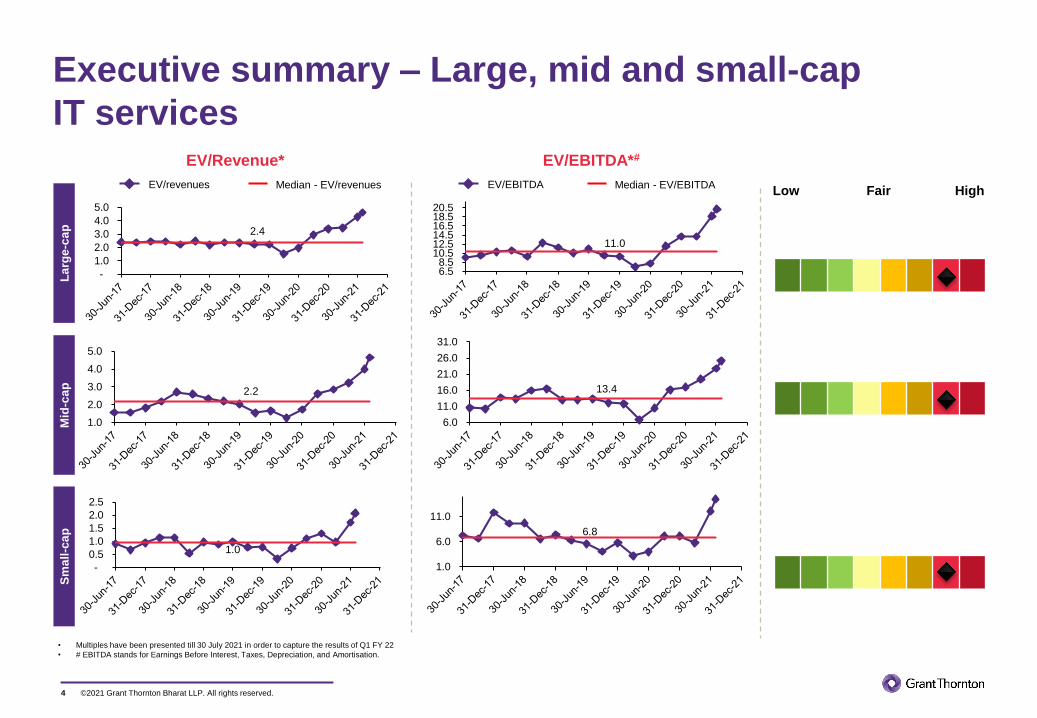
Executive summary – Large, mid and small-cap
IT services
4
EV/Revenue* EV/EBITDA*#
Median - EV/revenuesEV/revenues
• Multiples have been presented till 30 July 2021 in order to capture the results of Q1 FY 22
• # EBITDA stands for Earnings Before Interest, Taxes, Depreciation, and Amortisation.
La
rge
-ca
pM
id-c
ap
Sm
all
-ca
p
Median - EV/EBITDAEV/EBITDAHighLow Fair
2.4
-
1.0
2.0
3.0
4.0
5.0
11.0
6.5 8.5
10.5 12.5 14.5 16.5 18.5 20.5
2.2
1.0
2.0
3.0
4.0
5.0
1.0
-
0.5
1.0
1.5
2.0
2.5
6.8
1.0
6.0
11.0
13.4
6.0
11.0
16.0
21.0
26.0
31.0
©2021 Grant Thornton Bharat LLP. All rights reserved.
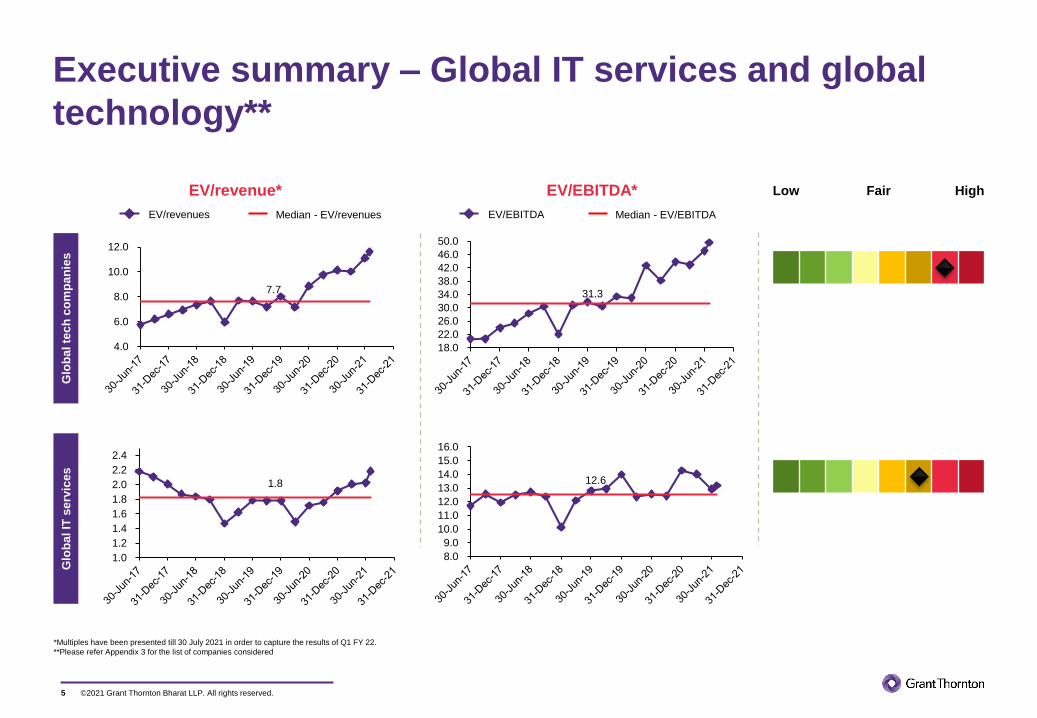
Executive summary – Global IT services and global
technology**
5
EV/revenue* EV/EBITDA* HighLow Fair
Median - EV/revenuesEV/revenues
Glo
ba
l IT
se
rvic
es
Median - EV/EBITDAEV/EBITDA
Glo
ba
l te
ch
co
mp
an
ies
*Multiples have been presented till 30 July 2021 in order to capture the results of Q1 FY 22.
**Please refer Appendix 3 for the list of companies considered
31.3
18.0
22.0
26.0
30.0
34.0
38.0
42.0
46.0
50.0
1.8
1.0
1.2
1.4
1.6
1.8
2.0
2.2
2.4
12.6
8.0
9.0
10.0
11.0
12.0
13.0
14.0
15.0
16.0
7.7
4.0
6.0
8.0
10.0
12.0
©2021 Grant Thornton Bharat LLP. All rights reserved.
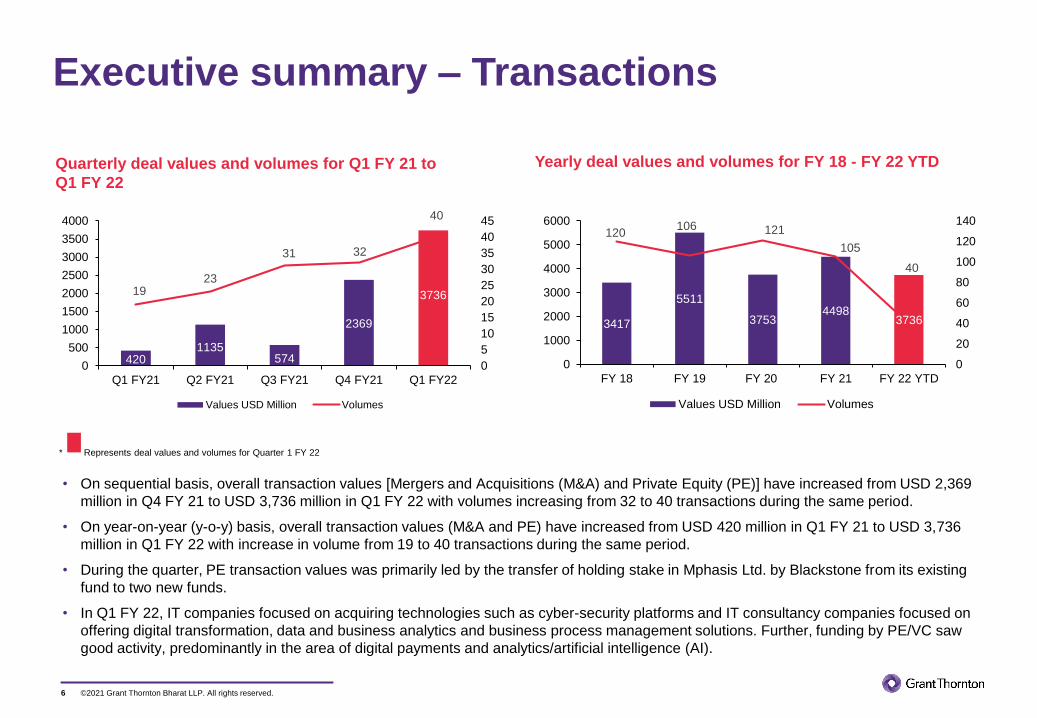
Executive summary – Transactions
6
• On sequential basis, overall transaction values [Mergers and Acquisitions (M&A) and Private Equity (PE)] have increased from USD 2,369
million in Q4 FY 21 to USD 3,736 million in Q1 FY 22 with volumes increasing from 32 to 40 transactions during the same period.
• On year-on-year (y-o-y) basis, overall transaction values (M&A and PE) have increased from USD 420 million in Q1 FY 21 to USD 3,736
million in Q1 FY 22 with increase in volume from 19 to 40 transactions during the same period.
• During the quarter, PE transaction values was primarily led by the transfer of holding stake in Mphasis Ltd. by Blackstone from its existing
fund to two new funds.
• In Q1 FY 22, IT companies focused on acquiring technologies such as cyber-security platforms and IT consultancy companies focused on
offering digital transformation, data and business analytics and business process management solutions. Further, funding by PE/VC saw
good activity, predominantly in the area of digital payments and analytics/artificial intelligence (AI).
Quarterly deal values and volumes for Q1 FY 21 to
Q1 FY 22
Yearly deal values and volumes for FY 18 - FY 22 YTD
4201135
574
2369
37361923
31 32
40
0
5
10
15
20
25
30
35
40
45
0
500
1000
1500
2000
2500
3000
3500
4000
Q1 FY21 Q2 FY21 Q3 FY21 Q4 FY21 Q1 FY22
Values USD Million Volumes
3417
5511
37534498
3736
120106 121
105
40
0
20
40
60
80
100
120
140
0
1000
2000
3000
4000
5000
6000
FY 18 FY 19 FY 20 FY 21 FY 22 YTD
Values USD Million Volumes
* Represents deal values and volumes for Quarter 1 FY 22
©2021 Grant Thornton Bharat LLP. All rights reserved.
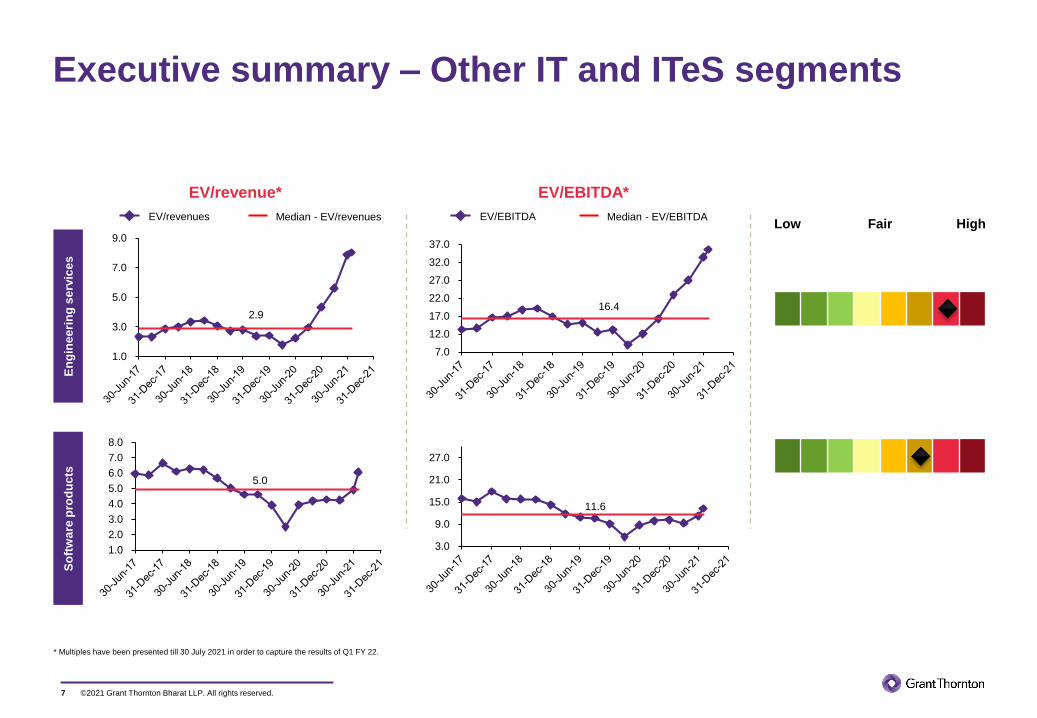
Executive summary – Other IT and ITeS segments
7
EV/revenue* EV/EBITDA*
HighLow FairMedian - EV/revenuesEV/revenues
* Multiples have been presented till 30 July 2021 in order to capture the results of Q1 FY 22.
En
gin
ee
rin
g s
erv
ice
sS
oft
wa
re p
rod
uc
ts
Median - EV/EBITDAEV/EBITDA
2.9
1.0
3.0
5.0
7.0
9.0
16.4
7.0
12.0
17.0
22.0
27.0
32.0
37.0
5.0
1.0
2.0
3.0
4.0
5.0
6.0
7.0
8.0
11.6
3.0
9.0
15.0
21.0
27.0
©2021 Grant Thornton Bharat LLP. All rights reserved.
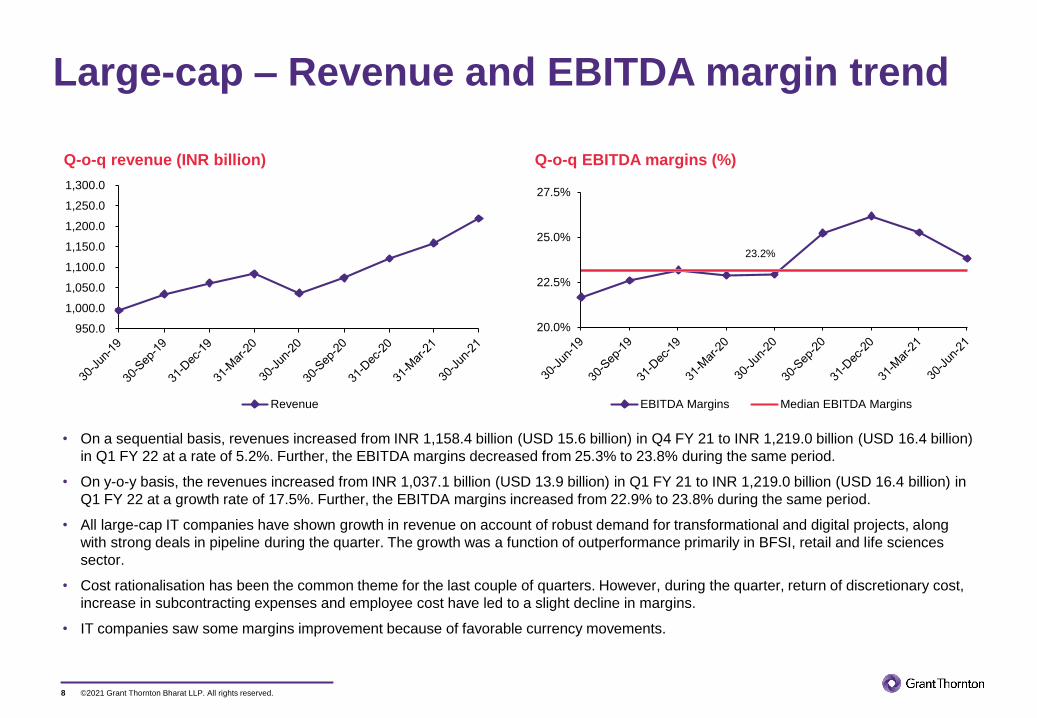
Large-cap – Revenue and EBITDA margin trend
8
• On a sequential basis, revenues increased from INR 1,158.4 billion (USD 15.6 billion) in Q4 FY 21 to INR 1,219.0 billion (USD 16.4 billion)
in Q1 FY 22 at a rate of 5.2%. Further, the EBITDA margins decreased from 25.3% to 23.8% during the same period.
• On y-o-y basis, the revenues increased from INR 1,037.1 billion (USD 13.9 billion) in Q1 FY 21 to INR 1,219.0 billion (USD 16.4 billion) in
Q1 FY 22 at a growth rate of 17.5%. Further, the EBITDA margins increased from 22.9% to 23.8% during the same period.
• All large-cap IT companies have shown growth in revenue on account of robust demand for transformational and digital projects, along
with strong deals in pipeline during the quarter. The growth was a function of outperformance primarily in BFSI, retail and life sciences
sector.
• Cost rationalisation has been the common theme for the last couple of quarters. However, during the quarter, return of discretionary cost,
increase in subcontracting expenses and employee cost have led to a slight decline in margins.
• IT companies saw some margins improvement because of favorable currency movements.
Q-o-q revenue (INR billion) Q-o-q EBITDA margins (%)
950.0
1,000.0
1,050.0
1,100.0
1,150.0
1,200.0
1,250.0
1,300.0
Revenue
23.2%
20.0%
22.5%
25.0%
27.5%
EBITDA Margins Median EBITDA Margins

©2021 Grant Thornton Bharat LLP. All rights reserved.
Large-cap – Historical multiples**
9
The valuation multiples of large-cap IT companies have reached an
all time high on account of pent-up demands and new opportunities
due to positive impact by the COVID-19 pandemic.
IT spends have increased and are expected to grow as clients
across all sectors continue to invest aggressively in their digital
transformation journey.
IT sector is expected to witness strong growth as organisations tend
to modernise their core operations, migrate to cloud and move
towards adoption of technology (such as data analytics, AI, etc.)
EV/Revenue* EV/EBITDA*
Market cap (INR billion)*
* Market cap and multiples have been presented till 30 July 2021 in order to capture the reported results of Q1 FY 22.
** Please refer Appendix 1 for the list of companies considered.
2.4
1.3 1.8 2.3 2.8 3.3 3.8 4.3 4.8
EV/ Rev Median-EV/Rev
11.0
6.5 8.5
10.5 12.5 14.5 16.5 18.5 20.5
EV/ EBITDA Median-EV/EBITDA
7,500.0 9,500.0
11,500.0 13,500.0 15,500.0 17,500.0 19,500.0 21,500.0 23,500.0 25,500.0 27,500.0

©2021 Grant Thornton Bharat LLP. All rights reserved.
Mid-cap – Revenue and EBITDA margin trend
10
• On sequential basis, the revenues increased from INR 121.5 billion (USD 1.63 billion) in Q4 FY 21 to INR 129.7 billion (USD 1.74 billion) in
Q1 FY 22 at a rate of 6.7%. However, the EBITDA margins decreased from 19.3% to 18.4% in the same period.
• On y-o-y basis, the revenues increased from INR 110.4 billion (USD 1.5 billion) in Q1 FY 21 to INR 129.7 billion (USD 1.74 billion) in Q1 FY
22 at a growth rate of 17.5%. Further, the EBITDA margins increased from 17.2% to 18.4% for the same period.
• It has been a positive quarter for the mid-cap segment. Growth in revenue is driven by demand for digital transformation and public/private
cloud adoption, along with strong deals in pipeline. The growth was a function of outperformance, primarily in BFSI, Hi-Tech and Media,
Retail and Lifesciences sector.
• Margins have declined slightly during the quarter because of wage hike and drop in utilisation due to a lag between hiring and deployment.
Q-o-q revenue (INR billion) Q-o-q EBITDA margins (%)
60.0
80.0
100.0
120.0
140.0
Revenue
17.6%
14.0%
16.0%
18.0%
20.0%
22.0%
EBITDA Margins Median EBITDA Margins
©2021 Grant Thornton Bharat LLP. All rights reserved.
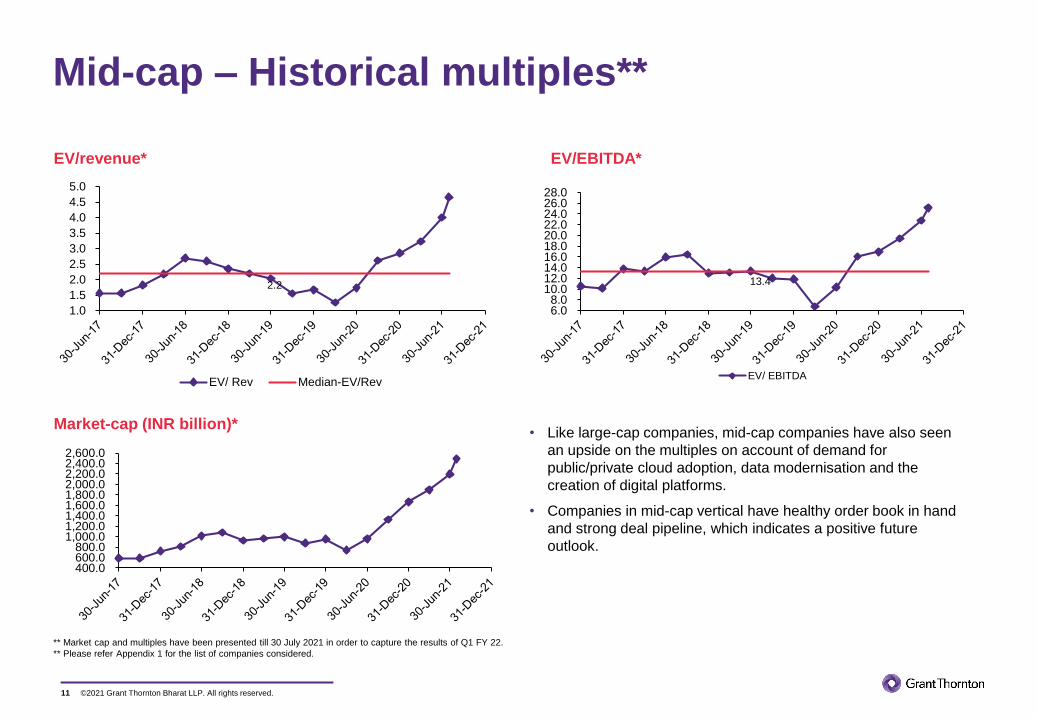
Mid-cap – Historical multiples**
11
• Like large-cap companies, mid-cap companies have also seen
an upside on the multiples on account of demand for
public/private cloud adoption, data modernisation and the
creation of digital platforms.
• Companies in mid-cap vertical have healthy order book in hand
and strong deal pipeline, which indicates a positive future
outlook.
EV/revenue* EV/EBITDA*
Market-cap (INR billion)*
** Market cap and multiples have been presented till 30 July 2021 in order to capture the results of Q1 FY 22.
** Please refer Appendix 1 for the list of companies considered.
400.0 600.0 800.0
1,000.0 1,200.0 1,400.0 1,600.0 1,800.0 2,000.0 2,200.0 2,400.0 2,600.0
2.2
1.0
1.5
2.0
2.5
3.0
3.5
4.0
4.5
5.0
EV/ Rev Median-EV/Rev
13.4
6.0 8.0
10.0 12.0 14.0 16.0 18.0 20.0 22.0 24.0 26.0 28.0
EV/ EBITDA
©2021 Grant Thornton Bharat LLP. All rights reserved.
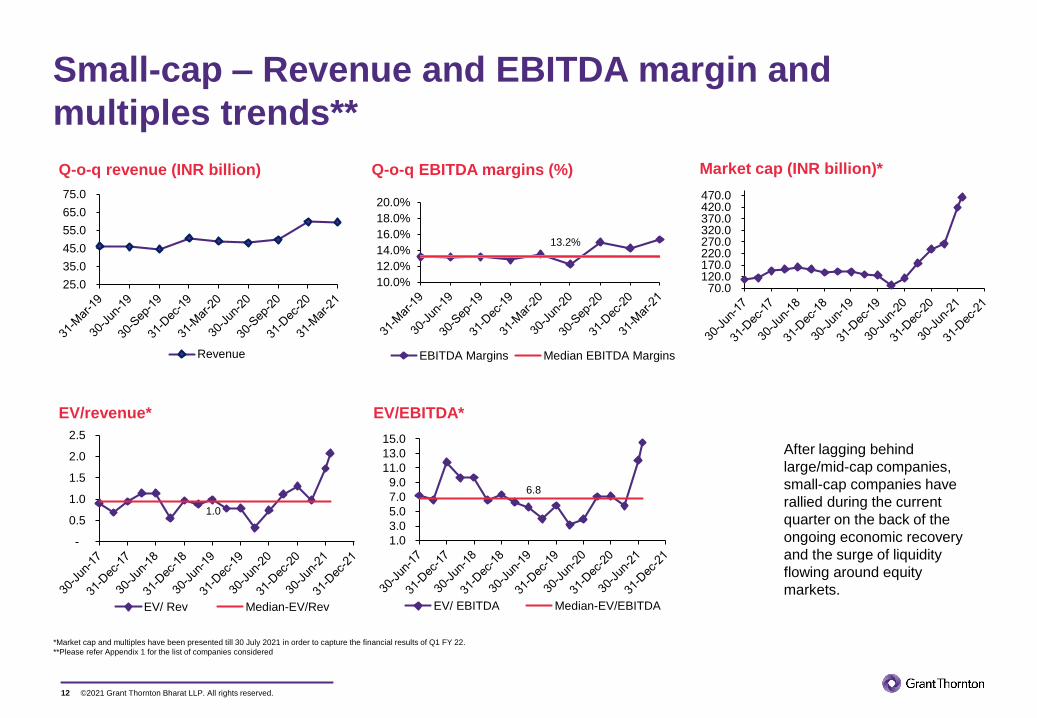
Small-cap – Revenue and EBITDA margin and
multiples trends**
12
Q-o-q revenue (INR billion) Q-o-q EBITDA margins (%)
EV/revenue* EV/EBITDA*
Market cap (INR billion)*
*Market cap and multiples have been presented till 30 July 2021 in order to capture the financial results of Q1 FY 22.
**Please refer Appendix 1 for the list of companies considered
1.0
-
0.5
1.0
1.5
2.0
2.5
EV/ Rev Median-EV/Rev
6.8
1.0
3.0
5.0
7.0
9.0
11.0
13.0
15.0
EV/ EBITDA Median-EV/EBITDA
70.0 120.0 170.0 220.0 270.0 320.0 370.0 420.0 470.0
25.0
35.0
45.0
55.0
65.0
75.0
Revenue
13.2%
10.0%
12.0%
14.0%
16.0%
18.0%
20.0%
EBITDA Margins Median EBITDA Margins
After lagging behind
large/mid-cap companies,
small-cap companies have
rallied during the current
quarter on the back of the
ongoing economic recovery
and the surge of liquidity
flowing around equity
markets.
©2021 Grant Thornton Bharat LLP. All rights reserved.
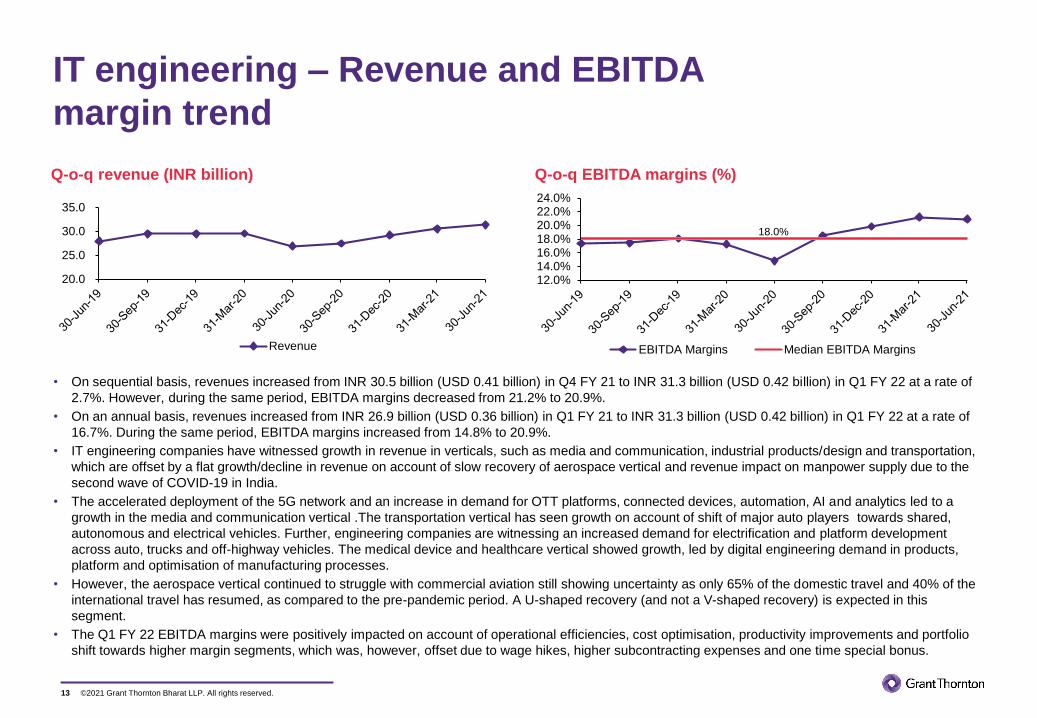
IT engineering – Revenue and EBITDA
margin trend
13
• On sequential basis, revenues increased from INR 30.5 billion (USD 0.41 billion) in Q4 FY 21 to INR 31.3 billion (USD 0.42 billion) in Q1 FY 22 at a rate of
2.7%. However, during the same period, EBITDA margins decreased from 21.2% to 20.9%.
• On an annual basis, revenues increased from INR 26.9 billion (USD 0.36 billion) in Q1 FY 21 to INR 31.3 billion (USD 0.42 billion) in Q1 FY 22 at a rate of
16.7%. During the same period, EBITDA margins increased from 14.8% to 20.9%.
• IT engineering companies have witnessed growth in revenue in verticals, such as media and communication, industrial products/design and transportation,
which are offset by a flat growth/decline in revenue on account of slow recovery of aerospace vertical and revenue impact on manpower supply due to the
second wave of COVID-19 in India.
• The accelerated deployment of the 5G network and an increase in demand for OTT platforms, connected devices, automation, AI and analytics led to a
growth in the media and communication vertical .The transportation vertical has seen growth on account of shift of major auto players towards shared,
autonomous and electrical vehicles. Further, engineering companies are witnessing an increased demand for electrification and platform development
across auto, trucks and off-highway vehicles. The medical device and healthcare vertical showed growth, led by digital engineering demand in products,
platform and optimisation of manufacturing processes.
• However, the aerospace vertical continued to struggle with commercial aviation still showing uncertainty as only 65% of the domestic travel and 40% of the
international travel has resumed, as compared to the pre-pandemic period. A U-shaped recovery (and not a V-shaped recovery) is expected in this
segment.
• The Q1 FY 22 EBITDA margins were positively impacted on account of operational efficiencies, cost optimisation, productivity improvements and portfolio
shift towards higher margin segments, which was, however, offset due to wage hikes, higher subcontracting expenses and one time special bonus.
Q-o-q revenue (INR billion) Q-o-q EBITDA margins (%)
20.0
25.0
30.0
35.0
Revenue
18.0%
12.0%14.0%16.0%18.0%20.0%22.0%24.0%
EBITDA Margins Median EBITDA Margins
©2021 Grant Thornton Bharat LLP. All rights reserved.
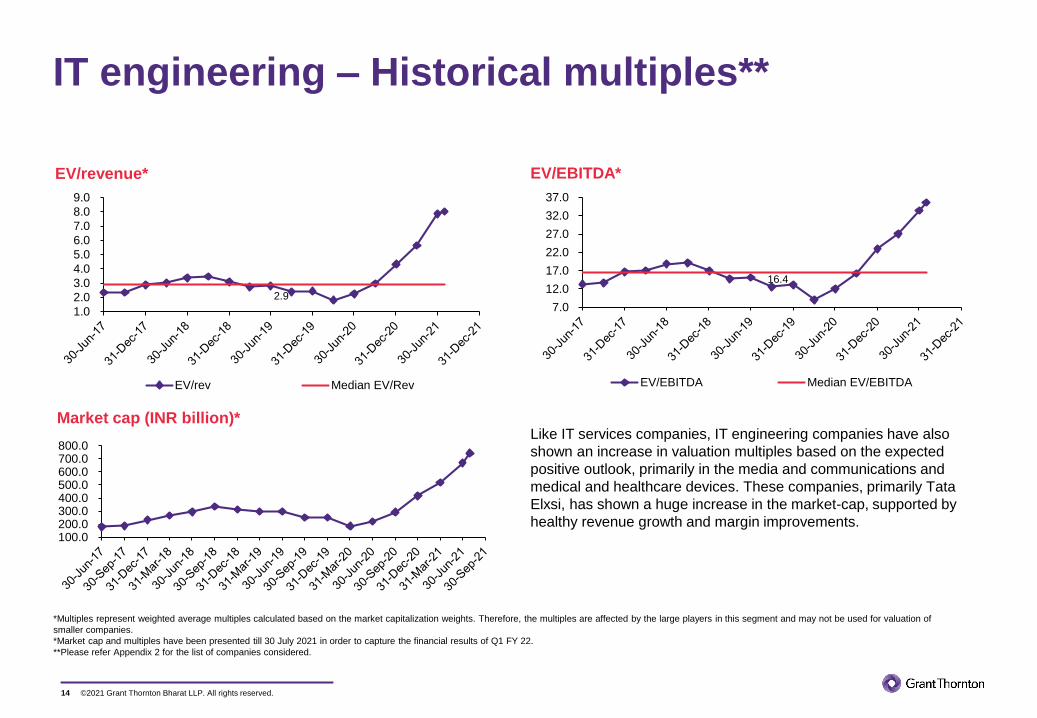
IT engineering – Historical multiples**
14
Like IT services companies, IT engineering companies have also
shown an increase in valuation multiples based on the expected
positive outlook, primarily in the media and communications and
medical and healthcare devices. These companies, primarily Tata
Elxsi, has shown a huge increase in the market-cap, supported by
healthy revenue growth and margin improvements.
EV/revenue* EV/EBITDA*
Market cap (INR billion)*
*Multiples represent weighted average multiples calculated based on the market capitalization weights. Therefore, the multiples are affected by the large players in this segment and may not be used for valuation of
smaller companies.
*Market cap and multiples have been presented till 30 July 2021 in order to capture the financial results of Q1 FY 22.
**Please refer Appendix 2 for the list of companies considered.
2.9
1.0
2.0
3.0
4.0
5.0
6.0
7.0
8.0
9.0
EV/rev Median EV/Rev
16.4
7.0
12.0
17.0
22.0
27.0
32.0
37.0
EV/EBITDA Median EV/EBITDA
100.0 200.0 300.0 400.0 500.0 600.0 700.0 800.0
©2021 Grant Thornton Bharat LLP. All rights reserved.
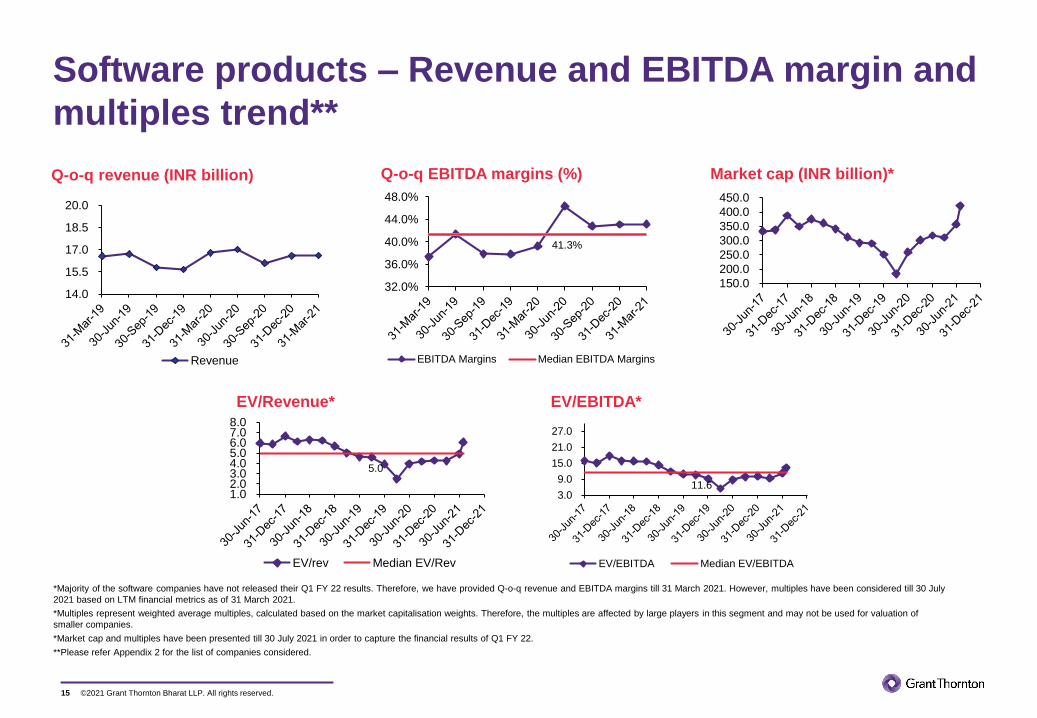
Software products – Revenue and EBITDA margin and
multiples trend**
15
Q-o-q revenue (INR billion) Q-o-q EBITDA margins (%)
EV/Revenue* EV/EBITDA*
Market cap (INR billion)*
*Majority of the software companies have not released their Q1 FY 22 results. Therefore, we have provided Q-o-q revenue and EBITDA margins till 31 March 2021. However, multiples have been considered till 30 July
2021 based on LTM financial metrics as of 31 March 2021.
*Multiples represent weighted average multiples, calculated based on the market capitalisation weights. Therefore, the multiples are affected by large players in this segment and may not be used for valuation of
smaller companies.
*Market cap and multiples have been presented till 30 July 2021 in order to capture the financial results of Q1 FY 22.
**Please refer Appendix 2 for the list of companies considered.
41.3%
32.0%
36.0%
40.0%
44.0%
48.0%
EBITDA Margins Median EBITDA Margins
5.0
1.0 2.0 3.0 4.0 5.0 6.0 7.0 8.0
EV/rev Median EV/Rev
11.6 3.0
9.0
15.0
21.0
27.0
EV/EBITDA Median EV/EBITDA
150.0
200.0
250.0
300.0
350.0
400.0
450.0
14.0
15.5
17.0
18.5
20.0
Revenue
©2021 Grant Thornton Bharat LLP. All rights reserved.
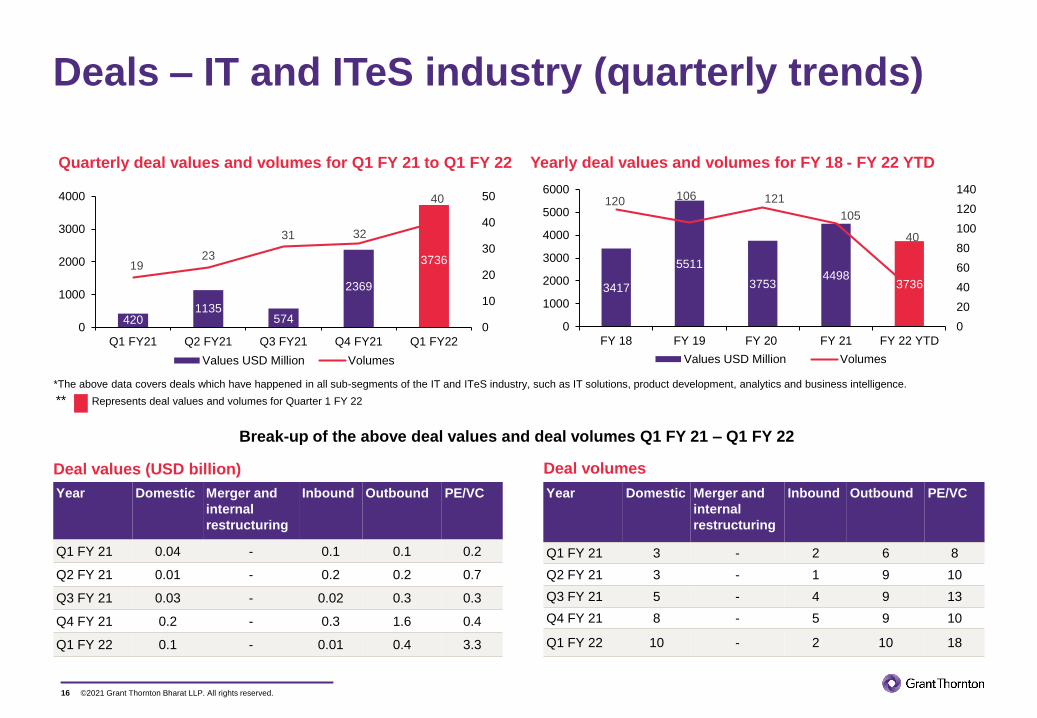
** Represents deal values and volumes for Quarter 1 FY 22
Deals – IT and ITeS industry (quarterly trends)
16
Year Domestic Merger and
internal
restructuring
Inbound Outbound PE/VC
Q1 FY 21 0.04 - 0.1 0.1 0.2
Q2 FY 21 0.01 - 0.2 0.2 0.7
Q3 FY 21 0.03 - 0.02 0.3 0.3
Q4 FY 21 0.2 - 0.3 1.6 0.4
Q1 FY 22 0.1 - 0.01 0.4 3.3
Year Domestic Merger and
internal
restructuring
Inbound Outbound PE/VC
Q1 FY 21 3 - 2 6 8
Q2 FY 21 3 - 1 9 10
Q3 FY 21 5 - 4 9 13
Q4 FY 21 8 - 5 9 10
Q1 FY 22 10 - 2 10 18
Quarterly deal values and volumes for Q1 FY 21 to Q1 FY 22
*The above data covers deals which have happened in all sub-segments of the IT and ITeS industry, such as IT solutions, product development, analytics and business intelligence.
Break-up of the above deal values and deal volumes Q1 FY 21 – Q1 FY 22
Deal values (USD billion) Deal volumes
Yearly deal values and volumes for FY 18 - FY 22 YTD
3417
5511
37534498
3736
120 106 121
105
40
0
20
40
60
80
100
120
140
0
1000
2000
3000
4000
5000
6000
FY 18 FY 19 FY 20 FY 21 FY 22 YTD
Values USD Million Volumes
4201135
574
2369
373619
23
31 32
40
0
10
20
30
40
50
0
1000
2000
3000
4000
Q1 FY21 Q2 FY21 Q3 FY21 Q4 FY21 Q1 FY22
Values USD Million Volumes
©2021 Grant Thornton Bharat LLP. All rights reserved.
IT and ITeS industry transactions: An overview
17
• On sequential basis, overall transaction values (M&A and PE) have increased from USD 2,369 million in Q4 FY
21 to USD 3,736 million in Q1 FY 22 with volumes increase from 32 to 40 transactions during the same period.
• On y-o-y basis, overall transaction values (M&A and PE) have increased from USD 420 million in Q1 FY 21 to
USD 3,736 million in Q1 FY 22 with increase in volumes from 19 to 40 transactions during the same period.
• M&A transaction values were higher at USD 2,016 million in Q4 FY 21 primarily led by the big-ticket acquisition
of Capco by Wipro Limited for USD 1,450 million. The transaction value in Q1 FY 22 was USD 477 million.
• PE transaction values increased from USD 353 million in Q4 FY 21 to USD 3,259 million in Q1 FY 22, primarily
led by the transfer of holding stake in Mphasis Ltd. by Blackstone from its existing fund to two new funds.
• In Q1 FY 22, IT companies focused on acquiring technologies, such as cyber-security platform and IT
consultancy companies offering digital transformation, data and business analytics and business process
management solutions. Further, funding by PE/VC saw good activity, predominantly in the area of digital
payments and Analytics/AI.
©2021 Grant Thornton Bharat LLP. All rights reserved.
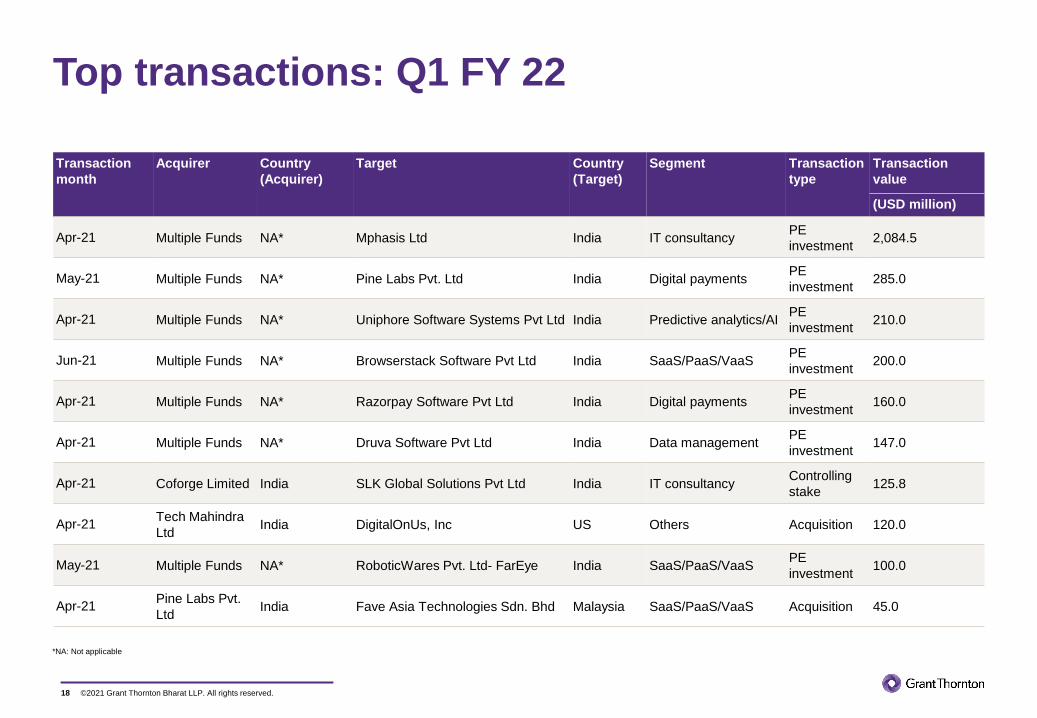
Top transactions: Q1 FY 22
18
*NA: Not applicable
Transaction
month
Acquirer Country
(Acquirer)
Target Country
(Target)
Segment Transaction
type
Transaction
value
(USD million)
Apr-21 Multiple Funds NA* Mphasis Ltd India IT consultancyPE
investment2,084.5
May-21 Multiple Funds NA* Pine Labs Pvt. Ltd India Digital paymentsPE
investment285.0
Apr-21 Multiple Funds NA* Uniphore Software Systems Pvt Ltd India Predictive analytics/AIPE
investment210.0
Jun-21 Multiple Funds NA* Browserstack Software Pvt Ltd India SaaS/PaaS/VaaSPE
investment200.0
Apr-21 Multiple Funds NA* Razorpay Software Pvt Ltd India Digital paymentsPE
investment160.0
Apr-21 Multiple Funds NA* Druva Software Pvt Ltd India Data management PE
investment147.0
Apr-21 Coforge Limited India SLK Global Solutions Pvt Ltd India IT consultancyControlling
stake125.8
Apr-21Tech Mahindra
LtdIndia DigitalOnUs, Inc US Others Acquisition 120.0
May-21 Multiple Funds NA* RoboticWares Pvt. Ltd- FarEye India SaaS/PaaS/VaaSPE
investment100.0
Apr-21Pine Labs Pvt.
LtdIndia Fave Asia Technologies Sdn. Bhd Malaysia SaaS/PaaS/VaaS Acquisition 45.0
©2021 Grant Thornton Bharat LLP. All rights reserved.
Company-specific analysis of large-cap
companies
19
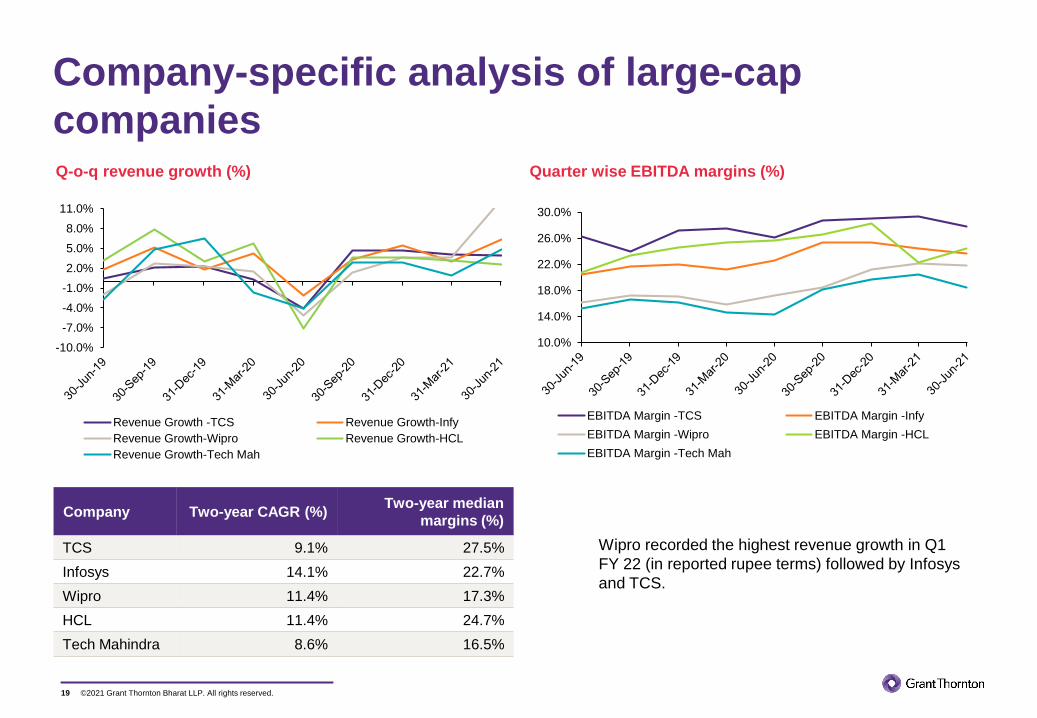
Company Two-year CAGR (%)Two-year median
margins (%)
TCS 9.1% 27.5%
Infosys 14.1% 22.7%
Wipro 11.4% 17.3%
HCL 11.4% 24.7%
Tech Mahindra 8.6% 16.5%
Q-o-q revenue growth (%) Quarter wise EBITDA margins (%)
Wipro recorded the highest revenue growth in Q1
FY 22 (in reported rupee terms) followed by Infosys
and TCS.
-10.0%
-7.0%
-4.0%
-1.0%
2.0%
5.0%
8.0%
11.0%
Revenue Growth -TCS Revenue Growth-Infy
Revenue Growth-Wipro Revenue Growth-HCL
Revenue Growth-Tech Mah
10.0%
14.0%
18.0%
22.0%
26.0%
30.0%
EBITDA Margin -TCS EBITDA Margin -Infy
EBITDA Margin -Wipro EBITDA Margin -HCL
EBITDA Margin -Tech Mah

©2021 Grant Thornton Bharat LLP. All rights reserved.
Company-specific analysis of large-cap
companies
20
* Multiples have been presented till 30th July 2021 in order to capture the results of Q1 FY22.
EV/Revenue EV/EBITDA
0.0
5.0
10.0
15.0
20.0
25.0
30.0
EV/EBITDA-TCS EV/EBITDA-Infy
EV/EBITDA-Wipro EV/EBITDA-HCL
EV/EBITDA-Tech Mah EV/EBITDA-Industry
Five-year
median EV/
revenue
Premium/
discount
on 2.4x
EV/LTM
revenue
Premium/
(discount) on
LTM
multiple(4.6x)
EV/one-year
forward
revenue
EV/Two-year
forward
revenue
Five-year
median
EV/EBIT
DA
Premium/Di
scount on
10.9x
EV/LTM
EBITDA
Premium/Disco
unt on LTM
Multiple(20.2x)
EV/one-
year
forward
EBITDA
EV/two-
year
forward
EBITDA
Large-cap
companies 2.40 4.63 10.95 20.16
TCS 4.94 106.08% 6.64 43.33% 5.74 5.17 18.91 72.77% 23.85 18.32% 20.30 18.51
Infosys 3.43 42.83% 6.18 33.44% 5.30 4.72 13.37 22.17% 22.66 12.42% 20.05 17.83
HCL 2.43 1.22% 3.46 -25.30% 3.08 2.77 10.71 -2.12% 13.64 -32.33% 12.38 11.21
Wipro 2.13 -11.29% 4.63 0.00% 3.77 3.41 10.82 -1.16% 20.16 0.00% 16.95 15.32
Tech Mahindra 1.56 -34.78% 2.49 -46.24% 2.16 1.94 9.83 -10.16% 14.04 -30.35% 11.52 10.45
0.0
2.0
4.0
6.0
8.0
EV/Revenue-TCS EV/Revenue-Infy
EV/Revenue-Wipro EV/Revenue-HCL
EV/Revenue-Tech Mah EV/Revenue-Industry
©2021 Grant Thornton Bharat LLP. All rights reserved.
Company-specific analysis of large-cap
companies
21
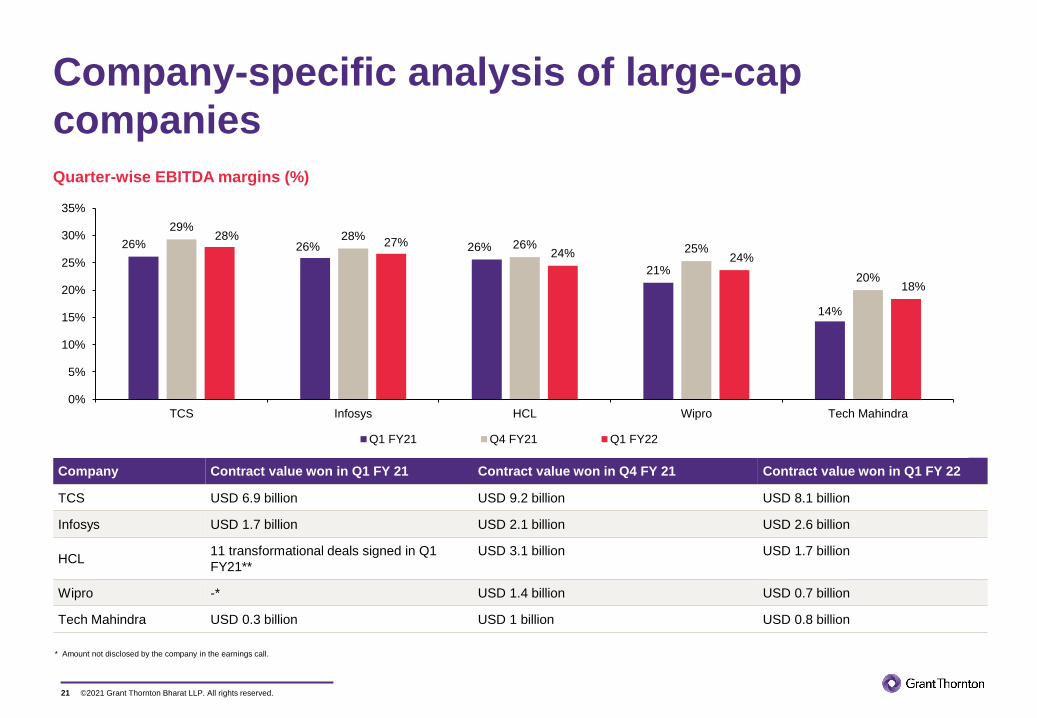
Company Contract value won in Q1 FY 21 Contract value won in Q4 FY 21 Contract value won in Q1 FY 22
TCS USD 6.9 billion USD 9.2 billion USD 8.1 billion
Infosys USD 1.7 billion USD 2.1 billion USD 2.6 billion
HCL11 transformational deals signed in Q1
FY21**
USD 3.1 billion USD 1.7 billion
Wipro -* USD 1.4 billion USD 0.7 billion
Tech Mahindra USD 0.3 billion USD 1 billion USD 0.8 billion
Quarter-wise EBITDA margins (%)
* Amount not disclosed by the company in the earnings call.
26% 26% 26%
21%
14%
29%28%
26% 25%
20%
28%27%
24% 24%
18%
0%
5%
10%
15%
20%
25%
30%
35%
TCS Infosys HCL Wipro Tech Mahindra
Q1 FY21 Q4 FY21 Q1 FY22
©2021 Grant Thornton Bharat LLP. All rights reserved.
Forward estimates of large-cap companies
22
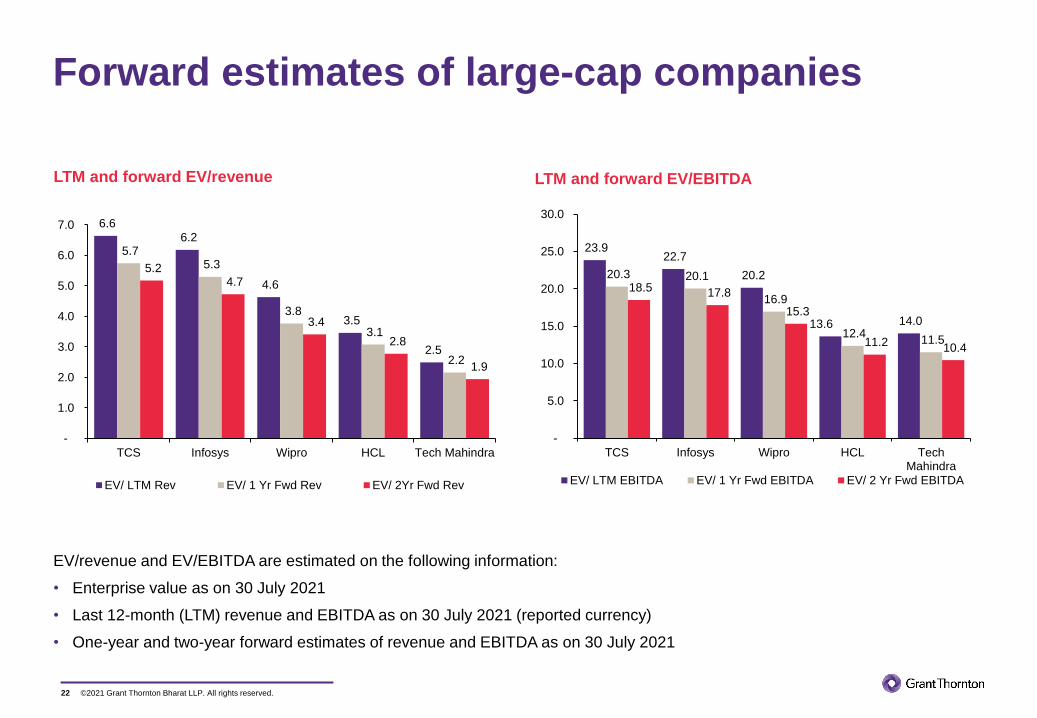
LTM and forward EV/revenue LTM and forward EV/EBITDA
EV/revenue and EV/EBITDA are estimated on the following information:
• Enterprise value as on 30 July 2021
• Last 12-month (LTM) revenue and EBITDA as on 30 July 2021 (reported currency)
• One-year and two-year forward estimates of revenue and EBITDA as on 30 July 2021
6.6 6.2
4.6
3.5
2.5
5.7 5.3
3.8
3.1
2.2
5.2 4.7
3.4
2.8
1.9
-
1.0
2.0
3.0
4.0
5.0
6.0
7.0
TCS Infosys Wipro HCL Tech Mahindra
EV/ LTM Rev EV/ 1 Yr Fwd Rev EV/ 2Yr Fwd Rev
23.9 22.7
20.2
13.6 14.0
20.3 20.1
16.9
12.4 11.5
18.5 17.8
15.3
11.2 10.4
-
5.0
10.0
15.0
20.0
25.0
30.0
TCS Infosys Wipro HCL TechMahindra
EV/ LTM EBITDA EV/ 1 Yr Fwd EBITDA EV/ 2 Yr Fwd EBITDA
©2021 Grant Thornton Bharat LLP. All rights reserved.
Revenue contribution and growth (reported USD
currency) in verticals for Q1 FY 22
23
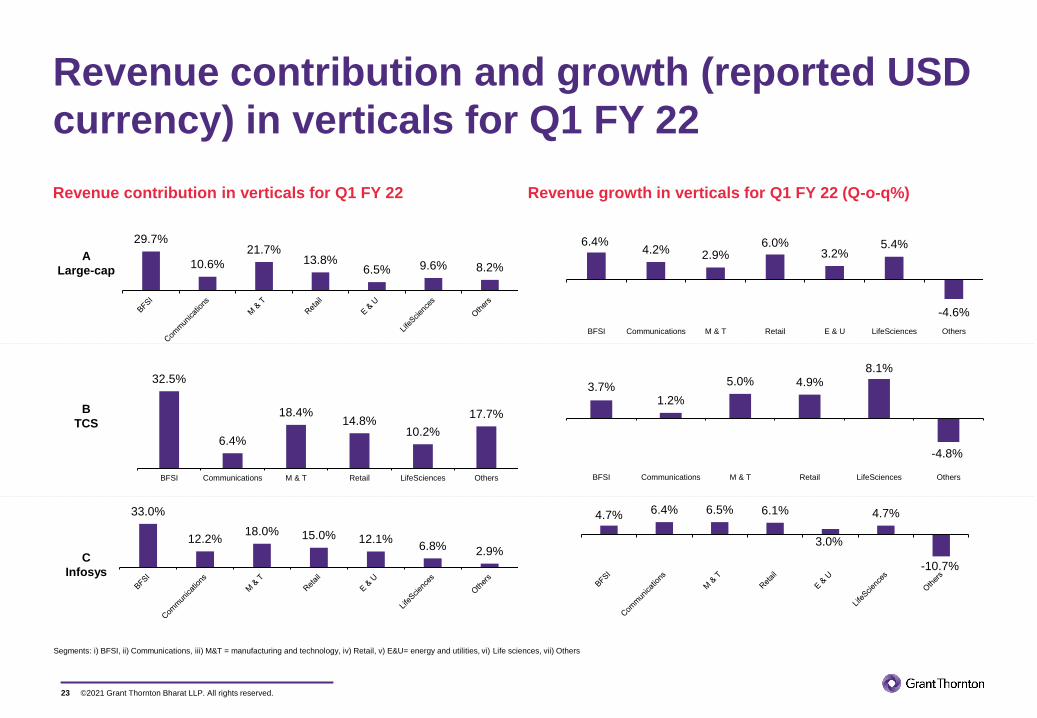
Revenue contribution in verticals for Q1 FY 22
Segments: i) BFSI, ii) Communications, iii) M&T = manufacturing and technology, iv) Retail, v) E&U= energy and utilities, vi) Life sciences, vii) Others
Revenue growth in verticals for Q1 FY 22 (Q-o-q%)
32.5%
6.4%
18.4%14.8%
10.2%
17.7%
BFSI Communications M & T Retail LifeSciences Others
3.7%1.2%
5.0% 4.9%8.1%
-4.8%
BFSI Communications M & T Retail LifeSciences Others
33.0%
12.2%18.0% 15.0% 12.1%
6.8% 2.9%
4.7% 6.4% 6.5% 6.1%
3.0%
4.7%
-10.7%
29.7%
10.6%
21.7%13.8%
6.5% 9.6% 8.2%
6.4%4.2% 2.9%
6.0%3.2%
5.4%
-4.6%
BFSI Communications M & T Retail E & U LifeSciences Others
A
Large-cap
B
TCS
C
Infosys
©2021 Grant Thornton Bharat LLP. All rights reserved.
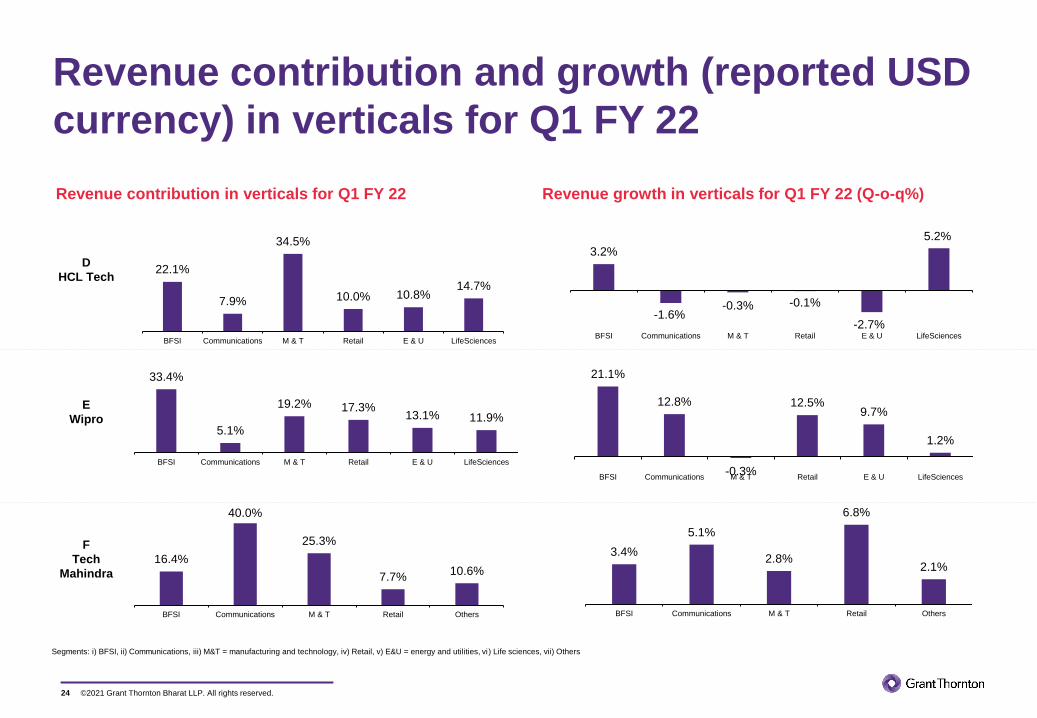
22.1%
7.9%
34.5%
10.0% 10.8%14.7%
BFSI Communications M & T Retail E & U LifeSciences
3.2%
-1.6%-0.3% -0.1%
-2.7%
5.2%
BFSI Communications M & T Retail E & U LifeSciences
33.4%
5.1%
19.2% 17.3%13.1% 11.9%
BFSI Communications M & T Retail E & U LifeSciences
21.1%
12.8%
-0.3%
12.5%9.7%
1.2%
BFSI Communications M & T Retail E & U LifeSciences
16.4%
40.0%
25.3%
7.7%10.6%
BFSI Communications M & T Retail Others
3.4%
5.1%
2.8%
6.8%
2.1%
BFSI Communications M & T Retail Others
Revenue contribution and growth (reported USD
currency) in verticals for Q1 FY 22
24
D
HCL Tech
Revenue contribution in verticals for Q1 FY 22
Segments: i) BFSI, ii) Communications, iii) M&T = manufacturing and technology, iv) Retail, v) E&U = energy and utilities, vi) Life sciences, vii) Others
Revenue growth in verticals for Q1 FY 22 (Q-o-q%)
E
Wipro
F
Tech
Mahindra
©2021 Grant Thornton Bharat LLP. All rights reserved.
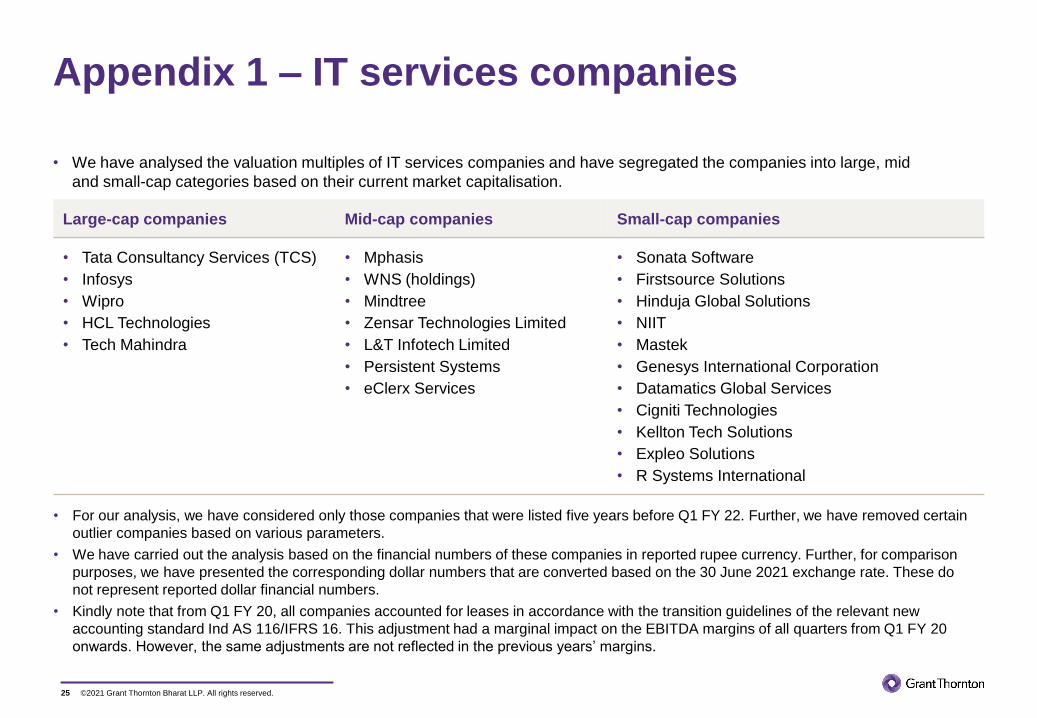
Appendix 1 – IT services companies
25
• We have analysed the valuation multiples of IT services companies and have segregated the companies into large, mid
and small-cap categories based on their current market capitalisation.
Large-cap companies Mid-cap companies Small-cap companies
• Tata Consultancy Services (TCS)
• Infosys
• Wipro
• HCL Technologies
• Tech Mahindra
• Mphasis
• WNS (holdings)
• Mindtree
• Zensar Technologies Limited
• L&T Infotech Limited
• Persistent Systems
• eClerx Services
• Sonata Software
• Firstsource Solutions
• Hinduja Global Solutions
• NIIT
• Mastek
• Genesys International Corporation
• Datamatics Global Services
• Cigniti Technologies
• Kellton Tech Solutions
• Expleo Solutions
• R Systems International
• For our analysis, we have considered only those companies that were listed five years before Q1 FY 22. Further, we have removed certain
outlier companies based on various parameters.
• We have carried out the analysis based on the financial numbers of these companies in reported rupee currency. Further, for comparison
purposes, we have presented the corresponding dollar numbers that are converted based on the 30 June 2021 exchange rate. These do
not represent reported dollar financial numbers.
• Kindly note that from Q1 FY 20, all companies accounted for leases in accordance with the transition guidelines of the relevant new
accounting standard Ind AS 116/IFRS 16. This adjustment had a marginal impact on the EBITDA margins of all quarters from Q1 FY 20
onwards. However, the same adjustments are not reflected in the previous years’ margins.
©2021 Grant Thornton Bharat LLP. All rights reserved.
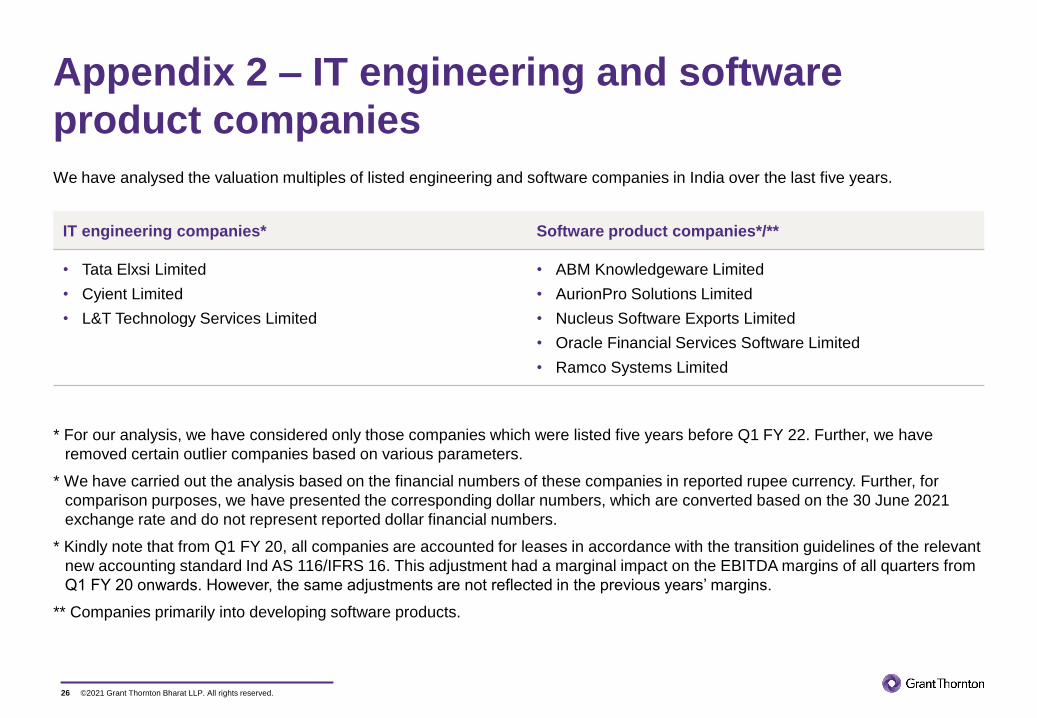
Appendix 2 – IT engineering and software
product companies
26
We have analysed the valuation multiples of listed engineering and software companies in India over the last five years.
IT engineering companies* Software product companies*/**
• Tata Elxsi Limited
• Cyient Limited
• L&T Technology Services Limited
• ABM Knowledgeware Limited
• AurionPro Solutions Limited
• Nucleus Software Exports Limited
• Oracle Financial Services Software Limited
• Ramco Systems Limited
* For our analysis, we have considered only those companies which were listed five years before Q1 FY 22. Further, we have
removed certain outlier companies based on various parameters.
* We have carried out the analysis based on the financial numbers of these companies in reported rupee currency. Further, for
comparison purposes, we have presented the corresponding dollar numbers, which are converted based on the 30 June 2021
exchange rate and do not represent reported dollar financial numbers.
* Kindly note that from Q1 FY 20, all companies are accounted for leases in accordance with the transition guidelines of the relevant
new accounting standard Ind AS 116/IFRS 16. This adjustment had a marginal impact on the EBITDA margins of all quarters from
Q1 FY 20 onwards. However, the same adjustments are not reflected in the previous years’ margins.
** Companies primarily into developing software products.

©2021 Grant Thornton Bharat LLP. All rights reserved.
Appendix 3 – Global IT services and technology
companies
27
• We have analysed the valuation multiples of the following global IT services companies over the last five years:
• Capgemini SE
• EPAM Systems Incorporated
• CACI International Corporation
• Amdocs Limited
• Booz Allen Hamilton Holding Corporation
• Leidos Holding Incorporated
• Accenture plc
• Cognizant Technology Solutions Corporation
• DXC Technology Company
• International Business Machines (IBM) Corporation
• We have analysed the valuation multiples of the following global technology companies over the last five years:
• Microsoft Corporation
• Adobe Incorporated
• Oracle Corporation
• Salesforce Incorporated
• VMware Incorporated
• Synopsys Incorporated
• ANSYS Incorporated
• Fortinet Incorporated
• Paycom Software Incorporated
• SS&C Technologies Holdings Incorporated
©2021 Grant Thornton Bharat LLP. All rights reserved.
References
28
• S&P Capital IQ database
• Annual fillings of IT services companies
• Earnings call transcripts of IT services companies
• Dealtracker published by Grant Thornton Bharat
©2021 Grant Thornton Bharat LLP. All rights reserved.
About Grant Thornton Bharat
29
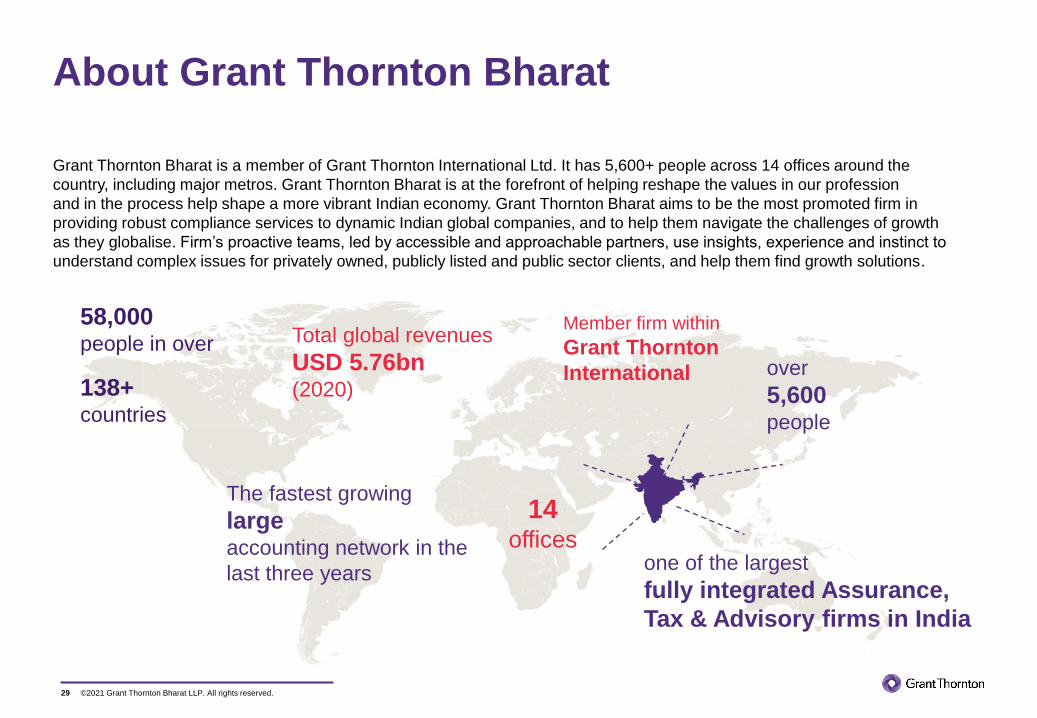
Grant Thornton Bharat is a member of Grant Thornton International Ltd. It has 5,600+ people across 14 offices around the
country, including major metros. Grant Thornton Bharat is at the forefront of helping reshape the values in our profession
and in the process help shape a more vibrant Indian economy. Grant Thornton Bharat aims to be the most promoted firm in
providing robust compliance services to dynamic Indian global companies, and to help them navigate the challenges of growth
as they globalise. Firm’s proactive teams, led by accessible and approachable partners, use insights, experience and instinct to
understand complex issues for privately owned, publicly listed and public sector clients, and help them find growth solutions.
58,000people in over
138+countries
Total global revenues
USD 5.76bn(2020)
14offices
one of the largest
fully integrated Assurance,
Tax & Advisory firms in India
Member firm within
Grant Thornton
International over
5,600people
The fastest growing
largeaccounting network in the
last three years
©2021 Grant Thornton Bharat LLP. All rights reserved.
Acknowledgements
30
Authors
Manish Saxena
Kaushik Paul
Sanjana Khandelwal
Vishal Satidasani
Madhav Kejriwal
Vaishnavi Talreja
For media queries, please contact
©2021 Grant Thornton Bharat LLP. All rights reserved.
Contact us
© 2021 Grant Thornton Bharat LLP. All rights reserved.
“Grant Thornton Bharat” means Grant Thornton Advisory Private Limited, the sole member firm of Grant Thornton International Limited (UK) in India, and those legal entities which are its related
parties as defined by the Companies Act, 2013, including Grant Thornton Bharat LLP.
Grant Thornton Bharat LLP, formerly Grant Thornton India LLP, is registered with limited liability with identity number AAA-7677 and has its registered office at L-41 Connaught Circus,
New Delhi, 110001.
References to Grant Thornton are to Grant Thornton International Ltd. (Grant Thornton International) or its member firms. Grant Thornton International and the member firms are not a worldwide
partnership. Services are delivered independently by the member firms.
Follow us @GrantThorntonIN
For more information or for any queries, write to us at [email protected]
NEW DELHI
National Office,
Outer Circle, L 41,
Connaught Circus,
New Delhi - 110001
T +91 11 4278 7070
NEW DELHI
6th Floor, Worldmark 2,
Aerocity,
New Delhi - 110037
T +91 11 4952 7400
BENGALURU
5th Floor, 65/2, Block A,
Bagmane Tridib,
Bagmane Tech Park,
CV Raman Nagar,
Bengaluru - 560093
T+91 80 4243 0700
CHANDIGARH
B-406A, 4th Floor,
L&T Elante Office Building,
Industrial Area Phase I,
Chandigarh - 160002
T +91 172 4338 000
CHENNAI
9th Floor, A Wing,
Prestige Polygon,
471 Anna Salai, Mylapore Division,
Teynampet,
Chennai - 600035
T +91 44 4294 0000
DEHRADUN
Suite No 2211, 2nd Floor,
Building 2000,
Michigan Avenue,
Doon Express Business Park,
Subhash Nagar,
Dehradun - 248002
T +91 135 2646 500
GURGAON
21st Floor, DLF Square, Jacaranda
Marg,
DLF Phase II,
Gurgaon - 122002
T +91 124 462 8000
HYDERABAD
7th Floor, Block III,
White House,
Kundan Bagh, Begumpet,
Hyderabad - 500016
T +91 40 6630 8200
KOCHI
6th Floor, Modayil Centre Point,
Warriam Road Junction,
MG Road,
Kochi - 682016
T +91 484 406 4541
KOLKATA
10C Hungerford Street,
5th Floor,
Kolkata - 700017
T +91 33 4050 8000
MUMBAI
11th Floor, Tower II,
One International Center,
SB Marg Prabhadevi (W),
Mumbai - 400013
T +91 22 6626 2600
MUMBAI
Kaledonia, 1st Floor, C Wing,
(Opposite J&J Office),
Sahar Road, Andheri East,
Mumbai - 400069
T +91 22 6176 7800
NOIDA
Plot No 19A, 2nd Floor,
Sector - 16A,
Noida - 201301
T +91 120 485 5900
PUNE
3rd Floor, Unit No 309-312,
West Wing, Nyati Unitree,
Nagar Road, Yerwada
Pune - 411006
T +91 20 6744 8800
Related Documents