VALUATION OF A NEW ENTRANT IN AN OLIGOPOLISTIC MARKET, INCLUDING ITS OPTION TO ABANDON. A REAL-LIFE CASE Félix Roux Pablo Solana Department of Industrial Engineering, Business Administration and Statistics Escuela Técnica Superior de Ingenieros Industriales Politechnic University of Madrid C/ José Gutiérrez Abascal 2, 28006 Madrid, Spain Susana Alonso Department of Financial Economics University of Valladolid C/ Trinidad 3, 40001 Segovia, Spain Corresponding author: Félix Roux Escuela Técnica Superior de Ingenieros Industriales Politechnic University of Madrid C/ José Gutiérrez Abascal 2, 28006 Madrid, Spain e-mail:[email protected] Márgenes 2,5 cm brought to you by CORE View metadata, citation and similar papers at core.ac.uk provided by Servicio de Coordinación de Bibliotecas de la Universidad Politécnica de Madrid

Welcome message from author
This document is posted to help you gain knowledge. Please leave a comment to let me know what you think about it! Share it to your friends and learn new things together.
Transcript
VALUATION OF A NEW ENTRANT IN AN OLIGOPOLISTIC MARK ET, INCLUDING ITS OPTION TO ABANDON. A REAL-LIFE CASE
Félix Roux Pablo Solana
Department of Industrial Engineering, Business Administration and Statistics Escuela Técnica Superior de Ingenieros Industriales
Politechnic University of Madrid C/ José Gutiérrez Abascal 2, 28006 Madrid, Spain
Susana Alonso Department of Financial Economics
University of Valladolid C/ Trinidad 3, 40001 Segovia, Spain
Corresponding author:
Félix Roux Escuela Técnica Superior de Ingenieros Industriales
Politechnic University of Madrid C/ José Gutiérrez Abascal 2, 28006 Madrid, Spain
e-mail:[email protected]
Márgenes 2,5 cm
brought to you by COREView metadata, citation and similar papers at core.ac.uk
provided by Servicio de Coordinación de Bibliotecas de la Universidad Politécnica de Madrid
VALUATION OF A NEW ENTRANT IN AN OLIGOPOLISTIC MARK ET, INCLUDING ITS OPTION TO ABANDON. A REAL-LIFE CASE
Félix Roux Pablo Solana
Politechnic University of Madrid
Susana Alonso University of Valladolid
Abstract The purpose of this paper is to increase current empirical evidence on the relevance of
real options for explaining firm investment decisions in oligopolistic markets. We
study an actual investment case in the Spanish mobile telephony industry, the
entrant in the market of a new operator, Yoigo. We analyze the option to abandon in
order to show the relevance of the possibility of sale the company in an oligopolistic
market where competitors are not allowed free entrance. The NPV of the new entrant
is calculated as a starting point. Then, and based on the general approach proposed
by Copeland and Antikarov (2001), a binomial tree is used to model managerial
flexibility in discrete time periods, and value the option to abandon. The strike price of
the option is calculated based in incremental EBITDA margins due to selling
customers or merging with a competitor.
Key words: Real Options; Option to abandon; Oligopolistic market; Monte Carlo simulation; Binomial trees
1
VALUATION OF A NEW ENTRANT IN AN OLIGOPOLISTIC MARK ET, INCLUDING ITS OPTION TO ABANDON. A REAL-LIFE CASE
1. INTRODUCTION
Understanding the valuation of new entrants in a market is a central theme in contemporary
business, especially when considering startup companies. It is widely acknowledged that
traditional valuations based on Net Present Value (NPV) use estimations with a high degree
of uncertainty –such as future cash flows of a company with a limited track record–. The NPV
approach neither takes into account the value of some options that these startup companies
bear, such as the option to growth or the option abandon the market.
To solve certain restrictions intherent in NPV, we can use real option valuation that
emerged from the proposal by Myers in 1977. Real option valuation considers active
management of corporate investments and, therefore, the value of their flexibility. In addition,
this model takes into account non-monetary outcomes arriving from previous resource
allocations and which become as a source of new opportunities for future decisions of the firm.
In this paper we try to increase current empirical evidence on the relevance of real
options for explaining firm investment decisions through the study of the entrant of a new
competitor in the mobile telecommunications industry. Real Options valuation is very suitable in
this industry, due to the future growth opportunities in the telecoms industry, the huge
investments required and uncertainties embedded in the market, which are key elements in
justifying the real option valuation methodology (Riihimäki, 2009).
Aditionally, the nature of the industry, an oligopolistic market where competitors are not
allowed free entrance, is considered in order to evaluate the significance of real options
embedded in the investment. Thus, we analyze the option to abandon as the main real option,
due to the fact that in this industry, there are economies of scale that allow bigger players enjoy
better margins. Consequently, new entrants have the option to sell their business to incumbent
companies (already established players), which are able to extract more value from the same
customer base, increasing its total size and having access to higher margins. As a recent real
example it can be mentioned what happened in the UK in 2009 when T-Mobile and Orange –
the smaller market players in the mobile market with 15% and 22% share respectively–
merged their businesses, creating a much larger company with 28.4 million customers (BBC,
2009). Most likely at the end of the process the brand name will be Orange.
We have evaluated, as a real life investment, the entrant of the fourth operator, Yoigo,
2
in the Spanish mobile telecommunications industry. In Europe in general, and in Spain in
particular, digital technology upgrades have led to a significant increase in the number of
players. Starting with GSM (Global System for Mobile Communication) in the 90s –which is the
most popular standard for mobile telephony systems in the world–, and later with the
introduction of the UMTS (Universal Mobile Telecommunications System) in the year 2000,
there has been a continuous increase in the number of players due to the allocation of
radiofrequencies to new standards.
Commonly, these companies have been valuing by simple Discount Cash Flows (DFC)
models, forecasting and taking present values of cash flows based in organic growth, and
building scenarios according to the probability density function of the variables chosen.
However, our analysis of the entrant of Yoigo in the Spanish mobile telephony industry reveals
that the sources of value of the investment are not only the present value of future cash flows
as expected from the accepted investments, which is valued by DFC models, but also the
value provided by the option to sell their business if things do not progress properly once it is
up and running, which has to be valued through real options techniques.
We estimate the value of this option to abandon the industry by using the proposal of
Copeland and Antikarov (2001), which is adapted to the nature of the investment analysed.
One of the most important parameters in the valuation of the option is the strike price which is
assumed Yoigo could obtain selling its customer base. To identify this strike price, the increase
in value of the entrant due to the increase in its margins at the level of a potential buyer is
calculated.
The information required for the case study is gathered from financial publications at
the time of the investment, analysts’ forecasts, public documents presented to the market by
Yoigo and finally, data collected from the professional experience of the authors in the industry.
We estimate the investment value on 2006, coinciding with the beginning of Yoigo’s
operations.
The findings to emerge from the case study provide evidence to support the
significance of real options in explaining the decision of Yoigo to entrant in the Spanish mobile
telephony industry. The value of the option to abandon endorses the logic of Yoigos’s
investment decision and contributes to justify the decision taken by the firm.
The remainder of the work is structured as follows. The second section outlines the
main features of the industry analysed. The third section provides the description of the
methodology framework used for the valuation and the main results. Thus, this section
includes, firstly, the valuation of the decision to entrant in the industry without considering
3
flexibility, the base case which is valued by DFC model, and secondly considering in an explicit
manner the option to abandon which is valued by real options techniques. Also section three
present the estimation of the strike price of the option and shows the main results in the option
to abandon valuation. The paper closes with a summary of the main conclusions.
2. OVERVIEW OF THE MOBILE TELEPHONE INDUSTRY IN SPA IN
In this section we present the Spanish mobile telephone market in order to show its
oligopolistic profile, with a limited number of players, high penetration –which tends to lower
its growth–, low differentiation of services and the presence of network effects. These
elements jointly drive to the existence of economies of scale which are also shown at the end
of the section.
2.1. Limited number of players The Spanish mobile telephone market, and major European markets, behaves as a pure
oligopoly, consisting of a few companies that offer the same service (Kotler and Keller,
2009). This mainly happens because the frequency bands required to operate are
considered a scarce resource, and they are allocated by the Administration. As a
consequence, there are currently only four players with frequency ownership in Spain which
portrait a pattern of imperfect competition, since only a few companies are able to offer a
specific product (Samuelson and Nordhaus, 1986).
Telefónica, under the brand name “Movistar”, is the market leader; Vodafone
operates under its own brand and is the second player; France Telecom, under the brand
name “Orange”, is the third player and, since December 2006, Xfera Móviles S.A., under the
brand name “Yoigo”, launched the fourth mobile operator.
Only those companies are able to manage their own frequencies and consequently
deploy their own network, although in some cases they share sites and provide national
roaming to each other.
Additionally to these Mobile Network Operators (MNOs) there are a number of Mobile
Virtual Network Operators (MVNOs). These are companies that operate using other players’
networks and have a completely different operational cost structure. We do not consider
these firms in the analysis, not only because of the aforementioned fact but also because
their marginal presence in the market- under 2% market share in terms of number of lines
(CMT, 2009). The Figure 1 shows the market share per company in 2008.

4
Fig. 1: Market share (% lines) of mobile operators, Spain 2008
44,9%
30,7%
20,7%
2,0% 1,7%
Market Share 2008 # lines
Movistar
Vodafone
Orange
Yoigo
Others (MVNOs)
Source: CMT Annual Report, 2009
2.2. High penetration
According to Merrill Lynch & Bank of America Global Wireless Matrix 4Q 2009, the
penetration of mobile telephony in Spain, defined as number of subscribers divided per
population, reaches 140%, close to Italy –highest in Western Europe– at 147%, and clearly
over Germany, United Kingdom and France at 132%, 126% and 94% respectively.
This reflects a very high penetration level at 54.1 millions of lines, shown in Table 1;
additionally the growth rate forecasted for years 2010 and 2011 is clearly lower than in
previous years, at 1.6% and 1.1% respectively. This shows that the market is close to
saturation.
Table 1: Total market customers evolution.
CY09E CY10E CY11E
Total Market (
mill) 54 055 54 902 55 521
Yearly growth 3.0% 1.6% 1.1%
Source: Merrill Llynch & Bank of America, Global Wireless Matrix 4Q09.
2.3. Low differentiation of services
Currently there is a low level of differentiation in services, they are mainly limited to voice,
short messages (SMSs), and data services that are progressively increasing their weight in
the services portfolio.
5
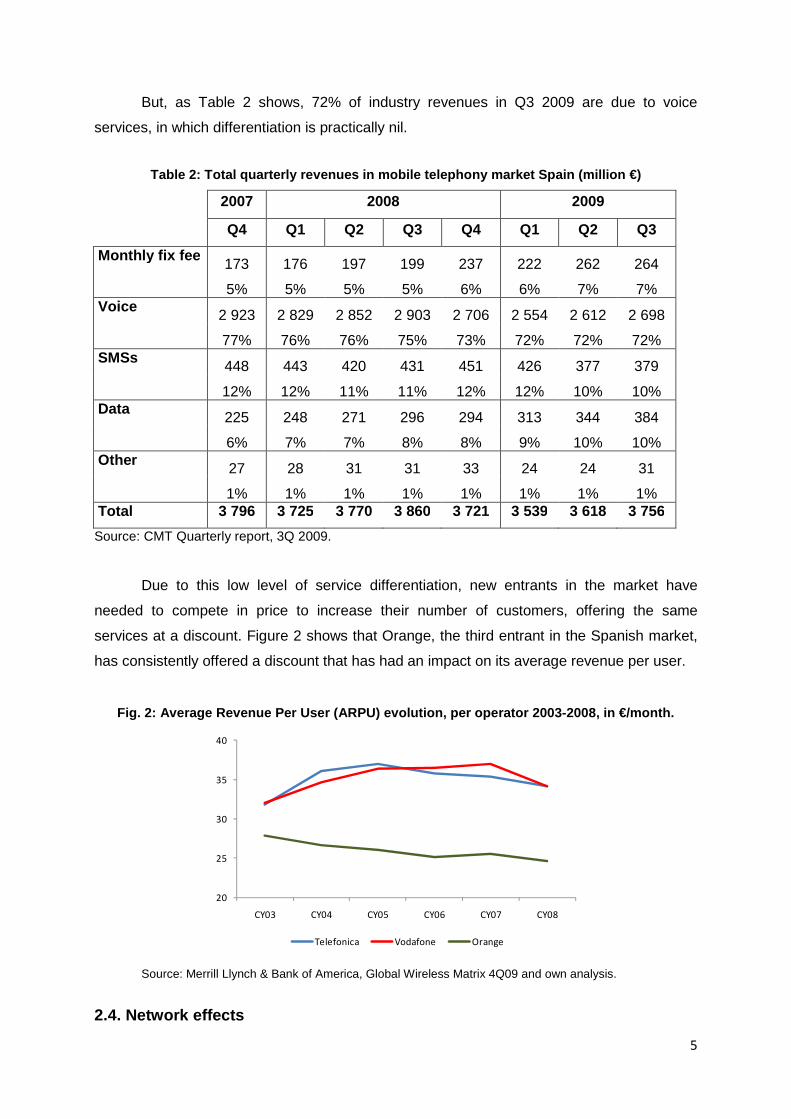
But, as Table 2 shows, 72% of industry revenues in Q3 2009 are due to voice
services, in which differentiation is practically nil.
Table 2: Total quarterly revenues in mobile telepho ny market Spain (million €)
2007 2008 2009
Q4 Q1 Q2 Q3 Q4 Q1 Q2 Q3
Monthly fix fee 173 176 197 199 237 222 262 264
5% 5% 5% 5% 6% 6% 7% 7%
Voice 2 923 2 829 2 852 2 903 2 706 2 554 2 612 2 698
77% 76% 76% 75% 73% 72% 72% 72% SMSs 448 443 420 431 451 426 377 379
12% 12% 11% 11% 12% 12% 10% 10% Data
225 248 271 296 294 313 344 384
6% 7% 7% 8% 8% 9% 10% 10% Other 27 28 31 31 33 24 24 31 1% 1% 1% 1% 1% 1% 1% 1% Total 3 796 3 725 3 770 3 860 3 721 3 539 3 618 3 756
Source: CMT Quarterly report, 3Q 2009.
Due to this low level of service differentiation, new entrants in the market have
needed to compete in price to increase their number of customers, offering the same
services at a discount. Figure 2 shows that Orange, the third entrant in the Spanish market,
has consistently offered a discount that has had an impact on its average revenue per user.
Fig. 2: Average Revenue Per User (ARPU) evolution, per operator 2003-2008, in €/month.
20
25
30
35
40
CY03 CY04 CY05 CY06 CY07 CY08
Telefonica Vodafone Orange
Source: Merrill Llynch & Bank of America, Global Wireless Matrix 4Q09 and own analysis.
2.4. Network effects
6
Network effects exist if the usage of a product by any user increases or decreases the
product’s value for other users (Katz and Shapiro, 1985). Technology adoption decisions, in
the presence of network effects, are influenced by the size of a provider’s existing installed
base in the market, as well as by expectations of its future size. The theory suggests that a
product value increases due to usage by other users, thus creating a positive network effects
(Katz and Shapiro, 1986).
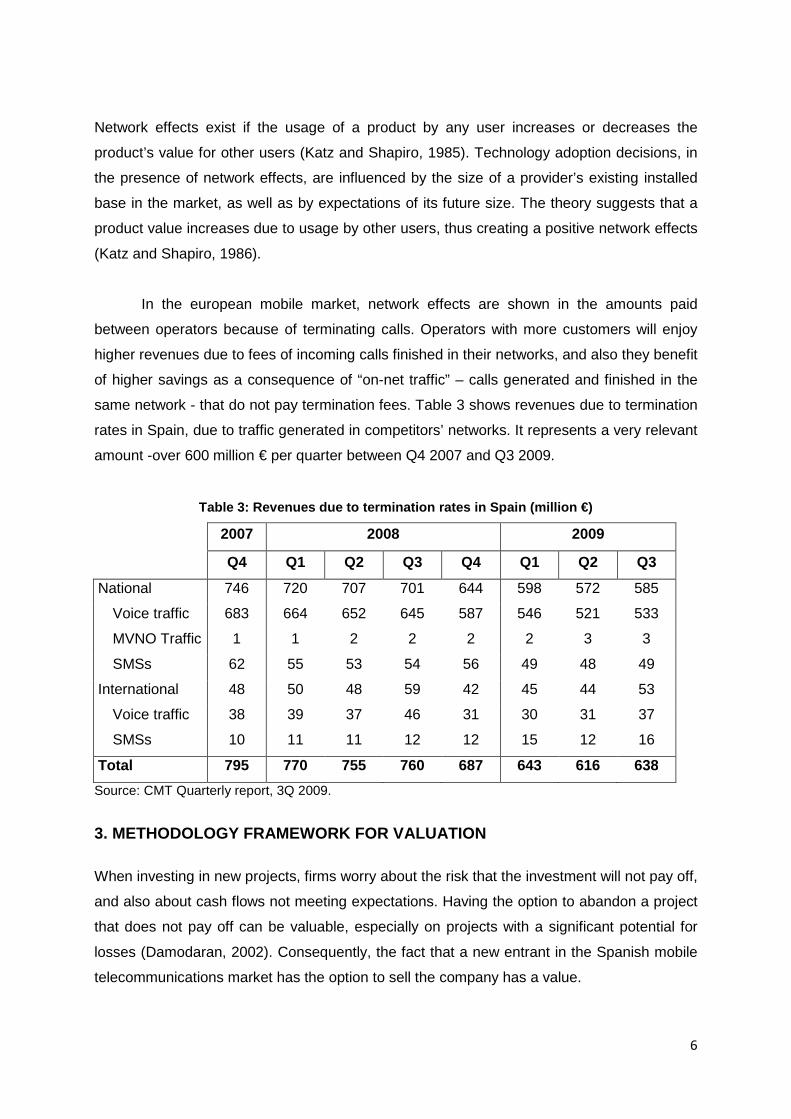
In the european mobile market, network effects are shown in the amounts paid
between operators because of terminating calls. Operators with more customers will enjoy
higher revenues due to fees of incoming calls finished in their networks, and also they benefit
of higher savings as a consequence of “on-net traffic” – calls generated and finished in the
same network - that do not pay termination fees. Table 3 shows revenues due to termination
rates in Spain, due to traffic generated in competitors’ networks. It represents a very relevant
amount -over 600 million € per quarter between Q4 2007 and Q3 2009.
Table 3: Revenues due to termination rates in Spain (million €)
2007 2008 2009
Q4 Q1 Q2 Q3 Q4 Q1 Q2 Q3
National 746 720 707 701 644 598 572 585
Voice traffic 683 664 652 645 587 546 521 533
MVNO Traffic 1 1 2 2 2 2 3 3
SMSs 62 55 53 54 56 49 48 49
International 48 50 48 59 42 45 44 53
Voice traffic 38 39 37 46 31 30 31 37
SMSs 10 11 11 12 12 15 12 16
Total 795 770 755 760 687 643 616 638
Source: CMT Quarterly report, 3Q 2009.
3. METHODOLOGY FRAMEWORK FOR VALUATION
When investing in new projects, firms worry about the risk that the investment will not pay off,
and also about cash flows not meeting expectations. Having the option to abandon a project
that does not pay off can be valuable, especially on projects with a significant potential for
losses (Damodaran, 2002). Consequently, the fact that a new entrant in the Spanish mobile
telecommunications market has the option to sell the company has a value.
7
For valuing the option to abandon we apply the methodology proposed by Copeland
and Antikarov (2001). On the basis of Samuelson theorem (1965), these authors propose to
reduce the sources of uncertainty in investment to a single-value variability of the project
without options, which evolves over time as a random walk.
To do that, firstly, an estimation of the investment present value without flexibility is
provided, which is calculated by DCF model. The underlying asset of the embedded option is
precisely the DCF value of the firm without options.
Then the uncertainty is introduced in an explicit manner as the process followed by
the variables identified as uncertain. Once modeled these variables, we used Monte Carlo
simulation to generate the distribution in time present value of the investment without
flexibility and the standard deviation of its rate of returnis estimated.
Then, the binomial tree is constructed from the underlying values considering the
reinvestment of cash flows, and the value of the option is determined.
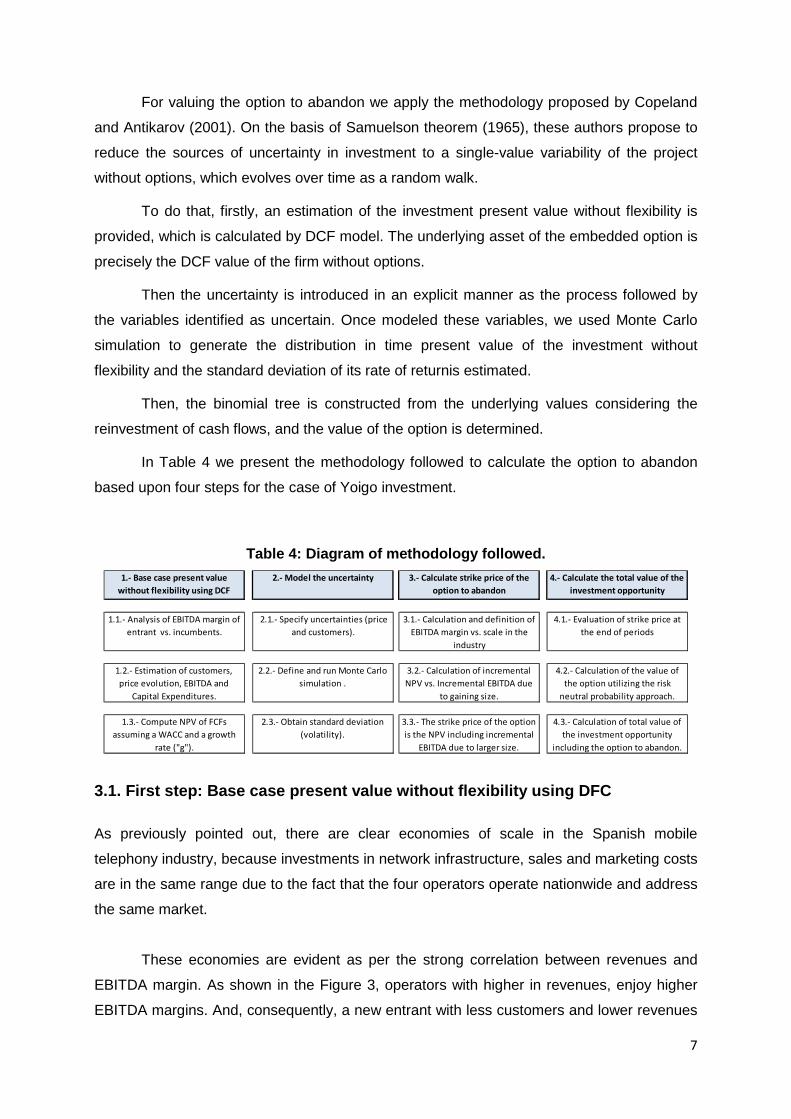
In Table 4 we present the methodology followed to calculate the option to abandon
based upon four steps for the case of Yoigo investment.
Table 4: Diagram of methodology followed.
1.- Base case present value
without flexibility using DCF
2.- Model the uncertainty 3.- Calculate strike price of the
option to abandon
4.- Calculate the total value of the
investment opportunity
1.1.- Analysis of EBITDA margin of
entrant vs. incumbents.
2.1.- Specify uncertainties (price
and customers).
3.1.- Calculation and definition of
EBITDA margin vs. scale in the
industry
4.1.- Evaluation of strike price at
the end of periods
1.2.- Estimation of customers,
price evolution, EBITDA and
Capital Expenditures.
2.2.- Define and run Monte Carlo
simulation .
3.2.- Calculation of incremental
NPV vs. Incremental EBITDA due
to gaining size.
4.2.- Calculation of the value of
the option utilizing the risk
neutral probability approach.
1.3.- Compute NPV of FCFs
assuming a WACC and a growth
rate ("g").
2.3.- Obtain standard deviation
(volatility).
3.3.- The strike price of the option
is the NPV including incremental
EBITDA due to larger size.
4.3.- Calculation of total value of
the investment opportunity
including the option to abandon.
3.1. First step: Base case present value without fl exibility using DFC
As previously pointed out, there are clear economies of scale in the Spanish mobile
telephony industry, because investments in network infrastructure, sales and marketing costs
are in the same range due to the fact that the four operators operate nationwide and address
the same market.
These economies are evident as per the strong correlation between revenues and
EBITDA margin. As shown in the Figure 3, operators with higher in revenues, enjoy higher
EBITDA margins. And, consequently, a new entrant with less customers and lower revenues

8
would have lower EBITDA margins while in the process of increasing its number of
customers. As presented in the attached figure, it is estimated that a new entrant in the
Spanish market such as Yoigo, would have an EBITDA margin between 10% and 20% until
reaching a number of customers over 5 million. In our case we have assumed an optimistic
scenario of 20%, in line also with Merrill Llynch & Bank of America estimations (2009). It also
can be appreciated in the figure that increasing those margins could be difficult because of
the progressive margin erosion due to market maturity.
Fig. 3: EBITDA Margin (%) vs. number of customers ( ´000), Spain 2003 – 2008
0%
10%
20%
30%
40%
50%
60%
70%
0 5.000 10.000 15.000 20.000 25.000 30.000
EB
ITD
A M
arg
in %
Customers (´000)
Telefonica
Vodafone
Orange
2011
2003
2011
2003
2003
2011
Source: Merrill Llynch & Bank of America, Global Wireless Matrix 4Q09 and own analysis.
A consequence of the diagram presented in Figure 3 is that players already present in
the market (incumbents) are able to extract more value from the same customers, because
of having a higher EBITDA margin. Thus, there should be an option to sell to them the
customer base at a premium. As we can see in the next section, we calculate the strike price
of the option to abandon based on this fact.
As a starting point of the valuation, we calculate the NPV of Yoigo, the fourth player in
the Spanish mobile telephony market, as if we were in 2006 at the moment of launching the
9
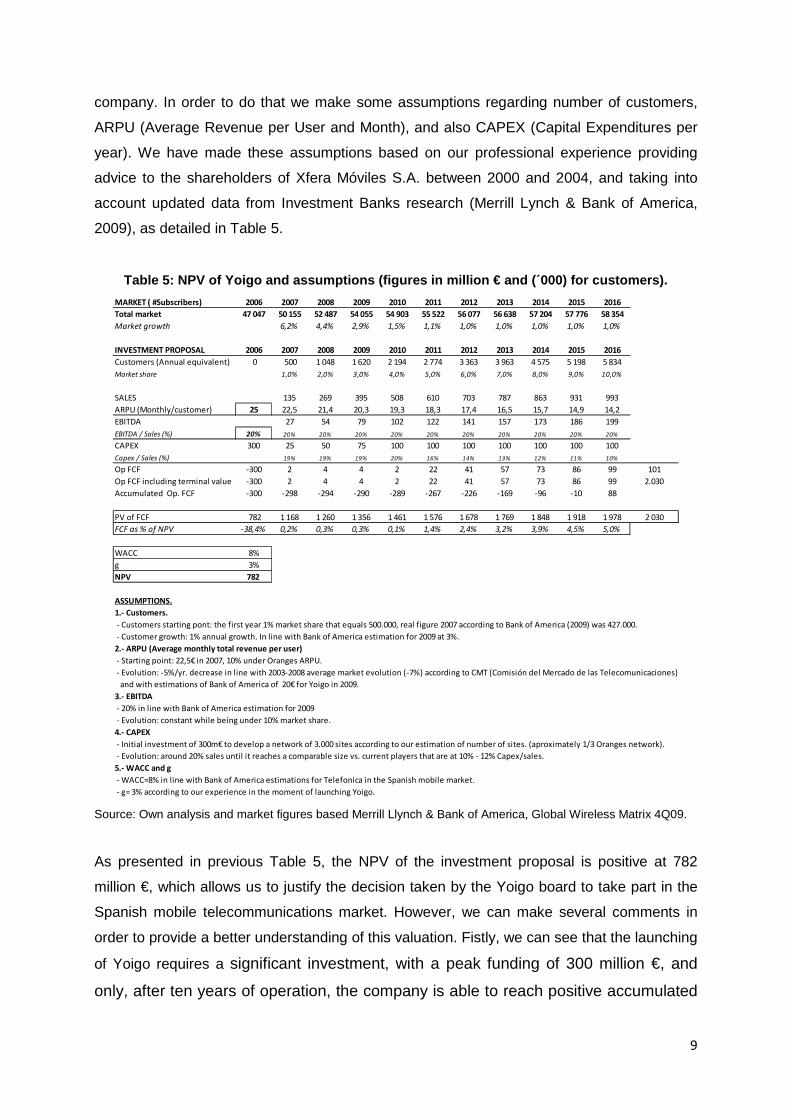
company. In order to do that we make some assumptions regarding number of customers,
ARPU (Average Revenue per User and Month), and also CAPEX (Capital Expenditures per
year). We have made these assumptions based on our professional experience providing
advice to the shareholders of Xfera Móviles S.A. between 2000 and 2004, and taking into
account updated data from Investment Banks research (Merrill Lynch & Bank of America,
2009), as detailed in Table 5.
Table 5: NPV of Yoigo and assumptions (figures in m illion € and (´000) for customers).
MARKET ( #Subscribers) 2006 2007 2008 2009 2010 2011 2012 2013 2014 2015 2016
Total market 47 047 50 155 52 487 54 055 54 903 55 522 56 077 56 638 57 204 57 776 58 354
Market growth 6,2% 4,4% 2,9% 1,5% 1,1% 1,0% 1,0% 1,0% 1,0% 1,0%
INVESTMENT PROPOSAL 2006 2007 2008 2009 2010 2011 2012 2013 2014 2015 2016
Customers (Annual equivalent) 0 500 1 048 1 620 2 194 2 774 3 363 3 963 4 575 5 198 5 834
Market share 1,0% 2,0% 3,0% 4,0% 5,0% 6,0% 7,0% 8,0% 9,0% 10,0%
SALES 135 269 395 508 610 703 787 863 931 993
ARPU (Monthly/customer) 25 22,5 21,4 20,3 19,3 18,3 17,4 16,5 15,7 14,9 14,2
EBITDA 27 54 79 102 122 141 157 173 186 199
EBITDA / Sales (%) 20% 20% 20% 20% 20% 20% 20% 20% 20% 20% 20%
CAPEX 300 25 50 75 100 100 100 100 100 100 100
Capex / Sales (%) 19% 19% 19% 20% 16% 14% 13% 12% 11% 10%
Op FCF -300 2 4 4 2 22 41 57 73 86 99 101
Op FCF including terminal value -300 2 4 4 2 22 41 57 73 86 99 2.030
Accumulated Op. FCF -300 -298 -294 -290 -289 -267 -226 -169 -96 -10 88
PV of FCF 782 1 168 1 260 1 356 1 461 1 576 1 678 1 769 1 848 1 918 1 978 2 030
FCF as % of NPV -38,4% 0,2% 0,3% 0,3% 0,1% 1,4% 2,4% 3,2% 3,9% 4,5% 5,0%
WACC 8%
g 3%
NPV 782
ASSUMPTIONS.
1.- Customers.
- Customers starting pont: the first year 1% market share that equals 500.000, real figure 2007 according to Bank of America (2009) was 427.000.
- Customer growth: 1% annual growth. In line with Bank of America estimation for 2009 at 3%.
2.- ARPU (Average monthly total revenue per user)
- Starting point: 22,5€ in 2007, 10% under Oranges ARPU.
- Evolution: -5%/yr. decrease in line with 2003-2008 average market evolution (-7%) according to CMT (Comisión del Mercado de las Telecomunicaciones)
and with estimations of Bank of America of 20€ for Yoigo in 2009.
3.- EBITDA
- 20% in line with Bank of America estimation for 2009
- Evolution: constant while being under 10% market share.
4.- CAPEX
- Initial investment of 300m€ to develop a network of 3.000 sites according to our estimation of number of sites. (aproximately 1/3 Oranges network).
- Evolution: around 20% sales until it reaches a comparable size vs. current players that are at 10% - 12% Capex/sales.
5.- WACC and g
- WACC=8% in line with Bank of America estimations for Telefonica in the Spanish mobile market.
- g= 3% according to our experience in the moment of launching Yoigo. Source: Own analysis and market figures based Merrill Llynch & Bank of America, Global Wireless Matrix 4Q09.
As presented in previous Table 5, the NPV of the investment proposal is positive at 782
million €, which allows us to justify the decision taken by the Yoigo board to take part in the
Spanish mobile telecommunications market. However, we can make several comments in
order to provide a better understanding of this valuation. Fistly, we can see that the launching
of Yoigo requires a significant investment, with a peak funding of 300 million €, and
only, after ten years of operation, the company is able to reach positive accumulated

10
free cash flow. Secondly, we can see that the NPV lies mainly in the terminal value of
the investment (2 030 m€ in the year 2017) which depends critically of the cash flows
growth rate “g”. Thirdly, we assume the WACC to be 8%, it is based in the figures
used by investment banks such as Merrill Lynch Bank of America for Telefónica, and
currently 8% is also utilized frequently in the Spanish mobile telecom industry to
value every player independently of its size, it is due to the difficulty to assume a
different level of risk in the long run for a similar móbile operator – Yoigo is owned
TeliaSonera, the large and experienced sweden mobile operator - operating in the
same market.
The Figure 4 shows the amount of initial disbursement and the evolution of flows,
without discounting, between 2006 and 2016 (expressed in million €) and before considering
the terminal value. As we mention before, the company reach positive accumulated free cash
flow after ten years of operations.
Fig. 4: Cash flow evolution 2006 – 2016 (million
€)
-300
2 4 4 222
4157
7386
99
-300 -298 -294 -290 -289-267
-226
-169
-96
-10
88
-400
-200
0
200
2006 2007 2008 2009 2010 2011 2012 2013 2014 2015 2016
Op FCF Accumulated Op. FCF
3.2. Second step: Modeling the uncertainty using ev ent trees
Once we have estimated the NPV of the new entrant Yoigo, we proceed to model the causal
uncertainties of the investment. In this case, we consider that the major source of uncertainty
is the evolution in number of customers because, as we can see in Table 6, price variations

11
are strongly correlated to customers growth rate. Thus, in the Spanish market for the period
between 2002 and 2008 we have found a slope between customers growth rate and price
variations (in percentage) of -0.6, meaning that 1% market growth relates to a 0.6% price
decrease, with a R2 factor of 99.1%.
Table 6: Correlation between customer growth rate a nd price decrease in the Spanish market
Evolution 2002 2003 2004 2005 2006 2007 2008
Total market customers (´000) 33 530 37 507 39 161 43 114 47 047 50 155 52 487
(1) % Growth 12% 4% 10% 9% 7% 5%
Average market ARPU (€/month) 25,0 23,5 22,8 20,0 18,4 17,2 16,3
(2) % decrease -6% -3% -12% -8% -6% -5%
Slope between (1 and 2) -0,60
R2 between (1 and 2) 99,1% Source: Own analysis from CMT 2009 and Merrill Llynch & Bank of America Global Matrix, 2009.
Due to the nature of the project (a startup), the short life of the industry –the digital
mobile telephony sector in Spain started in 1995– but also due to the evolution of the market,
that has grown up very quickly, it would be difficult to assume that past years growth figures
would be replicated. Consequently we use management estimates, as presented by
Copeland and Antikarov (2001) to model the source of uncertainty number of customers. We
assume a estimation that the total number of customers will be over 1 million by 2016. To
estimate the volatility we assume lognormal distribution and, thus, we follow the equation
recommended by Copeland and Antikarov (2001).
were T is the number of periods considered, Σri is the sum of the period growths, V0 is the
starting number of customers (we assume 0.5 million after 1 year, -reality has been 0.43
million), and VTLower is the lower forecasted number of customers, representing the worst
case scenario according to management expectations at the end of the periods considered.
We assume this worst case to be 1 million customers by 2016.
Next we run Monte Carlo simulation. For each year we define a log-normally
distributed random variable, customer evolution (Q). Where ε is a random number N(0,1) and
µ is the average growth for the periods considered.
As we mention before, we assume that price variation is strongly correlated with the
customer evolution, being the R2 of the regression between customers growth rate and price
12
variations (in percentage) of 99.1% shown in Table 6. Every time we run Monte Carlo
Simulation, price variations are also run.
Using this process we obtain many simulated sets of customers and ARPUs for the
forecasted years. Once these values are simulated at different time intervals, we
obtain the value of the flows corresponding to these simulations and from these the
current value of the project at every moment.
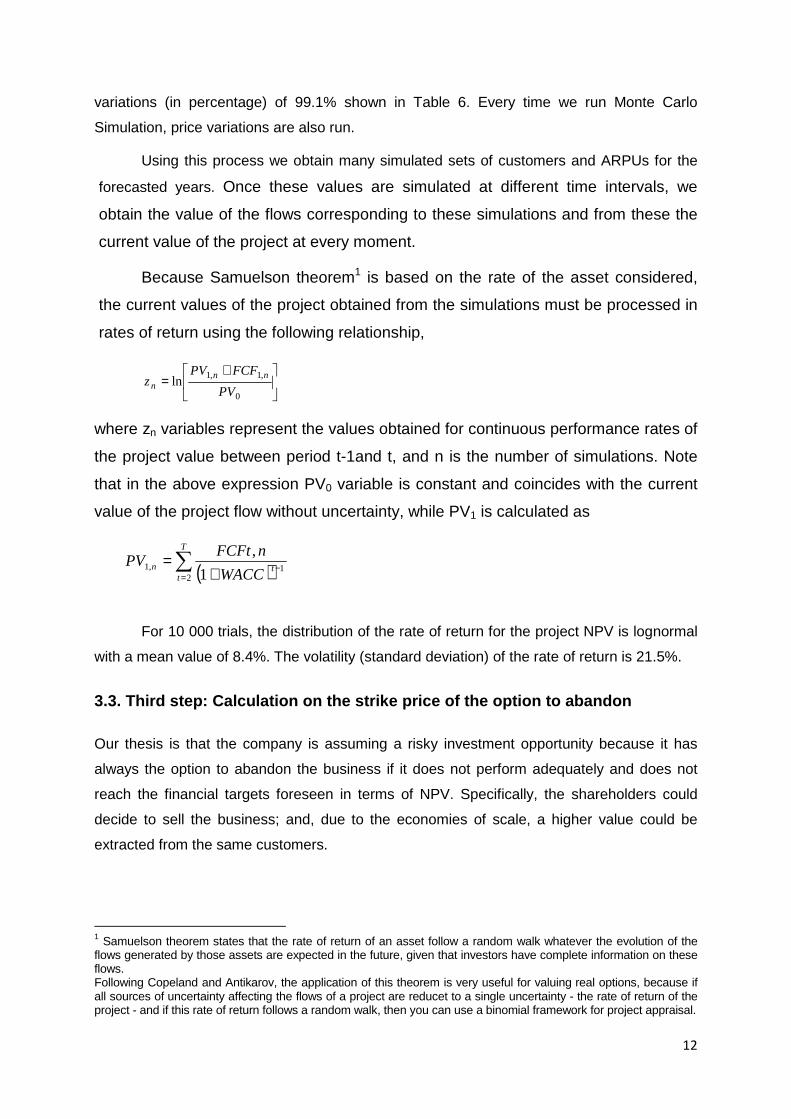
Because Samuelson theorem1 is based on the rate of the asset considered,
the current values of the project obtained from the simulations must be processed in
rates of return using the following relationship,
+=
0
,1,1lnPV
FCFPVz
nnn
where zn variables represent the values obtained for continuous performance rates of
the project value between period t-1and t, and n is the number of simulations. Note
that in the above expression PV0 variable is constant and coincides with the current
value of the project flow without uncertainty, while PV1 is calculated as
( )∑=
−+=
T
ttn
WACC
nFCFtPV
21,1
1
,
For 10 000 trials, the distribution of the rate of return for the project NPV is lognormal
with a mean value of 8.4%. The volatility (standard deviation) of the rate of return is 21.5%.
3.3. Third step: Calculation on the strike price of the option to abandon
Our thesis is that the company is assuming a risky investment opportunity because it has
always the option to abandon the business if it does not perform adequately and does not
reach the financial targets foreseen in terms of NPV. Specifically, the shareholders could
decide to sell the business; and, due to the economies of scale, a higher value could be
extracted from the same customers.
1 Samuelson theorem states that the rate of return of an asset follow a random walk whatever the evolution of the flows generated by those assets are expected in the future, given that investors have complete information on these flows. Following Copeland and Antikarov, the application of this theorem is very useful for valuing real options, because if all sources of uncertainty affecting the flows of a project are reducet to a single uncertainty - the rate of return of the project - and if this rate of return follows a random walk, then you can use a binomial framework for project appraisal.
13
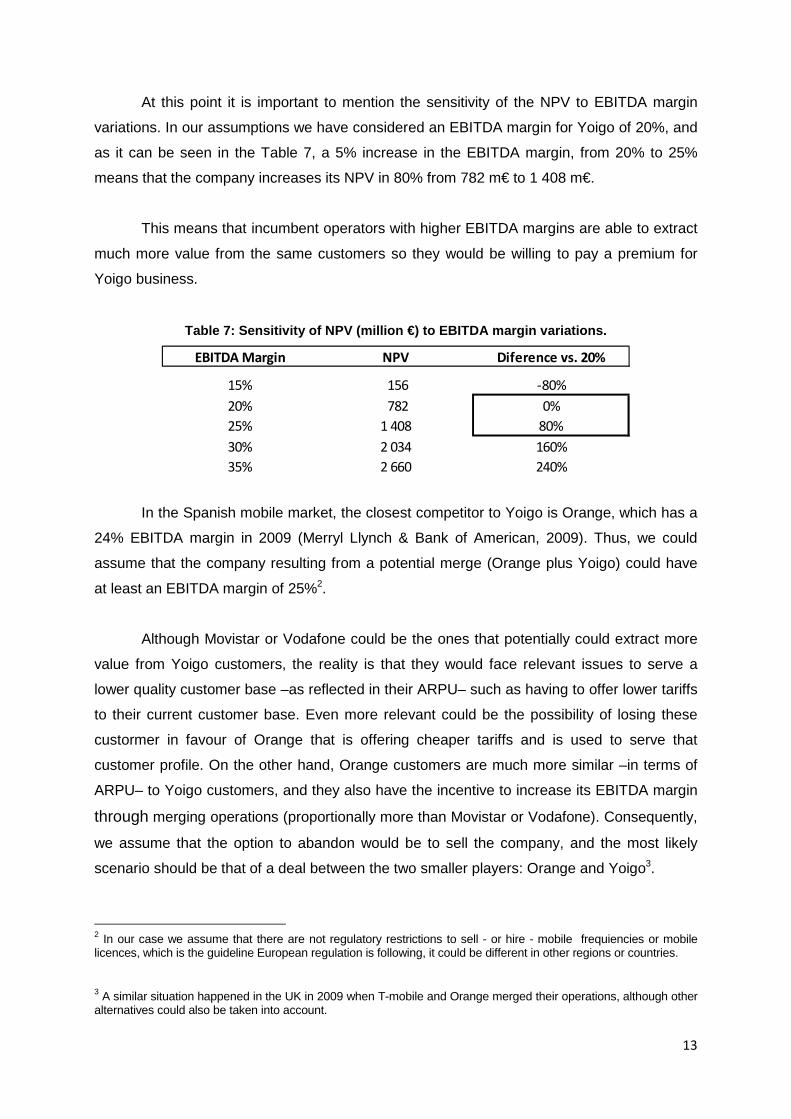
At this point it is important to mention the sensitivity of the NPV to EBITDA margin
variations. In our assumptions we have considered an EBITDA margin for Yoigo of 20%, and
as it can be seen in the Table 7, a 5% increase in the EBITDA margin, from 20% to 25%
means that the company increases its NPV in 80% from 782 m€ to 1 408 m€.
This means that incumbent operators with higher EBITDA margins are able to extract
much more value from the same customers so they would be willing to pay a premium for
Yoigo business.
Table 7: Sensitivity of NPV (million €) to EBITDA m argin variations.
EBITDA Margin NPV Diference vs. 20%
15% 156 -80%
20% 782 0%
25% 1 408 80%
30% 2 034 160%
35% 2 660 240%
In the Spanish mobile market, the closest competitor to Yoigo is Orange, which has a
24% EBITDA margin in 2009 (Merryl Llynch & Bank of American, 2009). Thus, we could
assume that the company resulting from a potential merge (Orange plus Yoigo) could have
at least an EBITDA margin of 25%2.
Although Movistar or Vodafone could be the ones that potentially could extract more
value from Yoigo customers, the reality is that they would face relevant issues to serve a
lower quality customer base –as reflected in their ARPU– such as having to offer lower tariffs
to their current customer base. Even more relevant could be the possibility of losing these
custormer in favour of Orange that is offering cheaper tariffs and is used to serve that
customer profile. On the other hand, Orange customers are much more similar –in terms of
ARPU– to Yoigo customers, and they also have the incentive to increase its EBITDA margin
through merging operations (proportionally more than Movistar or Vodafone). Consequently,
we assume that the option to abandon would be to sell the company, and the most likely
scenario should be that of a deal between the two smaller players: Orange and Yoigo3.
2 In our case we assume that there are not regulatory restrictions to sell - or hire - mobile frequiencies or mobile licences, which is the guideline European regulation is following, it could be different in other regions or countries.
3 A similar situation happened in the UK in 2009 when T-mobile and Orange merged their operations, although other alternatives could also be taken into account.
14
The strike price of the option to abandon is calculated as the increase in NPV due to
higher EBITDA margins that would be generated from the same customers by an alternative
player with larger scale. In our case the strike price would be based in a 5% EBITDA
increase that would generate an 80% NPV increase.
Consequently, the strike price is variable since will change depending on the
simulated values for the number of customers. That is, although the strike price is based
on a fixed EBITDA margin increase that generates a fixed NPV increase, the value depends
upon the customers reached in every period. Additionally a sensitivity analysis could be
made using a range of incremental EBITDAs (i.e. between 2.5% and 7.5% instead of a fixed
5%). We think that this approach is a much more realistic manner than the traditional
approaches based in a fixed strike price of the option to abandon which does not change
during the life of the project, and also helps to gain a deeper understanding of the value of
the business.
3.4. Step four: Total value of the investment oppor tunity
To calculate the value of the company including the option to abandon we use a discrete
multiplicative binomial event tree. Differently from models in continuous time, such as those
by Black and Scholes (1973) and Merton (1973), a discrete setting helps to clarify the
economic principles underlying option pricing. The main reason to use a discrete setting,
however, is that there are not closed form solutions in continuous time for American put
options as it is presented in the case. Binomial trees provide a simple set up to value such
American derivatives.
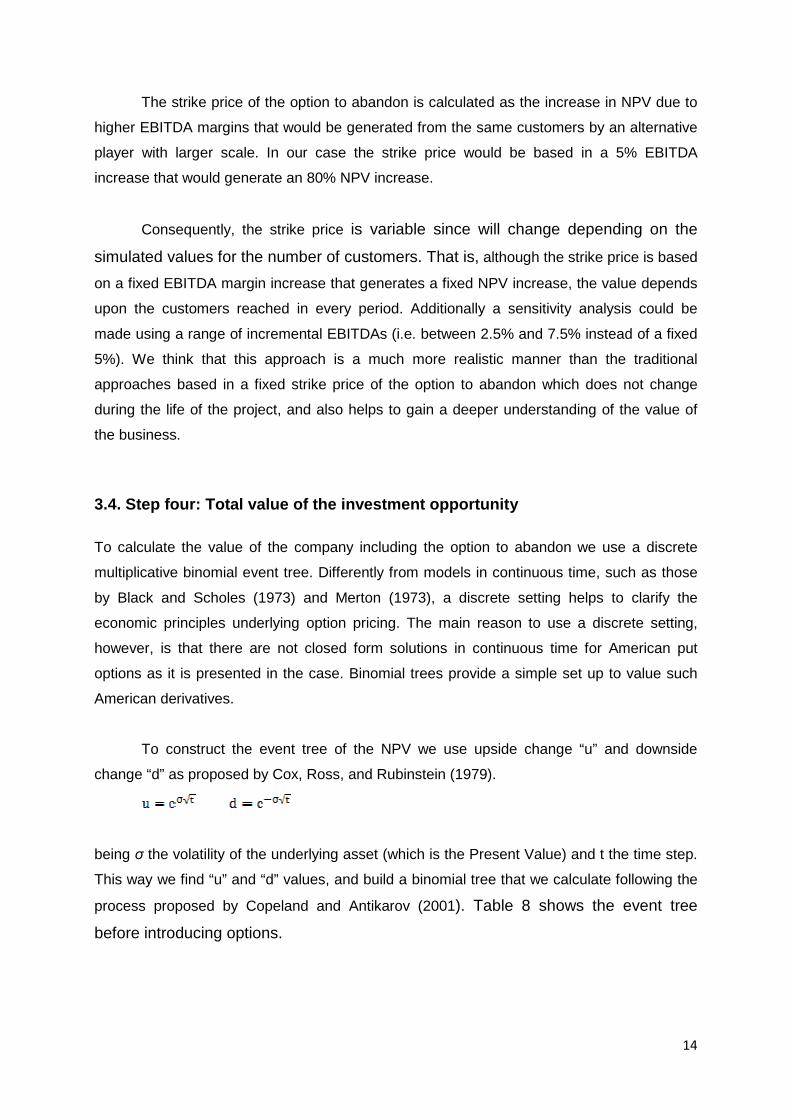
To construct the event tree of the NPV we use upside change “u” and downside
change “d” as proposed by Cox, Ross, and Rubinstein (1979).
being σ the volatility of the underlying asset (which is the Present Value) and t the time step.
This way we find “u” and “d” values, and build a binomial tree that we calculate following the
process proposed by Copeland and Antikarov (2001). Table 8 shows the event tree
before introducing options.

15
Table 8: Event tree (million €)
Up (u) = 1.239984
Down (d) = 0.806461
Present Value before dividends (dividends = CF)
2006 2007 2008 2009 2010 2011 2012 2013 2014 2015 2016
1 081.9 1 168.4 1 446.4 1 788.1 2 210.7 2 738.3 3 347.3 4 047.9 4 851.2 5 769.8 6 817.6
940.7 1 162.9 1 437.8 1 780.9 2 177.0 2 632.6 3 155.1 3 752.6 4 434.1
Capex (Yr 1) 756.3 935.1 1 158.3 1 415.9 1 712.2 2 052.0 2 440.6 2 883.8
300.0 608.2 753.3 920.9 1 113.6 1 334.6 1 587.3 1 875.6
489.9 598.9 724.3 868.0 1 032.4 1 219.8
389.5 471.0 564.5 671.4 793.4
306.4 367.2 436.7 515.9
238.8 284.0 335.6
184.7 218.3
142.0
PV1 = PVo x u (or) PV0 x dPV1 = PVo x u (or) PV0 x d
The next step is to calculate the effect of the FCF in the present value of every single
period; we calculate it as a percentage of the present value as described by Copeland and
Antikarov (2001) and presented in Table 9.
Table 9: CF of every period as a percentage of PV ( million €)
CF as a % of PV
2006 2007 2008 2009 2010 2011 2012 2013 2014 2015 2016
-27.7% 0.2% 0.3% 0.3% 0.1% 1.4% 2.5% 3.3% 4.1% 4.7% 5.2%
CF calculated for every period as a proportion of the PV
2006 2007 2008 2009 2010 2011 2012 2013 2014 2015 2016
-300.0 2.0 4.3 5.2 2.4 38.8 82.8 135.6 198.1 271.6 357.4
2.8 3.4 1.6 25.2 53.9 88.2 128.8 176.7 232.5
2.2 1.0 16.4 35.0 57.3 83.8 114.9 151.2
0.7 10.7 22.8 37.3 54.5 74.7 98.3
6.9 14.8 24.3 35.4 48.6 64.0
9.6 15.8 23.1 31.6 41.6
10.3 15.0 20.6 27.1
9.8 13.4 17.6
8.7 11.4
7.4
CF = (% of NPV) x (PV before dividends)CF = (% of NPV) x (PV before dividends)
Now, we are able to calculate the Binomial tree extracting the FCF for every period
and identifying the cells were the value is under the expected present value in the previous
DCF valuation, as presented in Table 10. We have defined the criteria that we would
abandon the business when that happens because that would mean that we are not reaching
our initial financial targets.
The strike price of the option in those cases would be the present value of the
business in that moment incremented by the 80% due to the higher NPV extracted to the
customer base by a competitor when being sold.
16
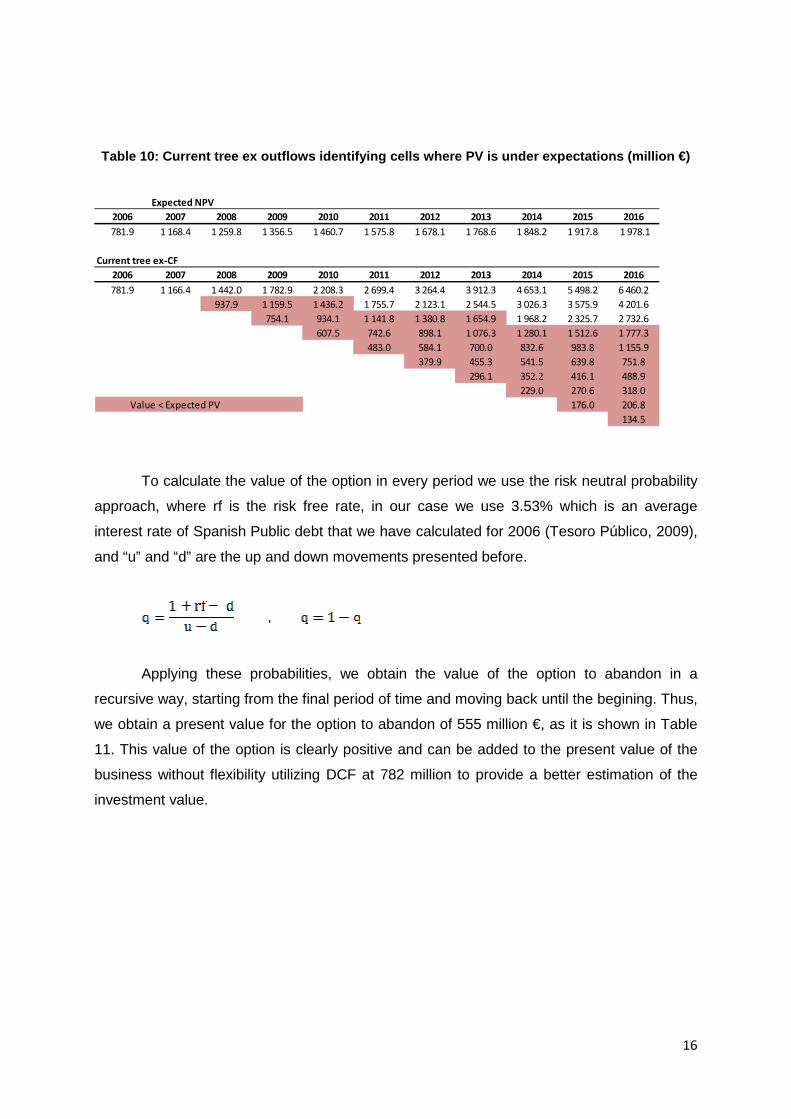
Table 10: Current tree ex outflows identifying cell s where PV is under expectations (million €)
Expected NPV
2006 2007 2008 2009 2010 2011 2012 2013 2014 2015 2016
781.9 1 168.4 1 259.8 1 356.5 1 460.7 1 575.8 1 678.1 1 768.6 1 848.2 1 917.8 1 978.1
Current tree ex-CF
2006 2007 2008 2009 2010 2011 2012 2013 2014 2015 2016
781.9 1 166.4 1 442.0 1 782.9 2 208.3 2 699.4 3 264.4 3 912.3 4 653.1 5 498.2 6 460.2
937.9 1 159.5 1 436.2 1 755.7 2 123.1 2 544.5 3 026.3 3 575.9 4 201.6
754.1 934.1 1 141.8 1 380.8 1 654.9 1 968.2 2 325.7 2 732.6
607.5 742.6 898.1 1 076.3 1 280.1 1 512.6 1 777.3
483.0 584.1 700.0 832.6 983.8 1 155.9
379.9 455.3 541.5 639.8 751.8
296.1 352.2 416.1 488.9
229.0 270.6 318.0
Value < Expected PV 176.0 206.8
134.5
To calculate the value of the option in every period we use the risk neutral probability
approach, where rf is the risk free rate, in our case we use 3.53% which is an average
interest rate of Spanish Public debt that we have calculated for 2006 (Tesoro Público, 2009),
and “u” and “d” are the up and down movements presented before.
Applying these probabilities, we obtain the value of the option to abandon in a
recursive way, starting from the final period of time and moving back until the begining. Thus,
we obtain a present value for the option to abandon of 555 million €, as it is shown in Table
11. This value of the option is clearly positive and can be added to the present value of the
business without flexibility utilizing DCF at 782 million to provide a better estimation of the
investment value.
17
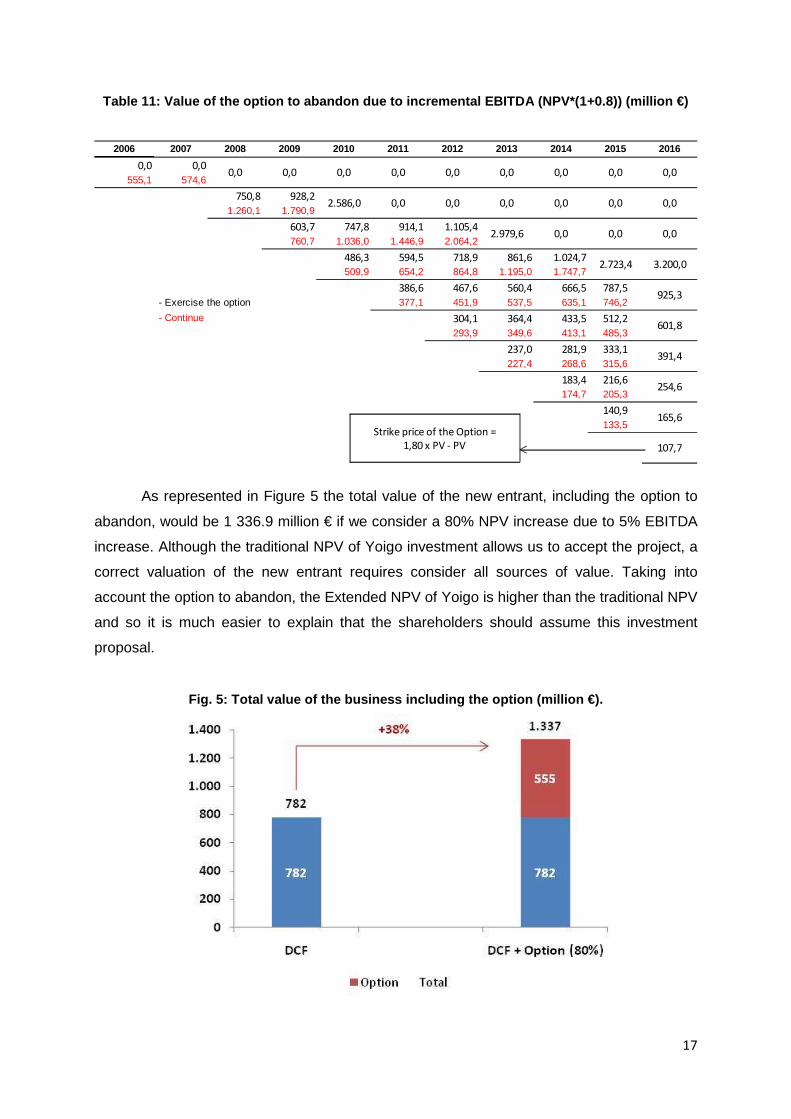
Table 11: Value of the option to abandon due to inc remental EBITDA (NPV*(1+0.8)) (million €)
2006 2007 2008 2009 2010 2011 2012 2013 2014 2015 2016
0,0 0,0
555,1 574,6
750,8 928,2
1.260,1 1.790,9
603,7 747,8 914,1 1.105,4
760,7 1.036,0 1.446,9 2.064,2
486,3 594,5 718,9 861,6 1.024,7
509,9 654,2 864,8 1.195,0 1.747,7
386,6 467,6 560,4 666,5 787,5
- Exercise the option 377,1 451,9 537,5 635,1 746,2
- Continue 304,1 364,4 433,5 512,2
293,9 349,6 413,1 485,3
237,0 281,9 333,1
227,4 268,6 315,6
183,4 216,6
174,7 205,3
140,9
133,5
0,0 0,0 0,0 0,0 0,0 0,0 0,0 0,0 0,0
2.586,0 0,0 0,0 0,0 0,0 0,0 0,0
2.979,6 0,0 0,0 0,0
2.723,4 3.200,0
925,3
601,8
391,4
254,6
165,6
107,7
Strike price of the Option =
1,80 x PV - PV
As represented in Figure 5 the total value of the new entrant, including the option to
abandon, would be 1 336.9 million € if we consider a 80% NPV increase due to 5% EBITDA
increase. Although the traditional NPV of Yoigo investment allows us to accept the project, a
correct valuation of the new entrant requires consider all sources of value. Taking into
account the option to abandon, the Extended NPV of Yoigo is higher than the traditional NPV
and so it is much easier to explain that the shareholders should assume this investment
proposal.
Fig. 5: Total value of the business including the o ption (million €).
18
4. CONCLUSIONS
This paper presents an in-depth analysis of the sources of value for the case of an
investment of a new entrant in an oligopolistic market. We approach the creation of value in
the decision of launching Yoigo, the fourth operator in the Spanish mobile
telecommunications market, through the real options method. From this perspective, the
value of the investment in launching Yoigo derives jointly from its expected cash flows
without flexibility and the option to abandon de market by selling its business or merging
with a competitor.
Each component of the value of the new entrant has to be evaluated with appropriate
techniques. Thus, for valuing the value of the investment without flexibility we use models
based on discounted cash flows and for valuing the option to abandon we employ Real Option
techniques.
Our analysis of this real investment case provides new evidence about the
relevance of sources of value which differ from direct cash flow. The economies of
scale present in the mobile telecommunicatins industry allow a new entrant in the market to
consider the option to sell its customers base to larger players if it does not reach its
business targets, because they are able to extract more value from the same customer base.
To estimate the value of the option to abandon the industry, we apply the
proposal of Copeland and Antikarov (2001), which is adapted to the nature of the
investment analysed. One of the most important parameters in the valuation of the
option is the strike price. Again, due to the economies of scale present in the
industry, the strike price of the option to abandon can be calculated using the incremental
NPV caused by higher EBITDA margins. This is a relevant point in the valuation and is a
distinguishing element vs. traditional methods were the abandonment value did not change
during the life of the project.
We have found that the value of the option to abandon to be positive and
contribute to justify the investment strategy made at the time by Yoigo. A correct
valuation of the new entrant in a oligopolistic market requires consider all sources of value.
Taking into account the option to abandon, the Extended NPV of Yoigo is higher than the
traditional NPV and so it is much easier to explain that the shareholders should assume this
investment proposal.
19
REFERENCES
BBC (2009) Press Release on “T-Mobile and Orange merger”, 2009, available at http://news.bbc.co.uk/2/hi/8243226.stm
Black, F. and Scholes, M. (1973): “The Pricing of Options and Corporate Liabilities”. Journal of Political Economy, nº 81, pág.: 637-659.
CMT Informe anual 2009.
CMT Quarterly Report, Q3, 2009.
Copeland, T. E. and Antikarov, V. (2001): Real Options. A practitioner’s guide. Ed.: Texere New York.
Cox, J.; Ross, S. and Rubinstein, M. (1979): “Option Pricing: A Simplified Approach”. Journal of Financial Economics, nº 7, pág.: 229-64.
Damodaran, A. (2002): Investment Valuation (Second Edition, chapter 29). Ed.: Wiley Finance, New York.
Katz, M. L. and Shapiro, C. (1985): “Network externalities, competition and compatibility”. American Economics Review, nº 75, pág.: 425–440.
Katz, M. L. and Shapiro, C. (1986): “Technology adoption in the presence of network externalities”. Journal of Political Economy, nº 94, pág.: 822–841.
Kotler, P. and Keller, K. L. (2009): Dirección de Marketing (12th Edition, chapter 11). Ed.: Pearson Educación S.A., Madrid.
Merton, R. C. (1973): “Theory of Rational Option Pricing”. Bell Journal of Economics and Management Science, nº 4, pág.: 141-183.
Riihimäki, V. (2006): Real Option Valuation of Broadband Access Networks – Statistical Analysis of WiMAX and ADSL Investments. Licentiate Thesis, Department of Electrical and Communications Engineering, Helsinki University of Technology, Espoo.
Samuelson, P. A. (1965): “Rational Theory of Warrant Price”. Industrial Management Review, pp. 13-39.
Samuelson, P. A. and Nordhaus, W. D. (1986): Economía (12th Edition, chapter 23). Ed.: MacGraw Hill, Mexico.
Tesoro Público (2009): “Tipos de interés medios de la deuda del Estado en moneda Nacional”, available http://www.tesoro.es/doc/SP/home/estadistica/03.pdf
Related Documents