Valmet’s Interim Review January 1 – June 30, 2015 | 1

Welcome message from author
This document is posted to help you gain knowledge. Please leave a comment to let me know what you think about it! Share it to your friends and learn new things together.
Transcript

Valmet’s Interim Review January 1 – June 30, 2015 | 1

Valmet’s Interim Review January 1 – June 30, 2015 | 2
Valmet’s Interim Review January 1 – June 30, 2015
Strong start for Automation as part of Valmet – profitability
reached the targeted range in Q2/2015 Figures in brackets, unless otherwise stated, refer to the comparison period, i.e. the same period of the
previous year. Automation has been consolidated into Valmet’s financials since April 1, 2015, when the
acquisition of Automation was completed.
April–June 2015: Strong start for Automation – Valmet’s EBITA more than
doubled Orders received decreased to EUR 781 million (EUR 1,023 million).
- Orders received increased in the Services business line and decreased in the Pulp and Energy, and Paper business lines.
Net sales increased to EUR 779 million (EUR 588 million). - Net sales increased in the Paper, and Services business lines and remained at the previous
year’s level in the Pulp and Energy business line. - Automation contributed to net sales by EUR 68 million.
Earnings before interest, taxes and amortization (EBITA) and non-recurring items were EUR 54 million (EUR 22 million), and the corresponding EBITA margin was 6.9 percent (3.7%).
- Profitability improved due to the higher level of net sales, improved gross profit, and the acquisition of Automation.
Earnings per share were EUR 0.14 (EUR 0.07).
Non-recurring items amounted to EUR -12 million (EUR 0 million), of which costs related to acquisition of Automation amounted to approximately EUR 10 million.
Cash flow provided by operating activities was EUR 17 million (EUR 46 million).
January–June 2015: EBITA more than doubled – continued good development in
Services Orders received decreased to EUR 1,360 million (EUR 2,124 million).
- Orders received increased in the Services business line and declined from the high levels in H1/2014 in the Pulp and Energy, and Paper business lines.
Net sales increased to EUR 1,340 million (EUR 1,107 million). - Net sales increased in Services, Pulp and Energy, and Paper business lines. - Automation contributed to net sales by EUR 68 million.
Earnings before interest, taxes and amortization (EBITA) and non-recurring items were EUR 73 million (EUR 26 million), and the corresponding EBITA margin was 5.5 percent (2.3%).
- Profitability improved due to the higher level of net sales, improved gross profit, and the acquisition of Automation.
Earnings per share were EUR 0.19 (EUR 0.03).
Non-recurring items amounted to EUR -12 million (EUR -6 million), of which costs related to acquisition of Automation amounted to approximately EUR 10 million.
Cash flow provided by operating activities was EUR -3 million (EUR 89 million).

Valmet’s Interim Review January 1 – June 30, 2015 | 3
Valmet reiterates its guidance for 2015 Valmet is reiterating its guidance presented on February 6, 2015 in which Valmet estimates that, including
the acquisition of Process Automation Systems, net sales in 2015 will increase in comparison with 2014
(EUR 2,473 million) and EBITA before non-recurring items in 2015 will increase in comparison with 2014
(EUR 106 million).
Short-term outlook
General economic outlook
Global growth is projected at 3.3 percent in 2015, marginally lower than in 2014, with a gradual pickup in
advanced economies and a slowdown in emerging market and developing economies. In 2016, growth is
expected to strengthen to 3.8 percent. The distribution of risks to global economic activity is still tilted to
the downside. Near-term risks include increased financial market volatility and disruptive asset price shifts,
while lower potential output. (International Monetary Fund, July 9, 2015)
Short-term market outlook
Valmet is reiterating its short-term market outlook presented on April 29, 2015. Valmet estimates that
activity in pulp, and board and paper markets will remain on a good level. The activity in the services,
tissue, and automation markets is estimated to remain satisfactory. The activity in the energy markets is
expected to remain weak.
President and CEO Pasi Laine: Together with Automation, Valmet becomes a
stronger company When the acquisition of Process Automation Systems was completed on April 1, 2015, Valmet got its fourth
business line, called Automation. Our customers appreciate that we have reunited the automation
expertise with paper, pulp, and power plant technology and process know-how, within the same company.
This change has energized and motivated our employees too.
Automation had a strong start as a part of Valmet, and over time I believe that we can achieve even greater
benefits through good internal cooperation. With an integrated sales process, harmonized project
execution, wider offering and enhanced product development, we will be able to serve our customers even
better than before. All in all, Valmet will become a stronger company.
Valmet’s performance in the second quarter of 2015 was solid: net sales increased, profitability improved
and the EBITA margin reached our targeted range. Good development continued in the Services business
line. Additionally we are continuing our focus on cost control and successful project execution.
In addition to expanding Valmet’s offering, the automation business somewhat decreases cyclicality of
Valmet’s businesses. On annual level the automation business is typically fairly stable, thus increasing the
stability and visibility of Valmet’s business.

Valmet’s Interim Review January 1 – June 30, 2015 | 4
Key figures1
EUR million Q2/2015 Q2/2014 Change Q1–Q2/
2015 Q1–Q2/
2014 Change
Orders received 781 1,023 -24% 1,360 2,124 -36%
Order backlog2 2,208 2,406 -8% 2,208 2,406 -8%
Net sales 779 588 33% 1,340 1,107 21%
Earnings before interest, taxes and amortization (EBITA) and non-recurring items
54 22 >100% 73 26 >100%
% of net sales 6.9% 3.7% 5.5% 2.3%
Earnings before interest, taxes and amortization (EBITA)
42 22 91% 61 20 >100%
% of net sales 5.4% 3.7% 4.6% 1.8%
Operating profit (EBIT) 32 16 96% 46 9 >100%
% of net sales 4.1% 2.8% 3.4% 0.8%
Profit before taxes 31 16 90% 42 7 >100%
Profit / loss 21 11 97% 29 5 >100%
Earnings per share, EUR 0.14 0.07 97% 0.19 0.03 >100%
Earnings per share, diluted, EUR 0.14 0.07 97% 0.19 0.03 >100%
Equity per share, EUR 5.38 5.19 4% 5.38 5.19 4%
Cash flow provided by operating activities 17 46 -63% -3 89
Cash flow after investments -321 36 -351 71
Return on equity (ROE) (annualized) 7% 1%
Return on capital employed (ROCE) before taxes (annualized)
9% 3%
1 The calculation of key figures is presented in the Tables section of the January–June 2015 Interim Review. 2 At the end of period.
Equity to assets ratio and gearing As at June
30, 2015 As at June
30, 2014 As at March
31, 2015
Equity to assets ratio at end of period 35% 40% 34%
Gearing at end of period 29% -7% -17%
Orders received, EUR million Q2/2015 Q2/2014 Change Q1–Q2/
2015 Q1–Q2/
2014 Change
Services 307 273 13% 600 540 11%
Automation 85 - - 85 - -
Pulp and Energy 259 560 -54% 397 1,182 -66%
Paper 129 190 -32% 278 402 -31%
Total 781 1,023 -24% 1,360 2,124 -36%
Order backlog, EUR million As at June
30, 2015 As at June
30, 2014 Change As at March
31, 2015
Total 2,208 2,406 -8% 2,064

Valmet’s Interim Review January 1 – June 30, 2015 | 5
Net sales, EUR million Q2/2015 Q2/2014 Change Q1–Q2/
2015 Q1–Q2/
2014 Change
Services 304 251 21% 546 475 15%
Automation 68 - - 68 - -
Pulp and Energy 231 229 1% 453 410 11%
Paper 177 108 63% 273 222 23%
Total 779 588 33% 1,340 1,107 21%
Audiocast for analysts, investors and media Valmet will arrange a conference call and an audiocast in English for analysts, investors, and media on
Thursday, July 30, 2015 at 4:00 p.m. Finnish time (EET).
Conference call participants are requested to dial in at least five minutes prior to the start of the
conference, at 3:55 p.m. (EET), at +44 1452 553430. The participants will be asked to provide the following
event passcode: 1719244.
The audiocast can be followed live at www.valmet.com/webcasts. The live audiocast starts at 4:00 p.m.
(EET) and a recording of the audiocast will be available shortly after the event at the same address.
It is possible to ask questions at the conference call after the presentation.

Valmet’s Interim Review January 1 – June 30, 2015 | 6
Valmet’s Interim Review January 1 – June 30, 2015 Automation has been consolidated into Valmet’s financials since April 1, 2015, when the acquisition of
Automation was completed.
Customer activity has been on an improving trend In the first half of 2015, customer activity decreased compared with the high level of the first half of 2014.
Customer activity, however, increased somewhat in the second quarter of 2015 compared with the
previous quarter. Overall the customer activity has been on an improving trend for a few quarters. In the
energy business, customers’ decision making is in many cases postponed due to uncertainty in the energy
market. In the automation market, customer activity has improved somewhat during the second quarter of
2015.
In the first half of the year, orders received decreased compared with the high levels of the first half of
2014. Orders received increased in North America, and decreased in other areas.
Orders received increased in Services and more than doubled in North America
Orders received, EUR million Q2/2015 Q2/2014 Change Q1–Q2/
2015 Q1–Q2/
2014 Change
Services 307 273 13% 600 540 11%
Automation 85 - - 85 - -
Pulp and Energy 259 560 -54% 397 1,182 -66%
Paper 129 190 -32% 278 402 -31%
Total 781 1,023 -24% 1,360 2,124 -36%
Orders received, comparable foreign exchange rates, EUR million1
Q2/2015 Q2/2014 Change Q1–Q2/ 2015
Q1–Q2/ 2014
Change
Services 291 273 6% 568 540 5%
Automation 82 - - 82 - -
Pulp and Energy 249 560 -56% 378 1,182 -68%
Paper 122 190 -36% 263 402 -35%
Total 744 1,023 -27% 1,291 2,124 -39%
1 Indicative only. January to June 2015 orders received in the functional currency of the contracting entity converted to euro with
January–June 2014 average monthly exchange rates.
Orders received, EUR million Q2/2015 Q2/2014 Change Q1–Q2/
2015 Q1–Q2/
2014 Change
North America 196 82 >100% 385 268 44%
South America 38 194 -80% 88 217 -60%
EMEA 443 567 -22% 645 1,004 -36%
China 45 121 -62% 99 156 -36%
Asia-Pacific 58 59 -3% 143 480 -70%
Total 781 1,023 -24% 1,360 2,124 -36%
Orders received in April–June amounted to EUR 781 million, i.e. 24 percent less than in the comparison
period (EUR 1,023 million). The emerging markets accounted for 21 percent (41%) of orders received.
Orders received increased in the Services business line and decreased in the Pulp and Energy, and Paper

Valmet’s Interim Review January 1 – June 30, 2015 | 7
business lines. Orders received increased in North America, remained stable in Asia-Pacific, and decreased
in other areas.
In April–June, changes in foreign exchange rates increased orders received by approximately EUR 36 million
compared with the exchange rates for April–June, 2014.
During April–June, the letter of intent for the supply of key technology to a bioproduct mill in Finland
signed during the first quarter of 2015, was finalized into a delivery agreement. The estimated value of
Valmet's delivery, which includes only the core equipment supplied by Valmet, is about EUR 125–150
million. During April–June Valmet also received orders to upgrade an evaporation plant in Sweden, to
supply key technologies and automation technology for an extensive paper machine grade conversion in
Finland and a repeat order for two energy recovery systems in Italy and Poland. In addition, Valmet also
agreed on modernization of automation and remote control of district heating plants in Finland, and supply
of automation to a new waste-to-energy plant in the United Kingdom.
Orders received in the first half of the year amounted to EUR 1,360 million, i.e. 36 percent less than in the
comparison period (EUR 2,124 million). The emerging markets accounted for 28 percent (51%) of orders
received. Orders received increased in the Services business line and declined from the high levels in the
comparison period in the Pulp and Energy, and Paper business lines. Orders received increased in North
America and decreased in other areas.
In the first half of the year, changes in foreign exchange rates increased orders received by approximately
EUR 69 million compared with the exchange rates for January–June, 2014.
During January–March, Valmet received an OptiConcept M containerboard line order from Taiwan. Orders
received in the first quarter also included equipment for a fluff conversion project in the USA, a softwood
line rebuild in Sweden and a biomass based boiler plant in Finland.
Order backlog EUR 144 million higher than at the end of March 2015
Order backlog, EUR million As at June
30, 2015 As at June
30, 2014 Change As at March
31, 2015
Total 2,208 2,406 -8% 2,064
At the end of June, the order backlog was EUR 2,208 million, which was 7 percent higher than at the end of
March 2015 (EUR 2,064 million at the end of March, 2015) and 8 percent lower than at the end of the
comparison period (EUR 2,406 million). Approximately 60 percent of the order backlog, i.e. EUR 1.3 billion,
is expected to be recognized as net sales in 2015. Approximately 30 percent of the order backlog relates to
stable business (Services and Automation business lines). At the end of June 2014, approximately 20
percent of the order backlog related to the Services business line.

Valmet’s Interim Review January 1 – June 30, 2015 | 8
Net sales increased
Net sales, EUR million Q2/2015 Q2/2014 Change Q1–Q2/
2015 Q1–Q2/
2014 Change
Services 304 251 21% 546 475 15%
Automation 68 - - 68 - -
Pulp and Energy 231 229 1% 453 410 11%
Paper 177 108 63% 273 222 23%
Total 779 588 33% 1,340 1,107 21%
Net sales, comparable foreign exchange rates, EUR million1
Q2/2015 Q2/2014 Change Q1–Q2/ 2015
Q1–Q2/ 2014
Change
Services 283 251 13% 511 475 8%
Automation 65 - - 65 - -
Pulp and Energy 233 229 2% 455 410 11%
Paper 168 108 55% 257 222 16%
Total 748 588 27% 1,288 1,107 16%
1 Indicative only. January to June 2015 net sales in the functional currency of the contracting entity converted to euro with January–
June 2014 average monthly exchange rates.
Net sales, EUR million Q2/2015 Q2/2014 Change Q1–Q2/
2015 Q1–Q2/
2014 Change
North America 166 113 46% 290 209 39%
South America 69 89 -22% 172 167 3%
EMEA 334 243 37% 550 438 25%
China 79 66 19% 120 143 -16%
Asia-Pacific 131 76 72% 208 149 40%
Total 779 588 33% 1,340 1,107 21%
Net sales in April–June increased 33 percent to EUR 779 million (EUR 588 million). Net sales increased in the
Paper, and Services business lines and remained at the previous year’s level in the Pulp and Energy business
line. The stable business (Services and Automation business lines together) accounted for 48 percent of
Valmet’s net sales (Services business line accounted for 43% in the second quarter of 2014). Net sales
decreased in South America and increased in other areas. Measured by net sales, the top three countries
were the USA, Finland and Sweden, which together accounted for 42 percent of total net sales (the USA,
Brazil and China, which together accounted for 40%). Emerging markets accounted for 43 percent (48%) of
net sales.
In April–June, changes in foreign exchange rates increased net sales by approximately EUR 31 million
compared with the exchange rates for April–June, 2014.
Net sales in the first half of the year increased 21 percent to EUR 1,340 million (EUR 1,107 million). Net
sales increased in Services, Pulp and Energy, and Paper business lines. The stable business (Services and
Automation business lines together) accounted for 46 percent of Valmet’s net sales (Services business line
accounted for 43% in the first half of 2014). Net sales increased in North America, EMEA, and Asia-Pacific,
remained stable compared with the first half of 2014 in South America, and decreased in China.
Valmet’s Interim Review January 1 – June 30, 2015 | 9
In the first half of the year, changes in foreign exchange rates increased net sales by approximately EUR 52
million compared with the exchange rates for January–June, 2014.
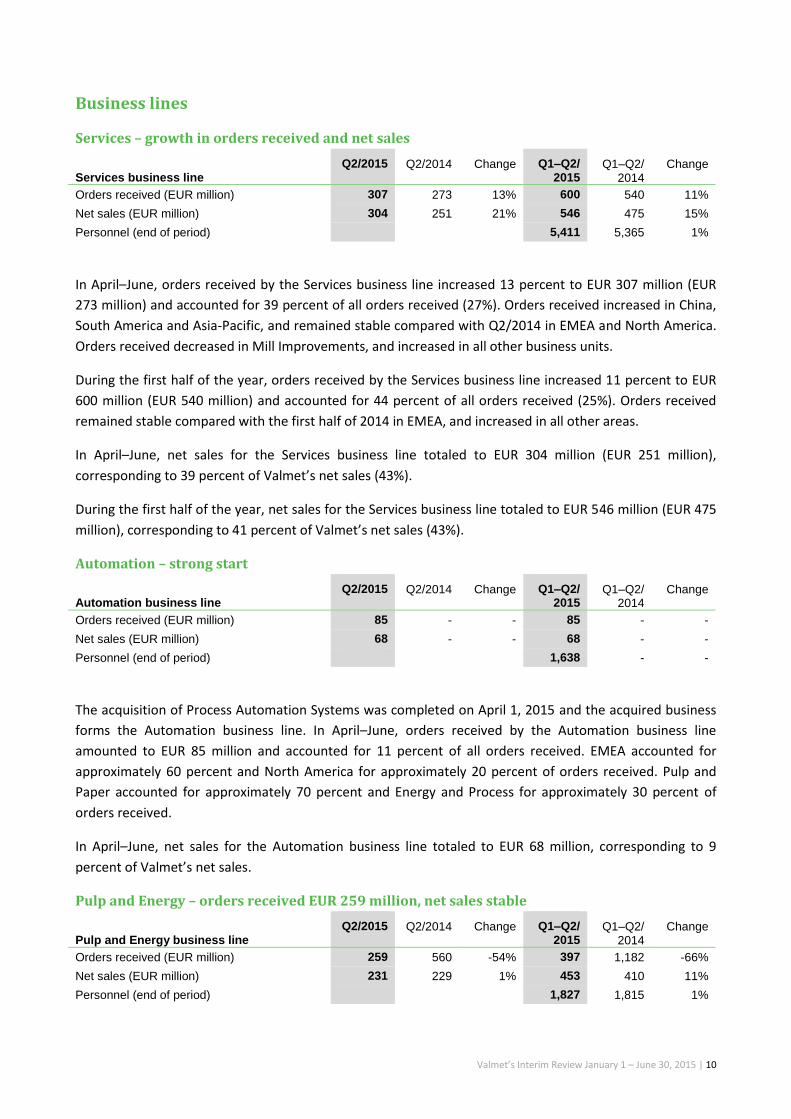
Profitability improved – EBITA margin in the targeted range In April–June, earnings before interest, taxes and amortization and non-recurring items (EBITA before non-
recurring items) were EUR 54 million, i.e. 6.9 percent of net sales (EUR 22 million and 3.7%). Profitability
improved due to the higher level of net sales, improved gross profit, and the acquisition of Automation.
In the first half of the year, earnings before interest, taxes and amortization and non-recurring items (EBITA
before non-recurring items) were EUR 73 million, i.e. 5.5 percent of net sales (EUR 26 million and 2.3%).
Profitability improved due to the higher level of net sales, improved gross profit, and the acquisition of
Automation.
Operating profit (EBIT) in April–June was EUR 32 million, i.e. 4.1 percent of net sales (EUR 16 million and
2.8%). Non-recurring items amounted to EUR -12 million (EUR 0 million), of which costs related to
acquisition of Automation amounted to approximately EUR 10 million.
Operating profit (EBIT) in the first half of the year was EUR 46 million, i.e. 3.4 percent of net sales (EUR 9
million and 0.8%). Non-recurring items amounted to EUR -12 million (EUR -6 million), of which costs related
to acquisition of Automation amounted to approximately EUR 10 million.
Net financial income and expenses Net financial income and expenses in April–June were EUR -2 million (EUR 0 million), of which interest
expenses amounted to EUR 3 million (EUR 3 million), interest income to EUR 1 million (EUR 1 million), other
financial income and expenses to EUR -1 million (EUR 0 million), dividends received to EUR 0 million (EUR 1
million) and net foreign exchange gains to EUR 1 million (EUR 1 million).
Net financial income and expenses in the first half of the year were EUR -4 million (EUR -2 million), of which
interest expenses amounted to EUR 6 million (EUR 5 million), interest income to EUR 2 million (EUR 2
million), other financial income and expenses to EUR -1 million (EUR -1 million), dividends received to EUR 0
million (EUR 1 million) and net foreign exchange gains to EUR 1 million (EUR 1 million).
Profit before taxes and earnings per share Profit before taxes for April–June was EUR 31 million (EUR 16 million). The profit attributable to owners of
the parent in April–June was EUR 21 million (EUR 11 million), corresponding to earnings per share (EPS) of
EUR 0.14 (EUR 0.07).
Profit before taxes for the first half of the year was EUR 42 million (EUR 7 million). The profit attributable to
owners of the parent in the first half of the year was EUR 29 million (EUR 5 million), corresponding to
earnings per share (EPS) of EUR 0.19 (EUR 0.03).
Return on capital employed (ROCE) increased In the first half of the year, the annualized return on capital employed (ROCE) before taxes was 9 percent
(3%) and annualized return on equity (ROE) 7 percent (1%).
Valmet’s Interim Review January 1 – June 30, 2015 | 10
Business lines
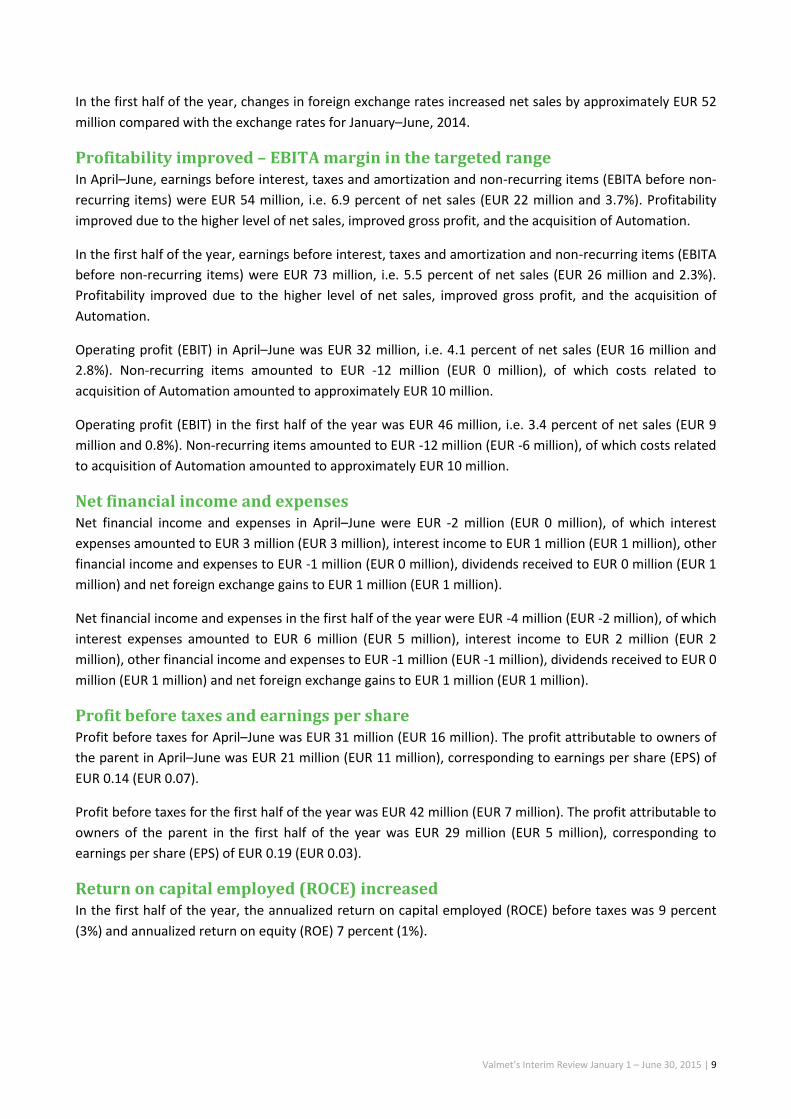
Services – growth in orders received and net sales
Services business line Q2/2015 Q2/2014 Change Q1–Q2/
2015 Q1–Q2/
2014 Change
Orders received (EUR million) 307 273 13% 600 540 11%
Net sales (EUR million) 304 251 21% 546 475 15%
Personnel (end of period) 5,411 5,365 1%
In April–June, orders received by the Services business line increased 13 percent to EUR 307 million (EUR
273 million) and accounted for 39 percent of all orders received (27%). Orders received increased in China,
South America and Asia-Pacific, and remained stable compared with Q2/2014 in EMEA and North America.
Orders received decreased in Mill Improvements, and increased in all other business units.
During the first half of the year, orders received by the Services business line increased 11 percent to EUR
600 million (EUR 540 million) and accounted for 44 percent of all orders received (25%). Orders received
remained stable compared with the first half of 2014 in EMEA, and increased in all other areas.
In April–June, net sales for the Services business line totaled to EUR 304 million (EUR 251 million),
corresponding to 39 percent of Valmet’s net sales (43%).
During the first half of the year, net sales for the Services business line totaled to EUR 546 million (EUR 475
million), corresponding to 41 percent of Valmet’s net sales (43%).
Automation – strong start
Automation business line Q2/2015 Q2/2014 Change Q1–Q2/
2015 Q1–Q2/
2014 Change
Orders received (EUR million) 85 - - 85 - -
Net sales (EUR million) 68 - - 68 - -
Personnel (end of period) 1,638 - -
The acquisition of Process Automation Systems was completed on April 1, 2015 and the acquired business
forms the Automation business line. In April–June, orders received by the Automation business line
amounted to EUR 85 million and accounted for 11 percent of all orders received. EMEA accounted for
approximately 60 percent and North America for approximately 20 percent of orders received. Pulp and
Paper accounted for approximately 70 percent and Energy and Process for approximately 30 percent of
orders received.
In April–June, net sales for the Automation business line totaled to EUR 68 million, corresponding to 9
percent of Valmet’s net sales.
Pulp and Energy – orders received EUR 259 million, net sales stable
Pulp and Energy business line Q2/2015 Q2/2014 Change Q1–Q2/
2015 Q1–Q2/
2014 Change
Orders received (EUR million) 259 560 -54% 397 1,182 -66%
Net sales (EUR million) 231 229 1% 453 410 11%
Personnel (end of period) 1,827 1,815 1%

Valmet’s Interim Review January 1 – June 30, 2015 | 11
In April–June, orders received by the Pulp and Energy business line decreased 54 percent to EUR 259
million (EUR 560 million) and accounted for 33 percent of all orders received (55%). Orders received
increased in North America, and decreased in other areas. Orders received decreased in both Pulp and
Energy.
During the first half of the year, orders received by the Pulp and Energy business line decreased 66 percent
to EUR 397 million (EUR 1,182 million) and accounted for 29 percent of all orders received (56%). Orders
received increased in North America and decreased in other areas. Orders received decreased in both Pulp
and Energy.
In April–June, net sales for the Pulp and Energy business line totaled to EUR 231 million (EUR 229 million),
corresponding to 30 percent of Valmet’s net sales (39%).
During the first half of the year, net sales for the Pulp and Energy business line totaled to EUR 453 million
(EUR 410 million), corresponding to 34 percent of Valmet’s net sales (37%).
Paper – orders received EUR 129 million, net sales increased
Paper business line Q2/2015 Q2/2014 Change Q1–Q2/
2015 Q1–Q2/
2014 Change
Orders received (EUR million) 129 190 -32% 278 402 -31%
Net sales (EUR million) 177 108 63% 273 222 23%
Personnel (end of period) 3,119 3,220 -3%
In April–June, orders received by the Paper business line decreased to EUR 129 million (EUR 190 million)
and accounted for 16 percent of all orders received (19%). Orders received increased in North America,
remained stable compared with the comparison period in EMEA, South America and Asia-Pacific, and
decreased in China. Orders received increased in Tissue, and decreased in Board and Paper.
During the first half of the year, orders received by the Paper business line decreased 31 percent to EUR
278 million (EUR 402 million) and accounted for 20 percent of all orders received (19%). Orders received
increased in South America, and decreased in other areas. Orders received decreased in both Board and
Paper, and Tissue.
In April–June, net sales for the Paper business line totaled to EUR 177 million (EUR 108 million),
corresponding to 23 percent of Valmet’s net sales (18%).
During the first half of the year, net sales for the Paper business line totaled to EUR 273 million (EUR 222
million), corresponding to 20 percent of Valmet’s net sales (20%).
Continued focus on improving profitability Valmet aims to improve product margin by focusing on improving sales and project management. By
harmonizing processes and tools, localization of competencies, better selection of sales cases and
developing our project management, Valmet targets to improve product margin.
In order to reduce quality costs and lead times, Valmet is implementing Lean method. Implementing Lean is
expected to reduce waste and thus improve efficiency. A common quality development approach, together
with different quality tools and processes help reduce quality costs and lead times. In order to reduce
quality costs and lead times, it is also important to highlight the importance of quality initiatives and
Valmet’s Interim Review January 1 – June 30, 2015 | 12
accountability. Training programs have been developed specifically for learning and utilizing Lean tools
within every part of our business.
To improve profitability, Valmet also focuses on procurement savings. These can be achieved by increased
sourcing from cost-competitive countries, with an increased use of sub-contracting and by consolidating
the shipment and warehouse network.
Valmet is constantly focusing on improving product competitiveness in order to increase gross profit.
Valmet focuses on cost efficient design, modularity and standardization, and product-based improvement
programs.
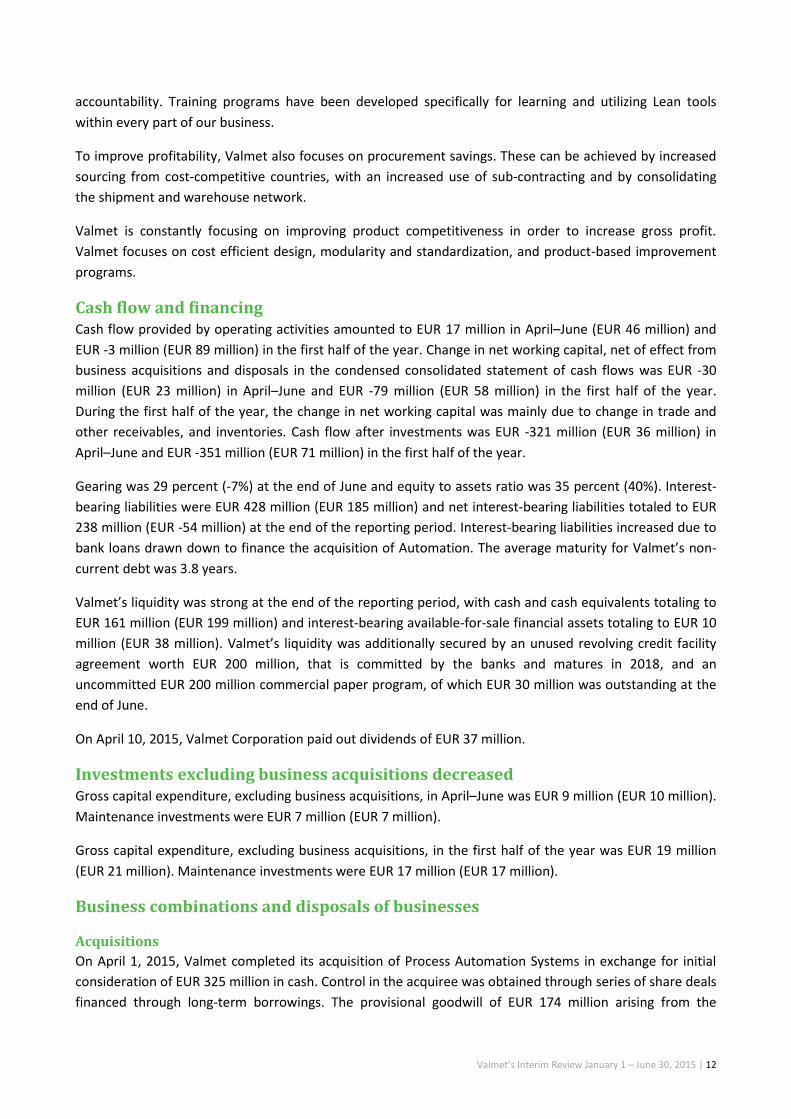
Cash flow and financing Cash flow provided by operating activities amounted to EUR 17 million in April–June (EUR 46 million) and
EUR -3 million (EUR 89 million) in the first half of the year. Change in net working capital, net of effect from
business acquisitions and disposals in the condensed consolidated statement of cash flows was EUR -30
million (EUR 23 million) in April–June and EUR -79 million (EUR 58 million) in the first half of the year.
During the first half of the year, the change in net working capital was mainly due to change in trade and
other receivables, and inventories. Cash flow after investments was EUR -321 million (EUR 36 million) in
April–June and EUR -351 million (EUR 71 million) in the first half of the year.
Gearing was 29 percent (-7%) at the end of June and equity to assets ratio was 35 percent (40%). Interest-
bearing liabilities were EUR 428 million (EUR 185 million) and net interest-bearing liabilities totaled to EUR
238 million (EUR -54 million) at the end of the reporting period. Interest-bearing liabilities increased due to
bank loans drawn down to finance the acquisition of Automation. The average maturity for Valmet’s non-
current debt was 3.8 years.
Valmet’s liquidity was strong at the end of the reporting period, with cash and cash equivalents totaling to
EUR 161 million (EUR 199 million) and interest-bearing available-for-sale financial assets totaling to EUR 10
million (EUR 38 million). Valmet’s liquidity was additionally secured by an unused revolving credit facility
agreement worth EUR 200 million, that is committed by the banks and matures in 2018, and an
uncommitted EUR 200 million commercial paper program, of which EUR 30 million was outstanding at the
end of June.
On April 10, 2015, Valmet Corporation paid out dividends of EUR 37 million.
Investments excluding business acquisitions decreased Gross capital expenditure, excluding business acquisitions, in April–June was EUR 9 million (EUR 10 million).
Maintenance investments were EUR 7 million (EUR 7 million).
Gross capital expenditure, excluding business acquisitions, in the first half of the year was EUR 19 million
(EUR 21 million). Maintenance investments were EUR 17 million (EUR 17 million).
Business combinations and disposals of businesses
Acquisitions
On April 1, 2015, Valmet completed its acquisition of Process Automation Systems in exchange for initial
consideration of EUR 325 million in cash. Control in the acquiree was obtained through series of share deals
financed through long-term borrowings. The provisional goodwill of EUR 174 million arising from the

Valmet’s Interim Review January 1 – June 30, 2015 | 13
acquisition is attributable to the assembled workforce and synergies expected to arise subsequent to the
acquisition. The consideration paid on the deal is subject to post closing adjustment.
Disposals
Valmet made no disposals during the six months ended June 30, 2015.
Number of personnel increased mainly due to the acquisition
Personnel by business line As at June 30,
2015 As at June
30, 2014 Change As at March 31,
2015
Services 5,411 5,365 1% 5,212
Automation 1,638 - - -
Pulp and Energy 1,827 1,815 1% 1,792
Paper 3,119 3,220 -3% 3,065
Other 529 401 32% 502
Total (end of period) 12,524 10,801 16% 10,571
Personnel by area As at June 30,
2015 As at June
30, 2014 Change As at March 31,
2015
North America 1,348 1,133 19% 1,135
South America 526 427 23% 441
EMEA 7,897 6,670 18% 6,460
China 2,043 1,974 3% 1,942
Asia-Pacific 710 597 19% 593
Total (end of period) 12,524 10,801 16% 10,571
In the first half of the year, Valmet employed an average of 11,299 people (11,279). The number of
personnel at the end of June was 12,524 (10,801). The number of personnel increased mainly due to the
acquisition. In the first half of the year, personnel expenses totaled to EUR 366 million (EUR 307 million) of
which wages, salaries and remuneration equaled to EUR 285 million (EUR 238 million).
Strategic goals and their implementation Valmet is a leading global developer and supplier of services, technologies and automation for the pulp,
paper and energy industries. Valmet's mission is to convert renewable resources into sustainable results.
The company continues to focus on developing and supplying competitive technology and services to the
pulp, paper and energy industries. Valmet is committed to moving its customers' performance forward.
Valmet seeks to achieve its strategic targets by pursuing the following Must-Win initiatives: customer
excellence, leader in technology and innovation, excellence in processes, and winning team. Valmet's vision
is to become the global champion in serving its customers.
Valmet’s product and service portfolio consists of productivity-enhancing services, automation solutions,
plant upgrades and rebuilds, new cost-efficient equipment and solutions for optimizing energy and raw
material usage, and technologies increasing the value of its customers’ end-products.
Valmet’s strategy and financial targets were reconfirmed by the Board of Directors in June 2015 (Stock
exchange release on June 24, 2015). Valmet has the following financial targets:
Valmet’s Interim Review January 1 – June 30, 2015 | 14
Financial targets
Net sales growth to exceed market growth
EBITA margin before non-recurring items: 6 to 9 percent
Return on capital employed (pre-tax), ROCE: minimum of 15 percent
Dividend payout at least 40 percent of net profit
Activities and achievement in sustainability Valmet’s sustainability agenda focuses on five core areas with specific roadmaps for 2014–2016. The focus
areas are Sustainable supply chain; Responsible operations (health, safety and environment, HSE); People
and performance; Cost-effective sustainable solutions and Corporate Citizenship.
In the first half of 2015, Valmet continued with the implementation of the four global supply chain
initiatives to integrate sustainability stronger into the procurement processes. Until the end of June 2015,
altogether 280 procurement professionals had received relevant training and over 5,000 suppliers globally
had been informed about Valmet’s Sustainable Supply Chain policy with the target to cover all active
suppliers by the end of the year.
Valmet’s systematic safety work has brought positive results. The lost time incident frequency rate (LTIF) at
the end of June 2015 was at the level of 4.0 (12 months rolling; 5.5 at the end of December 2014). In 2015,
the focus has been on improving preventative safety measures and harmonizing HSE practices in customer
project deliveries globally. The company’s professional safety management played an important role in the
construction of the Valmet-delivered pulp line at the CMPC Guaíba mill in Brazil, which was successfully
started up in May 2015.
In the first half of 2015, Valmet launched the first programs of its renewed global training portfolio. The
trainings are designed to help achieve the strategic targets and utilize company values to drive desired
behavior.
In May 2015, Valmet was included in the United Nations’ climate treaty (UNFCCC) as one of the companies
with significant climate goals. The company was selected for its CO2 and energy emission reduction targets
for 2020.
Lawsuits and claims Several lawsuits, claims and disputes based on various grounds are pending against Valmet in various
countries, including product liability lawsuits and claims as well as legal disputes related to Valmet’s
deliveries.
On February 20, Valmet issued a stock exchange release about Andritz Oy having filed a summons
application with the Stockholm District Court against Valmet AB, a subsidiary of Valmet Corporation,
regarding patent infringement. In the claim Andritz is asking that Valmet under a penalty ceases to utilize
the patent allegedly infringing Andritz's patent and the Court to impose royalty and damages on Valmet AB.
Valmet has denied the claims in its writ of response submitted to the Stockholm District Court. In June
Andritz revised its claim, which subsequently changed their overall claim from EUR 52 million to EUR 54
million and interest for the alleged infringement.
Valmet’s management does not expect to the best of its present understanding that the outcome of these
lawsuits, claims and disputes will have a material adverse effect on Valmet in view of the grounds

Valmet’s Interim Review January 1 – June 30, 2015 | 15
presented for them, provisions made, insurance coverage in force and the extent of Valmet’s total business
activities. Valmet is also a plaintiff in several lawsuits.
Corporate Governance Statement Valmet has prepared a separate Corporate Governance Statement for 2014 which complies with the
recommendations of the Finnish Corporate Governance Code for listed companies. It also covers other
central areas of corporate governance. The statement has been published on Valmet’s website, separately
from the Board of Directors’ Report, at www.valmet.com/governance.
Shares and shareholders
Share capital and number of shares
At the end of June 2015, Valmet Corporation’s share capital totaled to EUR 100,000,000 and the number of
shares was 149,864,619. At the end of June, Valmet held 399 treasury shares and the number of
outstanding shares was 149,864,220.
Treasury shares and Board authorizations
Valmet Corporation’s Annual General Meeting on March 27, 2015 authorized Valmet’s Board of Directors
to resolve on repurchasing Company shares in one or more tranches. The maximum number of shares to be
repurchased shall be 10,000,000 shares, which corresponds to approximately 6.7 percent of all the shares
in the Company.
Company shares may be repurchased otherwise than in proportion to the shareholdings of the
shareholders (directed repurchase). Company shares may be repurchased using the unrestricted equity of
the Company at a price formed on a regulated market on the main list of the Helsinki Stock Exchange on
the date of the repurchase.
Company shares may be repurchased for reasons of developing the Company's capital structure, financing
or carrying out acquisitions, investments or other business transactions, or for the shares to be used in an
incentive scheme. The Board of Directors resolves on all other terms related to the repurchasing of own
shares.
Valmet Corporation’s Annual General Meeting authorized Valmet’s Board of Directors to resolve on the
issuance of shares as well as the issuance of special rights entitling to shares, pursuant to Chapter 10(1) of
the Finnish Limited Liability Companies Act, in one or more tranches. The issuance of shares may be carried
out by issuing new shares as well as transferring treasury shares of Valmet Corporation. Based on the
authorisation, the Board of Directors may resolve to issue shares in derogation from the shareholder’s pre-
emptive right and to issue special rights within the conditions by Finnish laws.
The maximum number of new shares which may be issued shall be 15,000,000 shares, which corresponds
to approximately 10 percent of all the shares in Valmet Corporation. The maximum number of treasury
shares which may be issued shall be 10,000,000 shares, which corresponds to approximately 6.7 percent of
all the shares in the Company.
The Board of Directors is furthermore authorised to issue special rights pursuant to Chapter 10(1) of the
Finnish Limited Liability Companies Act entitling their holder to receive new shares or treasury shares for
consideration. The maximum number of shares which may be issued based on the special rights shall be
15,000,000 shares, which corresponds to approximately 10 percent of all the shares in Company. This

Valmet’s Interim Review January 1 – June 30, 2015 | 16
number of shares shall be included in the aggregate numbers of shares mentioned in the previous
paragraph.
The new shares and treasury shares may be issued for consideration or without consideration.
The Board of Directors of Valmet Corporation shall also be authorised to resolve on issuing treasury shares
to the Company without consideration. The maximum number of shares which may be issued to Valmet
Corporation shall be 10,000,000 shares when combined with the number of shares repurchased based on
an authorisation. Such number corresponds to approximately 6.7 percent of all shares in the Company. The
treasury shares issued to the Company shall not be taken into account in the limits pursuant to the
preceding paragraphs.
The Board of Directors resolves on all other terms related to the issuance of shares as well as the issuance
of special rights entitling to shares pursuant to Chapter 10(1) of the Finnish Limited Liability Companies Act.
The authorisation may be exercised by The Board of Directors for example for reasons of developing the
Company's capital structure, in financing or carrying out acquisitions, investments or other business
transactions, or for the shares to be used in an incentive scheme.
The authorisations shall remain in force until the next Annual General Meeting, and they cancel the Annual
General Meeting’s authorisations of March 26, 2014.
Trading in shares
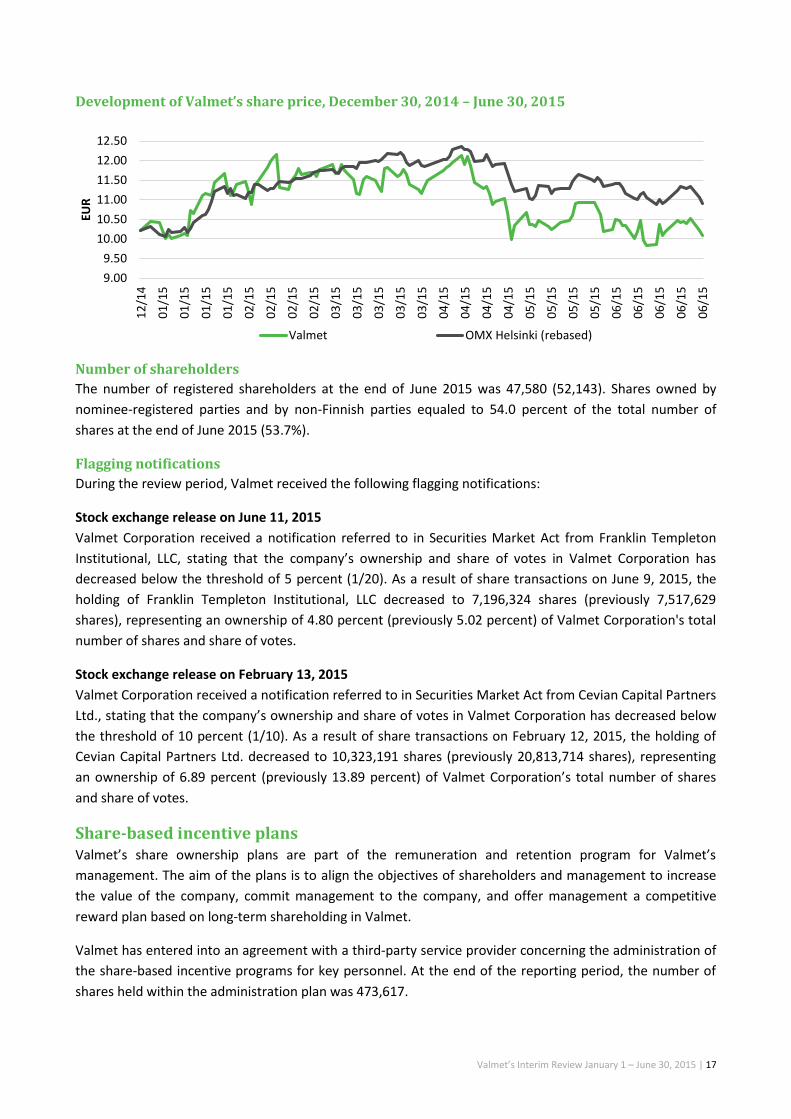
The closing share price for Valmet’s share on the last day of trading in 2014 (December 30, 2014) was EUR
10.22. The closing share price on the final day of trading for the reporting period, June 30, 2015, was EUR
10.08. The share price decreased by some 1 percent during the reporting period. The highest price for the
share during the reporting period was EUR 12.47, the lowest was EUR 9.58 and the volume-weighted
average price was EUR 11.01. The number of shares traded on NASDAQ OMX Helsinki during January–June
was approximately 62 million. The value of trading was approximately EUR 681 million. (Source: NASDAQ
OMX)
In addition to NASDAQ OMX Helsinki, Valmet’s shares are also traded on other marketplaces, such as Chi-X
and BATS. A total of approximately 13 million of Valmet Corporation’s shares were traded on alternative
marketplaces in January–June, which equals to approximately 18 percent of the share’s total trade volume.
Of the alternative exchanges, Valmet’s shares were traded especially on Chi-X. (Source: VWD, Six)
Market capitalization (excluding treasury shares) stood at EUR 1,511 million at the end of the reporting
period.
Valmet’s Interim Review January 1 – June 30, 2015 | 17
Development of Valmet’s share price, December 30, 2014 – June 30, 2015
Number of shareholders
The number of registered shareholders at the end of June 2015 was 47,580 (52,143). Shares owned by
nominee-registered parties and by non-Finnish parties equaled to 54.0 percent of the total number of
shares at the end of June 2015 (53.7%).
Flagging notifications
During the review period, Valmet received the following flagging notifications:
Stock exchange release on June 11, 2015
Valmet Corporation received a notification referred to in Securities Market Act from Franklin Templeton
Institutional, LLC, stating that the company’s ownership and share of votes in Valmet Corporation has
decreased below the threshold of 5 percent (1/20). As a result of share transactions on June 9, 2015, the
holding of Franklin Templeton Institutional, LLC decreased to 7,196,324 shares (previously 7,517,629
shares), representing an ownership of 4.80 percent (previously 5.02 percent) of Valmet Corporation's total
number of shares and share of votes.
Stock exchange release on February 13, 2015
Valmet Corporation received a notification referred to in Securities Market Act from Cevian Capital Partners
Ltd., stating that the company’s ownership and share of votes in Valmet Corporation has decreased below
the threshold of 10 percent (1/10). As a result of share transactions on February 12, 2015, the holding of
Cevian Capital Partners Ltd. decreased to 10,323,191 shares (previously 20,813,714 shares), representing
an ownership of 6.89 percent (previously 13.89 percent) of Valmet Corporation’s total number of shares
and share of votes.
Share-based incentive plans Valmet’s share ownership plans are part of the remuneration and retention program for Valmet’s
management. The aim of the plans is to align the objectives of shareholders and management to increase
the value of the company, commit management to the company, and offer management a competitive
reward plan based on long-term shareholding in Valmet.
Valmet has entered into an agreement with a third-party service provider concerning the administration of
the share-based incentive programs for key personnel. At the end of the reporting period, the number of
shares held within the administration plan was 473,617.
9.00
9.50
10.00
10.50
11.00
11.50
12.00
12.501
2/1
4
01
/15
01
/15
01
/15
01
/15
02
/15
02
/15
02
/15
02
/15
03
/15
03
/15
03
/15
03
/15
03
/15
04
/15
04
/15
04
/15
04
/15
05
/15
05
/15
05
/15
05
/15
06
/15
06
/15
06
/15
06
/15
06
/15
EUR
Valmet OMX Helsinki (rebased)

Valmet’s Interim Review January 1 – June 30, 2015 | 18
Long-term incentive plan 2012–2014
In December 2013, Metso’s Board of Directors decided to continue the share-based incentive plan
approved in December 2011. The target group of the plan is the senior management of Valmet. The plan
approved in 2011 includes three performance periods, equivalent to the 2012, 2013, and 2014 calendar
years. The Board of Directors is responsible for setting the performance criteria and targets used at the
beginning of each performance period. 40 key employees in Valmet were covered by the plan for the 2014
performance period. Growth in Valmet’s EBITA-% and growth in Services orders received were the 2014
performance criteria of the long-term incentive plan.
The potential reward from the 2014 performance period will be paid at the end of an approximately two-
year vesting period in 2017, partly in company shares and partly in cash. The proportion paid in cash is
intended to cover taxes and tax-related costs arising from the payment.
The potential rewards to be paid on the basis of the 2014 performance period will correspond to a
maximum total of 706,423 Valmet shares. The reward of the Plan may not exceed 120 percent of the key
employee's annual total base salary.
During the first quarter of 2015, Valmet paid 166,383 shares on the basis of the 2012 performance period
to the participants of the Plan.
Long-term incentive plan 2015–2017
In December 2014, the Board of Directors approved a new share based incentive plan for Valmet's key
employees. The plan has three discretionary periods, which are the calendar years 2015, 2016 and 2017.
The Board of Directors shall decide on the performance criteria and participants in the beginning of each
performance period. The Plan is directed to approximately 80 key people. The potential reward of the Plan
from the discretionary period 2015 is based on EBITA-% improvement and Services’ orders received growth
(%).
The potential reward of the Plan from the discretionary period 2015 will be paid partly as Company shares
and partly in cash in 2016. The shares paid as reward may not be transferred during the restriction period,
which will end two years after the end of the discretionary period. The proportion to be paid in cash is
intended to cover taxes and tax-related costs arising from the reward to the key employee.
The rewards to be paid on the basis of the Plan are in total an approximate maximum of 616,000 shares in
Valmet Corporation and a cash payment needed for taxes and tax-related costs arising from the shares. The
reward of the Plan may not exceed 120 percent of the key employee's annual total base salary.
The shares to be transferred as part of the possible reward will be obtained in public trading, ensuring that
the incentive plan will not have a diluting effect on Valmet’s share value.
More information about share-based incentive plans can be found in Valmet’s Corporate Governance
Statement which is available at www.valmet.com/governance.
Resolutions of Valmet Corporation’s Annual General Meeting The Annual General Meeting of Valmet Corporation was held in Helsinki on March 27, 2015. The Annual
General Meeting adopted the Financial Statements for 2014 and discharged the members of the Board of
Directors and the President and CEO from liability for the 2014 financial year. The Annual General Meeting
approved the Board of Directors' proposals, which concerned authorizing the Board to resolve on

Valmet’s Interim Review January 1 – June 30, 2015 | 19
repurchasing company shares and to resolve on the issuance of shares and the issuance of special rights
entitling to shares.
The Annual General Meeting confirmed the number of Board members as seven and appointed Bo Risberg
as a new member of the Board. Bo Risberg was appointed as Chairman of Valmet Corporation's Board and
Mikael von Frenckell as Vice Chairman. Lone Fønss Schrøder, Friederike Helfer, Pekka Lundmark, Erkki
Pehu-Lehtonen and Rogério Ziviani will continue as members of the Board. The term of office of the
members of the Board of Directors expires at the end of the next Annual General Meeting.
The Annual General Meeting appointed PricewaterhouseCoopers Oy, authorized public accountants, as the
company's auditor for a term expiring at the end of the next Annual General Meeting.
Valmet published stock exchange releases on March 27, 2015, concerning the resolutions of the Annual
General Meeting and the composition of the Board of Directors. The stock exchange releases and a
presentation of the Board’s members can be viewed on Valmet’s website at www.valmet.com/agm.
In compliance with the resolution of the Annual General Meeting on March 27, 2015, Valmet Corporation
paid out dividends of EUR 37 million for 2014, corresponding to EUR 0.25 per share, on April 10, 2015.
Changes in the Board composition On April 7, 2015, Pekka Lundmark announced his resignation from the Board of Directors of the company.
The reason for the resignation is his appointment as the President and CEO of Fortum Corporation as of
September 2015. Valmet announced the resignation as a stock exchange release on April 8, 2015.
The Board of Directors elected Erkki Pehu-Lehtonen to replace Pekka Lundmark in Valmet’s Remuneration
and HR Committee. Valmet announced the election as a stock exchange release on April 20, 2015.
Risks and business uncertainties Valmet’s operations are affected by various strategic, financial, operational, and hazard risks. Valmet takes
measures to exploit emerging opportunities and to limit the adverse effects of potential threats. The
assessment of risks related to sustainable development holds a key role in risk management. If such threats
materialized, they could have material adverse effects on Valmet’s business, financial situation, and
operating result or on the value of shares and other securities.
The objective of Valmet’s risk management is to ensure the implementation of an effective and successful
strategy for achieving both long- and short-term goals. The task of Valmet’s management is to regulate risk
appetite.
In assessing risks, Valmet takes into consideration the probability of the risks and their estimated impact on
net sales and financial results. Valmet’s management estimates that the company’s overall risk level is
currently manageable in proportion to the scope of its operations and the practical measures available for
managing these risks.
Financial uncertainty in the global economy, coupled with fluctuations in exchange rates and tightening
financial market regulations, may have an adverse effect on the availability of financing from banks and
capital markets, and could reduce the investment appetite of Valmet’s customers. Valmet estimates that
the high proportion of business derived from stable business (Services and Automation) and emerging
markets will reduce the possible negative effects that market uncertainties may have.
Valmet’s Interim Review January 1 – June 30, 2015 | 20
If global economic growth weakens, it might have adverse effects on new projects under negotiation or on
projects in the order backlog. Some projects may be postponed, suspended, or canceled. In the case of
long-term delivery projects, initial customer down payments are typically 10–30 percent of the value of the
project, and customers make progress payments as a project is implemented. This significantly decreases
the risks and financing requirements related to Valmet’s projects. Valmet continually assesses its
customers’ creditworthiness and their ability to meet their obligations. As a rule, Valmet does not finance
customer projects. If economic growth slows significantly, the markets for Valmet’s products may shrink,
which may lead to, for example, tougher price competition. Changes in official regulations and legislation
can also critically affect especially the energy business.
Large fluctuations in energy prices can affect the global economy. These fluctuations can also affect Valmet
and its customers, especially in the energy business.
Changes in labor costs and the prices of raw materials and components can affect Valmet’s profitability.
Wage inflation is continuing, but Valmet’s goal is to offset this at least partly through increased productivity
and strict price discipline. It is possible, however, that tough competition in some product categories will
make it difficult to pass on cost increases to product prices. On the other hand, some of Valmet’s customers
are raw material producers, and their ability to operate and invest may be enhanced by strengthening
commodity prices and hampered by declining commodity prices.
Through acquisitions Valmet may become exposed to risks associated with new markets and business
environments. The actual acquisition process also includes risks. Other risks associated with acquisitions
include, but are not limited to, integration of the acquired business, increased financial risk exposure,
retention of key personnel and achieving the targets set for the acquired business.
Management of project business risks important
An important part of Valmet’s business consists of project business. Pulp business projects in particular are
large, thus project-specific risk management is crucial. Key risks related to projects are cost accounting,
scheduling and materials management risks. Risk analysis shall, as a minimum, take place for all significant
project quotations. The work concerning threat and opportunity assessment continues during the
execution phase of the project. Risk management is based on careful planning and on continuous,
systematic monitoring and drawing on past experiences. Project risks are managed by improving and
continuously developing project management processes and the related tools.
There may be changes in the competitive situation of Valmet’s individual businesses, such as the
emergence of new, cost-effective players in the markets. Valmet can safeguard its market position by
developing its products and services, and through good customer service and a local presence.
Availability of financing crucial
Securing the continuity of Valmet’s operations requires that sufficient funding is available under all
circumstances. Valmet estimates that its liquid cash assets and committed credit limits are sufficient to
secure the company’s immediate liquidity and to ensure the flexibility of financing. The average maturity
for Valmet’s non-current debt is 3.8 years. Loan facilities include customary covenants and Valmet is in
clear compliance with the covenants at the balance sheet date.
Net working capital and capital expenditure levels have a key impact on the adequacy of our financing.
Valmet estimates that the company is well-positioned to keep capital expenditure at the level of total
depreciation.

Valmet’s Interim Review January 1 – June 30, 2015 | 21
Of the financial risks that affect Valmet’s profit, currency exchange rate risks are among the most
substantial. Exchange rate changes can affect Valmet’s business, although the wide geographical scope of
the company’s operations reduces the impact of any individual currency. Economic insecurity typically
increases exchange rate fluctuations. Valmet hedges its currency exposures linked to firm delivery and
purchase agreements.
At the end of June 2015, Valmet had EUR 624 million (EUR 441 million) of goodwill on its statement of
financial position. Valmet assesses the value of its goodwill for impairment annually or more frequently if
facts and circumstances indicate that a risk of impairment exists. Valmet has not identified any indications
of impairment during the reporting period. The principles used for impairment testing are presented in the
Annual Report.
Events after the reporting period There were no subsequent events after the review period that required recognition or disclosure.
Valmet reiterates its guidance for 2015 Valmet is reiterating its guidance presented on February 6, 2015 in which Valmet estimates that, including
the acquisition of Process Automation Systems, net sales in 2015 will increase in comparison with 2014
(EUR 2,473 million) and EBITA before non-recurring items in 2015 will increase in comparison with 2014
(EUR 106 million).
Short-term outlook
General economic outlook
Global growth is projected at 3.3 percent in 2015, marginally lower than in 2014, with a gradual pickup in
advanced economies and a slowdown in emerging market and developing economies. In 2016, growth is
expected to strengthen to 3.8 percent. The distribution of risks to global economic activity is still tilted to
the downside. Near-term risks include increased financial market volatility and disruptive asset price shifts,
while lower potential output. (International Monetary Fund, July 9, 2015)
Short-term market outlook
Valmet is reiterating its short-term market outlook presented on April 29, 2015. Valmet estimates that
activity in pulp, and board and paper markets will remain on a good level. The activity in the services,
tissue, and automation markets is estimated to remain satisfactory. The activity in the energy markets is
expected to remain weak.
In Espoo on July 30, 2015
Valmet Corporation’s Board of Directors

Unaudited Condensed Consolidated Interim Financial Statements
Valmet’s Interim Review January 1 – June 30, 2015 | 22
Consolidated Statement of Income
EUR million Q2/2015 Q2/2014 Q1–Q2/
2015 Q1–Q2/
2014
Net sales 779 588 1,340 1,107
Cost of goods sold -599 -475 -1,047 -897
Gross profit 180 113 293 210
Selling, general and administrative expenses -136 -97 -239 -200
Other operating income and expenses, net -12 1 -8 -1
Share in profits and losses of associated companies 1 0 1 0
Operating profit 32 16 46 9
Financial income and expenses, net -2 0 -4 -2
Profit before taxes 31 16 42 7
Income taxes -9 -5 -13 -2
Profit / loss 21 11 29 5
Attributable to:
Owners of the parent 21 11 29 5
Non-controlling interests 0 0 0 0
Profit / loss 21 11 29 5
Earnings per share attributable to owners of the parent:
Earnings per share, EUR 0.14 0.07 0.19 0.03
Diluted earnings per share, EUR 0.14 0.07 0.19 0.03
Unaudited Condensed Consolidated Interim Financial Statements
Valmet’s Interim Review January 1 – June 30, 2015 | 23
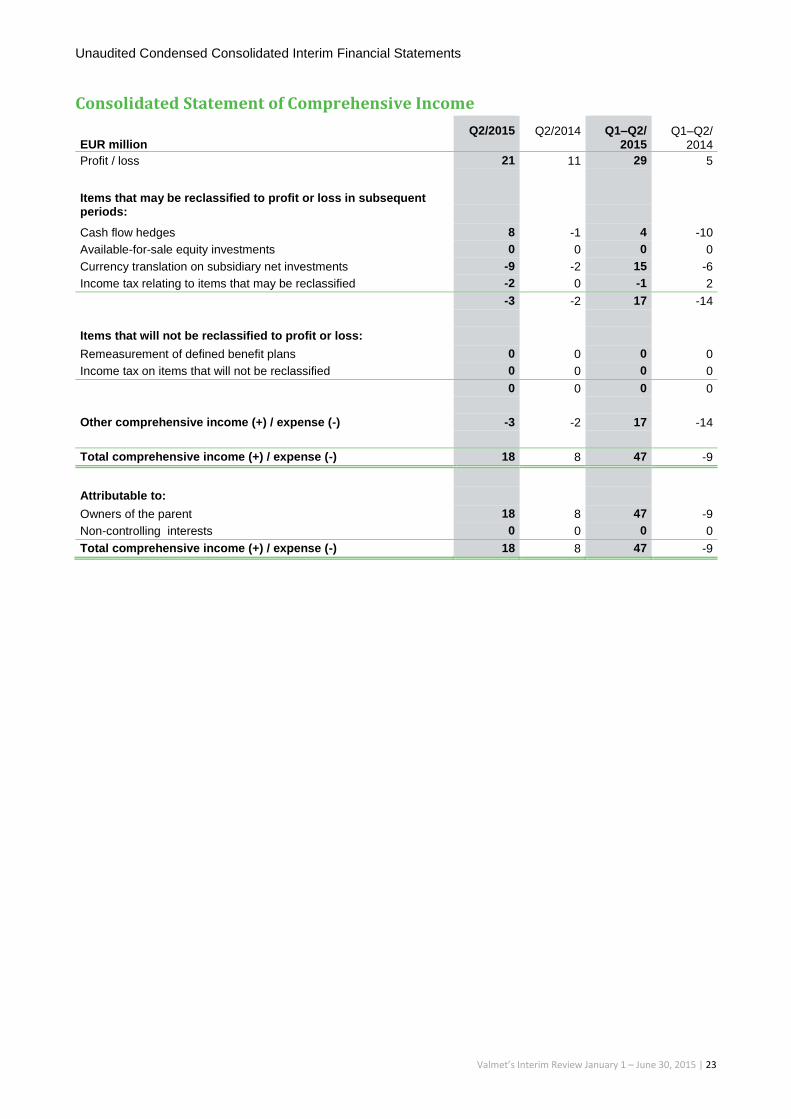
Consolidated Statement of Comprehensive Income
EUR million Q2/2015 Q2/2014 Q1–Q2/
2015 Q1–Q2/
2014
Profit / loss 21 11 29 5
Items that may be reclassified to profit or loss in subsequent periods:
Cash flow hedges 8 -1 4 -10
Available-for-sale equity investments 0 0 0 0
Currency translation on subsidiary net investments -9 -2 15 -6
Income tax relating to items that may be reclassified -2 0 -1 2
-3 -2 17 -14
Items that will not be reclassified to profit or loss:
Remeasurement of defined benefit plans 0 0 0 0
Income tax on items that will not be reclassified 0 0 0 0
0 0 0 0
Other comprehensive income (+) / expense (-) -3 -2 17 -14
Total comprehensive income (+) / expense (-) 18 8 47 -9
Attributable to:
Owners of the parent 18 8 47 -9
Non-controlling interests 0 0 0 0
Total comprehensive income (+) / expense (-) 18 8 47 -9

Unaudited Condensed Consolidated Interim Financial Statements
Valmet’s Interim Review January 1 – June 30, 2015 | 24
Consolidated Statement of Financial Position Assets
EUR million As at June
30, 2015 As at June
30, 2014 As at December
31, 2014
Non-current assets
Intangible assets
Goodwill 624 441 446
Other intangible assets 245 99 91
Total intangible assets 869 540 537
Property, plant and equipment
Land and water areas 27 22 22
Buildings and structures 149 131 132
Machinery and equipment 204 197 202
Assets under construction 24 27 25
Total property, plant and equipment 404 376 381
Financial and other non-current assets
Investments in associated companies 13 5 5
Available-for-sale financial assets 9 13 9
Loan and other receivables 19 2 7
Derivative financial instruments 1 0 0
Deferred tax asset 83 88 86
Other non-current assets 19 14 14
Total financial and other non-current assets 144 122 121
Total non-current assets 1,417 1,038 1,040
Current assets
Inventories 568 480 474
Receivables
Trade and other receivables 622 437 445
Cost and earnings of projects under construction in excess of advance billings
205 176 192
Loan and other receivables 0 0 0
Available-for-sale financial assets 4 28 28
Derivative financial instruments 13 13 20
Income tax receivables 24 17 22
Total receivables 869 671 706
Cash and cash equivalents 161 199 192
Total current assets 1,598 1,349 1,372
Total assets 3,015 2,387 2,412
Unaudited Condensed Consolidated Interim Financial Statements
Valmet’s Interim Review January 1 – June 30, 2015 | 25
Consolidated Statement of Financial Position Equity and liabilities
EUR million As at June
30, 2015 As at June
30, 2014 As at December
31, 2014
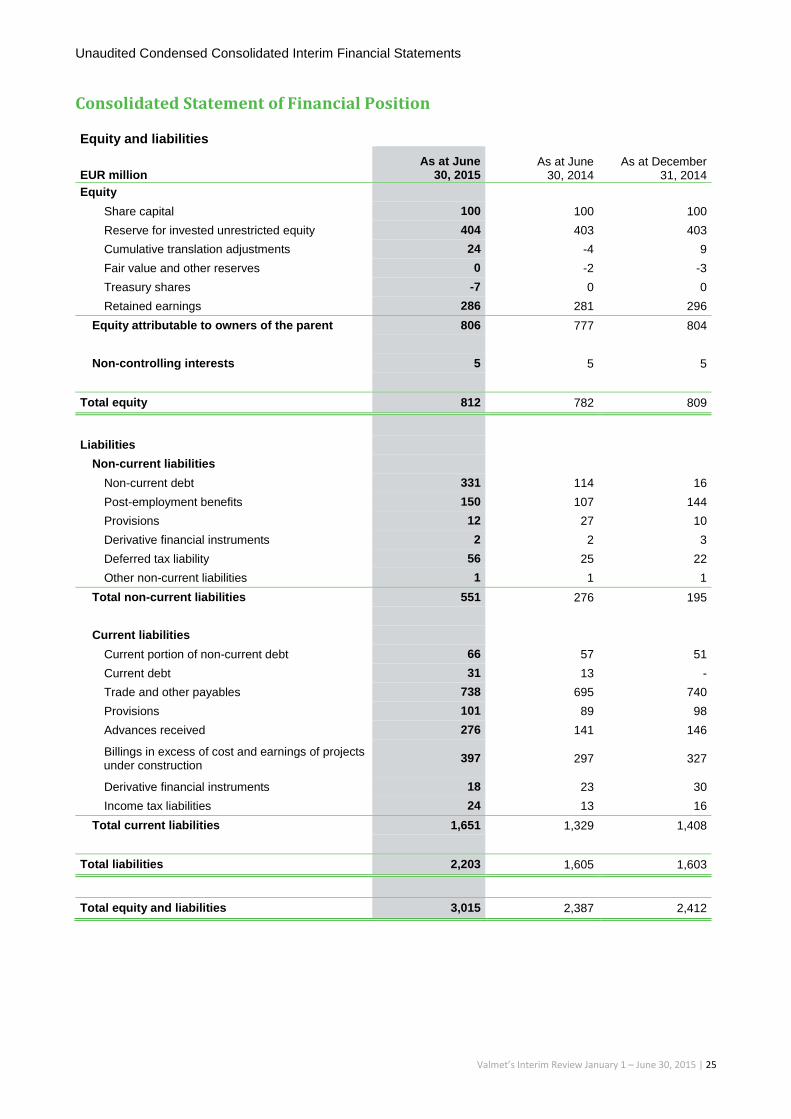
Equity
Share capital 100 100 100
Reserve for invested unrestricted equity 404 403 403
Cumulative translation adjustments 24 -4 9
Fair value and other reserves 0 -2 -3
Treasury shares -7 0 0
Retained earnings 286 281 296
Equity attributable to owners of the parent 806 777 804
Non-controlling interests 5 5 5
Total equity 812 782 809
Liabilities
Non-current liabilities
Non-current debt 331 114 16
Post-employment benefits 150 107 144
Provisions 12 27 10
Derivative financial instruments 2 2 3
Deferred tax liability 56 25 22
Other non-current liabilities 1 1 1
Total non-current liabilities 551 276 195
Current liabilities
Current portion of non-current debt 66 57 51
Current debt 31 13 -
Trade and other payables 738 695 740
Provisions 101 89 98
Advances received 276 141 146
Billings in excess of cost and earnings of projects under construction
397 297 327
Derivative financial instruments 18 23 30
Income tax liabilities 24 13 16
Total current liabilities 1,651 1,329 1,408
Total liabilities 2,203 1,605 1,603
Total equity and liabilities 3,015 2,387 2,412

Unaudited Condensed Consolidated Interim Financial Statements
Valmet’s Interim Review January 1 – June 30, 2015 | 26
Condensed Consolidated Statement of Cash Flows
EUR million Q2/2015 Q2/2014 Q1–Q2/
2015 Q1–Q2/
2014
Cash flows from operating activities
Profit / loss 21 11 29 5
Adjustments
Depreciation and amortization 25 18 43 36
Dividend income and net interests 1 0 2 0
Income taxes 9 5 13 2
Other non-cash items 2 -2 3 2
Change in net working capital, net of effect from business acquisitions and disposals
-30 23 -79 58
Net interests and dividends received -1 -1 -1 0
Income taxes paid -11 -9 -13 -15
Net cash provided by (+) / used in (-) operating activities 17 46 -3 89
Cash flows from investing activities
Capital expenditure on fixed assets -9 -10 -19 -21
Proceeds from sale of fixed assets 1 1 1 3
Business acquisitions, net of cash acquired and loan repayments -330 - -330 -
Proceeds from sale of businesses, net of cash sold - - - 0
Other 0 0 0 0
Net cash provided by (+) / used in (-) investing activities -338 -9 -348 -17
Cash flows from financing activities
Redemption of own shares - 0 -7 0
Dividends paid -37 -22 -37 -22
Net borrowings (+) / payments (-) on current and non-current debt -27 -28 350 -26
Net investments in available-for-sale financial assets 0 -13 23 -37
Other -9 - -13 -
Net cash provided by (+) / used in (-) financing activities -74 -63 316 -85
Net increase (+) / decrease (-) in cash and cash equivalents -395 -27 -35 -14
Effect of changes in exchange rates on cash and cash equivalents -2 1 3 1
Cash and cash equivalents at beginning of period 557 224 192 211
Cash and cash equivalents at end of period 161 199 161 199

Unaudited Condensed Consolidated Interim Financial Statements
Valmet’s Interim Review January 1 – June 30, 2015 | 27
Consolidated Statement of Changes in Equity
EUR million Share capital
Reserve for invested
unrestricted equity
Cumulative translation
adjustments
Fair value
and other
reserves Treasury
shares Retained earnings
Equity attributable
to owners of the parent
Non-controlling
interests Total
equity
Balance at January 1, 2015 100 403 9 -3 0 296 804 5 809
Profit / loss - - - - - 29 29 0 29
Other comprehensive income (+) / expense (-)
- - 15 3 - 0 17 0 17
Total comprehensive income (+) / expense (-)
- - 15 3 - 29 47 0 47
Dividends - - - - - -37 -37 0 -37
Purchase of treasury shares - - - - -7 - -7 - -7
Share-based payments, net of tax - 2 - - - -1 1 - 1
Other - - - - - 0 0 - 0
Balance at June 30, 2015 100 404 24 0 -7 286 806 5 812
Balance at January 1, 2014 100 402 2 5 - 299 808 5 813
Profit / loss - - - - - 5 5 - 5
Other comprehensive income (+) / expense (-)
- - -6 -8 - - -14 - -14
Total comprehensive income (+) / expense (-)
- - -6 -8 - 5 -9 - -9
Dividends - - - - - -22 -22 - -22
Purchase of treasury shares - - - - 0 - 0 - 0
Share-based payments, net of tax - 0 - - - 1 1 - 1
Other - - - - - 0 0 - 0
Balance at June 30, 2014 100 403 -4 -2 0 281 777 5 782

Unaudited Condensed Consolidated Interim Financial Statements
Valmet’s Interim Review January 1 – June 30, 2015 | 28
Accounting principles
General information
Valmet Corporation (the “Company” or the “parent company”) and its subsidiaries (together “Valmet”,
“Valmet Group” or the “Group”) form a global supplier of sustainable technology and services, which
designs, develops and produces systems, automation solutions, machinery and equipment for process
industries. The main customers of Valmet operate in pulp, paper and energy generation industries.
Valmet Corporation is domiciled in Helsinki, and its registered address is Keilasatama 5, 02150 Espoo,
Finland. The Company’s shares are listed on the NASDAQ OMX Helsinki Ltd.
These condensed consolidated interim financial statements were approved for issue on July 30, 2015.
Basis of preparation
These condensed consolidated interim financial statements for the six months ended June 30, 2015 have
been prepared in accordance with IAS 34, ‘Interim financial reporting’ and in conformity with IFRS as
adopted by the European Union. The financial information presented in these condensed consolidated
interim financial statements has not been audited. The condensed consolidated interim financial
statements should be read in conjunction with the Group’s annual consolidated financial statements for the
year ended December 31, 2014, which have been prepared in accordance with IFRS.
In the condensed consolidated interim financial statements the figures are presented in million euros
subject to rounding, which may cause some rounding inaccuracies in column and total sums.
Accounting principles
The accounting policies adopted in the preparation of these condensed consolidated interim financial
statements are consistent with those followed in the preparation of the Group’s annual consolidated
financial statements for the year ended December 31, 2014.
Unaudited Condensed Consolidated Interim Financial Statements
Valmet’s Interim Review January 1 – June 30, 2015 | 29
Business combinations and disposals of businesses
Acquisitions
On April 1, 2015, Valmet completed its acquisition of Process Automation Systems in exchange for initial
consideration of EUR 325 million in cash. Process Automation Systems supplies process automation and
information management systems and related applications and services to the pulp, paper, energy and
other process industries. Control in the acquiree was obtained through series of share deals financed
through long-term borrowings. The provisional goodwill of EUR 174 million arising from the acquisition is
attributable to the assembled workforce and synergies expected to arise subsequent to the acquisition.
Majority of the goodwill recognized is not expected to be deductible for income tax purposes. The
consideration paid on the deal is subject to post closing adjustment.
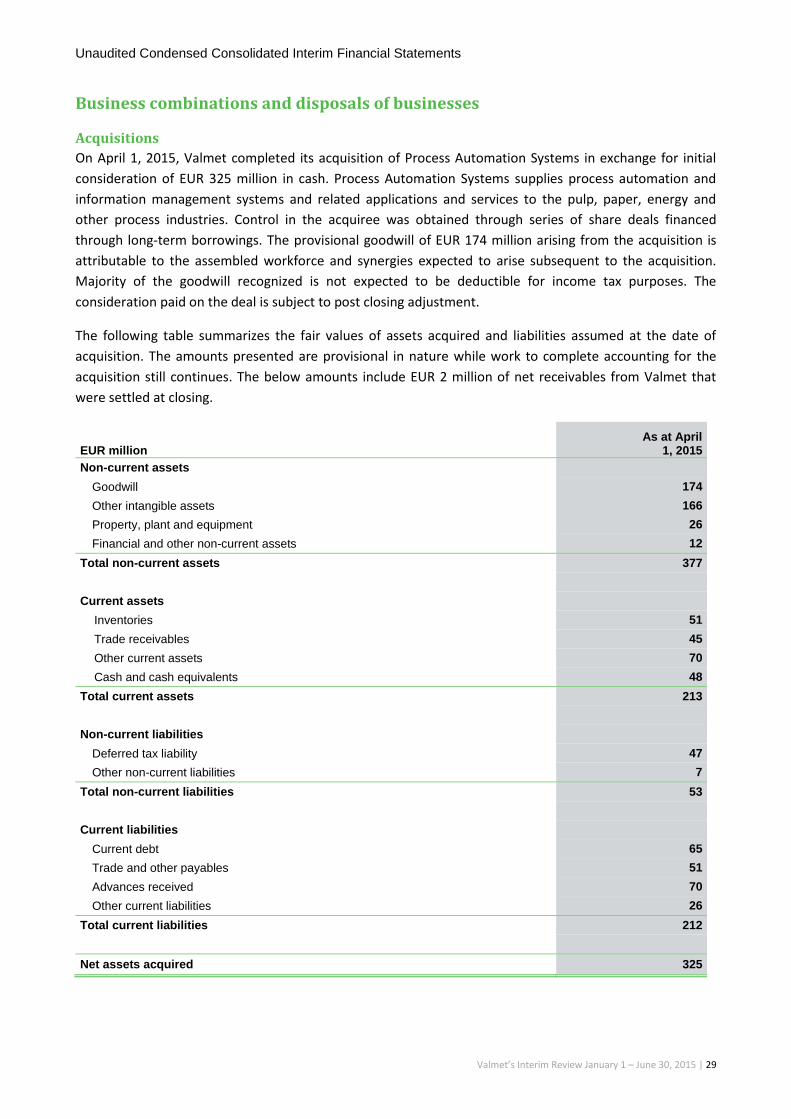
The following table summarizes the fair values of assets acquired and liabilities assumed at the date of
acquisition. The amounts presented are provisional in nature while work to complete accounting for the
acquisition still continues. The below amounts include EUR 2 million of net receivables from Valmet that
were settled at closing.
EUR million As at April
1, 2015
Non-current assets
Goodwill 174
Other intangible assets 166
Property, plant and equipment 26
Financial and other non-current assets 12
Total non-current assets 377
Current assets
Inventories 51
Trade receivables 45
Other current assets 70
Cash and cash equivalents 48
Total current assets 213
Non-current liabilities
Deferred tax liability 47
Other non-current liabilities 7
Total non-current liabilities 53
Current liabilities
Current debt 65
Trade and other payables 51
Advances received 70
Other current liabilities 26
Total current liabilities 212
Net assets acquired 325
Unaudited Condensed Consolidated Interim Financial Statements
Valmet’s Interim Review January 1 – June 30, 2015 | 30
Acquisition related costs of EUR 2 million and EUR 1 million have been charged to selling, general and
administrative expenses in the consolidated income statement in January–June 2015 and for the year
ended December 31, 2014, respectively.
From the date of acquisition, Automation contributed EUR 68 million of revenue and EUR 9 million to profit
of the Group. If the acquisition had occurred on January 1, 2015, management estimates that the combined
statement of income would show net sales of EUR 1,395 million and profit of EUR 15 million. These
amounts include estimated interest expenses and income taxes as well as the charges arising from fair
value adjustments, determined provisionally as at June 30, 2015, for the January–March period.
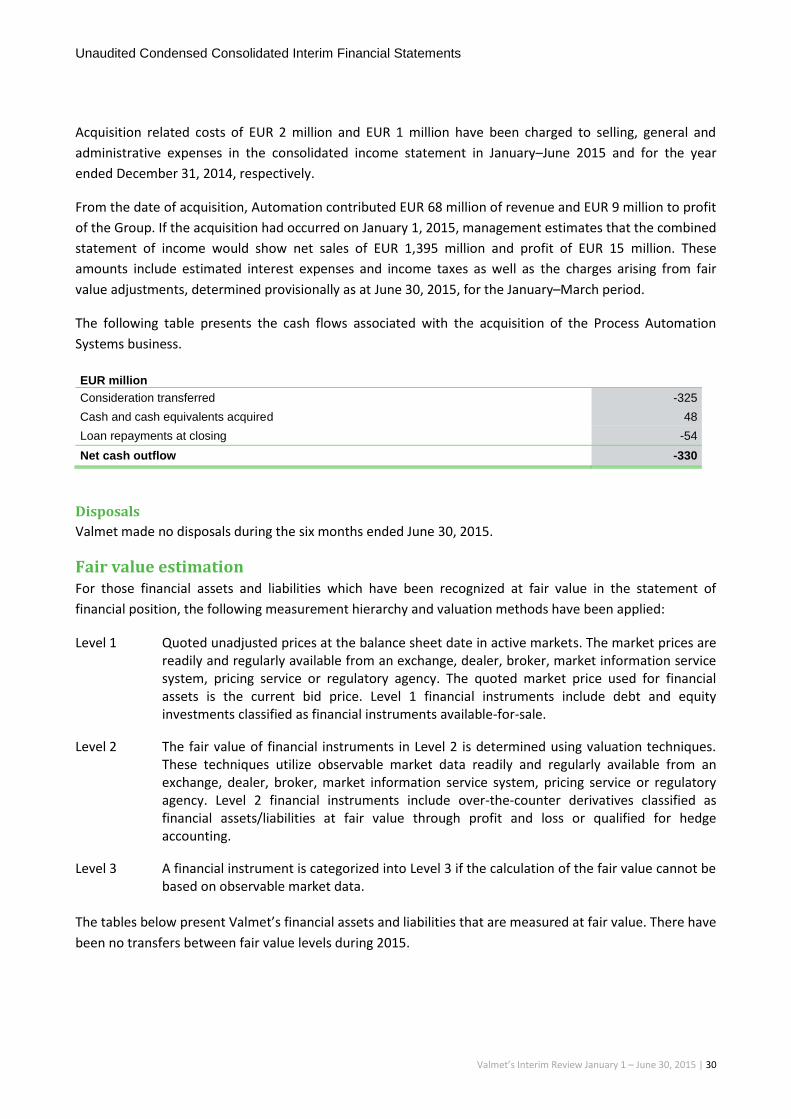
The following table presents the cash flows associated with the acquisition of the Process Automation
Systems business.
EUR million
Consideration transferred -325
Cash and cash equivalents acquired 48
Loan repayments at closing -54
Net cash outflow -330
Disposals
Valmet made no disposals during the six months ended June 30, 2015.
Fair value estimation For those financial assets and liabilities which have been recognized at fair value in the statement of
financial position, the following measurement hierarchy and valuation methods have been applied:
Level 1 Quoted unadjusted prices at the balance sheet date in active markets. The market prices are readily and regularly available from an exchange, dealer, broker, market information service system, pricing service or regulatory agency. The quoted market price used for financial assets is the current bid price. Level 1 financial instruments include debt and equity investments classified as financial instruments available-for-sale.
Level 2 The fair value of financial instruments in Level 2 is determined using valuation techniques. These techniques utilize observable market data readily and regularly available from an exchange, dealer, broker, market information service system, pricing service or regulatory agency. Level 2 financial instruments include over-the-counter derivatives classified as financial assets/liabilities at fair value through profit and loss or qualified for hedge accounting.
Level 3 A financial instrument is categorized into Level 3 if the calculation of the fair value cannot be based on observable market data.
The tables below present Valmet’s financial assets and liabilities that are measured at fair value. There have
been no transfers between fair value levels during 2015.

Unaudited Condensed Consolidated Interim Financial Statements
Valmet’s Interim Review January 1 – June 30, 2015 | 31
As at June 30, 2015
EUR million Level 1 Level 2 Level 3
Assets
Derivatives at fair value through profit and loss - 3 -
Derivatives qualified for hedge accounting - 11 -
Available for sale financial assets 12 0 2
Total assets 12 15 2
Liabilities
Derivatives at fair value through profit and loss - 5 -
Derivatives qualified for hedge accounting - 14 -
Total liabilities - 19 -
As at June 30, 2014
EUR million Level 1 Level 2 Level 3
Assets
Derivatives at fair value through profit and loss - 1 -
Derivatives qualified for hedge accounting - 12 -
Available for sale financial assets 12 26 -
Total assets 12 40 -
Liabilities
Derivatives at fair value through profit and loss - 10 -
Derivatives qualified for hedge accounting - 16 -
Total liabilities - 26 -
The following table presents the changes in level 3 instruments for the six months ended June 30, 2015 and
2014.
EUR million Q1–Q2/
2015 Q1–Q2/
2014
Balance at beginning of year
2 -
Exchange rate differences
0 -
Additions
- -
Acquisitions
0 -
Transfers into level 3
- -
Disposals
0 -
Other changes
- -
Balance at end of period 2 -
Assets pledged and contingent liabilities
EUR million As at June
30, 2015 As at June
30, 2014
Guarantees on behalf of others
6 3
Lease commitments
56 43
Valmet Corporation, with its subsidiaries, and financial institutions have guaranteed commitments arising
from the ordinary course of business of Valmet Group up to a maximum of EUR 1,126 million and EUR
1,181 million as at June 30, 2015 and 2014, respectively.
Unaudited Condensed Consolidated Interim Financial Statements
Valmet’s Interim Review January 1 – June 30, 2015 | 32
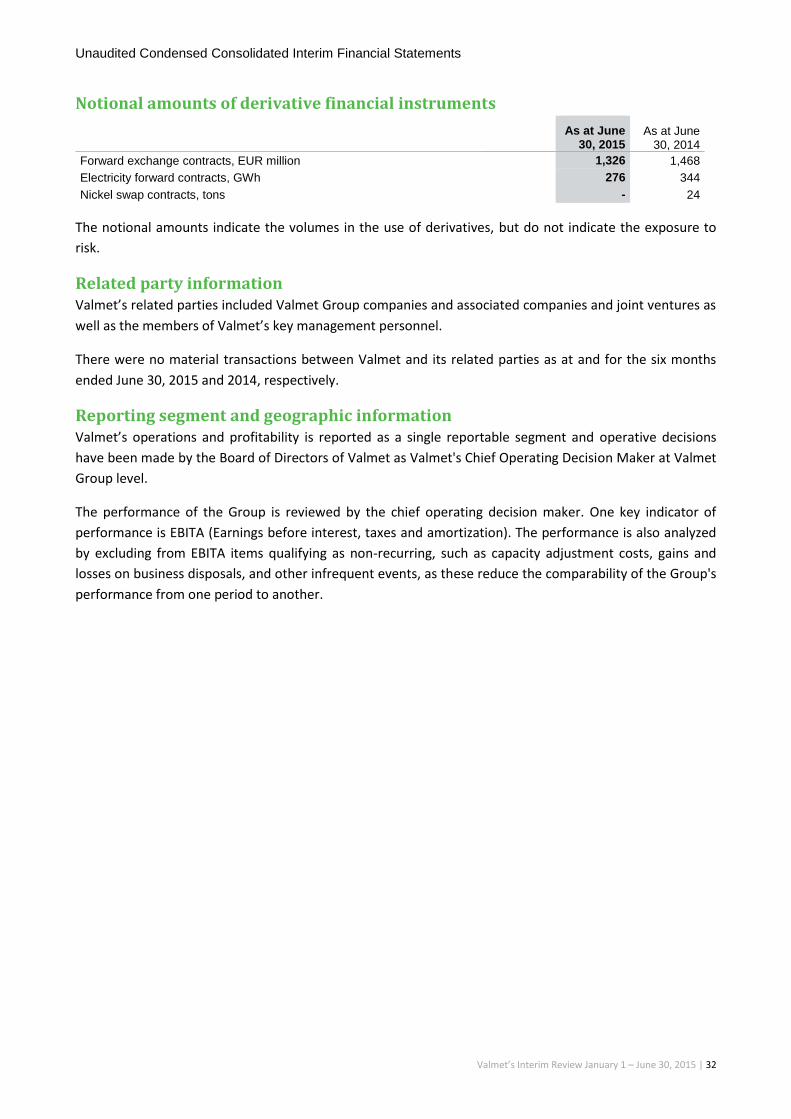
Notional amounts of derivative financial instruments
As at June 30, 2015
As at June 30, 2014
Forward exchange contracts, EUR million
1,326 1,468
Electricity forward contracts, GWh
276 344
Nickel swap contracts, tons
- 24
The notional amounts indicate the volumes in the use of derivatives, but do not indicate the exposure to
risk.
Related party information Valmet’s related parties included Valmet Group companies and associated companies and joint ventures as
well as the members of Valmet’s key management personnel.
There were no material transactions between Valmet and its related parties as at and for the six months
ended June 30, 2015 and 2014, respectively.
Reporting segment and geographic information Valmet’s operations and profitability is reported as a single reportable segment and operative decisions
have been made by the Board of Directors of Valmet as Valmet's Chief Operating Decision Maker at Valmet
Group level.
The performance of the Group is reviewed by the chief operating decision maker. One key indicator of
performance is EBITA (Earnings before interest, taxes and amortization). The performance is also analyzed
by excluding from EBITA items qualifying as non-recurring, such as capacity adjustment costs, gains and
losses on business disposals, and other infrequent events, as these reduce the comparability of the Group's
performance from one period to another.
Unaudited Condensed Consolidated Interim Financial Statements
Valmet’s Interim Review January 1 – June 30, 2015 | 33
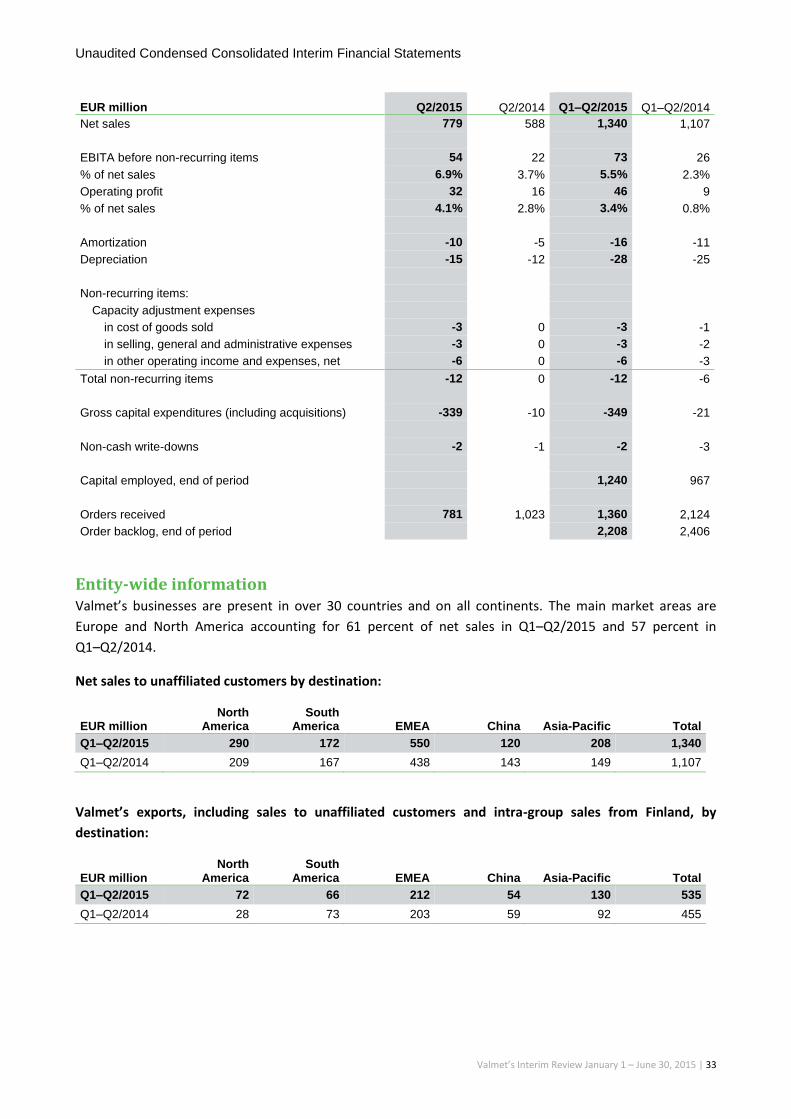
EUR million Q2/2015 Q2/2014 Q1–Q2/2015 Q1–Q2/2014
Net sales 779 588 1,340 1,107
EBITA before non-recurring items 54 22 73 26
% of net sales 6.9% 3.7% 5.5% 2.3%
Operating profit 32 16 46 9
% of net sales 4.1% 2.8% 3.4% 0.8%
Amortization -10 -5 -16 -11
Depreciation -15 -12 -28 -25
Non-recurring items:
Capacity adjustment expenses
in cost of goods sold -3 0 -3 -1
in selling, general and administrative expenses -3 0 -3 -2
in other operating income and expenses, net -6 0 -6 -3
Total non-recurring items -12 0 -12 -6
Gross capital expenditures (including acquisitions) -339 -10 -349 -21
Non-cash write-downs -2 -1 -2 -3
Capital employed, end of period
1,240 967
Orders received 781 1,023 1,360 2,124
Order backlog, end of period
2,208 2,406
Entity-wide information Valmet’s businesses are present in over 30 countries and on all continents. The main market areas are
Europe and North America accounting for 61 percent of net sales in Q1–Q2/2015 and 57 percent in
Q1–Q2/2014.
Net sales to unaffiliated customers by destination:
EUR million North
America South
America EMEA China Asia-Pacific Total
Q1–Q2/2015 290 172 550 120 208 1,340
Q1–Q2/2014 209 167 438 143 149 1,107
Valmet’s exports, including sales to unaffiliated customers and intra-group sales from Finland, by
destination:
EUR million North
America South
America EMEA China Asia-Pacific Total
Q1–Q2/2015 72 66 212 54 130 535
Q1–Q2/2014 28 73 203 59 92 455

Unaudited Condensed Consolidated Interim Financial Statements
Valmet’s Interim Review January 1 – June 30, 2015 | 34
Gross capital expenditure (excluding business acquisitions) by location:
EUR million North
America South
America EMEA China Asia-Pacific Total
Q1–Q2/2015 2 1 12 3 2 19
Q1–Q2/2014 2 1 15 2 0 21
Analysis of net sales by category:
EUR million Q1–Q2/2015 Q1–Q2/2014
Sale of services
578 475
Sale of projects, equipment and goods
762 632
Total 1,340 1,107
Events after the reporting period There were no subsequent events after the review period that required recognition or disclosure.
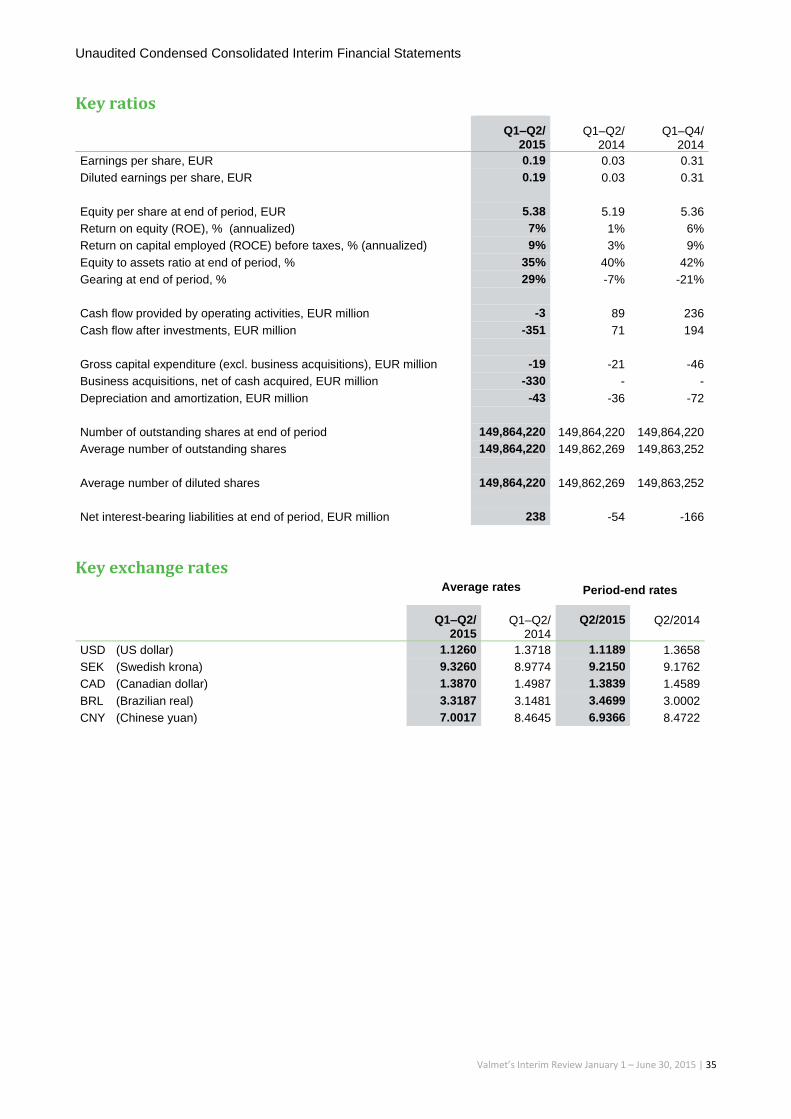
Unaudited Condensed Consolidated Interim Financial Statements
Valmet’s Interim Review January 1 – June 30, 2015 | 35
Key ratios
Q1–Q2/ 2015
Q1–Q2/ 2014
Q1–Q4/ 2014
Earnings per share, EUR 0.19 0.03 0.31
Diluted earnings per share, EUR 0.19 0.03 0.31
Equity per share at end of period, EUR 5.38 5.19 5.36
Return on equity (ROE), % (annualized) 7% 1% 6%
Return on capital employed (ROCE) before taxes, % (annualized) 9% 3% 9%
Equity to assets ratio at end of period, % 35% 40% 42%
Gearing at end of period, % 29% -7% -21%
Cash flow provided by operating activities, EUR million -3 89 236
Cash flow after investments, EUR million -351 71 194
Gross capital expenditure (excl. business acquisitions), EUR million -19 -21 -46
Business acquisitions, net of cash acquired, EUR million -330 - -
Depreciation and amortization, EUR million -43 -36 -72
Number of outstanding shares at end of period 149,864,220 149,864,220 149,864,220
Average number of outstanding shares 149,864,220 149,862,269 149,863,252
Average number of diluted shares 149,864,220 149,862,269 149,863,252
Net interest-bearing liabilities at end of period, EUR million 238 -54 -166
Key exchange rates Average rates Period-end rates
Q1–Q2/
2015 Q1–Q2/
2014
Q2/2015 Q2/2014
USD (US dollar) 1.1260 1.3718 1.1189 1.3658
SEK (Swedish krona) 9.3260 8.9774 9.2150 9.1762
CAD (Canadian dollar) 1.3870 1.4987 1.3839 1.4589
BRL (Brazilian real) 3.3187 3.1481 3.4699 3.0002
CNY (Chinese yuan) 7.0017 8.4645 6.9366 8.4722

Unaudited Condensed Consolidated Interim Financial Statements
Valmet’s Interim Review January 1 – June 30, 2015 | 36
Formulas for Calculation of Indicators EBITA:
Operating profit + amortization + goodwill impairment
EBITA before non-recurring items: Operating profit + amortization + goodwill impairment + non-recurring items
Earnings per share: Profit attributable to shareholders of the company
Average number of outstanding shares during period
Earnings per share, diluted: Profit attributable to shareholders of the company
Average number of diluted shares during period
Return on equity (ROE), %: Profit
x 100 Total equity (average for period)
Return on capital employed (ROCE) before taxes, %: Profit before tax + interest and other financial expenses
x 100 Balance sheet total - non-interest bearing liabilities (average for period)
Equity to assets ratio, %: Total equity
x 100 Balance sheet total - advances received
Gearing, %: Net interest bearing liabilities
x 100 Total equity
Net interest bearing liabilities: Non-current interest bearing debt + current interest bearing debt
- cash and cash equivalents - other interest bearing assets
Net Working Capital: Other non-current assets + inventories + trade and other receivables
+ cost and earnings of projects under construction in excess of advance billings + derivative financial instruments (assets)
- post-employment benefits - provisions - trade and other payables - advances received - billings in excess of cost and earnings of projects under construction - derivative financial instruments (liabilities)

Unaudited Condensed Consolidated Interim Financial Statements
Valmet’s Interim Review January 1 – June 30, 2015 | 37
Quarterly information
EUR million Q2/2015 Q1/2015 Q4/2014 Q3/2014 Q2/2014
Net sales 779 561 777 590 588
EBITA before non-recurring items 54 19 48 32 22
% of net sales 6.9% 3.5% 6.1% 5.5% 3.7%
Operating profit 32 13 38 26 16
% of net sales 4.1% 2.4% 4.8% 4.4% 2.8%
Profit before taxes 31 11 36 24 16
% of net sales 3.9% 2.0% 4.6% 4.1% 2.7%
Profit / loss 21 8 25 16 11
% of net sales 2.7% 1.4% 3.2% 2.8% 1.8%
Earnings per share, EUR 0.14 0.05 0.17 0.11 0.07
Earnings per share, diluted, EUR 0.14 0.05 0.17 0.11 0.07
Amortization -10 -6 -5 -5 -5
Depreciation -15 -13 -12 -13 -12
Research and development expenses, net -17 -10 -12 -8 -10
% of net sales -2.2% -1.8% -1.5% -1.4% -1.7%
Non-recurring items:
Capacity adjustment expenses
in cost of goods sold -3 - -2 -1 0
in selling, general and administrative expenses -3 0 -2 0 0
in other operating income and expenses, net -6 - -1 0 0
Total non-recurring items -12 0 -5 -1 0
Gross capital expenditures (including acquisitions) -339 -10 -15 -10 -10
Business acquisitions, net of cash acquired -330 - - - -
Non-cash write-downs -2 0 -2 -1 -1
Capital employed, end of period 1,240 1,239 877 902 967
Orders received 781 580 480 466 1,023
Order backlog, end of period 2,208 2,064 1,998 2,312 2,406
Related Documents